PWC, 2010 - Total Tax Contribution (TTC) Study of the Global Mining Industry
36
Total Tax Contribution A study o the economic contribution mining companies make to public nances
Transcript of PWC, 2010 - Total Tax Contribution (TTC) Study of the Global Mining Industry

8/3/2019 PWC, 2010 - Total Tax Contribution (TTC) Study of the Global Mining Industry
http://slidepdf.com/reader/full/pwc-2010-total-tax-contribution-ttc-study-of-the-global-mining-industry 1/36
Total Tax Contribution A study o the economic contribution mining companies make topublic nances

8/3/2019 PWC, 2010 - Total Tax Contribution (TTC) Study of the Global Mining Industry
http://slidepdf.com/reader/full/pwc-2010-total-tax-contribution-ttc-study-of-the-global-mining-industry 2/36

8/3/2019 PWC, 2010 - Total Tax Contribution (TTC) Study of the Global Mining Industry
http://slidepdf.com/reader/full/pwc-2010-total-tax-contribution-ttc-study-of-the-global-mining-industry 3/36
i
Foreword
We are pleased to present PricewaterhouseCoopers’ second Total TaxContribution (TTC) Study o the global Mining Industry, which aims to bringgreater transparency to the ull contribution that mining companies make topublic nances. This study is larger than our original study and includes 22mining companies operating in 20 dierent jurisdictions. The results analysetheir total payments to government, ocusing on their most signicantoperations in the various locations. We received a positive response to our
rst study or the global Mining Industry, validating our perception that there iskeen interest in better understanding the complete tax and other payments thatmining companies make to government.
The TTC approach goes beyond income taxes to collect data on all taxes andother payments to government, to more properly calculate the entire tax burdeno an enterprise. The mining industry, perhaps more than most other industries,remits large amounts o non-income taxes to various levels o government inthe orm o employment taxes, royalties, VAT/sales/use taxes, inrastructureunding and other levies. The income tax portion o a company’s nancial resultsis highlighted in its nancial statements, but other taxes and payments are notsegregated in its results, thus diminishing what it appears to pay to government.This incomplete representation o the total levies on any company, but especiallythose o a mining company, reduces its perceived impact on the public good.
The study uses data provided by mining companies on all the dierent taxesand other amounts they paid into public nances in their 2008 year. The studythereore covers a somewhat turbulent period, with the nancial crises unwindingand the start o the global economic recession. The impact o the downturn on thesector is refected in the results, with the Total Tax Rate (the tax cost as measuredin relation to protability) increasing since the rst study was conducted. This isbecause while corporate income tax will all with lower protability, other taxesand levies do not – and become relatively more expensive.
There is pressure on both government and business to increase transparencyin the extractive industries, with a call or companies to ‘publish what they pay’,and or governments to ‘publish what they receive’, and how they use theserevenues. We hope this study’s results will provide new inormation about theeconomic ootprint o mining companies and how they contribute to the publicnances and the communities where they operate. Some mining companies areincluding TTC data in their corporate reporting and we hope more may do so.We anticipate that users o the study results may include investors, governmentand civil society organisations, as well as mining companies themselves.
We welcome eedback and comments on the study.
Steve Ralbovsky Susan SymonsGlobal Mining Tax Leader Total Tax Contribution LeaderPricewaterhouseCoopers (US) PricewaterhouseCoopers (UK)
8/3/2019 PWC, 2010 - Total Tax Contribution (TTC) Study of the Global Mining Industry
http://slidepdf.com/reader/full/pwc-2010-total-tax-contribution-ttc-study-of-the-global-mining-industry 4/36

8/3/2019 PWC, 2010 - Total Tax Contribution (TTC) Study of the Global Mining Industry
http://slidepdf.com/reader/full/pwc-2010-total-tax-contribution-ttc-study-of-the-global-mining-industry 5/36
1
1 Executive summary
The taxes and other contributions to government that mining companiespay are an important element in the creation o prosperity and stability o thecountries in which they operate. However, the ull extent o this contribution isnot always recognised.
PricewaterhouseCoopers1 (PwC) has carried out a study o the taxes and othercontributions paid by a number o mining companies in their accounting periodto 31 December 2008 (or equivalent period). This is the second study andollows an earlier study looking at the year to 31 December 2007.
The purpose o the study is to provide greater transparency about the overallcontribution o mining companies to the public nances o the countries inwhich they operate.
The study was carried out using the PwC Total Tax Contribution (TTC)Framework. TTC provides a standardised methodology or companies tomeasure and communicate all the taxes and contributions that they pay. It isstraightorward in concept, not tax technical, and thereore relatively easy orstakeholders to understand.
The study was carried out using data provided by 22 mining companies.PwC has collated and anonymised this data to provide the study results.PwC has not veried, validated or audited the data, and thereore cannot giveany undertaking as to the accuracy o the study results.
The companies taking part in the study provided data or mining operationso dierent sizes and stages o development in dierent countries around theworld. The results show an average or a company in a country o operation.They provide a good picture o how taxes and other contributions impact onthese companies, but cannot necessarily be considered as representative othe industry as a whole.
The study results show that mining companies make a large economic
contribution in the countries where they operate. The companies taking partreported total gures or turnover o US$62.9bn, wages and salaries paid toemployees o US$6.0bn and a total contribution to government o US$10.1bn.
These companies pay many other taxes and contributions in addition tocorporate income tax. On average, corporate income tax is only 40% o allthe taxes and contributions they bear. For every $1 o corporate income tax,they pay another $1.50 in other taxes and contributions borne plus $0.52in taxes collected.
1 “PricewaterhouseCoopers” and “PwC” reer to the network o member rms oPricewaterhouseCoopers International Limited (PwCIL). Each member rm is a separate legalentity and does not act as agent o PwCIL or any other member rm.

8/3/2019 PWC, 2010 - Total Tax Contribution (TTC) Study of the Global Mining Industry
http://slidepdf.com/reader/full/pwc-2010-total-tax-contribution-ttc-study-of-the-global-mining-industry 6/36
2
These companies make a large contribution to public nances in relation to thesize o their operations. On average, they paid an amount equivalent to 15.3%o their turnover to government, comprising 10.8% in amounts borne and 4.5%in amounts collected.
At 10.8%, the amounts borne are at a lower percentage o turnover than inthe rst study (12.5%). This is because protability and taxes linked to protshave allen. Taxes and contributions borne by mining companies are a higherpercentage than the average shown in our cross-industry TTC studies.
Mining companies are large employers. On average, or companies in thestudy, employment taxes were $15,349 per employee. This is an indication o
the direct benet to public nances o each job created or maintained by thesecompanies. This average has increased rom $14,875 in the rst study.
The tax cost as measured in relation to protability (the Total Tax Rate) hasincreased since the rst study was conducted (39.3% compared to 32.2%).This is because while taxes on prots may all in a downturn, other taxes andcontributions (which are not linked to prots) do not all to the same degree andthus become relatively more expensive.
The 22 companies that took part in the study provided data on their operationsin 20 countries. This report also provides an analysis or three regional andeconomic groupings o countries – Arica, Latin America and OECD countries.
In all regions, the average employment taxes per employee is high incomparison to income per capita, suggesting that these companies employskilled, well-paid workers.

8/3/2019 PWC, 2010 - Total Tax Contribution (TTC) Study of the Global Mining Industry
http://slidepdf.com/reader/full/pwc-2010-total-tax-contribution-ttc-study-of-the-global-mining-industry 7/36
3
The results o the regional analysis show taxes and contributions borne as ahigher percentage o turnover in Latin America, refecting higher prots andcorporate income tax payments in this region or companies providing data.The average Total Tax Rate (TTR) is also highest in Latin America.
Employment taxes are higher in the OECD countries, both as an averagepercentage o turnover and as an element o the TTR.
So ar as we are aware, this is the only study to collect data on the taxesand other amounts paid to government by mining companies. For most othe companies taking part in the study, this was also the rst time they hadcollected this data. Companies taking part each receive their own TTC report.
All companies are coming under increased public scrutiny regarding the taxesthey pay, and mining companies are at the oreront in this debate. The PublishWhat You Pay coalition o civil society organisations is campaigning or greaterrevenue transparency in the oil, gas and mining industries and is calling oncompanies to disclose payments to government and other inormation on acountry-by-country basis.
Our work on tax transparency shows that some mining companies are leadingthe way in corporate reporting or tax. For the past two years, FTSE100 miningcompanies have won the PwC sponsored Building Public Trust Awards or TaxReporting – Anglo American plc in 2009, and Kazakhmys in 2008. Both o thesecompanies use the TTC approach to show their tax and other payments to
government by country, split between borne and collected.
PwC suggests that all mining companies consider i there could be businessbenets rom being more transparent in communicating their tax aairs totheir stakeholders. We also suggest that the Total Tax Contribution Frameworkprovides a good basis or mining companies to report on all the dierent taxesand other amounts that they pay.
We hope that these study results will provide new data about the economicootprint o mining companies through paying taxes and other contributions.We anticipate that users o the study will include investors, governments andcivil society organisations, as well as mining companies themselves.
“The taxes we pay as a company
and those we collect on behal
o Government represent an
important contribution to the
creation o wealth and stability o
the countries in which we operate.
We ully endorse the principle
o transparency and this applies
equally in the area o taxation as
in all business dealings. We seek
to eectively communicate with
stakeholders the level o taxes thatwe both bear and collect and this
is where the concept o Total Tax
Contribution plays an important role
frstly in helping us to understand
and then explain to stakeholders
the overall tax burden on our
operations.”
Keith TuckerExecutive Vice President Taxation Anglo American plc
“A record number o our members took part in the 2009 Total Tax Contribution survey with PwC. Boards and
Executives o large UK companies are keenly interested in the contribution they make to the communities and the
countries where they operate and TTC provides a much richer picture o the contribution our companies are making
to the public fnances and to employment. And o course our companies are very interested in the dialogue between
business and government and the degree to which government policy encourages investment and employment. TTC
data is important as it enriches the dialogue between government and business.”
Ashley Almanza, Chairman o The Hundred Group o Finance Directors

8/3/2019 PWC, 2010 - Total Tax Contribution (TTC) Study of the Global Mining Industry
http://slidepdf.com/reader/full/pwc-2010-total-tax-contribution-ttc-study-of-the-global-mining-industry 8/36
4
2 Purpose and outline o the study
The taxes and other contributions to government that Mining companiespay are an important element in the creation o prosperity and stability o thecountries in which they operate. However, the ull extent o this contributionis not always recognised, since oten only corporate income tax is reportedseparately in their nancial statements. Mining companies pay taxes throughoutthe lie cycle o a mining project, and pay many other taxes in addition to
corporate income tax, including employment taxes, property taxes andindirect taxes. In addition, mining companies oten make signicant urthercontributions to government nances through sector-specic taxes, royaltiesand levies, and contributions to local inrastructure such as roads, schoolsand housing.
PwC has carried out a study o the taxes and contributions paid by a numbero mining companies in their accounting period to 31 December 2008 (orequivalent period). This is the second study and ollows an earlier study lookingat the year to 31 December 2007. The purpose o the study is to providegreater transparency about the overall contribution o mining companies to thepublic nances o the countries in which they operate.
The study has been carried out using the PwC Total Tax Contribution (TTC)Framework. TTC provides a standardised methodology or companies tomeasure and communicate all the taxes and contributions that they pay. Itis straightorward in concept, not tax technical and thereore relatively easyor stakeholders, many o whom have limited knowledge o tax complexities,to understand. By ocusing on payments, it provides a measure o whatcompanies contribute to the public nances, and the creation o prosperity andstability or the communities in which they operate.
The TTC Framework makes a distinction between taxes borne and taxescollected. Taxes borne are the company’s own cost and will impact theirresults; or example, property taxes will orm part o property costs. Taxescollected are those that the company administers on behal o government and
collects rom others; or example, employee income taxes deducted throughthe payroll. Taxes collected will have an administrative cost or the companyand will also have an impact on the company’s business; or example,employment taxes impact on the cost o labour.
The TTC Framework also extends to royalties and other payments andcontributions to government, such as ees and other levies and contributionsto local inrastructure. These are also an important part o the company’seconomic ootprint and are particularly relevant to the mining sector.

8/3/2019 PWC, 2010 - Total Tax Contribution (TTC) Study of the Global Mining Industry
http://slidepdf.com/reader/full/pwc-2010-total-tax-contribution-ttc-study-of-the-global-mining-industry 9/36
5
Mining companies extract natural resources and as a result are naturally thesubject o intense scrutiny rom government, civil society organisations andother stakeholders with regards to what they put back in return into theseeconomies. There is a desire or greater transparency over what miningcompanies pay and over how governments use the revenues they receive.TTC provides data, or mining companies and their stakeholders, about the‘economic ootprint’ o these companies through paying taxes and othercontributions. We hope that the study results will provide new data or readersincluding:
• miningcompaniesastheyfocusontheirowntotaltaxesandconsiderwhere
to make uture investments;
• investorsastheyconsiderinvestmentsintheindustry;
• governmentsastheyevaluateexistingtaxesandlookattaxpolicy;and
• communitiesandcivilsocietyorganisationsastheymeasurethecontribution
o mining companies to the local economy.

8/3/2019 PWC, 2010 - Total Tax Contribution (TTC) Study of the Global Mining Industry
http://slidepdf.com/reader/full/pwc-2010-total-tax-contribution-ttc-study-of-the-global-mining-industry 10/36
6
3 Understanding the study results
The study was carried out using data provided by 22 mining companies.PwC has collated and anonymised the data provided by the companies takingpart to produce the study results. PwC has not veried, validated or auditedthe data, and cannot thereore give any undertaking as to the accuracy o thestudy results.
Participating companies were asked to provide data on their taxes andother contributions paid to government in their year to 31 December 2008or equivalent period2. The results are thereore a one-year snapshot orthese companies or this year, and cannot be considered to be necessarilyrepresentative o the industry as a whole, or o the position over the lie cycleo a mining project (which will be many years). They do, however, provide apicture o the impact o taxes and other contributions to government on thesecompanies, and how they contribute to public nances.
The companies were asked to provide data on a country-by-country basis,or their main countries o operation. The data provided by each participatingcompany or each country has been treated as a separate ‘data set’. Betweenthem, the 22 companies provided 53 data sets covering mining operations in
20 dierent countries across the developed and the developing world, includingCanada, Chile, Ghana, South Arica, Indonesia and the US. Participants werenot asked to cover all their countries o operation.
The study results show the picture or a mining company in a country aroundthe world, taking an average across all the data sets3. In addition, we havebeen able to show an average or certain regional geographic or economiccountry groupings.
Data was provided in the currency o choice, and where necessary, has beentranslated to US dollars at an average rate or the period covered by the study.
2 The data requested included:
(i) details o turnover, prots and employment;
(ii) the largest taxes borne (corporate income tax, mining taxes, employer social security,
property taxes) and taxes collected (payroll taxes, VAT, withholding taxes);
(iii) rents, royalties and user ees; and
(iv) any other contributions to government, whether voluntary or mandatory.
3 All data sets have been given an equal weighting in calculating the average.

8/3/2019 PWC, 2010 - Total Tax Contribution (TTC) Study of the Global Mining Industry
http://slidepdf.com/reader/full/pwc-2010-total-tax-contribution-ttc-study-of-the-global-mining-industry 11/36
7
This is the second global TTC study carried out or the mining sector.It ollows a rst study using the same approach and data or the year to31 December 20074. 14 mining companies participated in the rst study and,taking the two studies together, 28 mining companies have taken part in total.
This second study covers a turbulent period, which saw the unwinding o thenancial crisis (Lehman Brothers collapsed in September 2008) and the start oa global economic recession. Some mineral and metal prices ell heavily5.
Eight mining companies took part in both the rst and second studies and acomparison o their results between the two years has been used to give urtherinsight into these study results.
PwC has also carried out TTC studies in a number o countries, including Australia, Canada, South Arica and the US. In these countries, studies havebeen carried out with cross-industry groups o companies using the TTCmethodology. We have also used the results rom these cross-industry studiesto give urther insight into the mining study results.
4 See Total Tax Contribution Global study or the mining sector , published March 2009 on ourdedicated microsite at:www.pwc.co.uk/ttc or www.pwc.co.uk/pd/total_tax_contribution_mining_sector.pd
5 The price per metric tonne o copper ell rom $6,641 at 31 December 2007 to $3,042 at31 December 2008.

8/3/2019 PWC, 2010 - Total Tax Contribution (TTC) Study of the Global Mining Industry
http://slidepdf.com/reader/full/pwc-2010-total-tax-contribution-ttc-study-of-the-global-mining-industry 12/36
8
4 Total contribution o the mining sector
Mining companies make a large economic contribution in the countrieswhere they have mining operations. The companies participating in the studyreported total gures or turnover o US$62.9bn, wages and salaries paid toemployees o US$6.0bn, and a total contribution to government o US$10.1bn.Figure 1 shows the total contribution to government, analysed into taxes andcontributions borne, and taxes collected.
Figure 1: Total contribution to government
$
Taxes borne
Mining specic taxes, royalties, etc
Other contributions
6,742,206,937
696,885,743
426,267,809
7,865,360,489
Less grants and subsidies received (107,246,978)
Taxes and contributions borne 7,758,113,511
Taxes collected 2,329,908,181
Total contribution to government 10,088,021,692
Table shows all the payments and contributions to government reported by participants.
The average total contribution to government by a company in a countryreported in the study was US$190 million, comprising an amount o US$146million borne and US$44 million collected. This is a smaller amount than theaverage in the rst study, refecting the higher number o companies withsmaller operations in the sample. 46% o participants in the second studyreported turnover o less than $0.5bn, compared to 15% in the rst study.

8/3/2019 PWC, 2010 - Total Tax Contribution (TTC) Study of the Global Mining Industry
http://slidepdf.com/reader/full/pwc-2010-total-tax-contribution-ttc-study-of-the-global-mining-industry 13/36
9
Figure 2 is taken rom Anglo American plc 2008 Report to Society and showshow taxes are paid across the various phases o a mining project. Typically,higher amounts will be paid when mining operations are mature and in ullproduction than at the earlier investment stages o the project. Corporateincome tax is only likely to be paid when the mine is in ull production andlosses and capital expenditure rom the exploration and development phaseshave been oset or tax. Other taxes, however, are paid across the lie cycleand increase as the project matures. These include employer and employeetaxes and social contributions, which grow with the number o employees; androyalties and indirect taxes linked to the level o production.
Figure 2: Taxes generated over the lie o a mine
Source: Angle American plc – Report to Society 2008, page 21
The size and phase o the mining operations included in the study varies.The turnover size in a country ranges rom zero to US$10.2bn and employeenumbers rom 27 to 66,049 people. The maximum amount reported as paidto government by a mining company in a single country was US$1.4bn andthe minimum US$564 thousand. These size ranges refect not only the scale
o operation in a country but also operations at dierent stages in the lie cycleo a mining project.

8/3/2019 PWC, 2010 - Total Tax Contribution (TTC) Study of the Global Mining Industry
http://slidepdf.com/reader/full/pwc-2010-total-tax-contribution-ttc-study-of-the-global-mining-industry 14/36
10
5 Taxes and other contributions borne bymining companies
Mining companies pay many other taxes and contributions in addition tocorporate income tax6. Figure 3 shows that in this study, corporate incometax is only 40% o all the taxes and contributions that mining companiesbear. Taxes and contributions borne are the amounts that are a cost to miningcompanies when paid and that aect their results (although the ultimateincidence may be passed on to shareholders, employees or customers). Forevery $1 o corporate income tax paid by the mining companies in the study,there is another $1.50 paid in other taxes and contributions borne.
Figure 3 shows the taxes and contributions borne as a percentage o the totalspaid. At 40% in this study, corporate income tax is a lower percentage o thetotal than in the rst study (48%). This refects the impact o the economicdownturn on the mining sector. Prots generally ell in the year to 31 December2008, compared to the previous year, and tax payments linked to prots(corporate income tax and mining taxes) also ell. Looking at the companiestaking part in both studies, prot beore tax ell by an average o 20% betweenthe two years, corporate income tax by 22% and mining taxes by 23%.
Figure 3: Taxes and contributions borne
Corporate income tax is just 40% o the taxes and contributions borne by mining companies.Mining specic taxes, royalties and other contributions make up 27% o the total.
Pie chart shows the average taxes and contributions borne as a percentage o the total or aparticipant in a country across all the countries covered in the study.
6 See Appendix 1 or an illustrative list o the taxes and contributions typically paid by miningcompanies.
People taxes – 20%
Production taxes – 11%
Mining taxes – 5%
Property taxes – 2%
Royalties, licence
fees and resource
rents – 16%
Other contributions – 6%
Corporate income tax – 40%
Other profit
taxes – 0%
8/3/2019 PWC, 2010 - Total Tax Contribution (TTC) Study of the Global Mining Industry
http://slidepdf.com/reader/full/pwc-2010-total-tax-contribution-ttc-study-of-the-global-mining-industry 15/36
11
In addition to corporate income tax, mining companies bear many other taxes.These may be categorised as ollows:
• othertaxesonproft (in addition to corporate income tax);
• people taxes (taxes on employment levied on the employer, such as payrolltaxes or employer social security payments);
• taxesorleviesborneonpurchasesorsupplies( production taxes, such ascustoms and excise duties); and
• property taxes, (such as local taxes on the ownership and use o realproperty or stamp duties and other transaction taxes).
Together, these represent a urther 33% o the average total in Figure 3.
The taxes in the categories above may also be paid by companies in otherindustry sectors. However, the remaining category, which represents 27% othe average total, is specic to the mining sector and eectively representspayment or extracting natural resources.
• taxes, royalties, ees and rents or the extraction o minerals and metalsand other contributions by mining companies.
Governments in dierent countries choose to levy these amounts in dierentways; in some cases as an additional tax on prots (mining tax); in other cases
as a turnover based royalty, or a licence ee. Mining companies in the studyalso reported numerous other contributions to government nances in dierentcountries, both mandatory and voluntary, including providing or contributing tothe cost o public inrastructure (roads, schools and housing etc).
The TTC Framework measures cash paid into public nances and the studyresults thereore refect any tax incentives or tax holidays given. Governmentswill oten oer tax breaks or incentives to attract new business investment,create jobs and increase gross domestic product. Where these are available,they will result in lower payments o corporate income tax or other taxes, andare thereore refected in the study results.
In some cases, governments may provide cash grants or subsidies, and
companies participating in the study were also asked to provide data onany such payments received rom government. These amounts have beendeducted rom taxes and contributions borne in calculating the study results.The amounts reported are small in relation to the taxes and contributionsborne – (2.0%) on average.
8/3/2019 PWC, 2010 - Total Tax Contribution (TTC) Study of the Global Mining Industry
http://slidepdf.com/reader/full/pwc-2010-total-tax-contribution-ttc-study-of-the-global-mining-industry 16/36
12
6 Taxes collected by mining companies
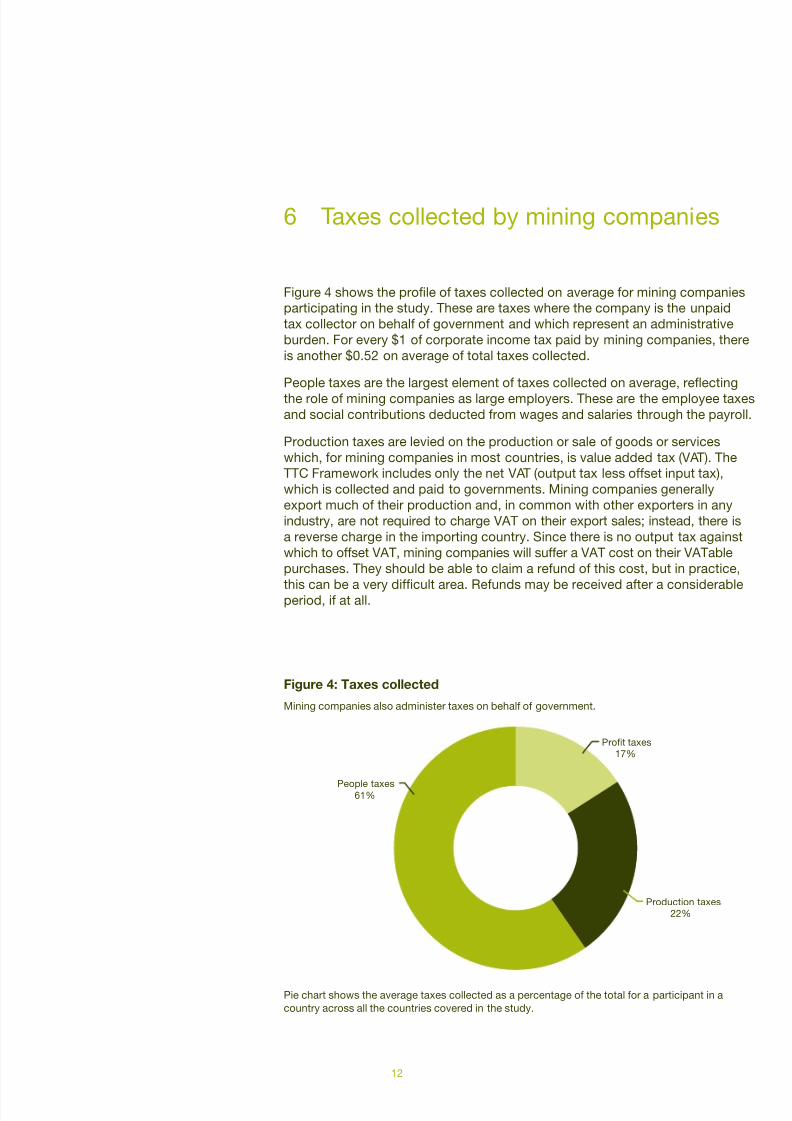
Figure 4 shows the prole o taxes collected on average or mining companiesparticipating in the study. These are taxes where the company is the unpaidtax collector on behal o government and which represent an administrativeburden. For every $1 o corporate income tax paid by mining companies, thereis another $0.52 on average o total taxes collected.
People taxes are the largest element o taxes collected on average, refectingthe role o mining companies as large employers. These are the employee taxesand social contributions deducted rom wages and salaries through the payroll.
Production taxes are levied on the production or sale o goods or serviceswhich, or mining companies in most countries, is value added tax (VAT). TheTTC Framework includes only the net VAT (output tax less oset input tax),which is collected and paid to governments. Mining companies generallyexport much o their production and, in common with other exporters in anyindustry, are not required to charge VAT on their export sales; instead, there isa reverse charge in the importing country. Since there is no output tax againstwhich to oset VAT, mining companies will suer a VAT cost on their VATablepurchases. They should be able to claim a reund o this cost, but in practice,
this can be a very dicult area. Reunds may be received ater a considerableperiod, i at all.
Figure 4: Taxes collected
Mining companies also administer taxes on behal o government.
Pie chart shows the average taxes collected as a percentage o the total or a participant in acountry across all the countries covered in the study.
Profit taxes
17%
Production taxes
22%
People taxes61%

8/3/2019 PWC, 2010 - Total Tax Contribution (TTC) Study of the Global Mining Industry
http://slidepdf.com/reader/full/pwc-2010-total-tax-contribution-ttc-study-of-the-global-mining-industry 17/36
13
The other element o taxes collected is categorised under taxes on prot.This includes all taxes withheld or deducted at source rom various types opayment (apart rom wages and salaries) such as dividends, royalties, eesor other charges. These are oten required when payments are made acrossnational boundaries and sometimes within the country.

8/3/2019 PWC, 2010 - Total Tax Contribution (TTC) Study of the Global Mining Industry
http://slidepdf.com/reader/full/pwc-2010-total-tax-contribution-ttc-study-of-the-global-mining-industry 18/36
14
7 Employment taxes
Mining companies are large employers and make an important contribution inemployment taxes. The companies participating in the study reported a total o302,880 employees in the countries or which they provided data, and a total oUS$1.7bn in employment taxes borne and collected7.
On average, or each one o their employees, these mining companies paid anamount o US$15,349 to government in employment taxes alone, split between$5,290 taxes borne and $10,059 taxes collected – see Figure 5. This is anincreased gure than ound in the rst study ($14,875). The gure represents anaverage or all countries covered in the study and will vary by country, refectingthe size o the economy and income per capita, as well as the tax regime. Theresults range rom $1,226 to $97,316.
Employment taxes per employee are an indication o the direct benet broughtto the public nances or each job created or maintained by these companies.In a recession, maintaining employment levels is a key economic and social aim.For companies taking part in both studies, employee numbers were fat between2007 and 2008 (minus 0.3% on average), but average wages and employmenttaxes per employee grew (wages by 12% and employment taxes by 16%).
However, looking orward, it is likely that employee numbers and employmenttaxes will be impacted in the ollowing period as the recession takes hold.
Figure 5. Employment taxes per employee
On average, or every one o their 302,880 employees, mining companies paid $15,349 inemployment taxes.
Employment taxes borne and collected per employee is an indicator o the direct benet to thepublic nances o each job created or maintained. Chart shows the average result or a participantin a country across all the countries covered in the study.
7 Employment taxes borne include employers’ social contributions and any taxes on employment thatare charged on the employer, such as payroll taxes. Employment taxes collected are employees’income tax and social security deducted rom wages and salaries through the payroll.
Employment taxes peremployee
U S D ‘ 0
0 0
Employment taxes collected Employment taxes borne
$10,059
2
4
6
8
10
12
14
16
$5,290

8/3/2019 PWC, 2010 - Total Tax Contribution (TTC) Study of the Global Mining Industry
http://slidepdf.com/reader/full/pwc-2010-total-tax-contribution-ttc-study-of-the-global-mining-industry 19/36
15
8 The impact o tax on the mining sector
In addition to reporting the amounts o taxes and contributions borne andcollected by mining companies, we have calculated results or certainindicators to put the gures into context and to show the impact o taxes andcontributions on the sector. Figure 6 sets out the indicators that we have usedand what they measure.
Figure 6: Total Tax Contribution indicators
Total contribution to governmentexpressed as a percentage oturnover.
Indicates the size o the contributionin the context o the size o theoperations.
Total Tax Rate (all taxes andcontributions borne as a percentageo prot beore all taxes andcontributions borne).
Measures the burden o all taxesand contributions borne in relationto protability.
Employment taxes borne andcollected per employee.
Indicates the direct benet to publicnances or each job created ormaintained.
Total contribution to government as a percentage o turnover is an indicatoro the size o the total contribution in relation to the size o the business. Weconsider this to be a useul indicator or the mining industry, since it is linked toturnover and thereore relevant or a longer period over the lie cycle o a miningproject than a measure linked to prot (see Figure 2).
Mining companies make a large contribution to public nances in relation to thesize o their operations. On average, as shown in Figure 7, the companies inthe study paid an amount equivalent to 15.3% o their turnover to government,comprising 10.8% in taxes and contributions borne and 4.5% in taxescollected. The results in the study range rom 6.4% to 39.9%.

8/3/2019 PWC, 2010 - Total Tax Contribution (TTC) Study of the Global Mining Industry
http://slidepdf.com/reader/full/pwc-2010-total-tax-contribution-ttc-study-of-the-global-mining-industry 20/36
16
Figure 7: Total contribution to government as a percentage o turnover
On average mining companies contribute an amount equivalent to 15.3% o their turnoverto government.
Total contribution expressed as a percentage o turnover is an indicator o the size o thecontribution in the context o the size o the business as measured by turnover. Chart shows theaverage results or a participant in a country across all countries covered in the study.
At 10.8% in the 2009 study, taxes and contributions borne are equivalent to alower percentage o turnover than in the 2008 study (12.5%). This reductionis due to a all in taxes linked to prots – turnover increased 4% on averagebetween the two years or companies taking part in both studies, but taxes onprots ell (see section 5).
It is notable that taxes and contributions borne are a higher percentage oturnover on average or mining companies than or a broad cross-section ocompanies in our cross-industry studies. Figure 8 shows a comparison o theresults with our TTC studies in our countries which have an important miningindustry. These are cross-industry studies with participants rom a rangeo industry sectors. At 10.8%, taxes and contributions borne are a higher
percentage o turnover on average or mining companies around the world thanthe cross-sector results in Australia (7.7%), Canada (4.4%), South Arica (7.2%)and the US (5.5%)8.
8 See What is your company’s Total Tax Contribution? 2008 survey results
PricewaterhouseCoopers survey in Australia, published March 2009
Total Tax Contribution Canada’s Tax Regime: complexity and competitiveness in difcult times –PricewaterhouseCoopers survey or the Canadian Council o CEOs, published May 2009
Total Tax Contribution How much do large South Arican companies really pay?*PricewaterhouseCoopers survey in South Arica, published October 2008
Total Tax Contribution – How much do large U.S. companies pay in taxes?*PricewaterhouseCoopers survey in the US, published February 2009
The publications listed above can be ound on our dedicated micro site www.pwc.co.uk/ttc
0%
5%
10%
15%
20%
Taxes and contributionsborne
Taxes collected Total contribution togovernment
10.8%
4.5%
15.3%

8/3/2019 PWC, 2010 - Total Tax Contribution (TTC) Study of the Global Mining Industry
http://slidepdf.com/reader/full/pwc-2010-total-tax-contribution-ttc-study-of-the-global-mining-industry 21/36
17
Taxes collected to turnover is a lower percentage refecting that:
• miningcompaniesaremajorexporters,asexplainedinsection5,andare
thereore not required to account or VAT; and
• somecompaniesinotherindustrysectorshaveanadditionaltaxcollection
role, or example, oil producers collect uel excise duty.
Figure 8: Total contribution to government as a percentage o turnover –
international comparison
On average, mining companies pay a higher percentage to government in taxes and contributionsborne than a broad cross-section o companies as shown in our cross industry studies.
Chart shows the average result rom the mining study and compares this with the average result incross-industry studies in Australia, Canada, South Arica and the US.
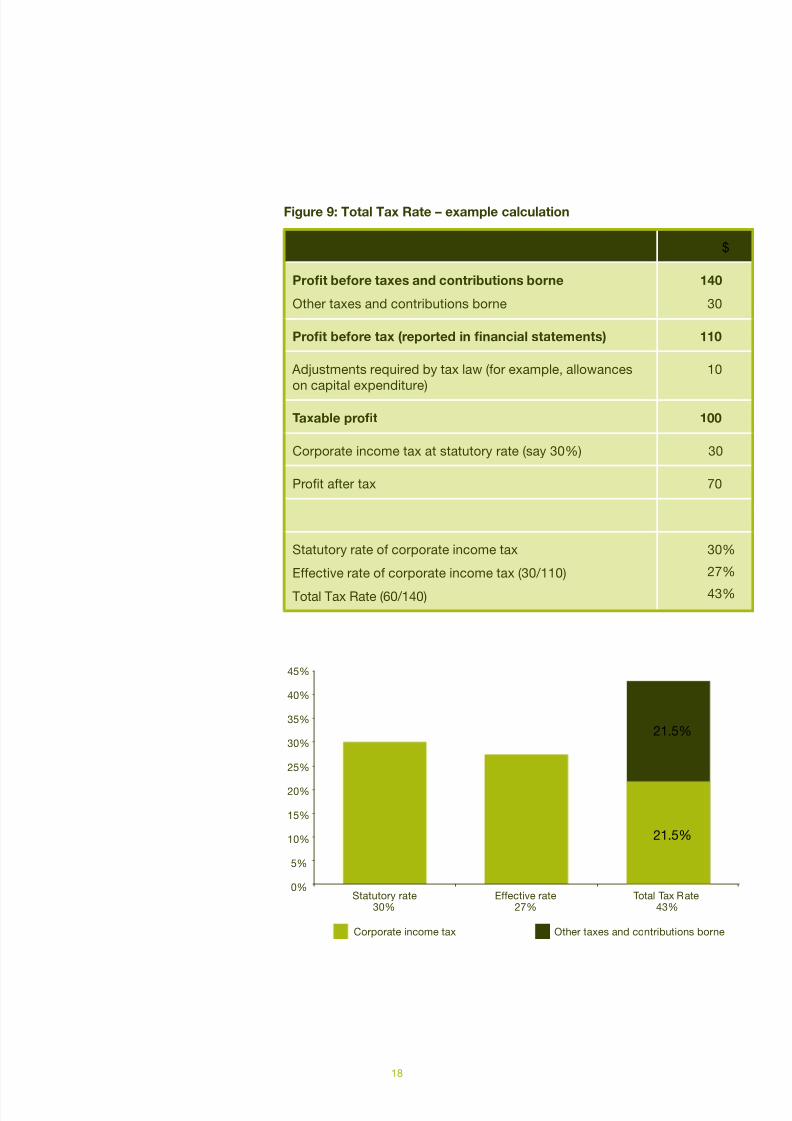
The Total Tax Rate (TTR) is a measure o the burden o all taxes andcontributions borne on a particular business. In the calculation, the numeratoris the total taxes and contributions borne and the denominator is the protbeore all these taxes and contributions. Taxes and contributions which aredeductible in computing prot beore tax (as reported in nancial statements)are added back to get a prot beore all taxes and contributions borne. Figure 9provides a simple hypothetical example calculation and shows how this relatesto other measures o the tax burden on companies:
• thestatutory rate o corporate income tax is the headline rate o tax leviedby government on prots;
• theeective rate o corporate income tax is the actual rate o corporateincome tax paid taking into account adjustments required by tax law; orexample, to disallow certain expenses or to give tax allowances or capitalexpenditure or research and developments costs; and
• theTTRistheactualratepaidtakingallthedifferenttaxessufferedinrelation
to prot beore all those taxes.
0%
2%
4%
6%
8%
10%
12%
Canada US South Africa Australia Mining study
Taxes and contributions borne Taxes collected
8/3/2019 PWC, 2010 - Total Tax Contribution (TTC) Study of the Global Mining Industry
http://slidepdf.com/reader/full/pwc-2010-total-tax-contribution-ttc-study-of-the-global-mining-industry 22/36
18
Figure 9: Total Tax Rate – example calculation
$
Proft beore taxes and contributions borne
Other taxes and contributions borne
140
30
Proft beore tax (reported in fnancial statements) 110
Adjustments required by tax law (or example, allowanceson capital expenditure)
10
Taxable proft 100
Corporate income tax at statutory rate (say 30%) 30
Prot ater tax 70
Statutory rate o corporate income tax
Eective rate o corporate income tax (30/110)
Total Tax Rate (60/140)
30%
27%
43%
Corporate income tax Other taxes and contributions borne
21.5%
0%
5%
10%
15%
20%
25%
30%
35%
40%
45%
Statutory rate30%
Effective rate27%
Total Tax Rate43%
21.5%

8/3/2019 PWC, 2010 - Total Tax Contribution (TTC) Study of the Global Mining Industry
http://slidepdf.com/reader/full/pwc-2010-total-tax-contribution-ttc-study-of-the-global-mining-industry 23/36
19
The Total Tax Rate is a more volatile indicator or the mining sector, sinceprotability will vary considerably across the lie cycle o a mining project. A TTR calculation cannot be made where there is a loss (rather than a prot)beore taxes and contributions borne. We were not able to make a calculationor this reason, in a th (21%) o data sets. Where we were able to make thecalculation, and as shown in Figure 10, the average TTR in the study was39.3%. The results range rom 5.6% to 140.8%9.
Figure 10: Total Tax Rate
The average Total Tax Rate or companies in the study is 39.3%.
Total Tax Rate is an indicator o the cost o taxes and contributions borne in relation to prots. Chartshows the average result or a participant in a country across all the countries covered in the study.
As prots decline in an economic downturn, TTRs increase. The average TTRhas increased since the rst study (32.2%). This is because while taxes onprots will all with lower protability, other taxes and contributions (which arenot linked to prots) may not all, or all to the same degree, and thus become
relatively more expensive. For companies taking part in both studies, theaverage TTR increased by 4% between 2007 and 2008. The same eect isseen in our annual TTC study with FTSE 100 companies in the UK. Prots alsoell or these companies between 2007 and 2008, due to the nancial crisis andeconomic downturn, while average TTRs increased10.
9 It should also be noted that the data provided by participants or prot beore tax may involve a
degree o estimation or allocation. This is because there is oten no requirement to consolidateprot at a country level, either or nancial reporting or or tax purposes. In addition, there isusually a mismatch between corporate income tax paid in the year and prots o the year.
10 See Total Tax Contribution – PricewaterhouseCoopers (UK) 2009 survey or the Hundred Group
o Finance Directors, published March 2009 on www.pwc.co.uk/ttc
Corporate income tax
15.4%
23.9%
0%
5%
10%
15%
20%
25%
30%
35%
40%
45%
Total Tax Rate
Other taxes and
contributions borne

8/3/2019 PWC, 2010 - Total Tax Contribution (TTC) Study of the Global Mining Industry
http://slidepdf.com/reader/full/pwc-2010-total-tax-contribution-ttc-study-of-the-global-mining-industry 24/36
20
9 Regional analysis
Mining companies participating in the study provided data on miningoperations in 20 countries around the world11. So ar, the results have shownan average picture across all these countries. However, sucient data wasprovided to enable us to group some o the countries into regional or economicgroupings and provide a separate analysis or these. They are Arica, Latin America and high income OECD countries12. In looking at the regional analysis,
it is important to note that the amount o data provided varies by region, or bycountry within a region. The results show an average picture or 2008 or thecompanies providing data and may not necessarily be representative o theregion, the industry as a whole, or the picture over time.
Figure 11 is an analysis o the total contribution to government reported inthe study split into regional groupings. O the total amounts, 20% was paidto governments in Arica, 31% in Latin America, 24% in high income OECDcountries and 25% in other countries. As above, the amount o data providedby region varies. More data was provided or Latin America than or theother regions13.
Figure 11: Total contribution – by region
Chart shows the total contribution to government reported in the study split by region.
11 The countries are Argentina, Australia, Brazil, Canada, Chile, China, Democratic Republic o
Congo, Finland, Ghana, Guatemala, Indonesia, Kazakhstan, Mexico, Papua New Guinea, Peru,Russia, South Arica, Tanzania, Turkey and the US.
12 Groupings per World Bank – Doing Business 2010.
13 17 data sets or Latin America, 14 or Arica and 14 or OECD countries.
Africa – 20%
Latin America – 31%
OECD – 24%
Other countries – 25%

8/3/2019 PWC, 2010 - Total Tax Contribution (TTC) Study of the Global Mining Industry
http://slidepdf.com/reader/full/pwc-2010-total-tax-contribution-ttc-study-of-the-global-mining-industry 25/36
21
Figure 12 shows an analysis o taxes and contributions borne, compared byregion. It is important to note that this is a comparison o the percentage splito taxes and contributions borne, and not absolute amounts. It is interestingto note the dierences between the percentages o the total attributable tocorporate income tax and to people (employment) taxes between the OECDcountries and the other two regions.
Figure 12: Taxes and contributions borne – by region
Chart shows the average position or a participant in a country by region.
At 22%, corporate income tax is a lower percentage o the total in the OECDcountries than in the other two regions. This refects lower protability andthereore corporate income tax payments. Nearly hal the data sets were inloss in OECD countries, compared to around a sixth in the other two regions.
At 36% o the total borne, employer taxes and social contributions (peopletaxes) are a higher percentage in the OECD, refecting higher employmentcosts. People taxes borne are equivalent on average to 2.4% o turnover inthe OECD countries, compared to 0.7% in Latin America and 0.5% in Arica.
Figure 13 compares the average employment taxes per employee across thethree regional groupings. However, since this result does compare absoluteamounts, it is important to put the gures into the context o the size o theeconomies and income per capita in the countries. Average employment taxesper employee in the Arican countries are US$5,539, compared to income percapita o US$1,770, and in Latin America are US$9,385 compared to income percapita o US$6,766. The gures in the OECD countries are average employmenttaxes o US$40,475 and income per capita o US$41,971. The results suggestthat in all the regions, these companies employ skilled, well-paid workers14.
14 In addition to employees, data was requested on contractors who are oten used in the industry.Participants reported total payments o $1.3bn to a total o 53,596 contractors. The averagepayment was $22,572 in Arica, $30,046 in Latin America and $108,300 in the OECD countries.No data is available on taxes paid by contractors; however these are part o the taxes indirectlygenerated by the activities o mining companies.
OECD
22%24%
36%
18% Africa
Production and
property taxes
17% People taxes
8%
Mining taxes, royalties
and other contributions
31%
Corporate income tax
44%
Latin America
50%
21%
16%
13%

8/3/2019 PWC, 2010 - Total Tax Contribution (TTC) Study of the Global Mining Industry
http://slidepdf.com/reader/full/pwc-2010-total-tax-contribution-ttc-study-of-the-global-mining-industry 26/36
22
Figure 13: Employment taxes per employee – by region
Chart shows the average result or a participant in a country by region. Source or income percapita: World Bank Development indicators (Doing Business 2010)
Figure 14 compares the average total contribution to government as apercentage o turnover, by region. At 13%, taxes and contributions borne are
equivalent to a higher percentage o turnover on average in Latin America,due to a higher percentage or corporate income tax. The data sets or Latin America are more protable and pay more corporate income tax on average,perhaps refecting more operations at a mature stage o production.
Figure 14: Total contribution to government as a percentage o turnover –
by region
Chart shows the average result or a participant in a country by region.
$5,539
$9,385
$40,475
-
10
20
30
40
50
Africa Latin America OECD
U S D $
' 0 0 0
Employment taxes per employee Average income per capita
7.4% 7.5%
13.0%
6.3%
3.8%4.4%
0%
2%
4%
6%
8%
10%
12%
14%
OECD Africa Latin America
Taxes and contributions borne Taxes collected

8/3/2019 PWC, 2010 - Total Tax Contribution (TTC) Study of the Global Mining Industry
http://slidepdf.com/reader/full/pwc-2010-total-tax-contribution-ttc-study-of-the-global-mining-industry 27/36
23
At 6.3%, taxes collected are equivalent to a higher percentage o turnover onaverage in the OECD countries, due to a higher percentage or people taxescollected (income tax and employees’ social contributions deducted throughthe payroll).
Figure 15 compares the average TTR by region. The average result is highest inLatin America at 39.5%, due to a higher percentage or corporate income tax.The average percentage attributable to other taxes and contributions borne ishighest in OECD countries, due to higher people taxes borne (employer taxesand social contributions).
Figure 15: Total Tax Rate – by region
Chart shows the average result or a participant in a country by region.
Corporate income tax Other taxes and contributions borne
32.6%34.4%
39.5%
0%
5%
10%
15%
20%
25%
30%
35%
40%
45%
50%
OECD Africa Latin America

8/3/2019 PWC, 2010 - Total Tax Contribution (TTC) Study of the Global Mining Industry
http://slidepdf.com/reader/full/pwc-2010-total-tax-contribution-ttc-study-of-the-global-mining-industry 28/36
24
10 Tax transparency
So ar as we are aware, this is the only study to collect data on the taxes andother amounts paid to government by mining companies. For most o thecompanies taking part in the study, this was also the rst time that they hadcollected this data. In return or taking part, each company received a reportthat illustrates their contribution to government, country-by-country and overall.In PwC’s view, every mining company should have this inormation on a regular
basis or all its operating markets. It is essential management inormation and isalso helpul in inorming communication and engagement with government andother key stakeholders. Companies which participate in our TTC studies aroundthe world tell us that they use their own data in these ways.
All companies are coming under increased public scrutiny regarding the taxesthey pay, and mining companies are at the oreront o this issue. Miningcompanies extract natural resources, usually in remote locations and otenin the developing world. There is, thereore, strong interest in what they payor these resources, through taxation and other ees and levies, and how theyimpact on the communities where they operate. There is also concern that thegovernments in these countries should use the revenues received to urthersocial and economic development to improve the lives o citizens.
Initiatives to increase transparency include the global campaign by PublishWhat You Pay (PWYP) or revenue transparency in the oil, gas and miningindustries. The PWYP coalition o civil society organisations calls on extractiveindustry companies to disclose payments to governments and otherinormation (including reserves, production volumes, production revenues andcosts) on a country-by-country basis15. Their proposals have been included inthe International Accounting Standards Board discussion paper on extractiveindustries o April 2010, with a request or comment by 30 July 201016. ThePWYP proposals are intended to complement the Extractive IndustriesTransparency Initiative (EITI) which encourages governments o resource-richcountries to “Publish What You Earn”. A large number o companies, industryassociations, investors, civil society organisations and intergovernmental
organisations (such as The World Bank and the IMF) support the EITI17. Forexample, AngloGold Ashanti discloses all payments to and assistance receivedrom government, country-by-country, in its Sustainability Review, in supporto its commitments under the EITI, whether or not the country concerned is amember o the EITI18.
15 See http://www.publishwhatyoupay.org/
16 International Accounting Standards Board Discussion Paper DP/2010/1, Extractive Activities, April 2010.
17 See http://www.eitransparency.org/
18 See AngloGold Ashanti Sustainability Review 2009, pages 53-56.

8/3/2019 PWC, 2010 - Total Tax Contribution (TTC) Study of the Global Mining Industry
http://slidepdf.com/reader/full/pwc-2010-total-tax-contribution-ttc-study-of-the-global-mining-industry 29/36
25
Our work on tax transparency shows that some mining companies are leadingthe way in corporate reporting or their tax aairs. For each o the past twoyears, UK-based FTSE 100 mining companies have won the PwC sponsoredBuilding Public Trust Awards or Tax Reporting – Anglo American plc in 2009,and Kazakhmys in 200819. Both o these companies use the TTC approach toshow payments to government by country, split between borne and collected.
In making the award to Anglo American plc in 2009, the independent panelo judges said that they liked, “the open and transparent discussion o tax,including tax strategy, tax payments and relationships with tax authorities; andalso the clear links made by Anglo American between tax and their corporateresponsibility commitments, and to their wider economic contribution”.
Figure 16 is an extract rom the Anglo American plc Report to Society 2008.Figure 17 is an extract rom the Kazakhmys plc Annual Report and accounts orthe same year.
PwC suggests that all mining companies consider i there could be businessbenets rom being more transparent in communicating their tax aairs to theirstakeholders. We also suggest that the TTC Framework provides a good basisor mining companies to report the dierent taxes and other amounts thatthey pay.
19 The PricewaterhouseCoopers (UK) Building Public Trust Awards celebrate the commitmento the UK’s largest corporations and public sector bodies to build public trust through theircommunication o the key building blocks o sustainable perormance. The largest UK-basedcompanies (FTSE 100 and 250) are eligible or one or more o the awards listed. The awards are judged by an independent panel who review a shortlist put orward by PwC. In 2009, awardswere made in the ollowing categories:
• FTSE100for‘Excellenceinreporting’
• FTSE250for‘Excellenceinreporting’
• PublicSectorfor‘Excellenceinreporting’
• LifetimeAchievementRecognitionfor‘Buildingtrustandcondenceinthecorporateand
public sectors’
• ReportingofExecutiveRemuneration
• TaxReportingintheFTSE100&250
• SustainabilityReportingintheFTSE100&250
• SustainabilityReportinginthePublicSector
See also Appendix 2, our suggested ramework or communicating tax to stakeholders (the PwCTax Transparency Framework) which is used to short list companies or the judging panel.

8/3/2019 PWC, 2010 - Total Tax Contribution (TTC) Study of the Global Mining Industry
http://slidepdf.com/reader/full/pwc-2010-total-tax-contribution-ttc-study-of-the-global-mining-industry 30/36
26
Figure 16: Anglo American plc – reporting
Source: Anglo American plc – Report to Society 2008, pages 21 & 22

8/3/2019 PWC, 2010 - Total Tax Contribution (TTC) Study of the Global Mining Industry
http://slidepdf.com/reader/full/pwc-2010-total-tax-contribution-ttc-study-of-the-global-mining-industry 31/36
27
Figure 17: Kazakhmys plc – reporting
Source: Kazakhmys Plc, Annual Report 2008, p44,45
Total tax contributionDuring 2008, the Group paid $861 million (2007: $1,108 million)in taxes across the countries in which it has a presence. Companytaxes, such as corporate income taxes, excess profits tax, royaltiesand employer taxes, comprised $802 million (2007: $1,059 million)of this total. In addition, the Group indirectly contributed$59 million (2007: $49 million) in employee taxes and withholdingtaxes primarily on dividends, which the Group collected on behalf of government authorities and paid over to them.
’
’
’
’ ’
Taxes paid directly to governments by category and region$ million Central Asia1 UK Germany 2008 total 2007 total
Taxes paidCorporate income taxes (including excess profits tax) 561 41 19 621 850Payroll taxes (employer’s obligations) 47 1 9 57 54Customs and stamp duties 39 10 – 49 36Taxes on properties 25 – 1 26 18Royalties and environmental payments 46 – – 46 100Miscellaneous taxes 3 – – 3 1
721 52 29 802 1,059
Taxes collected and remittedWithholding taxes on dividends, interest and services 4 – – 4 3Payroll taxes (employee’s obligations) 34 4 17 55 46
38 4 17 59 49
Total 759 56 46 861 1,108
1 Includes Kazakhstan, Kyrgyzstan and Tajikistan.

8/3/2019 PWC, 2010 - Total Tax Contribution (TTC) Study of the Global Mining Industry
http://slidepdf.com/reader/full/pwc-2010-total-tax-contribution-ttc-study-of-the-global-mining-industry 32/36
28
Appendix 1
Taxes and contributions borne andcollected by Mining companies:illustrative list
Taxes and contributions borne
Taxes on prots Corporate income taxOther prot taxes
People taxes Employer social contributionsPayroll taxes and other taxes on the employer
Taxes on production Customs duties and taxes on internationaltransactionsIrrecoverable VAT and other taxes borne on theproduction or sale o goods and services
Property taxes Taxes on the ownership and use o real and
intangible propertyStamp duties and other transer taxes
Mining taxes Taxes on the extraction o minerals and metals
User ees Royalties, licence ees and resource rents or theextraction o minerals and metals
Other contributions Contributions to inrastructureOther contributions
Taxes collected
Taxes on prots Taxes withheld at source rom royalties, ees orother payments
People taxes Employee social contributionsEmployee income tax deducted through payroll
Taxes on production Net value added tax (VAT)(output less input tax)Other taxes levied on the production and sale ogoods and services

8/3/2019 PWC, 2010 - Total Tax Contribution (TTC) Study of the Global Mining Industry
http://slidepdf.com/reader/full/pwc-2010-total-tax-contribution-ttc-study-of-the-global-mining-industry 33/36
29
Appendix 2
Suggested ramework or communicatingtax to stakeholders
The PricewaterhouseCoopers (UK) Tax Transparency Framework wasdeveloped in discussions with dierent groups o stakeholders. It covers three
aspects o corporate tax aairs and provides a Framework or companies toconsider the benets and risks o greater tax transparency and how to bestcommunicate their tax aairs.
1. Tax strategy and risk management
- Discussion o objectives and strategy in relation to tax
- Policies in key areas which are relevant or the business (eg, tax planning,transer pricing)
- Governance and oversight or tax
- Discussion o material tax risks
2. Tax numbers and perormance
- Clear explanation to why the tax charge is not simply accounting prot atthe statutory rate
- Reconciliation o cash tax payments to the tax charge
- Forward looking measures or tax, (orecast accounting and cash rates)
3. Total Tax Contribution and the wider impact o taxes
- How tax impacts the wider business strategy and results o the company
- How the business adds value to shareholders and other stakeholders,with reerence to tax
- Communication o the economic contribution o all taxes paid
- Discussion o advocacy and lobbying activity on tax

8/3/2019 PWC, 2010 - Total Tax Contribution (TTC) Study of the Global Mining Industry
http://slidepdf.com/reader/full/pwc-2010-total-tax-contribution-ttc-study-of-the-global-mining-industry 34/36
30
Contact details
For urther inormation on the miningstudy, or to discuss your company’sTotal Tax Contribution, please contactone o the specialists below:
Total Tax Contribution -country contacts
Australia Tim Cox
T: +61 (3) 8603 6181E: [email protected]
Canada Lincoln Schreiner
T: +1 (604) 806-7713E: [email protected]
Chile Sandra Benedetto
T: +56 2 9400155E: [email protected]
South AricaCharles De Wet
T: +27 21 529 2377E: [email protected]
East AricaFrancis Kamulegeya
T: + 256 41 236018E: [email protected]
GhanaDarcy White
T: +233 21 761 576E: [email protected]
US Peter Merrill
T: +1 (202) 414 1666E: [email protected]
UK Susan Symons
T: +44 (0)20 7804 6744
Global Mining Leadership Team
Global Mining Leader and AustraliaTim Goldsmith
T: +61 3 8603 2016E: [email protected]
South AricaHugh Cameron
T: +27 11 797 4292E: [email protected]
CanadaJohn Gravelle, Toronto
T: +1 (416) 869 8727E: [email protected]
ChinaKen Su, Beijing
T: +86 (10) 6533 7290
E: [email protected] Rao, Hyderabad
T: +91 40 6624 6688E: [email protected]
Latin AmericaColin Becker, Santiago
T: +56 (2) 940 0016E: [email protected]
RussiaandCentral&EasternEurope
John Campbell, Moscow
T: +7 (495) 967 6279E: [email protected]
United KingdomJason Burkitt, London
T: +44 (20) 7213 2515E: [email protected]
United StatesSteve Ralbovsky, Phoenix
T: +1 (602) 364 8193E: [email protected]
Knowledge ManagerBen Gargett
T: +61 3 8603 2539E: [email protected]

8/3/2019 PWC, 2010 - Total Tax Contribution (TTC) Study of the Global Mining Industry
http://slidepdf.com/reader/full/pwc-2010-total-tax-contribution-ttc-study-of-the-global-mining-industry 35/36

8/3/2019 PWC, 2010 - Total Tax Contribution (TTC) Study of the Global Mining Industry
http://slidepdf.com/reader/full/pwc-2010-total-tax-contribution-ttc-study-of-the-global-mining-industry 36/36
This publication has been prepared or general guidance on matters o interest only, and does not constitute proessional advice. You should not actupon the inormation contained in this publication without obtaining specic proessional advice. No representation or warranty (express or implied) isgiven as to the accuracy or completeness o the inormation contained in this publication, and, to the extent permitted by law, PricewaterhouseCoopersdoes not accept or assume any liability, responsibility or duty o care or any consequences o you or anyone else acting, or reraining to act, in relianceon the inormation contained in this publication or or any decision based on it.
© 2010 PricewaterhouseCoopers All rights reserved “PricewaterhouseCoopers” and “PwC” reer to the network o member rms o
www.pwc.co.uk