PVC Pipe Cyclic Design Method - PVC Pipe Association
12
– 1 – PVC Pipe Cyclic Design Method Steven Folkman, Ph.D., 1 and Jay Parvez, EIT 2 1 Buried Structures Laboratory, Utah State University (retired), 1232 E 100 S, Logan, UT 84321; E-mail: [email protected] 2 Regional Engineer, Uni-Bell PVC Pipe Association, Dallas, TX 75234; E-mail: jparvez@uni- bell.org ABSTRACT This paper provides the background for a new method in fatigue life calculations for polyvinyl chloride (PVC) pipe developed by Utah State University that is simple to use and is the recommended practice by the PVC Pipe Association. Design engineers must select an appropriate pipe wall thickness (or DR) that will accommodate both maximum pressure and repeated surge pressure events. Methods for assessing the number of cycles to failure have been developed for PVC pipe over the past 50 years. The AWWA C900-16 standard has a procedure in Appendix B for assessing the number of cycles to failure for PVC pipe, which is based off of testing done at Utah State University’s Buried Structures Laboratory in 2004 and additional research prior to that. The current approach requires input of a mean stress and a stress amplitude and typically requires a root finding approach to calculate a number of cycles to failure. Experience has shown that this method can be difficult and time-consuming for most design engineers to use. This paper looks at a new method that will be used as a design standard in North America to calculate fatigue life in PVC pipes subjected to repeated pressure surge events. INTRODUCTION Marshall et al. reports little to no history of PVC pipe failure due to fatigue alone in North America for municipal application (Marshall et al., 1998). Nevertheless, design engineers need an appropriate method to account for effects of cyclic pressures. There are numerous studies of fatigue failure in PVC pipe and several are discussed below. These investigations tend to focus on large amplitude pressure fluctuations which can produce a short time to failure. As pressure amplitudes decrease, the time and number of cycles to failure increases. At low stress amplitudes, the time required to complete a pressure cycling test to failure can cover an excessive number of years making the test difficult to be completed. Thus the failure data that is available was done with moderate to high stress amplitudes. Procedures for estimating the number of cycles to failure for a given stress amplitude are outlined in AWWA C900-16 standard in Appendix B. These procedures are based on testing done by Vinson (Vinson, 1982) and Jeffery (Jeffery, Moser, and Folkman, 2003). This procedure correlates both stress amplitude and mean stress to the number of cycles to failure. The relationships developed provide good results as long as one considers stress amplitudes within the range used to develop the relationships. If one considers stress amplitudes less than 400 psi (2.76 MPa), the predicted number of cycles to failure becomes inaccurate. Additionally, the equations in AWWA C900-16 Appendix B require an iterative or root finding technique to obtain an estimated number of
Transcript of PVC Pipe Cyclic Design Method - PVC Pipe Association

– 1 –
PVC Pipe Cyclic Design Method
Steven Folkman, Ph.D.,1 and Jay Parvez, EIT2
1 Buried Structures Laboratory, Utah State University (retired), 1232 E 100 S, Logan, UT 84321; E-mail: [email protected] 2 Regional Engineer, Uni-Bell PVC Pipe Association, Dallas, TX 75234; E-mail: [email protected] ABSTRACT This paper provides the background for a new method in fatigue life calculations for polyvinyl chloride (PVC) pipe developed by Utah State University that is simple to use and is the recommended practice by the PVC Pipe Association. Design engineers must select an appropriate pipe wall thickness (or DR) that will accommodate both maximum pressure and repeated surge pressure events. Methods for assessing the number of cycles to failure have been developed for PVC pipe over the past 50 years. The AWWA C900-16 standard has a procedure in Appendix B for assessing the number of cycles to failure for PVC pipe, which is based off of testing done at Utah State University’s Buried Structures Laboratory in 2004 and additional research prior to that. The current approach requires input of a mean stress and a stress amplitude and typically requires a root finding approach to calculate a number of cycles to failure. Experience has shown that this method can be difficult and time-consuming for most design engineers to use. This paper looks at a new method that will be used as a design standard in North America to calculate fatigue life in PVC pipes subjected to repeated pressure surge events. INTRODUCTION Marshall et al. reports little to no history of PVC pipe failure due to fatigue alone in North America for municipal application (Marshall et al., 1998). Nevertheless, design engineers need an appropriate method to account for effects of cyclic pressures. There are numerous studies of fatigue failure in PVC pipe and several are discussed below. These investigations tend to focus on large amplitude pressure fluctuations which can produce a short time to failure. As pressure amplitudes decrease, the time and number of cycles to failure increases. At low stress amplitudes, the time required to complete a pressure cycling test to failure can cover an excessive number of years making the test difficult to be completed. Thus the failure data that is available was done with moderate to high stress amplitudes. Procedures for estimating the number of cycles to failure for a given stress amplitude are outlined in AWWA C900-16 standard in Appendix B. These procedures are based on testing done by Vinson (Vinson, 1982) and Jeffery (Jeffery, Moser, and Folkman, 2003). This procedure correlates both stress amplitude and mean stress to the number of cycles to failure. The relationships developed provide good results as long as one considers stress amplitudes within the range used to develop the relationships. If one considers stress amplitudes less than 400 psi (2.76 MPa), the predicted number of cycles to failure becomes inaccurate. Additionally, the equations in AWWA C900-16 Appendix B require an iterative or root finding technique to obtain an estimated number of
– 2 –
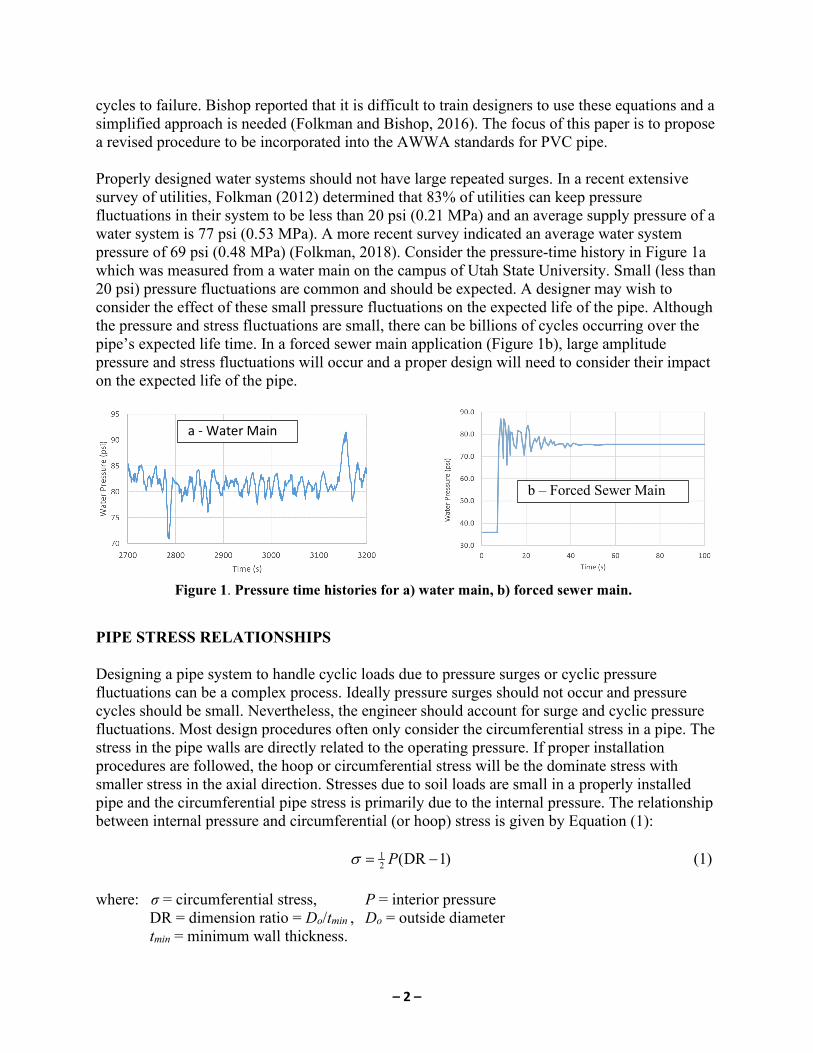
cycles to failure. Bishop reported that it is difficult to train designers to use these equations and a simplified approach is needed (Folkman and Bishop, 2016). The focus of this paper is to propose a revised procedure to be incorporated into the AWWA standards for PVC pipe. Properly designed water systems should not have large repeated surges. In a recent extensive survey of utilities, Folkman (2012) determined that 83% of utilities can keep pressure fluctuations in their system to be less than 20 psi (0.21 MPa) and an average supply pressure of a water system is 77 psi (0.53 MPa). A more recent survey indicated an average water system pressure of 69 psi (0.48 MPa) (Folkman, 2018). Consider the pressure-time history in Figure 1a which was measured from a water main on the campus of Utah State University. Small (less than 20 psi) pressure fluctuations are common and should be expected. A designer may wish to consider the effect of these small pressure fluctuations on the expected life of the pipe. Although the pressure and stress fluctuations are small, there can be billions of cycles occurring over the pipe’s expected life time. In a forced sewer main application (Figure 1b), large amplitude pressure and stress fluctuations will occur and a proper design will need to consider their impact on the expected life of the pipe.
PIPE STRESS RELATIONSHIPS Designing a pipe system to handle cyclic loads due to pressure surges or cyclic pressure fluctuations can be a complex process. Ideally pressure surges should not occur and pressure cycles should be small. Nevertheless, the engineer should account for surge and cyclic pressure fluctuations. Most design procedures often only consider the circumferential stress in a pipe. The stress in the pipe walls are directly related to the operating pressure. If proper installation procedures are followed, the hoop or circumferential stress will be the dominate stress with smaller stress in the axial direction. Stresses due to soil loads are small in a properly installed pipe and the circumferential pipe stress is primarily due to the internal pressure. The relationship between internal pressure and circumferential (or hoop) stress is given by Equation (1): 1
2 (DR 1)Pσ = − (1) where: σ = circumferential stress, P = interior pressure DR = dimension ratio = Do/tmin , Do = outside diameter tmin = minimum wall thickness.
Figure 1. Pressure time histories for a) water main, b) forced sewer main.
a - Water Main
b – Forced Sewer Main

– 3 –
Equation 1 is an accurate estimation of the stress on the inside surface of the pipe under pressure. The exact solution for the circumferential stress in a pipe subjected to internal pressure P is given by Equation (2):
(2) where: ri = internal radius, ro = external radius, r = radius to point of interest (ri ≤ r ≤ ro). For example, consider a C900 6-inch DR 25 PVC pipe with an internal pressure of 100 psi. The inside and outside radius values are 3.174 and 3.45 inches. Equation 1 predicts a stress of:
( )12100 25 1 1200psiσ = − =
Equation 2 predicts a stress of 1202 psi at r = ri demonstrating excellent agreement. Common terms used to describe cyclic stress behavior are shown in Figure 2. This figure illustrates the meaning of peak stress (σpeak), minimum stress (σmin), stress amplitude (σamp), mean or average stress (σmean), and stress range (σrange) used in this paper. Other studies typically report their results in one or more of these terms. Some researchers use the term “stress amplitude” to refer to what is defined here as stress range (i.e. peak-to-peak measurements or σrange in Fig. 2) and thus when comparing results, one may need to apply a factor of 2 to the results. To create these cyclic stresses in Figure 2, the internal pressure would have a proportional behavior when plotted.
PVC FATIGUE PREDICTION MODELS Fatigue failure prediction is normally accomplished by one of two approaches; stress-life and fracture mechanics. Fracture mechanics deals directly with modeling crack initiation and growth. It is complex and requires some knowledge of several parametric terms and usually requires computer software to complete an analysis. Burn, et al. (2006) reviewed fracture mechanics studies of PVC pipe by many authors and demonstrated how to apply fracture mechanics to predict fatigue failures. The report from Burn, et al., details the procedure but many practitioners would find them difficult to apply. A very important observation of that study is the statistical
Figure 2. Illustration of stress terms. time
Circ
umfe
rent
ial s
tress
σmin
σrange
σamp
σmean
σpeak

– 4 –
nature of pipe flaws on fatigue failure. A close inspection of a PVC specimen that failed due to fatigue will usually display at the initiation site a small flaw or defect in the material. Figure 3 has photographs of the fatigue failures in PVC due to pressure cycling and the flaws at the initiation location. The flaws create stress concentrations that amplify the expected stress. All pipe materials have flaws. The significance of a flaw depends on its size, shape, and location. Thus, a fracture mechanics model needs a stochastic model of the flaw size, orientation, and distribution. Pressure cycling tests of pipe specimens reflect these same phenomena by the range in the number of cycles to failure for otherwise identical pipe specimens. For researchers trying to understand fatigue failure, fracture mechanics provides the most accurate approach. Most design engineers do not have a background in fracture mechanics and would not have a good basis for obtaining the required input. A typical design engineer desires a simple and reliable approach that they can use with confidence. Thus, stress-life fatigue calculations are greatly preferred to facture mechanics.
Procedures for computing the number of cycles to failure for a given stress history using a stress-life procedure is well documented in most machine design textbooks (e.g. Budynas and Nisbett, 2015). In metals, both the mean stress and the stress amplitude affect the number of cycles to failure. A stress-life analysis often is portrayed as a “S-N diagram” where a measure of stress is plotted versus the number of cycles to failure. For example, Figure 4 illustrates an S-N diagram for 6061-T6 aluminum where the vertical axis or “S value” is the peak or maximum stress. Figure 4 has different curves for four stress ratios = σmax/σmin. The time history curve on the right illustrate max and min values. Thus for metals in tension, the mean stress value does affect the number of cycles to failure. The curves have “run-out” points indicating an infinite life condition where no failures were found after 10 million cycles. This is called an endurance limit. S-N diagrams for PVC pipe have been developed by a number of investigators. Vinson published a method to predict fatigue failure in PVC pipes (Vinson, 1975). Vinson ran tests on 6-inch (152 mm), CIOD SDR 17 and 6-inch (152 mm), IPS OD SDR 26 PVC pipe. The pipes were cycled from a base hoop stress between 400 and 500 psi (2.76 and 3.45 MPa) up to various peak hoop stresses. Fitting a straight line through his data, he developed the following equation for predicting cycles to failure from a peak hoop stress:
( ) ( ) 4.906215.05 10 peakN σ−
= × (3)
Figure 3. Photographs of a PVC fatigue initial failure site that started at a flaw.
Flaw
Flaw

– 5 –
where: N = number of surges to failure and σpeak = peak hoop stress in psi units. His experimental data points and Eq. (3) were used to generate the S-N diagram in Figure 5. The equation he developed was used for years as the standard for predicting fatigue life of PVC pipe. His use of peak stress to predict fatigue failure is inconsistent with most other PVC fatigue failure prediction methods.
Other researchers have developed similar S-N diagrams for PVC (see Hucks, 1972, Joseph and Leevers, 1985, Bowman, 1990, and Marshall, Brogden, and Shepherd, 1998). Jeffery et al. has a summary of the results of these researchers (Jeffery, Moser, and Folkman, 2003). The current AWWA C900 manual in Appendix B has guidelines for predicting PVC fatigue failure based on work done by Jeffery, Moser, and Folkman (2003). This work utilized Vinson’s data along with fatigue test results of their own. Vinson’s data was selected because the PVC material tested represented that manufactured in the USA whereas the other investigation used
Figure 4. S-N curves for 6061-T6 aluminum (from: MIL-HDBK-5J, 31 Jan. 2003).
time
stre
ss
σmin
σmax
100
1000
10000
103 104 105 106 107
Number of Cycles to Failure
Peak
Str
ess
(psi
)
Peak
Str
ess
(MPa
)
0.689
6.89
68.9
Figure 5. Illustration of Vinson’s data and equation (Vinson, 1975).

– 6 –
PVC from the UK and Europe with different stabilizers. Furthermore, some studies mentioned above utilized high pressure cycling rates. ASTM F1674 recommends a maximum rate of 10 cycles/minute. It is believed that higher cycling rates prevent creep strains from occurring which could affect the number of cycles to failure. Jeffery, Moser, and Folkman’s correlation of cycles to failure versus mean stress and stress amplitude is illustrated in Figure 6 and by Equation 4.
( )( )( )
153620.01637 log 0.1697 1782
logamp mean NN
σ σ= ⋅ − + − (4)
where: N = number of cycles to failure, σamp = stress amplitude, psi, and σmean = mean stress, in psi units. As one can see from Figure 6, the effect of mean stress is much smaller than stress amplitude. That is, fatigue failure is primarily driven by stress amplitude as mentioned by other researchers. It is important to note that the smallest stress amplitude data point used in the correlation is 400 psi (2.76 MPa).
Equation 4 is equivalent to a high order polynomial fits to failure data with a regression technique. Regression fits of higher order polynomials can yield good results over the range of the interpolated data. However, these fits tend to diverge to ±∞ if one applies them outside the range of the fit data (extrapolation). Again, the lowest stress amplitude test value included in Eq. 4 is 400 psi so if one applies Eq. 4 with stress amplitudes smaller than 400 psi, one is outside the domain of the fit. Figure 7 plots the number of cycles to failure predicted by Eq. 4 versus stress amplitude for a mean stress values of 425 psi (4.5 MPa) and 1700 psi (11.7 MPa) which represent a typical range of mean stress values. Also shown in Figure 7 are the failure data points upon which Eq. 4 is based. Some important observations are;
Figure 6. Fatigue criteria from Jeffery (Jeffery, et al., 2003).
107 Number of Cycles
Mea
n St
ress
(psi
)
Stress Amplitude – psi (MPa)
0
500
1000
1500
2000
2500
3000
103 104 105 106 108 109
3000
(20.
7)
2000
(13.
8)
1500
(10.
3)
1000
(6.8
9)
700
(4.8
3)
500
(3.4
5)
300
(2.0
7)
200
(1.3
8)
150
(1.0
3)
100
(0.6
9)
50 (0
.34)
20
(0.1
4)
Positive/Negative
2000 psi Limit
Vinson USU
Design Space M
ean
Stre
ss (M
Pa)
3.45
0
10.3
13.8
17.2
20.7

– 7 –
a) the failure data points have a close to linear relationship when plotted with log/log axes, b) the effect of mean stress is small, and c) below a stress amplitude of 400 psi the curves diverge rapidly downward.
The maximum number of cycles to failure from Eq. 4 is limited to about 400 million cycles, as shown by the diverging curves in Figure 7, regardless of how small the stress amplitude is. However, the downward trending curves are an artifact of the curve fitting procedure and does not represent actual behavior.
Whittle and Teo (Whittle, 2005) completed rotating beam fatigue tests of notched uPVC and mPVC (modified-PVC, sometimes used in Europe) samples and were able to show reasonable correlation with the pressure cycling tests reported by Joseph and Leevers (Joseph, 1985). Rotating beam tests can be completed in much shorter time because cyclic loading is rapidly applied. They were also able to demonstrate a stress threshold below which fatigue failures were no longer observed. Whittle reported this stress range threshold to be 5 MPa (725 psi) (or a stress amplitude of 2.5 MPa (362 psi)). Certain materials (e.g. mild steel) have an infinite life stress limit or endurance limit. That is, below a certain stress amplitude level, load cycles will never produce a fatigue failure. Verification of this endurance limit in PVC has not be confirmed using pressure cycling tests of pipe. Testing at this low stress level would require over 108 cycles and the cost and time involved is high. To apply 108 pressure cycles to a test specimen at a maximum rate of 10 cycles per minute would require 19 years to complete. As mentioned above, PVC fatigue failures are often observed to start at small flaws in the material (also see Burn, et al., 2006). These rotating beam tests have high stresses only over a very small region of the specimen. In a pipe pressure cycling test, the entire length of the test specimen is subjected to the cyclic loads and there is a higher probability of flaw being present. Additionally, the stress cycling rate in a rotating beam test is very rapid (far in excess of that specified in ASTM F1674) and creep strains could not occur. Thus, although Whittle and Teo’s results are significant, they
Figure 7. Stress amplitude vs. cycles to failure from Eq. 4 with two mean stress values. The downward slope on the right side is an artifact of the equation, not representative of
the pipe behavior.

– 8 –
have not been confirmed by other researchers. For the sake of conservatism, this paper will ignore the potential existence of an endurance limit in PVC.
REVISED FATIGUE FAILURE CORRELATION A new relationship was obtained to replace Eq. 4 that would meet two objectives; a simple explicit equation to estimate the number of cycles to failure and provide a more reasonable result for low amplitude stresses. To simplify the procedure, the effect of mean stress was ignored. Pressure cycling test results (stress amplitude and number of cycles to failure) from Vinson (Vinson, 1981) and Jeffery (Jeffery et al., 2003) were used along with several additional data points recently obtained at Utah State University as the basis for the correlation. As previously discussed, additional PVC fatigue data is available but it is for pipe manufactured outside North America with different stabilizer formulation and in some cases, cycled more rapidly than outlined in ASTM F1674. A linear fit to the data in log/log coordinates was computed resulting in Equation 5:
4.196 log ( ) 17.7610 ampN σ− += (5)
where: N = number of cycles, and σamp = stress amplitude in psi. For stress amplitude in MPa units, replace 17.76 with 8.695. As shown in Figure 8, the stress amplitude basis for this correlation ranges from 410 to 2474 psi (2.83 to 17.1 MPa). When stress amplitudes fall within this range, using Eq. 5 is effectively an interpolation of the data. When stress amplitudes are less than 400 psi (2.76 MPa), use of Eq. 5 amounts to an extrapolation process. For low stress amplitudes, using Eq. 5 is analogous to the stress regression calculations to obtain the Long-Term Hydrostatic Strength of plastic pipes. The available data does tend to have a linear variation in log/log axes and it is reasonable to assume that this linear relationship would continue for smaller amplitudes.
Figure 9 illustrates the results computed from Equations 4 and 5 along with the test data. Figure 9 has orange, green, and blue curves showing the results from Eq. 4 for mean stress values of
Figure 8. New correlation of stress amplitudes to number of cycles.

– 9 –
425, 1000, and 1700 psi, respectively. The results for Eq. 5 are plotted with a black dashed line. For stress amplitudes above 400 psi, the results are very similar with Eq. 5 tending to be more conservative (predicting a smaller number of cycles to failure). For example, consider a stress amplitude of 800 psi and a mean stress of 1000 psi. The number of cycles to failure predicted by equations 4 and 5 are 6.04E5 and 3.79E5 cycles, respectively or a 37% difference. Each of the three mean stress curves terminate at a stress amplitude equal to the mean stress. Higher stress amplitudes would require negative pressures occurring in the pipe which is undesirable. At stress amplitudes less than 400 psi, the linear behavior of Eq. 5 gives a reasonable estimate to the expected behavior for small stress amplitudes.
DAMAGE MODEL OF MULTIPLE STRESS AMPLITUDES The above mentioned testing was accomplished by applying a single constant stress amplitude during the pressure cycling tests. A pressurized pipe system can be subjected to a variety of pressure amplitudes and stresses for various reasons including multiple pump or valve operations. Figure 1 serves as an example. To account for a variety of stress amplitudes acting over time, a damage accumulation model can be utilized to combine damage estimates from each surge amplitude. Several damage accumulation models are available but a simple popular model is the Palmgren-Miner model (Miner, 1945). It is frequently used because other more complex theories often do not provide significant improvement in prediction reliability as noted by Budynas and Nisbett (Budynas, 2015). The model is expressed as:
i
i
nDN
=∑ (6)
where D = fraction of fatigue life consumed, ni = number of cycles of a particular stress range i during a one-year period, Ni = number of cycles to failure at stress range i. At failure set D = 1.
Figure 9. Comparison of results from Equations 6 and 7.

– 10 –
A forced sewer main is an application where pressure cycles are very regular and can have larger amplitudes and a large number of cycles, and thus, is a special concern for fatigue failure. As an example, assume that the pressure-time history in Figure 10 represents the surge events during the startup of a forced main pump. It is assumed the equilibrium operating pressures are 35 psi with the pump off and 80 psi when the pump is running. Figure 10 has pressure range values approximating the events; a boost in the operating pressure from 35 to 90 psi followed by two cycles each occurring at 20, 16, and 10 psi pressure range values. It is further assumed that a similar behavior occurs at pump shutdown with the same pressure range values. If we assume the system cycles every 20 minutes, there would be 72 pump starts and 72 pump stops for a total of 144 per day. For conservatism, it is assumed that two very high intermittent surges (80-psi) occur each day. The above surges are pressure range values and consistent with Figure 2, the pressure amplitudes are half of the pressure range values. Table 1 summarizes the damage calculation procedure.
Table 1. Example Calculations for a Force Main DR 25 Pipe
Pressure Range (psi)
Pressure Amplitude
(psi)
Stress Amplitude, Eq. 1 (psi)
Number of Cycles to Failure, Eq. 5 (Ni)
Cycles per Day
Cycles per year
(ni)
% of Life Consumed per Year
(ni/Ni) 80 40 480 3.23E+06 2 730 0.00022585 55 27.5 330 1.56E+07 144 52560 0.00337551 20 10 120 1.09E+09 288 105120 0.00009681 16 8 96 2.77E+09 288 105120 0.00003796 10 5 60 1.99E+10 288 105120 0.00000528
Sum = 0.00374141 Life = 267.3
Given the pressure amplitude values in Table 1, the corresponding stress amplitude values are computed using Eq. 1. The stress amplitude values in Table 1 are for a DR 25 pipe. The fourth column from the left in Table 1 is the number of cycles to failure computed using Eq. 5 at the corresponding stress amplitude. The fifth column is the number of cycles per day at the corresponding stress amplitude. To obtain the number cycles per year in the second to last column we multiply the cycles per day by 365 days per year. The last column (% of Life
Figure 10. Example force main time history.
55 20 16 10

– 11 –
Consumed per Year), represents the fraction of life consumed per year for the corresponding pressure amplitude or the ni/Ni term in the summation of Eq. 6. In the second to last row in Table 1 we complete the summation in Eq. 6 which gives the total fraction of life consumed each year. The expected life of the pipe (last row of Table 1) is the reciprocal of the life consumed per year (“Sum =” value). Thus, the above example has an expected life of 267.3 years. Examination of the last column in Table illustrates how as stress amplitude decreases, damage rapidly decreases. Thus, neglecting very small stress amplitudes is acceptable. In the above example we count the initial surge at pump turn on and turn off as separate cycles even though they are only one cycle by definition. Counting them as a single cycle (or 72 cycles per day rather than 144) would produce an expected life of 487 years. This approach could be justified, but the more conservative approach is recommended. As shown in Fig. 8, there is considerable scatter in the test data. This is very typical of “S-N” diagrams for all materials. Equations 4 and 5 are both mean fits to the test data. That is, measured number of cycles to failure lie on either side of the curve. Thus, when using either Eq. 4 or 5, one should also incorporate some kind of safety factor. Applying a safety factor to the stress amplitude is not recommended because the non-linear relationship between stress amplitude and the number of cycles to failure. It is recommended that an appropriate safety factor be applied to the number of cycles to failure estimated by Eq. 4 or 5. Design of pipeline systems should be based on an expected life. In the example outlined in Table 1, an expected life of 267.3 years is predicted. Using a safety factor of 2.0 on the expected life, one would end up with an expected life of approximately 134 years. The safety factor to apply is up to the user, but a value of 2.0 is typically used. A common water main or sewer life expectancy is 100 years and the example in Table 1 with a safety factor of 2.0 would meet that design life. CONCLUSION Researchers try to develop equations that provide the most accurate results. A consideration that is sometimes lost is that an elaborate theory can be too cumbersome for a design engineer to apply on a routine basis. It is imperative that design engineers have confidence that the design process they use is reliable and widely accepted. It is well known that fracture mechanics is the most accurate method of analyzing fatigue failure problems. But a typical design engineer would lack the training and specialized software to complete a fracture mechanics analysis. With PVC pipe, a statistical distribution of flaw sizes is also needed which does not have wide acceptance. Thus, for the design engineer “working in the trenches”, a simple stress-life approach for fatigue calculations is more appropriate. Additionally, the calculation approach in the AWWA C900-16 standard is accurate over the stress amplitude range used to develop it. Nevertheless, the relationship in AWWA C900-16 is cumbersome to use. Equation 5 is a simplified approach to compute the number of cycles to failure of a given stress amplitude. Equation 5 neglected the effects of mean stress but the results show that in most cases it is slightly more conservative that the current standard embodied in Eq. 4. It is an approach that is simple and gives reasonable results. Additionally, Eq. 4 provides inaccurate results for stress amplitudes below 400 psi. The S-N diagrams for PVC show a linear relationship in log/log coordinates and using Eq. 5 at stress amplitudes less than 400 psi will give reasonable estimates of the number of cycles to failure.

– 12 –
This paper makes an effort to build on previously established relationships for predicting fatigue failure and put them in a form that would be easily completed in a spreadsheet. The damage of a combination of pressure amplitudes can be computed using Eq. 6 and procedures are outlined in Table 1 to translate the results into an expected life for a given situation. A key input to these calculations is having a reasonable estimate of what the magnitudes of the surge or fluctuating pressures might be along with the number of cycles per day. This input can change with each application. Successful application of this approach will come from monitoring existing systems that are similar to new systems and using that data for guidance. REFERENCES Bowman, J. (1990). The Fatigue Response of Polyvinyl Chloride and Polyethylene Pipe
Systems. Buried Plastic Pipe Technology. American Society for Testing and Materials ASTM STP 1093, ed. G. Buczala and M. Cassady, Philadelphia, PA.
Budynas, R. G., Nisbett, J., K. (2015). “Shigley’s Mechanical Engineering Design,” 10 Ed., McGraw-Hill, New York, 2015, pp. 226-349.
Burn, S., et al. (2006). “Long-term Performance Prediction for PVC Pipes,” AWWARF Report 91092F, May 2006.
Folkman, S. L., Rice, J., Sorenson, A., and Braithwaite, N. (2012). “Survey of Water Main Failures in the United States and Canada,” AWWA Journal, American Water Works Association, Oct. 2012, vol. 104, no. 10, pp. 70-79.
Folkman, S. L. and Bishop, R. (2016). “A Simple Design Procedure for PVC Pipe to Account for Cyclic Pressure Loading,” Proceedings of the 18th Plastic Pipes Conference PPXVIII, Berlin, Germany, Sep. 13, 2016.
Folkman, S. L. (2018). “Water Main Break Rates in the USA and Canada: A Comprehensive Study,” Utah State University Research Report for Uni-Bell PVC Pipe Association, available from: https://digitalcommons.usu.edu/mae_facpub/174/, March 1, 2018.
Hucks, R. (1972). Design of PVC Water-Distribution Pipe. Civil Engineering ASCE 42, no. 6, pp. 70-73.
Jeffrey, J. D., Moser, A. P., and Folkman, S. L. (2003). “New Design Guidelines for Fatigue Failure in PVC Pipe,” American Water Works Association Annual Meeting, Anaheim, California, June 18, 2003.
Joseph, S. H. (1984). “Fatigue failure and service lifetimes in UPVC pressure pipes,” Plastics and Rubber Processing and Applications, 4, pp. 325-330.
Joseph, S. H. and Leevers, P. S. (1985). “Failure mechanics of uPVC cyclically pressurized water pipelines,” Journal of Materials Science, vol. 20, pp. 237-245.
Marshall, G. Brogden, S.; and Shepherd, M. (1998). Evaluation of the Surge and Fatigue Resistance of PVC and PE Pipeline Materials for use in the U.K. Water Industry’s Trade Association, Water Industry Information and Guidance Note. London, UK.
Miner, M. A. (1945). “Cumulative Damage in Fatigue,” Journal Applied Mechanics, vol. 12, Transactions of ASME, vol. 67, pp. A159-A164.
Vinson, H. (1981). Response of PVC Pipe to Large, Repetitive Pressure Surges. Proceedings of the International Conference on Underground Plastic Pipe, American Society of Civil Engineers, New Orleans, 30 March – 1 April 1981, New York, pp. 485-494.
Whittle, A. J. and Teo, A. (2005). “Resistance of PVC-U and PVC-M to cyclic fatigue,” Plastics, Rubber and Composites, vol. 34, no. 1, Feb. 2005, pp. 40-46.