PUTTING FIRST - Minerals Council South Africa
18
PUTTING SOUTH AFRICA FIRST Telephone: +27 11 498 7100 Email: [email protected] 5 Hollard Street, Johannesburg, 2001 PO Box 61809, Marshalltown, 2107 www.chamberofmines.org.za www.facebook.com/Mine @Mine_RSA #Coal #SustainableFuture #MiningCharter #RegulatoryCertainty #PLATINUM #MANGANESE #MiningMatters #IfitsnotGrownitsMined #IfitsnotGrownitsMined #SafetyFirst #TomorrowsMine #TomorrowsMine #IllegalMining #IllegalMining #Diamonds #IllegalMining #MiningCharter #Diamonds #IllegalMining #MiningCharter #IfitsnotGrownitsMined #FeesMustFall #MiningMatters #BeBoldForChange #IllegalMining MINE SA 2017 FACTS AND FIGURES POCKETBOOK 464,667 direct jobs R126 billion annual employee earnings Approximately 4.5 million dependants supported
Transcript of PUTTING FIRST - Minerals Council South Africa

PUTTINGSOUTH AFRICA
FIRSTPUTTINGSOUTH AFRICA
FIRSTPUTTINGSOUTH AFRICA
FIRST
Telephone: +27 11 498 7100Email: [email protected]
5 Hollard Street, Johannesburg, 2001PO Box 61809, Marshalltown, 2107
www.chamberofmines.org.za
www.facebook.com/Mine
@Mine_RSA
#Coal
#Sus
tain
able
Futu
re#M
inin
gC
hart
er#R
egul
ato
ryC
erta
inty
#PLATINUM
#MANGANESE
#Min
ing
Mat
ters
#Ifit
snot
Grow
nits
Min
ed
#Ifit
snot
Grow
nits
Min
ed
#Saf
etyF
irst
#Tom
orro
wsM
ine
#Tom
orro
wsM
ine
#Ille
galM
inin
g
#Ille
galM
inin
g
#Dia
mon
ds
#Ille
galM
inin
g
#Min
ingC
hart
er
#Dia
mon
ds
#Ille
galM
inin
g
#Min
ingC
hart
er
#IfitsnotGrownitsMined
#FeesMustFall #MiningMatters#BeB
oldF
orCh
ange
#Ille
galM
inin
g
MINE SA 2017FACTS AND FIGURES POCKETBOOK
464,667 direct jobs
R126 billionannual employee
earnings
Approximately
4.5 milliondependantssupported

PAGE b PAGE 1
Mining plays a significant role in the economy of our nation.
It is therefore important for data on our
industry to be freely available so that
stakeholders are able to understand how our
industry is performing. Chamber of Mines
chief economist, Henk Langenhoven, and
his team have compiled this document to
showcase our industry using this data, and
provide some insight into what the numbers
mean for our country and the future of our
mining industry.
A ‘Facts and Figures 2016’ publication was
published in June 2017 as an updated version
of the ‘Mine SA 2016’ pocketbook and a
more comprehensive statistical reference
guide to the South African mining sector.
These are both available on the Chamber
website http://www.chamberofmines.org.za/.
This ‘Mine SA 2017’ pocketbook is an update of the 2016 publication.
FOREWORD
REPRESENT ABOUT 90% OF SOUTHAFRICA’S MINERAL PRODUCTION
EMPLOY 464,667 PEOPLE
CONTRIBUTE R16.0bn IN TAXES TO SOUTH AFRICA
CONTRIBUTE R126.0bn IN EMPLOYEE EARNINGS
The Chamber’s vision is to reposition the mining industry as South Africa’s foremost industrial sector.
The Chamber is a respected body of members who together:
IMAGE
Mine head gear at Sibanye Stillwater’s Driefontein mine
IMAGE
Employees at an AngloGold Ashanti mine
Estimates based on latest statistics available

PAGE 3PAGE 2
The Chamber serves its members and promotes their interests by providing
strategic support and advisory input.
A key role of the organisation is to facilitate interaction among mining employers
to examine policy issues and other matters of mutual concern to crystallise
and define desirable industry standpoints. Consultation and collaboration are
voluntary and never encroach on the autonomy of members.
The Chamber also acts as a principal advocate for mining in South Africa to
government, communicating major policies endorsed by its members. A further
vital function of the organisation is to represent some sectors in collective
bargaining with organised labour.
Chamber members subscribe and adhere to a Membership Compact, a
mandatory code of ethical business conduct.
We must overcome many challenges but, every day in South Africa, as we mine to new depths, we strive to reach new heights. Mining shapes the world around us, from the bridges we cross, to the way we communicate, from the air we breathe and the roads that connect us, to the innovations of tomorrow. If it’s not grown, it’s mined...
Roger Baxter, Chief Executive Officer
Chamber of Mines
February 2018
MESSAGE FROM THE The Chamber of Mines of South Africa is a mining industry employers’ organisation that supports and promotes the South African mining industry.CEO
Roger BaxterChief Executive Officer

PAGE 4 PAGE 5
CONTENTS
History snapshot 6
Our metals and minerals 8
GOLD 10
PLATINUM 12
DIAMONDS 14
COAL 16
CHROME, IRON ORE AND MANGANESE 18
Mining in our lives 20
Safety and health 26
Our people 28
Women in mining 29
Mining transformation 30
Mining community development 32
Modernisation 34
Illegal mining 36
Chamber facts and figures IBC
www.chamberofmines.org.za
REGISTERED OFFICE5 Hollard Street, Johannesburg, 2001
BUSINESS ADDRESSPO Box 61809, Marshalltown, 2107
Telephone: +27 11 498 7100Email: [email protected]
Gold
OUR MINERALS
PlatinumDiamonds
Coal
Chrome, iron ore, manganese, and other metals and minerals
IMAGE
Gold product at the Rand Refinery
PAGE 7PAGE 6
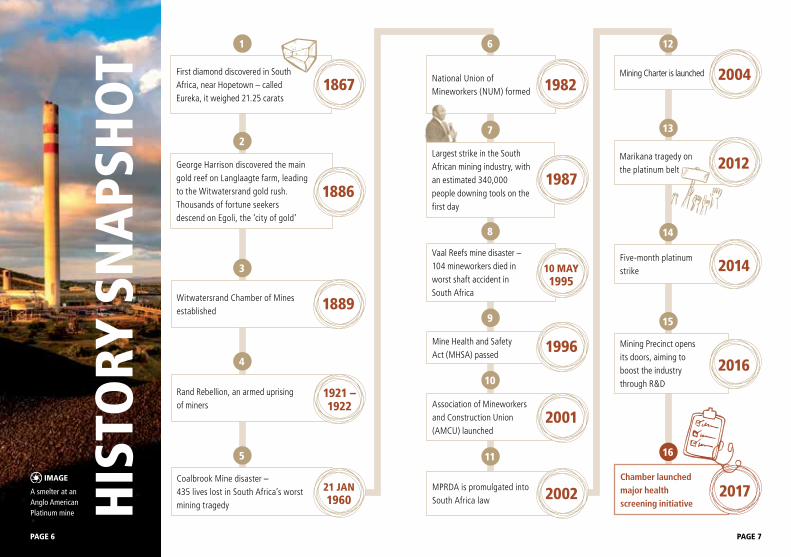
First diamond discovered in South Africa, near Hopetown – called Eureka, it weighed 21.25 carats
Largest strike in the South African mining industry, with an estimated 340,000 people downing tools on the first day
1867
1987George Harrison discovered the main gold reef on Langlaagte farm, leading to the Witwatersrand gold rush. Thousands of fortune seekers descend on Egoli, the ‘city of gold’
Vaal Reefs mine disaster – 104 mineworkers died in worst shaft accident in South Africa
1886
Witwatersrand Chamber of Mines established
Association of Mineworkers and Construction Union (AMCU) launched
Mine Health and Safety Act (MHSA) passed
Rand Rebellion, an armed uprising of miners
MPRDA is promulgated into South Africa law
Coalbrook Mine disaster – 435 lives lost in South Africa’s worst mining tragedy
Mining Charter is launchedNational Union of Mineworkers (NUM) formed
Marikana tragedy on the platinum belt
Five-month platinum strike
Mining Precinct opens its doors, aiming to boost the industry through R&D
Chamber launched major health screening initiative
1889
2001
1996
1921 – 1922
21 JAN1960
1982
2012
2014
2016
2017
10 MAY1995
2002
2004
HIS
TORY
SN
APS
HO
T2
7 13
3
8 14
15
4
10
9
165 11
1 6 12
IMAGE
A smelter at an Anglo American Platinum mine

PAGE 8
In 2017*
• Direct contribution of mining to GDP:
R312 billion
• Mining GDP growth rate: 3.7%
• Mining contribution as % of total
GDP: 6.8%
• Direct contribution of mining to fixed
investment: R93.4 billion
• Total primary mineral sales: R424 billion
• Royalties paid: R5.8 billion
• Taxes paid: R16 billion
* Estimates based on latest statistics available
PAGE 9
The mining industry is an important component of the South African economy, and has been for over 100 years. In 2017, our projected estimates indicate that the industry constituted 6.8% of the economy, marginally down from the 7% of overall gross domestic product (GDP) recorded a year earlier1. In real terms, the industry is estimated to have expanded by 3.7% in 2017, contributing R312 billion to GDP1.
Although the industry has lost almost 30,000 jobs since 2014, employment is estimated to have increased by 1.6% to 464,667 during 20172, which can be attributed partially to the growth experienced in the industry. Among the major commodities, estimates point to the gold sector having shed about 4,000 jobs between 2016 and 2017; while sectors such as platinum group metals (PGMs), iron ore, diamonds, chrome and manganese employed more people between 2016 and 20172. Mining employment represents 6.1% of private non-agricultural employment and 4.8% of total non-agricultural employment3.
The industry contributed R93 billion to fixed investment in 20174, which constituted 18.2% of private sector fixed investment and 10.8% of the country’s total fixed investment bill for the year. In the decade between 2007 and 2017 a downward trajectory is evident in the industry’s fixed investment activity, which should be a cause for concern, particularly regarding the industry’s prospects. Policy uncertainty is at the top of investors’ concerns. There is optimism, however, that this might change after the recent election of a new head of the ruling party, and a noticeable intent to deal with corruption and state capture, to improve the governance of state-owned enterprises, and to increase regulatory certainty in the mining sector.
In 2017, the industry exported R307 billion worth of produce2, 27% of the country’s R1.1 trillion export book5. The 10% strengthening of the rand against the US dollar in 2017 would have adversely affected the rand receipts of exports, which increased by 4.1%; however, on a US dollar equivalent basis, exports increased by 16.1%.
In the 2016/2017 fiscal year the industry paid R5.8 billion in royalties, representing a 56% increase on the prior year6. The industry paid R16 billion in taxes for the same period7.
OUR METALS AND MINERALS MINING CONTRIBUTION SUMMARY:
IMAGE
An employee at an Anglo American coal mine
1 Statistics South Africa (P0441); Chamber of Mines calculation
2 Department of Mineral Resources (DMR); Chamber of Mines calculation
3 DMR; Statistics South Africa; Chamber of Mines calculation
4 South African Reserve Bank; Chamber of Mines calculation
5 South African Revenue Service Customs
6 South African Revenue Services (Mineral and Petroleum Resources Royalty payments by commodity – 2016/2017)
7 South African Revenue Services (Companies provisional tax payments – 2016/2017)

PAGE 11PAGE 10
GO
LD The Witwatersrand (Wits) Basin is one of the world’s
largest gold deposits – an elliptical basin that stretches
over an arc of 400 kilometres through the Free State,
North West and Gauteng provinces.
After 120 years of operations, gold mining has reached
depths of up to 4,000 metres, making these among
the deepest mines in the world. At this depth, rock
temperatures reach about 50°C and vertical rock
pressures around 100MPa.
The discovery of gold in South Africa in the late
19th century led to the development of the city of
Johannesburg, Egoli (city of gold). For many years,
South Africa was the world’s primary gold producer
with peak production of 1,000 tonnes in 1970.
Gold remains one of the world’s most coveted metals,
revered for its beauty and symbolism, and held as
a store of value. This versatile metal is malleable,
conductive and does not tarnish, making it ideal for
use in jewellery and many industrial applications.
OUR METALS AND MINERALS
0
50
100
150
200
250
300
0
30,000
60,000
90,000
120,000
150,000
180,000
2007
Gold production (metric tonnes)
Gol
d pr
oduc
tion
(met
ric to
nnes
)
Gold production and industry employment (2007 – 2017)
Number of employees
Num
ber o
f em
ploy
ees
2008 2009 2010 2011 2012 201712013 2014 2015 2016
In 20171
Direct employees Gold produced
112,200 people 138t
Employee earnings Total sales
R29.9bn R67.6bn
Royalties paid Percentage of metals exported
R0.9bn 73%
Source: DMR, Chamber of Mines1 Estimates based on latest statistics available
South Africa was the world’s primary gold producer with peak production of 1,000 tonnes in 1970
IMAGE
Gold at the Rand Refinery

PAGE 13PAGE 12
0
50
100
150
200
250
300
350
0
30,000
60,000
90,000
120,000
150,000
180,000
210,000
Platinum production (metric tonnes) Number of employees
20082007 2009 2010 2011 2012 2013 2014 2015 2016 20171
Platinum production and industry employment (2007 – 2017)
Plat
inum
pro
duct
ion
(met
ric to
nnes
)
Num
ber o
f em
ploy
ees
PLAT
INU
M The Bushveld Igneous Complex, formed some 2 billion
years ago, is the world’s largest layered intrusion,
created when vast quantities of molten rock from the
earth’s mantle were brought to the surface through
long vertical cracks.
In South Africa, the discovery of the first platinum
nuggets dates back to 1924. Geologist Hans
Merensky’s follow-up work resulted in the discovery
of the Bushveld Igneous Complex. This complex hosts
more than half the world’s PGMs and associated
minerals, such as nickel, chromium, vanadium and
refractory minerals. South Africa is host to around 80%
of the world’s known platinum reserves.
PGMs consist of six noble metals, all silvery-white in
appearance – platinum, palladium, rhodium, ruthenium,
osmium and iridium. Platinum, palladium and rhodium
are the primary metals of significant economic value.
They are used largely for jewellery and in the automotive
industry for their excellent catalytic properties. Other
uses include investment (coins and bars), fuel cells, and
many other industrial purposes.
OUR METALS AND MINERALS
South Africa is host to around 80% of the world’s known platinum reserves
In 20171
Direct employees Platinum produced
175,770 people 253t
Employee earnings Total sales
R48.0bn R94.1bn
Royalties paid Percentage of metals exported
R0.8bn 87%
IMAGE
Platinum bars at Anglo American Platinum
Source: DMR, Chamber of Mines1 Estimates based on latest statistics available

PAGE 15PAGE 14
Diamond production (million carats) Number of employees
Diamond production and industry employment (2007 – 2017)
0
2
4
6
8
10
12
14
16
18
0
3,000
6,000
9,000
12,000
15,000
18,000
21,000
24,000
27,000
20082007 2009 2010 2011 2012 2013 2014 2015 2016 20171
Diam
ond
prod
uctio
n (m
illio
n ca
rats
)
Num
ber o
f em
ploy
eesDIA
MO
ND
SDiamonds, arguably the ultimate luxury mineral,
comprise an intricate lattice of carbon atoms, a
crystalline structure that makes them harder than any
other form in nature. This characteristic makes diamonds
not only popular in jewellery, but also desirable in high-
tech cutting, grinding and polishing tools.
Diamond mining has taken place in South Africa for
over a century, and is largely responsible for putting
the African sub-continent ‘on the map’ as a minerals-
rich region.
Natural diamonds were formed some 3.3 billion
years ago in conditions of intense heat and pressure
150 kilometres below the earth’s surface. The primary
sources of all of South Africa’s diamonds are kimberlites
in ancient, vertically-dipping volcanic pipes, mostly in the
vicinity of the city of Kimberley, and initially amenable to
opencast mining. Early in the 20th century, the Premier
mine’s volcanic pipe was discovered near Pretoria with
a number of further kimberlite pipes discovered in
the Northern Cape and Limpopo since then. Alluvial
diamonds and small diamondiferous fissures have been
known and worked for many years along the southern
banks of the Orange River, as well as along and offshore
of South Africa’s west coast.
OUR METALS AND MINERALS
Diamond mining has taken place in South Africa for over a century
IMAGE
Diamonds at Petra Diamonds
In 20171
Direct employees Diamonds produced
18,227 people
9.9m carats
Employee earnings Total sales
R5.2bn R16.4bn
Royalties paid Percentage of minerals exported
R0.3bn 55%
Source: DMR, Chamber of Mines1 Estimates based on latest statistics available
PAGE 17PAGE 16
COA
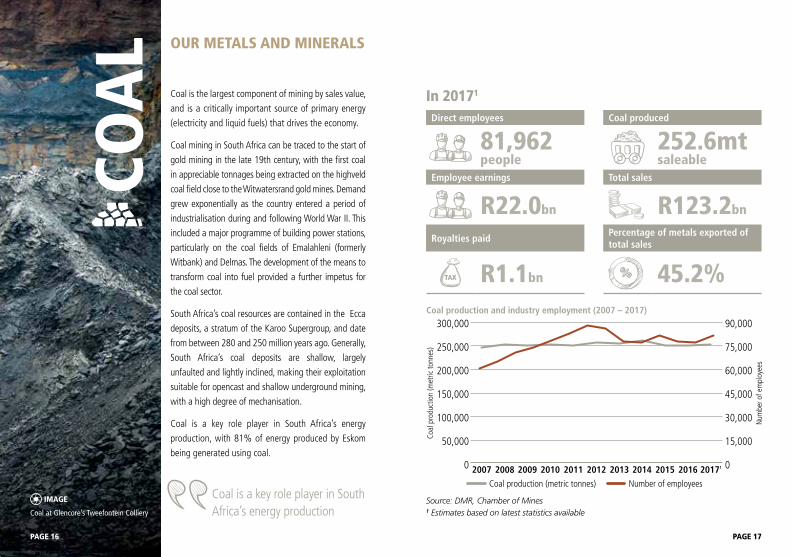
LCoal is the largest component of mining by sales value,
and is a critically important source of primary energy
(electricity and liquid fuels) that drives the economy.
Coal mining in South Africa can be traced to the start of
gold mining in the late 19th century, with the first coal
in appreciable tonnages being extracted on the highveld
coal field close to the Witwatersrand gold mines. Demand
grew exponentially as the country entered a period of
industrialisation during and following World War II. This
included a major programme of building power stations,
particularly on the coal fields of Emalahleni (formerly
Witbank) and Delmas. The development of the means to
transform coal into fuel provided a further impetus for
the coal sector.
South Africa’s coal resources are contained in the Ecca
deposits, a stratum of the Karoo Supergroup, and date
from between 280 and 250 million years ago. Generally,
South Africa’s coal deposits are shallow, largely
unfaulted and lightly inclined, making their exploitation
suitable for opencast and shallow underground mining,
with a high degree of mechanisation.
Coal is a key role player in South Africa’s energy
production, with 81% of energy produced by Eskom
being generated using coal.
OUR METALS AND MINERALS
Coal is a key role player in South Africa’s energy production
Coal production (metric tonnes) Number of employees
Coal production and industry employment (2007 – 2017)
0
50,000
100,000
150,000
200,000
250,000
300,000
0
15,000
30,000
45,000
60,000
75,000
90,000
20082007 2009 2010 2011 2012 2013 2014 2015 2016 20171
Coal
pro
duct
ion
(met
ric to
nnes
)
Num
ber o
f em
ploy
ees
In 20171
Direct employees Coal produced
81,962 people
252.6mt saleable
Employee earnings Total sales
R22.0bn R123.2bn
Royalties paid Percentage of metals exported of total sales
R1.1bn 45.2%
IMAGE
Coal at Glencore’s Tweefontein Colliery
Source: DMR, Chamber of Mines1 Estimates based on latest statistics available
PAGE 19 PAGE 20PAGE 18
CHRO
ME,
IRO
N O
RE
AN
D M
AN
GA
NES
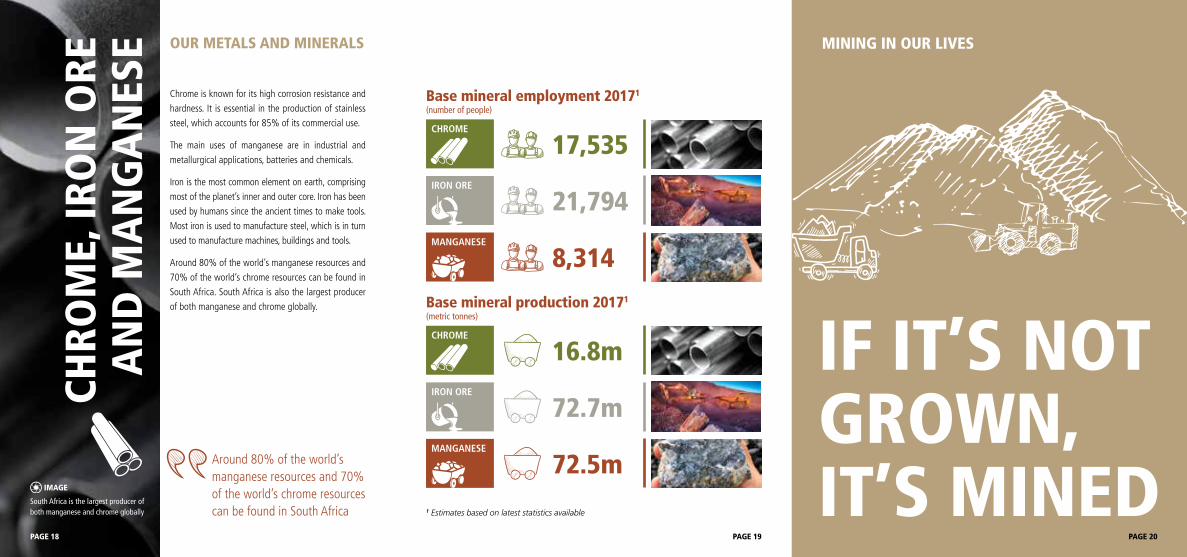
EChrome is known for its high corrosion resistance and
hardness. It is essential in the production of stainless
steel, which accounts for 85% of its commercial use.
The main uses of manganese are in industrial and
metallurgical applications, batteries and chemicals.
Iron is the most common element on earth, comprising
most of the planet’s inner and outer core. Iron has been
used by humans since the ancient times to make tools.
Most iron is used to manufacture steel, which is in turn
used to manufacture machines, buildings and tools.
Around 80% of the world’s manganese resources and
70% of the world’s chrome resources can be found in
South Africa. South Africa is also the largest producer
of both manganese and chrome globally.
OUR METALS AND MINERALS
Around 80% of the world’s manganese resources and 70% of the world’s chrome resources can be found in South Africa
Base mineral employment 20171
(number of people)
Base mineral production 20171
(metric tonnes)
CHROME
17,535IRON ORE
21,794MANGANESE
8,314
CHROME
16.8mIRON ORE
72.7mMANGANESE
72.5m1 Estimates based on latest statistics available
IF IT’S NOT GROWN, IT’S MINED
MINING IN OUR LIVES
IMAGE
South Africa is the largest producer of both manganese and chrome globally

PAGE 23 PAGE 24PAGE 21 PAGE 22
Silver, gold and titanium: space shuttles
Coal and gold: pharmaceuticals
Steel, copper and aluminium: Wind turbines
Steel: vehicle bodies
Steel and titanium: surgical implants
Aluminium: bike framesSteel:
street light bases
Steel and aluminium: metal furniture
Platinum: airbags
Platinum: catalytic converters
Platinum: cellphones
Coal: energy generation
Copper: door handles
Copper: air conditioners
Silver: LEDs
Platinum: making glass
Gold, platinum and diamonds: jewellery
Platinum: pacemakers
Silver: telescopes
Silver: mirrors
Platinum: solar panels
Steel, aluminium, aggregate and sand: bridges
Chrome, copper and magnesium: paint pigments
Platinum: fuel cells
Aluminium and magnesium: alloy wheels
Chrome: cans
Copper: water pipes
Platinum and gold: dentistry
Platinum and gold: watches
Platinum and gold: laptop and hard disc technology
Coal and gold: Jet fuel and aircraft engines

PAGE 27PAGE 26PAGE 25
Aggregate and sand,
chrome, coal, diamonds,
ferrous metals, gold,
iron, limestone and lime,
manganese, non-ferrous
metals, platinum group
metals, precious metals
and minerals
Safety performance in the mining industry was disappointing in 2017.
For the first time in a decade, the industry reported a regression in the number of fatalities. Tragically, 86* people lost their lives in mining-related accidents in 2017, compared with 73 lives lost in 2016.
This is particularly disappointing given the consistent improvement the industry has seen over the past two decades as a result of various tripartite health and safety initiatives adopted by the mining industry**.
This improvement in safety performance over the past two decades illustrates that achieving the industry’s ultimate goal of zero harm is possible if all stakeholders work together.
A particular concern during 2017 has been the number of accidents related to seismic activity and subsequent fall of ground incidents.
There has been a notable increase in the number of rockbursts, while the number of rockfalls, which is typically the main cause of falls of ground, decreased.
The industry has noted this development and has committed itself to understanding and addressing this issue. The Mining Industry Occupational Safety and Health Falls of Ground team has been established and is leading a task team which is developing leading practices on rockbursts in particular. The findings made by the task team will be shared across the industry.
South Africa’s Mine Health and Safety Act (MHSA), introduced in 2006, made provision for a tripartite approach to safety and health, requiring
industry, the unions and government to act in concert in promoting a safe and healthy workplace.
As required by the MHSA, individual companies and mines have agreements in place that regulate many aspects of safety and health in the workplace, and that provide joint planning, decision-making, training and auditing.
To accelerate the journey to zero harm, the Chamber established the MOSH Learning Hub in 2008 to identify and promote adoption of leading practices through a people-centred contribution.
In 2012, the Chamber established the CEO Zero Harm Forum (formerly called the CEO Elimination of Fatalities Team) to visibly lead by example, to drive health and safety initiatives and to share experiences to help address key challenges in a manner that will enable the industry to achieve the 2024 milestones and accelerate the industry’s journey to zero harm.
0
50
100
150
200
250
Num
ber o
f fat
aliti
es
2007 2008 2009 2010 2011 2012 2013 2014 2015 2016 20171
Mining industry fatalities (2007 – 2017)
SAFETY AND HEALTH
Source: DMR, Chamber of Mines 1 Estimates based on latest statistics available
* Based on available information. The final performance figures are still to be published by the DMR.
** Between 1993 and 2016, the number of fatalities declined by around 88% while fatalities as a result of fall of ground incidents declined by 92% over the same period. Other safety indicators improved at similar rates.

PAGE 29PAGE 28
OUR PEOPLE
The mining sector remains a significant employer in South Africa.
The mining industry employed 464,667 people in 2017 (457,698 people in 2016).
4.7% increase in total wages in 2017 (10.3% increase in 2016)
Mining contributes to various industries and has an extensive supply chain. Jobs
in mining translate to employment in other industries.
1.4m indirect jobs created by industry in 2017 (1.4m in 2016)
The industry not only provides jobs but believes it is important to encourage
and facilitate the development of its employees to ensure the sustainability of
the industry. South African mining companies invest in employee training and
development in many forms that include learnerships, bursaries, apprenticeships,
internships and adult education.
The future success of the mining industry relies on the continuous development
of technical innovation and the nurturing and retention of human capabilities.
In addition to the skills development levy (1% of annual payroll), the Charter
requires that the industry spend 5% of its annual payroll on human resources
development (HRD). In 2016, the mining industry spent 5.5% of its annual
payroll on HRD. The industry will continue to collaborate with key stakeholders
including the Mining Qualifications Authority to ensure that HRD expenditure is
aligned with the needs of the industry and the nation. This translates into HRD
expenditure in 2016 of R7.74 billion, in addition to the skills development levy
payment of R1.46 billion.
Artisans are a mainstay of the mining industry with an average of 2,000 artisans
qualifying in the mining industry each year.
Since the promulgation of the MPRDA in 2002 and the Mining Charter in 2004, the number of women in the industry has significantly increased.
Most mines meet or exceed the 10% women
in mining target and numerous industry
initiatives are underway to make a career in
mining more welcoming to female employees
and job seekers. Representation of women
in mining increased from around 11,400
women in 2002 to around 53,000 women in
2015, increasing to 53,179 in 2017. Women
represent 12% of the mining labour force.
No of women employees
% of women employees
Gold 13,374 12PGMs 19,340 11Diamond 2,494 14Coal 10,209 13Chrome 2,751 16Iron ore 2,384 14Manganese 1,247 16Cement, lime aggregates and sand 1,380 12
Current available DMR 2017 Q3 figures
TRAINING AND DEVELOPMENT OF WOMEN IN MINING
As the industry seeks to encourage the partici-
pation of women at all levels, special focus is
placed on their training and development.
WOMEN IN MINING
15% of top management
Women represent:
16% of senior management
22% of professionally qualified employees
18% of employees in the skilled and technical area
IMAGE
A woman in mining at Sibanye Stillwater

PAGE 31PAGE 30
The mining industry is committed to addressing legacies of the past and contributing meaning-fully to policies, practices and outcomes that reflect the true demographics of the country, and to creating an environment that will build a sustainable and prosperous mining industry.
Until the late 1980s, skilled jobs were denied to black
miners. It took 10 years for the proportion of skilled
positions held by black miners to approach 20%. Since
2004, the percentage of historically disadvantaged
South Africans (HDSAs) in skilled and management
positions has risen to between 40% and 75%
depending on the category.
The Chamber carried out a survey of mining industry
transformation and community development performance
among its members. There were 28 respondents and the
results are reflected in the following sections.
OWNERSHIP
In 2016, ownership of the industry by HDSAs was 39%,
significantly above the Charter target of 26%. This
assessment is based on the principle of recognition
of continuing consequences of previous transactions.
The Chamber has calculated that empowerment
transactions between 2000 and 2014 have been
valued at R205 billion and there has been a transfer of
value of some R159 billion to HDSA entities (including
black-owned companies, entrepreneurs, employee and
MINING TRANSFORMATION community trusts). This number continues to grow and in 2016 R2.2 billion flowed to HDSA
entities in dividends from the surveyed companies.
This has been achieved notwithstanding the international financial crisis of 2008, the consequences of which continue to afflict commodity markets. This has also negatively affected mining company shareholders, including participants in black economic empowerment (BEE) transactions.
PROCUREMENT
The proportion of procurement from HDSA entities continues to exceed targets in all three reporting categories:
• Capital goods: In 2016, companies reported 69% of expenditure on capital goods against the 2010 Charter target of 40%. In monetary terms, this translates into expenditure with HDSA companies for capital goods of R11.1 billion in 2016.
• Services: In 2016, 75% of expenditure on services was with HDSA suppliers, compared with the 2010 Charter target of 70%. In 2016, this amounted to expenditure of R61.0 billion.
• Consumables: In 2016, 68% of consumables was purchased from HDSA suppliers, at a cost of R40.7 billion. The 2010 Charter target was 50%.
49.3% of top management were HDSAs (50.4%
in 2014)
48.3% of senior management were HDSAs (41.9%
in 2014)
49.8% HDSAs made up 49.8% of middle management
(50.9% in 2014)
58% HDSAs made up 58% of junior management
(54% in 2014)
84.4% HDSAs filled 84.4% of core and critical skills
positions (75.5% in 2014)
EMPLOYMENT EQUITY
Mining companies continue to focus on workplace transformation with appreciable improvements being achieved in two of the four categories. The 2010 Charter specified a target of 40% HDSAs in all reporting categories by 2014. In 2016:
IMAGE
An employee at Anglo American Platinum’s Tumela mine

PAGE 32
MINING COMMUNITY DEVELOPMENT
Mining companies recognise that they need to earn and maintain their social licence to operate.
Companies understand that their role is not just one of neighbour to communities
where they operate but also as partners in and catalysts for sustainable socio-
economic development in those areas.
One of the most prominent features of the 2010 Charter relates to mining
community development and its regulation through social and labour plans
(SLPs). SLPs provide for strategic interventions which require the planning
(mostly with local authorities) and implementation of programmes that focus
on the promotion of socio-economic growth and sustainable development of
host communities and significant labour-sending areas.
The 2010 Charter did not set universal spending targets in respect of mining
community development; budgets were set though engagement with the DMR.
Outcomes should in any event be measured against impact. However, locally
and internationally, a target of 1% of net profit after tax (NPAT) is seen to be a
reasonable target for community development spend.
Of the 28 companies surveyed in the Chamber’s community development
performance survey, 25 spent more than 1% of NPAT. Their total spending
in 2016 amounted to R1.14 billion. The entire industry’s NPAT for the period
amounted to R34 billion, of which 1% is R339 million. Therefore, the
28 companies alone spent triple the total 1% of NPAT.
Notably, 16 of the 66 operations managed by the 28 companies reported
financial losses in 2016, yet they collectively contributed more than R180 million
to mining community development.
The Chamber of Mines believes that, while there remain a number of areas
which can be improved over time, the industry’s transformation performance is
satisfactory and demonstrates commitment to continuous improvement.
IMAGE
An employee at an AngloGold Ashanti mine
25 of 28 companies
spent more than 1% of NPAT on community
development
R1.14 billionwas spent in total
in 2016
R34 billionIndustry’s NPAT for the period, of which 1% is
R339 million
In the Chamber’s community development
performance survey:
PAGE 33
PAGE 34 PAGE 35
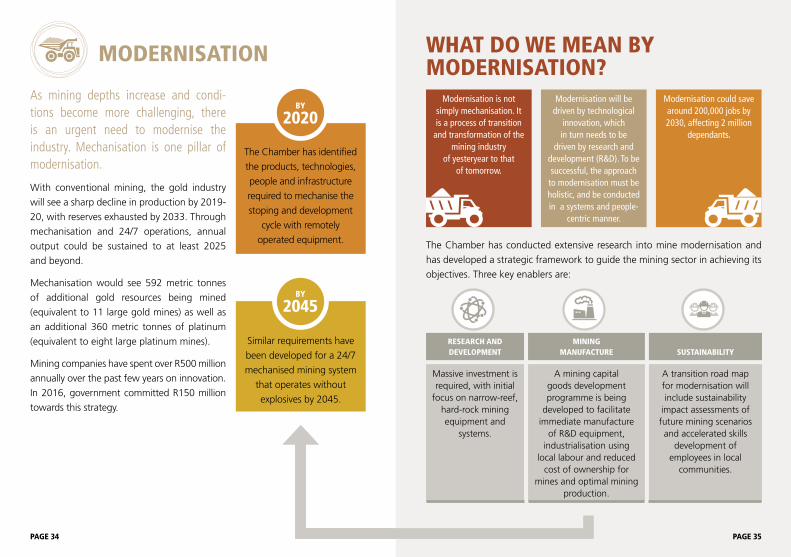
MODERNISATION WHAT DO WE MEAN BY MODERNISATION?
As mining depths increase and condi-tions become more challenging, there is an urgent need to modernise the industry. Mechanisation is one pillar of modernisation.
With conventional mining, the gold industry
will see a sharp decline in production by 2019-
20, with reserves exhausted by 2033. Through
mechanisation and 24/7 operations, annual
output could be sustained to at least 2025
and beyond.
Mechanisation would see 592 metric tonnes
of additional gold resources being mined
(equivalent to 11 large gold mines) as well as
an additional 360 metric tonnes of platinum
(equivalent to eight large platinum mines).
Mining companies have spent over R500 million
annually over the past few years on innovation.
In 2016, government committed R150 million
towards this strategy.
BY
2020
BY
2045
The Chamber has identified
the products, technologies,
people and infrastructure
required to mechanise the
stoping and development
cycle with remotely
operated equipment.
Similar requirements have
been developed for a 24/7
mechanised mining system
that operates without
explosives by 2045.
RESEARCH AND DEVELOPMENT
MINING MANUFACTURE SUSTAINABILITY
Massive investment is required, with initial
focus on narrow-reef, hard-rock mining equipment and
systems.
A mining capital goods development programme is being
developed to facilitate immediate manufacture
of R&D equipment, industrialisation using
local labour and reduced cost of ownership for
mines and optimal mining production.
A transition road map for modernisation will include sustainability
impact assessments of future mining scenarios and accelerated skills
development of employees in local
communities.
Modernisation is not simply mechanisation. It is a process of transition
and transformation of the mining industry
of yesteryear to that of tomorrow.
Modernisation will be driven by technological
innovation, which in turn needs to be
driven by research and development (R&D). To be successful, the approach
to modernisation must be holistic, and be conducted in a systems and people-
centric manner.
Modernisation could save around 200,000 jobs by 2030, affecting 2 million
dependants.
The Chamber has conducted extensive research into mine modernisation and
has developed a strategic framework to guide the mining sector in achieving its
objectives. Three key enablers are:

PAGE 36
1889 1897 – 1901
1889 – 18961887 1902 – 1952 1968 – TODAY
1953 – 1967
The Chamber of Mines
formalised
Chamber of Mines of the South African
Republic
Witwatersrand Chamber of Mines
Original Chamber of Mines conceived
Transvaal Chamber of Mines
Chamber of Mines of
South Africa
Transvaal and Orange Free State Chamber of Mines
A BRIEF HISTORY
ILLEGAL MINING CHAMBER MEMBERS
Illegal mining is on the rise in South Africa and presents challenges that need
to be addressed from a range of perspectives. Illegal miners in South Africa are
colloquially known as ‘zama zamas’.
• Many thousands of people are involved in illegal mining
• The annual value of illegal mining runs into billions of dollars
• Zama zamas travel as far as four kilometres underground where they may live
for several days at a time
• Illegal mining takes place at existing and abandoned mines
• Illegal miners openly flout personal health and safety to open cement-
plugged shafts with explosives on abandoned mines, and without using
necessary protective gear. In operating mines, zama zamas pose severe risks
to legitimate mine employees, to safety protocols, to shaft infrastructure and
stability, to equipment, and ultimately, to the business
An increase in unemployment, poverty and the entry of large numbers of illegal immigrants
into the country has contributed to an increase in illegal mining. Illegal mining
was initially spurred on by the surge in the gold price during
the bull market of the first decade of this century.
Despite the fall in the US$ gold price around 2011, the
rand gold price has held sufficiently steady to keep illegal mining profitable.
There are limited resources at the disposal of law
enforcement agencies to stem illegal mining, such as police, immigration,
border controls and prosecuting authorities.
No single stakeholder can address the challenge of illegal mining on its own –
collaboration is key.
14 BASE MINERALS 7 GOLD 11 PLATINUM
3 DIAMONDS 20 COAL 6 MINING CONTRACTORS
3 MINING CORPORATES 4 INVESTMENT COMPANIES 3 ASSOCIATIONS
71 MEMBERS