Put Your Money Where Your Butt Is: A Commitment Contract ... · PDF fileA Commitment Contract...
23
213 American Economic Journal: Applied Economics 2 (October 2010): 213–235 http://www.aeaweb.org/articles.php?doi=10.1257/app.2.4.213 “Quitting smoking is easy. I’ve done it a thousand times.” — Mark Twain M ore than five decades after Robert H. Strotz (1955) modeled dynamic incon- sistency, debate continues over how to represent preferences for consumption over time. 1 Introspection, casual empiricism, and laboratory evidence have moti- vated theorists to develop several classes of models in which consumers exhibit more impatience for near-term trade-offs than for future trade-offs. 2 The consumption of addictive substances has been a particular focus of such models. 3 These models 1 See Edmund S. Phelps and Robert A. Pollack (1968) for another early, formal model with time-inconsistent preferences. 2 See, e.g., David Laibson (1997), Ted O’Donoghue and Matthew Rabin (1999, 2001), Faruk Gul and Wolfgang Pesendorfer (2001, 2004), and Drew Fudenberg and David K. Levine (2006). 3 Models of addiction with self-control or temptation problems include Jonathan Gruber and Botond K ˝ oszegi (2001), Laibson (2001), O’Donoghue and Rabin (2002), B. Douglas Bernheim and Antonio Rangel (2004), and Gul and Pesendorfer (2007). * Giné: Development Economics Research Group, The World Bank, 1818 H St., NW, MC3–307, Washington, DC 20433 (e-mail: [email protected]); Karlan: Department of Economics, Yale University, P.O. Box 208269, New Haven, CT 06520–8269 and Innovations for Poverty Action (IPA), The Abdul Latif Jameel Poverty Action Lab (JPAL), and stickK.com (e-mail: [email protected]); Zinman: Department of Economics, Dartmouth College, 314 Rockefeller Hall, Hanover, NH 03755 IPA, JPAL, and stickK.com (e-mail: [email protected]). Thanks to the management and staff of Green Bank for their cooperation, and to Jacob Appel, Paulette Cha, Kareem Haggag, Scott Nelson, and especially Tomoko Harigaya for research and project management assistance. Thanks to two anonymous referees and to Satish Chand, Stefano DellaVigna, Meredith Rosenthal, and conference participants at the American Society of Health Economists biennial meeting, National Bureau of Economic Research Summer Institute, and 2009 Latin American and Caribbean Economic Association (LACEA), and seminar participants, and many university seminars. Thanks to the World Bank for funding. All errors and opinions are those of the authors and not funders nor employers. Disclosures: Karlan is president of stickK.com, which offers online commitment contracts. Zinman is on the research advisory board of stickK.com. † To comment on this article in the online discussion forum, or to view additional materials, visit the articles page at http://www.aeaweb.org/articles.php?doi=10.1257/app.2.4.213. Put Your Money Where Your Butt Is: A Commitment Contract for Smoking Cessation † By Xavier Giné, Dean Karlan, and Jonathan Zinman* We designed and tested a voluntary commitment product to help smokers quit smoking. The product (CARES) offered smokers a sav- ings account in which they deposit funds for six months, after which they take a urine test for nicotine and cotinine. If they pass, their money is returned; otherwise, their money is forfeited to charity. Of smokers offered CARES, 11 percent took up, and smokers randomly offered CARES were 3 percentage points more likely to pass the 6-month test than the control group. More importantly, this effect persisted in surprise tests at 12 months, indicating that CARES pro- duced lasting smoking cessation. (JEL D12, I12, O15)
Transcript of Put Your Money Where Your Butt Is: A Commitment Contract ... · PDF fileA Commitment Contract...

213
American Economic Journal: Applied Economics 2 (October 2010): 213–235http://www.aeaweb.org/articles.php?doi=10.1257/app.2.4.213
“Quitting smoking is easy. I’ve done it a thousand times.”— Mark Twain
More than five decades after Robert H. Strotz (1955) modeled dynamic incon-sistency, debate continues over how to represent preferences for consumption
over time.1 Introspection, casual empiricism, and laboratory evidence have moti-vated theorists to develop several classes of models in which consumers exhibit more impatience for near-term trade-offs than for future trade-offs.2 The consumption of addictive substances has been a particular focus of such models.3 These models
1 See Edmund S. Phelps and Robert A. Pollack (1968) for another early, formal model with time-inconsistent preferences.
2 See, e.g., David Laibson (1997), Ted O’Donoghue and Matthew Rabin (1999, 2001), Faruk Gul and Wolfgang Pesendorfer (2001, 2004), and Drew Fudenberg and David K. Levine (2006).
3 Models of addiction with self-control or temptation problems include Jonathan Gruber and Botond K o szegi (2001), Laibson (2001), O’Donoghue and Rabin (2002), B. Douglas Bernheim and Antonio Rangel (2004), and Gul and Pesendorfer (2007).
* Giné: Development Economics Research Group, The World Bank, 1818 H St., NW, MC3–307, Washington, DC 20433 (e-mail: [email protected]); Karlan: Department of Economics, Yale University, P.O. Box 208269, New Haven, CT 06520–8269 and Innovations for Poverty Action (IPA), The Abdul Latif Jameel Poverty Action Lab (JPAL), and stickK.com (e-mail: [email protected]); Zinman: Department of Economics, Dartmouth College, 314 Rockefeller Hall, Hanover, NH 03755 IPA, JPAL, and stickK.com (e-mail: [email protected]). Thanks to the management and staff of Green Bank for their cooperation, and to Jacob Appel, Paulette Cha, Kareem Haggag, Scott Nelson, and especially Tomoko Harigaya for research and project management assistance. Thanks to two anonymous referees and to Satish Chand, Stefano DellaVigna, Meredith Rosenthal, and conference participants at the American Society of Health Economists biennial meeting, National Bureau of Economic Research Summer Institute, and 2009 Latin American and Caribbean Economic Association (LACEA), and seminar participants, and many university seminars. Thanks to the World Bank for funding. All errors and opinions are those of the authors and not funders nor employers. Disclosures: Karlan is president of stickK.com, which offers online commitment contracts. Zinman is on the research advisory board of stickK.com.
† To comment on this article in the online discussion forum, or to view additional materials, visit the articles page at http://www.aeaweb.org/articles.php?doi=10.1257/app.2.4.213.
Put Your Money Where Your Butt Is:A Commitment Contract for Smoking Cessation†
By Xavier Giné, Dean Karlan, and Jonathan Zinman*
We designed and tested a voluntary commitment product to help smokers quit smoking. The product (CARES) offered smokers a sav-ings account in which they deposit funds for six months, after which they take a urine test for nicotine and cotinine. If they pass, their money is returned; otherwise, their money is forfeited to charity. Of smokers offered CARES, 11 percent took up, and smokers randomly offered CARES were 3 percentage points more likely to pass the 6-month test than the control group. More importantly, this effect persisted in surprise tests at 12 months, indicating that CARES pro-duced lasting smoking cessation. (JEL D12, I12, O15)
ContentsPut Your Money Where Your Butt Is: A Commitment Contract for Smoking Cessation† 213
I. CARES Product Design 217II. Cue Cards Treatment Design 219III. Experimental Design and Summary Statistics 219IV. Results 223A. CARES Take up 223B. CARES Usage 223C. Treatment Effects on Smoking Cessation 225V. Conclusion 227Appendix Summaries of Three Open-Ended Follow-up Interviews 230REFERENCES 233

214 AMERICAn ECOnOMIC JOuRnAL: AppLIEd ECOnOMICS OCTOBER 2010
share the prediction that some (self-aware, or “sophisticated”) consumers will seek to voluntarily constrain their future consumption choices. They will demand com-mitment devices.4 Yet there is little field evidence on the demand for, or effective-ness of, such commitment devices (Gharad Bryan, Dean Karlan, and Scott Nelson 2009; Stefano DellaVigna 2009).
We take some initial steps toward addressing the empirical viability and effec-tiveness of commitment devices for smoking cessation, using evidence from a field experiment in the Philippines. Green Bank of Caraga randomly offered some smok-ers the opportunity to voluntarily sign a commitment contract (branded Committed Action to Reduce and End Smoking, or “CARES”) to stop smoking. A smoker sign-ing the contract pledged his own money that he would pass a urine test six months later.5 During the six-month commitment period, a bank employee visited each CARES client weekly to collect deposits. After the commitment period, a CARES client who passed the urine test got his money back (no interest accrued on the account). If he failed the test, the bank donated the money to charity. A second treatment group received “cue cards,” visually aversive wallet-sized pictures that are modeled on Canada’s mandated cigarette packaging and intended to regularly remind smokers of the health risks from smoking.
CARES is essentially the performance bond contract suggested in Gruber and Koszegi (2001), augmented with a deposit collection service that reduces transac-tion costs and perhaps provides a form of social pressure. So CARES provides two forms of voluntary commitment: a financial commitment in the form of savings balances, and a nonfinancial commitment to be visited by a deposit collector (and thus receive the social pressure that may accompany such a visit). Two prior studies found that such social pressure, whether from a bank or from peers, can be used to generate higher savings. Nava Ashraf, Karlan, and Wesley Yin (2006a) find positive treatment effects from a deposit collection service offered by the Green Bank of Caraga in the Philippines, the same bank that offered CARES. Felipe Kast and Dina Pomeranz (2009) find positive treatment effects of a peer monitoring and reporting savings program in Chile.
Eleven percent of smokers offered the CARES contract signed up. This is compa-rable to takeup rates for a leading “self-help” treatment, nicotine replacement medi-cations (patch, gum, inhaler, or nasal spray).6 The average client made a deposit every 2 weeks and ended up committing 550 pesos (US$11) by the end of the 6-month contract period. The 550 pesos is about 20 percent of the monthly income
4 In contrast, standard neoclassical models of intertemporal choice do not predict a demand for commitment. Gary S. Becker and Kevin M. Murphy (1988) model the consumption of addictive substances along the lines, and Becker, Michael Grossman, and Murphy (1991) test the model’s key empirical predictions.
5 The testing protocol (for cotinine, the primary metabolite of nicotine) has limitations, detailed below, but has been used by public health campaigns and tests of other treatments (Neal L. Benowitz et al. 2002; Kevin G. Volpp et al. 2006, 2009; and some of the randomized trials of nicotine replacement medications summarized in Lindsay F. Stead et al. 2008).
6 Seventeen percent of US smokers reported using nicotine replacement medication during the last 12 months in a nationally representative 2001 phone survey (Maansi A. Bansal et al. 2004). In the only study we know of from the Philippines, only 6 percent of a sample of relatively heavy smokers who had already decided to quit had ever used any form of nicotine replacement therapy in past smoking cessation attempts (Rommel Tipones and Lenora Fernandez 2006).
VOL. 2 nO. 4 215GIné ET AL.: puT YOuR MOnEY WhERE YOuR BuTT IS
of participants7 and roughly equal to the average out-of-pocket expense for about 6 months worth of cigarettes incurred by CARES clients at baseline.
Our results suggest that CARES helps smokers quit. Smokers randomly offered CARES were an estimated 3.4 to 5.7 percentage points more likely to pass the 12-month urine test than the control group. Using the random assignment of whether CARES was offered to estimate treatment effects—specifically, intention-to-treat effects—generates results that are free of bias (e.g., from an omitted variable such as the strength of desire to stop smoking).8 We find similar results on 6-month quits (i.e., the end point of the contract and bank accounts), but focus on the 12-month results for several reasons. The six-month test date was scheduled up to four weeks in advance, and the test could be passed by abstaining from smoking for as little as a few days before the test date.9 The 12-month tests, in contrast, were “surprise” tests with only a day or two gap between test solicitation and administration. The 12-month results also lacked any incentives for fraud, since all commitment contract money had been returned or forfeited at 6 months, and, hence, there was no financial consequence tied to the 12-month test result. Lastly, practical reasons required that subject compensa-tion for taking the six-month test vary across treatment arms (CARES users did not receive compensation, while all other subjects did). In principle, this could generate sample selection bias. The 12-month test does not suffer from this problem, since all subjects were offered equal compensation for taking the test.
The effect of CARES on smoking quits, although small in the nominal number of individuals who stopped smoking, is large in relative terms. The Philippines (and elsewhere) has low levels of transition from smoking to nonsmoking status, given the addictive nature of smoking.10 For example, the 12-month cessation rates for the control group ranged from 8.9 percent to 14.7 percent, depending on the assump-tions regarding those not found for testing or those who refused to be tested. Our intention-to-treat effects represent a 35.3 percent (3/8.5) or 36.5 percent (5/13.7) increase over these baseline likelihoods of smoking cessation.
The magnitude of the CARES treatment effects is also large relative to other smoking cessation treatments. Within-sample we find little evidence that the aver-sive cue cards affect smoking quits. The results also suggest that CARES has effects that are comparable to other treatments that have been tested using randomized tri-als on other samples. Volpp et al.(2006) find that modest financial bonuses offered through a US Veterans Affairs hospital increase short-term cessation, but not lasting quits. Volpp et al. (2009) find that larger financial bonuses ($250 for 6-month test passage, $400 for 12-month test passage), offered through a workplace program, increase both short-term cessation and lasting quits (with a treatment-on-the-treated
7 Income is very roughly estimated from marketer observations of subject appearance and work activity.8 Although not free of attrition bias, which we will discuss below and handle through various conservative
assumptions. Results are robust to these assumptions.9 Possibilities of gaming the six-month test aside, the public health literature finds that even short-term absten-
tion or failed quit attempts increase the probability of quitting eventually.10 See, e.g., the American Cancer Society’s Guide to Quitting Smoking, which states: “Why is quitting and
staying quit hard for so many people? The answer is nicotine.” Mark Twain offers a related perspective: “Quitting smoking is easy. I’ve done it a thousand times.” Fujian Song et al. (2002) report that 46 percent of US smokers made a serious attempt to stop in the 1993–1994, but only 5.7 percent successfully abstained for a period of 1 month or more.

216 AMERICAn ECOnOMIC JOuRnAL: AppLIEd ECOnOMICS OCTOBER 2010
effect of 5.8 percentage points). Nonfinancial interventions, such as over-the-coun-ter nicotine replacement medications, have been tested in dozens of randomized trials and generally produce treatment-on-the-treated effects that are smaller than those found here for CARES (Stead et al. 2008).
Despite the large treatment effects of CARES, a surprisingly large proportion of smokers who voluntarily committed with CARES (66 percent) ended up fail-ing to quit. This is consistent with various behavioral biases in preferences and/or expectations (e.g., partial naïveté about dynamic inconsistency, projection bias, and over-confidence). Or it may be the case that these smokers are sophisticated about their self-control problems and use CARES to commit to an earnest quit attempt that improves the likelihood of eventual cessation (e.g., Carlo C. DiClemente et al.1991; Norman Hymowtiz et al. 1997). Also, the fact that clients who ended up failing made smaller commitments—fewer and smaller deposits after opening the account, but before taking the test—suggests that any welfare loss is blunted by the choice of lower commitment intensity. Anecdotally, several clients reported having spent less on cigarettes, but then failed to stop completely. Thus, the lost deposits may have been (partially) offset from a welfare perspective by a reduction in smoking.
In all, the results here are unusually direct evidence on the takeup and effectiveness of a commitment device for managing the consumption of an addictive substance. The main comparable studies we know are Roger Paxton’s (1980, 1981, 1983).11 These studies have three key differences from ours. First, they were administered in a highly structured and clinical setting to smokers who were already participating in a smoking cessation program. Our study includes smokers of varying smoking intensi-ties and ex ante dispositions toward cessation aids. Second, Paxton’s control groups received a rich set of other smoking cessation aids, including counseling, social pres-sure, and aversion therapy. Our study takes a more over-the-counter approach and compares the effects of CARES to a control group that receives nothing other than basic information. Third, Paxton’s analysis does not exploit random assignment.12
Our study also relates to prior work on commitment devices for other decisions that may involve self-control problems. Dan Ariely and Klaus Wertenbroch (2002) find that 37 of 51 MBA students elect to impose binding deadlines on themselves for completing class assignments. Deadlines improve task performance, but students do not necessarily set them optimally.
Three other papers on savings behavior—Ashraf, Karlan, and Yin (2006b); Richard H. Thaler and Shlomo Benartzi (2004); Esther Duflo, Michael Kremer, and Jonathan Robinson (2009)—find that products with commitment features increase savings rates. But the decisions and treatments in those papers make it more difficult to interpret the treatment effects as tests of time inconsistent preferences. In Ashraf, Karlan, and Yin, (2006a, 2006b) individuals were offered
11 See also Jesse Dallery, Steven Meredith, and Irene Glenn (2008), which randomly assigns four individuals to receive a deposit contract and four individuals to receive positive incentives, and finds no difference in cessa-tion, and Richard Winnet (1973), which found significant differences in short-term outcomes and a statistically insignificant (but imprecisely estimated) difference in long-term smoking cessation. See, also, Thomas G. Bowers, Winett, and Lee W. Fredericksen (1987) and Harry A. Lando (1977) for other papers involving financial incentives as part of larger programs.
12 Paxton (1980, 1981, and 1983) randomized subjects into different arms, but then estimated treatment effects by comparing those who took up the commitment product to the entirety of the control group.

VOL. 2 nO. 4 217GIné ET AL.: puT YOuR MOnEY WhERE YOuR BuTT IS
an illiquid savings account (SEED) that did not allow withdrawals until a goal was reached. SEED might provide benefits other than self-control, such as spousal control, opt-out of informal risk sharing arrangements, and mental accounting. SEED also is not a direct commitment to lower particular consumption (as is CARES), but rather a commitment to not withdraw funds deposited into the SEED account. Thaler and Benartzi’s (2004) Save More Tomorrow™ (SMART) plays on status quo bias, money illusion, and loss aversion, and is also not a binding commitment. Clients can complete a single form to change their contribution to retirement savings, thus undoing the commitment. Duflo, Kremer, and Robinson (2009) is the closest to this paper in that there is a clearer commitment device (in that case, by choosing to purchase fertilizer at harvest time for next planting season as opposed to delaying the purchase until next planting time). We differ in two important theoretical ways from Duflo, Kremer, and Robinson (2009). First, CARES is a commitment contract to avoid a specific and tempting consumption good whereas Duflo, Kremer, and Robinson (2009) is a commitment to make a certain future investment (which implicitly requires a reduction in overall con-sumption). Second, the CARES product is distinctly about controlling one’s own temptations, whereas a commitment to a future investment may be done strategi-cally to fend off claims on future cash by spouses, families, or friends.
Thus, as compared to the savings literature, CARES offers the opportunity to make a more binding and direct commitment on a specific, tempting, and addictive consumption behavior. Also our finding that a limited-time (six-month) commit-ment produces longer-term smoking cessation suggests that commitments can facil-itate the formation of good habits. This, in turn, suggests that commitment contracts may be worth subsidizing if viable private markets fail to develop in some settings (due, e.g., to legal obstacles or externalities). In some cases commitment contracts could serve as a lower-cost substitute for, or low-cost complement to, conditional cash transfers for healthy behaviors (Volpp et al. 2008a, 2008b; Gary Charness and Ury Gneezy 2009).
Our paper proceeds as follows. Section I describes the voluntary commitment savings product that we designed for smokers who want to quit smoking. Section II describes the cue card treatment. Section III details the experimental design and implementation by Green Bank in the Philippines. Section IV reports the results of the study. Section V concludes, with particular attention to heterogeneity and its implications for generalizing these results to the full population of smokers (and to other similar behaviors).
I. CARES Product Design
CARES is a voluntary commitment savings program specifically designed for smokers who want to quit smoking. The basic design of the product allows a smoker to risk a self-selected amount of his own money that will be forfeited unless he passes a biochemically verified test of smoking cessation, administered as a urine test of nicotine and cotinine byproducts, six months after signing the commitment contract. The particular product design and study described below was implemented by the Green Bank of Caraga, on the island of Mindanao in the Philippines.

218 AMERICAn ECOnOMIC JOuRnAL: AppLIEd ECOnOMICS OCTOBER 2010
Green Bank marketed CARES by sending bank representatives into the street to target obvious smokers. Details on the marketing are described with the experimen-tal design in Section III.
Green Bank required a minimum balance of 50 pesos (~= US$1), collected by the field marketers, to open a CARES account. Marketers encouraged smok-ers to deposit the money they would normally expect to spend on cigarettes into a savings account every week for six months. The savings account did not yield any interest. This helps discourage nonsmokers from opening the account merely because of the convenience of deposit collection services. The bank offered most randomly selected individuals weekly deposit collection. The remaining CARES clients had to go to a branch to make additional deposits.13
Clients could only make deposits, and not withdrawals, from the CARES account during the six-month commitment period. Hence, all deposited funds were at risk. Clients who passed the six-month urine test got their entire balance back. Clients who failed (or did not take) the test forfeited their entire balance.
Trained Green Bank technicians tested CARES clients’ smoking status using the NicCheckTM urine strip test for nicotine and its primary metabolite, cotinine.14 NicCheck has been used in previous anti-smoking programs, including the Dutch Cancer Society’s “Quit and Win” campaign, and the financial bonus incentive testing in Volpp et al. (2006, 2009). The test result provides a categorical measure of recent nicotine consumption, with values ranging from 0 (no exposure) to 15 (high exposure).15 Green Bank counts only a zero result as passing, and market-ers emphasized that clients must stop smoking completely in order to be sure of passing the test.
Green Bank contacted each client three to four weeks prior to his six-month deadline to set up a urine testing appointment. If a client could not be reached ini-tially, the bank made repeated attempts to set up a test date within one week of the maturity date. If a client was deemed unable to take the test within the stipulated one-week grace period due to mitigating circumstances (e.g., working in another location), he was allowed an additional three weeks to take the test. If the client was reached and refused to schedule a date, the account balance was forfeited one week after the six-month commitment date.
13 Clients lost the weekly deposit collection service if they missed three consecutive deposits.14 Initially CARES clients were required to take a blood test at a nearby hospital lab, but delays and added costs
led Green Bank to switch to urine strips that could be used in the field. NicCheck product specifications indicate that the urine strips sacrifice a bit of test specificity (the ability to detect a true negative result, which is 97 percent for urine strip versus 99 percent for lab-based cotinine analysis), but offer equivalent test sensitivity (the ability to detect a true positive result, which is roughly 97 percent for both urine strips and lab-based cotinine analysis) and the ability to provide results in the field, within 15 minutes. Green Bank found similar specificity (1 false positive out of 18 self-reported nonsmokers) and much lower sensitivity in its own pilot testing, where marketers randomly approached people on the street in our study area, asked if they were smokers, and then offered 30 pesos to take the urine strip test.
15 Small and portable test strips are dipped into the urine sample, stimulating a chemical reaction that changes the test strip’s color. The color result ranges from white (no nicotine exposure), to light pink (moderate nicotine exposure), to red (high nicotine exposure). The test administrator then compares the test strip’s color to a NicCheck color scale and assigns the test result a number ranging from 0 (no exposure) to 15 (high exposure).
VOL. 2 nO. 4 219GIné ET AL.: puT YOuR MOnEY WhERE YOuR BuTT IS
II. Cue Cards Treatment Design
The cue cards are pocket-sized, graphic depictions of the negative health con-sequences of smoking. Each individual received one of four pictures: a prema-ture baby (with the text “Smoking harms unborn babies”), bad teeth (with the text “Smoking causes mouth and throat cancer”), black lung (with the text “Smoking causes lung cancer”), or a child hooked up to a respirator (with the text “Don’t let children breathe your smoke”). By law, such images must be featured on cigarette packages in Australia, Canada, and New Zealand (Janet Hoek and Philip Gendall 2005). Smokers assigned to the cues treatment were offered their choice of the cards described above, and encouraged by the marketers to keep them handy and/or post them in locations where the subject tended to smoke. More than 99 percent of sub-jects offered the cue cards accepted them. One year after receiving the cue cards, in a brief follow-up survey (done in conjunction with the “surprise” nicotine test), 40 percent reported remembering the cue cards and knowing where they were, and 6 percent reported using them actively to help them avoid smoking.
III. Experimental Design and Summary Statistics
Our study sample consists of 2,000 smokers aged 18 or older who reside on the island of Mindanao in the southern Philippines. Green Bank marketers identified smokers by approaching people and asking them whether they smoke regularly. If they did, the marketer then asked if they wanted to participate in a short survey on smok-ing. All subjects received an informational pamphlet on the dangers of smoking and a tip sheet on how to quit. Since the primary objectives of this study were to determine first, whether there was demand for CARES, and second, whether CARES increased smoking cessation, the marketers only collected very quick and basic baseline data on age and smoking status (see Section IVA for more details).
The experiment was implemented in three distinct waves of marketing (the econometric specifications condition for these waves because probability of assign-ment to treatment varied across waves).
The first two waves took place in Butuan City from August 2006 to December 2006. After completing the baseline survey, marketers revealed a sticker on the back of the survey that randomly assigned the subject to one of four groups: (1A) CARES with deposit collection, (1B) CARES without deposit collection, (2) Cues, or (3) Control.16 All subjects received information on the dangers of smoking and a pam-phlet with tips on how to quit. The probability of assignment to groups in wave 1 was heavily slanted toward CARES to establish whether there was sufficient takeup to proceed with continued research on the product: 45 percent, 45 percent, 5 percent, and 5 percent (some assignments to Cues and Control were maintained to train the marketing team on the randomization protocols). After establishing that there was
16 In the first wave there were 20 situations in which marketers interviewed respondents with either 1 or 2 oth-ers present. In these cases, marketers were instructed to interview all individuals in the group before disclosing the random assignment. All respondents in the group received the same assignment as the first interviewee. Impact results discussed below correct standard errors for any clustering within groups of individuals that received joint marketing.
220 AMERICAn ECOnOMIC JOuRnAL: AppLIEd ECOnOMICS OCTOBER 2010
sufficient take up of CARES, Green Bank changed the assignment probabilities to 15 percent, 15 percent, 30 percent, and 40 percent for the second wave in order to improve power for identifying the impact of CARES on smoking cessation. Surveys were completed by 418 smokers (and hence drawn into the sample frame) in the first two waves. Of the 266 assigned to receive a CARES offer, 34 took the product. Two individuals from the cues group also opened an account (after hearing about the product and approaching bank staff on their own). In our analysis, we code these individuals in the cues group, in adherence to the random assignment.
The third marketing wave ran from February 2007 to May 2007 in the neighbor-ing town of Ampayon. Here, Green Bank implemented new randomization proce-dures designed to produce even better compliance with the randomized treatment assignment. Now marketers used a calculator to solve an equation based on the subject’s birth date (the residual of dd + mm + yy, divided by three). The indi-vidual was then assigned to the CARES group if the residual was zero, to cues if the residual was one, and to control if the residual was two. Given the low take up in the CARES group without deposit collection in the first two waves (4.3 percent), and the fact that the geographic area for the third wave was more rural, all respondents in the Ampayon CARES group were offered deposit collection service.17 Of the 515 Ampayon subjects, 49 were offered CARES and opened the account. Table 1, panel A summarizes CARES offers and take-up rates.
In order to validate the quality and accuracy of information provided by the mar-keters, field staff from IPA conducted spot-checking visits with randomly selected respondents who had been offered CARES. More than 90 percent of the clients accurately described the main features of the product design (i.e., that they would lose their deposited money if they failed to stop smoking).
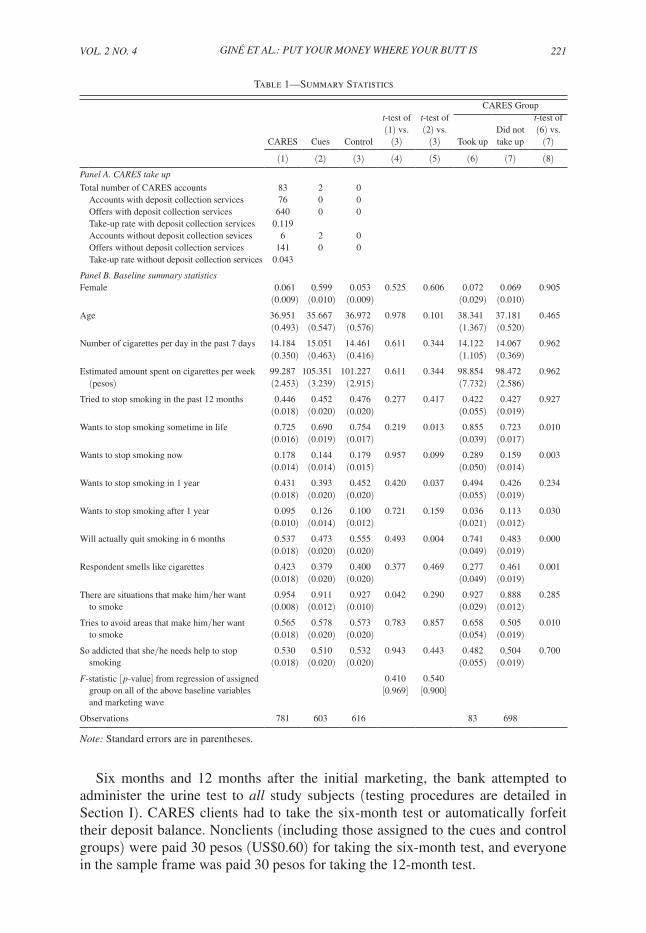
Given the random assignment, we expect individuals who end up in treatment and control groups to have statistically indistinguishable baseline characteristics, on average, after we control for the likelihood of assignment to each arm. Table 1, panel B presents this evidence. The F-statistic from a regression of assignment to CARES on all baseline covariates is 0.41 ( p-value of 0.969), and for assignment to Cues is 0.54 ( p-value of 0.900). When we examine individual variables across the CARES and control groups, 12 out of 13 are similar statistically, and only 1 variable fails at the 10 percent level: 95.4 percent in the CARES group reported experiencing specific situations that make them want to smoke, whereas only 92.7 percent of control individuals reported the same. The cues treatment individuals are similar statistically to the control treatment individuals in 10 out of 13, with the significant differences found on “wanting to stop smoking sometime in your life,” “wanting to stop smoking in one year,” and “will actually quit smoking in six months.” These variables may also be correlated with smoking cessation, so we estimate treatment effects with the full set of baseline covariates as control variables (Table 5, panel B shows that the primary treatment effect estimates are robust to removing the base-line covariates).
17 As detailed in our equation (1), controls for randomization conditions and marketing wave ensure that this low take-up rate does not confound inference on treatment effects. We also confirm that dropping the no-deposit collection CARES treatment arm does not change the results in Table 5.
VOL. 2 nO. 4 221GIné ET AL.: puT YOuR MOnEY WhERE YOuR BuTT IS
Six months and 12 months after the initial marketing, the bank attempted to administer the urine test to all study subjects (testing procedures are detailed in Section I). CARES clients had to take the six-month test or automatically forfeit their deposit balance. Nonclients (including those assigned to the cues and control groups) were paid 30 pesos (US$0.60) for taking the six-month test, and everyone in the sample frame was paid 30 pesos for taking the 12-month test.
Table 1—Summary Statistics
CARES Group
CARES Cues Control
t-test of (1) vs.
(3)
t-test of (2) vs.
(3) Took upDid not take up
t-test of (6) vs.
(7)
(1) (2) (3) (4) (5) (6) (7) (8)panel A. CARES take up
Total number of CARES accounts 83 2 0Accounts with deposit collection services 76 0 0Offers with deposit collection services 640 0 0Take-up rate with deposit collection services 0.119Accounts without deposit collection sevices 6 2 0Offers without deposit collection services 141 0 0Take-up rate without deposit collection services 0.043
panel B. Baseline summary statisticsFemale 0.061 0.599 0.053 0.525 0.606 0.072 0.069 0.905
(0.009) (0.010) (0.009) (0.029) (0.010)Age 36.951 35.667 36.972 0.978 0.101 38.341 37.181 0.465
(0.493) (0.547) (0.576) (1.367) (0.520)Number of cigarettes per day in the past 7 days 14.184 15.051 14.461 0.611 0.344 14.122 14.067 0.962
(0.350) (0.463) (0.416) (1.105) (0.369)Estimated amount spent on cigarettes per week 99.287 105.351 101.227 0.611 0.344 98.854 98.472 0.962 (pesos) (2.453) (3.239) (2.915) (7.732) (2.586)Tried to stop smoking in the past 12 months 0.446 0.452 0.476 0.277 0.417 0.422 0.427 0.927
(0.018) (0.020) (0.020) (0.055) (0.019)Wants to stop smoking sometime in life 0.725 0.690 0.754 0.219 0.013 0.855 0.723 0.010
(0.016) (0.019) (0.017) (0.039) (0.017)Wants to stop smoking now 0.178 0.144 0.179 0.957 0.099 0.289 0.159 0.003
(0.014) (0.014) (0.015) (0.050) (0.014)Wants to stop smoking in 1 year 0.431 0.393 0.452 0.420 0.037 0.494 0.426 0.234
(0.018) (0.020) (0.020) (0.055) (0.019)Wants to stop smoking after 1 year 0.095 0.126 0.100 0.721 0.159 0.036 0.113 0.030
(0.010) (0.014) (0.012) (0.021) (0.012)Will actually quit smoking in 6 months 0.537 0.473 0.555 0.493 0.004 0.741 0.483 0.000
(0.018) (0.020) (0.020) (0.049) (0.019)Respondent smells like cigarettes 0.423 0.379 0.400 0.377 0.469 0.277 0.461 0.001
(0.018) (0.020) (0.020) (0.049) (0.019)
There are situations that make him/her want 0.954 0.911 0.927 0.042 0.290 0.927 0.888 0.285 to smoke (0.008) (0.012) (0.010) (0.029) (0.012)
Tries to avoid areas that make him/her want 0.565 0.578 0.573 0.783 0.857 0.658 0.505 0.010 to smoke (0.018) (0.020) (0.020) (0.054) (0.019)
So addicted that she/he needs help to stop 0.530 0.510 0.532 0.943 0.443 0.482 0.504 0.700 smoking (0.018) (0.020) (0.020) (0.055) (0.019)
F-statistic [ p-value] from regression of assigned 0.410 0.540 group on all of the above baseline variables and marketing wave
[0.969] [0.900]
Observations 781 603 616 83 698
note: Standard errors are in parentheses.

222 AMERICAn ECOnOMIC JOuRnAL: AppLIEd ECOnOMICS OCTOBER 2010
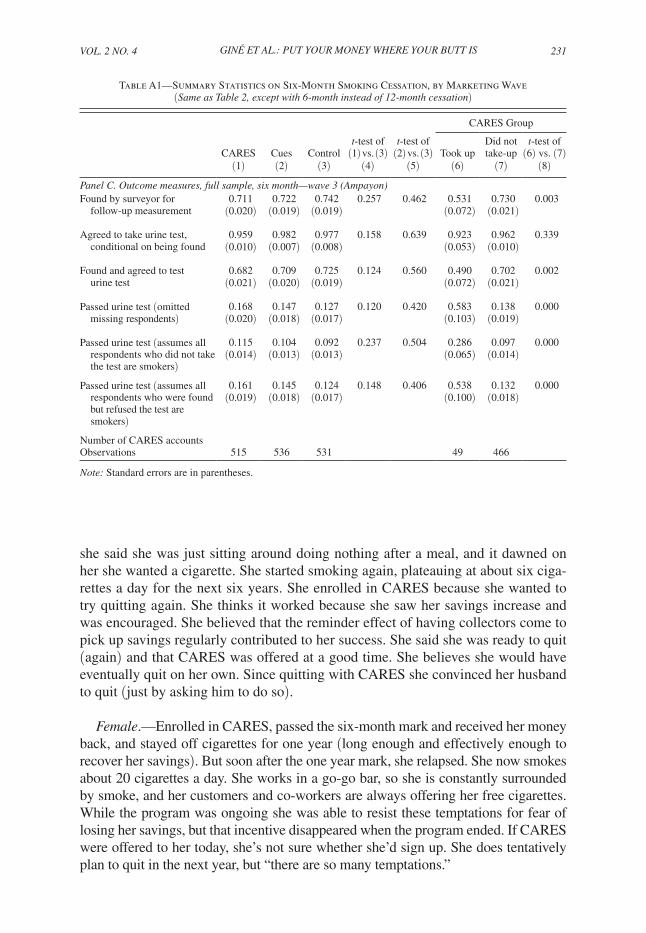
Table 2 shows reach rates for the 12-month urine test in wave 3 (Appendix Table A1 shows the same statistics for the 6-month test).18 The bank reached 64 percent of those in the baseline for the 12-month urine test, with no difference in reach or test completion rate across the three treatment and control groups. Of those contacted, 96 percent agreed to take the test.
Table 2 also shows unconditional mean 12-month quit rates under different assumptions about the smoking status of those who did not take the urine test. These results preview our main results below (where we pool all three waves and condition on wave-varying treatment assignment probabilities), that subjects assigned to the CARES group are (marginally) significantly more likely to pass the 12-month urine test than those in the control group.19
18 We show only wave 3 because treatment assignment probabilities varied by wave, making means com-parisons informative only if one conditions on wave (as we do in our econometric estimates of treatment effects, presented below in Table 5), or if one considers each wave separately. So to conserve space in presenting our uncon-ditional means comparisons in Table 2 and Appendix Table A1, we present results only for the largest wave, wave 3.
19 One noteworthy pattern from the unconditional means in Table 2 is that the quit rates among CARES non-takers (column 7) are comparable to those of the control group (column 3). One might presume that CARES nontakers (being self-selected) should be less likely to truly want to quit, on average, than the control group, and hence should have lower quit rates than the control group. Alternatively, there may not be much heterogeneity in the desire to quit (or in the secular hazard out of smoking), but substantial heterogeneity in the expected benefit of CARES. There may also be a treatment effect from being offered CARES, unconditional on take-up, if know-ing that CARES is available changes behavior (e.g., by making quitting seem more desirable and/or feasible, and thereby increasing quit attempts).
Table 2—Summary Statistics on 12-Month Smoking Cessation
CARES Group
CARES Cues Control
t-test of (1) vs.
(3)
t-test of (2) vs.
(3) Took upDid not take up
t-test of (6) vs.
(7)(1) (2) (3) (4) (5) (6) (7) (8)
Outcome measures, one year: wave 3 (Ampayon)Found by surveyor for follow-up 0.643 0.636 0.646 0.913 0.740 0.796 0.627 0.019 measurement (0.021) (0.021) (0.021) (0.582) (0.022)Agreed to take urine test, 0.952 0.965 0.956 0.776 0.567 0.974 0.949 0.483 conditional on being found (0.012) (0.010) (0.011) (0.026) (0.013)Found and agreed to test urine test 0.612 0.614 0.618 0.841 0.896 0.776 0.594 0.013
(0.021) (0.021) (0.021) (0.060) (0.023)Passed urine test 0.187 0.158 0.137 0.086 0.452 0.237 0.181 0.405 (omitted missing respondents) (0.022) (0.020) (0.019) (0.070) (0.023)Passed urine test 0.115 0.097 0.085 0.108 0.486 0.184 0.107 0.111 (assumes all respondents who did not take the test are smokers)
(0.014) (0.013) (0.012) (0.056) (0.014)
Passed urine test 0.178 0.152 0.131 0.092 0.426 0.231 0.171 0.363 (assumes all respondents who were found but refused the test are smokers)
(0.021) (0.019) (0.018) (0.068) (0.022)
Number of CARES accounts 49 0 0
Observations 515 536 531 49 466
notes: Standard errors are in parentheses. Only wave 3 (largest) is shown because treatment assignment probabili-ties varied by wave, making mean comparisons hard if all waves are included. The treatment estimates of Table 5 use all waves, but condition on wave.

VOL. 2 nO. 4 223GIné ET AL.: puT YOuR MOnEY WhERE YOuR BuTT IS
IV. Results
A. CARES Take up
In total, 83 out of 781 (11 percent) individuals offered CARES signed a contract. Table 1, panel B, columns 6–8, shows univariate analysis of the take-up decision from data on the limited set of characteristics marketers collected in the quick baseline sur-vey administered prior to treatment assignment and marketing.20 Table 3 shows multi-variate estimation of take-up correlates.21 In the univariate comparisons, the following baseline characteristics were positively correlated with taking up CARES: wanting to quit (at some point in life, or now), optimism about quitting (as indicated by respond-ing yes to “will you quit smoking in the next year?”), and pre-existing strategic behav-ior in managing one’s cravings (as indicated by responding yes to “do you try to avoid areas or situations that make you want to smoke?”). This last correlation provides supportive evidence for theoretical models that distinguish between sophisticated and naïve agents, in which the sophisticated are more likely to engage in strategic behavior against their future selves. This result is not statistically significant in the multivariate analysis in Table 3, however. Negative correlates with CARES take-up were wanting to quit smoking more than a year in the future (perhaps an indicator of procrastination) and smelling like cigarettes (likely an indicator of heavy smoking). The main results here are that the full set of baseline characteristics are jointly significant, but they explain only about 10 percent of the variation in the take-up decision.
B. CARES usage
Table 4 shows some summary statistics on CARES deposits.Opening balances were 57 pesos on average. This is four times the monetary value
of the number of cigarettes the client reported smoking per week. Ninety percent of clients opened with the minimum amount of 50 pesos. Eighty percent of clients then made additional contributions. On average, CARES clients made a deposit every 2 weeks, and by 6 months the average balance grew to 553 pesos. Given self-reported smoking intensity and a per-cigarette cost of one peso, the average CARES client committed roughly six months worth of cigarette spending to the account.
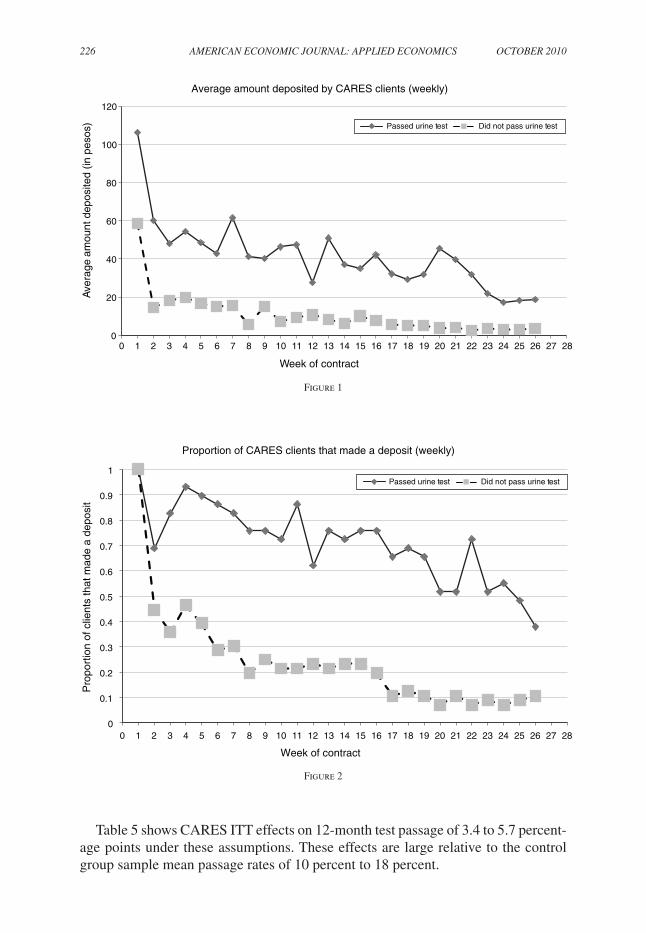
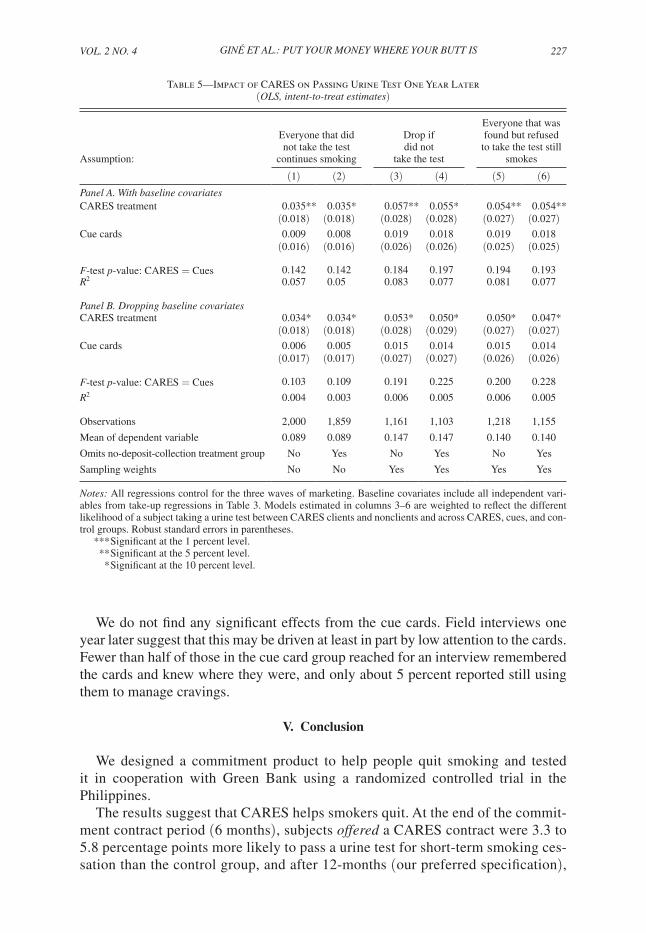
Not surprisingly CARES clients who used the account more intensively were more likely to pass the six-month urine tests (Table 4). Successful clients made more deposits, were more likely to retain deposit collection services by making regular deposits, and had larger balances at contract maturity. Of course, since con-tract terms and deposit requirements were not randomized, we cannot infer a causal relationship between deposit amount, deposit regularity, and success.
However, the pattern of deposits is intuitive. Figures 1 and 2 show that those who succeed start off making higher deposits, and continue to make deposits throughout
20 Only a handful of the 2,000 subjects were existing Green Bank clients. Marketers did not elicit income directly, but their observation of subject appearance and work activity indicated that average subject income was substantially lower than that of typical Green Bank clients.
21 All take-up and impact regressions include indicator variables for the three marketing waves.

224 AMERICAn ECOnOMIC JOuRnAL: AppLIEd ECOnOMICS OCTOBER 2010
the life of the project. The trend is downward, in that deposits get smaller and less frequent toward the end. Once enough funds are in the account to be binding and modify one’s behavior, further deposits are unnecessary to change behavior. On the other hand, those who fail drop much more precipitously than those who succeed, and converge to only one out of ten individuals making any deposits at the halfway point of the study.
Table 3—Multivariate Analysis of CARES Take-up OLS, Probit
Estimator: OLS Probit(1) (2)
Female −0.034 −0.024(0.041) (0.028)
Age (/100) 0.894** 0.858**(0.405) (0.398)
Age squared (/100) −0.010** −0.010**(0.005) (0.005)
Number of cigarettes per day in the past 7 days (/100) 0.153 0.103(0.321) (0.252)
Number of cigarettes per day squared (/100) −0.002 −0.001(0.007) (0.005)
Having tried to stop smoking in the past 12 months −0.034 −0.025(0.025) (0.019)
Wanting to stop smoking sometime in life 0.085 0.062(0.085) (0.039)
Wanting to stop smoking now 0.034 0.019 (0.038) (0.028)
Wanting to stop smoking in 1 year 0.076 0.080(0.080) (0.127)
Wanting to stop smoking after 1 year −0.002 −0.003(0.037) (0.050)
Will actually quit smoking in 6 months 0.116*** 0.114***(0.036) (0.041)
Respondent smells like cigarettes −0.073** −0.056***(0.024) (0.019)
There are situations that make him/her want to smoke 0.031 0.037(0.039) (0.033)
Try to avoid areas that make him/her want to smoke 0.043 0.039*(0.027) (0.022)
So addicted that she/he needs help to stop smoking 0.034 0.026(0.027) (0.022)
Probability (all variables above = 0) 0.000 0.000
Observations 781 775
(pseudo-) R2 0.101 0.142
Number of CARES accounts opened 83 83
Mean of dependent variable 0.106 0.107
notes: Standard errors are clustered by the marketing group if the respondents were surveyed in a group. All regres-sions control for three phases of randomization and use marketer fixed effects. Probit specification reports marginal effects. Robust standard errors in parentheses.
*** Significant at the 1 percent level. ** Significant at the 5 percent level. * Significant at the 10 percent level.

VOL. 2 nO. 4 225GIné ET AL.: puT YOuR MOnEY WhERE YOuR BuTT IS
C. Treatment Effects on Smoking Cessation
We estimate the intent-to-treat (ITT) effects of CARES and cue cards on test pas-sage using the OLS specification
(1) passit = α + βcaresi + χcuesi + δXi + γWi + εi,
where i indexes individuals; t refers to the 6-month or 12-month test; pass, cares, and cues are all binary variables; X is the vector of baseline covariates; and W is a vector of dummies for the three marketing waves. We report our main results—on 12-month test passage—in Table 5. Panel A of Table 5 shows results controlling for baseline the covariates Xi, and panel B shows that the results are similar if we drop those covariates. We find similar results if we estimate (1) for six-month test passage (Appendix Table A2), using probit instead of OLS (Appendix Table A3), or after limiting the sample to those who reported wanting to stop smoking at some point in their life in the baseline survey (Appendix Table A4).
Each table reports results on the full sample in odd columns, and dropping the CARES arm without deposit collection in even columns. We estimate effects under three different assumptions on clients for whom we do not have a test result: these clients would have failed the test (columns 1 and 2); these clients have the average pass rate, i.e., we drop these clients (columns 3 and 4); these clients have the average pass rate, unless they were found by the technician and refused to take the test, in which case we assume they would have failed (columns 5 and 6).22
22 Six test strips turned blue (off the NicCheck results spectrum) in each of the 6- and 12-month follow-up pools. This is likely due to the TB medicine Isoniazid. We coded these blue strips as failures, but Green Bank returned the commitment balance to the one CARES client with a blue result.
Table 4—Usage of CARES Bank Account by Six-Month Urine Test Result (Summary statistics, philippine pesos (P50 = US$1))
Number of accounts Min Average Max
Standard deviation
(1) (2) (3) (4) (5)Opening balance 85 50 57.18 410 40.49 Success (i.e., those who passed 6-month urine test) 29 50 71.03 410 67.95 Failures (i.e., those who failed 6-month urine test) 56 50 50.00 50 0.00
Number of deposits made into CARES account 85 1 11.75 29 9.35 Success (i.e., those who passed 6-month urine test) 29 7 20.90 26 5.47 Failures (i.e., those who failed 6-month urine test) 56 1 7.02 29 7.17
Proportion of clients who missed three deposits and lost deposit collection service
85 0 0.64 1 0.48
Success (i.e., those who passed 6-month urine test) 29 0 0.14 1 0.35 Failures (i.e., those who failed 6-month urine test) 56 0 0.89 1 0.31
Balance at 6 months 85 50 551.12 3,410 651.01 Success (i.e., those who passed 6-month urine test) 29 282.75 1,079.58 3,410 703.37 Failures (i.e., those who failed 6-month urine test) 56 50 277.45 2,657.75 414.62
note: Minimum account opening deposit was 50 pesos.
226 AMERICAn ECOnOMIC JOuRnAL: AppLIEd ECOnOMICS OCTOBER 2010
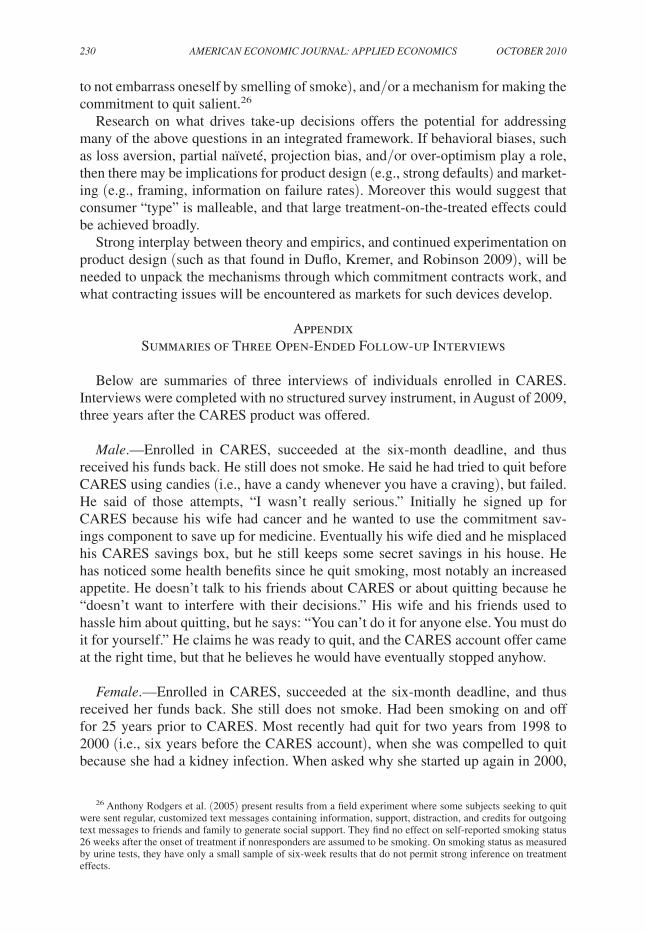
Table 5 shows CARES ITT effects on 12-month test passage of 3.4 to 5.7 percent-age points under these assumptions. These effects are large relative to the control group sample mean passage rates of 10 percent to 18 percent.
0
20
40
60
80
100
120
0 1 2 3 4 5 6 7 8 9 10 11 12 13 14 15 16 17 18 19 20 21 22 23 24 25 26 27 28
Ave
rage
am
ount
dep
osite
d (in
pes
os)
Week of contract
Average amount deposited by CARES clients (weekly)
Passed urine test Did not pass urine test
0
0.1
0.2
0.3
0.4
0.5
0.6
0.7
0.8
0.9
1
0 1 2 3 4 5 6 7 8 9 10 11 12 13 14 15 16 17 18 19 20 21 22 23 24 25 26 27 28
Pro
port
ion
of c
lient
s th
at m
ade
a de
posi
t
Week of contract
Proportion of CARES clients that made a deposit (weekly)
Passed urine test Did not pass urine test
Figure 1
Figure 2
VOL. 2 nO. 4 227GIné ET AL.: puT YOuR MOnEY WhERE YOuR BuTT IS
We do not find any significant effects from the cue cards. Field interviews one year later suggest that this may be driven at least in part by low attention to the cards. Fewer than half of those in the cue card group reached for an interview remembered the cards and knew where they were, and only about 5 percent reported still using them to manage cravings.
V. Conclusion
We designed a commitment product to help people quit smoking and tested it in cooperation with Green Bank using a randomized controlled trial in the Philippines.
The results suggest that CARES helps smokers quit. At the end of the commit-ment contract period (6 months), subjects offered a CARES contract were 3.3 to 5.8 percentage points more likely to pass a urine test for short-term smoking ces-sation than the control group, and after 12-months (our preferred specification),
Table 5—Impact of CARES on Passing Urine Test One Year Later (OLS, intent-to-treat estimates)
Assumption:
Everyone that did not take the test
continues smoking
Drop if did not
take the test
Everyone that was found but refused
to take the test still smokes
(1) (2) (3) (4) (5) (6)panel A. With baseline covariatesCARES treatment 0.035** 0.035* 0.057** 0.055* 0.054** 0.054**
(0.018) (0.018) (0.028) (0.028) (0.027) (0.027)Cue cards 0.009 0.008 0.019 0.018 0.019 0.018
(0.016) (0.016) (0.026) (0.026) (0.025) (0.025)
F-test p-value: CARES = Cues 0.142 0.142 0.184 0.197 0.194 0.193R2 0.057 0.05 0.083 0.077 0.081 0.077
panel B. dropping baseline covariatesCARES treatment 0.034* 0.034* 0.053* 0.050* 0.050* 0.047*
(0.018) (0.018) (0.028) (0.029) (0.027) (0.027)Cue cards 0.006 0.005 0.015 0.014 0.015 0.014
(0.017) (0.017) (0.027) (0.027) (0.026) (0.026)
F-test p-value: CARES = Cues 0.103 0.109 0.191 0.225 0.200 0.228
R2 0.004 0.003 0.006 0.005 0.006 0.005
Observations 2,000 1,859 1,161 1,103 1,218 1,155
Mean of dependent variable 0.089 0.089 0.147 0.147 0.140 0.140
Omits no-deposit-collection treatment group No Yes No Yes No Yes
Sampling weights No No Yes Yes Yes Yes
notes: All regressions control for the three waves of marketing. Baseline covariates include all independent vari-ables from take-up regressions in Table 3. Models estimated in columns 3–6 are weighted to reflect the different likelihood of a subject taking a urine test between CARES clients and nonclients and across CARES, cues, and con-trol groups. Robust standard errors in parentheses.
*** Significant at the 1 percent level. ** Significant at the 5 percent level. * Significant at the 10 percent level.

228 AMERICAn ECOnOMIC JOuRnAL: AppLIEd ECOnOMICS OCTOBER 2010
the effects were 3.4 to 5.7 percentage points. From simple analysis of counts of successes and failures, 29 of the 83 who took-up passed at 6 months and 54 failed. Of the 29 who passed the 6-month test, 14 then passed (and 15 failed) the 12-month test, whereas, of the 54 who failed at 6 months, only 7 then passed at 12 months (and 47 failed).
These results suggest that the CARES product is an effective treatment for smok-ing cessation. We do not know of any comparable trials on other treatments in the Philippines, but the CARES treatment effects compare favorably to those found for nicotine replacement therapy in randomized controlled trials in other settings (Stead et al. 2008). The CARES take-up rate (11 percent) also compares well to nicotine replacement therapy (Bansal et al. 2004; Rommel Tipones and Lenora Fernandez 2006), which is notable given the novelty of the CARES product. Presumably com-mitment contract take-up rates could increase if familiarity, trust, and information about the product builds. If so, commitment contracts could help public health efforts to address the “under-use” of smoking cessation treatments (Vilma E. Cokkinides et al. 2005; C. Tracy Orleans 2007).
Rough calculations suggest that CARES could pass a social cost-benefit test. We estimate CARES’ cost per quit by instrumenting for CARES take up, with the CARES offer, to get treatment-on-the-treated estimates. This instrumental variables strategy is plagued by the possibility that the CARES offer itself may influence quit behavior among those who are offered, but do not take the product (i.e., the instrument may not satisfy the exclusion restriction). It is also imperative to recognize the heterogeneity in take up. In an extreme case, for example, the 11 percent that took up may be the only people for which this would work, and thus one cannot extrapolate the treatment-on-the-treated estimates to the general population. The right answer is likely somewhere in the middle. A product launched on a larger scale, that benefits from social influence and overcomes potential trust issues, could work for more than the 11 percent that took it up in this pilot test, but clearly would not be appropriate for 100 percent of smokers.
With those cautions in mind, our smallest treatment-on-the-treated point estimate implies a cost per quit of $700 in purchasing-power-parity- (PPP)adjusted terms.23 The typical estimates of the (social) benefits of smoking cessation are considerably larger than that cost, e.g., the US Center for Disease Control and Prevention (2002) reports that employers alone benefit $3,400 per quit-year from increased productiv-ity and reduced health care costs. Many studies also find large annual benefits to former smokers from health improvements and increases in quality-adjusted years of life. So even if CARES merely helps people quit sooner (as suggested by two of the three open-ended interviews with CARES clients in the Appendix), its benefits may still be substantial. And, of course, the commitment contract provider may earn benefits as well. In the implementation studied here, Green Bank earned a spread on deposits and public relations benefits. In other implementations contract providers might cover costs from forfeited balances, fees, and/or from advertising.
23 We first estimate per client cost by inflating Green Bank’s per account costs for acquisition (marketing) and administration (deposit collection, urine testing) by the ratio of per capita, PPP-adjusted gross domestic product (GDP) for the United States versus the Philippines. Then we get the per quit cost by inflating per client cost by the inverse of our lowest estimate for the 12-month treatment-on-the-treated effect (i.e., we inflate by 1/0.31).

VOL. 2 nO. 4 229GIné ET AL.: puT YOuR MOnEY WhERE YOuR BuTT IS
Nevertheless the majority of CARES clients in our study failed to quit, suggesting that there is still much to be done in improving the effectiveness of smoking cessa-tion treatments. In particular, it remains to be seen whether and how our results will generalize to other populations, or to other behaviors relevant for models of time-inconsistency (e.g., weight loss; exercise; task management; or consumption, more generally). Both empirics and theory provide some guidance in how to think about external validity. The 11 percent take-up rate for CARES implies that our average treatment effects mask important heterogeneity in treatment effects across differ-ent consumer “types.” Clearly our average positive treatment effect should not be driven by time-consistent individuals, who should have no demand for commitment devices. Nor do our results apply directly to time-inconsistent individuals who plan to quit, but are “naïve” about their self-control problems, and, hence, incorrectly believe that they will quit without a change in incentives. Rather, it seems likely that our results are driven by a subset of smokers, with time-inconsistent preferences, who are (partly) sophisticated about their self-control problems.24 The evidence that CARES take up may be higher among smokers who said that they tried to avoid situ-ations that make them want to smoke (Table 1 panel B; Table 3) is consistent with (partial) sophisticates driving take up, since avoiding situations can be viewed as a form of (nonbinding) commitment device. Identifying more about heterogeneity in preferences and sophistication is a critical direction for future research.
A closely related line of inquiry for future research is testing whether commit-ment contracts complement or substitute for other smoking cessation treatments. Bundling commitment devices with other treatments that impart awareness or sophistication (e.g., information on how difficult it is to quit) might benefit naïve consumers. Sophisticated consumers might benefit from binding commitments to adhere to nicotine replacement or other therapies. Binding commitments may not even be necessary for some consumers if the salience of “this account holds the money I’ve saved from not buying cigarettes” is what drives cessation.
Another closely related and open empirical question is the optimal design of an anti-smoking commitment contract.25 To highlight just one aspect of product design, note that in our study CARES was largely bundled with deposit collection services. Hence, we cannot yet unpack how much of the treatment effect was due to the financial commitment, and how much was due to frequent contact with the deposit collector. Important sub-questions on the role of deposit collection include whether and how much in-person contact with contract administrators is necessary for the commitment to be effective (e.g., it may be the case that deposit collection is important simply for convenience), and that direct deposit or mobile banking will be efficient substitutes in some settings. Alternately, contact with the deposit collector may be an integral part of the commitment per se (e.g., by permitting a commitment
24 Interestingly, in two of the three open-ended interviews reported in the Appendix, successful CARES clients did not attribute their lasting smoking cessation to CARES. Instead, they perceived themselves as having been ready at the time to stop, and although CARES was the impetus, they believed they would have stopped at some point anyhow.
25 For theories of optimal contracting with consumption commitments, see, e.g., DellaVigna and Ulrike Malmendier (2004), and Kfir Eliaz and Ran Spiegler (2006).
230 AMERICAn ECOnOMIC JOuRnAL: AppLIEd ECOnOMICS OCTOBER 2010
to not embarrass oneself by smelling of smoke), and/or a mechanism for making the commitment to quit salient.26
Research on what drives take-up decisions offers the potential for addressing many of the above questions in an integrated framework. If behavioral biases, such as loss aversion, partial naïveté, projection bias, and/or over-optimism play a role, then there may be implications for product design (e.g., strong defaults) and market-ing (e.g., framing, information on failure rates). Moreover this would suggest that consumer “type” is malleable, and that large treatment-on-the-treated effects could be achieved broadly.
Strong interplay between theory and empirics, and continued experimentation on product design (such as that found in Duflo, Kremer, and Robinson 2009), will be needed to unpack the mechanisms through which commitment contracts work, and what contracting issues will be encountered as markets for such devices develop.
Appendix Summaries of Three Open-Ended Follow-up Interviews
Below are summaries of three interviews of individuals enrolled in CARES. Interviews were completed with no structured survey instrument, in August of 2009, three years after the CARES product was offered.
Male.—Enrolled in CARES, succeeded at the six-month deadline, and thus received his funds back. He still does not smoke. He said he had tried to quit before CARES using candies (i.e., have a candy whenever you have a craving), but failed. He said of those attempts, “I wasn’t really serious.” Initially he signed up for CARES because his wife had cancer and he wanted to use the commitment sav-ings component to save up for medicine. Eventually his wife died and he misplaced his CARES savings box, but he still keeps some secret savings in his house. He has noticed some health benefits since he quit smoking, most notably an increased appetite. He doesn’t talk to his friends about CARES or about quitting because he “doesn’t want to interfere with their decisions.” His wife and his friends used to hassle him about quitting, but he says: “You can’t do it for anyone else. You must do it for yourself.” He claims he was ready to quit, and the CARES account offer came at the right time, but that he believes he would have eventually stopped anyhow.
Female.—Enrolled in CARES, succeeded at the six-month deadline, and thus received her funds back. She still does not smoke. Had been smoking on and off for 25 years prior to CARES. Most recently had quit for two years from 1998 to 2000 (i.e., six years before the CARES account), when she was compelled to quit because she had a kidney infection. When asked why she started up again in 2000,
26 Anthony Rodgers et al. (2005) present results from a field experiment where some subjects seeking to quit were sent regular, customized text messages containing information, support, distraction, and credits for outgoing text messages to friends and family to generate social support. They find no effect on self-reported smoking status 26 weeks after the onset of treatment if nonresponders are assumed to be smoking. On smoking status as measured by urine tests, they have only a small sample of six-week results that do not permit strong inference on treatment effects.
VOL. 2 nO. 4 231GIné ET AL.: puT YOuR MOnEY WhERE YOuR BuTT IS
she said she was just sitting around doing nothing after a meal, and it dawned on her she wanted a cigarette. She started smoking again, plateauing at about six ciga-rettes a day for the next six years. She enrolled in CARES because she wanted to try quitting again. She thinks it worked because she saw her savings increase and was encouraged. She believed that the reminder effect of having collectors come to pick up savings regularly contributed to her success. She said she was ready to quit (again) and that CARES was offered at a good time. She believes she would have eventually quit on her own. Since quitting with CARES she convinced her husband to quit (just by asking him to do so).
Female.—Enrolled in CARES, passed the six-month mark and received her money back, and stayed off cigarettes for one year (long enough and effectively enough to recover her savings). But soon after the one year mark, she relapsed. She now smokes about 20 cigarettes a day. She works in a go-go bar, so she is constantly surrounded by smoke, and her customers and co-workers are always offering her free cigarettes. While the program was ongoing she was able to resist these temptations for fear of losing her savings, but that incentive disappeared when the program ended. If CARES were offered to her today, she’s not sure whether she’d sign up. She does tentatively plan to quit in the next year, but “there are so many temptations.”
Table A1—Summary Statistics on Six-Month Smoking Cessation, by Marketing Wave (Same as Table 2, except with 6-month instead of 12-month cessation)
CARES Group
CARES Cues Controlt-test of (1) vs. (3)
t-test of (2) vs. (3) Took up
Did not take-up
t-test of (6) vs. (7)
(1) (2) (3) (4) (5) (6) (7) (8)
panel C. Outcome measures, full sample, six month—wave 3 (Ampayon)Found by surveyor for 0.711 0.722 0.742 0.257 0.462 0.531 0.730 0.003 follow-up measurement (0.020) (0.019) (0.019) (0.072) (0.021)
Agreed to take urine test, 0.959 0.982 0.977 0.158 0.639 0.923 0.962 0.339 conditional on being found (0.010) (0.007) (0.008) (0.053) (0.010)
Found and agreed to test 0.682 0.709 0.725 0.124 0.560 0.490 0.702 0.002 urine test (0.021) (0.020) (0.019) (0.072) (0.021)
Passed urine test (omitted 0.168 0.147 0.127 0.120 0.420 0.583 0.138 0.000 missing respondents) (0.020) (0.018) (0.017) (0.103) (0.019)
Passed urine test (assumes all 0.115 0.104 0.092 0.237 0.504 0.286 0.097 0.000 respondents who did not take the test are smokers)
(0.014) (0.013) (0.013) (0.065) (0.014)
Passed urine test (assumes all 0.161 0.145 0.124 0.148 0.406 0.538 0.132 0.000 respondents who were found but refused the test are smokers)
(0.019) (0.018) (0.017) (0.100) (0.018)
Number of CARES accountsObservations 515 536 531 49 466
note: Standard errors are in parentheses.

232 AMERICAn ECOnOMIC JOuRnAL: AppLIEd ECOnOMICS OCTOBER 2010
Table A3—Impact of CARES on Passing Urine Test One Year Later (Same as Table 5, except using probit instead of OLS probit, intent-to-treat estimates)
Everyone that did not take the test
continues smokingDrop if did
not take the test
Everyone that was found but refused
to take the test still smokes
Assumption: (1) (2) (3) (4) (5) (6)CARES treatment 0.033* 0.035* 0.059** 0.058* 0.055** 0.056**
(0.017) (0.018) (0.029) (0.030) (0.028) (0.028)Cue cards 0.009 0.009 0.020 0.020 0.020 0.020
(0.017) (0.017) (0.029) (0.029) (0.028) (0.027)
Observations 1,989 1,849 1,155 1,097 1,212 1,149
F-test p-value: CARES = Cues 0.140 0.127 0.178 0.189 0.192 0.189
Mean of dependent variable 0.089 0.089 0.147 0.147 0.140 0.140
Omits no-deposit-collection treatment group No Yes No Yes No Yes
Sampling weights No No Yes Yes Yes Yes
notes: All probits control for the three waves of marketing and include covariates (all independent variables from take-up regressions in Table 3). Models estimated in columns 3–6 are weighted to reflect the different likelihood of a subject taking a urine test between CARES clients and non-clients and across CARES, cues, and control groups. The sample size decreases here versus OLS because indicator variables for a small number of missing baseline sur-vey responses perfectly predict failure in test results. Marginal effects with robust standard errors are in parentheses.
*** Significant at the 1 percent level. ** Significant at the 5 percent level. * Significant at the 10 percent level.
Table A2—Impact of CARES on Six-Month Test Passage (Same as Table 5, except outcome = 6-month test passage instead of 12-month)
Everyone that did not take the test
continues smokingDrop if did
not take the test
Everyone that was found but refused to
take the test still smokes
Assumption: (1) (2) (3) (4) (5) (6)CARES treatment 0.033* 0.037** 0.058** 0.068** 0.041* 0.051**
(0.017) (0.018) (0.026) (0.026) (0.024) (0.025)Cue cards 0.015 0.015 0.022 0.022 0.021 0.021
(0.016) (0.016) (0.024) (0.024) (0.023) (0.023)
Observations 2,000 1,859 1,226 1,199 1,287 1,255
F-test p-value: CARES = Cues 0.302 0.220 0.162 0.086 0.408 0.234
R2 0.048 0.047 0.068 0.075 0.056 0.061
Mean of dependent variable 0.083 0.083 0.123 0.123 0.119 0.119
Omits no-deposit-collection treatment group No Yes No Yes No Yes
Sampling weights No No Yes Yes Yes Yes
notes: All regressions control for the three waves of marketing and include covariates (all independent variables from take-up regressions in Table 3). Models estimated in columns 3–6 are weighted to reflect the different likeli-hood of a subject taking a urine test between CARES clients and nonclients and across CARES, cues, and control groups. Robust standard errors are in parentheses.
*** Significant at the 1 percent level. ** Significant at the 5 percent level. * Significant at the 10 percent level.

VOL. 2 nO. 4 233GIné ET AL.: puT YOuR MOnEY WhERE YOuR BuTT IS
REFERENCES
Ariely, Dan, and Klaus Wertenbroch. 2002. “Procrastination, Deadlines, and Performance: Self-Con-trol by Precommitment.” psychological Science, 13(3): 219–24.
Ashraf, Nava, Dean Karlan, and Wesley Yin. 2006a. “Deposit Collectors.” B. E. Journal of Economic Analysis and policy: Advances in Economic Analysis and policy, 6(2): Article 5.
Ashraf, Nava, Dean Karlan, and Wesley Yin. 2006b. “Tying Odysseus to the Mast: Evidence from a Com-mitment Savings Product in the Philippines.” Quarterly Journal of Economics, 121(2): 635–72.
Bansal, Maansi A., Michael Cummings, Andrew Hyland, and Gary A. Giovino. 2004. “Stop-Smoking Medications: Who Uses Them, Who Misuses Them, and Who is Misinformed About Them?” nico-tine & Tobacco Research, 6(S3): S303–10.
Becker, Gary S., Michael Grossman, and Kevin M. Murphy. 1991. “Rational Addiction and the Effect of Price on Consumption.” American Economic Review, 81(2): 237–41.
Becker, Gary S., and Kevin M. Murphy. 1988. “A Theory of Rational Addiction.” Journal of political Economy, 96(4): 675–700.
Benowitz, Neal L., Peyton Jacob, Karen Ahijevych, Martin J. Jarvis, Sharon Hall, Jacques LeHouezec, Anna Hansson, et al. 2002. “Biochemical Verification of Tobacco Use and Cessation.” nicotine & Tobacco Research, 4(2): 149–59.
Bernheim, B. Douglas, and Antonio Rangel. 2004. “Addiction and Cue-Triggered Decision Processes.” American Economic Review, 94(5): 1558–90.
Bowers, Thomas G., Richard A. Winett, and Lee W. Frederiksen. 1987. “Nicotine Fading, Behavioral Contracting, and Extended Treatment: Effects on Smoking Cessation.” Addictive Behaviors, 12(2): 181–84.
Bryan, Gharad, Dean Karlan, and Scott Nelson. 2009. “Commitment Devices.” Unpublished. Centers for Disease Control and Prevention. 2002. “Annual Smoking-Attributable Mortality, Years of
Potential Life Lost, and Economic Costs––United States, 1995–1999.” Morbidity and Mortality Weekly Report, 51(14): 300–303.
Charness, Gary, and Uri Gneezy. 2009. “Incentives to Exercise.” Econometrica, 77(3): 909–31.
Table A4—Impact of CARES on Passing Urine Test One Year Later (Same as Table 5, except on subsample reporting in baseline that want to stop smoking at
some point in life OLS, intent-to-treat estimates)
Everyone that did not take the test
continues smokingDrop if did
not take the test
Everyone that was found but refused to
take the test continues smoking
Assumption: (1) (2) (3) (4) (5) (6)CARES treatment 0.034 0.033 0.064* 0.059* 0.058* 0.055
(0.021) (0.022) (0.035) (0.035) (0.033) (0.034)Cue cards −0.001 −0.001 0.006 0.005 0.004 0.004
(0.020) (0.020) (0.032) (0.032) (0.031) (0.031)
Observations 1,434 1,331 824 780 865 817
F-test p-value: CARES = Cues 0.094 0.110 0.102 0.132 0.111 0.130
R2 0.066 0.060 0.100 0.091 0.097 0.089
Mean of dependent variable 0.099 0.099 0.161 0.161 0.155 0.155
Omits no-deposit-collection treatment group No Yes No Yes No Yes
Sampling weights No No Yes Yes Yes Yes
notes: All regressions control for the three waves of marketing and include covariates (all independent variables from take-up regressions in Table 3). Models estimated in columns 3–6 are weighted to reflect the different likeli-hood of a subject taking a urine test between CARES clients and nonclients and across CARES, cues, and control groups. Robust standard errors are in parentheses.
*** Significant at the 1 percent level. ** Significant at the 5 percent level. * Significant at the 10 percent level.

234 AMERICAn ECOnOMIC JOuRnAL: AppLIEd ECOnOMICS OCTOBER 2010
Cokkinides, Vilma E., Elizabeth Ward, Abmedin Jemal, and Michael J. Thun. 2005. “Under-Use of Smoking Cessation Treatments: Results from the National Health Interview Survey, 2000.” Ameri-can Journal of preventive Medicine, 28(1): 119–22.
Dallery, Jesse, Steven Meredith, and Irene M. Glenn. 2008. “A Deposit Contract Method to Deliver Abstinence Reinforcement for Cigarette Smoking.” Journal of Applied Behavior Analysis, 41(4): 609–15.
DellaVigna, Stefano. 2009. “Psychology and Economics: Evidence from the Field.” Journal of Eco-nomic Literature, 47(2): 315–72.
DellaVigna, Stefano, and Ulrike Malmendier. 2004. “Contract Design and Self-Control: Theory and Evidence.” Quarterly Journal of Economics, 119(2): 353–402.
DiClemente, Carlo C., James O. Prochaska, Scott K. Fairhurst, Wayne F. Velicer, Mary M. Velasquez, and Joseph S. Rossi. 1991. “The Process of Smoking Cessation: An Analysis of Precontemplation, Contemplation, and Preparation Stages of Change.” Journal of Consulting and Clinical psychol-ogy, 59(2): 295–304.
Duflo, Esther, Michael Kremer, and Jonathan Robinson. 2009. “Nudging Farmers to Utilize Fertilizer: Theory and Experimental Evidence from Kenya.” Bureau for Research and Economic Analysis Development (BREAD) Working Paper 233.
Eliaz, Kfir, and Ran Spiegler. 2006. “Contracting with Diversely Naive Agents.” Review of Economic Studies, 73(3): 689–714.
Fudenberg, Drew, and David K. Levine. 2006. “A Dual-Self Model of Impulse Control.” American Economic Review, 96(5): 1449–76.
Gruber, Jonathan, and Botond Koszegi. 2001. “Is Addiction ‘Rational’? Theory and Evidence.” Quar-terly Journal of Economics, 116(4): 1261–1303.
Gul, Faruk, and Wolfgang Pesendorfer. 2001. “Temptation and Self-Control.” Econometrica, 69(6): 1403–35.
Gul, Faruk, and Wolfgang Pesendorfer. 2004. “Self-Control and the Theory of Consumption.” Econo-metrica, 72(1): 119–58.
Gul, Faruk, and Wolfgang Pesendorfer. 2007. “Harmful Addiction.” Review of Economic Studies, 74(1): 147–72.
Hoek, Janet, and Philip Gendall. 2005. “Pictorial Health Warnings: A Review of Research Evidence.” New Zealand Ministry of Health Report. April.
Hymowtiz, Norman, K. Michael Cummings, Andrew Hyland, William R. Lynn, Terry F. Pechacek, and Tyler D. Hartwell. 1997. “Predictors of Smoking Cessation in a Cohort of Adult Smokers Followed for Five Years.” Tobacco Control, 6(S2): S57–62.
Kast, Felipe, and Dina Pomeranz. 2009. “Peers as a Savings Commitment Device: Evidence from a Field Experiment among Low-Income Micro-Entrepreneurs in Chile.” www.sociedadpoliticaspub-licas.cl/.../Felipe_Kast_Peers_as_a_saving_commintment_device.pdf.
Laibson, David. 1997. “Golden Eggs and Hyperbolic Discounting.” Quarterly Journal of Economics, 112(2): 443–77.
Laibson, David. 2001. “A Cue-Theory of Consumption.” Quarterly Journal of Economics, 116(1): 81–119.
Lando, Harry A. 1977. “Successful Treatment of Smokers with a Broad-Spectrum Behavioral Approach.” Journal of Consulting and Clinical psychology, 45(3): 361–66.
O’Donoghue, Ted, and Matthew Rabin. 1999. “Doing It Now or Later.” American Economic Review, 89(1): 103–24.
O’Donoghue, Ted, and Matthew Rabin. 2001. “Choice and Procrastination.” Quarterly Journal of Eco-nomics, 116(1): 121–60.
O’Donoghue, Ted, and Matthew Rabin. 2002. “Addiction and Present-Biased Preferences.” http://www.arts.cornell.edu/econ/edo1/addicts.PDF.
Orleans, C. Tracy. 2007. “Increasing the Demand for and Use of Effective Smoking Cessation Treat-ments: Reaping the Full Health Benefits of Tobacco-Control Science and Policy Gains—In Our Lifetime.” American Journal of preventive Medicine, 33(6S): S340–48.
Paxton, Roger. 1980. “The Effects of a Deposit Contract as a Component in a Behavioural Programme for Stopping Smoking.” Behaviour Research and Therapy, 18(1): 45–50.
Paxton, Roger. 1981. “Deposit Contracts with Smokers: Varying Frequency and Amount of Repay-ments.” Behaviour Research and Therapy, 19(2): 117–23.
Paxton, Roger. 1983. “Prolonging the Effects of Deposit Contracts with Smokers.” Behaviour Research and Therapy, 21(4): 425–33.
Phelps, Edmund S., and Robert A. Pollak. 1968. “On Second-Best National Savings and Game-Equi-librium Growth.” Review of Economic Studies, 35(2): 185–99.

VOL. 2 nO. 4 235GIné ET AL.: puT YOuR MOnEY WhERE YOuR BuTT IS
Rodgers, Anthony, Tim Corbett, Dale Bramley, Tania Riddell, Mary Wills, Ruey-Bin Lin, and Mark Jones. 2005. “Do u smoke after txt? Results of a Randomised Trial of Smoking Cessation Using Mobile Phone Text Messaging.” Tobacco Control, 14(4): 255–61.
Song, Fujian, James Raftery, Paul Aveyard, Chris Hyde, Pelham Barton, and Nerys Woolacott. 2002. “Cost-Effectiveness of Pharmacological Interventions for Smoking Cessation: A Literature Review and a Decision Analytic Analysis.” Medical decision Making, 22(S1): S26–37.
Stead, Lindsay F., Rafael Perera, Chris Bullen, David Mant, and Tim Lancaster. 2008. “Nicotine Replacement Therapy for Smoking Cessation.” Cochrane database of Systematic Reviews, 1.
Strotz, Robert H. 1955. “Myopia and Inconsistency in Dynamic Utility Maximization.” Review of Eco-nomic Studies, 23(3): 165–80.
Thaler, Richard H., and Shlomo Benartzi. 2004. “Save More Tomorrow: Using Behavioral Economics to Increase Employee Saving.” Journal of political Economy, 112(1): S164–87.
Tipones, Rommel, and Lenora Fernandez. 2006. “Predictors of Smoking Cessation 1 Year After Enrollment in a Smoking Cessation Program in a Tertiary Hospital.” philippine Journal of Internal Medicine, 44: 7–12.
Volpp, Kevin G., Andrea Gurmankin Levy, David A. Asch, Jesse A. Berlin, John J. Murphy, Angela Gomez, Harold Sox, Jingsan Zhu, and Caryn Lerman. 2006. “A Randomized Controlled Trial of Financial Incentives for Smoking Cessation.” Cancer Epidemiology, Biomarkers & prevention, 15(1): 12–18.
Volpp, Kevin G., Leslie K. John, Andrea B. Troxel, Laurie Norton, Jennifer Fassbender, and George Loewenstein. 2008a. “Financial Incentive-Based Approaches for Weight Loss: A Randomized Trial.” Journal of the American Medical Association, 300(22): 2631–37.
Volpp, Kevin G., George Loewenstein, Andrea B. Troxel, Jalpa Doshi, Maureen Price, Mitchell Laskin, and Stephen E. Kimmel. 2008b. “A Test of Financial Incentives to Improve Warfarin Adherence.” Unpublished.
Volpp, Kevin G., Andrea B. Troxel, Mark V. Pauly, Henry A. Glick, Andrea Puig, David A. Asch, Rob-ert Galvin, et al. 2009. “A Randomized, Controlled Trial of Financial Incentives for Smoking Ces-sation.” new England Journal of Medicine, 360(7): 699–709.
Winnet, Richard. 1973. “Parameters of Deposit Contracts in the Modification of Smoking.” psycho-logical Record, 23(1): 49–60.