Pushing the Innovation Envelope: Strategies for Boosting Productivity and ROI - Kenneth Kaitin,...
40
Pushing the Innovation Envelope Kenneth I Kaitin, PhD Professor and Director Tufts Center for the Study of Drug Development Evolution Summit 2015 Las Vegas, NV, September 20, 2015 Strategies for Boosting Productivity and ROI
-
Upload
marcus-evans -
Category
Business
-
view
1.051 -
download
0
Transcript of Pushing the Innovation Envelope: Strategies for Boosting Productivity and ROI - Kenneth Kaitin,...

Pushing the Innovation Envelope
Kenneth I Kaitin, PhD Professor and Director
Tufts Center for the Study of Drug Development
Evolution Summit 2015 Las Vegas, NV, September 20, 2015
Strategies for Boosting Productivity and ROI

Agenda
• Environment for pharmaceu1cal R&D
• CSDD’s current drug development metrics
• New models of bioinnova1on

The Current Landscape for Pharma Innova6on
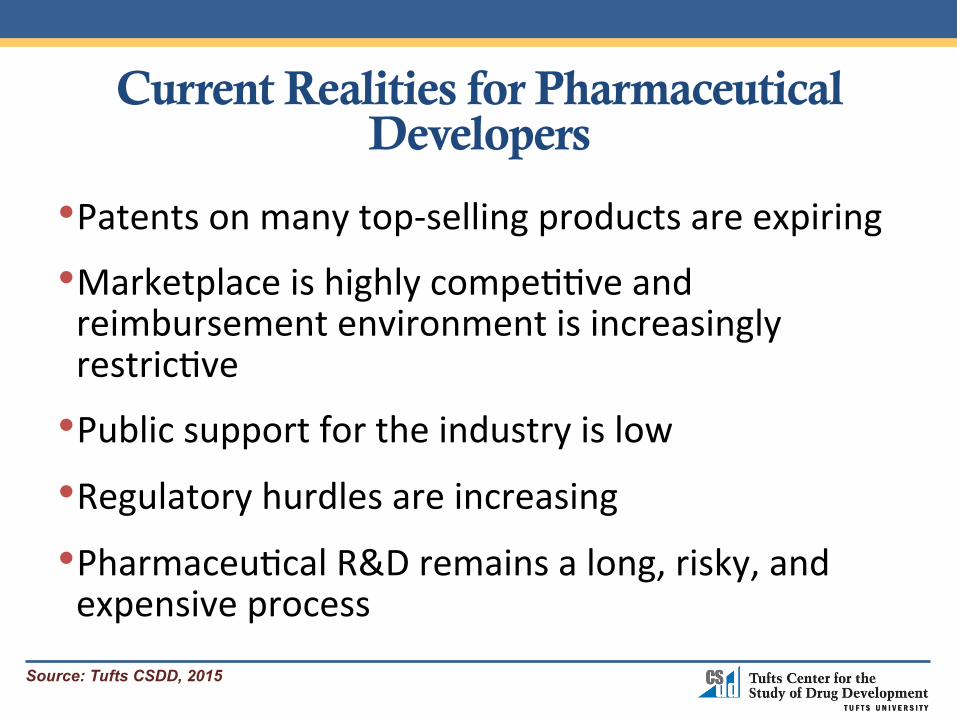
Current Realities for Pharmaceutical Developers
• Patents on many top-‐selling products are expiring
• Marketplace is highly compe11ve and reimbursement environment is increasingly restric1ve
• Public support for the industry is low • Regulatory hurdles are increasing • Pharmaceu1cal R&D remains a long, risky, and expensive process
Source: Tufts CSDD, 2015
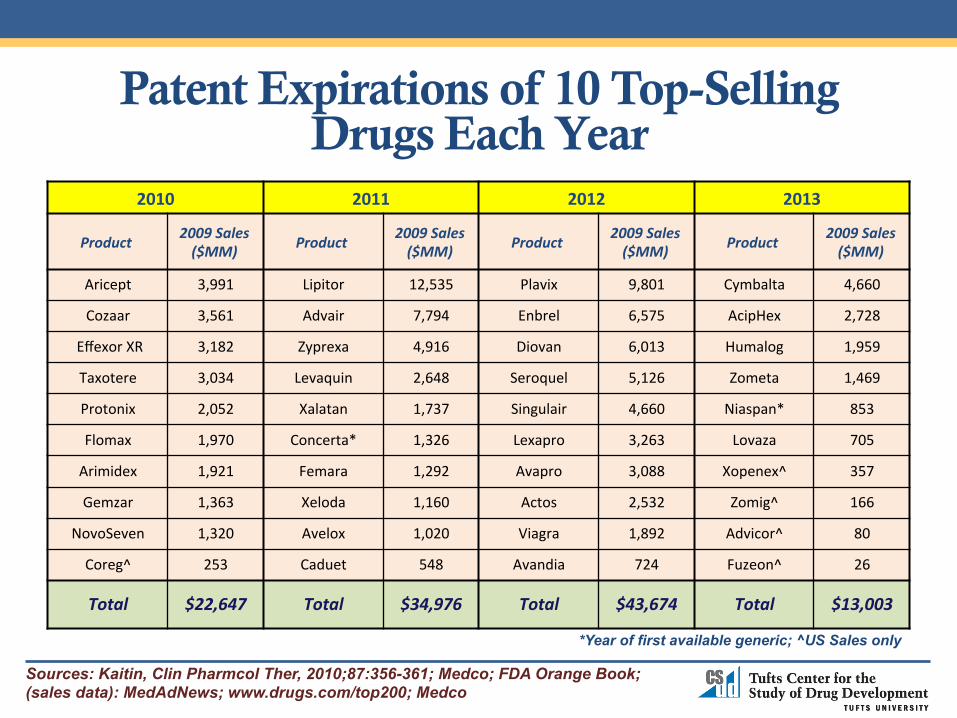
Patent Expirations of 10 Top-Selling Drugs Each Year
2010 2011 2012 2013
Product 2009 Sales ($MM) Product 2009 Sales
($MM) Product 2009 Sales ($MM) Product 2009 Sales
($MM)
Aricept 3,991 Lipitor 12,535 Plavix 9,801 Cymbalta 4,660
Cozaar 3,561 Advair 7,794 Enbrel 6,575 AcipHex 2,728
Effexor XR 3,182 Zyprexa 4,916 Diovan 6,013 Humalog 1,959
Taxotere 3,034 Levaquin 2,648 Seroquel 5,126 Zometa 1,469
Protonix 2,052 Xalatan 1,737 Singulair 4,660 Niaspan* 853
Flomax 1,970 Concerta* 1,326 Lexapro 3,263 Lovaza 705
Arimidex 1,921 Femara 1,292 Avapro 3,088 Xopenex^ 357
Gemzar 1,363 Xeloda 1,160 Actos 2,532 Zomig^ 166
NovoSeven 1,320 Avelox 1,020 Viagra 1,892 Advicor^ 80
Coreg^ 253 Caduet 548 Avandia 724 Fuzeon^ 26
Total $22,647 Total $34,976 Total $43,674 Total $13,003
Sources: Kaitin, Clin Pharmcol Ther, 2010;87:356-361; Medco; FDA Orange Book; (sales data): MedAdNews; www.drugs.com/top200; Medco
*Year of first available generic; ^US Sales only
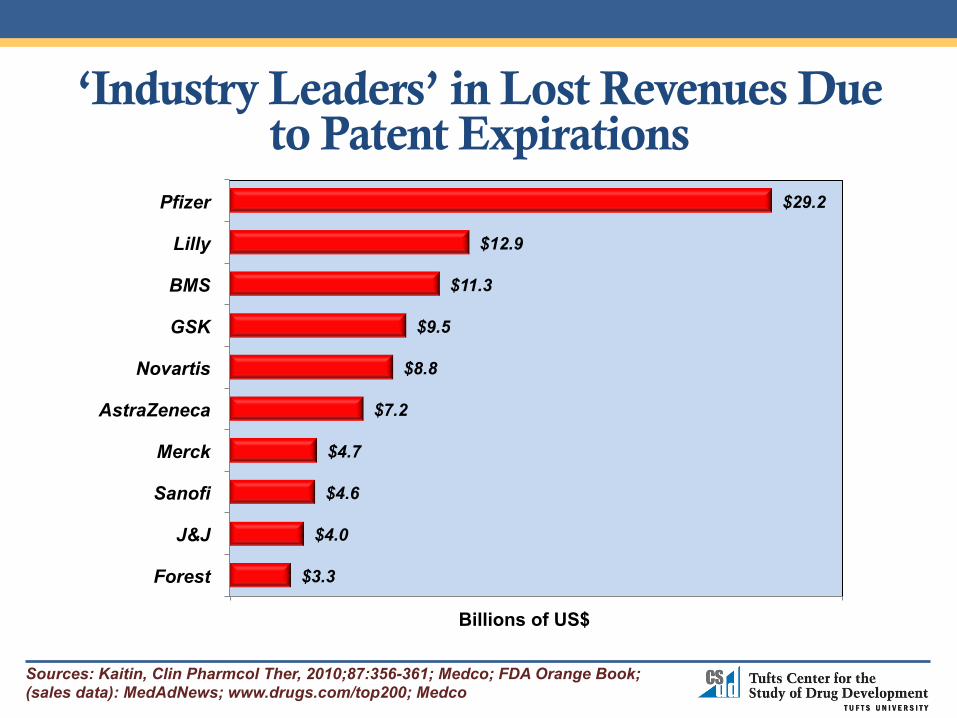
‘Industry Leaders’ in Lost Revenues Due to Patent Expirations
$3.3
$4.0
$4.6
$4.7
$7.2
$8.8
$9.5
$11.3
$12.9
$29.2
Forest
J&J
Sanofi
Merck
AstraZeneca
Novartis
GSK
BMS
Lilly
Pfizer
Billions of US$
Sources: Kaitin, Clin Pharmcol Ther, 2010;87:356-361; Medco; FDA Orange Book; (sales data): MedAdNews; www.drugs.com/top200; Medco

Blockbuster Patent Expirations, 2014-16 Year Brand Generic Company Indication Sales
($BB)*
2014 Nexium Esomeprazole Astra Zeneca GERD 4.5
Cymbalta Duloxitine Eli Lilly Depression, anxiety, nerve pain 4.2
Symbicort Budesonide/Formoterol Astra Zeneca Asthma, COPD 3.1
Celebrex Celecoxib Pfizer Arthritis, acute pain 2.5
Evista Raloxifine Eli Lilly Osteoporosis 1.4
Sandostatin Octreotide Novartis Acromegaly syndrome 1.4
Actonel Risedronate Warner Chilcott Osteoporosis 1.1
2015 Abilify Aripiprazole Otsuka Schizophrenia, bipolar disorder 5.2
Gleevec Imatinib mesylate Novartis Chronic myeloid leukemia (CML) 4.7
Copaxone Glatiramer Teva Multiple sclerosis 3.6
Namenda Memantine Forest Alzheimer's disease 1.4
Zyvox Linezolid Pfizer Antiviral 1.3
Prezista Darunavir Janssen HIV 1.3
Provigil Modofinil Teva Excessive sleepiness 1.2
Avodart Dutasteride GlaxoSmithkline Benign prostatic hyperplasia (BPH) 1.2
Combivent Albuterol/Ipratropium Boehringer Ingelheim COPD 1.1
2016 Crestor Rosuvastatin calcium Astra Zeneca Hypercholesterolemia 7.1
Benicar Olmesartan medoxomil Daiichi Sankyo Hypertension 2.6
Source: EvaluateGroup.com, 2014 * 2011 Global Sales
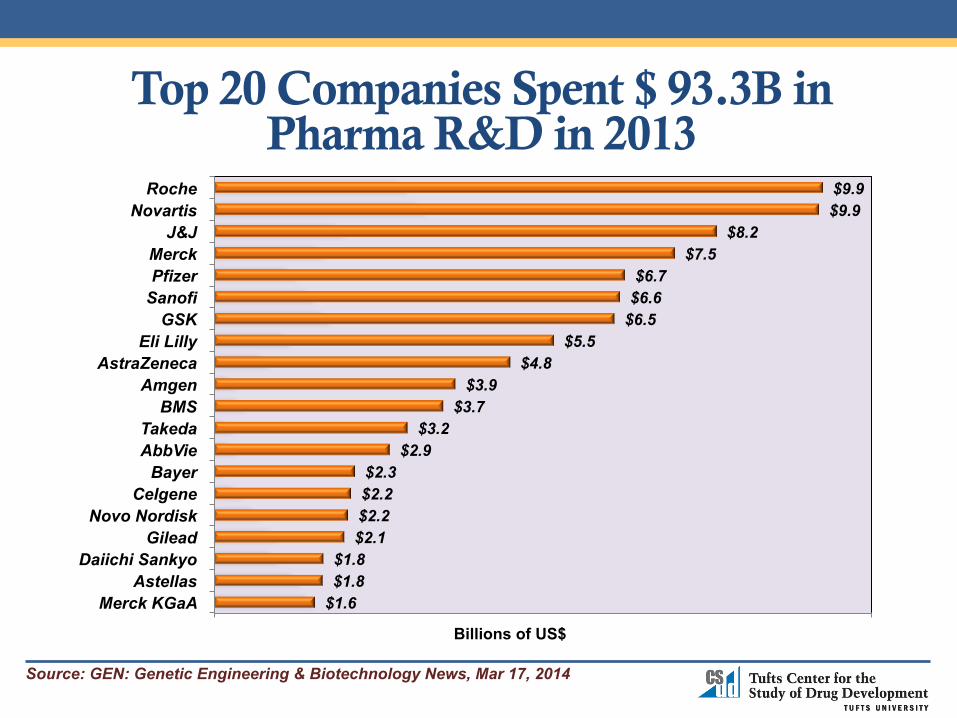
Top 20 Companies Spent $ 93.3B in Pharma R&D in 2013
$1.6 $1.8 $1.8
$2.1 $2.2 $2.2 $2.3
$2.9 $3.2
$3.7 $3.9
$4.8 $5.5
$6.5 $6.6 $6.7
$7.5 $8.2
$9.9 $9.9
Merck KGaA Astellas
Daiichi Sankyo Gilead
Novo Nordisk Celgene
Bayer AbbVie Takeda
BMS Amgen
AstraZeneca Eli Lilly
GSK Sanofi Pfizer Merck
J&J Novartis
Roche
Billions of US$
Source: GEN: Genetic Engineering & Biotechnology News, Mar 17, 2014

Source: Tufts CSDD, 2015; R&D expenditures from PhRMA
New Drug and Biologic Approvals Are Not Keeping Pace with Rising R&D Costs
0
14
28
42
56
0
14
28
42
56
1963 1966 1969 1972 1975 1978 1981 1984 1987 1990 1993 1996 1999 2002 2005 2008 2011 2014
R&
D Expenditures
(Billions of 2013$)
NM
E/N
BE
App
rova
ls
* Trend line is 3-year moving average; R&D expenditure adjusted for inflation
R&D Expenditures
New Approvals
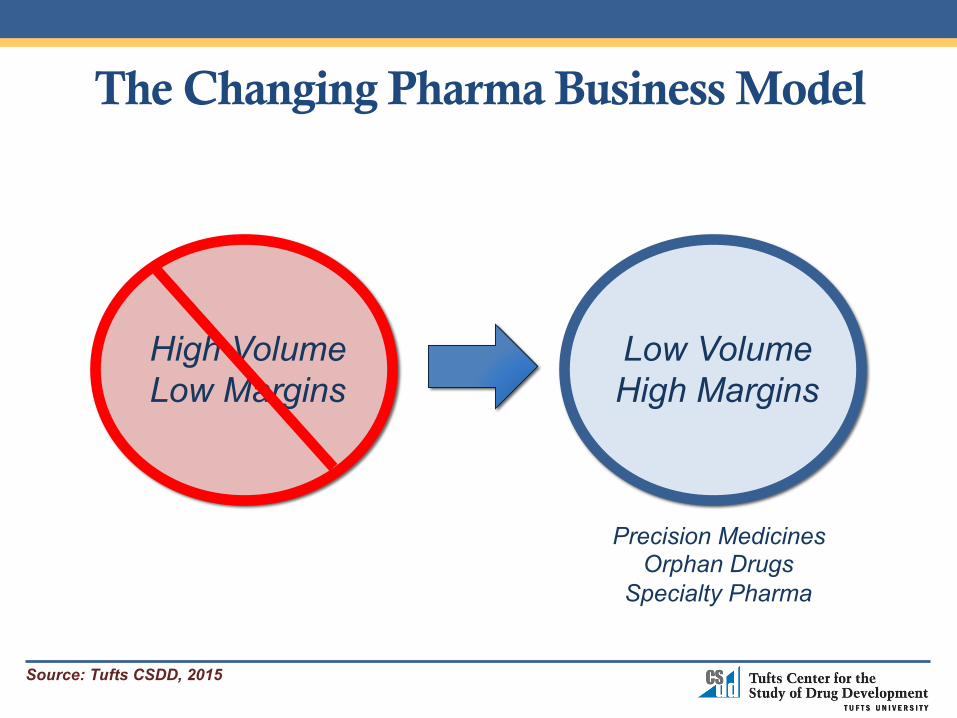
The Changing Pharma Business Model
Source: Tufts CSDD, 2015
High Volume Low Margins
Low Volume High Margins
Precision Medicines Orphan Drugs
Specialty Pharma
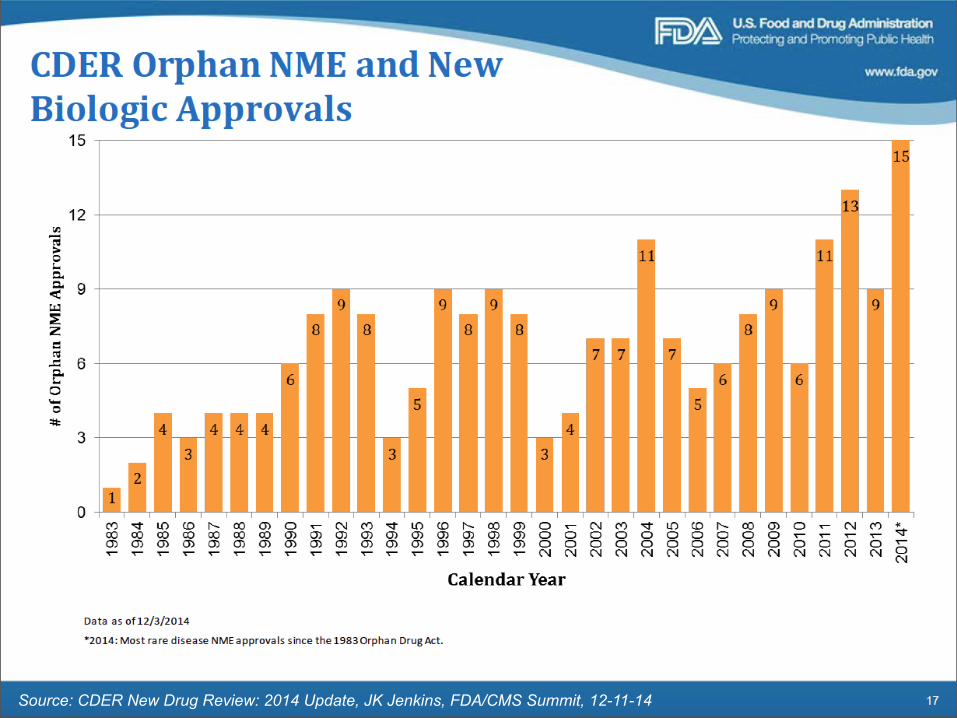
Source: CDER New Drug Review: 2014 Update, JK Jenkins, FDA/CMS Summit, 12-11-14
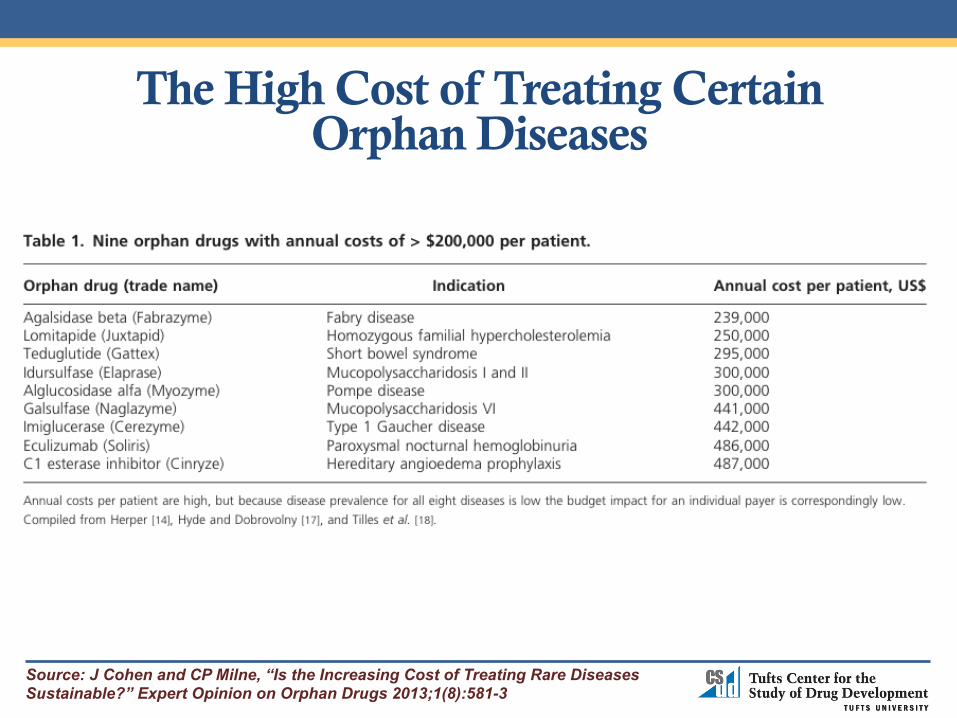
The High Cost of Treating Certain Orphan Diseases
Source: J Cohen and CP Milne, “Is the Increasing Cost of Treating Rare Diseases Sustainable?” Expert Opinion on Orphan Drugs 2013;1(8):581-3


Bringing a New Drug to Market: Current TuNs CSDD Drug Development Metrics

Source: Tufts CSDD, 2015
0 10
AIDS Antiviral
Anti-infective*
Immunologic
Cardiovascular
Antineoplastic
Gastrointestinal
Endocrine
Respiratory
CNS
5.9
6.0
7.4
7.4
7.5
7.7
7.8
8.3
8.7
0.9
0.8
1.2
1.6
0.6
0.9
1.0
1.6
1.0
Years
Clinical Phase Approval Phase
Clinical and Approval Times Vary Across Therapeutic Classes, 2010-14
* Anti-infective excludes AIDS antivirals
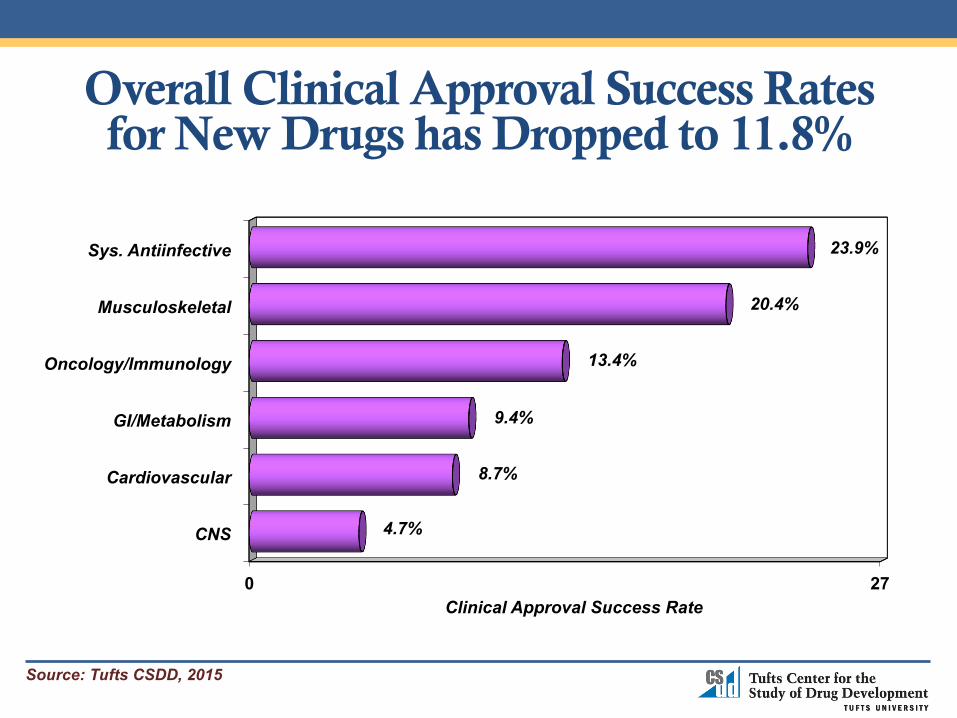
Overall Clinical Approval Success Rates for New Drugs has Dropped to 11.8%
0 27
CNS
Cardiovascular
GI/Metabolism
Oncology/Immunology
Musculoskeletal
Sys. Antiinfective
4.7%
8.7%
9.4%
13.4%
20.4%
23.9%
Clinical Approval Success Rate
Source: Tufts CSDD, 2015


72%
35%
80%
71%
49%
55%
68%
35%
50%
63%
32%
64% 60%
33%
46%
58% 52%
79%
0
100
Phase 1-2 Phase 2-3 Phase 3-Subm
Tran
sitio
n Pr
obab
ility
Musculoskeletal Onc/Immunologic GI/Metabolic Cardiovascular CNS Syst Antiinfective
Phase Transition Probabilities by Therapeutic Class
Source: DiMasi et al, Clin Pharmacol Ther, 2010;87:272-277
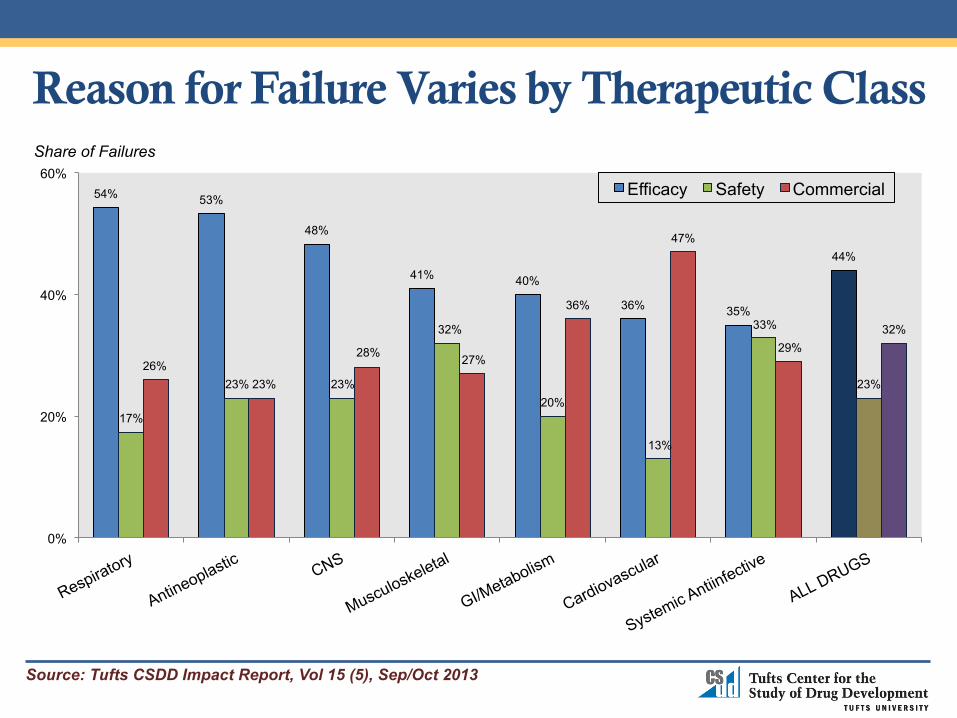
54% 53%
48%
41% 40%
36% 35%
44%
17%
23% 23%
32%
20%
13%
33%
23% 26%
23%
28% 27%
36%
47%
29% 32%
0%
20%
40%
60% Efficacy Safety Commercial
Share of Failures
Source: Tufts CSDD Impact Report, Vol 15 (5), Sep/Oct 2013
Reason for Failure Varies by Therapeutic Class
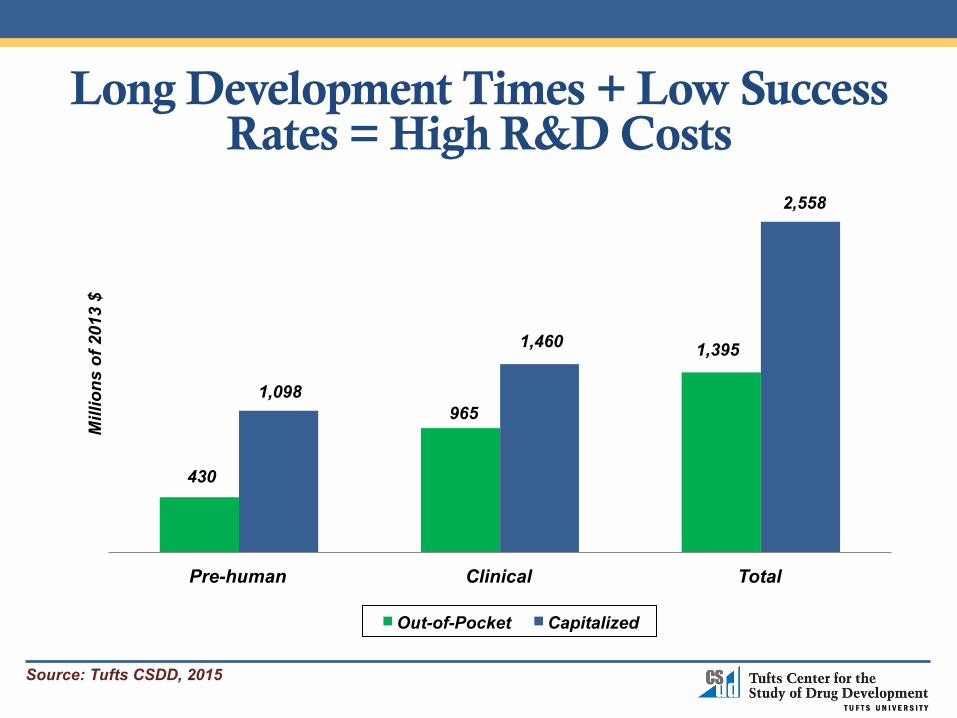
Long Development Times + Low Success Rates = High R&D Costs
Source: Tufts CSDD, 2015
430
965
1,395
1,098
1,460
2,558
Pre-human Clinical Total
Mill
ions
of 2
013
$
Out-of-Pocket Capitalized
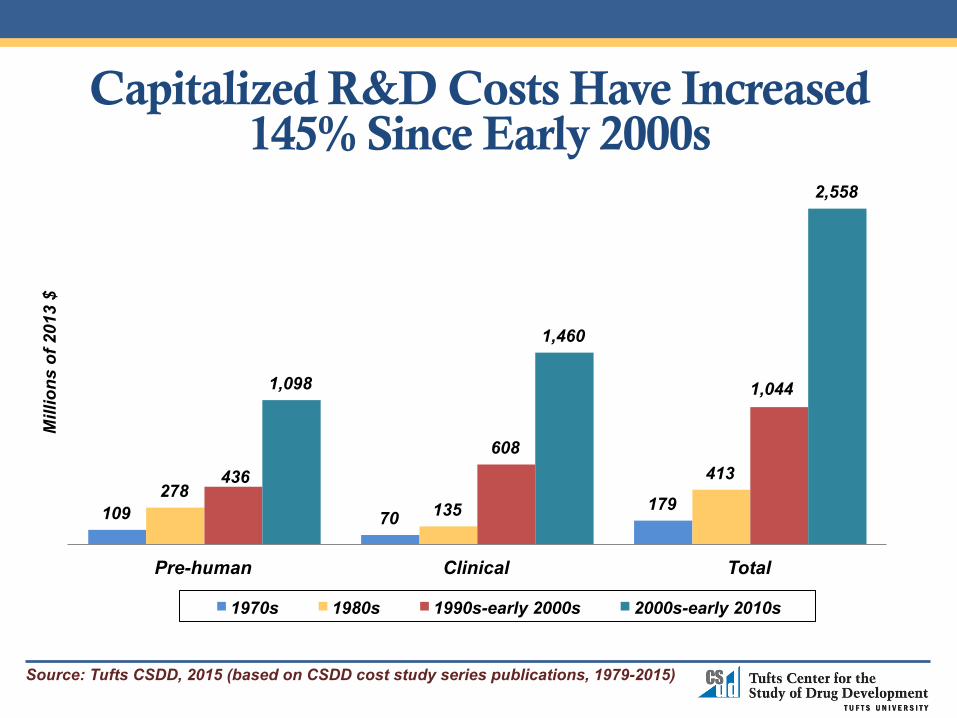
Capitalized R&D Costs Have Increased 145% Since Early 2000s
Source: Tufts CSDD, 2015 (based on CSDD cost study series publications, 1979-2015)
109 70 179
278 135
413 436 608
1,044 1,098
1,460
2,558
Pre-human Clinical Total
Mill
ions
of 2
013
$
1970s 1980s 1990s-early 2000s 2000s-early 2010s

Source: Tufts CSDD, 2015

Drivers of High Development Costs
• Poor preclinical screens and predic1ve models • Chronic and complex indica1ons • Clinical trial size • Pa1ent recruitment/reten1on • Increased protocol complexity • Regulatory demands • Commercial demands
Source: Tufts CSDD, 2015

Typical Phase III Protocol 2002 2012
Scientific Total Number of Endpoints 7 13
Total Number of Procedures 106 167
Total Number of Eligibility Criteria 31 50
Average Number of Major Amendments 2.3 3.6
Proportion of ‘Non-Core’ Procedures 18% 31%
Operating Total Number of Countries 11 34
Total Number of Investigative Sites 124 196
Total Number of Patients Randomized 729 597
Total Number of Data Points Collected 494,236 929,203
Increase over Plan Timeline to Reach LPLV 28% 73%
Protocol Complexity is Increasing
Source: Tufts CSDD, 2015; *Medidata Solutions

Source: Tufts CSDD, 2015
Portfolio Decision-Making Grid
Oncology
CNS
Cardiovascular
Infectious Disease
Medical Need
Competitive Landscape
Technical Challenge
Exploitable Science

Compounds in Development by Therapeutic Area: Oncology Leads
Source: EvaluatePharma® (3 May 2012)
Oncology 31%
Systemic Intiinfectives 15%
Central Nervous System 14%
Cardiovascular 7%
Musculoskeletal 5%
Endocrine 5%
Gastrointestinal 4%
Respiratory 4%
Dermatology 3%
Sensory Organs 3%
Genito-Urinary 3% Blood 3%
Other 4%

Trends in New Drug and Biologics Approvals Within Four Largest Therapeutic Class
Source: Tufts CSDD, 2015
0% 10% 20% 30% 40% 50% 60% 70%
2010-13
2000-09
1990-99
1980-89
Share of US New Drug Approvals
Anti-infective* Antineoplastic Cardiovascular CNS
* Anti-infective excludes AIDS antivirals

Source: Tufts CSDD, 2015
How to Stimulate Innovation in Areas with High Medical Need but Low Investment
Appeal and/or High Technical Risk
• Legisla1ve and regulatory push/pull ini1a1ves, such as BTD, priority vouchers and market exclusivity
• Establish public support by making disease area a na1onal priority: e.g., “War on Cancer”, AIDS, Ebola, White House BRAIN Ini1a1ve
• Invest in basic research • Foster strategic partnerships and integrated alliances
The Bioinnova6on Landscape is Changing

Strategies Driving Development Performance
1990-1999 2000-2009 2010-present
Operating Changes
• Project Management
• Procurement/Cost-containment
• Globalization • Downsizing/
Consolidation
• Downsizing and Consolidation
• Flexible and virtual workplaces
Alliances • M&As • Public-private
partnerships • Transactional
Outsourcing
• M&As • In-Licensing and
Joint Ventures • Functional
service outsourcing
• M&As • In-Licensing, JVs • Public-private
partnerships • Precompetitive
alliances • Integrated outsourcing
Technologies • Rapid screening • Combinatorial
chemistry • EDC and IVRS
• -Omics • eClinical Trial
Solutions (e.g., CTMS)
• Platform technologies • Companion
diagnostics • Integrated Big Data • Social media • Mobile health
Source: Tufts CSDD, 2015

Transforming R&D Strategy: Innovation Partnerships
u Academic-Industry: (‘upstream/TR focus’) e.g., PFEs-CTIs; J&J Innovation Centers, LLY-Lilly Innovation Fellowship Awards; ADDCs
u Multi-Stakeholder Consortia and PPPs: e.g., ADNI (26 partners); Enlight Biosciences (8 cos); TransCelerate BioPharma (18); IMI; MS Outcome Assessments Consortium; Coalition Against Major Diseases (CAMD)
u Outsourcing providers: (virtual) LLY-Chorus; (functional) LLY-Covance/Advion; BMS-Accenture; AZN-(API)
u Patient groups: e.g., VRTX-CFF; Breast Cancer Alliance; Lupus Foundation; Michael J. Fox Foundation
u Payer-Industry
u VC partnerships
u Open innovation and Crowdsourcing: e.g., LLY-Open Innovation Drug Discovery; Transparency Life Sciences
Source: Tufts CSDD, 2015
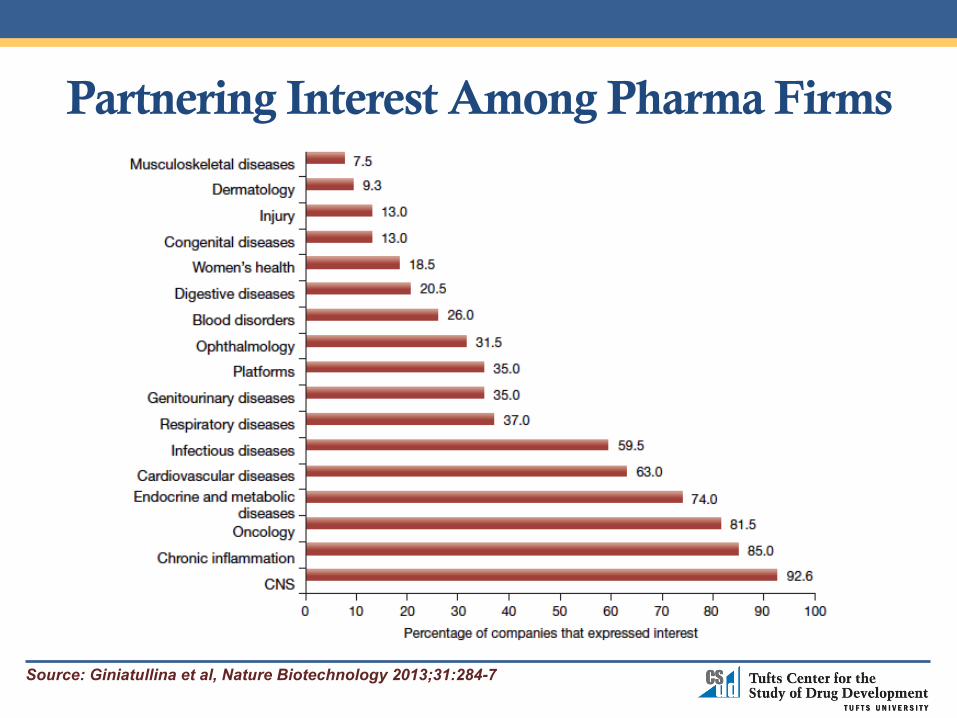
Source: Giniatullina et al, Nature Biotechnology 2013;31:284-7
Partnering Interest Among Pharma Firms
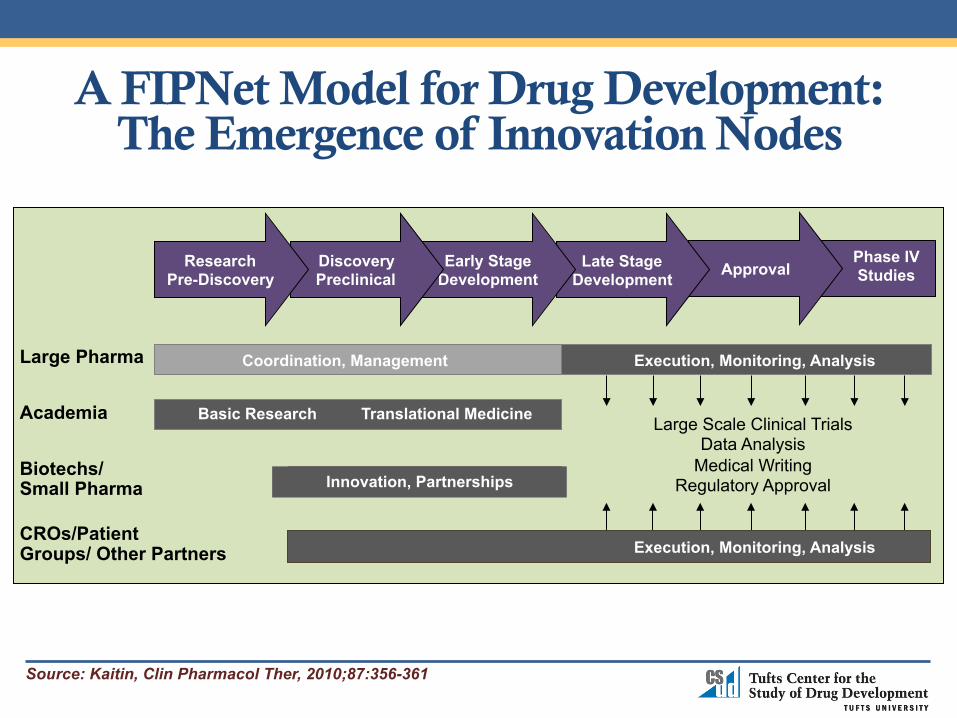
A FIPNet Model for Drug Development: The Emergence of Innovation Nodes
Phase IV Studies Approval Late Stage
Development Early Stage
Development Discovery Preclinical
Research Pre-Discovery
Large Pharma Academia
Biotechs/ Small Pharma CROs/Patient Groups/ Other Partners
Basic Research Translational Medicine
Execution, Monitoring, Analysis
Innovation, Partnerships
Coordination, Management Execution, Monitoring, Analysis
Large Scale Clinical Trials Data Analysis
Medical Writing Regulatory Approval
Source: Kaitin, Clin Pharmacol Ther, 2010;87:356-361

Source: Tufts CSDD, 2015
Lupus
Innovation Nodes: 21st Century Bioinnovation
Type 2 Diabetes
Alzheimer’s Disease Accelerating Medicines
Partnerships
Government • NIH • FDA
Founda6ons • American Diabetes Assoc • Alzheimers Assoc • Founda1on of NIH • Geoffrey Bean Founda1on • Lupus Founda1on of America
• Rheumatology Research Founda1on
• USAgainstAlzheimers
Companies • Abbvie • BiogenIdec • BMS • GSK • J&J
• Eli Lilly • Merck • Pfizer • Sanofi • Takeda
Rheumatoid Arthritis

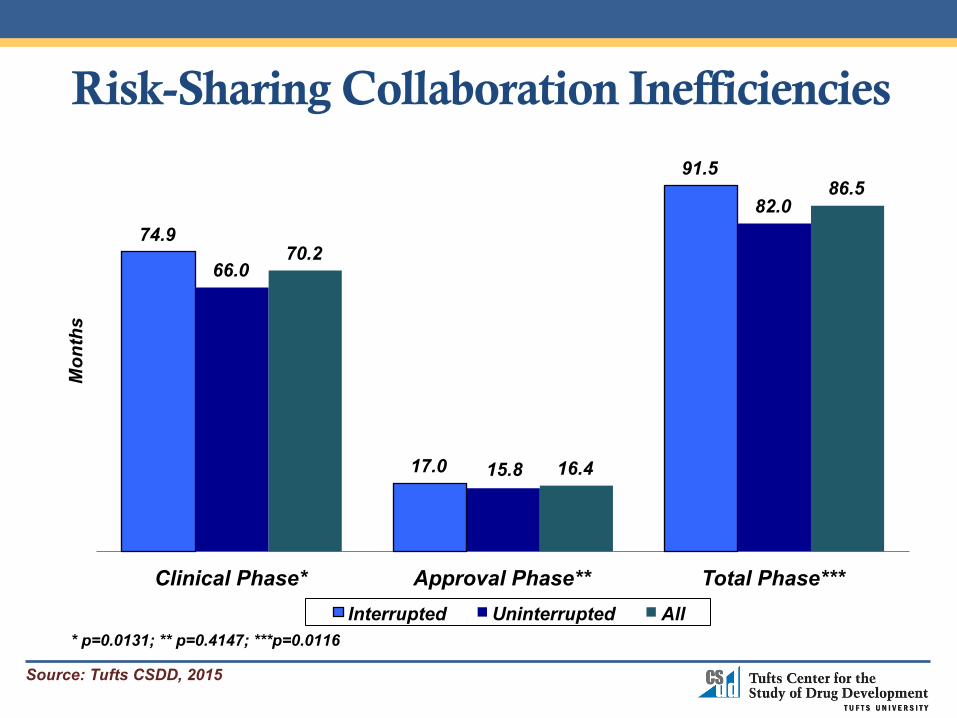
Risk-Sharing Collaboration Inefficiencies
Source: Tufts CSDD, 2015
74.9
17.0
91.5
66.0
15.8
82.0
70.2
16.4
86.5
Clinical Phase* Approval Phase** Total Phase***
Mon
ths
Interrupted Uninterrupted All * p=0.0131; ** p=0.4147; ***p=0.0116

Characteristics of Top-Performing Strategic Partnerships
Source: Tufts CSDD, 2015
• High level of partner specializa1on • Shared governance and opera1ng risk • Integrated systems, SOPs, processes
• Sophis1cated planning and coordina1on • More efficient interac1ons
• Faster engagement
• Innova1ve ideas

Bottom Line: Integrated strategic partnerships allow stakeholders to spread risk and leverage knowledge and resources, offering the best hope of finding new treatments for many unmet medical needs.
Source: Tufts CSDD, 2015

Tufts Center for the Study of Drug Development Tufts University, Boston, Massachusetts, USA
Email [email protected]
Website http://csdd.tufts.edu
Kenneth I Kaitin, PhD Professor and Director Tufts University School of Medicine

For more information about theFor more information about the marcus evans Pharma
S it iSummits series: [email protected]