Pushing Economy and Propulsion Technique of … PHYSICAL ACTIVITY QUARTERLY, 1998.15.36-50 O 1998...
15
ADAPTED PHYSICAL ACTIVITY QUARTERLY, 1998.15.36-50 O 1998 Human Kinetics Publishers, Inc. Pushing Economy and Propulsion Technique of Wheelchair Racers at Three Speeds Victoria L. Goosey Ian G. Campbell Manchester Metropolitan University Staffordshire University Pushing economy and wheelchair propulsion technique were examined for 8 wheelchair racers on amotorized treadmill at 6.0,6.5, and 7.0 d s. Kinematic data for the sagittal view were collected by a video camera for two-dimen- sional analysis. Adaptations to speed changes occurred, initially by a decrease in cycle time and an increase in cycle rate, and later by an increase in the flexion of the elbow. At each speed there were large variations in pushing economy between individuals. The relationship between pushing economy and selected kinematic variables revealed that at 6.0,6.5, and 7.0 d s, economy was associated with (a) the lighter athletes (r = 39, 36, .83), (b) a greater range of elbow movement (r = -35, -.65, -.63), and (c) a lower push rate (r = .73, 31, .63), respectively. Effects of lesion level and wheelchair design may be more important in explaining differences in pushing economy than differ- ences in propulsion technique. Morgan, Martin, and Krahenbuhl(l989) have suggested that running economy (submaximal oxygen consumption) is a good predictor of long distance running per- formance, and changes in economy during running at a given speed are likely to lead to changes in performance (Cavanagh, 1990). Compared to the volume of studies on running economy, relatively few investigations have directly examined pushing economy. Pushing economy is defined as the energy cost (oxygen uptake) of wheel- chair propulsion at a constant fixed speed (Lakomy & Williams, 1996). It has been clearly shown that running economy is linked to the mechanics of running style (Bransford & Howley, 1977; Cavanagh, 1990; Cavanagh & Will- iams, 1982; Daniels, 1985;Morgan et al., 1989). For the wheelchair racer, far less research is available to provide insight into how variables related to propulsion mechanics affect pushing economy (Goosey, Campbell, & Fowler, 1996; Jones, Baldini, Cooper, Robertson, & Widman, 1992). Victoria L. Goosey is with the Department of Exercise and Sport Science at the Manchester Metropolitan University, Stoke-on-Trent, ST7 2HL, UK. Ian G. Campbell is with the Division of Sport, Health, and Exercise at Staffordshire University, Stoke-on-Trent, ST4 2DF, UK. 36
Transcript of Pushing Economy and Propulsion Technique of … PHYSICAL ACTIVITY QUARTERLY, 1998.15.36-50 O 1998...
ADAPTED PHYSICAL ACTIVITY QUARTERLY, 1998.15.36-50 O 1998 Human Kinetics Publishers, Inc.
Pushing Economy and Propulsion Technique of Wheelchair Racers
at Three Speeds
Victoria L. Goosey Ian G. Campbell Manchester Metropolitan University Staffordshire University
Pushing economy and wheelchair propulsion technique were examined for 8 wheelchair racers on amotorized treadmill at 6.0,6.5, and 7.0 d s . Kinematic data for the sagittal view were collected by a video camera for two-dimen- sional analysis. Adaptations to speed changes occurred, initially by a decrease in cycle time and an increase in cycle rate, and later by an increase in the flexion of the elbow. At each speed there were large variations in pushing economy between individuals. The relationship between pushing economy and selected kinematic variables revealed that at 6.0,6.5, and 7.0 d s , economy was associated with (a) the lighter athletes (r = 39, 36, .83), (b) a greater range of elbow movement (r = -35, -.65, -.63), and (c) a lower push rate (r = .73, 31, .63), respectively. Effects of lesion level and wheelchair design may be more important in explaining differences in pushing economy than differ- ences in propulsion technique.
Morgan, Martin, and Krahenbuhl(l989) have suggested that running economy (submaximal oxygen consumption) is a good predictor of long distance running per- formance, and changes in economy during running at a given speed are likely to lead to changes in performance (Cavanagh, 1990). Compared to the volume of studies on running economy, relatively few investigations have directly examined pushing economy. Pushing economy is defined as the energy cost (oxygen uptake) of wheel- chair propulsion at a constant fixed speed (Lakomy & Williams, 1996).
It has been clearly shown that running economy is linked to the mechanics of running style (Bransford & Howley, 1977; Cavanagh, 1990; Cavanagh & Will- iams, 1982; Daniels, 1985; Morgan et al., 1989). For the wheelchair racer, far less research is available to provide insight into how variables related to propulsion mechanics affect pushing economy (Goosey, Campbell, & Fowler, 1996; Jones, Baldini, Cooper, Robertson, & Widman, 1992).
Victoria L. Goosey is with the Department of Exercise and Sport Science at the Manchester Metropolitan University, Stoke-on-Trent, ST7 2HL, UK. Ian G. Campbell is with the Division of Sport, Health, and Exercise at Staffordshire University, Stoke-on-Trent, ST4 2DF, UK.
36
Pushing Economy and Propulsion Technique 37
Many researchers have examined wheelchair design features such as seat height, handrim size, and camber (Masse, Lamontagne, & O'Riain, 1992; Veeger, Woude, & Rozendal, 1988; Veeger, Woude, & Rozendal, 1989; Woude, Veeger, Rozendal, Ingen Schenau, Rooth, & Nierop, 1988). These variables that affect wheelchair propulsion style have an effect on the cardiorespiratory responses dur- ing wheelchair ergometry. For example, Woude and coworkers (1988) reported a 10% rise in VO, during wheelchair propulsion with large handrims of 0.56 m, compared with the smallest handrim size of 0.30 to 0.35 m. Veeger et al. (1988) also found that smaller handrims (0.31 m) are associated with reduced cardiores- piratory stress. Similar to findings of Woude and coworkers (1988), Veeger et al. (1988) reported a 10 to 15% difference in oxygen cost between the 0.31 m handrims and the 0.56 m handrims. It was also noted that, as the handrim increased in size, there was a significant effect on the movement pattern of the upper arm in both the sagittal and frontal planes of motion (Veeger et al., 1988; Woude et al., 1988). Both these studies employed a "Speedy Wheely" standard wheelchair at speeds ranging from 0.83 m/s to 4.17 m/s. In contrast, the typical race speeds reported at the 1995 World Athletics Championships in Sweden, for 800 m and 1500 m events ranged from 6.60 m/s to 7.60 m/s. Little information is available concerning pro- pulsion technique at these propulsion speeds, a problem that this study addresses.
More recently, both the physiological and biomechanical aspects of wheel- chair racers have been reported at realistic race speeds (Campbell, 1992; Campbell & Goosey, 1996; Goosey, Campbell, & Fowler, 1996; Jones et al., 1992; Lakomy et al., 1987; Wang, Deutsch, Morse, Hedrick, & Milikan, 1995). From a physi- ological perspective, Lakomy et al. (1987) found large variations between wheel- chair racers in pushing economy; this intraindividual variation was greater than that generally reported for running economy. Campbell (1992) stated that the dif- ferences found in pushing economy may partly be explained by differences in propulsion technique. From a biomechanical perspective, Wang et al. (1995) de- scribed the 3D kinematic patterns of wheelchair propulsion across four speed con- ditions, 90,70,50, and 30% of the peak speed for each subject. The speeds examined ranged from approximately 2.8 m/s to 8.3 m/s, but were different for each athlete. They concluded that, as speed increased, the drive phase was performed faster. The range of the push-angle remained constant, and greater forward lean also oc- curred. Wang et al. (1995), however, did not investigate cardiorespiratory responses.
The relationship between economy and specific descriptors of wheelchair propulsion in the racing population has been reported by only one group of re- searchers in the form of an abstract (Jones et al., 1992). These individuals exam- ined pushing economy and wheelchair propulsion technique at speeds up to 6.25 m/s in male wheelchair racers. Ten athletes were selected from 15 and divided into two groups, (5 most economical and 5 least economical). Jones et al. (1992) re- ported that the economical group (a) had less head and trunk velocity with more elbow and wrist velocity at the strike and release, (b) released the wheel with a straighter arm and higher wrist velocity, and (c) stroked less frequently with less time in contact with the rim. Thus, Jones et al. (1992) does provide some evidence that the mechanics of wheelchair propulsion influence oxygen consumption. How- ever, with so few studies in this area, there is a need to increase the understanding concerning pushing economy and propulsion technique of wheelchair racers. This may ultimately aid the performance of these athletes, as some researchers have suggested the importance of the relationship between pushing economy and en-
38 Goosey and Campbell
durance performance (Campbell, 1992; Campbell, Williams, & Lakomy, 1995; Cooper, 1992).
The purpose of the present study was (a) to describe kinematic patterns at a range of wheelchair propulsion speeds, (b) to examine pushing economy at a range of speeds, and (c) to determine relationships between wheelchair propulsion me- chanics and pushing economy.
Method
Subjects
Eight paraplegic wheelchair athletes (7 male and 1 female), aged 30 k 8 years with a body mass of 68.0 + 11.3 kg, volunteered to participate in this study, All athletes trained for and competed at a national level for endurance events, and six of the ath- letes competed at international level. The physical and physiological data of the ath- letes are shown in Table 1. The inclusion of the female athlete with the male athletes was based on the following assumptions: (a) that large variability in oxygen con- sumption exists between athletes at a given speed (Campbell, 1992), (b) large vari- ability in pushing techniques also exist between and within groups regardless of gender (Goosey, Campbell, & Fowler, 1997), (c) although senior male athletes outperform senior female athletes, there is great similarity between athletes of different gender in terms of the arm movement pattern (Goosey et al., 1997), and (d) the female (Subject 1) was an experienced and well-trained endurance athlete.
Exercise Test Protocol
Each athlete completed a five-stage incremental exercise that included speeds of 6.0, 6.5, and 7.0 mls at an incline of 0.7% on a motorized treadmill (Woodway ELG2; speed range 0 to 9.5 m/s; gradient range 0 to 22%) adapted for racing wheelchairs (Campbell & Williams, 1996; Goosey, Campbell, & Fowler, 1995). Each subject was fully familiarized with the testing procedures on the motorized treadmill, using his or her own racing chair.
The use of the athlete's own racing chair is an important issue when examining pushing economy and wheelchair propulsion techniques. Two major components are involved in wheelchair racing: the athlete and the chair. In reality the chair cannot be separated from the athlete; therefore, they should be considered as one integrated unit (Woude et al., 1992). Researchers have demonstrated that changes in wheelchair de- sign can influence energy costs (Woude, Veeger, & Rozendal, 1989). However, in our opinion, when a standardized chair is used in research, athletes may alter their wheel- ing style to adjust to a test chair. From a practical standpoint, racing wheelchairs and their components are determined largely by the athlete's personnel preference (Higgs, 1983). Through training, athletes become tuned to their own chair. Therefore, we believe that athletes should use their own racing chairs when participating in research. All wheelchairs were fitted with 0.70 m (diameter) spoked wheels with the handrirn sizes varying from 0.37 m to 0.39 m.
Technique Analysis
Tho-dimensional analysis was used; a stationary Panasonic F15 video camera was ed perpendicular to the treadmill and recorded the sagittal view. It was
Pushing Economy and Propulsion Technique 39
assumed that wheelchair propulsion movements of both upper extremities were symmetrical (Sanderson & Sommer, 1985; Wang et al. 1995). The left side of each athlete was analyzed, following the same method reported by Goosey et al. (1997). Each sequence was digitized manually at a sampling frequency of 50 Hz using an m-image video captive board interfaced with an Acorn Archimedes 440 rnicro- computer.
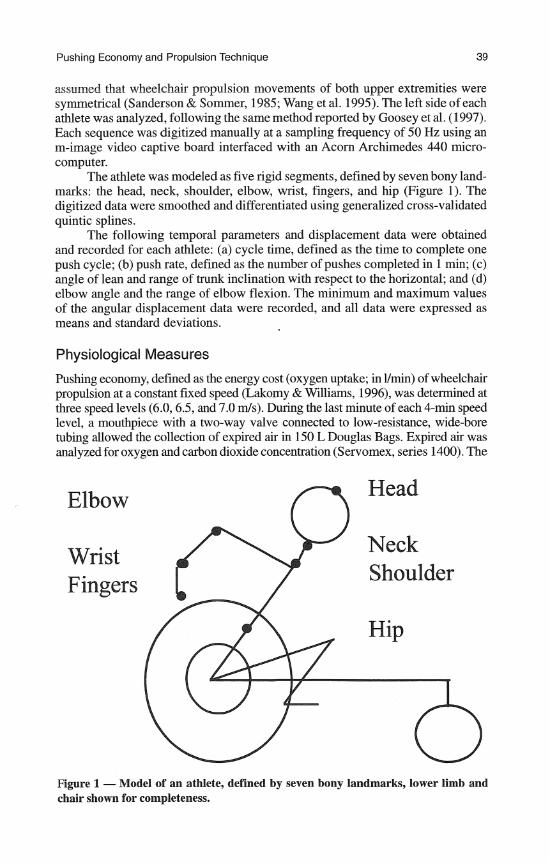
The athlete was modeled as five rigid segments, defined by seven bony land- marks: the head, neck, shoulder, elbow, wrist, fingers, and hip (Figure 1). The digitized data were smoothed and differentiated using generalized cross-validated quintic splines.
The following temporal parameters and displacement data were obtained and recorded for each athlete: (a) cycle time, defined as the time to complete one push cycle; (b) push rate, defined as the number of pushes completed in 1 min; (c) angle of lean and range of trunk inclination with respect to the horizontal; and (d) elbow angle and the range of elbow flexion. The minimum and maximum values of the angular displacement data were recorded, and all data were expressed as means and standard deviations.
Physiological Measures
Pushing economy, defined as the energy cost (oxygen uptake; in Vmin) of wheelchair propulsion at a constant fixed speed (Lakomy & Williams, 1996), was determined at three speed levels (6.0,6.5, and 7.0 mls). During the last minute of each 4-min speed level, a mouthpiece with a two-way valve connected to low-resistance, wide-bore tubing allowed the collection of expired air in 150 L Douglas Bags. Expired air was analyzed for oxygen and carbon dioxide concentration (Servomex, series 1400). The
Elbow
Wrist Fingers
Figure 1 - Model of an athlete, defined by seven bony landmarks, lower limb and chair shown for completeness.
40 Goosey and Campbell
analyzer had been calibrated using three calibration gases (0,, CO,, and nitrogen) of known concentrations. Expired ventilatory volume was determined using a Harvard dry gas meter calibrated against a Tissot spirometer.
Capillary blood samples were obtained from an ear lobe immediately after completing each exercise stage. The first drop of blood was discarded, and 25 rnl of this blood was collected in a heparinized capillary tube (Hawksley, UK). An automatic analyzer (YSI 1500 Sport; yellow springs) was used to assess blood lactate concentration. The analyzer was calibrated with known lactate standards at 5 mmoV1. Linearity throughout the operating range was checked with 15 mmol/l lactate standard.
Following the submaximal economy test, VO, peak was determined via a separate test using a continuous incremental ramp protocol. During this test, the speed of the treadmill remained constant and the treadmill gradient was increased at 3 min intervals. The treadmill speed selected for each sub-ject was based on the submaximal economy test. The validity and reliability of these meth- ods have been previously reported (Campbell, 1992; Campbell et al., 1995; Campbell & Williams, 1996).
Statistical Analysis
Kinematic Changes Across Speeds. The mean minimum and maximum val- ues of the selected parameters were analyzed by a one-way analysis of variance with repeated measures, using a level of significance of .05. Significant differ- ences were analyzed by performing a Tukey post hoc test in order to identify where the differences were located across the three speed levels.
Pushing Economy and Propulsion Technique. Several Pearson Product Moment correlations were employed to determine the association between push- ing economy (Vmin) and each kinematic variable at three common speeds (6.0, 6.5, and 7.0 m/s). A stepwise linear regression on VO, was employed to examine how much of the variance was accounted for by these kinematic variables.
Results
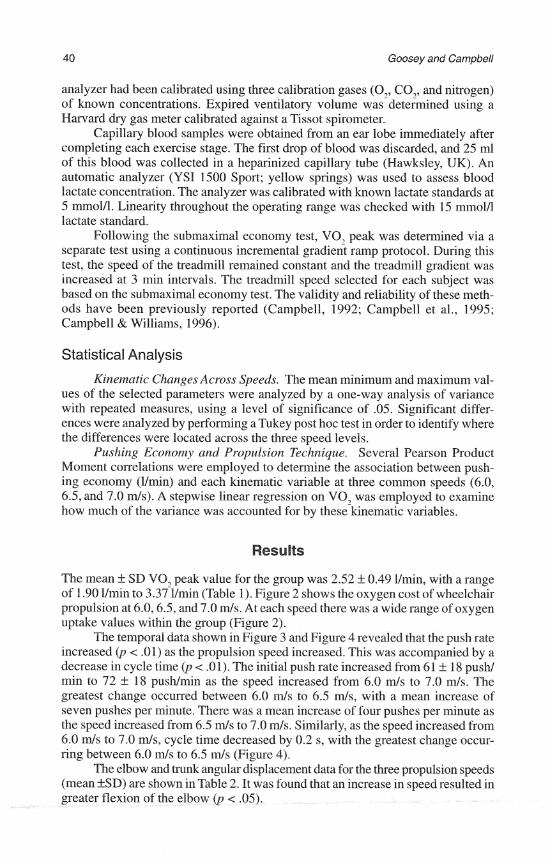
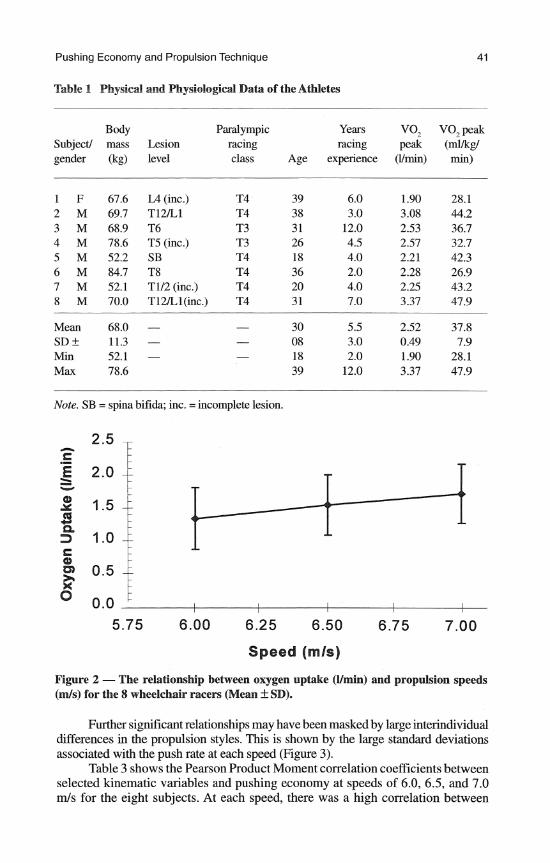
The mean f SD VO, peak value for the group was 2.52 f 0.49 Vmin, with a range of 1.90 llmin to 3.37 llmin (Table 1). Figure 2 shows the oxygen cost of wheelchair propulsion at 6.0,6.5, and 7.0 m/s. At each speed there was a wide range of oxygen uptake values within the group (Figure 2).
The temporal data shown in Figure 3 and Figure 4 revealed that the push rate increased (p < .01) as the propulsion speed increased. This was accompanied by a decrease in cycle time @ < .01). The initial push rate increased from 61 k 18 push/ min to 72 f 18 push/min as the speed increased from 6.0 m/s to 7.0 m/s. The greatest change occurred between 6.0 m/s to 6.5 m/s, with a mean increase of seven pushes per minute. There was a mean increase of four pushes per minute as the speed increased from 6.5 m/s to 7.0 m/s. Similarly, as the speed increased from 6.0 m/s to 7.0 m/s, cycle time decreased by 0.2 s, with the greatest change occur- ring between 6.0 m/s to 6.5 m/s (Figure 4).
The elbow and trunk angular displacement data for the three propulsion speeds (mean fSD) are shown in Table 2. It was found that an increase in speed resulted in greater flexion of the elbow (p < .05).
Pushing Economy and Propulsion Technique 41
Table 1 Physical and Physiological Data ofthe Athletes
Body Paralympic Years VOz V0,peak Subject1 mass Lesion racing racing peak (mVkg! gender (kg) level class Age experience (Urnin) min)
LA (inc.) T4 T12/Ll T4 T6 T3 T5 (inc.) T3 SB T4 T8 T4 T1/2 (inc.) T4 T12/Ll(inc.) T4
Mean 68.0 - - 30 5.5 2.52 37.8 SD+ 11.3 - - 08 3.0 0.49 7.9 Min 52.1 - - 18 2.0 1.90 28.1 Max 78.6 39 12.0 3.37 47.9
Note. SB = spina bifi&, inc. =incomplete lesion.
2.5 ,
Speed (mls)
Figure 2 - The relationship between oxygen uptake (Vmin) and propulsion speeds (mls) for the 8 wheelchair racers (Mean + SD).
Further significant relationships may have been masked by large interindividual differences in the propulsion styles. This is shown by the large standard deviations associated with the push rate at each speed (Figure 3).
Table 3 shows the Pearson Product Moment correlation coefficients between selected kinematic variables and pushing economy at speeds of 6.0, 6.5, and 7.0 m/s for the eight subjects. At each speed, there was a high correlation between
42 Goosey and Campbell
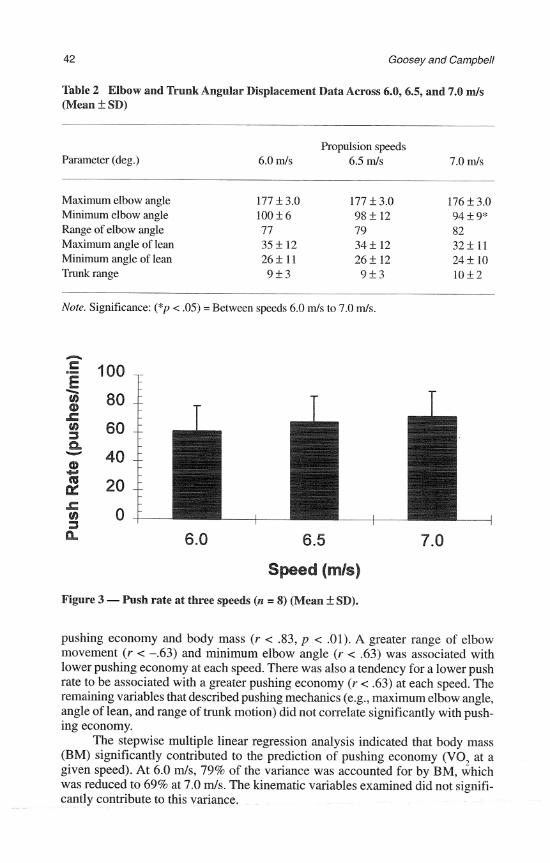
Table 2 Elbow and Trunk Angular Displacement Data Across 6.0,6.5, and 7.0 m/s (Mean f SD)
Parameter (deg.) Propulsion speeds
6.0 m/s 6.5 m/s 7.0 m/s
Maximum elbow angle 177 + 3.0 177 f 3.0 176 f 3.0 Minimum elbow angle 100 f 6 98 + 12 94 f 9* Range of elbow angle 77 79 82 Maximum angle of lean 35 + 12 34 + 12 32f 11 Minimum angle of lean 26f 11 26f 12 24f 10 Trunk range 9 f 3 9 f 3 10 + 2
Note. Significance: (*p < .05) = Between speeds 6.0 m/s to 7.0 d s .
Speed (mls)
Figure 3 - Push rate at three speeds (n = 8) (Mean + SD).
pushing economy and body mass ( r < 33, p < .01). A greater range of elbow movement ( r < -.63) and minimum elbow angle (r < .63) was associated with lower pushing economy at each speed. There was also a tendency for a lower push rate to be associated with a greater pushing economy ( r < .63) at each speed. The remaining variables that described pushing mechanics (e.g., maximum elbow angle, angle of lean, and range of trunk motion) did not correlate significantly with push- ing economy.
The stepwise multiple linear regression analysis indicated that body mass (BM) significantly contributed to the prediction of pushing economy (VO, at a given speed). At 6.0 d s , 79% of the variance was accounted for by BM, which was reduced to 69% at 7.0 d s . The kinematic variables examined did not signifi- cantly contribute to this variance.

Pushing Economy and Propulsion Technique
6.0 6.5 7.0
Speed (mls)
Figure 4 - Cycle time at three speeds (n = 8) (Mean f SD).
Table 3 Pearson Product Moment Correlation Coefficients (r) Between Selected Kinematic Variables and Pushing Economy (Oxygen Uptake (Vmin)) at 6.0,6.5, and 7.0 mls
Parameter 6.0 d s 6.5 d s 7.0 mls
Body mass (kg) Push rate (pushlmin) Cycle time (s) Elbow angle (deg.)
Max Min
Elbow range (deg.) Angle of lean (deg.)
Max Min
Trunk range (deg.)
Note. Significance: *p < .05 and **p < .O1 (n = 8).
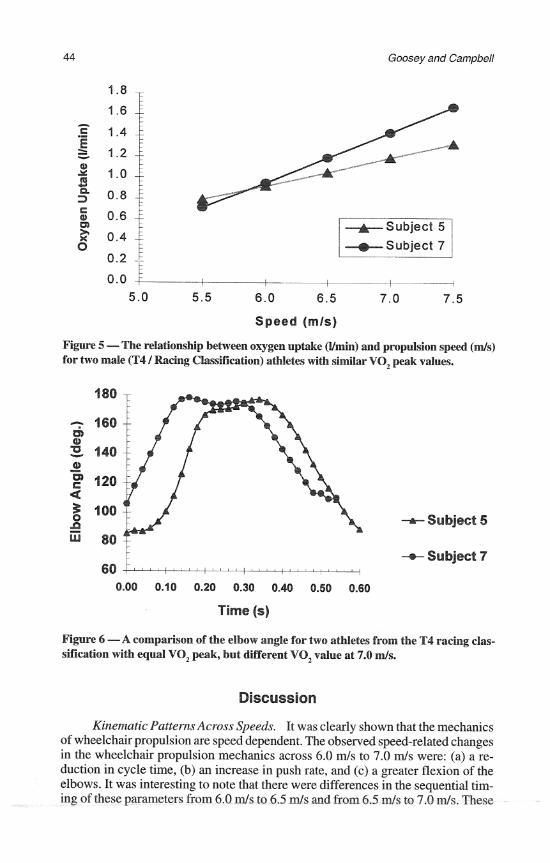
Figure 5 shows VO, during the submaximal incremental test for two athletes from the same racing classification with similar body mass and VO, peak values. Subject 5 was more economical (consumed less oxygen) than Subject 7 at speeds ranging from 6.0 m/s to 7.5 m/s. Figure 6 demonstrates the greater range of elbow movement during one push cycle at 7.0 m/s for Subject 5 when compared with Subject 7.
Goosey and Campbell
Speed (mls)
Figure 5 -The relationship between oxygen uptake (Vmin) and propulsion speed ( d s ) for two male (T4 / Racing Classification) athletes with similar VO, peak values.
-t- Subject 5
60 1 1 1 -c- Subject 7
0.00 0.10 0.20 0.30 0.40 0.50 0.60
Time (s)
Figure 6 -A comparison of the elbow angle for two athletes from the T4 racing clas- sification with equal VO, peak, but different VO, value at 7.0 d s .
Discussion
Kinematic Patterns Across Speeds. It was clearly shown that the mechanics of wheelchair propulsion are speed dependent. The observed speed-related changes in the wheelchair propulsion mechanics across 6.0 m/s to 7.0 m/s were: (a) a re- duction in cycle time, (b) an increase in push rate, and (c) a greater flexion of the elbows. It was interesting to note that there were differences in the sequential tim- ing of these parameters from 6.0 m/s to 6.5 m/s and from 6.5 m/s to 7.0 m/s. These
Pushing Economy and Propulsion Technique 45
findings, in general, are consistent with the findings of Veeger and coworkers (1989) using a standardized wheelchair across slower propulsion speeds. However, Veeger and coworkers (1989) found no difference in the minimum elbow angle as speed increased. This may be because only a small amount of tmnk flexion was noted by Veeger et al. (1989), which may be associated with standardized testing conditions.
As the speed increased from 6.0 m!s to 6.5 m/s, it was accompanied by a decrease in cycle time and an increase in push rate. There was no significant change in the displacement data, suggesting that the athletes were performing the same movement pattern, only at a greater rate.
The increase in speed from 6.5 mls to 7.0 m/s resulted in a s i m c a n t increase in elbow flexion. This was accompanied by nonsignificant changes in both the cycle time and push rate, suggesting that the athletes were beginning to adapt to the increase in speed by a change in their technique (i.e., the movement pattern). This was also found by Wang and coworkers (1995) who noted that greater trunk and elbow flexion occurred at higher speeds. This fmding is consistent also with researchers examining the range of trunk motion under various conditions, who have generally found that the trunk moves forward as the demand of the activity increases e e s , 1991).
Pushing Economy
Zntraindividual Variation Across Speeds. Large intraindividual variation occurred in pushing economy (Figure 2). When expressed as a percentage of the mean, the variation varied from 35% at 6.0 m/s to 26% at 7.0 m/s. The faster speeds of 6.5 m/s to 7.0 m/s reflect typical raceltraining intensities for this group of ath- letes. Previous studies have implied that it seems logical that the more an athlete trains at a given speed, the more finely tuned the associated mechanical move- ments become (Williams, 1990). In this case, there was less variability at 7.0 m/s within these wheelchair racers, possibly because they had to adjust their propul- sion mechanics (e.g., stroke frequency) at the slower speeds. The variability ob- served in pushing economy between subjects is consistent with that reported in previous studies examining the oxygen cost of wheelchair propulsion (Campbell, 1992; Campbell & Goosey, 1996; Lakomy et al., 1987). However, the interindividual variation is considerably higher than that reported for running economy studies, which have reported variations between 2% to 11 % for a given speed within groups of runners with similar performance abilities (Morgan et al., 1989).
The Relationship Between Wheelchair Propulsion Mechanics and Economy. One of the reasons for the study was to determine which biomechanical factors may account for the differences in pushing economy. The main findings suggested that when the relationship between selected kinematic variables and pushing economy was examined, greater pushing economy was associated with (a) lower body mass (lighter athletes), (b) greater range of elbow flexion/minimum elbow angle, and (c) tendency for a lower push rate.
Body Mass. Oxygen uptake was expressed in Vmin and was not normalized to body mass. This method conforms with other research reporting the VO, peak or submaximal values in wheelchair propulsion (Campbell, 1992; Glaser, 1985; Lakomy et al., 1987) because body weight is continually supported during the activity. Fur- thermore, body mass is a poor estimate of the skeletal musculature employed during wheelchair propulsion. When VO, was expressed as Vmin, the lighter athletes were found to be more economical than the heavier athletes. The differences observed
46 Goosey and Campbell
in the submaximal VO, values between the lighter and heavier athletes may possi- bly be a function of the size of the contracting muscle mass. Generally, the lighter athletes are of smaller build and therefore do not require a high rate of oxygen use. The results from this study suggest that oxygen uptake (VO,) should be adjusted in future research to account for differences possibly in body size. However, there are insufficient data at present to know what this adjustment might be.
Range of Elbow Motion. A greater range of elbow movement was associ- ated with lower pushing economy. An explanation for this finding is not immedi- ately apparent, although greater elbow extension may suggest that there was greater use of the shoulder muscles. Meijs, Oers, Veeger, and Woude (1989) found that an increase in the seat height significantly affected the trajectory of the elbow (de- creased extensionMexion). Therefore, a greater range of elbow motion may be a function of seating position in the racing wheelchair. It was interesting to note that angle of lean was not associated with greater pushing economy. This may be ex- plained by the large variability found with the angle of lean, which may be the result of the different seating positions adopted by the athletes.
Push Rate. Finally, there was a tendency for a lower push rate to be associated with a greater pushing economy, which supports the findings of Jones and coworkers (1992). As the speed increased from 6.5 m/s to 7.0 d s , the push rate appeared to be reaching a plateau, which may indicate the athletes' optimum frequency. This plateau is similar to what has been described by Cavanagh and Williams (1982) as runners' select a combination of stride frequencies and stride lengths that minimizes metabolic cost during level running. Likewise, during cyclic movements, researchers examin- ing pedal frequencies of cyclists (Boning, Gonen, & Maassen, 1989) or cycle fre- quencies during wheelchair propulsion (Woude, Veeger, Rozendal, & Sargeant, 1989) have found that experimentally induced deviations from the individuals' freely chosen pedal/cycle frequency tend to result in an increase in oxygen cost. In the present study, although individuals had different preferred push rates at a given speed (Figure 3), they appeared to maintain their chosen push rate across the speeds 6.5 mls and 7.0 mls.
In order to determine how much of these combined kinematic variables ac- counted for the variance in pushing economy, the variables associated with push- ing economy were introduced into a stepwise multiple regression equation. It was found that 89% of the variance was accounted for by both the minimum elbow angle and body mass at 6.0 mls. Body mass alone accounted for 70% of the vari- ance in pushing economy at 6.5 mls and 63% at 7.0 mls.
Figure 5 illustrated that Subject 5 was more economical than Subject 7, al- though these two athletes were matched according to their racing classification, racing experience and age, and had a similar body mass and V0,peak value. Sub- ject 5 demonstrated a greater range of elbow movement (Figure 6), which was a factor associated with better pushing economy. However, other factors, such as the nature of the disability, may have also contributed to Subject 5 being more eco- nomical. In this respect, the disability of Subject 5 was spina bifida, which may suggest that other mechanisms related to disability are responsible.
Summary It can be concluded that adaptations to speed changes occur, initially by a decrease in cycle time and an increase in cycle rate, and later by an increase in the flexion of the elbows.
Pushing Economy and Propulsion Technique 47
Generally, the differences in propulsion technique do appear to influence oxygen uptake. In terms of pushing economy, the lighter athletes with a greater range of elbow movement and a lower push rate were more economical. In gen- eral, the variations in pushing economy were not accounted for by the variations in the kinematic variables examined (elbow angle and angle of lean) but were partly explained by the differences in body mass (63% to 89% of the variance). Further- more, as the speed increased from 6.0 to 7.0 m/s, the relationship between pushing economy and the kinematic variables in the present study (push rate, minimum elbow angle, and elbow range) were reduced. This suggests that possibly as the physiological demands increase, other factors such as the nature of the disability1 lesion level and the wheelchair design, or more probably a combination of these, may explain the differences in pushing economy between athletes.
The results from the present study add to our understanding of pushing economy and propulsion techniques of wheelchair racers and provide a platform for future studies. However, it must be noted that the limitations of the present study may be with (a) the limited kinematic analysis employed, (b) the use of a two-dimensional analysis (2D), (c) combining the one female with the seven males for statistical analysis, and (d) the decision to ignore the influence of body size on pushing economy. Other variables of interest for future studies are the shoulder angles and the wrist, elbow, and shoulder velocities. An increased wrist velocity at the strike and release of the handrim have been associated with better economy (Jones et al., 1992), and maximal shoulder velocity at initial contact of the drive phase has been associated with maximizing wheelchair racing speed (Wang et al., 1995).
Three-dimensional (3D) angular velocities/displacements and linear velocities may be more appropriate than the 2D analysis used in this study. However, Roeleveld, Lute, Veeger, Gwinn, and Woude (1994) stated that a two-dimensional (2D) analysis was suitable for stroke, timing, and displacement of segments in the sagittal plane. Furthermore, Sanderson and Sommer (1985) stated that because of the symmetry of motion, there would be negligible or no rotation of the trunk about its longitudinal axis. It should be noted that only recently have 3D experimental designs been em- ployed (Vanlandewijck, Spaepen, & Lysens, 1994; Wang et al., 1995). These studies have allowed the movements of the arm in the frontal lane to be described and 3D linear and angular velocities to be obtained. This may bemore noticeable and relevant for wheelchair racers at high propulsion speeds. However, limited data are available on the 3D kinematic features of wheelchair racers and pushing economy, which is an area certainly worthy of future investigation.
Studies that include spinal cord injured athletes (SCI) should recognize the limitations inherent in the experimental methods employed that might affect the relationships identified. These might include combining athletes of different rac- ing classifications or combining male and female athletes. Athletes in this study were grouped together because of the small number of subjects available. Conse- quently, there is a need to establish the relationship between selected kinematic variables and pushing economy for each specific subpopulation in the future.
Generally, in the literature, running economy has been normalized to body mass (Morgan et al., 1989), which follows the ratio-standard linear relationship. However, the relationship between peak oxygen uptake/submaximal oxygen uptake and body mass has not been examined in the wheelchair population. Therefore, the definition of pushing economy measured in this study (VO, submax; in Urnin) did not account for
48 Goosey and Campbell
body weight. Nevi11 (1994) stated that a fundamental issue is that the physiological variable is influenced by active muscle mass, with body mass usually used as a proxy in the absence of muscle mass estimates. Body mass is a poor estimate of the skeletal musculature employed during wheelchair propulsion. Furthermore, there are errors associated with estimating body composition in SCI athletes (Hooker & Hooker, 1990). Generally VO, submaximal and peak values found in wheel- chair racers are expressed in absolute values (Lakomy et al., 1987; Lakomy & Williams, 1996). At this stage, it is not appropriate to express VO, values relative to body mass. However, the results from our study suggest that future studies may need to address this issue. Although a common 213 exponent has been found in the able-bodied literature, we are not confident in the use of this value until it has been carefully evaluated in this specific population. For example, if we were to find that VO, corresponded to 213 body mass and we had used the ratio standard methods (BM'), we would be overcorrecting and the heavier athletes would become more economical.
References
Boning, D., Gonen, Y., & Maassen, N. (1984). Relationship between work load, pedal fre- quency, and physical fitness. International Journal of Sports Medicine, 5,92-97.
Bransford, D.R., & Howley, E.T. (1977). Oxygen cost of running in trained and untrained men and women. Medicine and Science in Sports Medicine, 3, 137-140.
Campbell, I.G. (1992). The influence of level of spinal cord injury on the physiological and metabolic responses to exercise and pe$ormance. Unpublished doctoral disserta- tion, Loughborough University of Technology, UK.
Campbell, I.G., & Goosey, V.L. (1996, August). Pushing economy of wheelchair athletes. Paper presented at the 3rd Paralympic Scientific Congress, Atlanta, GA.
Campbell, I.G., &Williams, C. (1996). A comparison of two wheelchair treadmill exercise test protocols for determination of peak oxygen uptake (VO, peak): Gradient versus speed. In C. Simard, C. Lkpine, & D. Drouin (Eds.), Proceedings of 3rd Interna- tional Medical Congress on Sports for the Disabled (pp. 67-76). Quebec, PQ: Lava1 University.
Campbell, I.G., Williams, C., & Lakomy, H.K.A. (1995). Physiological characteristics and marathon performance of endurance trained wheelchair athletes. In H. Van Coppenolle, Y. Vanlandewijck, J. Simons, P. Van de Vliet, & E. Neerinckx (Eds.), Proceedings of the First European Conference on Adapted Physical Activity and Sports: A white paper on research and practice (pp. 83-88). Leuven, Belgium: Amersfoort.
Cavanagh, P.R. (1990). The biomechanics of distance running. Champaign, JL Human Kinetics.
Cavanagh, P.R., & Williams, K. R. (1982). The effect of stride length variations on oxygen uptake during distance running. Medicine and Science in Sports and Exercise, 14,30- 35.
Cooper, R.A. (1992). The contribution of selected anthropometric and physiological vari- ables to 10 K performance of wheelchair racers: A preliminary study. Journal of Rehabilitation Research and Development, 24,29-34.
Daniels, J.T. (1985). A physiologist's view of running economy. Medicine and Science in Sports and Exercise, 17, 1-23.
Goosey, V.L., Campbell, I.G., & Fowler, N.E. (1995). Development of a treadmill test to examine the physiological responses of wheelchair athletes to submaximal exercise.
Pushing Economy and Propulsion Technique 49
In G. Atkinson & T. Reilly (Eds.), Proceedings of the 3rd International Conference on Sport, Leisure, and Ergonomics (pp. 13-18). Burton Manor, UK: E & FN Spon.
Goosey, V.L., Campbell, I.G., & Fowler, N.E. (1996, August). Pushing economy and wheel- chairpropulsion technique of wheelchair racers. Paper presented at the 3rd Pardympic Scientific Congress, Atlanta, GA.
Goosey, V.L., Campbell, I.G., & Fowler, N.E. (1997). A kinematic analysis of the wheel- chair racing techniques of male, female, and junior male athletes. Adapted Physical Activity Quarterly, 14, 156-165.
Higgs, C. (1983). An analysis of racing wheelchairs used in the 1980 Olympic Games for the disabled. Research Quarterly for Exercise & Sport, 4,229-233.
Hooker, C.L., & Hooker, S.P. (1990). The spinal cord injured athlete. Adapted Physical Activity Quarterly, 7,265-285.
Jones, D., Baldini, E, Cooper, R., Robertson, R., & Widrnan, L. (1992). Economical aspects of wheelchair propulsion. Medicine and Science in Sports and Exercise, 24(5) (Suppl.), S32.
Lakomy, H.K.A., Campbell, I.G., & Williams, C. (1987). Treadmill performance and se- lected physiological characteristics of wheelchair athletes. British Journal of Sports Medicine, 21(3), 130-133.
Lakomy, H.K.A., & Williams, T. (1996). The response of an able-bodied person to wheel- chair training: A case study. British Journal of Sports Medicine, 30,236-237.
Lees, A. (1991). Performance characteristics of two wheelchair sprint tests. In Proceedings of the ergonomics of manual wheelchair propulsion, commission of the European communities (pp. 13-20). Amsterdam: Free University Press.
Masse, L.C., Lamontagne, M., & O'Riain, M.D. (1992). Biomechanical analysis of wheel- chair propulsion for various seating positions. Journal of Rehabilitation Research and Development, 29, 12-26.
Meijs, P.J.M., Oers, C.A.J.M. van, Veeger, H.E.J., & Woude, L.H.V. van der. (1989). The effect of seat height on the physiological response and propulsion technique in wheel- chair propulsion. Journal of Rehabilitation Sciences, 2(4), 104-107.
Morgan, D.W., Martin, P.E., & Krahenbuhl, G.S. (1989). Factors affecting running economy. Sports Medicine, 7,310-330.
Nevill, A.M. (1994). The need to scale for differences in body size and mass: An explana- tion of Kleiber's 0.75 mass exponent. Journal ofApplied Physiology, 77,2870-2873.
Roeleveld, K., Lute, E., Veeger, D., Gwinn, T., & Woude, L.H.V. van der. (1994). Power output and technique of wheelchair athletes. Adapted Physical Activity Quarterly, 11,71-85.
Sanderson, D.J., & Sornmer, H.J. (1985). Kinematic features of wheelchair propulsion. Journal of Biomechanics, 18,423-429.
Vanlandewijck, Y.C., Spaepen, A.J., & Lysens, R.J. (1988). Wheelchair propulsion effi- ciency: Movement pattern adaptations to speed changes. Medicine and Science in Sports and Exercise, 26, 1373- 138 1.
Veeger, H.E.J., Woude, L.H.V. van der, & Rozendal, R.H. (1988). Wheelchair handrim di- ameter, physiology and stroke technique. In G. de Groot, A. P. Hollander, P.A. Huijing, & G.J. van Ingen Schenau (Eds.), Biomechanics XIA: Proceedings of XIth Interna- tional Congress on Biomechanics (pp. 519-523). Amsterdam: Free University Press.
Veeger, H.E.J., Woude, L.H.V. van der, & Rozendal, R.H. (1989). Wheelchair propulsion technique at different speeds. Scandinavian Journal of Rehabilitation Medicine, 21, 197-203.
Wang, Y.T., Deutsch, H., Morse, M., Hedrick, B., & Milikan, T. (1995). Three-dimensional kinematics of wheelchair propulsion across racing speeds. Adapted Physical Activity Quarterly, 12,78-89.
50 Goosey and Campbell
Williams, K.R. (1990). Relationship between distance running biomechanics and running economy. In P. Cavanaugh (Ed.), Biomechanics of distance running (pp. 271-305). Champaign, IL: Human Kinetics.
Woude, L.H.V. van der, Veeger, H.E.J., Rozendal, R.H. (1989). Ergonomics of wheelchair design: A prerequisite for optimum wheeling conditions. Adapted Physical Activity Quarterly, 6,109-132.
Woude, L.H.V. van der, Veeger, H.E.J., & Rozendal, R.H. (1992). Biomechanics of wheel- chair racing. In R. Rodan (Ed.), Proceedings of the 10th Symposium of the Interna- tional Society of Biomechanics in Sports (pp. 329-336). Milan, Italy: Edi-Ermes.
Woude, L.H.V. van der, Veeger, H.E.J., Rozendal, R.H., Ingen Schenau, G.J. van, Rooth, P., & Nierop, P. van. (1988). Wheelchair racing: Effect of rim diameter and speed on physiology and technique. Medicine and Science in Sports and Exercise, 20(5), 492- 500.
Woude, L.H.V. van der, Veeger, H.E.J., Rozendal, R.H., & Sargeant, A.J. (1989). Optimum cycle frequencies in handrim propulsion. European Journal of Applied Physiology, 58.625-632.
Authors' Notes
The support by the Sports Council, who fund the British Wheelchair Racing Asso- ciation (BWRA) Sports Science Support Program, which is based at the Manchester Metro- politan University, is acknowledged. In addition, an acknowledgement is made to Mr. Alan Batterham, Dr. Neil Fowler, and Mr. Keith Tolfrey for their assistance.