Purification and Partial Characterization of a Basic Protein … · 2003-02-06 · Purification and...
7
THE JOURNAL OF Bnxmmx~, CHEMISTRY Vol. 242, No. 21, Issue of November 10, pp. 49334938, 1967 Printed in U.S.A. Purification and Partial Characterization of a Basic Protein from Pig Brain* (Received for publication, June 19, 1967) LAWRENCE G. TOMASI~ AND S. E. KORNGUTH From the Departments of Neurology and Physiological Chemistry, University of Wisconsin Medical Center, Madison, Wisconsin 53706 SUMMARY A basic protein has been isolated from pig brain. The purification procedure consisted of repeated extractions with chloroform-methanol (2: 1 v/v), 10% sodium chloride, and dilute hydrochloric acid. The pH 2.4 to 2.6 fraction ob- tained from the repeated acid extraction was further purified by pH and (NH&SO4 fractionation, Sephadex G-100 gel filtration, and chromatography on Amberlite IRC-50 with a gradient (5 to 20%) of guanidinium chloride. All of the fractions obtained by this purification procedure have been examined by starch gel electrophoresis. The homogeneity of the pig brain basic protein has been established by ultracentrifugation, starch gel electrophoresis, polyacrylamide gel electrophoresis, and end group analysis. Amino acid analysis performed on a complete acid hydroly- sate of the protein indicated that the ratio of basic to acidic amino acids is greater than 1.5. An absence of cysteine and the presence of a high glycine and proline content have also been observed. Basic proteins have been isolated from a number of cellular organelles (l-8). These basic proteins are polycations at physi- ological conditions, and serve to complex the polyanions present in the organelles, such as the phospholipids of the myelin sheath (9), the DNA of the nucleus (10, II), and the RNA of the ribo- some (12). There is evidence which suggests that the basic pro- tein-polyanion complexes are specific rather than random interac- tions (13) and may be involved in the regulations of RNA synthesis (14, 15), protein synthesis (16), and myelinogenesis * This work was supported by Grant NB05-631 from the Na- tional Institute of Neurological Diseases and Blindness, Grant GM-01666 from the National Institutes of Health, and by a general research support grant to the University of Wisconsin Medical School from the National Institutes of Health, Division of Re- search Facilities and Resources. $ This work was carried out during tenure of a Life Insurance Medical Research Fund Fellowship. Investigations into the properties of the naturally occurring polycations which permit them to enter into specific complexes requires a procedure for the large scale preparation of a homogene- ous basic protein. This protein should be soluble at physio- logical conditions so that studies on the mechanism of complex formation could be related to conditions occurring in viva. The present work describes a procedure for the preparation from pig brain of large amounts of a soluble, homogeneous basic protein. EXPERIMENTAL PROCEDURE iMaterials-Beaded forms of Sephadex G-25 and G-100 and Blue Dextran 2000, a high molecular weight (2 X 10⁶) dextran covalently bound to a blue dye, were purchased from Pharmacia. The guanidinium chloride was purchased from Aldrich and puri- fied according to the method of Sat.ake, Rasmussen, and Luck (18). A solution of this purified guanidinium chloride (75 g per 100 ml) had an optical density of less than 0.1 at 277 mp. The starch, hydrolyzed for gel electrophoresis, was purchased from Fisher Scientific. The reagents for discontinuous electrophoresis were obtained from Canalco. Extraction of Basic Protein-The solutions used in the purifica- tion procedure were precooled to O”, and the temperature of the homogenate was maintained below 4”. Eight fresh pig brains were homogenized in a 4-liter Waring blendor with 4 volumes of a chloroform-methanol solution (2: 1 v/v) for 2 min. The chloro- form-methanol-insoluble material was collected as a layer above the chloroform-methanol solution by centrifugation at 1200 x g for 20 min. The layer was rehomogenized with fresh chloroform- methanol and this extraction procedure was repeated until the insoluble material sedimented to the bottom of the tube during centrifugation at 1200 x g for 20 min. The insoluble material obtained from the chloroform-methanol extraction was homoge- nized with 6 volumes of acetone for 2 min to remove the residual chloroform-methanol and the acetone-insoluble material was col- lected by centrifugation at 1200 x g for 20 min. The acetone powder was then homogenized with 6 volumes of the following solutions for 2 min followed by centrifugation at 1200 x g for 20 min to collect the insoluble material: twice with distilled water, once with 10% NaCl, and again twice with distilled water. The final residue was extracted by homogenization with 3 volumes of 4933 by guest on July 7, 2018 http://www.jbc.org/ Downloaded from
Transcript of Purification and Partial Characterization of a Basic Protein … · 2003-02-06 · Purification and...
THE JOURNAL OF Bnxmmx~, CHEMISTRY Vol. 242, No. 21, Issue of November 10, pp. 49334938, 1967
Printed in U.S.A.
Purification and Partial Characterization of a Basic Protein
from Pig Brain*
(Received for publication, June 19, 1967)
LAWRENCE G. TOMASI~ AND S. E. KORNGUTH
From the Departments of Neurology and Physiological Chemistry, University of Wisconsin Medical Center, Madison, Wisconsin 53706
SUMMARY
A basic protein has been isolated from pig brain. The purification procedure consisted of repeated extractions with chloroform-methanol (2: 1 v/v), 10% sodium chloride, and dilute hydrochloric acid. The pH 2.4 to 2.6 fraction ob- tained from the repeated acid extraction was further purified by pH and (NH&SO4 fractionation, Sephadex G-100 gel filtration, and chromatography on Amberlite IRC-50 with a gradient (5 to 20%) of guanidinium chloride. All of the fractions obtained by this purification procedure have been examined by starch gel electrophoresis.
The homogeneity of the pig brain basic protein has been established by ultracentrifugation, starch gel electrophoresis, polyacrylamide gel electrophoresis, and end group analysis. Amino acid analysis performed on a complete acid hydroly- sate of the protein indicated that the ratio of basic to acidic amino acids is greater than 1.5. An absence of cysteine and the presence of a high glycine and proline content have also been observed.
Basic proteins have been isolated from a number of cellular organelles (l-8). These basic proteins are polycations at physi- ological conditions, and serve to complex the polyanions present in the organelles, such as the phospholipids of the myelin sheath (9), the DNA of the nucleus (10, II), and the RNA of the ribo- some (12). There is evidence which suggests that the basic pro- tein-polyanion complexes are specific rather than random interac- tions (13) and may be involved in the regulations of RNA synthesis (14, 15), protein synthesis (16), and myelinogenesis
* This work was supported by Grant NB05-631 from the Na- tional Institute of Neurological Diseases and Blindness, Grant GM-01666 from the National Institutes of Health, and by a general research support grant to the University of Wisconsin Medical School from the National Institutes of Health, Division of Re- search Facilities and Resources.
$ This work was carried out during tenure of a Life Insurance Medical Research Fund Fellowship.
Investigations into the properties of the naturally occurring polycations which permit them to enter into specific complexes requires a procedure for the large scale preparation of a homogene- ous basic protein. This protein should be soluble at physio- logical conditions so that studies on the mechanism of complex formation could be related to conditions occurring in viva.
The present work describes a procedure for the preparation from pig brain of large amounts of a soluble, homogeneous basic protein.
EXPERIMENTAL PROCEDURE
iMaterials-Beaded forms of Sephadex G-25 and G-100 and Blue Dextran 2000, a high molecular weight (2 X 10⁶) dextran covalently bound to a blue dye, were purchased from Pharmacia. The guanidinium chloride was purchased from Aldrich and puri- fied according to the method of Sat.ake, Rasmussen, and Luck (18). A solution of this purified guanidinium chloride (75 g per 100 ml) had an optical density of less than 0.1 at 277 mp. The starch, hydrolyzed for gel electrophoresis, was purchased from Fisher Scientific. The reagents for discontinuous electrophoresis were obtained from Canalco.
Extraction of Basic Protein-The solutions used in the purifica- tion procedure were precooled to O”, and the temperature of the homogenate was maintained below 4”. Eight fresh pig brains were homogenized in a 4-liter Waring blendor with 4 volumes of a chloroform-methanol solution (2: 1 v/v) for 2 min. The chloro- form-methanol-insoluble material was collected as a layer above the chloroform-methanol solution by centrifugation at 1200 x g for 20 min. The layer was rehomogenized with fresh chloroform- methanol and this extraction procedure was repeated until the insoluble material sedimented to the bottom of the tube during centrifugation at 1200 x g for 20 min. The insoluble material obtained from the chloroform-methanol extraction was homoge- nized with 6 volumes of acetone for 2 min to remove the residual chloroform-methanol and the acetone-insoluble material was col- lected by centrifugation at 1200 x g for 20 min. The acetone powder was then homogenized with 6 volumes of the following solutions for 2 min followed by centrifugation at 1200 x g for 20 min to collect the insoluble material: twice with distilled water, once with 10% NaCl, and again twice with distilled water. The final residue was extracted by homogenization with 3 volumes of
4933
by guest on July 7, 2018http://w
ww
.jbc.org/D
ownloaded from
Pig Brain Basic Protein Vol. 242, No. 21
0.01 N HCl and the insoluble material was collected by centrifuga- tion. The acid extraction followed by centrifugation was re- peated until a supernatant of pH 2.0 was attained. Eight ex- tractions were necessary, and a representative example of the pH values of the supernatant solutions were: 6.5, 5.8, 4.9, 4.0, 3.0, 2.6,2.4, 2.0. The pH 2.4 to 2.6 fraction was retained for the studies described and the insoluble material as well as the other pH fractions were discarded. The finely suspended particles of insoluble residue present in the pH 2.4 to 2.6 fraction were re- moved by centrifugation at 15,000 x g for 30 min. The clear supernatant was dialyzed at 4” against distilled water and was lyophilized.
Method of Assay-Starch gel electrophoresis and discontinuous polyacrylamide electrophoresis were used as a qualitative assay for the purification of the components from the pH 2.4 to 2.6 fraction. Starch gel electrophoresis was carried out according to the method of Smithies (19) with three different systems: (a) sodium formate buffer (0.025 M, pH 3.0) run at 3.75 volts per cm for 8 hours; (b) sodium formate buffer (0.025 M, pH 3.0) in 8 M
urea operated at 3.75 volts per cm for 8 hours; (c) sodium borate (0.026 M, pH 8.6) run at 6.25 volts per cm for 20 hours. Elec- trophoresis was carried out at room temperature, and the samples were in the range of 1 mg per ml. Discontinuous electrophoresis in 15% polyacrylamide gels was carried out according to the method of Reisfeld, Lewis, and Williams (20). P-Ala.nine ace- tate, pH 4.3, was used as a buffer and the gels were run for 3 hours at room temperature with a constant current of 3 ma per gel. Gels were stained for 1 hour with 1% Amido schwarz and de- stained electrolytically at a constant current of 3 ma per gel.
Preparation of Columns-Sephadex G-25 and G-100 were sus- pended in their respective buffers and allowed to equilibrate with stirring for several days before removing the fine particles. Columns of G-25 Sephadex were equilibrated and eluted with 0.01 N HCl, and these columns were routinely prepared so that the resin bed was 15 times the sample volume. For chromatog- raphy on Sephadex G-100, a column measuring 2.5 x 115 cm was used, buffered at pH 3.7 with 0.15 M ammonium acetate. The column was operated at a flow rate of 10 ml per hour and 3-ml fractions were collected. A Sephadex G-100 column, equili- brated and eluted with 8 M urea in 0.15 M sodium formate, pH 3.0, was used for the characterization of the purified component. For chromatography on this support, a column, 1.5 x 44 cm, was used, a flow rate of 2 ml per hour was maintained, and l-ml fractions were collected. The void volume of each column was determined by measuring the elution volume of Blue Dextran 2000 with the same conditions in which the columns were operated.
The Amberlite IRC-50 resin was cycled through the Na+ and H+ forms according to the method of Hirs, Moore, and Stein (21). For chromatography on this support, a column, 2.0 x 50 cm, was equilibrated with sodium phosphate (0.1 M, pH 6.8) containing 5% guanidinium chloride. For elution of the protein a two-chambered, linear gradient was used between 0.1 M sodium phosphate containing 5% guanidinium chloride, pH 6.8 (750 ml), and 0.1 M sodium phosphate containing 20% guanidinium chloride, pH 6.8 (750 ml). The flow rate was maintained at 10 ml per hour and B-ml fractions were collected. The concentra- tion of guanidinium chloride in the buffers was determined by gravimetric analysis. Columns were packed at room tempera- ture under the force of gravity. Once packed, the columns were operated at 4”.
Characterization of Basic Protein-Protein concentrations were
determined by absorption at 280 mp. The ultraviolet spectral analysis was determined with a 13cckman model DU spectro- photometer.
Amino acid analysis was performed on a protein hydrolysate (24 hours, 6 N HCI; 110“) with a Beckman/Spinco analyzer ac- cording to the method of Spackman, Stein, and Moore (22). The samples were prepared for hydrolysis as recommended by Crestfield, Moore, and Stein (23).
Edman degradation was used to determine the NHz-terminal amino acid, after the method of Light and Greenberg (24). Cyclization of the phenyl isothiocyanate derivative was accom- plished in anhydrous trifluoracetic acid. The appropriate amino acid phenylthiohydantoins were synthesized (25) and each deriva- tive was chromatographed on a thin layer silica gel support pre- pared in the following manner: 20 g of Silica Gel G were mixed in 45 ml of 0.5% starch hydrolysate containing 0.1% EDTA and the slurry was spread on glass plates (8 x 8 inches). The de- veloping solvents used were chloroform-methanol (90: 10 v/v) and chloroform-formic acid (100:5 v/v), numbered II and III by Stahl (26). An iodine azide reagent was used for detection of the phenylthiohydantoins (27). Sedimentation velocity meas- urements were made in a Spinco model E ultracentrifuge.
The sedimentation rate was followed with conventional Schlieren optics at high protein concentration (10 mg per ml) and by absorption optics with a split beam photoelectric scanning system (28) at low protein concentrations (1 mg per ml). The protein was made up to appropriate concentration with phosphate buffer (pH 7.4; 0.2 ionic strength). Pictures were taken at 32- min intervals while the rotor was operating at 59,780 rpm (20”).
RESULTS
The electrophoretic pattern of the pH 2.4 to 2.6 fraction re- vealed that the stainable components could be divided into four regions (Fig. 1, Pattern 1) : A, B, C, and D. The strongly staining narrow region near the origin was designated A. Region B con- sisted of three stainable components. The three components of B are more clearly indicated in Fig. 1, Pattern 6. Region C was a narrow zone which appeared quite homogenous and was the major component in the pH 2.4 to 2.6 fraction. Region D was a broad zone consisting of at least five stainable components. The five components of D are more clearly shown in Fig. 1, Pat- tern 6. The basic protein purified and characterized in this investigation is the major portion of Region C. It was chosen for the present work because it represents the major extractable protein from pig brain at this pH.
pH and (NH&S’04 Fractionation-The pH 2.4 to 2.6 fraction was dissolved in 0.01 N HCl (2 mg per ml) and this solution was adjusted to pH 5.0 with 1.0 N NaOH. The precipitate that formed was collected by centrifugation at 15,000 x g for 30 min. The electrophoretic patterns of the pH 5.0 supernatant (Fig. 1, Pattern .2) and the pH 5.0 precipitate (Fig. 1, Pattern 8) indicated that Region C remained in the supernatant at pH 5.0 while a major portion of Region A and Region D appeared in the pre- cipitate and this precipitate was discarded.
The pH 5.0 supernatant was brought 25% saturation with solid (NHS2S04, and the suspension was allowed to stir for 3 hours at 4” before collection of the precipitate by centrifugation at 15,000 x g for 30 min. The electrophoretic pattern of the precipitate (Fig. 1, Pattern 4) contained Regions A and B and this precipitate was discarded. This procedure removed all the com- ponents migrating with the same mobility as Region A. Solid
by guest on July 7, 2018http://w
ww
.jbc.org/D
ownloaded from
Issue of November 10, 967 L. G. Tomasi and S. E. Kornguth
(NH,)&04 was added with stirring to the supernatant until 40y0 saturation was reached. This suspension was allowed to stand overnight at 4” before the precipitate was collected by centrifuga- tion at 15,000 x g for 30 min. From the elect,rophoretic patterns of the precipitate (Fig. 1, Pattern 5) and the supernatant (Fig. 1, Pattern 6), it may be seen that Region C was concentrated in the precipitate. This precipitate containing Region C was dissolved in 0.01 N HCl, dialyzed at 4” against distilled water, and lyophi- lized. The supernatant obtained at 40% saturation with (NH4)$04 was concentrated 20-fold. The electrophoretic pat- tern (Fig. I, Pattern 6) indicated that Region C was almost totally absent from the supernatant whereas several components of Regions B and D were present.
Gel Filtrations-The lyophilized precipit’ate obtained from the 25 to 40% (NH&S04 fractionation was purified further by pas-
FIG. 1. Electrophoretic patterns on starch gel of each step during the purification of the pH 2.4 to 2.6 extract. The pH 2.4 to 2.6 extract was adjusted to pH 5.0 (Step I). The#supernatant of Step I was brought to 25% saturation with (NHd)$Od (Step II). The supernatant of Step II was adjusted to 40% saturation with (NH4).$04 (Step III). Pattern 1, pH 2.4 to 2.6 extract; Pattern 2, supernatant of Step I; Pattern 3, precipitate of Step I; Pattern 4, precipitat.e of Step II; Pattern 5, precipitate of Step III; Pattern 6, supernatant of Step III. The system employed was 0.026 M sodium formate, pH 3.0, at 3.75 volts per cm for 8 hours from bottom (+) to top (-) of the figure.
s-
0
3 r 2 0.5
0.7 I
$0.3 8 g 0.1
25
VO 1 nA
55 % -T&L C:L?JMN VOLUME
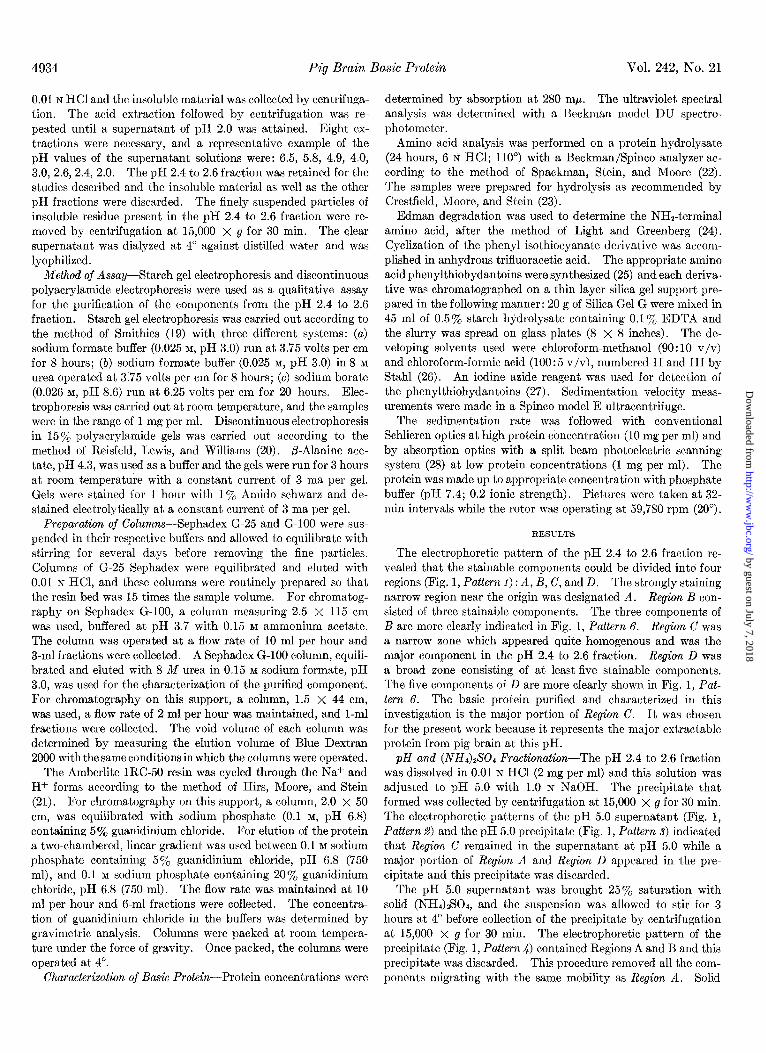
Fru. 2. Gel filtration on Sephadex G-100 of t)he precipitate at Step III (Fig. 1, Pattern 6). The column (total volume, 550 ml; void volume (V,), 140 ml) was equilibrated and elut,ed with 0.15 M ammonium acetate, pH 3.7. Ten millilit’ers of sample were ap- plied and t.he flow rate was 10 ml per hour.
>’
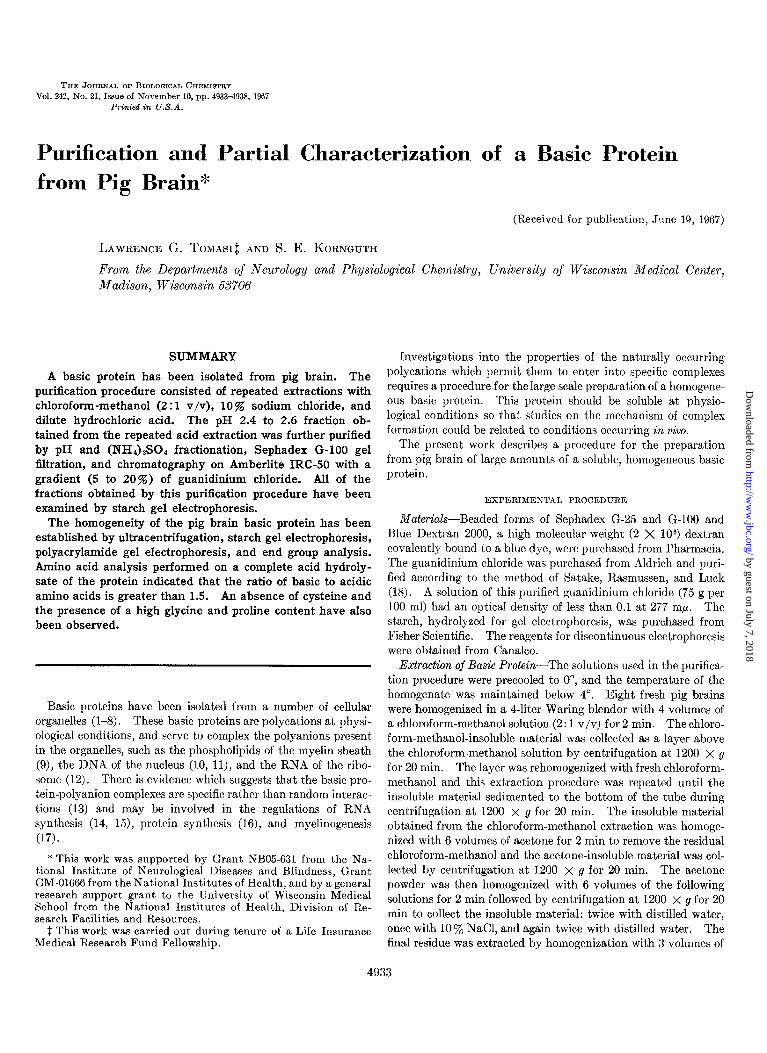
FIG. 3. Electrophoretic patterns on starch gel of the chro- matographic component eluted from Sephadex G-100. Pattern I, Peak II (Fig. 2), sodium formate (0.025 M, pH 3.0); Pattern 8, Peak II (Fig. i),-sodium borate (0.026 M, pH 8.6); Pattern 9, Peak II (Fig. 2). sodium formate (0.025 M. DH 3.0)-8 M urea: Pattern. L. , , maj’or peak (Fig. 4), sodium formate (0.025 M, pH 3.0)-8 M urea; Pattern 5, minor peak (Fig. 4), sodium formate (0.025 M, pH 3.0)~8 M urea. Except for Pattern 2, electrophoresis was carried out at 3.75 volts per cm for 8 hours from bottom (+) to top (-) of the figure. Pattern .9 was run at 6.25 volts per cm for 20 hours from bottom (-) to top (+) of the figure.
$ 09
s 0.7 w > 0.5 2
-I
$ 0.3 8 3 0.1
0 Cl
FIG. 4. Gel filtration on Sephadex G-100 of Peak II (Fig. 2). The column (total volume,, 52 ml; void volume (V,), 15 ml) was equilibrated and eluted with a 0.15 M sodium formate- M urea, pH 3.0. One milliliter of sample was applied and the flow rate was 2 ml per hour.
sage through Sephadex G-100 (Fig. 2). The elution pattern ob- tained showed two major chromatographic components. Peak 1 emerged at the void volume, and on starch electrophoresis at pH 3.0 it migrated similarly to those components which pre- cipitated both at pH 5.0 and at 25% (NH&SO* saturation. Peak 2 emerged as a symmetrical peak at 5Oa/, of total column volume (Fig. 2). Starch gel electrophoresis of this second peak revealed a single stainable component in three different systems: (a) 0.026 M sodium formate, pH 3.0 (Fig. 3, Pattern 1) ; (b) 0.026 M sodium borate, pH 8.6 (Fig. 3, Pattern 2); and (c) 0.026 M sodium formate- M urea, pH 3.0 (Fig. 3, Pattern 5). Reduction and al- kylation of the protein was not, performed before urea electro- phoresis because amino acid analysis indicated the lack of cysteine and its derivatives. The elution pattern resulting from the passage of this (NH&S04 fraction through Sephadex G-100
by guest on July 7, 2018http://w
ww
.jbc.org/D
ownloaded from
4936 Pig Brain Basic Protein Vol. 242, No. 21
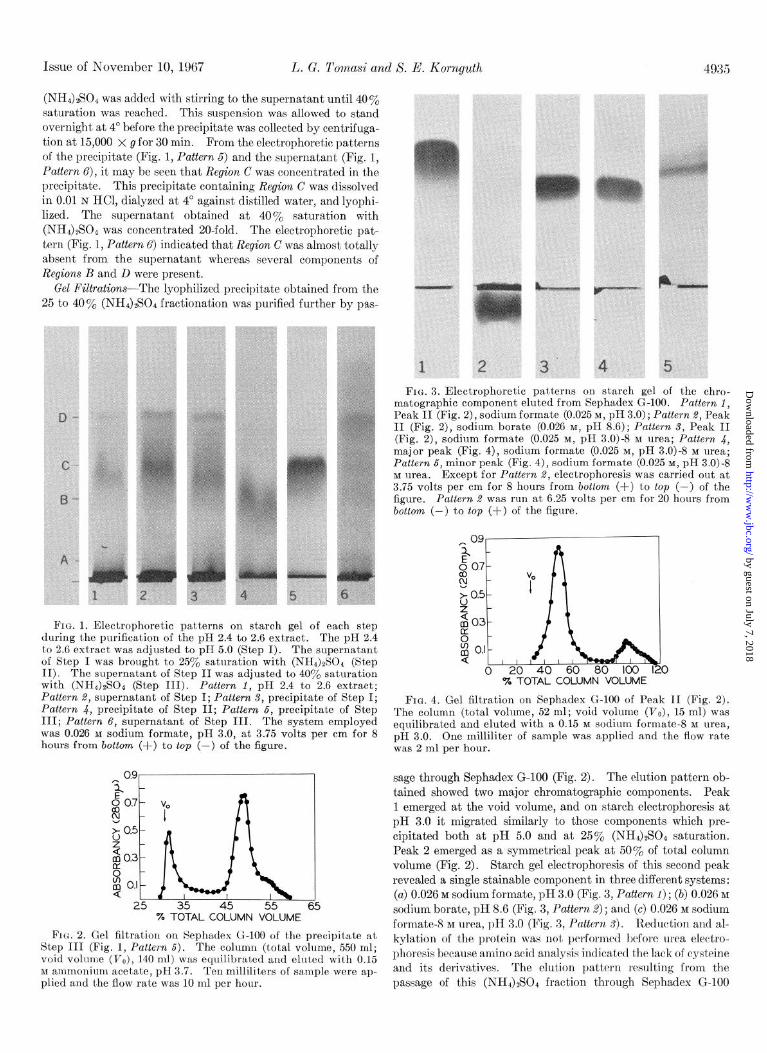
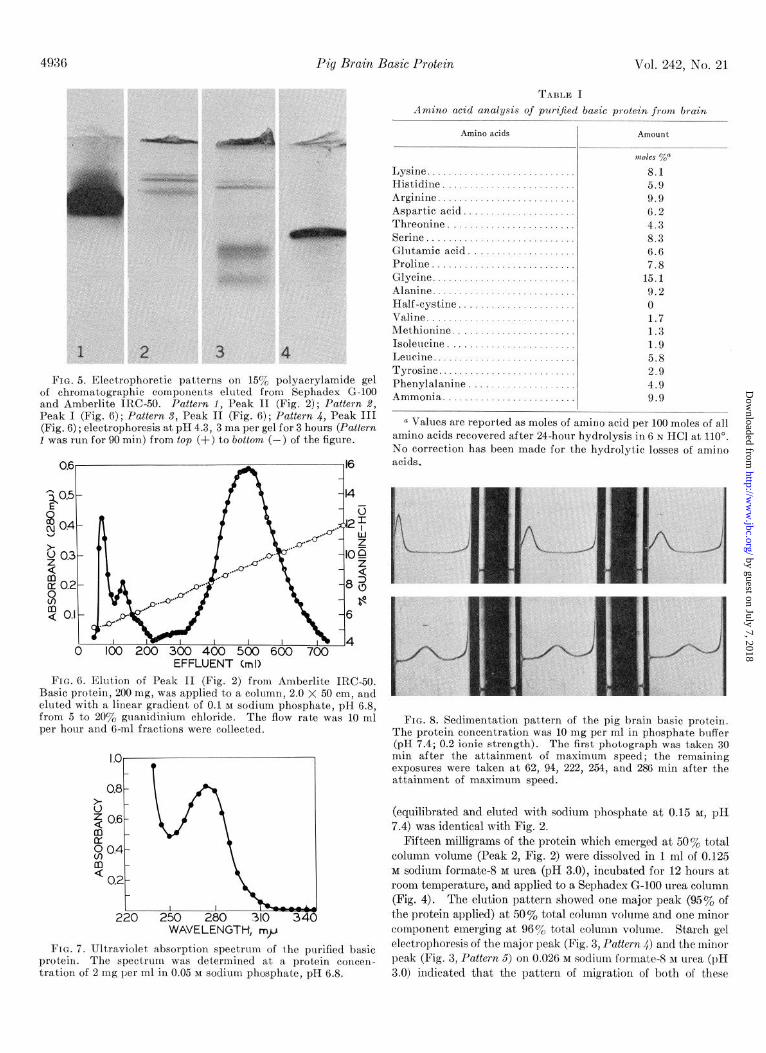
FIG. 5. Electrophoretic patterns on 15y0 polyacrylamide gel of chromatographic compbnents eluted from Sephadex G-i00 and Amberlite IRC-50. Pattern 1. Peak II (Fig. 2) : Pattern 2, Peak I (Fig. 6); Pattern S, Peak Ii (Fig. 6); PaEerk i, Peak III (Fig. 6) ; electrophoresis at pH 4.3, 3 ma per gel for 3 hours (Patlern 1 was run for 90 min) from top (t) to bottom (-) of the figure.
0 100 200 300 400 500 600 700 EFFLUENT <ml)
FIG. 6. Elution of Peak II (Fig. 2) from Amberlite IRC-50. Basic protein, 200 mg, was applied to a column, 2.0 X 50 cm, and eluted with a linear gradient of 0.1 M sodium phosphate, pH 6.8, from 5 to 20% guanidinium chloride. The flow rate was 10 ml per hour and 6-ml fractions were collected.
0.81
6
f 0.6
8? g 0.4
2 I
0.2
250 280 310 340 WAVELENGTH, mp
FIG. 7. Ultraviolet absorption spectrum of the purified basic protein. The spectrum was determined at a protein concen- tration of 2 mg per ml in 0.05 M sodium phosphate, pH 6.8.
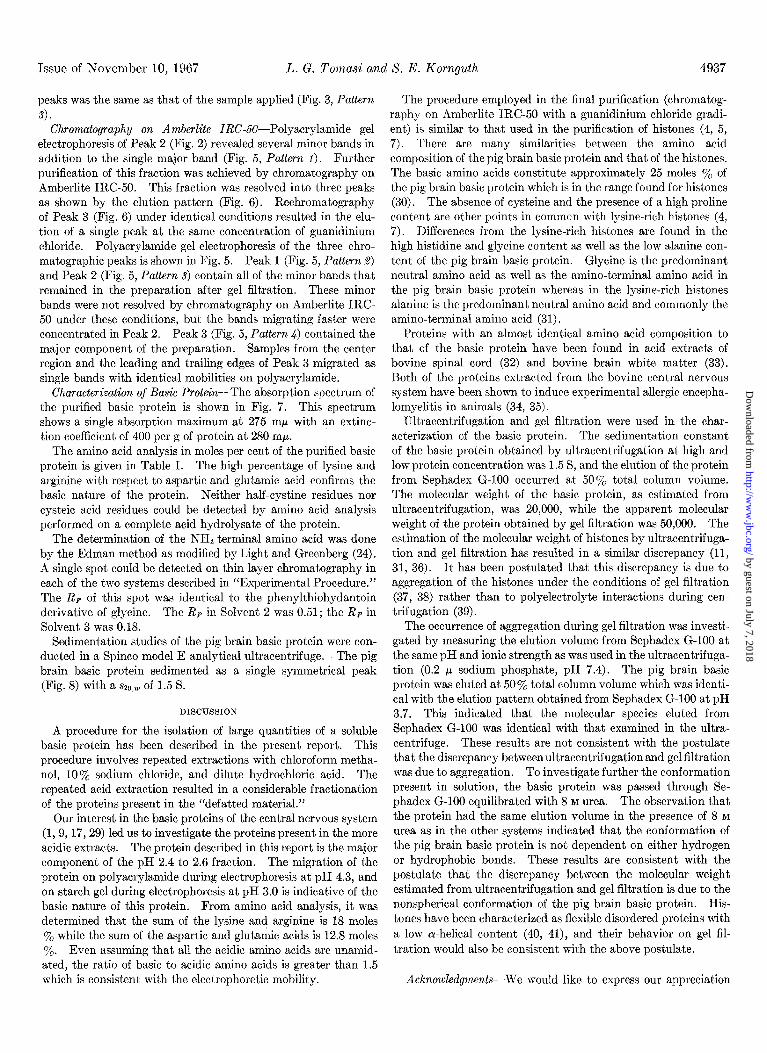
TAULE I
Amino acid unalysis of puriJied basic protein from brain
Amino acids
Lysine. Histidine Arginine Aspartic acid. Threonine Serine Glutamic acid. Proline Glycine.......... Alanine Half-cystine Vnline. Methionine. Isoleucine Leucine. Tyrosine. Phenylalanine Ammonia.
I Amount
mdes 70” 8.1 5.9 9.9 6.2 4.3 8.3 6.6 7.8
15.1 9.2 0 1.7 1.3 1.9 5.8 2.9 4.9 9.9
n Values are reported as moles of amino acid per 100 moles of all amino acids recovered after 24-hour hydrolysis in 6 N HCl at 110”. No correct.ion has been made for the hydrolyt.ic losses of amino acids.
FIG. 8. Sedimentation pattern of the pig brain basic protein. The protein concentration was 10 mg per ml in phosphate buffer (pH 7.4; 0.2 ionic strength). The first,photograph was taken 30 min after the attainment of maximum speed; t’he remaining exposures were taken at 62, 94, 222, 254, and 286 min after the attainment of maximum speed.
(equilibrated and eluted with sodium phosphate at 0.15 M, pH 7.4) was identical with Fig. 2.
Fifteen milligrams of the protein which emerged at 50% total column volume (Peak 2, Fig. 2) were dissolved in 1 ml of 0.125 M sodium formate- M urea (pH 3.0), incubated for 12 hours at room temperature, and applied to a Sephadex G-100 urea column (Fig. 4). The elution pattern showed one major peak (95% of t,he protein applied) at 5001, total column volume and one minor component emerging at 96% total column volume. Starch gel electrophoresis of the major peak (Fig. 3, Pattern 4) and the minor peak (Fig. 3, Pattern 5) on 0.026 M sodium formate-8 M urea (pH
3.0) indicated that the pattern of migration of both of these
by guest on July 7, 2018http://w
ww
.jbc.org/D
ownloaded from
Issue of November 10, 1967 L. G. Tomasi and X. E. Kornguth 4937
peaks was the same as that of the sample applied (Fig. 3, Pattern 8.
Chromatography on Amberlite IRC-5U-Polyacrylamide gel electrophoresis of Peak 2 (Fig. 2) revealed several minor bands in addition to the single major band (Fig. 5, Pattern 1). Further purification of this fraction was achieved by chromatography on Amberlite IRC-50. This fraction was resolved into three peaks as shown by the elution pattern (Fig. 6). Rechromatography of Peak 3 (Fig. 6) under identical conditions resulted in the elu- tion of a single peak at the same concentration of guanidinium chloride. Polyacrylamide gel electrophoresis of the three chro- matographic peaks is shown in Fig. 5. Peak 1 (Fig. 5, Pattern 2) and Peak 2 (Fig. 5, Pattern S) contain all of the minor bands that remained in the preparation after gel filtration. These minor bands were not resolved by chromatography on Amberlite IRC- 50 under these conditions, but the bands migrating faster were concentrated in Peak 2. Peak 3 (Fig. 5, Pattern 4) contained the major component of the preparation. Samples from the center region and the leading and trailing edges of Peak 3 migrated as single bands with identical mobilities on polyacrylamide.
Characterization of Basic Protein-The absorption spectrum of the purified basic protein is shown in Fig. 7. This spectrum shows a single absorption maximum at 275 rnp with an extinc- tion coefficient of 400 per g of protein at 280 rnp.
The amino acid analysis in moles per cent of the purified basic protein is given in Table I. The high percentage of lysine and arginine with respect to aspartic and glutamic acid confirms the basic nature of the protein. Neither half-cystine residues nor cysteic acid residues could be detected by amino acid analysis performed on a complete acid hydrolysate of the protein.
The determination of the NHz-terminal amino acid was done by the Edman method as modified by Light and Greenberg (24). A single spot could be detected on thin layer chromatography in each of the two systems described in “Experimental Procedure.” The RF of this spot was identical to the phenylthiohydantoin derivative of glycine. The Rp in Solvent 2 was 0.51; the RF in Solvent 3 was 0.18.
Sedimentation studies of the pig brain basic protein were con- ducted in a Spinco model E analytical ultracentrifuge. The pig brain basic protein sedimented as a single symmetrical peak (Fig. 8) with a s20,w of 1.5 S.
DISCUSSION
A procedure for the isolation of large quantities of a soluble basic protein has been described in the present report. This procedure involves repeated extractions with chloroform-metha- nol, 10% sodium chloride, and dilute hydrochloric acid. The repeated acid extraction resulted in a considerable fractionation of the proteins present in the “defatted material.”
Our interest in the basic proteins of the central nervous system (1,9, 17,29) led us to investigate the proteins present in the more acidic extracts. The protein described in this report is the major component of the pH 2.4 to 2.6 fraction. The migration of the protein on polyacrylamide during electrophoresis at pH 4.3, and on starch gel during electrophoresis at pH 3.0 is indicative of the basic nature of this protein. From amino acid analysis, it was determined that the sum of the lysine and arginine is 18 moles % while the sum of the aspartic and glutamic acids is 12.8 moles %. Even assuming that all the acidic amino acids are unamid- ated, the ratio of basic to acidic amino acids is greater than 1.5 which is consistent with the electrophoretic mobility.
The procedure employed in the final purification (chromatog- raphy on Amberlite IRC-50 with a guanidinium chloride gradi- ent) is similar to that used in the purification of histones (4, 5, 7). There are many similarities between the amino acid composition of the pig brain basic protein and that of the histones. The basic amino acids constitute approximately 25 moles y0 of the pig brain basic protein which is in the range found for histones (30). The absence of cysteine and the presence of a high proline content are other points in common with lysine-rich histones (4, 7). Differences from the lysine-rich histones are found in the high histidine and glycine content as well as the low alanine con- tent of the pig brain basic protein. Glycine is the predominant neutral amino acid as well as the amino-terminal amino acid in the pig brain basic protein whereas in the lysine-rich histones alanine is the predominant neutral amino acid and commonly the amino-terminal amino acid (31).
Proteins with an almost identical amino acid composition to that of the basic protein have been found in acid extracts of bovine spinal cord (32) and bovine brain white matter (33). Both of the proteins extracted from the bovine central nervous system have been shown to induce experimental allergic encepha- lomyelitis in animals (34, 35).
Ultracentrifugation and gel filtration were used in the char- acterization of the basic protein. The sedimentation constant of the basic protein obtained by ultracentrifugation at high and low protein concentration was 1.5 S, and the elution of the protein from Sephadex G-100 occurred at 50% total column volume. The molecular weight of the basic protein, as estimated from ultracentrifugation, was 20,000, while the apparent molecular weight of the protein obtained by gel filtration was 50,000. The estimation of the molecular weight of histones by ultracentrifuga- tion and gel filtration has resulted in a similar discrepancy (11, 31, 36). It has been postulated that this discrepancy is due to aggregation of the histones under the conditions of gel filtration (37, 38) rather than to polyelectrolyte interactions during cen- trifugation (39).
The occurrence of aggregation during gel filtration was investi- gated by measuring the elution volume from Sephadex G-100 at the same pH and ionic strength as was used in the ultracentrifuga- tion (0.2 p sodium phosphate, pH 7.4). The pig brain basic protein was eluted at 50% total column volume which was identi- cal wit,h the elution pattern obtained from Sephadex G-100 at pH 3.7. This indicated that the molecular species eluted from Sephadex G-100 was identical with that examined in the ultra- centrifuge. These results are not consistent with the postulate that the discrepancy betweenultracentrifugationand gel filtration was due to aggregation. To investigate further the conformation present in solution, the basic protein was passed through Se- phadex G-100 equilibrated with 8 M urea. The observation that the protein had the same elution volume in the presence of 8 M
urea as in the other systems indicated that the conformation of the pig brain basic protein is not dependent on either hydrogen or hydrophobic bonds. These results are consistent with the postulate that the discrepancy between the molecular weight estimated from ultracentrifugation and gel filtration is due to the nonspherical conformation of the pig brain basic protein. His- tones have been characterized as flexible disordered proteins with a low a-helical content (40, 41), and their behavior on gel fil- tration would also be consistent with the above postulate.
Acknowledgments-We would like to express our appreciation
by guest on July 7, 2018http://w
ww
.jbc.org/D
ownloaded from
4938 Pig Brain Basic Protein Vol. 242, No. 21
to Dr. M. A. Stahmann for the amino acid analysis, to Dr. H. F. Deutsch and Mr. Robert J. Carrico for the analytical ultra- centrifugation, and to Miss Judith Oldenberg for her valuable assistance. We are also grateful to Oscar Mayer and Company for the fresh pig brains.
REFERENCES
1. KORNGUTH, S. E., AND THOMPSON, H. G., JR., Arch. Biochem. Biophys., 105, 308 (1964).
2. CR.~MPTON, C. F., AND PETERMANN, M. L., J. Biol. Chem., 234, 2642 (1959).
3. CRIDDLE, R. S., BOCK, R. M., GREEN, D. E., AND TISDALE, H., B&hem&try, 1, 827 (1962).
4. RASMUSSEN. P. S.. MURRAY. K.. AND LUCK. J. M.. B&hem- istry, 1, 79 (1962). ’ ’
5. CRAMPTON, C. F., STEIN, W. H., AND MOORE, S., J. Biol. Chem., 225, 363 (1957).
6. CRIDDLE, R. S., AND PARK, L.. Biochem, Biophys. Res. Com- mm., i7, 74 (1964).
-
7. KINKADE. J. M.. JR.. AND COLE. R. D.. J. Biol. Chem.. 241. 5790 (1966). ’ ’
I
8. KINK.4DE, J. M., JR., AND COLE, R. D., J. Biol. Chem., 241, 5798 (1966).
9. KORNGUTH. S. E., AND ANDERSON, J. W.. J. Cell Biol.. 26, 157 (1965).
10. WALKER. I. 0.. J. Mol. Biol.. 14. 381 (1965). 11. BUSCH, H., H&tones and other ‘nuclekr pioteins, Academic
Press, New York, 1965, p. 91. 12. PETERMANN, M. L., The physical and chemical properties of
ribosomes, Elsevier, Amsterdam, 1964, p. 156. 13. BONNER, J., HUANG, R. C., AND GILDEN, R. V., Proc. Nat.
Acad. Sci. U. S. A., 50, 893 (l963). 14. Hu~~NG, R. C., AND BONNER, J., Proc. Nat. Acad. Sci. U. S. A.,
48, 1216 (1962). 15. ALLFREY, V. G., LITTAU, V. C., AND MIRSKY, A. E., Proc.
Nat. Acad. Sci. U. S. A., 49, 414 (1962). 16. TR.~uB, P., HOSOKAWA, K., AND NOMURA, M., Fed. Proc.,
25, 581 (1966). 17. KORNGUTH, S. E., ANDERSON, J. W., END SCOTT, G., J. Comp.
Neural., 127, 1 (1966).
18.
19. 20.
21.
22.
23.
24. 25.
26.
27. 28.
29.
30.
31. 32.
33.
34.
35.
36.
37.
38. 39.
40. 41.
SAT~KE, K., RASMUSSEN, P. S., AND LUCK, J. M., J. Biol. Chem:, 236, 2801 (1960):
SMITHIES. 0.. Advance. Protein Chem.. 14. 65 (1959). REISFELD, R.‘A., LEWIS, U. J., AND WILLIAMS, ‘D. E’., Nature,
195, 281 (1962). HIRS, C. H. W., MOORE, S., BND STEIN, W. H., J. Biol. Chem.,
200, 493 (1953). SPSCKMAN, D. H., STEIN, W. H., AND MOORE, S., Anal. Chem.,
30, 1190 (1958). CRESTFIELD, A. M., MOORE, S.. AND STEIN, W. H., J. Biol.
Chem., 238, 622 (i963). LIGHT. A.. AND GREENBERG. J.. J. Biol. Chem.. 240. 258 (19651. FRIENKE&ONR~T, H., in D. GLICK (Editor), ‘Methbds~ of
biochemical analysis, Vol. IZ, Interscience Publisher, Inc., New York, 1955, p. 391.
STAHL, E., in E. STAHL (Editor), Thin-layer chromatography, Springer-Verlag, New York, 1965, p. 430.
SJOQUIST, J., Acta Chem. &and., 7, 477 (1953). SCHACHMSN. H. K.. AND EDELSTEIN, S. J.. Biochemistry. 5,
2681 (1966). “I
KORNGUTH, S. E., ANDERSON, J. W., LADINSKY, J., AND THOMPSON, H. G., Jn.. &P. CeZZ Res., 37, 650 (1965).
MURRIY, K.; in J. BONNER AND P. 0. P. Ts’o (Editors), The Nucleohistones, Holden-Day, Inc., San Francisco, 1964.
MURRAY, K., Annu. Rev. Biochem., 34, 209 (1965). NAKAO, A., DAVIS, W. J., AND EINSTEIN, E. R., Biochim.
Biophys. Acta, 130, 163 (1966). MARTENSON, R. E., AND LE BYRON, F. N., J. Neurochem., 13,
1469 (1966). NAK.~o, A., DAVIS, W. J., END EINSTEIN, E. R., Biochim.
Biophys. Acta, 130, 171 (1966). KIES, M. W., ALVORD, E. C., JR., MARTENSON, R. E., AND
LE BARON, F. N., Science, 151, 821 (1966). JOHNSON, L. D., DRIEDGER, A., .~ND MARKO, A. M., Can. J.
Biochem. Physiol., 42, 795 (1964). CRUFT, H. J., MAURITZEN, C. M., .\ND STEDMAN, E., Phil.
Trans. Roy. Sot. London, Ser. B, 241, 93 (1957). CRUFT, II. J., Biochim. Biophys. Acta, 54, 611 (1961). TELLER, D. C., KINKADE, J. M., JR., AND COLE, R. D., Bio-
them. Biophys. Res. Commun., 20, 739 (1965). JIRGENSONS, B., J. Biol. Chem., 242, 912 (1967). BRllDBURY, E. M., CRANE-ROBINSON, C., PHILLIPS, D. M. P.,
JOHNS, E. W., AND MURRAY, K., iVature, 206, 1315 (1965).
by guest on July 7, 2018http://w
ww
.jbc.org/D
ownloaded from
Lawrence G. Tomasi and S. E. KornguthPurification and Partial Characterization of a Basic Protein from Pig Brain
1967, 242:4933-4938.J. Biol. Chem.
http://www.jbc.org/content/242/21/4933Access the most updated version of this article at
Alerts:
When a correction for this article is posted•
When this article is cited•
to choose from all of JBC's e-mail alertsClick here
http://www.jbc.org/content/242/21/4933.full.html#ref-list-1
This article cites 0 references, 0 of which can be accessed free at
by guest on July 7, 2018http://w
ww
.jbc.org/D
ownloaded from