Purdue Chemical Engineering Undergraduate … Chemical Incidents CSB study of 167 US reactive...
50
Purdue Chemical Engineering Undergraduate Process Safety Research November 10, 2016 1
Transcript of Purdue Chemical Engineering Undergraduate … Chemical Incidents CSB study of 167 US reactive...
Purdue Chemical Engineering
Undergraduate Process Safety Research
November 10, 2016
1
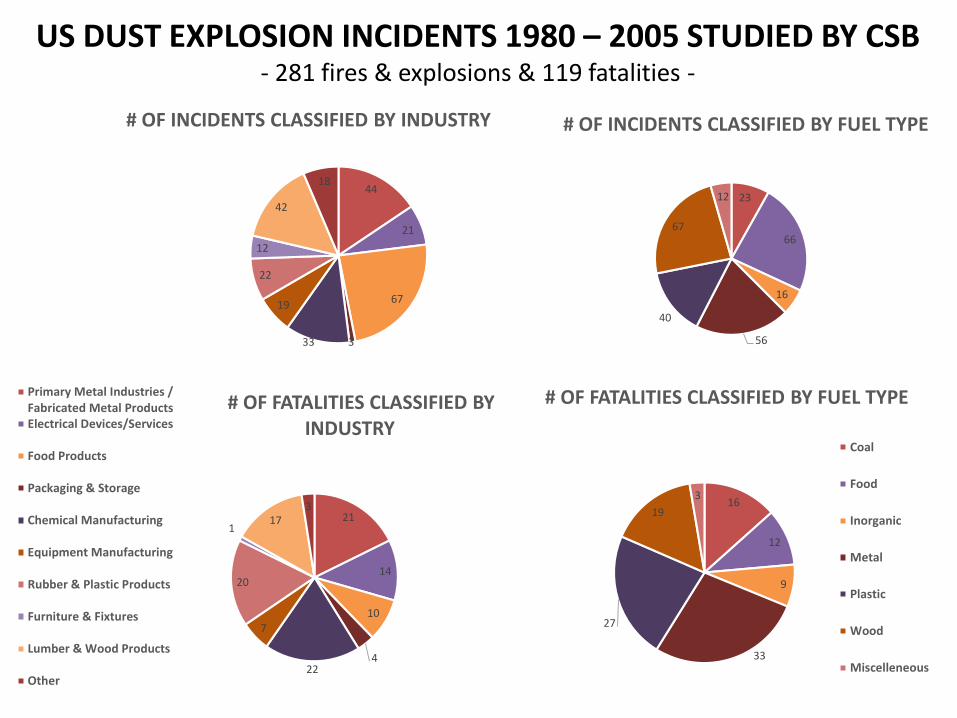
US DUST EXPLOSION INCIDENTS 1980 – 2005 STUDIED BY CSB- 281 fires & explosions & 119 fatalities -
44
21
67
333
19
22
12
42
18
# OF INCIDENTS CLASSIFIED BY INDUSTRY
21
14
10
422
7
20
117
3
# OF FATALITIES CLASSIFIED BY INDUSTRY
Primary Metal Industries /Fabricated Metal ProductsElectrical Devices/Services
Food Products
Packaging & Storage
Chemical Manufacturing
Equipment Manufacturing
Rubber & Plastic Products
Furniture & Fixtures
Lumber & Wood Products
Other
23
66
16
56
40
67
12
# OF INCIDENTS CLASSIFIED BY FUEL TYPE
16
12
9
33
27
19
3
Coal
Food
Inorganic
Metal
Plastic
Wood
Miscelleneous
# OF FATALITIES CLASSIFIED BY FUEL TYPE
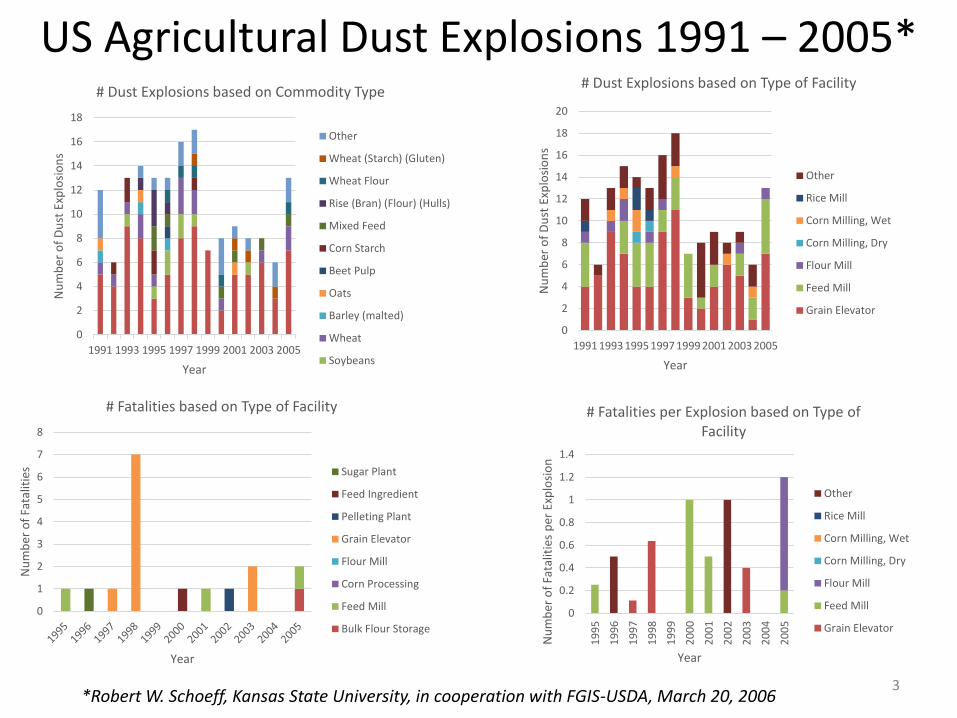
US Agricultural Dust Explosions 1991 – 2005*
3
0
2
4
6
8
10
12
14
16
18
20
1991 1993 1995 1997 1999 2001 2003 2005
Nu
mb
er o
f D
ust
Exp
losi
on
s
Year
# Dust Explosions based on Type of Facility
Other
Rice Mill
Corn Milling, Wet
Corn Milling, Dry
Flour Mill
Feed Mill
Grain Elevator
0
2
4
6
8
10
12
14
16
18
1991 1993 1995 1997 1999 2001 2003 2005
Nu
mb
er o
f D
ust
Exp
losi
on
s
Year
# Dust Explosions based on Commodity Type
Other
Wheat (Starch) (Gluten)
Wheat Flour
Rise (Bran) (Flour) (Hulls)
Mixed Feed
Corn Starch
Beet Pulp
Oats
Barley (malted)
Wheat
Soybeans
*Robert W. Schoeff, Kansas State University, in cooperation with FGIS-USDA, March 20, 2006
0
1
2
3
4
5
6
7
8
Nu
mb
er o
f Fa
talit
ies
Year
# Fatalities based on Type of Facility
Sugar Plant
Feed Ingredient
Pelleting Plant
Grain Elevator
Flour Mill
Corn Processing
Feed Mill
Bulk Flour Storage
0
0.2
0.4
0.6
0.8
1
1.2
1.4
19
95
19
96
19
97
19
98
19
99
20
00
20
01
20
02
20
03
20
04
20
05
Nu
mb
er o
f Fa
talit
ies
per
Exp
losi
on
Year
# Fatalities per Explosion based on Type of Facility
Other
Rice Mill
Corn Milling, Wet
Corn Milling, Dry
Flour Mill
Feed Mill
Grain Elevator

Reactive Chemical Incidents CSB study of 167 US reactive chemical incidents from 1980 – 2001 with 108 fatalities
14%
17%
20%
49%
Incidents by Region
West
NorthEast
MidWest
South
36%
8%35%
2%
19%
Incidents by Accident TypeThermal Run Away
Thermal/MechanicalShockIncompatibleMaterialsOther
Unknown
11%
14%
20%
55%
Deaths by Region
West
NorthEast
Midwest
South
47%
21%
18%
7%7%
Deaths by Accident TypeThermal Run Away
Thermal/MechanicalShockIncompatibleMaterialsOther
Unknown
Source: Chemical Safety Board, Improving Reactive Hazard Management, Reactive Incident Data Table, 1980 to 2001
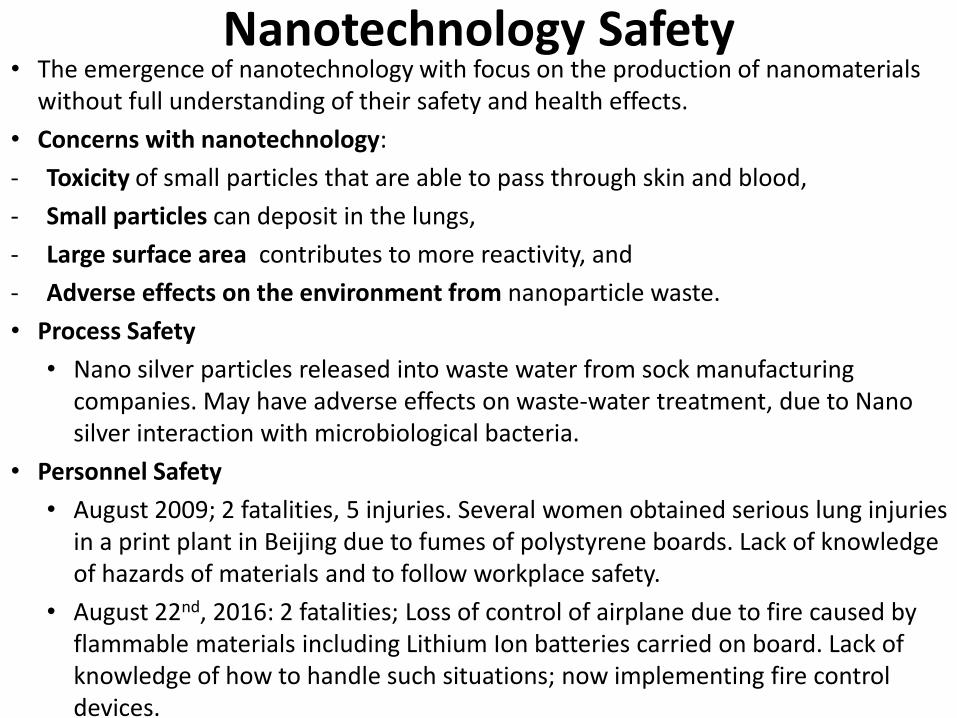
Nanotechnology Safety• The emergence of nanotechnology with focus on the production of nanomaterials
without full understanding of their safety and health effects.
• Concerns with nanotechnology:
- Toxicity of small particles that are able to pass through skin and blood,
- Small particles can deposit in the lungs,
- Large surface area contributes to more reactivity, and
- Adverse effects on the environment from nanoparticle waste.
• Process Safety
• Nano silver particles released into waste water from sock manufacturing companies. May have adverse effects on waste-water treatment, due to Nano silver interaction with microbiological bacteria.
• Personnel Safety
• August 2009; 2 fatalities, 5 injuries. Several women obtained serious lung injuries in a print plant in Beijing due to fumes of polystyrene boards. Lack of knowledge of hazards of materials and to follow workplace safety.
• August 22nd, 2016: 2 fatalities; Loss of control of airplane due to fire caused by flammable materials including Lithium Ion batteries carried on board. Lack of knowledge of how to handle such situations; now implementing fire control devices.
6
Chemical Process Safety @ Purdue
– CHE 420; Required senior level course
November 10, 2016
Dr. Ray A. Mentzer
Purdue University

7
BP Texas City, 2005; 15 fatalitiesPiper Alpha, UK 1988; 167 fatalities
Imperial Sugar, Georgia – 2008; 14 fatalitiesWest, TX – 2013; 15 fatalities
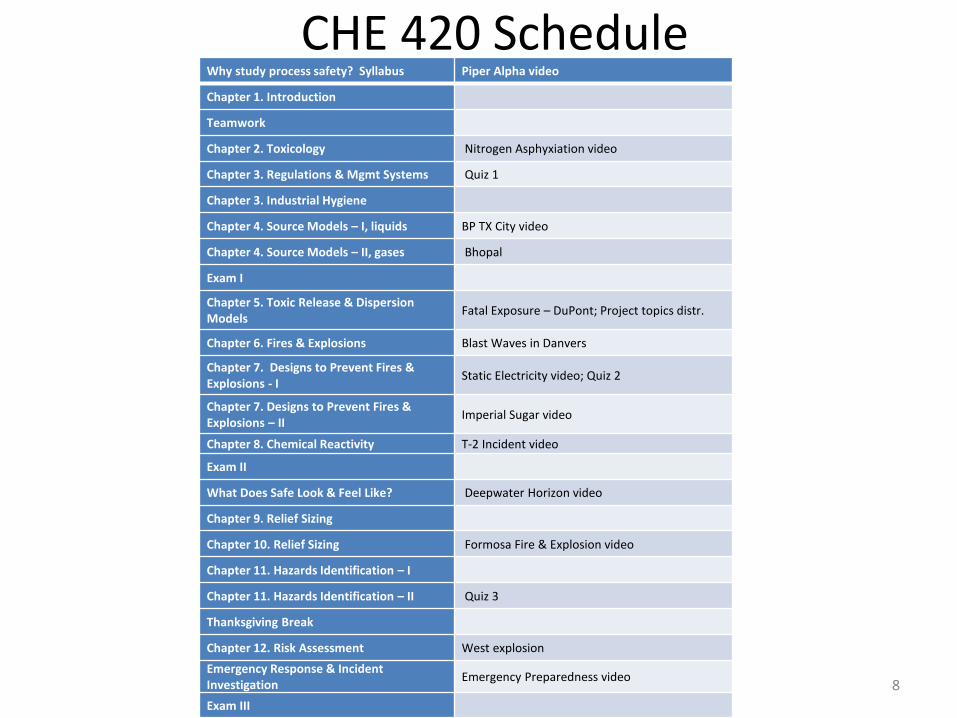
CHE 420 ScheduleWhy study process safety? Syllabus Piper Alpha video
Chapter 1. Introduction
Teamwork
Chapter 2. Toxicology Nitrogen Asphyxiation video
Chapter 3. Regulations & Mgmt Systems Quiz 1
Chapter 3. Industrial Hygiene
Chapter 4. Source Models – I, liquids BP TX City video
Chapter 4. Source Models – II, gases Bhopal
Exam I
Chapter 5. Toxic Release & Dispersion Models
Fatal Exposure – DuPont; Project topics distr.
Chapter 6. Fires & Explosions Blast Waves in Danvers
Chapter 7. Designs to Prevent Fires & Explosions - I
Static Electricity video; Quiz 2
Chapter 7. Designs to Prevent Fires & Explosions – II
Imperial Sugar video
Chapter 8. Chemical Reactivity T-2 Incident video
Exam II
What Does Safe Look & Feel Like? Deepwater Horizon video
Chapter 9. Relief Sizing
Chapter 10. Relief Sizing Formosa Fire & Explosion video
Chapter 11. Hazards Identification – I
Chapter 11. Hazards Identification – II Quiz 3
Thanksgiving Break
Chapter 12. Risk Assessment West explosion
Emergency Response & Incident Investigation
Emergency Preparedness video
Exam III
8

Process Incident DefinitionA process incident is the sudden unintended release of or exposure to a hazardous substance, which results in or might reasonably have resulted in, deaths, injuries, significant property or environmental damage, evacuation or sheltering in place.
10T-2 Laboratories, FL – ’09; 4 fatalities
VS.
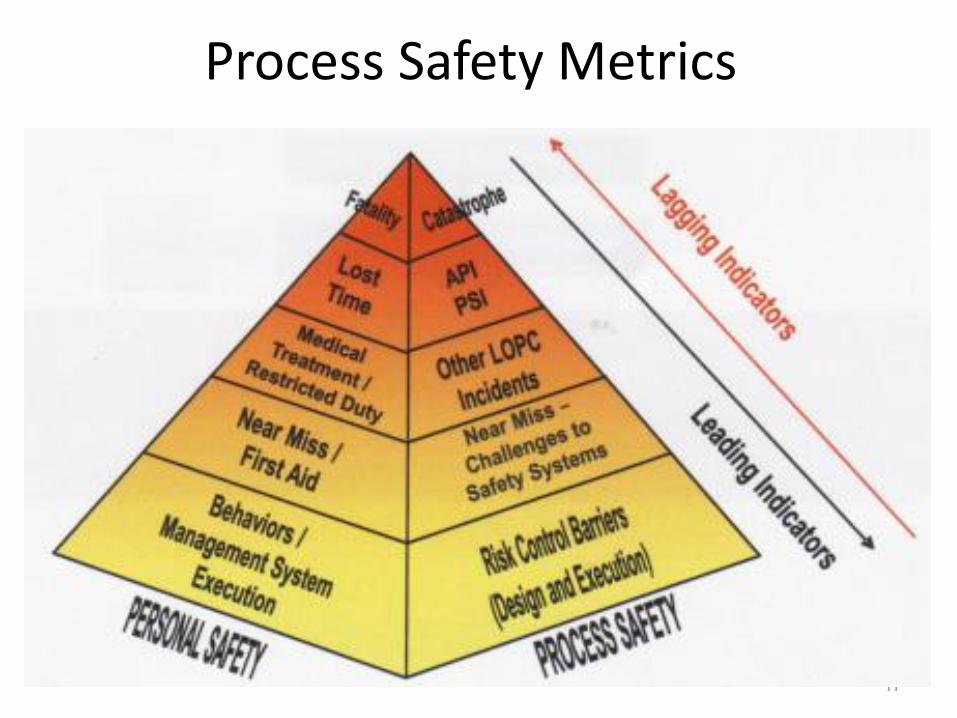
Process Safety Metrics
11

OSHA Process Safety Management Program **14 elements**
Employee Participation
Process Hazards Analysis
Training
Pre-startup Safety Review
Hot Work Permits
Incident Investigation
Compliance Audit
Process Safety Information
Operating Procedures
Contractors
Mechanical Integrity
Management of Change
Emergency Planning & Response
Trade Secrets
Industrial Compliance with PSM, RMP, …
• How does industry comply with the various federal, state & local regulations?
• Are regulations the minimum standard … and should companies consider implementing PSM type requirements at other sites, beyond PSM required sites?
• What about international sites? Should those facilities be held to a different (only local?) standard? What about PSM type requirements?
– Should international employees be exposed to different levels of risk than domestic employees with same company?
13

Industrial Compliance with OSHA PSM
- ExxonMobil’s “Operations Integrity Mgmt System” (OIMS) for all global operations - Many other companies have similar systems
14

15
Anatomy of a Release
Failure Source Term Release and Dispersion
Toxic
Flammable
Immediate Delayed
Ignition Ignition

RISK = CONSEQUENCE X FREQUENCY
Much of course addresses toxics & flammables
16
Source Term Modeling – lbs / hr
• How does one determine the volume of a liquid or gas release for Emergency Response Planning?
• What’s the Source or Volume term for various scenarios examined?
• ‘Tank problems’ - time to drain tank through hole or broken pipe, volume lost in time required to respond to mishap, maximum spill rate, etc?
• What’s special about ‘choke’ flow conditions for gases in terms of upstream / downstream pressures & fluid velocity?
17

18
Tank Liquid Discharge: Leak Time, Qm(t)
te 1
Co g
At
A
2gcPg
ghL
o
2gc Pg
Time to leak at Pg:
Where ‘A’ is the area of the hole & the subscript ‘t’
means tank. The time to empty tank at Pg ~ 0, for tank
at atmospheric P:te
1
Co g
At
A
2ghLo
--------------------------------------------
Substitute hL(t) into original Qm to obtain Qm(t),mass
discharge rate at any time:
ACo 2gcPg
ghL
o
gCo
2A2
At
tQm u A =
Initial height of liquid,
hLo
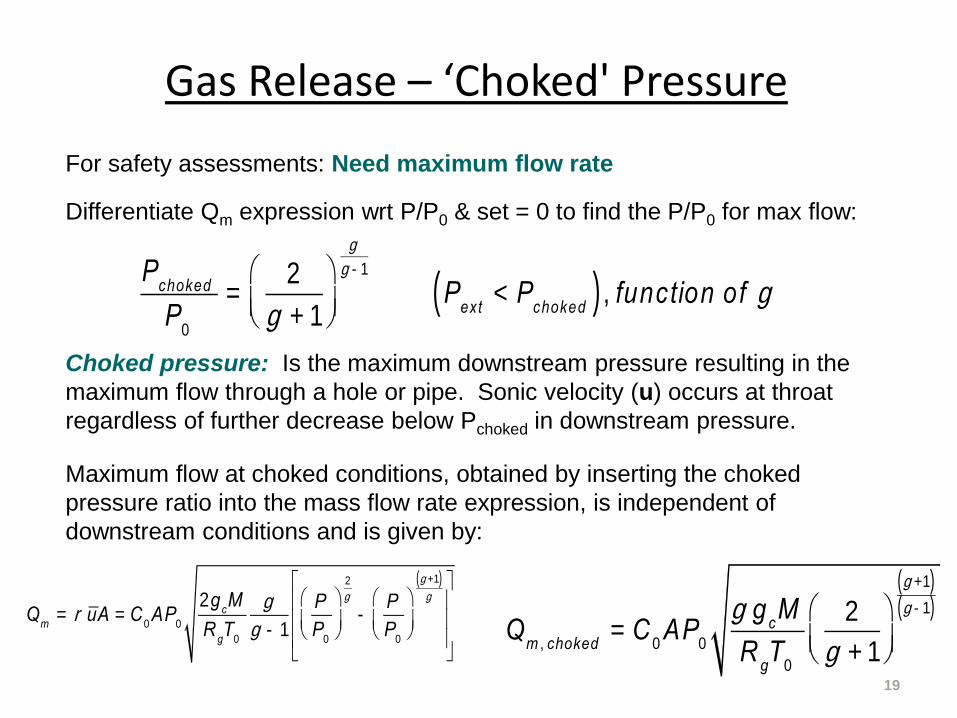
Gas Release – ‘Choked' Pressure
19
For safety assessments: Need maximum flow rate
Differentiate Qm expression wrt P/P0 & set = 0 to find the P/P0 for max flow:
Choked pressure: Is the maximum downstream pressure resulting in the
maximum flow through a hole or pipe. Sonic velocity (u) occurs at throat
regardless of further decrease below Pchoked in downstream pressure.
Maximum flow at choked conditions, obtained by inserting the choked
pressure ratio into the mass flow rate expression, is independent of
downstream conditions and is given by:
Pchoked
P0
=2
g + 1
æ
èçö
ø÷
g
g -1
Pext
< Pchoked( ) , function of g
Qm , choked
= C0AP
0
g gcM
RgT
0
2
g + 1
æ
èçö
ø÷
g +1( )g -1( )
Qm
= r uA = C0AP
0
2gcM
RgT
0
g
g - 1
P
P0
æ
èç
ö
ø÷
2
g
-P
P0
æ
èç
ö
ø÷
g +1( )g
é
ë
êêê
ù
û
úúú

20
Adiabatic Choked Gas Flow, Through Pipe
P1, T1, u1, Ma1 Pchoked, T2, as, Ma2 =1
External, P < Pchoked
Q 0
1 1 22 ( )
i
cg
f
g P PmG Y
A K
Yg Ma1
K fi
2
P1
P1 P2
Mass flux Gas expansion factor,
∆z ~ 0; Ws = 0
Yg
(choked or not choked; ideal gas)
G is mass flux, K frictional term, alpha ratio of heat
capacities, Y gas unit-less gas expansion factor
(choked only)
Mach is the ratio of the gas velocity to the velocity of sound in the gas
<Simplified procedure per pages 150 – 153 of text>

RISK = CONSEQUENCE X FREQUENCY
Much of course addressing toxics & flammables
21
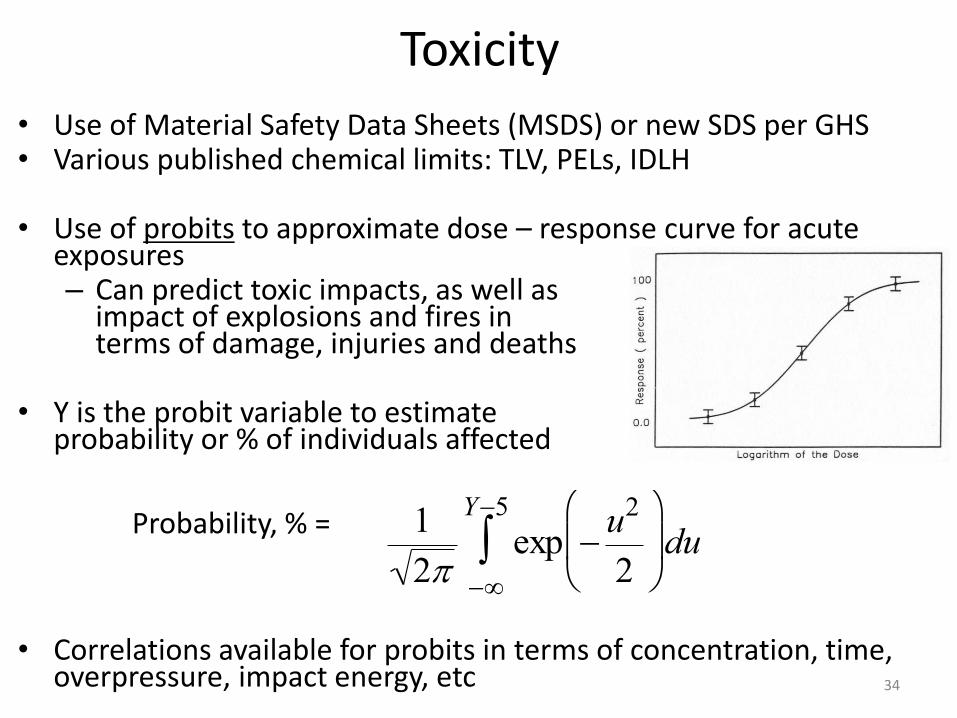
Toxicity
• Use of Material Safety Data Sheets (MSDS) or new SDS per GHS• Various published chemical limits: TLV, PELs, IDLH
• Use of probits to approximate dose – response curve for acute exposures – Can predict toxic impacts, as well as
impact of explosions and fires in terms of damage, injuries and deaths
• Y is the probit variable to estimate probability or % of individuals affected
Probability, % =
• Correlations available for probits in terms of concentration, time, overpressure, impact energy, etc 34
1
2exp
u2
2
Y5
du

23
Example Probit Estimation
• A blast produces a peak overpressure of 6 psig.
– What fraction of structures will be damaged by exposure to this overpressure?
– What fraction of people exposed will die as a result of lung hemorrhage?
– What fraction will have eardrums ruptured?
– What are some conclusions about the effects of this blast?

24
Chronic Workplace Exposures - Single & multiple volatile toxicants
- Dust & noise handled much the same way
- Toxic vapors in enclosure, with ventilation (e.g., standing near opening to storage tank)
where Qm is the source term, Qv the ventilation rate & k mixing factor
- Vaporization of liquid
where K the mass transfer coefficient & A the area of opening
Cppm QmRgT
k QvPM106
wt
0
)( 8
1 tCTWA
6
v
sat
ppm 10 X PkQ
PAK C

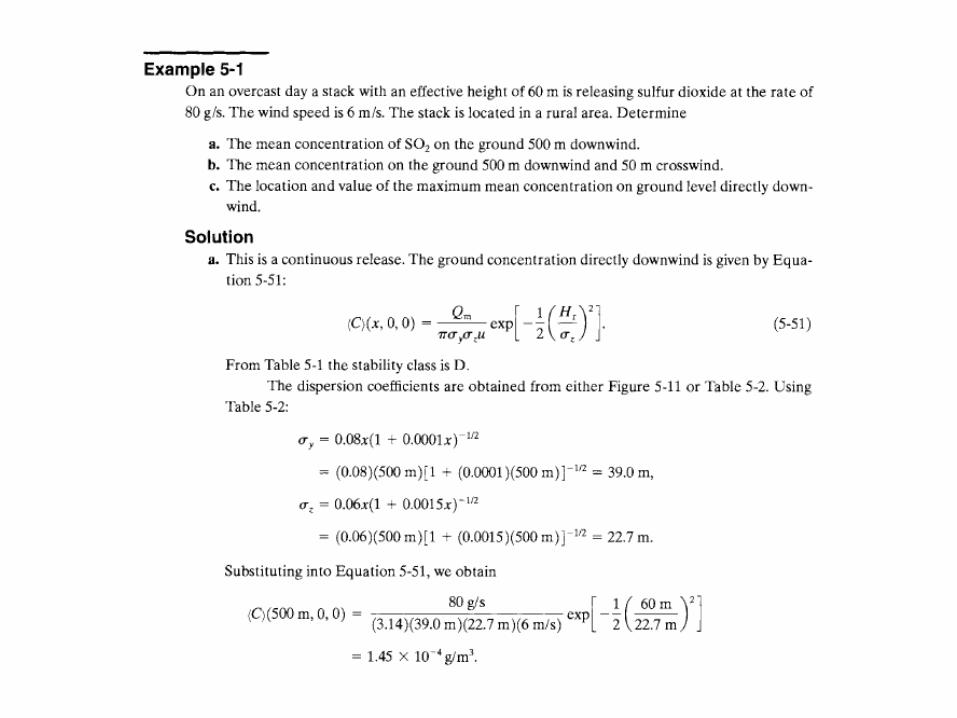
Vapor Releases & Air Dispersion Modeling
• How to estimate the downwind concentration of a chemical continuously released?
• Suppose the release is elevated, such as from a stack?
• How do the calculations change if the release is instantaneous vs. continuous … such as for an upset?
• What are the important variables involved in dispersion modeling? What does one need to know / assume ….?
• What are the criteria for the airborne concentration of toxics & how do they differ from PELs, TLVs, etc?
25
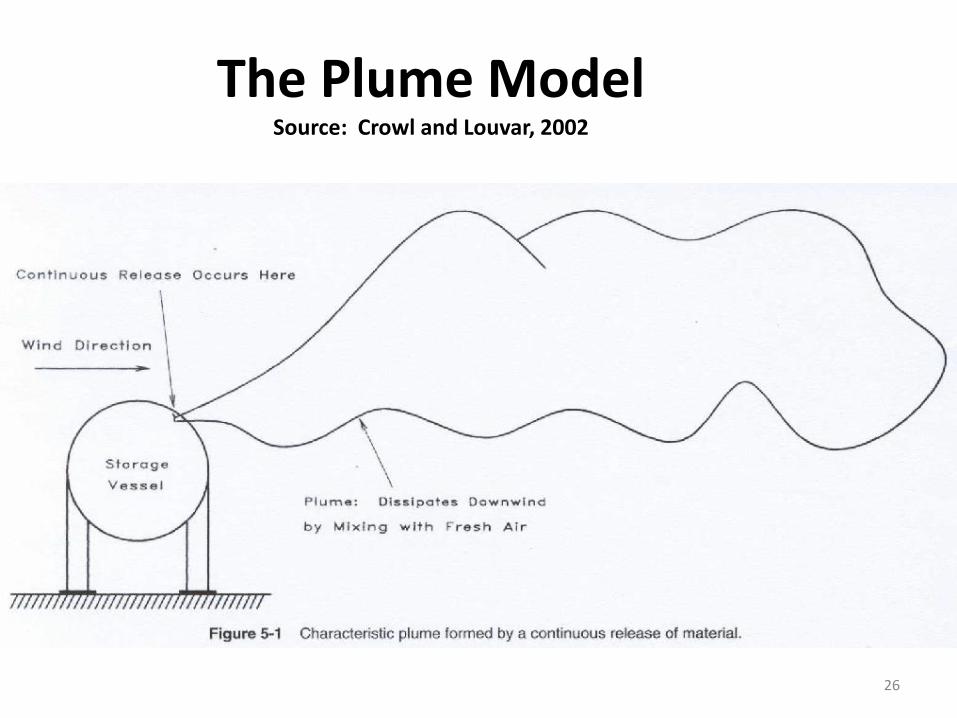
The Plume ModelSource: Crowl and Louvar, 2002
26

Neutrally Buoyant Dispersion Models (Gaussian Models)
For a release of a gas, assuming no reaction or molecular diffusion and
mixing by turbulence, the material concentration and air velocity are related by:
where uj is the velocity of the air and the subscript j indicates summation
over x, y & z.
After various simplifying assumptions and introducing the eddy diffusivity, K,
one arrives at the fundamental equation for dispersion modeling:
C
t
x j
(u jC) 0
C
t uj
C
x j
xj
K j
C
x j
28
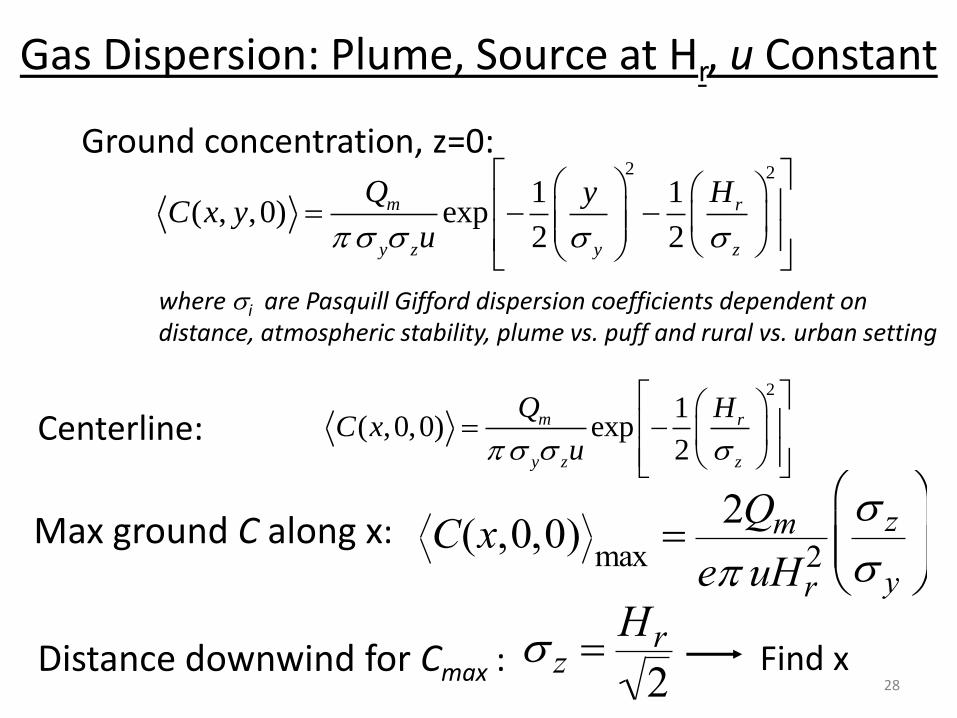
Gas Dispersion: Plume, Source at Hr, u Constant
2 2
1 1( , ,0) exp
2 2
m r
y z y z
Q HyC x y
u
Ground concentration, z=0:
Centerline:
Max ground C along x:
C(x,0,0)max
2Qm
e uHr2
z
y
Distance downwind for Cmax :
z Hr
2Find x
2
1( ,0,0) exp
2
m r
y z z
Q HC x
u
where i are Pasquill Gifford dispersion coefficients dependent on distance, atmospheric stability, plume vs. puff and rural vs. urban setting

Dispersion Modeling• Key Variables / Factors
– Quantity of release
– Wind speed
– Atmospheric stability – stable, neutral, unstable
– Ground conditions – rural vs. urban .. buildings, open water, trees, …
– Height of release above ground
– Momentum and buoyancy of the initial release
• Toxic Effect Criteria– Various criteria for short term exposures at higher than
TLV-TWA values available from many sources: ERPG, TLV-STEL, TLV-C, IDLH, …, EEGL, Toxic Endpoints
29
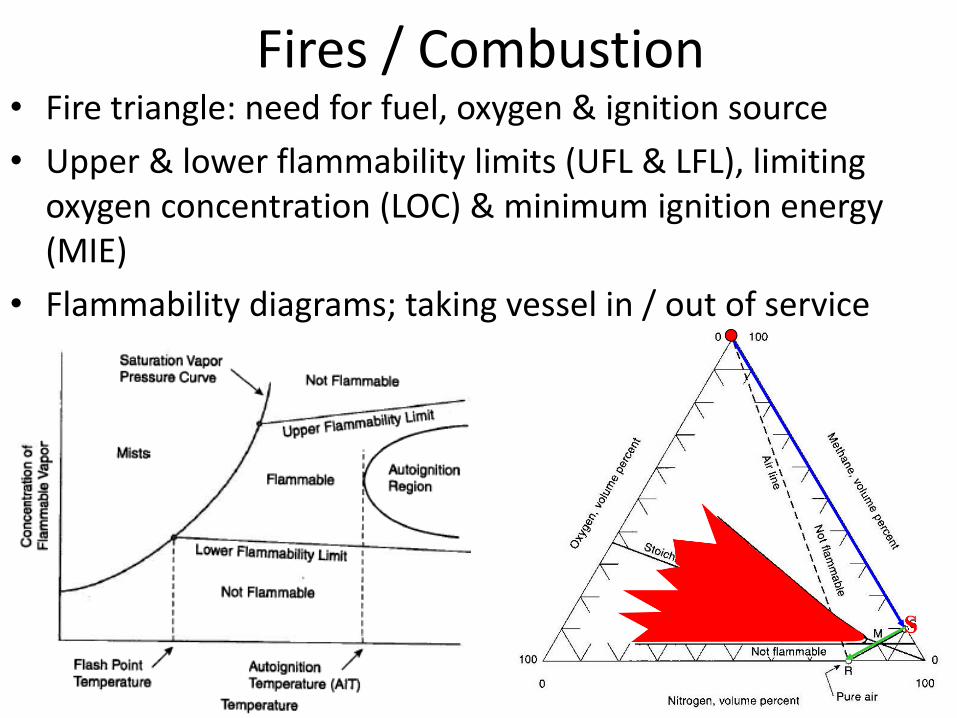
Fires / Combustion • Fire triangle: need for fuel, oxygen & ignition source
• Upper & lower flammability limits (UFL & LFL), limiting oxygen concentration (LOC) & minimum ignition energy (MIE)
• Flammability diagrams; taking vessel in / out of service
31
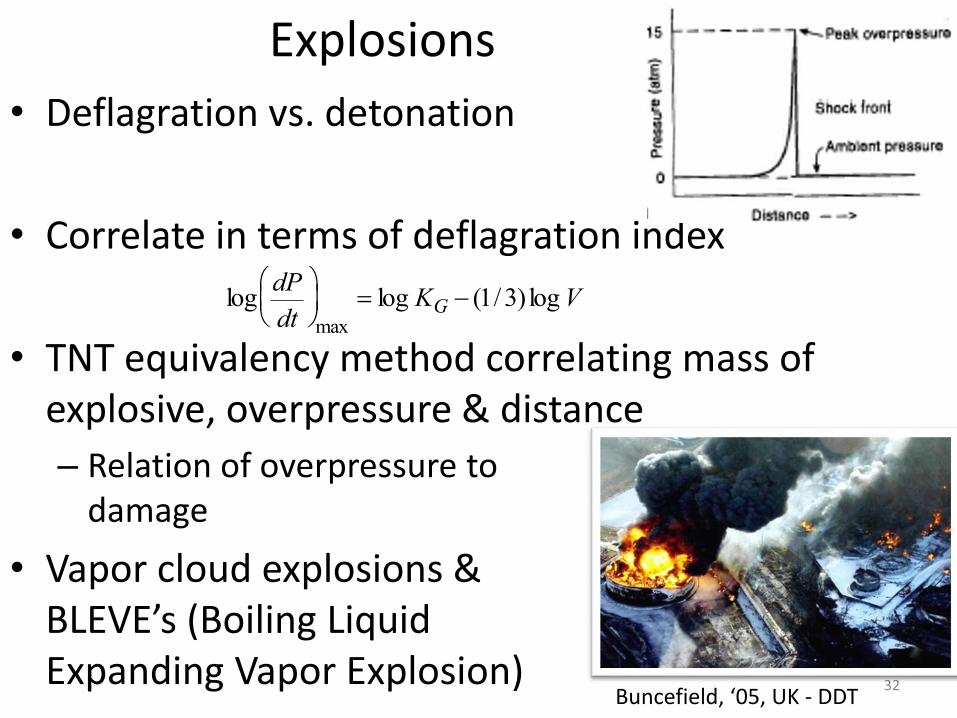
Explosions
• Deflagration vs. detonation
• Correlate in terms of deflagration index
• TNT equivalency method correlating mass of explosive, overpressure & distance
– Relation of overpressure to damage
• Vapor cloud explosions & BLEVE’s (Boiling Liquid Expanding Vapor Explosion) 32
logdP
dt
max
log KG (1/3)log V
Buncefield, ‘05, UK - DDT
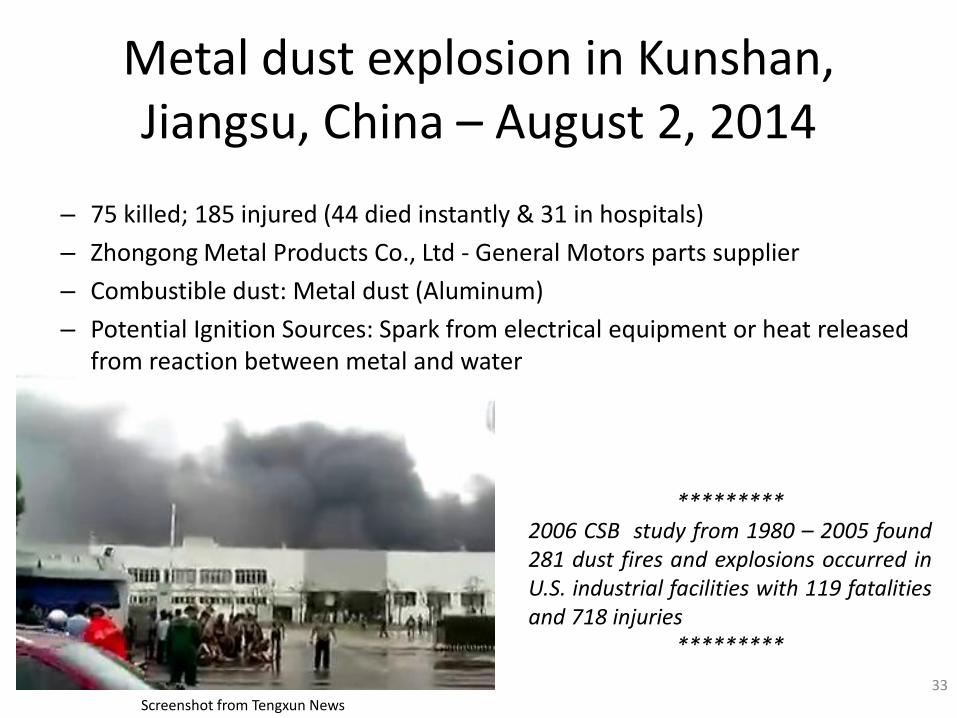
Metal dust explosion in Kunshan, Jiangsu, China – August 2, 2014
– 75 killed; 185 injured (44 died instantly & 31 in hospitals)
– Zhongong Metal Products Co., Ltd - General Motors parts supplier
– Combustible dust: Metal dust (Aluminum)
– Potential Ignition Sources: Spark from electrical equipment or heat released from reaction between metal and water
33
Screenshot from Tengxun News
*********2006 CSB study from 1980 – 2005 found281 dust fires and explosions occurred inU.S. industrial facilities with 119 fatalitiesand 718 injuries
*********
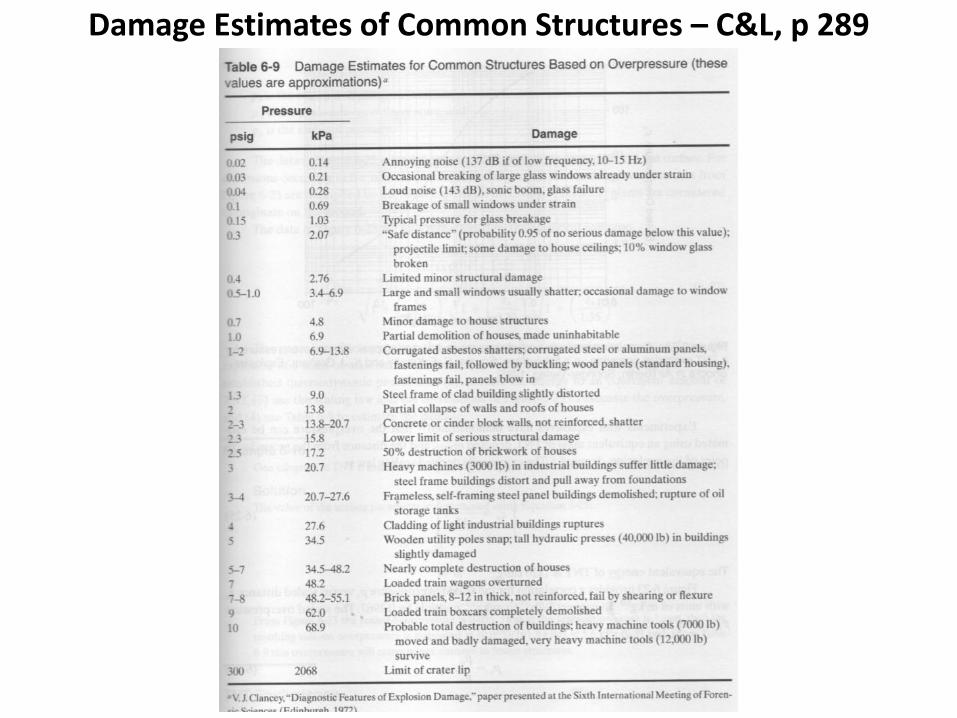
Damage Estimates of Common Structures – C&L, p 289
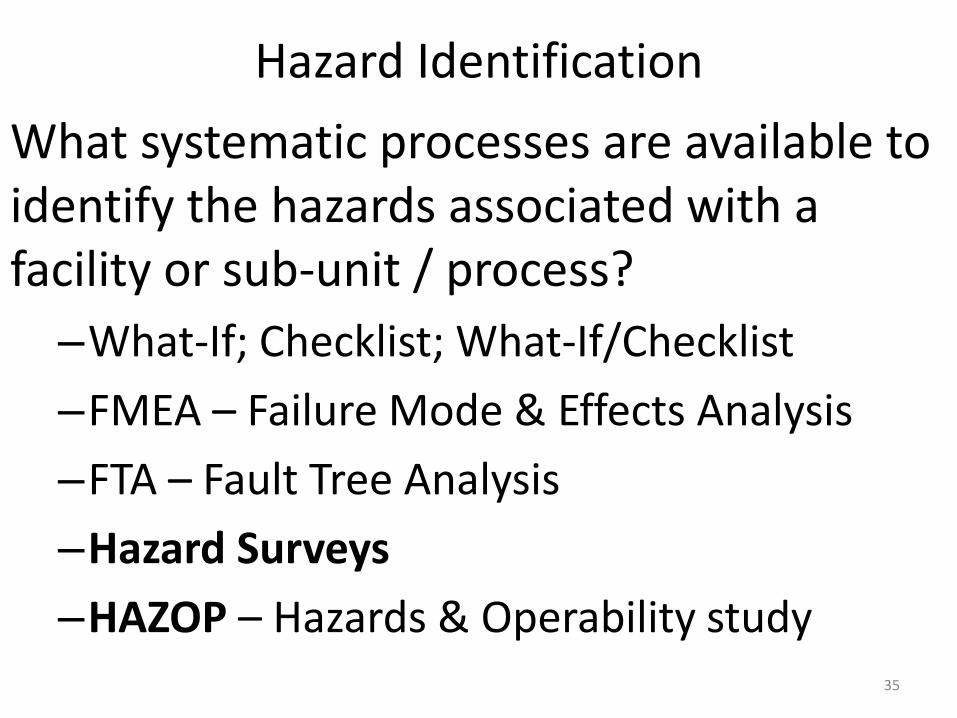
Hazard Identification
What systematic processes are available to identify the hazards associated with a facility or sub-unit / process?
–What-If; Checklist; What-If/Checklist
–FMEA – Failure Mode & Effects Analysis
–FTA – Fault Tree Analysis
–Hazard Surveys
–HAZOP – Hazards & Operability study35
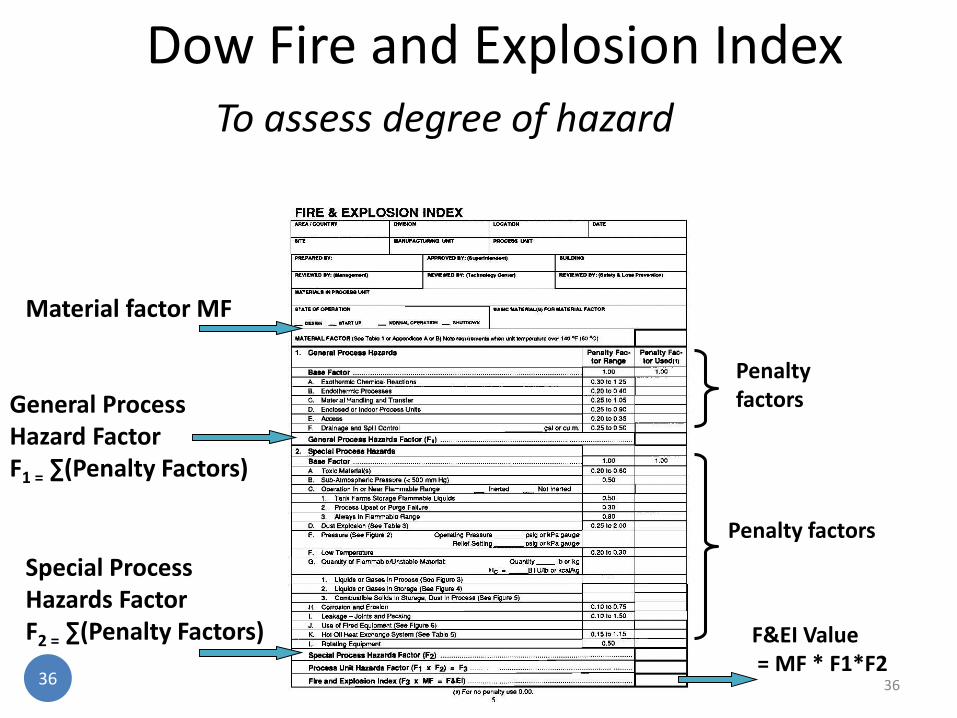
To assess degree of hazard
Material factor MF
Penalty factors
F&EI Value= MF * F1*F2
Special Process Hazards FactorF2 = ∑(Penalty Factors)
General ProcessHazard Factor F1 = ∑(Penalty Factors)
Dow Fire and Explosion Index
3636
Penalty factors
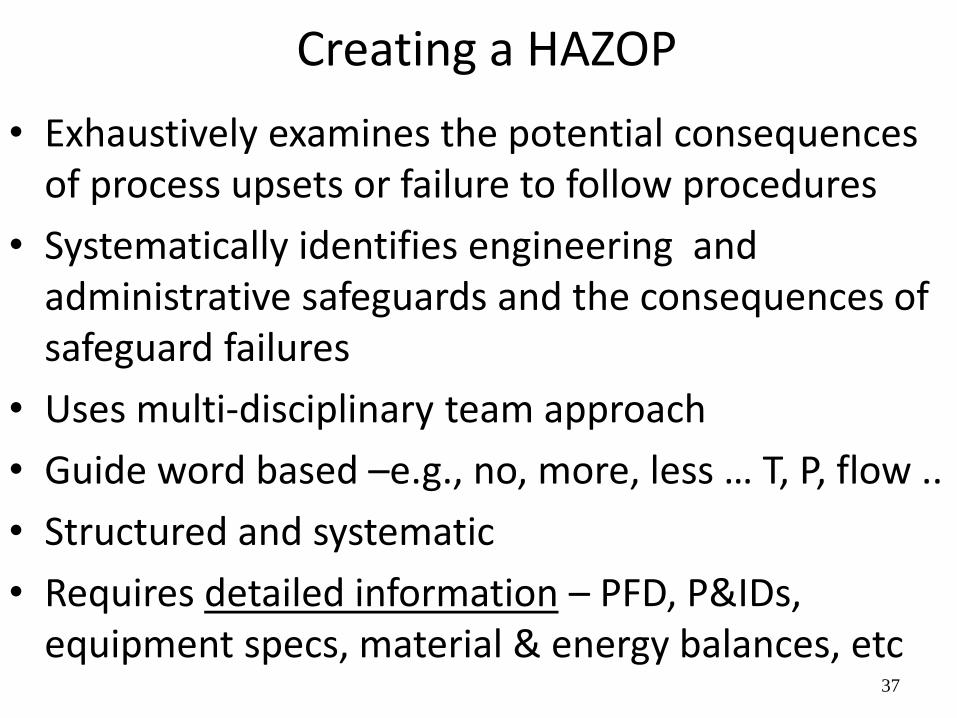
Creating a HAZOP
• Exhaustively examines the potential consequences of process upsets or failure to follow procedures
• Systematically identifies engineering and administrative safeguards and the consequences of safeguard failures
• Uses multi-disciplinary team approach
• Guide word based –e.g., no, more, less … T, P, flow ..
• Structured and systematic
• Requires detailed information – PFD, P&IDs, equipment specs, material & energy balances, etc
37
38
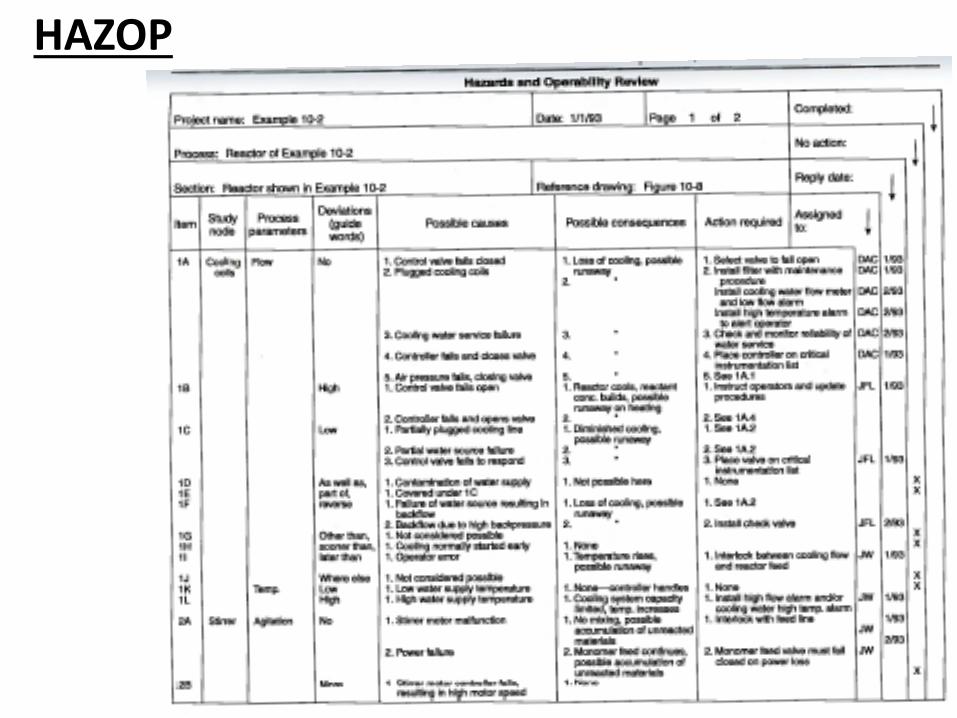
HAZOP
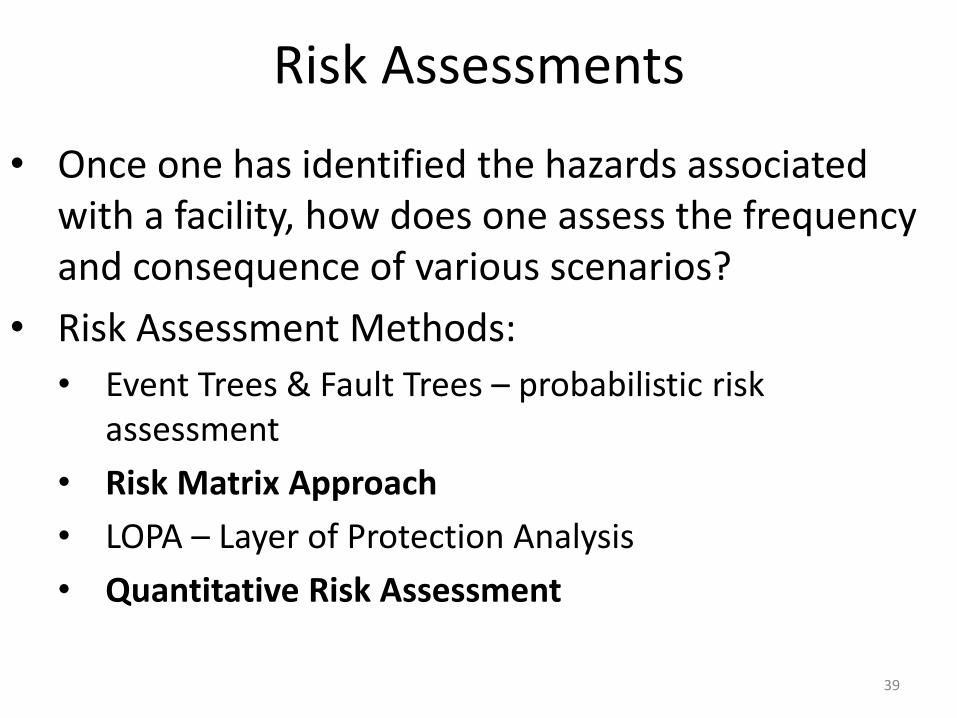
Risk Assessments
• Once one has identified the hazards associated with a facility, how does one assess the frequency and consequence of various scenarios?
• Risk Assessment Methods:
• Event Trees & Fault Trees – probabilistic risk assessment
• Risk Matrix Approach
• LOPA – Layer of Protection Analysis
• Quantitative Risk Assessment
39
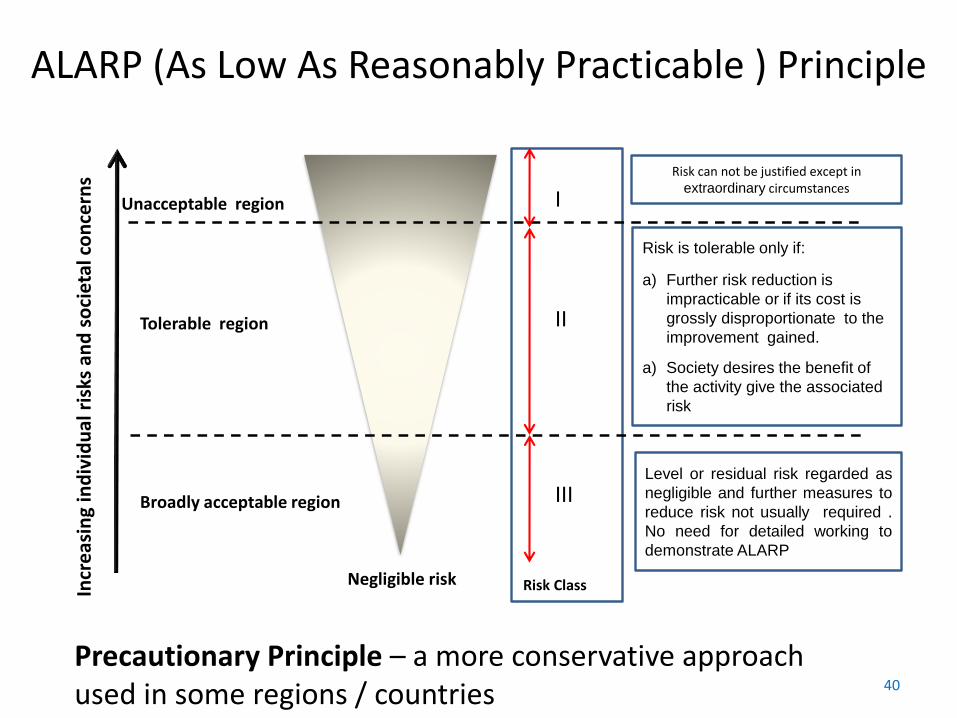
ALARP (As Low As Reasonably Practicable ) Principle
40
Risk can not be justified except in extraordinary circumstances
Risk is tolerable only if:
a) Further risk reduction is
impracticable or if its cost is
grossly disproportionate to the
improvement gained.
a) Society desires the benefit of
the activity give the associated
risk
Level or residual risk regarded as
negligible and further measures to
reduce risk not usually required .
No need for detailed working to
demonstrate ALARP
I
II
III
Negligible risk
Unacceptable region
Tolerable region
Broadly acceptable region
Risk ClassIncr
eas
ing
ind
ivid
ual
ris
ks a
nd
so
ciet
al c
on
cern
s
Precautionary Principle – a more conservative approach used in some regions / countries

Typical 4x4 Risk Matrix
41
Severity & Likelihood can be defined qualitatively or semi-quantitative in terms of degree of impact on: personnel, community, environment, facility, reputation, etc.

Quantitative Risk Assessment (QRA)- Individual Risk Contours Around Cl2 Loading Facility
Residential Area
Chlorine Loading facility
N.T.S.N
100 m
400 m
400 m
LEGEND
Chlorine rail tank car
Flammable liquids rail tank car
Rail line
Plant fence line
Chlorine pipe rack
Flammables pipe rack
Residential area: 400 people
uniformly distributed
(approximately 10 people per
acre). Other areas vacant.
Level 1 Risk Contour
Level 2 Risk Contour
Level 3 Risk Contour
64 m64 m 230 m230 m 360 m360 m
1.2x10⁻⁷/yr
2.4x10⁻⁵/yr
5.2x10⁻⁵/yr
42
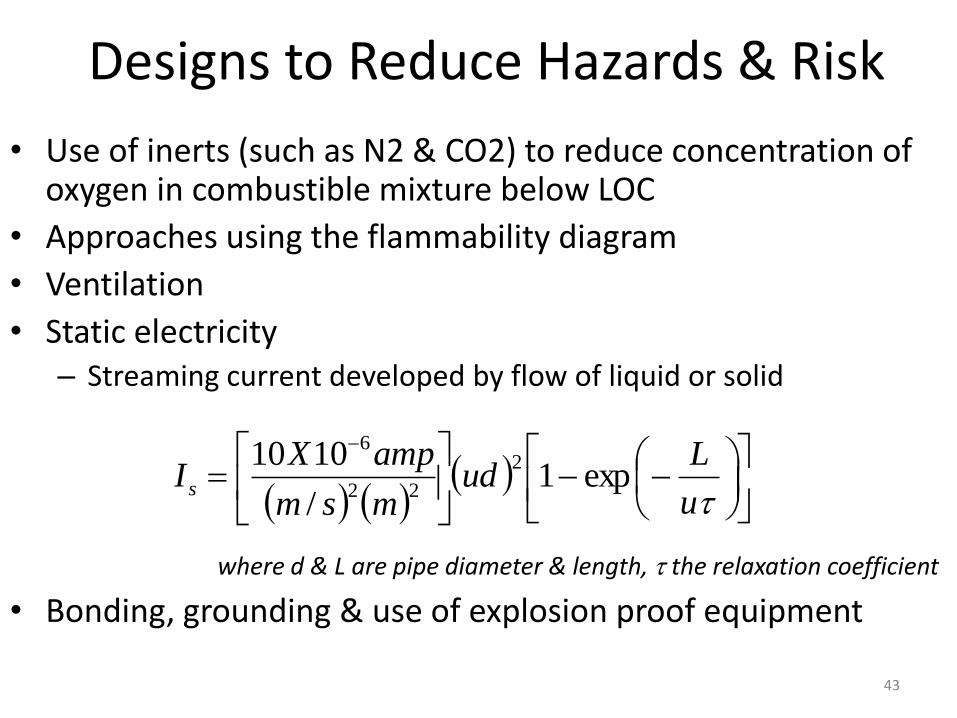
Designs to Reduce Hazards & Risk
• Use of inerts (such as N2 & CO2) to reduce concentration of oxygen in combustible mixture below LOC
• Approaches using the flammability diagram
• Ventilation
• Static electricity– Streaming current developed by flow of liquid or solid
where d & L are pipe diameter & length, the relaxation coefficient
• Bonding, grounding & use of explosion proof equipment
43
u
Lud
msm
ampXIs exp1
/
1010 2
22
6
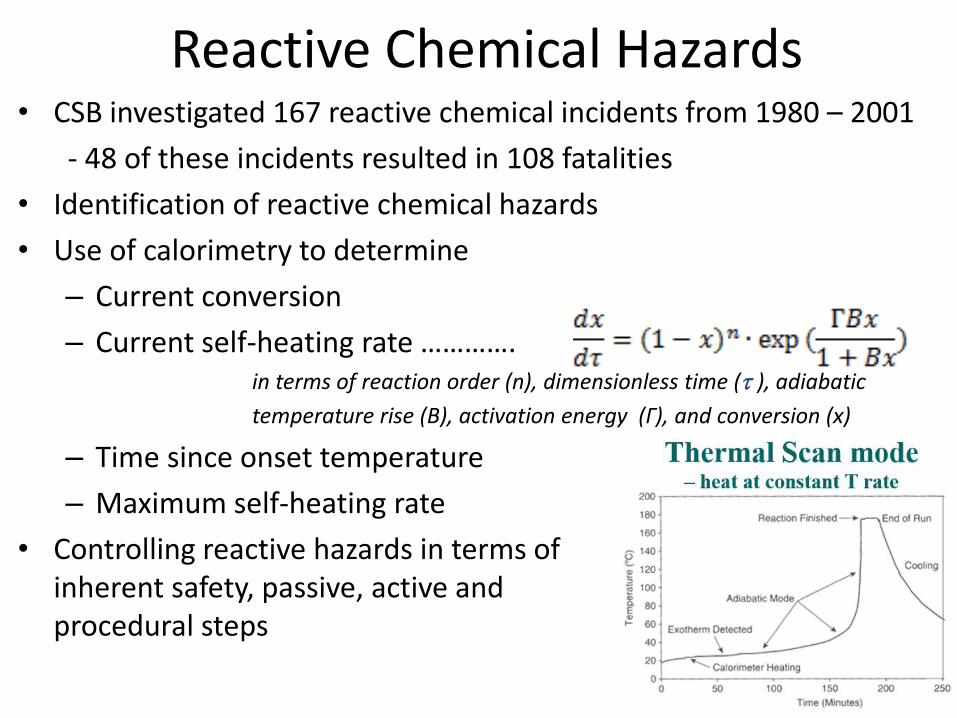
Reactive Chemical Hazards• CSB investigated 167 reactive chemical incidents from 1980 – 2001
- 48 of these incidents resulted in 108 fatalities
• Identification of reactive chemical hazards
• Use of calorimetry to determine
– Current conversion
– Current self-heating rate ………….in terms of reaction order (n), dimensionless time ( ), adiabatic
temperature rise (B), activation energy (Γ), and conversion (x)
– Time since onset temperature
– Maximum self-heating rate
• Controlling reactive hazards in terms of inherent safety, passive, active and procedural steps
44

Relief System Design • Are relief devices needed?• Location & type of relief devices?• Develop credible worst case relief
scenarios
• Selection and sizing of relief devices: conventional spring operated or bellows, or rupture discs
• Sizing of relief valves for two phase flow, such as runaway reactions
• Building design to reduce structural impact of explosion; use of blowout panels
• Fire and thermal relief of process vessels45
GT 0.9Hv
v f g
gc
Cp Ts
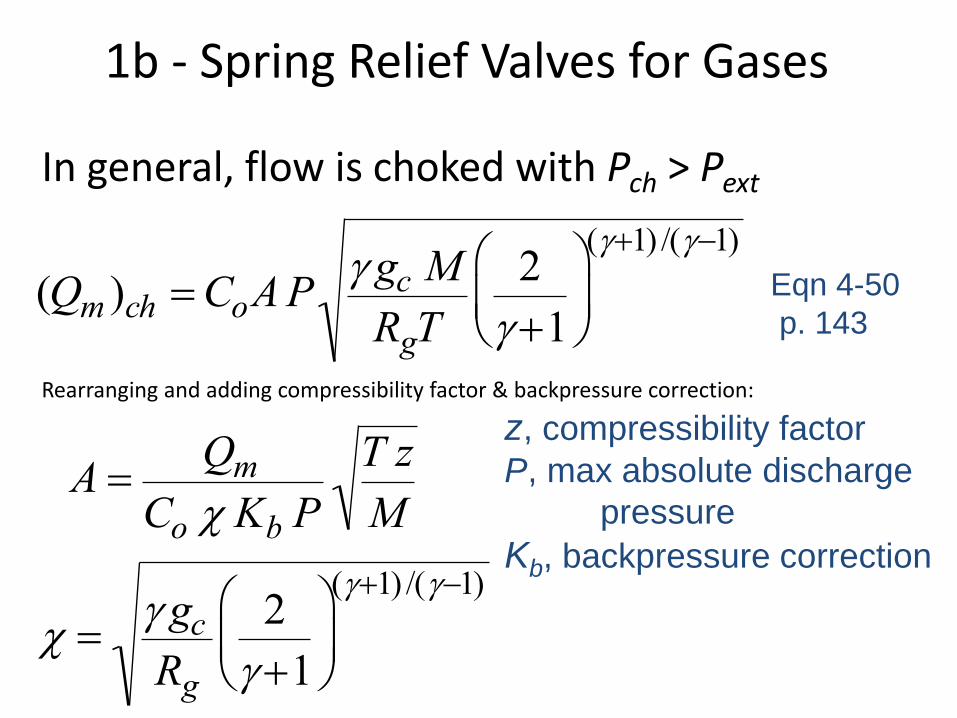
1b - Spring Relief Valves for Gases
In general, flow is choked with Pch > Pext
Rearranging and adding compressibility factor & backpressure correction:
(Qm )ch CoA P gc M
RgT
2
1
(1) /(1)
A Qm
Co Kb P
T z
M
gc
Rg
2
1
(1) /(1)
z, compressibility factor
P, max absolute discharge
pressure
Kb, backpressure correction
Eqn 4-50
p. 143
47
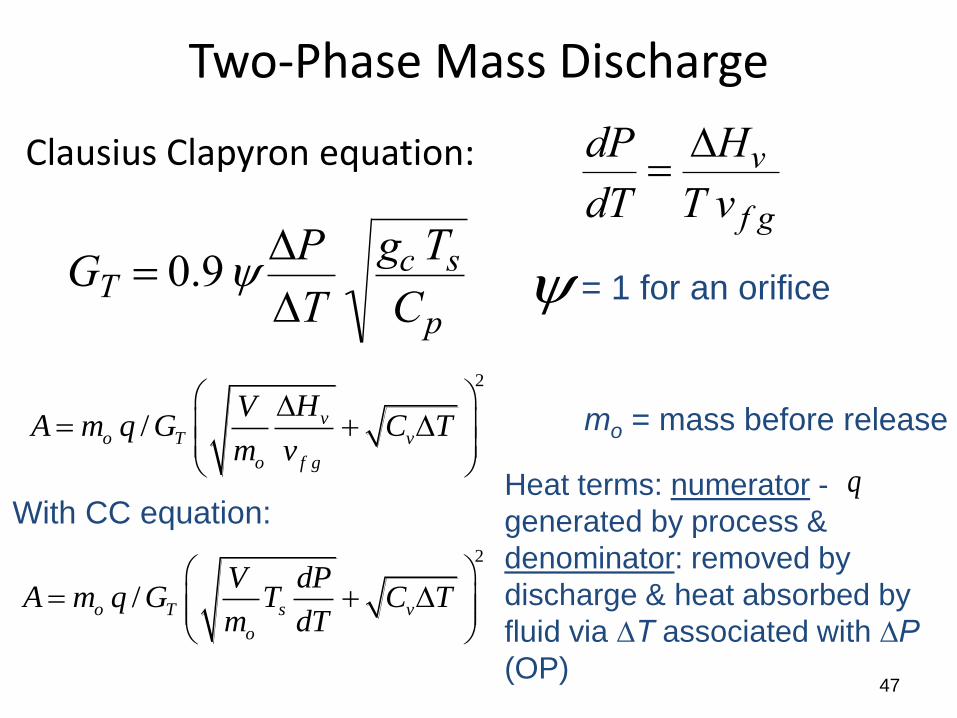
Two-Phase Mass Discharge
Clausius Clapyron equation:
GT 0.9P
T
gc Ts
Cp
dP
dTHv
T v f g
= 1 for an orifice
2
/ vo T v
o f g
HVA m q G C T
m v
2
/o T s v
o
V dPA m q G T C T
m dT
Heat terms: numerator -
generated by process &
denominator: removed by
discharge & heat absorbed by
fluid via ∆T associated with ∆P
(OP)
qWith CC equation:
mo = mass before release

Overpressurization of Vessels due to Plugging of Relief Line
48
49
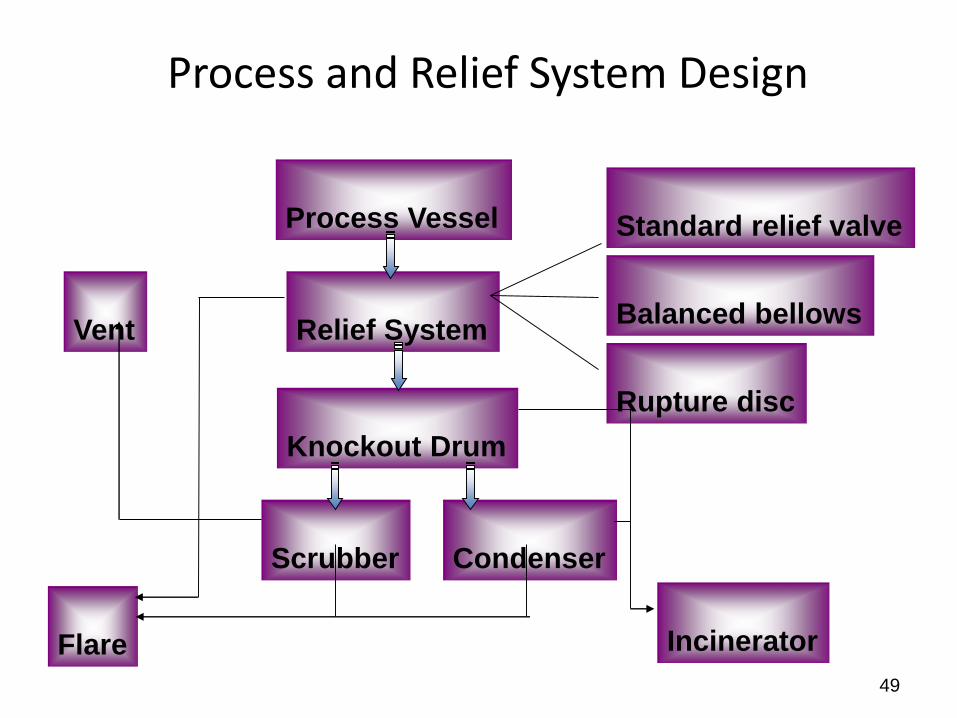
Process and Relief System Design
Process Vessel
Relief System
Knockout Drum
Standard relief valve
Balanced bellows
Rupture disc
Scrubber Condenser
Flare
Vent
Incinerator
Conclusion
• Scope of chemical process safety not recognized by many
• A challenging quantitative / technical discipline
• Applicable to many industries: oil & gas, chemicals, pharmaceuticals, agriculture, …
• Growing need & demand for engineers with these skills
50