Purchase and Material Management -...
137
Purchase and Material Management
Transcript of Purchase and Material Management -...

Purchase and Material Management

I/JNU OLE
Index
ContentI. ......................................................................II
List of FiguresII. .........................................................VI
List of TablesIII. ........................................................VII
AbbreviationsIV. .....................................................VIII
Case StudyV. ..............................................................116
BibliographyVI. ........................................................124
Self Assessment AnswersVII. ...................................127
Book at a Glance

II/JNU OLE
Contents
Chapter I ....................................................................... ...............................................................................1Material Management ................................................................................................................................. 1Aim ....................................................................... ........................................................................................ 1Objectives ....................................................................... .............................................................................. 1Learning outcome .......................................................................................................................................... 11.1 Introduction to Material Management ..................................................................................................... 21.2 Classification of Inventory .......................................................................................................................21.3 Meaning of Material Management ...........................................................................................................31.4 Objectives of Material Management ........................................................................................................41.5 Motives of Material Management ............................................................................................................41.6 Scope of Material Management ...............................................................................................................51.7 Material Planning .....................................................................................................................................51.8 Technique of Planning Materials ............................................................................................................. 51.9 Process of Codification ............................................................................................................................61.10 Standardisation .......................................................................................................................................71.11 Scheduling .............................................................................................................................................81.12 Procurement .......................................................................................................................................... 81.13 Purchasing .............................................................................................................................................81.14 Inspection ..............................................................................................................................................91.15 Quality Control ..................................................................................................................................... 91.16 Packaging ..............................................................................................................................................91.17 Storage ....................................................................... ........................................................................... 91.18 Inventory Control ................................................................................................................................101.19 Distribution ......................................................................................................................................... 101.20 Disposal ............................................................................................................................................... 101.21 Functions of Material Manager ............................................................................................................101.22 Effects of Over Stocking and Under Stocking ....................................................................................10Summary ....................................................................... ..............................................................................11References ....................................................................... ............................................................................11Recommended Reading ..............................................................................................................................11Self Assessment ...........................................................................................................................................12
Chapter II ....................................................................... ........................................................................... 14Material Cost Management ...................................................................................................................... 14Aim ....................................................................... ...................................................................................... 14Objectives ....................................................................... ............................................................................ 14Learning outcome ........................................................................................................................................ 142.1 Introduction to Material Cost Management ...........................................................................................152.2 Material Cost ..........................................................................................................................................152.3 Economic Order Quantity (EOQ) Models ............................................................................................. 172.4 Determination of Various Inventory Levels ..........................................................................................19 2.4.1 Maximum Level ....................................................................................................................20 2.4.2 Minimum Level ..................................................................................................................... 20 2.4.3 Re-order Level ....................................................................................................................... 20 2.4.4 Danger Level ..........................................................................................................................20 2.4.5 Calculation of Various Levels ...............................................................................................202.5 ABC Analysis ........................................................................................................................................232.6 XYZ Analysis ........................................................................................................................................ 25Summary ....................................................................... .............................................................................27References ....................................................................... ...........................................................................27Recommended Reading .............................................................................................................................27Self Assessment ...........................................................................................................................................28

III/JNU OLE
Chapter III ....................................................................... ..........................................................................30Material Requirements Planning ............................................................................................................. 30Aim ....................................................................... ...................................................................................... 30Objectives ....................................................................... ............................................................................ 30Learning outcome ........................................................................................................................................ 303.1 Introduction ............................................................................................................................................313.2 Definition of MRP ................................................................................................................................. 313.3 System Components............................................................................................................................... 323.4 Demand Dependency .............................................................................................................................333.5 Objectives of MRP .................................................................................................................................333.6 Advantages of MRP ............................................................................................................................... 343.7 Limitations of MRP ............................................................................................................................... 353.8 Evaluation of MRP .................................................................................................................................353.9 Keeping MRP Current in a Changing Environment .............................................................................. 353.10 Manufacturing Resource Planning (MRP II) .......................................................................................363.11 JIT ....................................................................... ............................................................................... 363.12 KANBAN ............................................................................................................................................ 36Summary ....................................................................... .............................................................................38References ....................................................................... ...........................................................................38Recommended Reading .............................................................................................................................38Self Assessment ...........................................................................................................................................39
Chapter IV ....................................................................... ..........................................................................41Introduction to Enterprise Resource Planning (ERP) ............................................................................41Aim ....................................................................... ...................................................................................... 41Objectives ....................................................................... ............................................................................ 41Learning outcome ........................................................................................................................................ 414.1 Introduction ............................................................................................................................................424.2 History and Evolution ............................................................................................................................424.3 Meaning ....................................................................... ........................................................................ 434.4 Definition ............................................................................................................................................... 434.5 Concept ....................................................................... .......................................................................... 434.6 Implementation of an ERP System ........................................................................................................ 444.7 Advantages of ERP ................................................................................................................................ 444.8 Disadvantages of ERP ............................................................................................................................454.9 Applicability of ERP .............................................................................................................................. 454.10 Reasons for the Growth of the ERP Market ........................................................................................ 464.11 Success of the ERP ...............................................................................................................................46Summary ....................................................................... .............................................................................47References ....................................................................... ...........................................................................47Recommended Reading .............................................................................................................................47Self Assessment ...........................................................................................................................................48
Chapter V ....................................................................... ............................................................................50Inventory Models ....................................................................................................................................... 50Aim ....................................................................... ...................................................................................... 50Objectives ....................................................................... ............................................................................ 50Learning outcome ........................................................................................................................................ 505.1 Introduction to Inventory Models .......................................................................................................... 515.2 Models for Accepting/Rejecting Discounts on Purchases ..................................................................... 515.3 Fixed Order vs. Fixed Interval System .................................................................................................. 55 5.3.1 Cyclical Ordering or Fixed Period System (Time Based) .................................................... 555.4 Material Requirement Planning (MRP) ................................................................................................60 5.4.1 Applicability of the MRP System .......................................................................................... 61 5.4.2 Inputs for MRP ..................................................................................................................... 61

IV/JNU OLE
5.4.3 MRP Process ..........................................................................................................................61 5.4.4 Outputs of MRP .................................................................................................................... 61 5.4.5 Benefits of MRP ................................................................................................................... 625.5 Inventory Turnover ............................................................................................................................... 62 5.5.1 Interpretation of Inventory Turnover ..................................................................................... 63Summary ....................................................................... .............................................................................64References ....................................................................... ...........................................................................64Recommended Reading .............................................................................................................................64Self Assessment ...........................................................................................................................................65
Chapter VI ....................................................................... ..........................................................................67Purchase Management .............................................................................................................................. 67Aim ....................................................................... ...................................................................................... 67Objectives ....................................................................... ............................................................................ 67Learning outcome ........................................................................................................................................ 676.1 Introduction to Purchase Management .................................................................................................. 68 6.1.1 Objectives of Material Management ......................................................................................686.2 Functions of Purchase Department ........................................................................................................ 68 6.2.1 Purchasing Function vs. Purchase Department .....................................................................69 6.2.2 Procurement vs. Purchasing ..................................................................................................70 6.2.3 Objectives of Purchasing ....................................................................................................... 706.3 Purchase Requisition ..............................................................................................................................70 6.3.1 Types of Purchase Requisitions ............................................................................................. 706.4 Purchase Procedure ...............................................................................................................................716.5 Types of Purchasing ..............................................................................................................................71 6.5.1 Forward Buying .................................................................................................................... 71 6.5.2 Tender Buying ........................................................................................................................72 6.5.3 Systems Contract .................................................................................................................. 73 6.5.4 Speculative Buying ...............................................................................................................74 6.5.5 Rate Contracts .......................................................................................................................74 6.5.6 Reciprocity in Buying ...........................................................................................................74 6.5.7 Zero Stock Buying ................................................................................................................75 6.5.8 Blanket Orders ...................................................................................................................... 756.6 Vendor Management ............................................................................................................................. 756.7 Inspection of Materials .......................................................................................................................... 76 6.7.1 Pre Dispatch Inspection ......................................................................................................... 76 6.7.2 Stage Inspection/Final Inspection ..........................................................................................77 6.7.3 Document Inspection ............................................................................................................. 77 6.7.4 Stores/Receipt Inspection ...................................................................................................... 77 6.7.5 Third Party Inspection............................................................................................................ 77Summary ....................................................................... .............................................................................80References ....................................................................... ...........................................................................80Recommended Reading .............................................................................................................................81Self Assessment ...........................................................................................................................................82
Chapter VII ....................................................................... ........................................................................ 84Stores Management.................................................................................................................................... 84Aim ....................................................................... ...................................................................................... 84Objectives ....................................................................... ............................................................................ 84Learning outcome ........................................................................................................................................ 847.1 Introduction to Stores Management .......................................................................................................85 7.1.1 Motive to Hold Inventory ...................................................................................................... 857.2 Functions of Stores Department ............................................................................................................85 7.2.1 Receipt of Material ................................................................................................................ 85 7.2.2 Issue of Material .................................................................................................................... 86

V/JNU OLE
7.2.3 Return of Material ..................................................................................................................87 7.2.4 Transfer of Materials ..............................................................................................................88 7.2.5 Proper Storage Function ........................................................................................................ 887.3 Valuation of Material ............................................................................................................................ 907.4 Valuation of Receipts ............................................................................................................................. 907.5 Valuation of Issues ................................................................................................................................. 91 7.5.1 First In First Out (FIFO) Method ..........................................................................................92 7.5.2 Last In First out (LIFO) Method ...........................................................................................93 7.5.3 Highest In First Out (HIFO) Method .....................................................................................94 7.5.4 Average Rate Method ............................................................................................................95 7.5.4.1 Simple Average (SAR) Method ..............................................................................95 7.5.4.2 Weighted Average Rate (WAR) Method ................................................................. 96 7.5.5 Market Rate ............................................................................................................................977.6 Valuation of Returns .............................................................................................................................. 98Summary ....................................................................... ...........................................................................100References ....................................................................... .........................................................................100Recommended Reading ...........................................................................................................................100Self Assessment .........................................................................................................................................101
Chapter VIII .............................................................................................................................................103Quality Management ............................................................................................................................... 103Aim ....................................................................... .................................................................................... 103Objectives ....................................................................... .......................................................................... 103Learning outcome ...................................................................................................................................... 1038.1 Introduction ..........................................................................................................................................1048.2 Definition of Total Quality Management .............................................................................................104 8.2.1 Defining Quality .................................................................................................................. 1048.3 Cost of Quality .....................................................................................................................................1048.4 Continuous Improvement (Kaizen) ......................................................................................................106 8.4.1 Plan to Study Cycle ..............................................................................................................106 8.4.2 Benchmarking ......................................................................................................................1078.5 Employee Empowerment .....................................................................................................................107 8.5.1 Team Approach .................................................................................................................... 1088.6 Tools of Quality Control ...................................................................................................................... 108 8.6.1 Cause-and-Effect Diagrams .................................................................................................108 8.6.2 Flowcharts ............................................................................................................................109 8.6.3 Checklists .............................................................................................................................109 8.6.4 Control Charts ......................................................................................................................109 8.6.5 Scatter Diagrams ..................................................................................................................109 8.6.6 Pareto Analysis .....................................................................................................................110 8.6.7 Histograms ............................................................................................................................1108.7 Process Management ............................................................................................................................1118.8 Quality Standards ..................................................................................................................................111 8.8.1 ISO 9000 Standards ..............................................................................................................111 8.8.2 ISO 14000 Standards ............................................................................................................1128.9 Reason for TQM Failure .......................................................................................................................112Summary ....................................................................... ............................................................................113References ....................................................................... ..........................................................................113Recommended Reading ............................................................................................................................113Self Assessment ..........................................................................................................................................114

VI/JNU OLE
List of Figures
Fig. 1.1 Inventory classification .....................................................................................................................2Fig. 2.1 Process from procurement to realisation of money ........................................................................17Fig. 3.1 Computer architecture for MRP ..................................................................................................... 31Fig. 3.2 Material requirements planning system ..........................................................................................32Fig. 8.1 Cost of defects .............................................................................................................................. 106Fig. 8.2 PDSA cycle ...................................................................................................................................107Fig. 8.3 Seven tools of quality control ........................................................................................................110

VII/JNU OLE
List of Tables
Table 1.1 List of classification of inventories ................................................................................................7Table 4.1 Evolution of ERP from 1960s to 1990s ....................................................................................... 43Table 5.1 Model developed for accepting/rejecting discounts on purchases in excel spread sheet .............52Table 6.1 Purchasing function vs. purchase department ..............................................................................69Table 6.2 Matrix of price and quality of the tenders ....................................................................................72Table 8.1 Cost of quality ............................................................................................................................105
VIII/JNU OLE
Abbreviations
BOM - Bill of MaterialsDGS & D - Directorate General of Supply & DisposalDIL - Desired Inventory LevelEDI - Electronic Data InterchangeEOQ - Economic Order QuantitiesERP - Enterprise Resource PlanningFIFO - First In First OutGC Guara-nteCeertifcateGRN - Goods Returned NoteGRR - Goods Received ReportHIFO - Highest In First OutIR - Inspection RequestIRF - Inventory Record FileIT - Information TechnologyLIFO - Last In First OutLTE - Limited Tender EnquiryMPS - Master Production ScheduleMRO - Maintenance, Repair and Operating InventoriesMRP - Materials Requirement PlanningMTC Mat-erial TestCertifcatePO - Purchase OrderQA - Quality AssuranceROI - Return on InvestmentROL - Re-Order LevelSAR - Simple Average RateSTE - Single Tender EnquiryVDC - Vendor Development CellWAR - Weighted Average Rate

1/JNU OLE
Chapter I
Material Management
Aim
The aim of this chapter is to:
introduce the students to material management•
explain the scope of material management•
elucidate the various motives of inventory•
Objectives
The objectives of this chapter are to:
defnetheclassifcationofinventory•
explicate the key objectives of material management•
enlist the functions of material manager•
Learning outcome
At the end of this chapter, you will be able to:
understand the materials requirement planning technique (MRP)•
analyse about the process of purchasing•
identify the effects of overstocking and under stocking•
Purchase and Material Management
2/JNU OLE
1.1 Introduction to Material Management
Every organisation depends on materials and services from other organisations to varying extents. These materials and services are obtained through exchange of money. Various materials are used as inputs such as raw materials, consumables and spares. These are required to be purchased and made available to the shops/users as and when neededtoensureuninterruptedproduction.Effcient managementofinputmaterialsisofparamountimportanceinabusinessorganisationformaximisingmaterialsproductivity,whichultimatelyaddstotheproftability oftheorganisation.
Material cost is probably the most important element of cost. In the case of certain industries like cement, sugar,chemicals,ironandsteel,etc.,thematerialscostformsaverysignifcant portionoftheoverallcostofproduction.
1.2 Classifcation of Inventory
The term material refers to all commodities which are consumed in the production process. The materials which canbeconsumedintheproductionprocesscanbebasicallyclassifedas:
Direct Materials•
Indirect Materials•
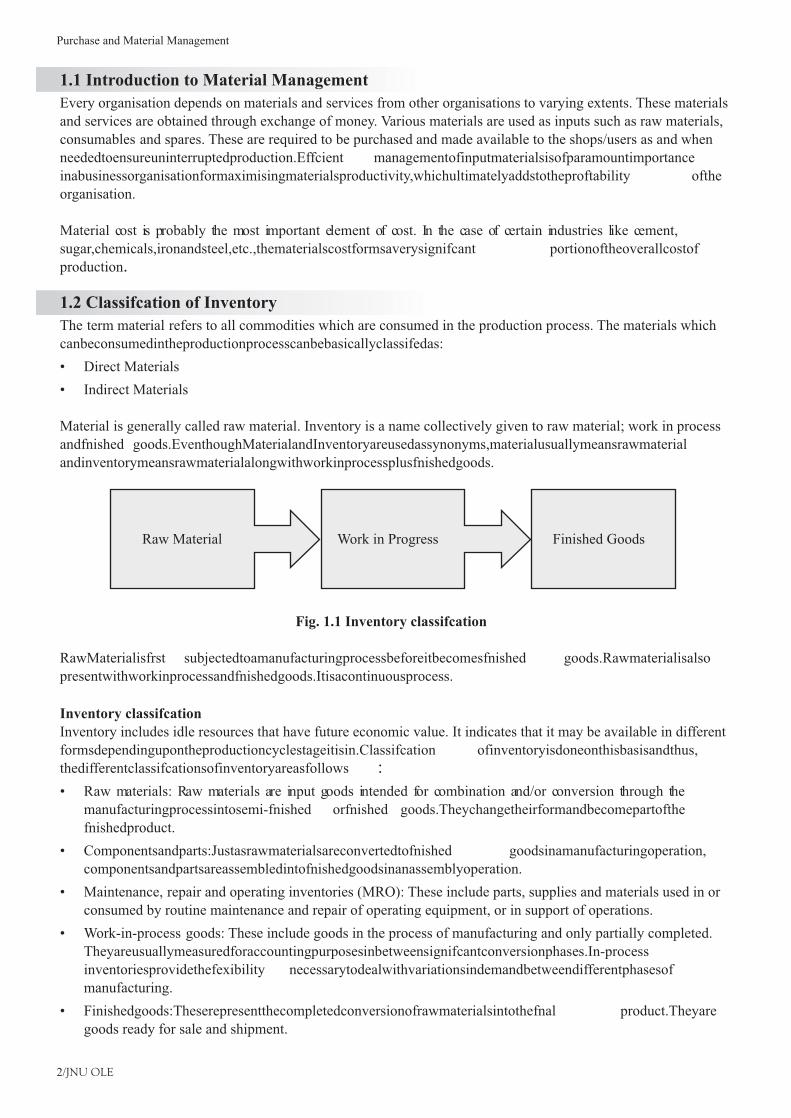
Material is generally called raw material. Inventory is a name collectively given to raw material; work in process andfnished goods.EventhoughMaterialandInventoryareusedassynonyms,materialusuallymeansrawmaterialandinventorymeansrawmaterialalongwithworkinprocessplusfnishedgoods.
Raw Material Work in Progress Finished Goods
Fig. 1.1 Inventory classifcation
RawMaterialisfrst subjectedtoamanufacturingprocessbeforeitbecomesfnished goods.Rawmaterialisalsopresentwithworkinprocessandfnishedgoods.Itisacontinuousprocess.
Inventory classifcationInventory includes idle resources that have future economic value. It indicates that it may be available in different formsdependingupontheproductioncyclestageitisin.Classifcation ofinventoryisdoneonthisbasisandthus,thedifferentclassifcationsofinventoryareasfollows :
Raw materials: Raw materials are input goods intended for combination and/or conversion through the •manufacturingprocessintosemi-fnished orfnished goods.Theychangetheirformandbecomepartofthefnishedproduct.
Componentsandparts:Justasrawmaterialsareconvertedtofnished goodsinamanufacturingoperation,•componentsandpartsareassembledintofnishedgoodsinanassemblyoperation.
Maintenance, repair and operating inventories (MRO): These include parts, supplies and materials used in or •consumed by routine maintenance and repair of operating equipment, or in support of operations.
Work-in-process goods: These include goods in the process of manufacturing and only partially completed. •Theyareusuallymeasuredforaccountingpurposesinbetweensignifcantconversionphases.In-processinventoriesprovidethefexibility necessarytodealwithvariationsindemandbetweendifferentphasesofmanufacturing.
Finishedgoods:Theserepresentthecompletedconversionofrawmaterialsintothefnal product.Theyare•goods ready for sale and shipment.
3/JNU OLE
Resale goods: These are goods acquired for resale. Such goods may be purchased by a wholesaler for resale to •distributors, or by distributors for resale to consumers, etc.
Capital goods: These are items (such as, equipment) that are not used or consumed during a single operating •period, but have extended useful lives and must be utilised over multiple operating periods. Tax laws require that such an item be capitalised, and a predetermined percentage of its cost be recognised as an expense, each operating period, over a predetermined time frame, according to equipment classes.
Construction materials: These are raw materials and components for construction projects such as a building, •bridge, etc.
Hardgoods/softgoods:Whatoneidentifes ashardgoodsandsoftgoodswillvarydependingontheindustry•involved. For example, in data processing, hard goods include apparatus such as, computers and terminals, while soft goods include software, data storage media and the like.
Fuel and lubricants: Fuel and lubricants are used for the oiling purpose for the equipment used in the process •which again varies with the type of industry.
Stationery goods: It includes writing material like, paper, pen, ink, etc., which are used by the people involved •in the process.
Primarypackingmaterial:Packingmateriallike,plastic,paper,etc.areusedtopackthefnished goodsfor•sale.
1.3 Meaning of Material Management
Materialsmanagementcanbedefnedas“anintegratedmanagementapproachtoplanning,acquiring,processinganddistributingproductionmaterialsfrom theraw materialstateto thefnished productstate”.Materialsmanagementis a key business function that is responsible for the coordination of planning, sourcing, purchasing, moving, storing and controlling materials in an optimum manner, so as to provide pre-determined service to the customer at a minimum cost.
Materialsmanagementhassuchsub-feldsas:
inventory management•
value analysis•
receiving•
stores and management of the obsolete•
slow moving and non moving materials•
Materials management is the branch of logistics that deals with tangible components of a supply chain. It covers the acquisition of spare parts and replacements, quality control of purchasing and ordering such parts, and the standards involved in ordering, shipping, and warehousing the said parts. The physical arrangement of materials/spare parts is called materials management.
Planningandcontrolofthefunctionssupportingthecompletecycle(fow) ofmaterials,andtheassociatedfow ofinformation is called materials management. Materials management is concerned with the control of materials in such a manner which ensures maximum return on working capital. Materials management is concerned with the location and purchase of materials needed, their storage and movement. It also arranges to keep an account of them. It is also responsible for planning their movement through manufacturing processes, store rooms and distribution channels.
Materials management provides an integrated systems approach to the coordination of the materials activities and the control of total material costs. The materials management function ranges from receiving the material requisitions from user department to placement of purchase orders and then, on the other hand, receiving the materials from vendors and making it available to the users departments.

Purchase and Material Management
4/JNU OLE
1.4 Objectives of Material Management
The fundamental objectives of the materials management function are acquisition of materials and services:
of the right quality •
in the right quantity •
at the right time •
from the right source •
The key objectives of material management are as follows:
Buying at the lowest price, consistent with the desired quality and service•
Maintaining a high inventory turnover, by reducing excess storage, carrying costs and inventory losses occurring •due to deteriorations, obsolescence and pilferage
Maintainingcontinuityofsupply,preventinginterruptionofthefowofmaterialsandservicestousers•
Maintainingthespecifed materialqualitylevelandaconsistencyofquality.Thispermitseffcient andeffective•operation
Developing reliable alternate sources of supply to promote a competitive atmosphere in performance and •pricing
Minimisingtheoverallcostofacquisitionbyimprovingtheeffciencyofoperationsandprocedures•
Hiring, developing, motivating and training personnel and providing a reservoir of talent•
Developing and maintaining good supplier relationships in order to create a supplier attitude and desire furnish •the organisation with new ideas, products, and better prices and service
Achieving a high degree of cooperation and coordination with user departments•
Maintaininggoodrecordsandcontrolsthatprovidesanaudittrailandensureseffciencyandhonesty•
Participating in 'Make or Buy' decisions •
1.5 Motives of Material Management
A company may hold the inventory with the various motives as stated below: Transaction motiveThe company may be required to hold the inventories in order to facilitate the smooth and uninterrupted production and sales operations. It may not be possible for the company to procure raw material whenever necessary. There may be a time lag between the demand for the material and its supply. Hence, it is needed to hold the raw material inventory. Similarly, it may not be possible to produce the goods immediately after they are demanded by the customers.Hence,itisneededtoholdthefnished goodsinventory.Theneedtoholdworkinprogressmayarisedue to production cycle.
Precautionary motiveIn addition to the requirement to hold the inventories for routine transactions, the company may like to hold them to guard against the risk of unpredictable changes in demand and supply forces. For example, the supply of raw material may get delayed due to the factors like strike, transport, disruption, short supply, lengthy processes involved in import of the raw materials, etc.
Hencethecompanyshouldmaintainsuffcient levelofinventoriestotakecareofsuchsituations.Similarly,thedemandforfnished goodsmaysuddenlyincrease(especiallyincaseofseasonaltypesofproducts)andifthecompany is unable to supply them, it may indicate gain for the competitions. Hence, the company will like to maintainsuffcientstockoffnishedgoods.

5/JNU OLE
Speculative motiveThe company may like to purchase and stock the inventory in the quantity which is more than needed for production and sales purpose. This may be with the intention to get the advantages in terms of quantity discounts connected with bulk purchasing or anticipated price rise.
1.6 Scope of Material ManagementThe scope of material management includes the following aspects:
Material planning•
Cataloguing or coding the materials•
Standardisation•
Scheduling•
Procurement•
Inspection•
Quality control•
Packaging•
Storage•
Inventory control•
Distribution •
Disposal•
1.7 Material PlanningMaterial management involves the process of planning to get the materials. It is the starting point for the whole materialmanagementfunction.Materialplanningisascientifc wayofdeterminingtherequirementsstartingwithraw materials, consumables, spare parts and all other materials that are required to meet the given production plan for a certain period. Material planning is derived from overall organisational planning and hence, it is always a sub-plan of the broad organisational plan. What it does is forecast and initiate the procurement of materials.
Factors affecting material planningThe factors affecting material planning are:
Macro factors: Global factors such as price trends, business cycles, government’s import and export policies •etc., are called macro factors. Credit policy of the government is a critical factor as banks follow these guidelines onlywhileextendingfnancialsupporttoabusinessentity.
Micro factors: These are essentially the factors existing within the organisation such as corporate policy •on inventory holding, production plan, investments etc., For any organisation, factors such as lead time of procurement, acceptable inventory levels, working capital, seasonality, delegation of power are micro factors
1.8 Technique of Planning MaterialsMaterials Requirement Planning (MRP) considers the annual production plan of the manufacturing concern. Once afrm determinesitsannualproductionplan,theoverallmaterialrequirementtomeetthegivenproductionplanis worked out. It is a detailed analysis encompassing the materials and quantities available for use, materials with quantities not available and hence, needing procurement, the actual lead time of procurement, etc.
It is always possible to have a situation where some parts of an assembly are available and some others are not available.TheBillofMaterials(BOM)isprepared.Itquantifes allthematerials(components)neededforvariousassemblies as per the production plan. BOM is thus a list displaying the code, nomenclature of an item, its unit and quantity, location of use and also the estimated price of each component. An explosion chart is a series of bills of materials grouped together in a matrix form so that combining the requirements for different components can be made. Once the BOM is ready, the same is handed over to the Purchasing wing which initiates the purchasing activities. MRP, thus, keeps in view the lead time also. Using computers, preparation of BOM through explosion of lists is quite easy and smooth.

Purchase and Material Management
6/JNU OLE
Materials required for any operation are based on the sales forecasts and production plans. Planning and control is done for the materials taking into account the materials not available for the operation and those in hand or in the pipe line. This involves estimating the individual requirements of parts, preparing materials budget, forecasting the levels of inventories, scheduling the orders and monitoring the performance, in relation to production and sales.
Cataloguing or coding the materialsFor easy procurement, storage, retrieval and the distribution of the inventories, it is essential to classify them into differentcategories.Thisclassifcation canbedonethroughcodifcation orcataloguing.Codifcation orcataloguingisbasicallyanidentifcationsystemforeachitemoftheinventory.
Therearethreebroadapproachestodevelopingasuitableidentifcationsystem. Theseare:
Arbitrary approach•
Symbolic approach •
Use of drawing numbers•
Arbitrary approachAs and when an item is received by stores in its receiving bay, a running and unique serial number is assigned to it. Thisnumberbecomesthecodeoftheitemforsubsequentuseatdifferentstages.Itdoesnothelpinthescientifcmanagement of inventory. Arbitrary approach is useful only where perhaps items are non-repetitive and the inventory managementneednotbescientifc.
Symbolic approachIt assigns code in such a manner that the same item number is not allotted to two different materials. The code is designed such that it can be used to tell many things about an item of material.
Thesystemuseseitheranumericcodifcation systemoranalphanumericsystem.Underthenumericsystem,asetofnumeric code (length pre-decided) is assigned to each item where different parts of the code describe different aspects of an item: class, subclass, unique running number of that item, location of the storage suppliers’ code, etc.
Example:
2 145 098 344
Class Subclass Running number Location code
Thus, the code of this item shall be a 10 digit code, 2145098344 and it shall always remain so for this item. It shall then be easy to communicate about this item among the concerned agencies. Similarly, there can be a code using alpha numeric value like AA223B234 with different alpha and numerical value describing some pre-decided meaning. It is also called mnemonic system. Since this code has certain logic, it is also called intelligent code and this system is widely used everywhere.
Use of drawing numbersManyfrms usedrawingnumbersascodestoidentifyanitem.Sincethedrawingnumberforafrm remainsunique,assigningacodeonthisbasisassumesauniquecodeforthatitemandhence,confrms therequirementofauniqueidentifcationfortheitem.
1.9 Process of Codifcation
Theprocessofcodifcationislistedbelow:
Decideifthefrmwantstogoforarbitrarysystem,symbolicsystemorengineeringdrawingsystem•
List the inventory items•
Defnetheclassofitems•
Defnethesubclassundereachclass•
7/JNU OLE
Depending upon the number of classes, their subclasses and probable number of items under each sub class •decidethelengthofcodeswhichshallremainfxedforalltheinventoryitems(10digit,alphanumeric,etc.)
Start assigning codes as per the detailed list of inventory•
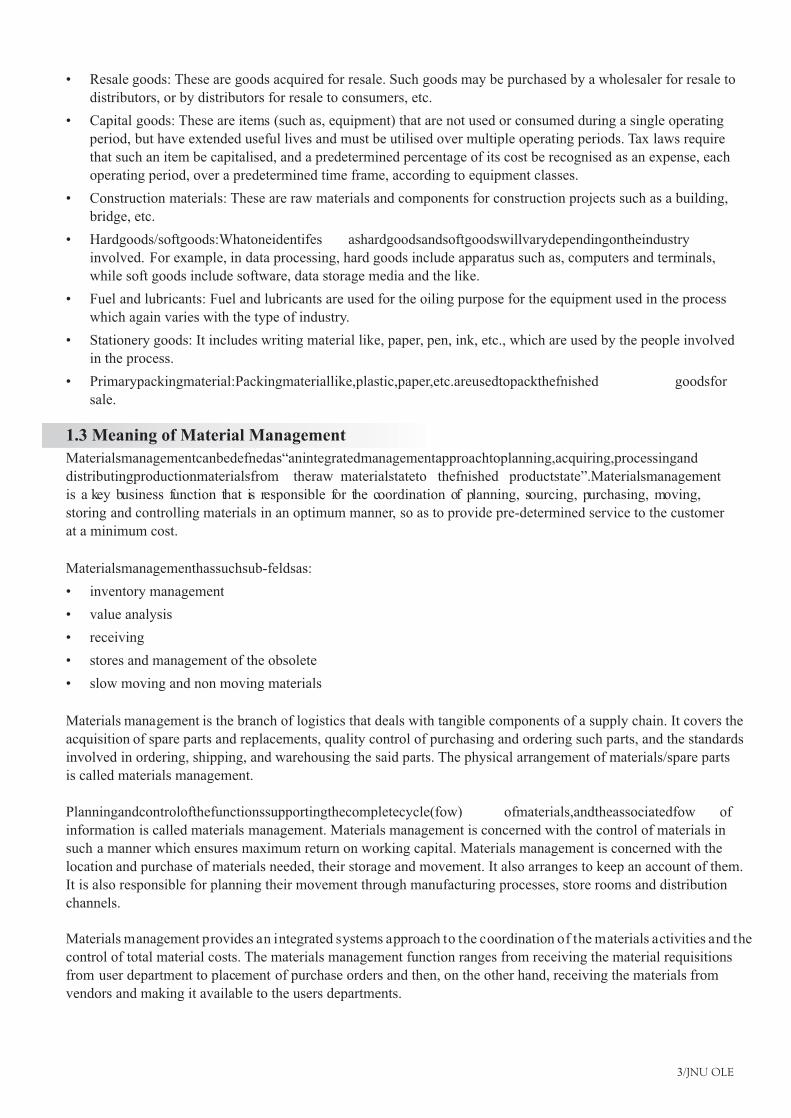
Anillustrativelistofclassifcationofinventories:
Abrasives Bearings Belt and beltings
Bolts, nuts & washers Brooms & brushes Building materials
Cans & containers Chemicals & reagents Cloth, leather & rubber
Electrical Gases Glassware
Oil & lubricants Pipe&pipefttings Raw materials
Rolls Refractory Stationery
Safety items Tools & tackles Photographic items
Table 1.1 List of classifcation of inventories
Codifcationisusuallydonebyateamconsistingofrepresentativesdrawnfromstores,userdepartmentandindustrialengineeringdepartment.Themajorresponsibilitylieswiththestoresdepartment.Codifcation identifes anitem.Also it acts as a communicating medium for an item among the different users of that item in whatever way such asstores,userdepartment,planningdepartment,fnance, purchasing,etc.Assoonastheitemisreceivedinthestores(iftheitemisanewone),itiscodifed. Oncecodifed, thesamecodeisusedinthecycleofprocurement,throughout and for ever.
1.10 Standardisation
Standardisationmeans“formulation,publicationandimplementationofguidelines,rulesandspecifcations forcommon and repeated use, aimed at achieving optimum degree of order or uniformity in a given context, discipline, orfeld”. Publicationmeanscommunicationofamessage,statement,ortextthroughanymeanssuchasaudio,video,print,electronicallyasane-bookorontheweb.Specifcation meansexactstatementoftheparticularneedstobesatisfed oressentialcharacteristicsthatacustomerrequiresingoods,material,method,process,service,system,orworkandwhichavendormustdeliver.Specifcations arewrittenusuallyinamannerthatenablesbothparties(and/oranindependentcertifer)tomeasurethedegreeofconformity
Specifcationsaredividedgenerallyintotwomaincategories:
Performancespecifcations: Conformtoknowncustomerrequirementssuchaskeepingaroom’stemperature•withinaspecifedrange.
Technicalspecifcations: Expressthelevelofperformanceoftheindividualunits,andaresubdividedintothe•following:
Individualunitspecifcations whichstateboundaries(parameters)oftheunit’sperformanceconsistingofa ?nominal (desired or mandated) value and tolerance (allowable departure from the nominal value)
Acceptablequalitylevelwhichstateslimitsthataretobesatisfed bymostoftheunits,butacertain ?percentage of the units is allowed to exceed those limits, and
Distributionspecifcations whichdefne anacceptablestatisticaldistribution(intermsofmeandeviation ?and standard deviation) for each unit, and are used by a producer to monitor its production processes

Purchase and Material Management
8/JNU OLE
1.11 Scheduling
Schedulingmeans“assigninganappropriatenumberofworkerstothejobsduringeachdayofworkanddeterminingwhenanactivityshouldstartorend”.Scheduledependsonthefollowing:
duration•
predecessor activity (or activities)•
predecessor relationships•
resource availability•
target completion date of the project•
1.12 Procurement
Procurement means acquisition. It includes the complete process of obtaining goods and services from preparation and processing of a requisition to receipt and approval of the invoice for payment. It is also called sourcing.
Procurement involves the following activities:
purchase planning•
standards determination •
specifcationsdevelopment•
supplier research and selection•
value analysis•
fnancing•
price negotiation •
making the purchase •
supply contract administration•
inventory control and stores, and•
disposals and other related functions•
1.13 Purchasing
Basically, the job of a materials manager is to provide to the user departments, right material at the right time in right quantity of right quality at right price, from the right source. To meet these objectives, the activities undertaken includeselectionofsourcesofsupply,fnalisation ofthetermsofpurchase,placementofpurchaseorders,followup, maintenance of relations with vendors, approval of payments to vendors, evaluating, rating and developing vendors.
Before deciding the quantity to be purchased, the following factors should be taken into consideration:
Quantity already ordered•
Quantity reserved - It may happen that a particular quantity, though in hand, might have been reserved for a •particular job which is not available for other purposes. In such cases, this quantity is such, as if it is not in stock
Funds availability - Amounts which are kept aside for drawing up purchase budget should be considered•
Normally, the process of purchasing the materials involves the following stages:
Requisitioning:Atthisstage,thepurchasingoffcershouldreceiveanaccuratedescriptionofthegoodsorservice•required.Therequisitionformbywhichamemberofstaffnotifes purchasingoffcer ofaneedforgoodsorservices should be simple, but clear. The more accurate and detailed the requisition form is, the more are the chances that the purchase will meet the expectations.
Financialapproval:Here,thepurchasingoffcer mustbegiventheapprovalfromaresponsibleperson.Itshould•be done before the purchasing commitment is made, and the purchasing system should ensure that this is done at the right time and by the right person.

9/JNU OLE
Marketassessment:Thepurchasingoffcer receivesanapprovedrequisitionandstartsmarketresearchinthis•stage. He should check that the item is not already in stock, that there is a competitive market for the item, if thereisalistof“approvedsuppliers”fortheitem,ifalowerpricecanbenegotiated,andsoon.
Purchasedecision:Duringpurchasedecisionstage,afterthepurchasingoffcercompletedthemarketassessment•and determined the method of purchase, he decides on the supplier or suppliers. To avoid internal customer complaints or audit reproof, the decision must be well documented to provide clear reasons as to why a particular supplier has been chosen.
Ordering:Attheorderingstage,themaininstrumentpurchasingoffcer workswithisanorderform.Theorder•formisanoffcial, numbereddocumentwhichdetailsthepurchaserequirementsandauthorisesthesuppliertodeliverthegoodsorservicestothecompany. Also,itcanfulflotherimportantfunctions.
Delivery:Atthedeliverystage,thepurchasingoffcercontrolsthemethod,termsandtimeofdeliveryestablished•while ordering. In case there is a competitive transport market, wise freighting decisions can lead to considerable cost savings.
Receiptingandaccounting:Atthisstage,thepurchasingoffcer shouldcheckwhetherthequalityandquantity•of delivered goods or services are relevant to ones in the purchase order. Usually, suppliers are not paid until the goods are checked however, this procedure should be taken up without unnecessary delays to ensure that payment terms are met.
Payment:Atthepaymentstage,thepurchasingoffcer makessurethatthepaymentsaremadeonthedatesthey•are due, because maintaining good supplier relations is very important. Also, he should control the terms of payment in case, they include previously negotiated discounts, progress payments or postponement of payment during warranty period.
1.14 Inspection
Inspection involves critical appraisal involving examination, measurement, testing, gauging, and comparison of materials or items. An inspection determines if the material or item is in proper quantity and condition, and if it conformstotheapplicableorspecifedrequirements.
Inspection is generally divided into three categories:
Receiving inspection •
In-process inspection and •
Final inspection •
1.15 Quality Control
A subset of the quality assurance (QA) process, it comprises of activities employed in detection and measurement of the variability in the characteristics of output attributable to the production system, and includes corrective responses. In quality control the role of inspection is to verify and validate the variance data.
1.16 Packaging
Packaging includes processes (such as cleaning, drying, and preserving) and materials (such as glass, metal, paper or paperboard, plastic) employed to contain, handle, protect, and/or transport an article. The role of packaging is expandingandmayincludefunctionssuchastoattractattention,assistinpromotion,providemachineidentifcation(barcodes, etc.), impart essential or additional information, and help in utilisation.
1.17 Storage
Storage means non-transitory, semi-permanent containment, holding or placement of goods or materials, usually with the intention of retrieving them at a later time. It does not include the interim accumulation of a limited amount during processing, maintenance, or repair.

Purchase and Material Management
10/JNU OLE
1.18 Inventory Control
Inventory control covers aspects such as setting inventory levels, doing various analyses such as ABC, XYZ, etc, fxingeconomicorderquantities(EOQ),settingsafetystocklevels,leadtimeanalysisandreporting.
1.19 Distribution
Distribution means movement of goods and services from the source through the distribution channel, right up to thefnalcustomer,consumer,oruser.
1.20 Disposal
Disposalmeansfnal placementorriddanceofwastes,excess,scrap,etc.,underproperprocessandauthoritywith(unlike in storage) no intention to retrieve. Disposal may be accomplished by abandonment, destruction, internment, incineration, donation, sale, etc.
1.21 Functions of Material Manager
The functions of a material manager are as under:
materials planning and control•
purchasing•
management of stores•
inventory control•
useofinformationtechnologyforeffcientmaterialmanagement•
1.22 Effects of Over Stocking and Under Stocking
The objective of material is to maintain optimum stock. The principle which should be kept in mind is that there should not be any over stocking or under stocking of materials, as both these situations involve costs.
Overstocking will result into the following consequences:
blocking of working capital, resulting in escalating cost of capital investment •
riskofdeteriorationofqualityandobsolescenceresultinginthematerialbeingunftforuse•
more storage facilities, resulting in higher rental cost •
additional insurance cost •
more material handling and up-keeping•
risk of breakage/pilferage, etc. •
price of raw material may go down in future•
in a nut-shell, carrying cost goes up •
however, ordering cost goes down •
Understocking will result into the following consequences:
production hold-ups, resulting into disturbed delivery schedules•
frantic eleventh hour purchases which may result in unfavourable prices and quality•
payment for idle time to workers•
increase in the number of orders which will result in more transportation cost•
in nut shell ordering cost goes up •
however carrying cost goes down •
Overstocking or understocking of materials results in losses, hence a manufacturer should go for optimum stock.

11/JNU OLE
Summary
The term material refers to all commodities which are consumed in the production process. The materials •whichcanbeconsumedintheproductionprocesscanbebasicallyclassifed asdirectmaterialsandindirectmaterials.
Material is generally called as raw material. Inventory is a name collectively given to raw material, work in •processandfnishedgoods.
Inventory includes idle resources that have future economic value. It indicates that it may be available in different •forms depending upon the production cycle stage it is in.
Materialsmanagementcanbedefnedas“anintegratedmanagementapproachtoplanning,acquiring,processing•anddistributingproductionmaterialsfromtherawmaterialstatetothefnishedproductstate”.
The fundamental objectives of the materials management function are acquisition of materials and services: of •the right quality, in the right quantity, at the right time, from the right source, and at the right time.
A company may hold the inventory with the various motives such as: transaction motive, precautionary motive, •and speculative motive.
Materialplanningisascientifc wayofdeterminingtherequirementsstartingwithrawmaterials,consumables,•spare parts and all other materials that are required to meet the given production plan for a certain period.
Materials requirement planning (MRP) considers the annual production plan of the manufacturing concern.•
Codifcation orcataloguingisbasicallyanidentifcation systemforeachitemoftheinventory.Therearethree•broadapproachestodevelopingasuitableidentifcationsystem:arbitrary,symbolic,anduseofdrawingnumbersapproach.
Standardisationmeanstheformulation,publication,andimplementationofguidelines,rulesandspecifcations•for common and repeated use, aimed at achieving optimum degree of order or uniformity in a given context, discipline,orfeld.
Scheduling means assigning an appropriate number of workers to the jobs during each day of work and •determining when an activity should start or end.
References
Aswathappa, K. & Bhat, K. S., 2010. • Production and Operations Management , Introduction to operations Management, 2nd ed., Himalaya Publishing House.
Shim, J. K. & Siegel, J. G., 1999. • Operations Management, Scope of Operations Management, 1st ed., Barrons Education Series Inc.
Introduction to Operations Management• , [Pdf] Available at: <http://highered.mcgraw-hill.com/sites/dl/free/0073377848/609567/stevenson_sample_chapter1.pdf> [Accessed 13 February 2013].
Introduction to Operations Management• , [Pdf] Available at: <http://highered.mcgraw-hill.com/sites/dl/free/0073525251/886181/stevenson11_sample_ch01.pdf> [Accessed 13 February 2013].
Dr. Sumukadas, N., 2013. • [1.a] Introduction to Operations Management, [Video online] Available at: <http://www.youtube.com/watch?v=Y28MsljBgvU> [Accessed 13 February 2013].
Dr. Oke, A., 2012. • Introduction to Operations Management 1, [Video online] Available at: <http://www.youtube.com/watch?v=skg_lg-4m2o> [Accessed 13 February 2013].
Recommended Reading
Krajewski, L., Ritzman, L. P., & Malhotra, M, K., 2009. • Operations Management: Process and supply chain, Operations Management, Prentice Hall Publication.
Murthy, P. R., 2006. • Production and Operations Management, Introduction to Operations Management , 2nd ed., New Age International Publishers.
Gaither, N., & Fraizer, G., 2002. • Operations Management-Overview, Thompson Learning, 9th ed.

Purchase and Material Management
12/JNU OLE
Self Assessment
Whichofthefollowingisdefned as“assigninganappropriatenumberofworkerstothejobsduringeachday1. ofworkanddeterminingwhenanactivityshouldstartorend”?
Procurementa.
Schedulingb.
Planningc.
Disposald.
________________ provides an integrated systems approach to the coordination of the materials activities and 2. the control of total material costs.
Material managementa.
Planning and controlb.
Cost managementc.
Schedulingd.
Inventory is a name collectively given to raw material; work in process and __________.3. servicesa.
equipmentsb.
resources c.
fnishedgoodsd.
Which of the following statements is false?4. Over stocking or under stocking of materials results in losses, hence a manufacturer should go for optimum a. stock.
Specifcations arewrittenusuallyinamannerthatenablesbothparties(and/oranindependentcertifer) tob. measure the degree of conformity.
Codifcation isusuallydonebyateamconsistingofrepresentativesdrawnfromstores,userdepartmentandc. industrial engineering department
The code is designed such that it can be used to tell one thing about an item of material.d.
In quality control, the role of inspection is to verify and validate the ________data. 5. systema.
optimumb.
variancec.
materiald.
________isfrstsubjectedtoamanufacturingprocessbeforeitbecomesfnishedgoods.6. Procurementa.
Planningb.
Raw materialc.
Purchasingd.

13/JNU OLE
What do the idle resources have in an inventory?7. Future economic valuea.
Future purchasing valueb.
Futureproftvaluec.
Future manufacturing valued.
Thematerialswhichcanbeconsumedintheproductionprocesscanbebasicallyclassifedas__________.8. rawmaterialandfnishedmateriala.
direct material and indirect materialb.
minimum material and maximum materialc.
spare material and optimum materiald.
Which of the following statements is true?9. In-processinventoriesprovidethefexibility necessarytodealwithvariationsindemandbetweendifferenta. phases of manufacturing.
Whatoneidentifesashardgoodsandsoftgoodswillremainsamewitheveryindustry.b.
Materials management is the branch of statistics that deals with the tangible components of a supply c. chain.
Material management is not concerned with the location and purchase of materials needed, their storage d. and movement.
Whichofthefollowingarethreebroadapproachestodevelopingasuitableidentifcationsystem?10. Arbitrary, symbolic and use of drawing numbers approacha.
Arbitrary, random and use of drawing numbers approachb.
Arbitrary, supply and use of drawing numbers approachc.
Arbitrary, symbolic and use of prime numbers approachd.

Purchase and Material Management
14/JNU OLE
Chapter II
Material Cost Management
Aim
The aim of this chapter is to:
introduce the concept of economic order quantity•
explain the material cost management•
elucidate the various inventory levels•
Objectives
The objectives of this chapter are to:
defnematerialcost•
explicate the drawbacks of Economic Order Quantity model (EOQ)•
enlist the ABC analysis•
Learning outcome
At the end of this chapter, you will be able to:
defnetheXYZanalysis•
recognise about AX control•
identify the advantages of ABC analysis•

15/JNU OLE
2.1 Introduction to Material Cost Management
Theobjectofinventorycontrolistoreducetheinvestmentintheinventorywithoutaffectingtheeffciency intheareaofproductionandsales.Ifasuffcient stockofrawmaterialisnotavailable,theproductionactivityislikelytobeinterrupted.Ifsuffcient stockoffnished goodsisnotavailable,itmaynotbepossiblefortheorganisationtoserve the customers properly and they may shift to the competitors. The objective of inventory control is to avoid the situation of over stocking as well as under stocking. The level of inventories should be maintained at the optimum level. Excess stock results in higher carrying cost and less stock results in excess ordering cost. In case of a typical manufacturingtypeofoperation,theactivitymayconsistofconversionofrawmaterialintheformoffnishedgoodswiththehelpoflabourandotherservicesandsellingthefnished goodsinthemarkettoearntheprofts.Though inventory is an idle resource, it is almost essential to keep some inventory in order to promote smooth and effcientrunningofbusiness.
For example: Consider the case – an enterprise that does not have any inventory. Clearly, as soon as the enterprise receives a sales order, it will have to order for raw materials to complete the order. This will keep the customers waiting. It is quite possible that sales may be lost. Also the enterprise may have to pay high price for some other reasons. On the other hand, inventory may promote sales by reducing customers waiting time.
It is essential to maintain the inventories in order to enhance the stability of production and employment levels. Considerthecaseofseasonalitems.Anyfuctuation indemandcanbemetifpossible,byeitherchangingthatpartofproductionorwithinventories.Ifthefuctuation isnotfollowedbychangingtherateofproduction,onehastotake into account the following costs.
Cost of increasing production and employment level, involves the following:
employment and training•
additional staff and service activities•
added shifts•
overtime costs•
Cost of decreasing production and employment level, involves the following:
employee compensation•
other employee costs•
staff, clerical and service activities•
total time costs•
The functions of inventories are to:
protectagainstunpredictablevariations(fuctuations)indemandandsupply•
take advantage of the price discounts by bulk purchases•
take the advantage of batches and longer production run•
providefexibilitytoallowchangesinproductionplansinviewofchangeindemands,etc.•
facilitate intermittent production•
2.2 Material Cost
Material cost is the cost of commodities and materials used by the organisation. It can be direct or indirect.
DirectMaterialisindicativeofmaterialwhichcanbeidentifed withtheindividualproductandwhichbecomes•anintegralpartofthefnished goods.Itbasicallyconsistsofallrawmaterials,eitherpurchasedfromoutsideor manufactured in-house.
IndirectMaterialindicatesthatmaterialwhichcannotbeidentifed withtheindividualproduct.Thismaterial•assiststhemanufacturingprocessanddoesnotbecomeanintegralpartoffnished goods.Theexamplesofindirect material may be consumable stores, cotton waste, oils and lubricants, stationery material, primary packing material, etc.
Purchase and Material Management
16/JNU OLE
Material cost is categorised as variable cost. The cost increases with the increase in the level of production activity andviceversa.Theheartofinventoryanalysisresidesintheidentifcation ofrelevantcosts.Someoftheimportantcosts that apply to inventory situation are as follows:
Ordering or set up costs: These are the costs associated with ordering or manufacturing goods through purchasing •or manufacturing and are known as set up costs or cost of ordering. Set up costs are generally assumed to be independent of the quantity ordered or produced.
Purchase cost or production cost (Material cost): When large production runs are in process, these results in •reduction of production cost per unit. Often, discounts are offered for the purchase of large quantities. In other words, often the unit cost of an item depends on the quantity procured or produced.
Inventory holding cost or carrying cost: The cost associated with carrying or holding the goods in stock are •known as carrying or holding costs. These costs arise due to the storage costs, property taxes on the items in inventory, interest on the invested capital (interest on value of the inventory items, spillage of the inventory items, depreciation of the inventory items, transportation and handling of the items in inventory, etc).
Shortage or stock out costs: The costs that are incurred as a result of running out of stock are known as stock out •orshortagecosts.Asaresultofshortages,salesorgoodwillmaybelost.Iftheunfulflled demandfortheitemscanbesatisfed atalaterdate(backordercase).Inthiscase,thecostofbackordersareassumedtovarydirectlywiththeshortagequantity(inrupeevalue)andthedelayingtime.However,iftheunfulflled demandislost(lost-sales case), in this case, the cost of shortages are assumed to vary directly with the shortage quantity.
Example: For calculating material cost
The following is the information about a manufacturing unit, M/s Vishal Industries-
Elements of cost Amount per unit
Raw material 80
Direct labour 30
Overheads 60
Total cost 170
Proft 30
Selling Price 200
The following further particulars are available:
Raw materials are in stock for one month•
Materials are in process for an average of half month•
Finished Goods are in stock for an average of one month•
Credit allowed to customers is two months•
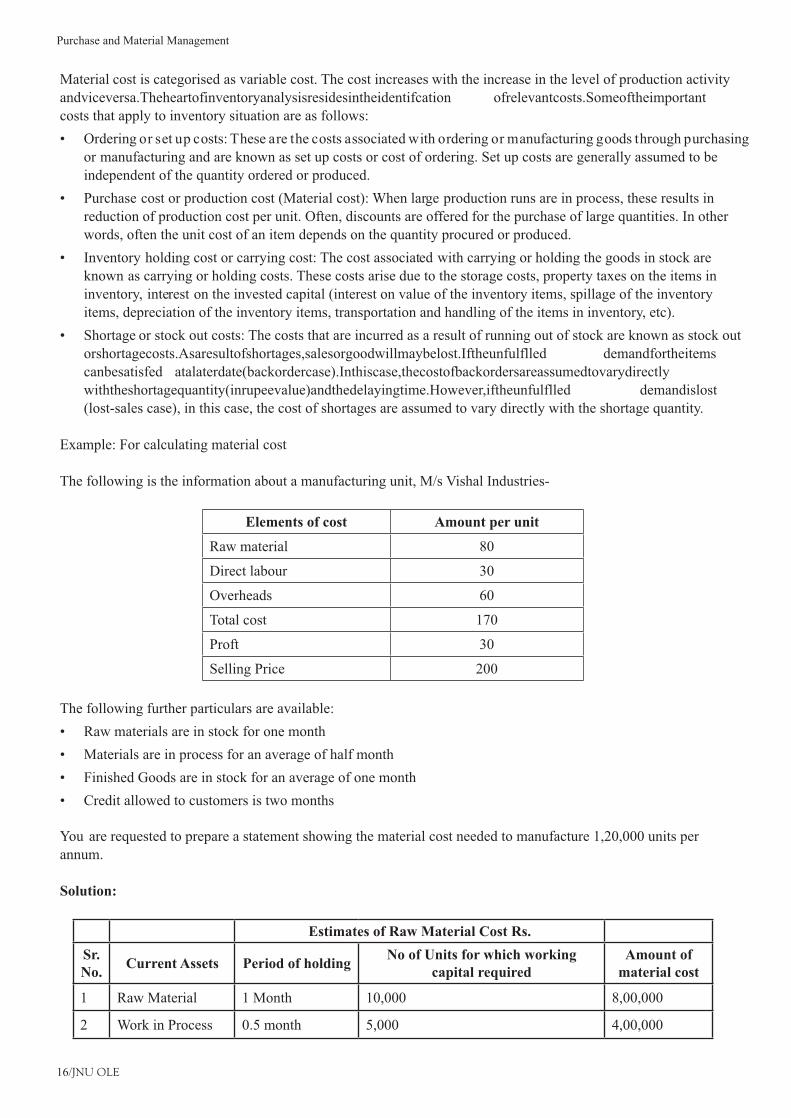
You are requested to prepare a statement showing the material cost needed to manufacture 1,20,000 units per annum.
Solution:
Estimates of Raw Material Cost Rs.
Sr. No.
Current Assets Period of holdingNo of Units for which working
capital requiredAmount of
material cost
1 Raw Material 1 Month 10,000 8,00,000
2 Work in Process 0.5 month 5,000 4,00,000

17/JNU OLE
3 Finished Goods 1 Month 10,000 8,00,000
4 Debtors 2 Months 10,000 16,00,000
Total 36,00,000
Working notes
Sr.No.
Category Period of holdingNo of units for which
working capital requiredAmount of
Material cost
1 Raw material 1 Month 10,000 8,00,000
2 Work in Process 0.5 Month 5,000 4,00,000
3 Finished Goods 1 Month 10,000 8,00,000
4 Debtors 2 Months 10,000 16,00,000
Total 36,00,000
Cash
Raw Material
Work in
Process
Finished
Goods
Debtors
Fig. 2.1 Process from procurement to realisation of money
Note: We have not considered the labour cost and other cost, since it is outside the purview of material cost. From the above example, it is clear that the cost of raw material is present in raw material stage, work in process stage, fnished goodstageanddebtors.Rawmaterialislikealifebloodoftheindustrywhichfows throughouttheprocessfrom procurement stage to realisation money from debtors.
2.3 Economic Order Quantity (EOQ) Models
Economic Order Quantity (EOQ) models are the most basic models of inventory management. EOQ model is essentially a trade-off between various relevant costs and derive an order quantity and time for placing an order in such a way that the total costs are minimised.
Economic lot size or economic order quantity model assumptions are:
The rate of demand for the item is deterministic and is constant D units per annum, independent of time•
Productionrateisinfnite,i.e.,productionisinstantaneous•
Shortages are not allowed •
Lead time is zero or constant independent of demand and the quantity ordered•
The entire quantity is delivered as a single package (or production in a single run)•

Purchase and Material Management
18/JNU OLE
Objective of the EOQThe prime objective of EO is to minimise the average annual variable cost. Economic Order Quantity (EOQ) indicates thatquantity,whichisfxed insuchawaythatthetotalvariablecostofmanagingtheinventory,canbeminimised.Such cost basically consists of two parts:
First, ordering cost (which in turn consists of the costs associated with the administrative efforts connected with •preparation of purchase requisitions, purchase enquiries, transportation cost and handling of more number of bills and receipts)
Second, carrying cost i.e., the cost of carrying or holding the inventory (which in turn consists of the cost like •godown rent, handling and upkeep expenses, insurance, opportunity cost of capital blocked i.e., interest etc.)
There is a reverse relationship between these two types of costs i.e.,
If the purchase quantity increases, ordering cost may get reduced but the carrying cost increases and vice versa.
A balance is to be struck between these two factors and it is possible at Economic Order Quantity (EOQ), where the total variable cost of managing the inventory is the least.
The following is the formula for calculating Economic Order Quantity: EOQ=√(2 AO)/C
Where,Q = Economic Order Quantity A = Annual Requirement in Units O = Cost of Placing an Order C = Cost of Carrying One Unit per Year
ExampleA manufacturer uses 4,000 units of a component every year and he buys them entirely from outside supplier. The order placing and receiving cost is Rs.100 per order and annual carrying cost is Rs. 10%. Unit cost of raw material is Rs 200/-. Calculate Economic Order Quantity.
Solution: EOQ=√(2 AO)/C√(2=x4,000x100)/10%of200√(8=,00,000/20)√4=0,000
= 200 units
Annual Requirement: 4,000 Ordering cost per order: 100 Carrying Cost: 10% Price per unit: 200
Lot size No. of orders Ordering cost Carrying cost Total cost
1 2 3 4 5
2=4000/col. 1 3=100xcol.2 4=col.1x100x0.10/2 5=3+4
50 80 8,000 500 8,500
100 40 4,000 1,000 5,000
150 27 2,667 1,500 4,167
19/JNU OLE
200 20 2,000 2,00 4,000
250 16 1,600 2,500 4,100
500 8 800 5,000 5,800
1000 4 400 10,000 10,400
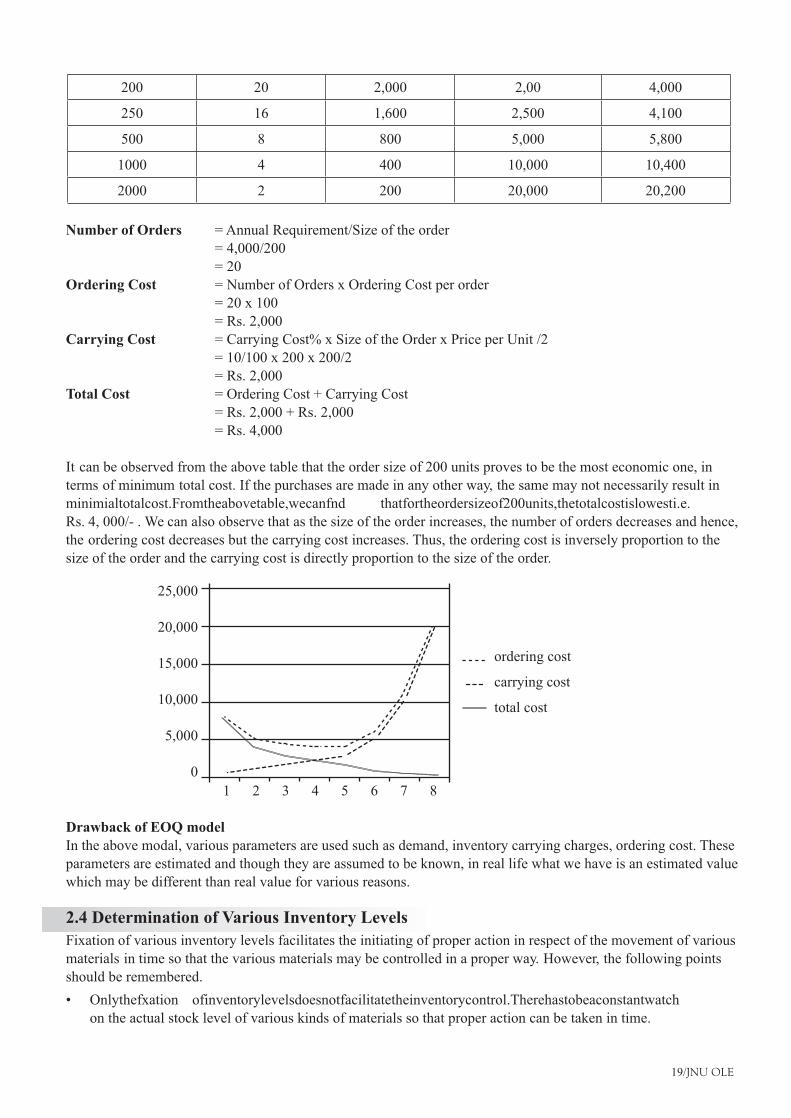
2000 2 200 20,000 20,200
Number of Orders = Annual Requirement/Size of the order = 4,000/200 = 20 Ordering Cost = Number of Orders x Ordering Cost per order = 20 x 100 = Rs. 2,000Carrying Cost = Carrying Cost% x Size of the Order x Price per Unit /2 = 10/100 x 200 x 200/2 = Rs. 2,000Total Cost = Ordering Cost + Carrying Cost = Rs. 2,000 + Rs. 2,000 = Rs. 4,000
It can be observed from the above table that the order size of 200 units proves to be the most economic one, in terms of minimum total cost. If the purchases are made in any other way, the same may not necessarily result in minimialtotalcost.Fromtheabovetable,wecanfnd thatfortheordersizeof200units,thetotalcostislowesti.e. Rs. 4, 000/- . We can also observe that as the size of the order increases, the number of orders decreases and hence, the ordering cost decreases but the carrying cost increases. Thus, the ordering cost is inversely proportion to the size of the order and the carrying cost is directly proportion to the size of the order.
25,000
20,000
15,000
10,000
5,000
0
1 2 3 4 5 6 7 8
ordering cost
carrying cost
total cost
Drawback of EOQ model In the above modal, various parameters are used such as demand, inventory carrying charges, ordering cost. These parameters are estimated and though they are assumed to be known, in real life what we have is an estimated value which may be different than real value for various reasons.
2.4 Determination of Various Inventory Levels
Fixation of various inventory levels facilitates the initiating of proper action in respect of the movement of various materials in time so that the various materials may be controlled in a proper way. However, the following points should be remembered.
Onlythefxation ofinventorylevelsdoesnotfacilitatetheinventorycontrol.Therehastobeaconstantwatch•on the actual stock level of various kinds of materials so that proper action can be taken in time.
Purchase and Material Management
20/JNU OLE
Thevariouslevelsfxedarenotfxedonapermanentbasisandaresubjecttorevisionregularly.•
Thevariouslevelswhichcanbefxedareasbelow:•Maximum Level ?
Minimum Level ?
Re-order Level ?
Danger Level ?
2.4.1 Maximum Level
It indicates the level above which the actual stock should not exceed. If it exceeds, it may involve unnecessary blockingoffundsininventory. Whilefxingthislevel,followingfactorsareconsidered:
maximum usage•
lead time•
storage facilities available, cost of storage, and insurance etc. •
prices for the material •
availability of funds•
nature of the material•
government regulations in respect of import of goods •
economic order quantity•
2.4.2 Minimum Level
It indicates the level below which the actual stock should not reduce. If it reduces, it may involve the risk of non-availabilityofmaterialwheneveritisrequired. Whilefxingthislevel,thefollowingfactorsareconsidered:
lead time•
rate of consumption•
2.4.3 Re-order Level
It indicates that level of material stock at which it is necessarily to take the steps for procurement of further lots of material.Thisisthelevelfallinginbetweenthetwoextremesofmaximumlevelandminimumlevelandisfxed insuch a way that the requirements of production are met properly till the new lot of material is received.
2.4.4 Danger Level
Thisisthelevelfxed belowminimumlevel.Ifthestockreachesthislevel,itindicatestheneedtotakeurgentaction in respect of getting supply. At this stage, the company may not be able to make the purchases in a systematic manner, but may have to make rush purchases which may involve higher costs of purchases.
2.4.5 Calculation of Various Levels
The various levels can be decided by using the following mathematical expressions.
Re-order Level = Maximum Lead Time x Maximum Usage
Maximum Level = Reorder Level + Reorder Quantity - (Minimum Usage x Minimum Lead Time)
Minimum Level = Reorder Level - (Normal Usage x Normal Lead Time)
Average Level = (Maximum Level + Minimum Level)/2
Danger Level = Normal Usage x Lead-time for emergency purchases

21/JNU OLE
Note: It should be noted that the expression of the reorder quantity in the calculation of maximum level indicates economic order quantity.
Illustration 1
Normal usage 50 units per week
Minimum usage 20 units per week
Maximum usage 80 units per week
Reorder quality 500 units
Reorder period 5 to 7 weeks
Compute from the above:Re-order level1. Minimum level2. Maximum level3. Average stock level4.
SolutionReorder Level = Maximum Lead time x Maximum Usage 7 weeks x 80 units = 560 unitsMinimum Level = Reorder Level – (Normal Usage x Normal Lead-time) = 500 units – (50 units X 6 weeks) = 200 units. Maximum Level = Reorder Level+Reorder Quantity - (Minimum Usage x Minimum Lead time) = 560 units + 500 units – (20 units x 5 weeks) = 960 units. Average Stock Level = (Minimum Level + Maximum Level)/2 = (200 units + 960 units)/2 = 580 units
Illustration 2Swarupa Industries manufactures a special product ‘Vick’. The following particulars are collected for the year 1986.
Monthly demand of 'Vick' - 1000 units•
Cost of placing an Order - Rs.100•
Annual carrying cost per unit - Rs.15•
Normal Usage 50 units per week•
Minimum Usage 25 units per week•
Maximum Usage 75 units per week •
Re-order period 4 to 6 weeks•
Compute the following:
Re-order Quantity•
Re-order Level•
Minimum Level•
Maximum Level•
Average Stock Level•

Purchase and Material Management
22/JNU OLE
SolutionReorder Quantity;EOQ =√(2 AO)/C√(2=X12,000X100)/15√(2=4,00,000/15)√1,=60,000
= 400 unitsReorder Level = Maximum Lead Time x Maximum Usage = 6 weeks x 75 units = 450 unitsMinimum Level = Reorder Level - (Normal Usage x Normal Lead time) = 450 units – (50 units x 5 weeks) = 200 units Maximum Level = Reorder Level + Reorder Quantity – (Minimum Usage x Minimum Lead-time) = 450 units + 400 units – (25 units x 4 Weeks) = 750 units. Average Stock Level = (Minimum Level + Minimum Level)/2 = (200 units + 750 units)/2 = 475 units
Theremaybeonemorewayinwhichthevariousinventorylevelsmaybefxed andforthisdeterminationofthesafety stock (also called as minimum stock or buffer stock) is essential. Safety stock is that level of stock below which the actual should not be allowed to fall. The safety stock may be calculated as;
(Maximum Usage x Maximum Lead-time) - (Normal Usage X Normal Lead-time)
Accordingtothismethod,thevariousinventorylevelsasdiscussedabovemaybefxedasbelow.
Minimum Level = Safety stock•
Maximum Level = Safety Stock + EOQ•
Reorder Level = Safety Stock + (Normal Usage x Normal Lead-time) •
Average Stock Level = (Minimum Level + Minimum Level)/2• = (Safety Stock + Safety stock + EOQ)/2
Illustration 3Calculate the various levels from the information given hereunder:
Total cost of purchasing relating to the order Rs. 201. Number of units to be purchased during the year 5,000 2. Purchase price per unit including transportation costs Rs. 503. Annual cost of storage of one unit Rs. 54.
Lead time:•Average ... 10 days ?
Maximum... 15 days ?
Minimum... 6 days ?
Maximum for emergency purchases... 4 days ?
Rate of consumption:•Average... 15 units per day ?
maximum... 20 units per day ?

23/JNU OLE
Solution:Working Notes:
Calculation of Safety Stock• = (Maximum Usage x Maximum Lead-time) (Normal Usage x Normal Lead-time) = (20 units x 15 days) – (15 days x 10 days) = 300 units - 150 units = 150 units
Calculation of EOQ•E=O√Q(2 AO)/C√(2=X5,000X20)/5√40=,000
= 200 units
Reordering Level= Safety Stock + (Normal Usage x Normal Lead-time)= 150 units + (15 units X 10 days)= 150 units + 150 units= 300 units.
Maximum Level = Safety Stock + EOQ = 150 units + 200 units = 350 units
Minimum Level = Safety Stock = 150 units
Danger Level = Normal Usage x Lead-time for emergency purchases = 15 units x 4 days = 60 units
Average Stock Level = (EOQ + Safety Stock + Safety Stock)/2 = (200 + 150 + 150)/2 = 250 units
2.5 ABC Analysis
TheABCclassifcation processis“ananalysisofarangeofobjects,suchasfnished products,itemslyingininventoryorcustomersintothreecategories”.Thismethodusuallycategorisesinventoryintothreeclasseswitheachclasshaving a different management control associated.
A - Outstandingly important•
B - of average importance•
C - Relatively unimportant as a basis for a control scheme•
Each category can and sometimes should be handled in a different way, with more attention being devoted to category A, less to B and still less to C.
Popularly known as the '80/20' rule, ABC concept is applied to inventory management as rule-of-thumb. It says that “about80%oftheRupeevalue,consumptionwise,ofaninventoryremainsinabout20%oftheitems”.Thisruleisfrequentlyusedbyinventorymanagerstoputtheireffortswherethebenefts aremost,intermsofcostreductionas well as maintaining a smooth availability of stock.
The ABC concept is derived from the Pareto’s 80/20 rule curve. It is also known as the 80-20 concept. Here, Rupee value of each individual inventory item is calculated on annual consumption basis. It is a determination of the relative ratios between the number of items and the value of the items consumed on a repetitive basis.

Purchase and Material Management
24/JNU OLE
‘A’ class items are closely monitored because of the value involved (70-80%); High value (A), Low value (C) and intermediaryvalue(B).ABCAnalysisisthebasisformaterialmanagementprocessesandhelpsdefne howstockis managed. It can form the basis of various activity including leading plans on alternative stocking arrangements (consignment stock), reorder calculations and can help determine at what intervals, inventory checks are carried out (forexampleAclassitemsmayberequiredtobecheckedmorefrequentlythanCclassstores.TheABCclassifcationsystem is grouping of items according to annual issue value, (in terms of money), in an attempt to identify the small number of items that will account for most of the issue value and that are the most important ones to control for effective inventory management. The emphasis is on putting effort where it will have the effect is most.
All the items of inventories are put in three categories, as mentioned below:
A Items: These Items are seen to be of high consumption volume. ‘A’ items usually include 10-20% of all •inventory items, and account for 50-60% of the total Rupee consumption volume
B Items: ‘B’ items are those that are 30-40% of all inventory items, and account for 30-40% of the total •Rupee consumption volume of the inventory. These are important, but not critical, and don’t pose sourcing diffculties
C Items: ‘C’ items account for 40-50% of all inventory items, but only 5-10% of the total•
ABCclassifcations allowtheinventorymanagertoassignprioritiesforinventorycontrol.Strictcontrolneedstobe kept on A and B items, with preferably low safety stock level. Taking a lenient view, the C class items can be maintained with looser control and with high safety stock level.
The ABC concept puts emphasis on the fact that every item of inventory is critical and has the potential of affecting, adversely, production, or sales to a customer or operations. The categorisation helps in better control on A and B items. ABCclassifcations canbeusedtodesigncyclecountingschemes.Forexample,Aitemsmaybecounted3times per year, B items 1 to 2 times, and C items only once, or not at all.
Suggested policy guidelines for A , B & C classes of items are given below:
A items (High Cons. Val) B items (Moderate cons. Val.) C item (Low cons. Val)
Very strict cons. Control•
No or very less safety stock•
Phased delivery (Weekly)•
Weekly control report•
Maximum follow up•
As many sources as possible•
Accurate forecasts•
Central purchasing/storage•
Max. efforts to control LT•
TobehandledbySr.offcers•
Moderate control•
Low safety stock•
Once in three months•
Monthly control report•
Periodic follow up•
Two or more reliable•
Estimates on past data•
Combination on past data•
Combination purchasing•
Moderate•
Middle level•
Loose control•
High safety stock•
Once in 6 months•
Quarterly report•
Exceptional•
Two reliable•
Rough estimate•
Decentralised•
Min. clerical efforts•
Can be delegated•
ABCanalysisassumestheprincipleof“VitalFewTrivialMany”whileconsideringtheinventorystructureofanyorganisationandispopularlyknownas“AlwaysBetterControl”.Itisananalyticalmethodofinventorycontrolwhich aims at concentrating efforts in those areas where attention is required most. It is usually observed that only a few numbers of items of inventory prove to be more important in terms of amount of investment in inventory or value of consumption, where as a very large number of items of inventory account for a very meagre amount of investmentininventoryorvalueofconsumption.ABCanalysisclassifes thevariousinventoryitemsaccordingtotheir importance in terms of amount:
‘A’ class consists of only a small percentage of a total number of items handled, but is most important in terms •of amount
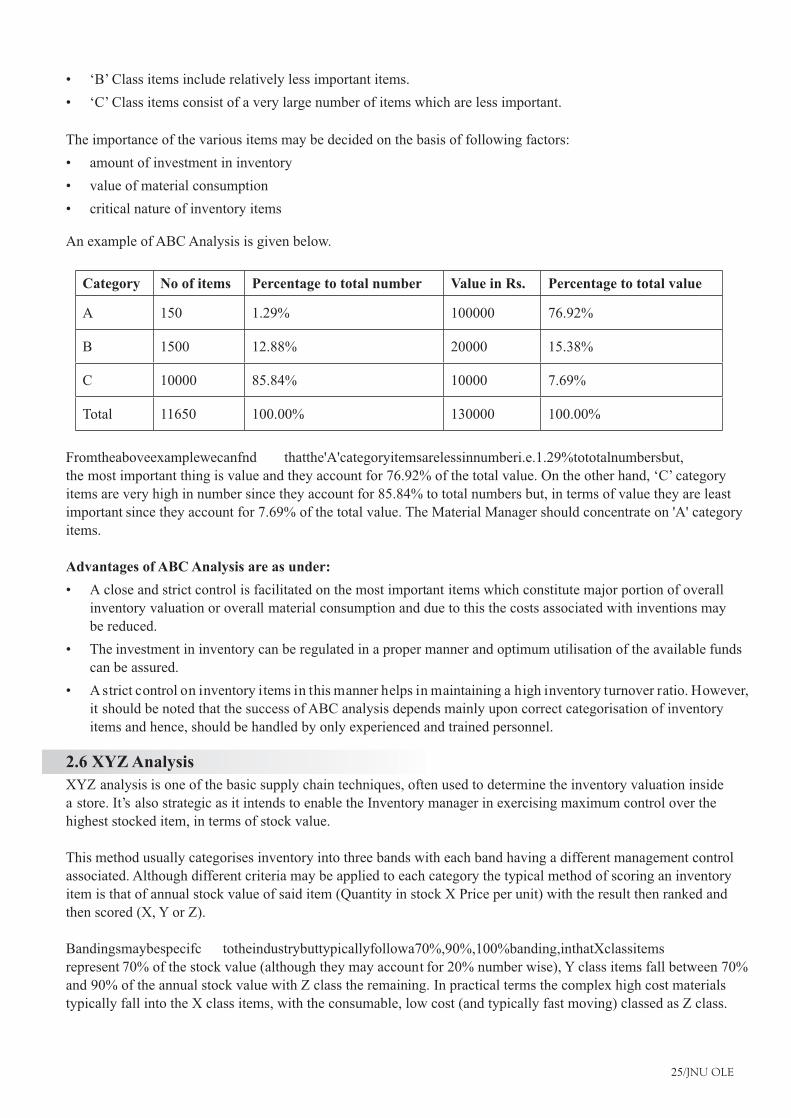
25/JNU OLE
‘B’ Class items include relatively less important items. •
‘C’ Class items consist of a very large number of items which are less important. •
The importance of the various items may be decided on the basis of following factors:
amount of investment in inventory•
value of material consumption•
critical nature of inventory items•
An example of ABC Analysis is given below.
Category No of items Percentage to total number Value in Rs. Percentage to total value
A 150 1.29% 100000 76.92%
B 1500 12.88% 20000 15.38%
C 10000 85.84% 10000 7.69%
Total 11650 100.00% 130000 100.00%
Fromtheaboveexamplewecanfnd thatthe'A'categoryitemsarelessinnumberi.e.1.29%tototalnumbersbut,the most important thing is value and they account for 76.92% of the total value. On the other hand, ‘C’ category items are very high in number since they account for 85.84% to total numbers but, in terms of value they are least important since they account for 7.69% of the total value. The Material Manager should concentrate on 'A' category items.
Advantages of ABC Analysis are as under:
A close and strict control is facilitated on the most important items which constitute major portion of overall •inventory valuation or overall material consumption and due to this the costs associated with inventions may be reduced.
The investment in inventory can be regulated in a proper manner and optimum utilisation of the available funds •can be assured.
A strict control on inventory items in this manner helps in maintaining a high inventory turnover ratio. However, •it should be noted that the success of ABC analysis depends mainly upon correct categorisation of inventory items and hence, should be handled by only experienced and trained personnel.
2.6 XYZ Analysis
XYZ analysis is one of the basic supply chain techniques, often used to determine the inventory valuation inside a store. It’s also strategic as it intends to enable the Inventory manager in exercising maximum control over the highest stocked item, in terms of stock value.
This method usually categorises inventory into three bands with each band having a different management control associated. Although different criteria may be applied to each category the typical method of scoring an inventory item is that of annual stock value of said item (Quantity in stock X Price per unit) with the result then ranked and then scored (X, Y or Z).
Bandingsmaybespecifc totheindustrybuttypicallyfollowa70%,90%,100%banding,inthatXclassitemsrepresent 70% of the stock value (although they may account for 20% number wise), Y class items fall between 70% and 90% of the annual stock value with Z class the remaining. In practical terms the complex high cost materials typically fall into the X class items, with the consumable, low cost (and typically fast moving) classed as Z class.

Purchase and Material Management
26/JNU OLE
Not all stock is equally valuable and therefore doesn’t require the same management focus. The results of the XYZ analysis provide information that helps evaluate how each inventory part should be monitored and controlled. X class items which are critically important and require close monitoring and tight control – while this may account for large value these will typically comprise a small percentage of the overall inventory count. Y class is of lower criticality requiring standard controls and periodic reviews of usage. Z class requires the least controls.
Classifcation ofinventoryintermsofXYZisalsoquitestrategicasitcanformthebasisofvariousactivityincluding leading plans on alternative stocking arrangements (consignment stock), reorder calculations and can help determine at what intervals inventory checks are carried out. For example X class items may require to be checked more frequently than Z class stores.
The main difference between the ABC Analysis and XYZ Analysis is that in case of ABC Analysis, the materials are classifed onthebasisofvalueofmaterialsconsumedwhereasincaseofXYZAnalysis;thematerialsareclassifedon the basis of value of materials held in the stock.
Inventory plays an important role for any organisation as it blocks the working capital which otherwise would have earned the organisation some money. While the need for having inventory can’t be denied for any running plant / machinery, its availability in controlled measures too is highly desirable. Control techniques such as ABC and XYZ analyses try to ensure the maximum control of materials.
AX control One of the ways to have still better (tight) control over the inventory with still less commitment of resources is by determining the AX category of items in a given inventory. Once ABC and XYZ analyses have been done and a list of A and X classes of items is drawn then AX category is a combination of the two categories. Going by the defnition ofAandXseparately,AXcategoryofitems,normally,displayahighconsumption(A)aswellasahighstock value (X). Essentially, these items are high value, in terms of overall procurement cost.
Obviously, the measures that need to be taken to keep AX inventory under control is similar to that of A or X items that are:
stock less number at any given time•
have tight consumption control•
more sources so that supply doesn’t become a constraint when needed etc.•
Based on the ABC and XYZ analysis there is another control mechanism, popularly known as AX control. Materials falling under A category under ABC analysis and X category under XYZ analysis are included in AX category and maximum control is exercised on these items.
The combination of ABC analysis and XYZ analysis will give the following alternatives.
X Y Z
A AX AY AZ
B BX BY BZ
C CX CY CZ
AX category the most important items of materials and CZ category the least important category.
27/JNU OLE
Summary
Theobjectofinventorycontrolistoreducetheinvestmentintheinventorywithoutaffectingtheeffciency in•the area of production and sales.
It is essential to maintain the inventories in order to enhance stability of production and employment levels.•
Cost of increasing production and employment level, involves: employment and training, additional staff and •service activities, added shifts, and overtime costs.
Cost of decreasing production and employment level, involves: employee compensation, other employee costs, •staff, clerical and service activities, and total time costs.
MaterialCostisthe“costofcommoditiesandmaterialsusedbytheorganisation”.Itcanbedirectorindirect.•
DirectMaterialindicatesthatmaterialwhichcanbeidentifed withtheindividualproductandwhichbecomes•anintegralpartofthefnishedgoods.
IndirectMaterialindicatesthatmaterialwhichcannotbeidentifedwiththeindividualproduct.•
Ordering or set up costs: These are the costs associated with ordering or manufacturing goods through purchasing •or manufacturing.
Purchase cost or production cost (Material Cost): When large production runs are in process, these results in •reduction of production cost per unit.
The cost associated with carrying or holding the goods in stock are known as carrying or holding costs.•
The costs that are incurred as a result of running out of stock are known as stock out or shortage costs.•
Economic Order Quantity (EOQ) models are the most basic models of inventory management. EOQ model is •essentially a trade-off between various relevant costs and derive an order quantity and time for placing an order in such a way that the total costs are minimised.
FormulaforcalculatingEconomicOrderQuantitycanbegivenas-EOQ=√(2 AO)/C•
Various inventory levels are: maximum, minimum, re-order and danger level.•
TheABCclassifcation processis“ananalysisofarangeofobjectssuchas,fnished products,itemslyingin•inventoryorcustomersintothreecategories”.
XYZ analysis is one of the basic supply chain techniques, often used to determine the inventory valuation •inside a store.
References
Aswathappa, K., 2010. • Production and Operations management- Manufacturing and Service operations , Himalaya publishing House.
Kumar, S.A., 2006. • Production and operations management-Introduction to production and operations management, New Age International.
Introduction to Product and Operations Management• , [Pdf] Available at: <http://www.newagepublishers.com/samplechapter/001233.pdf> [Accessed 13 February 2013].
Tutor2u, • Introduction to POM, [Online] Available at: <http://tutor2u.net/business/production/pom_introduction.html> [Accessed 13 February 2013].
Dr. Oke, A., 2012. • Introduction to Operations Management 2, [Video online] Available at: <http://www.youtube.com/watch?v=nT2b5CGuIvM> [Accessed 13 February 2013].
2010. • Introduction to Product Management , [Video online] Available at: <http://www.youtube.com/watch?v=ONrbwhPxJUc> [Accessed 13 February 2013].
Recommended Reading
Arora, K. C., 2004. • Production and Operations Management, Service Operations, Firewall Media.
Kolli, S., • Essentials of Production and Operations Management, Research and entertainment Association.
Khanna, • Production And Operations Management, PHI Learning Pvt. Ltd.

Purchase and Material Management
28/JNU OLE
Self Assessment
_________materialindicatesthatmaterialwhichcannotbeidentifedwiththeindividualproduct.1. Inventorya.
Directb.
Indirectc.
Costlyd.
Theheartof_________analysisresidesintheidentifcationofrelevantcosts.2. producta.
fnishedgoodsb.
raw materialc.
inventoryd.
The ABC concept is derived from which of the following?3. Pareto’s 20/80 rule curvea.
Pareto’s 40/20 rule curveb.
Pareto’s 40/80 rule curvec.
Pareto’s 80/20 rule curved.
What is material cost categorised into?4. Variable Costa.
Fixed costb.
Explicit costc.
Implicit costd.
Which of the following statements is false?5. Inventory plays an important role for any organisation as it blocks the working capital which otherwise a. would have earned the organisation some money.
All the stock is equally valuable and therefore doesn’t require the same management focus.b.
Safety stock is that level of stock below which the actual should not be allowed to fall.c.
The cost increases with the increase in the level of production activity and vice versa.d.
Which of the following statements is true?6. Inventoryisanproftable resource,itisalmostessentialtokeepsomeinventoryinordertopromotesmootha. andeffcientrunningofbusiness.
The objective of inventory control is to avoid the situation of over stocking as well as under stocking.b.
It is not essential maintain the inventories in order to enhance stability of production and employment c. levels.
The level of inventories should be maintained at the minimum level.d.
29/JNU OLE
_______Analysisisthebasisformaterialmanagementprocessesandhelpsdefnehowstockismanaged.7. Profta.
ABCb.
XYZc.
Inventoryd.
_______costs are generally assumed to be independent of the quantity ordered or produced.8. Orderinga.
Purchasingb.
Carryingc.
Set-upd.
Which of the following is that level of stock below which the actual should not be allowed to fall?9. Safetya.
Optimumb.
Requiredc.
Purchased.
Which of the following is the correct formula for calculating economic order quantity?10. EOQ=√(3 AO)/Ca.
EOQ=√(4 AO)/Cb.
EOQ=√(2CO)/Ac.
EOQ=√(2 AO)/Cd.
Purchase and Material Management
30/JNU OLE
Chapter III
Material Requirements Planning
Aim
The aim of this chapter is to:
explain the concept of Material Requirements Planning (MRP)•
elucidate objectives and advantages of MRP•
explain the limitations of MRP and analyse its system components•
Objectives
The objectives of this chapter are to:
defneMRP anddetermineitssystemcomponents•
recognise the objectives, advantages and limitations of MRP•
describe the concept of demand dependency•
Learning outcome
At the end of this chapter, you will be able to understand:
describe MRP and its objectives, advantages and limitations•
understand system components of MRP•
identify MRP in changing environment•

31/JNU OLE
3.1 Introduction
In the recent times, Material Requirements Planning (MRP) systems have replaced conventional planning systems which were reactive inventory systems in several organisations. The traditional reactive systems were simple to manage but were having serious drawbacks such as high inventory costs and unreliable delivery performance. However, the new system is more complex to manage but has several advantages. It reduces inventories and their associated costs as it carries only those items and components that are actually needed. Through its forward planning approach, it ensures that all the materials required are available whenever needed for production and aims at reducing order-processing delays. By setting realistic job completion dates, jobs can be completed on time, order promises are keptandproductionleadtimesaresignifcantly reduced.Improvedcustomerservices,alongwithotheradvantagesare achieved in more ways making it economical and effective.
3.2 Defnition of MRP
Material requirements planning is a time phased priority-planning technique that calculates material requirements •and schedules supply to meet demand across all products and parts in one or more plants.
It is a computer based system in which the given Master Production Schedule (MPS) is divided into the required •raw materials, parts and subassemblies needed to produce the end product in each time period, which may be a week or month of the production horizon.
MRP is an inventory control process carried out with the aid of the computer to determine time-phased requirement •of components that are used for manufacturing products on the assembly line principles.
MRP aims at solving problems at inventory control such as, the supply of the components in right quantity •attherighttime,toavoidstockpillingofheavyinventoryandstockdefciencies, MRPisusedfordependentdemand solutions. Computer architecture for MRP can be shown as follows:
Inventorystatus
Output
MRPProgram
Bill ofmaterials
MasterSchedule
Orders
Fig. 3.1 Computer architecture for MRP

Purchase and Material Management
32/JNU OLE
3.3 System Components
Material requirements planning system can be represented diagrammatically as follows:
MasterProduction
Schedule (MPS)
Materials requirementPlanning (MRP)Processing logic
BillsofmateralsfleInventoryststusfle
Order relaeserequirments (orders to
be released now)
Order rescheduling(expedite, deexpedite,cancle, open orders)
Planned orders(future)
Fig. 3.2 Material requirements planning system
Under the MRP system, three major sources of information are necessary, a Master Production Schedule (MPS), a billofmaterialsfleandaninventorystatusfle. Thesecomponentsarediscussedbelow.
Master Production Schedule (MPS)
AMasterProductionSchedule(MPS)isaplanforproduction,staffng, inventory,andsoon.MPSisdeveloped•asthecustomerordersarereceivedbythefrm orfromtheforecastsofdemandbeforetheMRPsystembeginsto operate.
The MPS is an input to the MRP system. It is designed to meet market demand by identifying the quantity of each •end product and when it is to be produced during each future period, during production planning horizon.
Orders are placed for replacement components for customers and entered as end items in the MPS. Thus, MPS •provide the important information for the MRP system
Bills of Materials
A Bill of Materials or BOM is a list of the raw materials, sub-assemblies, intermediate assemblies, components, •sub-components, parts and the quantities of each needed to manufacture the end product. This information is obtainedfrom productdesign documents,work fow analysisand otherstandardmanufacturingand industrialengineering documents.
The MRP receives primary information from the BOM i.e. the product structure which shows various components •oftheproduct.Eachitemintheproductisgivenauniqueidentifcation number.Takingintoconsiderationthemaster schedule for the end items, MRP schedules the time phase for the orders for the correct components items in the production structure.
Inventory status fle
TheMRPsystemmustretainanupdatedfleoftheinventorystatusofeachitemintheproductstructure.Thisfle•provides accurate and up-to-date information about the availability of every controlled item by the MRP system, which can then maintain an accurate accounting of all inventory transactions both actual and planned.
Theinventorystatusfle containstheidentifcation numbers,quantityonhand,safetystocklevel,quantity•allocated and procurement lead time of every item.

33/JNU OLE
3.4 Demand Dependency
The concept of demand dependency is important between the reactive and proactive (planning) systems. The •demand dependency is the degree to which the demand for the same product is associated with the demand for another item.
Incaseof“independentdemand”,thedemandisunrelatedtothedemandforotheritems.However,incase•ofa“dependentdemand”situation,ifweknowthedemandforoneitem,wecandeducethedemandfortheother related items. For example, If the demand for a product is known, we can calculate how many of its subcomponents are needed as its demand is already known.
In the past, industries used reactive control systems such as order quantity, reorder point system ignoring the •dependent and independent demand. Now, large safety stocks are not needed for dependent demand items because it is possible to calculate the exact amounts required. It is also not necessary to stock up items that are related to the dependent demand.
According to A. K. Dutta, the order point techniques based on Economic Order Quantity (EOQ) are more suited •for items having independent demands because they use past usage of sales data to forecast future demands. But for items which have dependent demands such as lower level components, sub-assemblies, etc., usage data is unrelated to the past demands.
Rather than planning for their requirements and timely availability, master production schedules, bills of •materials and inventory records act as starting points. The master production schedule shows the number of fnishedgoodsandthemajorsubassemblies.
Thebillsofmaterialpreparedforeachitemdefne thepreciserequirementsformaterialsandcomponents.By•consumption, total requirements are arrived at on a need time basis.
Depending on the nature of the industry, the production process and the item, demand for an inventory item •may be either discrete or continuous. Thus, variability of demand and the complexity of production process are the determining in using an order point system or time phased materials planning system.
In job lot or batch production demand discontinuity is pronounced. When production is discontinuous, a product •is broken down in many components, parts subassemblies and the materials planning system coordinates the ordering, delivery schedule and the start off time variation, which automatically minimises the time of inventory.
As there is emphasis on timing rather than quantity, it reduces the probability of production stoppages arising out •of stock outs. At the same time it eliminates the need for maintaining large stocks, which reduces the carrying cost of inventory further.
In practice, discontinuous demand indicates necessity and importance of proper timing of delivery schedules •rather than control of inventory through quantity. The EOQ formula, which assumes constant demands subject tocertainrandomfuctuations attimes,further,assumesneedfortheinventoryathandatallthetime.Theneedto replenish arises when inventory levels fall below the desirable level through constant depletion.
It also assumes that this constant demand is predetermined. But the material planning logic assumes that material •is required only when they are actually manufacturing operations and that these would be available in time.
Earlier it was not done because of huge data processing costs and the time taken for computation. Now, with •the availability of computer facilities at a cheaper rate, computation costs are declining and inventory coasts are rising. Hence, it has become easier to justify time phased materials planning systems which ensure tight operationalcontrol.Itisrapid,fexibleandresponsivetochangesintherequirements.
3.5 Objectives of MRPFollowing are the objectives of MRP:
Inventory reduction: MRP determines the number of components needed and the time when they are needed •to meet the master schedule. It enables the managers to procure the component as it is needed thus avoiding costs of excessive inventory.
Reductioninproductionanddeliveryleadtime:MRPidentifes quantities,timings,availabilities,procurement•and production action required of materials and components to meet delivery dead lines. By coordinating inventories, procurement and production decisions MRP helps in avoiding delays in production. It helps in arranging production activities in priorities by putting due dates on consumer job orders.

Purchase and Material Management
34/JNU OLE
Realistic commitments: Realistic delivery promises can enhance customer satisfaction and make him delighted. •By using MRP, production system can give information in time and likely delivery time to prospective customers. The potential customer orders can be added to the system to show the manager how the revised total loading can be handled with the existing capacity. This will result in more realistic delivery dates.
Increaseineffciency:MRPprovidesclosecoordinationamongstvariousworkcentresasproductionprogresses•through them. Hence production can be processed with fewer indirect personnel and fewer material interruptions. Theinformationprovidedencouragesproductioneffciencies.
It reduces inventory cost by reducing inventory levels.•
Itimprovesplantoperatingeffciencybymakingbetteruseofproductivityresources•
Thus, the MRP technique is used as:•requirement calculator ?
manufacturing and planning control system ?
manufacturing resource planning system ?
3.6 Advantages of MRP
MRP is not only a method of calculating how much material to order and when, but it is also a new technique of conducting manufacturing operations effectively under dynamic conditions. The main advantages of MRP are as follows:
Reduced levels of inventory: Helps in achieving better coordination among various orders for components and •production plans for parent items. As a result average inventory level tends to get reduced for dependent demand items like raw materials and work in progress.
Better utilisation of human and non human resources: Provides accurate prior information; it helps in improving •deliverysystems,fow ofwork,avoidingintermittentdelaysandreducingmanufacturingcycletimesinjobs.All these result in optimum utilisation of all available resources.
Improvedconsumerservice:Enablesmanagerstofx deliverydatesthataredefnitely achievable.Ithelpsin•improving the company’s ability to react to changes in customer orders, improve service by providing quality productsatfairprices,meetassemblydatesandreducedeliverytimesignifcantly.
Effcient fnancial planning:Enablestoplaneffectivecashfow requirements.Itenablestoidentifybottleneck•work centres or capacity constraints thus helping the operations manager to take better investment decisions
Better scheduling: Provides better knowledge about priorities hence better scheduling can be undertaken •easily.
Improved vendor relations: Enables the purchase department to know the priorities and changes in due dates for •orders so that purchaser places the orders on vendors accordingly. This helps in improving vendor relations.
Effcient planning:MaysuggestnecessarychangesintheMasterProductSchedule(MPS)forevaluatingan•alternative to it. It helps in projecting facility and equipment requirement, manpower planning, etc. so that the organisation can survive and grow under competitive conditions.
Promoting engineering efficiency: Helps in planning the time of design releases as well as design •modifcations.
Dynamic nature: MRP is a dynamic system which is an important advantage. It reacts effectively with changing •conditions. In fact it thrives on change. Changing conditions from the master schedule for several periods in future can affect not only the end item but also thousands of components. As the product system is computerised the management can make a new MRP computer run to revise production and procurement plans that react quicklytochangesincustomerdemandsasrefectedinthemasterschedule.
Rational material decisions: In order to maintain planned production schedules, planned order releases for •necessary items have to be acted upon immediately. Thus, it enables the manager to take rational decisions.

35/JNU OLE
3.7 Limitations of MRP
The limitations of MRP are given below:
The limitations of MRP arise from the conditions that need to be met before it can be used. Thus, for implementing •MRP, computers are necessary, the product structure has to be assembly oriented, bills of material and inventory status information need to be regularly collected and computerised and a valid master schedule must be prepared.
Limitations related to data integrity. Unreliable inventory and transaction data from the shop can ruin a well-•planned MRP system. Training personnel to keep accurate is not an easy task, but it is critical for the success of MRP implementation. In general, the system must be accurate and directly useful or else it becomes an expensive ornament that is bypassed in favour of ad hoc methods.
Top management support and proper organisation of functions such as production planning and control, materials, •production, quantity, engineering and so on. Timeliness of generating information, effective communication systems,propermotivationofpeople,effcientleadershiparenecessarythingsforthesuccessfulimplementationof MRP. Most of these can be lacking in many organisations.
3.8 Evaluation of MRP
ThemainadvantagesoftheMRP systemoverconventionalinventoryplanningapproachandfxedordersystemare:
improved customer services•
reduced inventory levels•
improvedoperatingeffciencyoftheproductiondepartments•
The MRP cannot be applied to all production systems. Conventionally, MRP is applied to production units producing discrete products for which a bill of materials can be generated. It cannot be applied to service systems like petroleum refneriesorrefllingsystems,transportationcompaniesandothernonmanufacturingsystems.
MRP is more useful in process-focussed systems that have long process times and complex multistage production steps. However, MRP is not a panacea to solve all types of inventory planning problems. It cannot function effectivelywhenthereisanineffectiveinventorystatus,BOMfles areinaccurateandtheMPSisunreliable.MRPcanbeeffciently appliedwhereproductionsystemsarenotwellmanagedandwhenacomprehensiveproductionand planning system is needed.
3.9 Keeping MRP Current in a Changing Environment
MRP is dynamic; it is responsive to new job orders from customers, current shop conditions and changes anticipated in the future. So, the MRP system must be updated with current information. It must provide stability for production operations in the face changing conditions. The four aspects of MRP are vital elements under dynamic environments. These are as follows:
Pegging: It is a process of tracing through the MRP records and levels in the product structure to identify how •changes in the records of the component will affect the records of other components. The pegging procedure shows exactly which item plans must changed.
Cycle counting: An accurate record is necessary for MRP, otherwise the production schedule cannot be •maintained,deliverieswillbemissedandlabourandequipmentwillbeineffciently used.Cyclecountingensures that on-hand inventories correspond to the quantities shown in the MRP records. The updated records indicate the excesses or shortage of components and hence production schedules at various work centres need adjustment.
Updating: When new jobs arrive or other shop transactions take place, the MRP system must be updated.•
Time fence: MRP has to function under dynamic environments; hence, the changes may lead to unstable and •erraticshopoperationsor“systemnervousness”.StabilitycanbegainedbyusingtimefencesintheMRPsystem.ThetimefenceisincorporatedintotheMPSandtheshortestlead-timefromrawmaterialstofnishedgoodsisdetermined.Withinthistimefence,theMPSisfxed.
Purchase and Material Management
36/JNU OLE
3.10 Manufacturing Resource Planning (MRP II)
Manufacturing Resource Planning (MRP II) evolved from early material requirements planning (MRP) systems •byincludingtheintegrationofadditionaldata,suchasemployeeandfnancialneeds.
This system is designed to centralise, integrate and process information for effective decision making in •scheduling, design engineering, inventory management and cost control in manufacturing.
MRP II is a computer-based system that can create detail production schedules using real-time data to coordinate •the arrival of component materials with machine and labour availability. MRP II is used widely by itself, but also as a module of more extensive Enterprise Resource Planning (ERP) systems.
3.11 JIT
Just in Time (JIT) production is a manufacturing philosophy which eliminates waste associated with time, labour, •and storage space. Basics of the concept are that the company produces only what is needed, when it is needed and in the quantity that is needed.
Thecompanyproducesonlywhatthecustomerrequests,toactualorders,nottoforecast.JITcanalsobedefned•as producing the necessary units, with the required quality, in the necessary quantities, at the last safe moment. It means that company can manage with their own resources and allocate them very easily.
Benefts of JIT
Reduced set up times in store: A company, in this case, can focus on other processes that might need •improvement.
Improvedfowsofgoodsin/through/outwarehouse:Employeeswillbeabletoprocessgoodsfaster.•
Employeeswhopossessmulti-skillsareutilisedmoreeffciently: Thecompanycanuseworkersinsituations•when they are needed, when there is a shortage of workers and a high demand for a particular product.
Better consistency of scheduling and consistency of employee work hours: If there is no demand for a product •at the time, workers don’t have to be working. This can save the company money by not having to pay workers for a job not completed or could have them focus on other jobs around the warehouse that would not necessarily be done on a normal day.
Supplies continue around the clock keeping workers productive and businesses focused on turnover. Employees •will work hard to meet the company goals.
To achieve the aims of JIT a disciplined approach is needed which incorporates three principles applied to the organisation:
Elimination of waste•
Total Quality Management(TQM)•
Total Employee Involvement•
3.12 KANBAN
Japanese are good at manufacturing products. Just ask any global producers of automobiles, copiers, or personal •electronics what happened in the 1980s. They will probably tell you how the Japanese captured a large share of the global-market by creating world-class standards in design, materials, and management.
What is often overlooked is the attempt to understand how the Japanese industry succeeds at the services that •supportthemanufacturingprocesswithintheproductionfeld, theKanbanprocessisthemostsignifcant ofthese services.
The concept of time-based management is nothing new for managers outside of Japan and has been in practice •for many years. However, the Kanban process involves more than just in time deliveries and inventory control. Kanban process components are the most ‘exportable’ of Japanese techniques, but the complete process itself has not yet been successfully adopted outside Japan.
37/JNU OLE
The Japanese refer to Kanban as a simple parts movement system that depends on cards and boxes/containers •to take parts from one work station to another on a production line.
Kanban stands for Kan- card, Ban- signal. The essence of the Kanban concept is that a supplier or the warehouse •should only deliver components to the production line as and when they are needed, so that there is no storage in the production area.
Within this system, workstations located along production lines only produce/deliver desired components when •they receive a card and an empty container, indicating that more parts will be needed in production.
Kanban limits the amount of inventory in the process by acting as an authorisation to produce more inventories. •SinceKanbanisachainprocessinwhichordersfow fromoneprocesstoanother,theproductionordeliveryof components is pulled to the production line, in contrast to the traditional forecast oriented method where parts are pushed to the line.
The advantages of the Kanban process are as follows:
simple and understandable process•
provides quick and precise information•
low costs associated with the transfer of information•
provides quick response to changes•
limitation over or limits over-capacity in processes•
avoids overproduction•
minimises waste•
control can be maintained•
delegates responsibility to line workers•
Purchase and Material Management
38/JNU OLE
Summary
In the recent times MRP systems have replaced conventional planning systems which were reactive inventory •systems in several organisations offering several advantages over the conventional planning systems.
Material Requirements Planning (MRP) is a material planning methodology which makes use of computer •technology.
Under the MRP system there are three major sources of information are necessary, a Master Production Schedule •(MPS),aninventorystatusfleandabillofmaterialsfle.
AMasterProductionschedule(MPS)isaplanforproduction,staffng,inventory,etc.•
A Bill of Materials or BOM is a list of the raw materials, sub-assemblies, intermediate assemblies, components, •sub-components, parts and the quantities of each needed to manufacture an end products.
TheInventorystatusfle providesaccurateandup-to-dateinformationabouttheavailabilityofeverycontrolled•item by the MRP system, which can then maintain an accurate accounting of all inventory transactions both actual and planned.
The key features of MRP are the creation of material requirements via exploding the bills of material and time-•phasing of requirements using posted average lead times.
MainobjectivesofMRPareinventoryreduction,realisticcommitments,andincreaseineffciencyandreduction•in production and delivery lead time.
ThemainadvantagesoftheMRPsystemoverconventionalinventoryplanningapproachandfxedordersystem•areimprovedcustomerservices,reducedinventorylevels,andimprovedoperatingeffciency oftheproductiondepartments.
MRPcannotbeappliedtoservicesystemslikepetroleumrefneriesorrefllingsystems,transportationcompanies•and other non manufacturing systems.
JIT is producing the necessary units, with the required quality, in the necessary quantities, at the last safe moment. •It means that company can manage with their own resources and allocate them very easily.
The Japanese refer to Kanban as a simple parts movement system that depends on cards and boxes/containers •to take parts from one work station to another on a production line. Kanban stands for Kan- card, Ban- signal.
References
Arora, K. C., 2004. • Production and Operations Management, Batch Production, Firewall Media.
Kolli, S., • Essentials of Production and Operations Managemen-Different Production Systems , Research and entertainment Association.
Birla Institute of Technology and Science, • Production, Planning & Control , [Online] Available at: <http://discovery.bits-pilani.ac.in/dlpd/courses/coursecontent/courseMaterial%5Cmmzg511%5CMOML18.pdf> [Accessed 15 November 2010].
Graves, S. C., • Manufacturing Planning and Control , [Pdf] Available at: <http://web.mit.edu/sgraves/www/ProdPlanCh.PDF> [Accessed 13 February 2013].
Prof. Jain, P. K., • Mod-1 Lec-1 Production Planning and Control , [Video online] Available at: <http://www.youtube.com/watch?v=yYIVumq6sVM> [Accessed 13 February 2013].
2008. • Production Plannning and Control , [Video online] Available at: <http://www.youtube.com/watch?v=b143Y7dTfIA> [Accessed 13 February 2013].
Recommended Reading
Adam, Everette, E. & Ebert, R. J., 2003. • Production and Operations Management - Concepts Models and Behaviour, New Delhi: Pearson Education.
Buffa, E.S., 1988. • Modern Production Management, New Delhi: Wily.
Charantimath, P., 2003. • Total Quality Management, Pearson Education, New Delhi.

39/JNU OLE
Self Assessment
MRP is an __________ control process carried out with the aid of the computer.1. inventorya.
datab.
productionc.
automatedd.
The concept of demand dependency is important between the ____________ and proactive (planning) 2. systems.
informativea.
reactiveb.
automaticc.
productived.
______ determines the number of components needed and the time when they are needed to meet the master 3. schedule.
MPRa.
ERPb.
MRPc.
PRMd.
By using MRP, _________ system can give information in time and likely delivery time to the prospective 4. customers.
developmenta.
manufacturingb.
managerialc.
productiond.
TheMRPsystemmustretainanupdatedfleofthe___________statusofeachitemintheproductstructure5. inventorya.
recordb.
indexc.
datad.
Which of the following statements is false?6. MRP is used for dependent demand solutions.a.
MRP cannot be used for dependent demand solutions.b.
The MPS is an input to the MRP system.c.
Theinventory statusflecontainsthe identifcation numbers,quantity onhand; safetystocklevel, quantityd. allocated and procurement lead time of every item.
Which of the following statements is true?7. The MRP receives primary information from the bills of materials.a.
TheMRPreceivesprimaryinformationfromtheinventoryfles.b.
The MRP receives primary information from the managers.c.
The MRP receives primary information from the workers.d.

Purchase and Material Management
40/JNU OLE
Which of the following is not an objective of MRP?8. Realistic commitmentsa.
Increaseineffciencyb.
Inventory reductionc.
Conceptualisationd.
Which of the following is the advantage of MRP?9. Reduced levels of inventorya.
Increased levels of inventoryb.
Static naturec.
Increased lead timed.
Whichofthefollowingcontainstheidentifcation numbers,quantityonhand;safetystocklevel,quantity10. allocated and procurement lead time of every item?
Inventorystatusflea.
Databasefleb.
Registerflec.
Indexfled.
41/JNU OLE
Chapter IV
Introduction to Enterprise Resource Planning (ERP)
Aim
The aim of this chapter is to:
explain the students to understand the concept of ERP system•
introduce the ERP and its applications•
explore reasons for the growth of the ERP Market•
Objectives
The objectives of this chapter are to:
explain the concept of ERP, its evolution and growth•
describe the advantages of ERP•
elucidate the difference between ERP system and ERP software•
Learning outcome
At the end of this chapter, you will able to:
understand evolution of ERP•
recognise the factors responsible for the growth of ERP market•
analyse the use of ERP •

Purchase and Material Management
42/JNU OLE
4.1 Introduction
Since last decade, information technology has made a drastic change in our life. As compared to earlier stage, when computer was used just as a typewriter, nowadays users have become more intelligent and IT literate. Now the user knows that a PC can do many more things rather then just typing a letter in a word processing software or making balance sheets in excel. They expect more things out of their PC. During this phase of industry, every one of us must have heard the word ERP i.e., Enterprise Resource Planning. In one sentence, ERP is a combination of management practice and technology, where information technology integrates with your company’s core business processes to enabletheachievementofspecifcbusinessobjectives.
4.2 History and Evolution
Enterprise Resource Planning is the evolution of Manufacturing Requirements Planning (MRP) II in 1980s, •which was mainly related to Manufacturing Industry and was designed to control manufacturing process and planningtherequiredproductionwitheffcientoutput.
Where as, MRP is the evolution of Inventory Management and Control conceived in 1960s, which was mainly •designed for management of Stocks in any particular industry.
ERP has expanded from co-ordination of manufacturing processes to the integration of enterprise-wide backend •processes like production planning and scheduling of delivery.
Intermsoftechnology,ERPhasevolvedfromlegacyimplementationtomorefexible tieredclient-server•architecture.
From business perspective, ERP has expanded from coordination of manufacturing processes to the integration of enterprise-wide backend processes. From technological aspect, ERP has evolved from legacy implementation to morefexibletieredclient-serverarchitecture.
The following table summarises the evolution of ERP from 1960s to 1990s:
System Year Description
Inventory Management and Control
1960’s Inventory Management and control is the combination of information •technology and business processes of maintaining the appropriate level of stock in a warehouse
The activities of inventory management include identifying inventory •requirements, setting targets, providing replenishment techniques and options, monitoring item usages, reconciling the inventory balances, and reporting inventory status
Materials Requirement Planning(MRP)
1970’s Materials Requirement Planning (MRP) utilises software applications •for scheduling production processes
MRP generates schedules for the operations and raw material purchases •basedontheproductionrequirementsoffnished goods,thestructureof the production system, the current inventories levels and the lot sizing procedure for each operation
Manufacturing Requirement Planning-II(MRP-II)
1980’s Manufacturing Requirements Planning or MRP utilises software •applications for coordinating manufacturing processes, from product planning, parts purchasing, inventory control to product distribution.

43/JNU OLE
Enterprise Resource Planning
1990’s Enterprise Resource Planning or ERP uses multi-module application •software for improving the performance of the internal business processes.
ERP systems often integrate business activities across functional •departments, from product planning, parts purchasing, inventory control,productdistributionandfulfllment,toordertracking.
ERP software systems may include application modules for supporting •marketing,fnance,accountingandhumanresources.
Table 4.1 Evolution of ERP from 1960s to 1990s
4.3 Meaning
ERP is one of the most widely implemented business software systems in a wide variety of industries and •organisations.
ERP is the acronym of Enterprise Resource Planning.•
It utilises ERP software applications to improve the performance of organisations resource planning, management •control and operational control.
ERP software is multi-module application software that integrates activities across functional departments, from •product planning, parts purchasing, inventory control and product distribution to order tracking.
ERPsoftwaremayincludeapplicationmodulesforthefnance, accountingandhumanresourcesaspectsofa•business.
ERP is just not only a software but also a business integrating process.•
4.4 Defnition
'ERP' refers to both ERP software and business strategies that implement ERP systems.
ERP Software
Software solution that addresses the enterprise needs taking the process view of an organisation to meet the •organisational goals tightly integrating all functions of an enterprise.
ERP System
An ERP system is more than sum of its parts or components which interacts together to achieve a common goal •streamline and improve organisations business processes.
ERP components includes; ERP Software, Business Processes, Users and Hardware.•
4.5 Concept
The term ERP originally referred to how a large organisation planned to use organisational wide resources. •
In the past, ERP systems were used in larger more industrial types of companies. However, the use of ERP has •changed and is extremely comprehensive, today the term can refer to any type of company, no matter what industry it falls in. In fact, ERP systems are used in almost any type of organisation large or small.
In order for a software system to be considered ERP, it must provide an organisation with functionality for two •or more systems. While some ERP packages exist that only cover two functions for an organisation (Payroll and Accounting) most ERP systems cover several functions.
An ERP system is based on a common database and a modular software design. The common database can •allow every department of a business to store and retrieve information in real-time. The information should be reliable, accessible, and easily shared.
The modular software design should mean a business can select the modules they need, mix and match modules •from different vendors, and add new modules of their own to improve business performance.

Purchase and Material Management
44/JNU OLE
Today’sERPsystemscancoverawiderangeoffunctionsandintegratethemintooneunifed database.For•instance, functions such as Human Resources, Supply Chain Management, Customer Relations Management, Financials, Manufacturing functions and Warehouse Management functions were all once stand alone software applications,usuallyhousedwiththeirowndatabaseandnetwork,todaytheycanallft underoneumbrellaofERP system.
4.6 Implementation of an ERP System
Implementing an ERP system is not an easy task to achieve, in fact it takes lots of planning, consulting and in• most cases 3 months to 1 year.
ERP systems are extraordinary wide in scope and for many larger organisations can be extremely complex. •ImplementinganERP systemwillultimatelyrequiresignifcantchangesonstaffandworkpractices.
While it may seem reasonable for an in house IT staff to head the project, it is widely advised that ERP •implementation consultants be used, due to the fact that consultants are usually more cost effective and are specifcallytrainedinimplementingthesetypesofsystems.
One of the most important traits that an organisation should have when implementing an ERP system is •ownership of the project. Because so many changes take place and its broad effect on almost every individual in the organisation, it is important to make sure that everyone is on board and will help make the project and using the new ERP system a success.
Usually organisations use ERP vendors or consulting companies to implement their customised ERP system. •
There are three types of professional services that are provided when implementing an ERP system, they are •Consulting, Customisation and Support.
Consulting services: Usually consulting services are responsible for the initial stages of ERP implementation, ?theyhelpanorganisationgolivewiththeirnewsystem,withproducttraining,workfow, improveERP’suseinthespecifcorganisation,etc.
Customisation services: Customisation services work by extending the use of the new ERP system or changing ?its use by creating customised interfaces and/or underlying application code. While ERP systems are made for many core routines, there are still some needs that need to be built or customised for an organisation.
Support services: Support services include both support and maintenance of ERP systems. For instance, ?trouble shooting and assistance with ERP issues.
4.7 Advantages of ERP
Advantages can be both direct and indirect.The direct advantages are:
improvement in integrating business•
communications with the use of information within the organisation is made fast and effective •
creatingadequatefunctionandfexibleeffciency•
a unifying system smoothens out the various bottlenecks of information and uses a single language for maintaining •business advantage
providing advantage for planning and analysis•
easy access to update information helps in proper planning, decision making utilising relevant analysis•
updating information and technology in the organisation•
by continuous up gradation in both information and technology the organisation remains modern and avoid •stagnancy
The indirect advantages are:
Customer goodwill and relations: Rapidly responding to customer demands is one of the great advantages •thatERPcanofferforsuccessfulbusiness.Fulflling thedemandsautomaticallycreatesgoodwillandstrongrelationships with the customer.
45/JNU OLE
Helps in creating customer satisfaction: Changes in customer demands can be rapidly incorporated with the use •of the ERP. Customer satisfaction is thus maintained.
Enhances the image of the organisation: The ability to deliver on time and with effectiveness creates a strong •trust in the minds of the customers and society. This enhances the corporate image of the organisation.
4.8 Disadvantages of ERP
Usually many obstacles can be prevented if adequate investment is made and adequate training is involved however, success does depend on skills and the experience of the workforce to quickly adapt to the new system. While advantages usually outweigh disadvantages for most organisations implementing an ERP system, here are some of the most common obstacles experienced some of the most common obstacles experienced are listed below:
customisation in many situations is limited•
the need to reengineer business processes•
ERP systems can be cost prohibitive to install and run•
technical support can be shoddy•
ERPsmaybetoorigidforspecifc organisationsthatareeitherneworwanttomoveinanewdirectioninthe•near future
4.9 Applicability of ERP
ERP and its predecessors MRP-II have been successfully implemented in companies with the following characteristics:
make-to-stock•
make-to-order•
design-to-order•
complex product •
simple product•
multiple plants•
single plant•
contract manufacturers•
manufacturing with distribution networks•
sell direct to end users•
sell through distributors•
business heavily regulated by the government•
conventional manufacturing•
process manufacturing•
repetitive manufacturing•
job shop•
fowshop•
fabrication only•
assembly only•
high-speed manufacturing•
low-speed manufacturing•
In every sector of an industry network, ERP has virtually universal application. ERP is the body of knowledge that contains the standard best practices for managing an enterprise.

Purchase and Material Management
46/JNU OLE
4.10 Reasons for the Growth of the ERP Market
There is no question that the market for enterprise resource planning (ERP) systems is much demanded. Industry analysisisforecastinggrowthratesofmorethan30%foratleastthenextfve years.Whyaresomanycompaniesreplacing their key business systems?
Here are some reasons:
enables improved business performance•cycle time reduction ?
increased business agility ?
inventory reduction ?
orderfulflmentimprovement ?
supports business growth requirements•new products/product lines, new customers ?
global requirements including multiple languages and currencies ?
providesfexible,integrated,real-timedecisionsupport•improve responsive across the organisation ?
eliminates limitation in legacy systems•century dating issues ?
fragmentation of data and processing ?
infexibilitytochange ?
insupportable technologies ?
takes advantage of the untapped mid-market (medium-size organisations)•increased functionality at a reasonable cost ?
client-server/open system technology ?
vertical market solutions ?
There are some of the reasons for the explosive growth rate of the ERP markets and ERP vendors. As more and more companies are joining the race and as the ERP vendors are shifting their focus from big fortune 1000 companies to differentmarketsegmentsthefuturewillseeferce battleformarketshareandmergersandacquisitionsforstrategicand competitive advantage. The ultimate winner in this race will be the customer, who will get better products and better service at affordable prices.
4.11 Success of the ERP
It is important to understand that choosing the right the ERP package and ensuring its correct implementation is of utmostimportance. Awrongpackagewronglyimplementedcanthreatentheorganisationaleffciency.
To ensure the effective use of ERP
A proper understanding of the business in the organisation by its people is necessary.•
ERP package should best be suited to meet the requirements of the organisation. A good vendor can make a •signifcantdifferenceinthisregard.
Implementation of the ERP program should be accurately planned and executed well .•
End user training is necessary to ensure the correct implementation and maintenance of the ERP.•
47/JNU OLE
Summary
Enterprise Resource Planning is one of the fastest growing segments in information technology. It enables •organisations to respond quickly to the ever increasing customer needs and to capitalise on market opportunities.
AccordingERPdefnitionitisacombinationofmanagementpracticeandtechnology,whereinformation•technologyintegrateswithyourcompany’scorebusinessprocessestoenabletheachievementofspecifcbusiness objectives.
The term ERP originally referred to how a large organisation plans to use its wide resources.•
ERP systems were used in larger more industrial types of companies. •
In order for a software system to be considered ERP, it must provide an organisation with functionality for two •or more systems.
The modular software design should mean a business can select the modules they need, mix and match modules •from different vendors, and add new modules of their own to improve business performance.
References
Schonberger, R. J., 1986. • World Class Manufacturing, New York: Free Press.
Sommers, M. S. & Kernan, J. B., 1965. • A Behavioural Approaching to Planning, Layout and Display.
2012. • Capacity Planning & Facility Location , [Pdf] Available at: <http://www1.pu.edu.tw/~ylai/OM/1011/ppts_f12/1011_OM_Ch09_F12.pdf> [Accessed 13 February 2013].
PRODUCTION PLANNING AND CONTROL, • CHAPTER 4: FACILITY CAPACITY, LOCATION AND LAYOUT, [Pdf] Available at: <http://www1.pu.edu.tw/~ylai/OM/1011/ppts_f12/1011_OM_Ch09_F12.pdf> [Accessed 13 February 2013].
2008. • Capacity Planning and Capacity Management Tips , [Video online] Available at: <http://www.youtube.com/watch?v=m4NJnhekJPw> [Accessed 13 February 2013].
Prof. Singh, I., 2010. • Mod-4 Lec-6 Capacity Planning – I, [Video online] Available at: <http://www.youtube.com/watch?v=FHauhdppEDA> [Accessed 13 February 2013].
Recommended Reading
Bollinger, S., 1998. • Fundamentals of Plant Layout, Society of Manufacturing Engineers in Association with Richard, Muther and Associates.
Francis, R. L. & White, J. A., 1992. • Facility Layout and Location: An Analytical Approach. Englewood Cliffs, NJ: Prentice Hall.
Ghosh, S. & Gagnon, R., 1989. • A Comprehensive Literature Review and Analysis of the Design, Balancing and Scheduling of Assembly Systems, International Journal of Production Research.

Purchase and Material Management
48/JNU OLE
Self Assessment
ERP is combination of _________ and __________.1. technology, assessmenta.
assessment, managementb.
management, technologyc.
technology, business process d.
In EPR information technology integrates with company’s ________ to achieve its ultimate goal.2. business ethics a.
business processesb.
managementc.
resourcesd.
ERP is evolution of ____________.3. manufacturing requirement planninga.
material resource planningb.
production planningc.
capacity resource planningd.
MRP is evolution of ___________.4. capacity resource planninga.
manufacturing requirement planningb.
production capacity and controlc.
inventory management and controld.
___________ utilises software applications for scheduling production processes.5. Manufacturing requirement planninga.
Materials requirement planningb.
Inventory management and controlc.
Enterprise resource planningd.
Match the following 6.
1. ERP software A. ERP software, Processes, Hardware
2. MRP-II B. Scheduling Production Processes
3. MRP C. Coordinating manufacturing processes
4. ERP system D. Multi-module application software
1-D, 2-A, 3-C, 4-Ba.
1-A, 2-B, 3-C, 4-Db.
1-B, 2-C, 3-D, 4-Ac.
1-D, 2-C, 3-B, 4-Ad.

49/JNU OLE
Which of the following services is responsible for the initial stages of ERP implementation? 7. Generationa.
Customisationb.
Consultingc.
Supportd.
Which of the following statements is true?8. ERP systems are used only for large organisations.a.
ERP systems are used only in small organisations.b.
ERP systems are used in both large as well as small organisations.c.
ERP systems are used in long term planning.d.
In ERP systems, common database can allow every department of a business to__________.9. store informationa.
retrieve informationb.
store and retrieve informationc.
store and process informationd.
On which of the following is the ERP system based?10. Database and Software designa.
Database and Processesb.
Processes and Software designc.
Databased.

Purchase and Material Management
50/JNU OLE
Chapter V
Inventory Models
Aim
The aim of this chapter is to:
introduce to the concept inventory models•
explain the model of accepting and rejecting discounts on purchases•
elucidate the advantages and disadvantages of the inventory models•
Objectives
The objectives of this chapter are to:
defneconceptofmaterialrequirementplanning(MRP)•
explicate the inputs and outputs of material requirement planning (MRP)•
enlistthefxedorderandfxedintervalsystem•
Learning outcome
At the end of this chapter, you will be able to:
understand the concept of inventory turnover•
identifythebeneftsofmaterialrequirementplanning(MRP)•
recognise the applicability of material requirement planning system•

51/JNU OLE
5.1 Introduction to Inventory Models
Material management is a day to day function. Various decisions regarding right size of the order, right price have to be taken on an on going basis. These decisions are repetitive in nature. They involve a lot of calculations. Therefore, it is advisable for the industries to develop certain models especially using information technology. These models can take care of calculation part and give enough time to the material managers to take the decision. The models willactasanaidtothemanagerstocomparevariousoffers,discountspricesetc.Inventorymodelis“amathematicalequationorformulathathelpsafrm indeterminingtheeconomicorderquantity,andthefrequencyofordering,tokeepgoodsorservicesfowingtothecustomerwithoutinterruptionordelay”.
5.2 Models for Accepting/Rejecting Discounts on Purchases
Many a times the suppliers of raw material come with an offer of discount on the catalogue price if a certain minimum quantityisordered.Themanufacturersmaybetemptedtoaccepttheorderthinkingthattheywillmakeproft byavailing the discount. Accepting or rejecting such decisions should not be impulsive decisions of the purchase department.Theyshouldbeconsciousdecisionsbasedoncalculationsandquantifcationofbenefts.
If a manufacturer orders a quantity which is more than the economic order quantity (EOQ) the following two things will happen:
Reduction in cost due to:•discount on the price of the raw material ?
reduction in ordering cost, because the number of orders goes down ?
Increase in Carrying cost:•If the reduction in cost is more than the increase in carrying cost then only a manufacturer should accept ?the discount offer. Other wise he should reject the offer.
If A > B, accept the discount offer.If A < B, reject the discount offer.
We can develop a model using excel spread sheet which will help us in taking a decision. We have to just feed the original data. Rest of the calculations and comparisons are done by the computer.
The following is the model developed in excel spread sheet. Those have working knowledge of Excel can easily understand this format and formulae used.
Row No.\Column Name A B C
1 Accept/reject a discount model
2 A) Basic information
3 1 Annual requirement units 20,000
4 2 Ordering cost per order 2,000
5 3 Carrying cost 20%
6 4 Price per unit 100
7
8 5 Discount quantity units 5,000
9 6 Discount rate 1%
10
11 B) If EOQ model followed
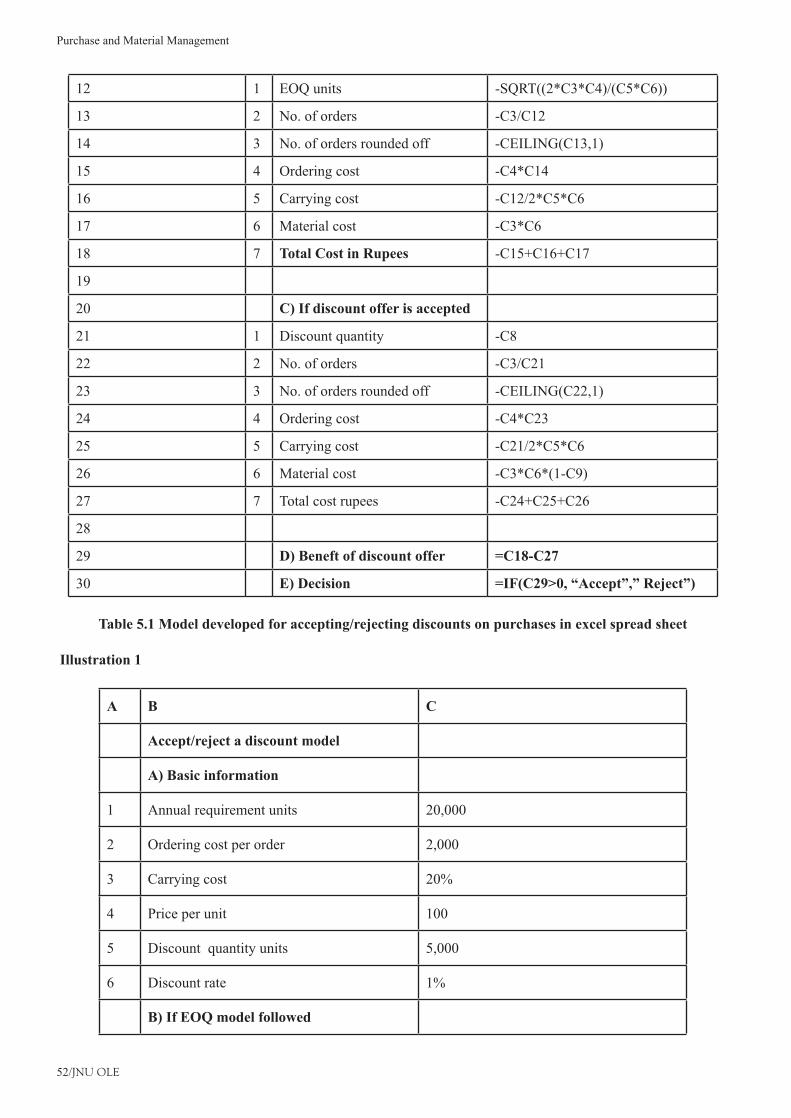
Purchase and Material Management
52/JNU OLE
12 1 EOQ units -SQRT((2*C3*C4)/(C5*C6))
13 2 No. of orders -C3/C12
14 3 No. of orders rounded off -CEILING(C13,1)
15 4 Ordering cost -C4*C14
16 5 Carrying cost -C12/2*C5*C6
17 6 Material cost -C3*C6
18 7 Total Cost in Rupees -C15+C16+C17
19
20 C) If discount offer is accepted
21 1 Discount quantity -C8
22 2 No. of orders -C3/C21
23 3 No. of orders rounded off -CEILING(C22,1)
24 4 Ordering cost -C4*C23
25 5 Carrying cost -C21/2*C5*C6
26 6 Material cost -C3*C6*(1-C9)
27 7 Total cost rupees -C24+C25+C26
28
29 D) Beneft of discount offer =C18-C27
30 E) Decision =IF(C29>0, “Accept”,” Reject”)
Table 5.1 Model developed for accepting/rejecting discounts on purchases in excel spread sheet
Illustration 1
A B C
Accept/reject a discount model
A) Basic information
1 Annual requirement units 20,000
2 Ordering cost per order 2,000
3 Carrying cost 20%
4 Price per unit 100
5 Discount quantity units 5,000
6 Discount rate 1%
B) If EOQ model followed

53/JNU OLE
1 EOQ units 2,000
2 No. of orders 10
3 No. of orders rounded off 10
4 Ordering cost 20,000
5 Carrying cost 20,000
6 Material cost 2,000,000
7 Total Cost Rupee 2,040,000
C) If discount offer is accepted
1 Discount quantity 5,000
2 No. of orders 4
3 No. of orders rounded off 4
4 Ordering cost 8,000
5 Carrying cost 50,000
6 Material cost 1,980,000
7 Total cost rupees 2,038,000
D) Beneft of discount offer 2000
E) Decision Accept
Illustration 2
A B C
Accept/reject a discount model
A) Basic information
1 Annual requirement units 10,000
2 Ordering cost per order 1,000
3 Carrying cost 10%
4 Price per unit 200
5 Discount quantity units 4,000
6 Discount rate 1%

Purchase and Material Management
54/JNU OLE
B) If EOQ model followed
1 EOQ units 1,000
2 No. of orders 10
3 No. of orders rounded off 10
4 Ordering cost 10,000
5 Carrying cost 10,000
6 Material cost 2,000,000
7 Total Cost Rupee 2,020,000
C) If discount offer is accepted
1 Discount quantity 4000
2 No. of orders 3
3 No. of orders rounded off 3
4 Ordering cost 3,000
5 Carrying cost 40,000
6 Material cost 1,980,000
7 Total cost rupees 2,023,000
D) Beneft of discount offer -3000
E) Decision Reject
Illustration 3The Purchase Department of the organisation has received an offer of quantity discounts on its orders of materials as under:
Price Per Ton Order Size in Tons
1,200 Less than 500
1,180 500 and less than 1000
1,160 1000 and less than 2000
1,140 2000 and less than 3000
1,120 3000 and above
The annual requirement for the material is 5000 tons. The delivery cost per order is Rs.1,200 and the stock holding cost is estimated at 20% of material cost per annum. You are required to advice the Purchase department the most economic purchase level.
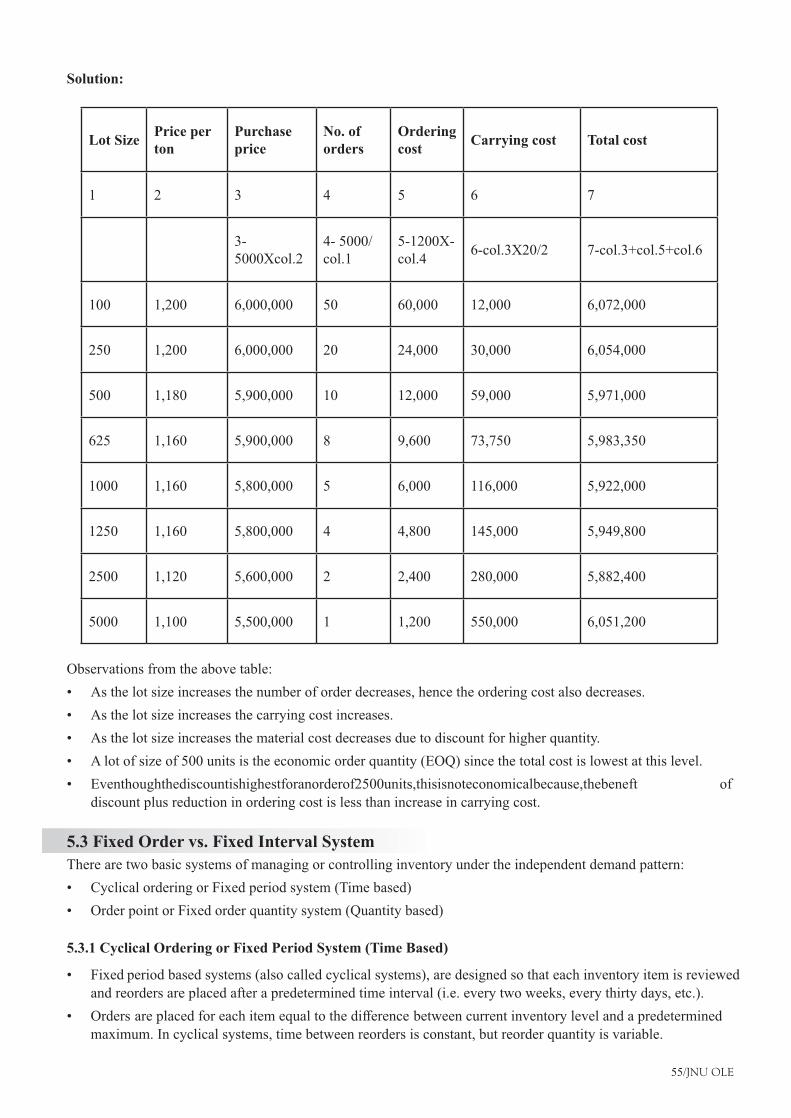
55/JNU OLE
Solution:
Lot SizePrice per ton
Purchase price
No. of orders
Ordering cost
Carrying cost Total cost
1 2 3 4 5 6 7
3- 5000Xcol.2
4- 5000/col.1
5-1200X-col.4
6-col.3X20/2 7-col.3+col.5+col.6
100 1,200 6,000,000 50 60,000 12,000 6,072,000
250 1,200 6,000,000 20 24,000 30,000 6,054,000
500 1,180 5,900,000 10 12,000 59,000 5,971,000
625 1,160 5,900,000 8 9,600 73,750 5,983,350
1000 1,160 5,800,000 5 6,000 116,000 5,922,000
1250 1,160 5,800,000 4 4,800 145,000 5,949,800
2500 1,120 5,600,000 2 2,400 280,000 5,882,400
5000 1,100 5,500,000 1 1,200 550,000 6,051,200
Observations from the above table:
As the lot size increases the number of order decreases, hence the ordering cost also decreases.•
As the lot size increases the carrying cost increases.•
As the lot size increases the material cost decreases due to discount for higher quantity.•
A lot of size of 500 units is the economic order quantity (EOQ) since the total cost is lowest at this level.•
Eventhoughthediscountishighestforanorderof2500units,thisisnoteconomicalbecause,thebeneft of•discount plus reduction in ordering cost is less than increase in carrying cost.
5.3 Fixed Order vs. Fixed Interval System
There are two basic systems of managing or controlling inventory under the independent demand pattern:
Cyclical ordering or Fixed period system (Time based) •
Order point or Fixed order quantity system (Quantity based) •
5.3.1 Cyclical Ordering or Fixed Period System (Time Based)
Fixed period based systems (also called cyclical systems), are designed so that each inventory item is reviewed •and reorders are placed after a predetermined time interval (i.e. every two weeks, every thirty days, etc.).
Orders are placed for each item equal to the difference between current inventory level and a predetermined •maximum. In cyclical systems, time between reorders is constant, but reorder quantity is variable.

Purchase and Material Management
56/JNU OLE
Predetermined maximums are set with a consideration of order lead time.•
It involves scheduled periodic reviews of the stock level of all inventory items. This is given below in detail.•
Fixedschedule(calendar)forreviewingagroupofitemsisdrawn,fxed DesiredInventoryLevel(DIL)ofeachitemorgroupofitemsiscalculated.Incasewherestocklevelofanitemisinsuffcient tosustaintheproductionoperation until the next scheduled review, order is placed to replenish the stock to DIL, maintenance of perpetual inventory records.
Procedure
First, all the inventory items are grouped in certain feasible categories or classes of items such as pipes & pipe •fttings,rawmaterials,chemicalsandreagents,oilandlubricants,etc.
Now, a calendar is drawn for all the classes so that depending upon the number of classes each class is reviewed •forreplenishmentduringcertainspecifedtimeframe.
TheDILforeachgrouporindividualitemisfxed.•
DIL = (Review Period + Lead Time + Safety Stock) x Periodical Demand•
IllustrationReview Period = 30 daysLead Time = 15 daysSafety Stock = 10 daysDaily Demand = 100 unitsDesired inventory level (DIL) = (30 +15 +10) x 100 = 5,500
If the actual quantity on hand is 1,400 on the date of reorder, the reorder quantity will be 5,500 - 1,400 = 4,100.
Depending upon the review period, a class of items is reviewed with reference to its stock position, production plan, any dues in quantity against any previous order. During review and based on the lead time, if the present stock of an item or group of items is not expected to last the next production plan then action for replenishment is taken by raising the material procurement requisition.
The order quantity = (DIL - (Present stock + dues in)
This system is suitable for the following:
for materials whose purchases can be planned months in advance •
for materials which exhibit an irregular or seasonal usage pattern •
for items with volatile prices •
for group of items purchased from and shipped together by one supplier •
Disadvantages of the system are as under:
compels periodic reviews of all items •
not effective to combat stock out situations •
actual ordering quantities may deviate from optimum quantity •
tends to peak the purchasing work load around the review dates •
there is no automatic trigger for reorder before the review time in the event of increased usage, which generally •leads to increased inventory levels as a means of stock out prevention
system does not permit effective use of economic order quantities•
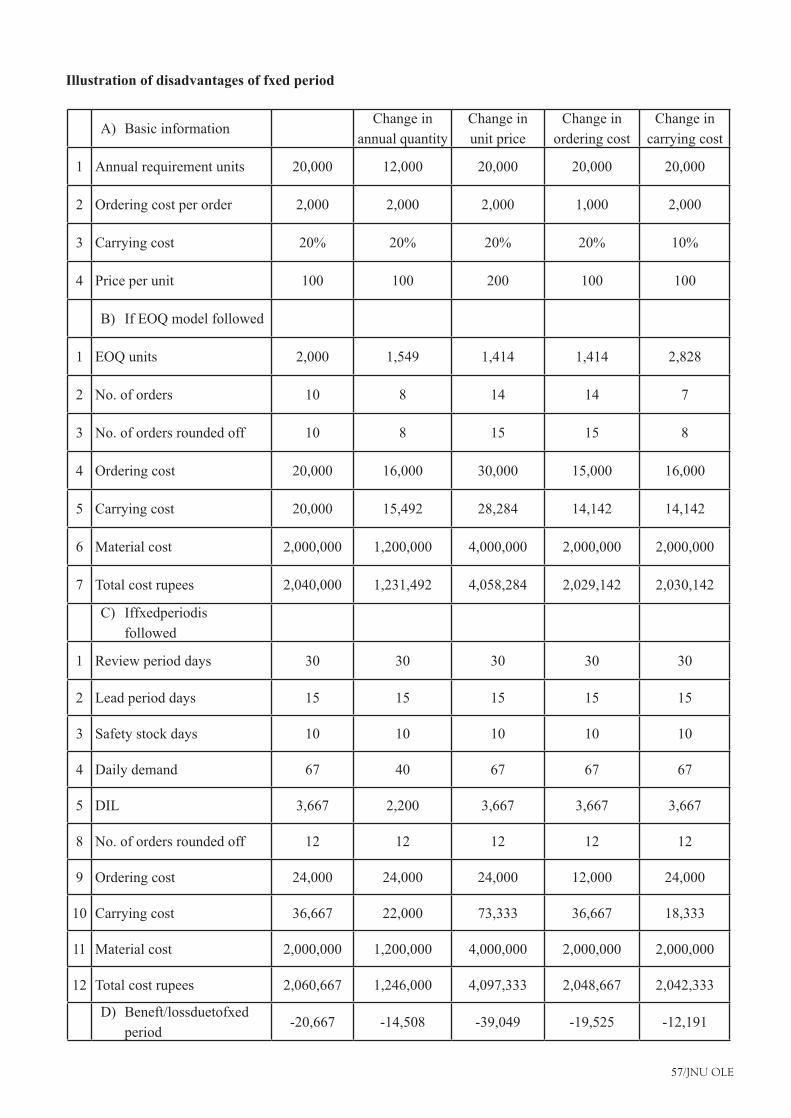
57/JNU OLE
Illustration of disadvantages of fxed period
Basic informationA) Change in
annual quantity
Change in
unit price
Change in
ordering cost
Change in
carrying cost
1 Annual requirement units 20,000 12,000 20,000 20,000 20,000
2 Ordering cost per order 2,000 2,000 2,000 1,000 2,000
3 Carrying cost 20% 20% 20% 20% 10%
4 Price per unit 100 100 200 100 100
If EOQ model followedB)
1 EOQ units 2,000 1,549 1,414 1,414 2,828
2 No. of orders 10 8 14 14 7
3 No. of orders rounded off 10 8 15 15 8
4 Ordering cost 20,000 16,000 30,000 15,000 16,000
5 Carrying cost 20,000 15,492 28,284 14,142 14,142
6 Material cost 2,000,000 1,200,000 4,000,000 2,000,000 2,000,000
7 Total cost rupees 2,040,000 1,231,492 4,058,284 2,029,142 2,030,142
Iffxedperiodis C)
followed
1 Review period days 30 30 30 30 30
2 Lead period days 15 15 15 15 15
3 Safety stock days 10 10 10 10 10
4 Daily demand 67 40 67 67 67
5 DIL 3,667 2,200 3,667 3,667 3,667
8 No. of orders rounded off 12 12 12 12 12
9 Ordering cost 24,000 24,000 24,000 12,000 24,000
10 Carrying cost 36,667 22,000 73,333 36,667 18,333
11 Material cost 2,000,000 1,200,000 4,000,000 2,000,000 2,000,000
12 Total cost rupees 2,060,667 1,246,000 4,097,333 2,048,667 2,042,333
Beneft/lossduetofxedD)
period-20,667 -14,508 -39,049 -19,525 -12,191

Purchase and Material Management
58/JNU OLE
Theaboveillustrationshowsthatifafxedperiodsystemisfollowed,therewillbelosscomparedtoEOQmodel.
Order point or fxed order quantity system (Quantity based) Orderpointsystem/fxedorderquantitysystemofinventorycontrolisbasedontheorderpointandorderquantityfactorsratherthanonthetimefactor. Theinventorypolicyisdrawnafterdefningthefollowing:
fxedorderpoint/re-orderlevel(ROL)foreachitem•
fxedmaximum,minimumlevelsforeachitem•
fxed quantitytobeorderedoftencalledMin-Maxsystems;theseinvolvebothamaximuminventoryleveland•a minimum at which reorders are generated
Basically,unitsofanitemareissueduntilthelevelofthatinventoryreachesthepredefned reorderpoint.Anorderis then triggered for a predetermined quantity (usually a calculated economic order quantity). In this system, the order quantity is constant and the time between orders is variable.
The different inventory points (Levels) of stock for an item are:
Maximum level (Max.), predetermined •
Minimum Level (Safety Stock, SS), predetermined •
Lead time (LT), predetermined•
Monthly demand = D (often based on Moving average method) •
MaxL= (Review period + LT + SS) x D•
Reorder level (ROL) = (LT + SS) x D •
Order Quantity (OQ) = Max – (Present stock + Pipeline dues) •
ProcessIn course of consumption of an inventory item in the form of issue from stores to the users, the stock level of the itemstartsdepletingthroughitsusagerateD.Aspertheabovedefnition, thestockgoesuptothemaximumlevelinthefrst replenishmentandthen,becauseofsteadyconsumption,comesgraduallydown.Inthatprocess,againit touches the Reorder Level (ROL). As soon as the stock level touches the ROL, fresh replenishment action is initiated. It is presumed that the next lot shall arrive by the time the present depleting stock touches the safety stock, keeping a stable lead time and a stable usage rate D.
Advantages of Fixed order quantity system
Each item is procured in the most economical quantity •
An item is attended to only when it needs attention i.e. when its stock has reached the ROL •
Control can be exercised on inventory with reference to maximum & minimum levels. •
Applicability of Order Point system: Item must have a reasonable stable usage •
Lead time should not have radical variation •
Supplier should be able to accept irregularly timed and unscheduled orders •
Limitations of the Fixed order quantity system:
Needs continuous monitoring of stock level of each item •
Cumbersome to operate for items with unstable usage and lead time •
Perpetual inventory records are required •

59/JNU OLE
Illustration to highlight disadvantages of the fxed order system
Basic informationA) Change in
annual quantityChange in unit price
Change in ordering cost
Change in carrying cost
1 Annual requirement units 20,000 12,000 20,000 20,000 20,000
2 Ordering cost per order 2,000 2,000 2,000 1,000 2,000
3 Carrying cost 20% 20% 20% 20% 10%
4 Price per unit 100 100 200 100 100
B) If EOQ model followed
1 EOQ units 2,000 1,549 1,414 1,414 2,828
2 No. of orders 10 8 14 14 7
3 No. of orders rounded off 10 8 15 15 8
4 Ordering cost 20,000 16,000 30,000 15,000 16,000
5 Carrying cost 20,000 15,492 28,284 14,142 14,142
6 Material cost 2,000,000 1,200,000 4,000,000 2,000,000 2,000,000
7 Total cost rupees 2,040,000 1,231,492 4,058,284 2,029,142 2,030,142
C)Iffxedorderis followed
1 Fixed order quantity 1,000 1,000 1,000 1,000 1,000
2 No. of orders 20 12 20 20 20
3 No of orders rounded off 20 12 20 20 20
4 Ordering cost 40,000 24,000 40,000 20,000 40,000
5 Carrying cost 10,000 10,000 20,000 10,000 5,000
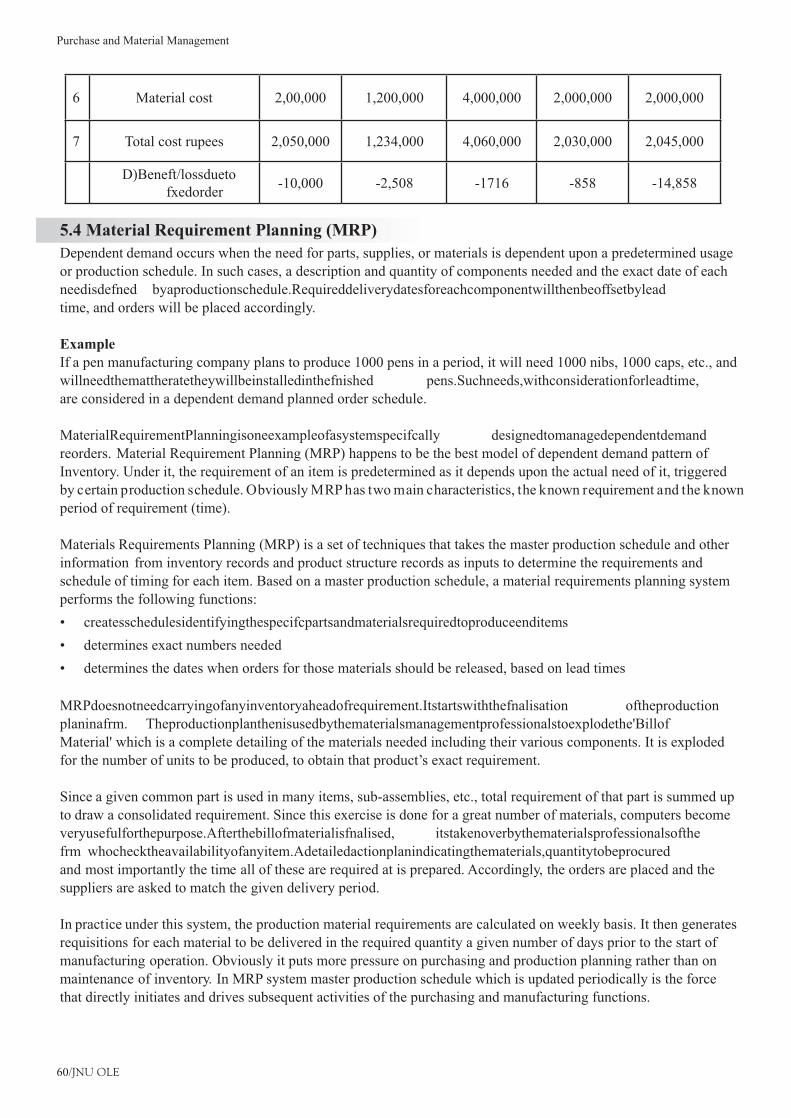
Purchase and Material Management
60/JNU OLE
6 Material cost 2,00,000 1,200,000 4,000,000 2,000,000 2,000,000
7 Total cost rupees 2,050,000 1,234,000 4,060,000 2,030,000 2,045,000
D)Beneft/lossduetofxedorder
-10,000 -2,508 -1716 -858 -14,858
5.4 Material Requirement Planning (MRP)
Dependent demand occurs when the need for parts, supplies, or materials is dependent upon a predetermined usage or production schedule. In such cases, a description and quantity of components needed and the exact date of each needisdefned byaproductionschedule.Requireddeliverydatesforeachcomponentwillthenbeoffsetbyleadtime, and orders will be placed accordingly.
ExampleIf a pen manufacturing company plans to produce 1000 pens in a period, it will need 1000 nibs, 1000 caps, etc., and willneedthemattheratetheywillbeinstalledinthefnished pens.Suchneeds,withconsiderationforleadtime,are considered in a dependent demand planned order schedule.
MaterialRequirementPlanningisoneexampleofasystemspecifcally designedtomanagedependentdemandreorders. Material Requirement Planning (MRP) happens to be the best model of dependent demand pattern of Inventory. Under it, the requirement of an item is predetermined as it depends upon the actual need of it, triggered by certain production schedule. Obviously MRP has two main characteristics, the known requirement and the known period of requirement (time).
Materials Requirements Planning (MRP) is a set of techniques that takes the master production schedule and other information from inventory records and product structure records as inputs to determine the requirements and schedule of timing for each item. Based on a master production schedule, a material requirements planning system performs the following functions:
createsschedulesidentifyingthespecifcpartsandmaterialsrequiredtoproduceenditems•
determines exact numbers needed •
determines the dates when orders for those materials should be released, based on lead times •
MRPdoesnotneedcarryingofanyinventoryaheadofrequirement.Itstartswiththefnalisation oftheproductionplaninafrm. Theproductionplanthenisusedbythematerialsmanagementprofessionalstoexplodethe'BillofMaterial' which is a complete detailing of the materials needed including their various components. It is exploded for the number of units to be produced, to obtain that product’s exact requirement.
Since a given common part is used in many items, sub-assemblies, etc., total requirement of that part is summed up to draw a consolidated requirement. Since this exercise is done for a great number of materials, computers become veryusefulforthepurpose.Afterthebillofmaterialisfnalised, itstakenoverbythematerialsprofessionalsofthefrm whochecktheavailabilityofanyitem.Adetailedactionplanindicatingthematerials,quantitytobeprocuredand most importantly the time all of these are required at is prepared. Accordingly, the orders are placed and the suppliers are asked to match the given delivery period.
In practice under this system, the production material requirements are calculated on weekly basis. It then generates requisitions for each material to be delivered in the required quantity a given number of days prior to the start of manufacturing operation. Obviously it puts more pressure on purchasing and production planning rather than on maintenance of inventory. In MRP system master production schedule which is updated periodically is the force that directly initiates and drives subsequent activities of the purchasing and manufacturing functions.

61/JNU OLE
5.4.1 Applicability of the MRP System
It is best suited where production is not done on a continuous basis.•
It is ideally suited for the job shop operations environment.•
Itisideallysuitedwherethedemandisdirectlydependentontheproductionofotherspecifc inventoryitems•orfnishedproducts.
It is used where the demand of the individual components are dependent on the requirement of the main •product.
Itcanbeusedwherethefexibility ispossibleinplacementofordersordeliveryreleasesistobedoneonshort•term basis.
5.4.2 Inputs for MRP
MRP process is triggered by the Master Production Schedule (MPS) which indicates the production volume of fnished productsonweeklybasis.MPSistheprimaryinput.Therefore,forasuccessfulrunoftheMRP,MPSmusthaveatimeschedulethatisgreaterthanthetotalleadtimeofthefnishedproduct.
Bill of Materials (BOM) which is a detailed item wise requirement document is the second input for MPR. It may containmultistagetypeofproductsthatmayrequireseveralstagesofanumberofcomponentstobeftted orconvertedintoleadingtothemakingofthefnalorfnishedproduct.
Inventory Record File (IRF) is the third input for MRP. It contains the status of an inventory item. It indicates the current stock position, the past timing and sizes of all orders, including the open orders for the item, the lead time for each item. IRF basically happens to be the past experience and serves as a good reference point for planning for the future MRP.
5.4.3 MRP Process
The MRP process involves the following steps:
Determine the gross requirements for a particular item.•
Determine the net requirements and when orders will be released for fabrication or subassembly.•
Net Requirements = Total Requirements – Available Inventory.•
Net Requirements = (Gross Requirements + Allocations) – (On Hand) + Scheduled Receipts.•
Develop a master production schedule for the end item (this is the output of the aggregate/production •planning).
MPS is adjusted accordingly .•
Createschedulesidentifyingthespecifc partsandmaterialsrequiredtoproducetheenditems.Thebillof•materials will be useful here.
Determine the exact numbers needed.•
Determine the dates when orders for those materials should be released, based on lead times.•
5.4.4 Outputs of MRP
The basic outputs of the MRP system are the planned orders from the planned order release row of the MRP matrix which details the timing and the quantity of subassemblies, parts and raw materials used to plan purchasing and manufacturingactions.Specifcally,theseoutputsinclude:
Purchase orders - sent to outside suppliers •
Workorders-tobereleasedtotheshopfoorforin-houseproduction•
Action notices or rescheduling notices - issued for items that are no longer needed as soon as planned or for •quantities that may have changed
Purchase and Material Management
62/JNU OLE
5.4.5 Benefts of MRP
TheMRPisaframeworkforprovidingusefulinformationfordecisionmakers.ThekeytorealizingthebeneftsfromanyMRPsystemistheabilityoftheinventoryplannertousetheinformationwell.Thespecifc benefts ofMRP include the following:
increased customer service and satisfaction •
improved utilisation of facilities and personnel •
better inventory planning and scheduling •
fast response to market changes and shifts •
reduced inventory levels without reduced customer service •
The MRP is also a very powerful tool since it takes into consideration changes in certain assumptions especially under uncertain conditions, especially when the inputs to the MRP system change because of the following realities in the production area:
delays in scheduled receipts •
changes in planned order sizes because of capacity constraints •
changes in gross requirements which dictate changes in lot sizes at subcomponent levels •
Unavailability of raw materials for one sub-component which negates the need for a fellow sub-component as both must be ready for the parent production. Utilisation of same parts at different levels indicating the need to restructure the bill of materials and presence of price discounts or some other features which makes it advisable to purchase more than the anticipated need. Thus MRP can be summarised as being a system which is solely dependent upon three concepts:
dependent demand •
inventory/open order netting, and•
time phasing on the basis of requirement period and the lead time for each item •
MRP system, thus, generates a complete set of planned orders for all manufactured parts and purchased materials based on information inputs. Accurate forecast and a timely lead time happen to be the main determinant of its success in a run.
5.5 Inventory Turnover
Inventory turnover indicates the ratio of materials consumed to the average inventory held. It is calculated as below: Inventory turnover = Value of material consumed/Average inventory held
where, Value of material consumed can be calculated as; Opening Stock + Purchases - Closing Stock
Average inventory held can be calculated as; (Opening Stock + Closing Stock)/2
Inventory turnover can be indicated in terms of number of days in which average inventory is consumed. It can be done by dividing 365 days (a year) by inventory turnover ratio.
Illustration 1From the following data for the year ended 31st March, 2010, calculate the inventory turnover ratio.Opening Stock 10,000 Purchases during the year 50,000 Closing Stock 12,000
Value of material consumed = Opening Stock + Purchases - Closing Stock

63/JNU OLE
= 10,000 + 50,000 – 12,000 = 48,000 Average inventory = (Opening Stock + Closing Stock)/2 = (10,000+ 12,000)/2 = 11,000Inventory turnover ratio = Value of material consumed /Average Inventory held = 48,000/11,000 = 4.36 timesInventory Turnover Period = 365/Inventory turnover ratio = 365/4.36 = 84 daysIllustration 2Opening Stock: 100 Closing Stock: 120 Sales: 1,100
Inventory turnover = Sales / Average Stock = 1,100/110 = 10 times Inventory turnover (Average Stock Holding period) = Average Stock x 365 / Sales = 110 x 365/1,100 = 37 days Inventory turnover (Average Stock Holding %) = Average Stock x 100 / Sales = 110 X 100/1,100 = 10%
5.5.1 Interpretation of Inventory Turnover
Inventory turnover of 4 times is concerned as normal. Any turnover more than 4 times is desirable. Average stock holding period of 90 days is concerned as normal. Any stock holding period less than 90 days is desirable. Average stock holding percentage of 25% is concerned as normal. Any Stock Holding percentage less than 25% is desirable.Any turnover more than 4 times also means Stock Holding period less than 90 days which in turn means Stock Holding percentage less than 25%. From the above illustration it can be seen that the Inventory Turnover can be expressed in three ways. The meaning of all the three is same. Inventory turnover of 10 times indicates a very high rateofturnover,whichinturnmeansmoreproft.'Moreturnover,moreproft'isthegeneralinterpretation.

Purchase and Material Management
64/JNU OLE
Summary
Inventorymodelsisamathematicalequationorformulathathelpsafrm indeterminingtheeconomicorder•quantity,andthefrequencyofordering,tokeepgoodsorservicesfowing tothecustomerwithoutinterruptionor delay.
If a manufacturer orders a quantity which is more than the Economic Order Quantity (EOQ) two things will •happen: reduction in cost and increase in carrying cost.
There are two basic systems of managing or controlling inventory under the independent demand pattern: •cyclicalorderingorfxed periodsystem(Timebased),andorderpointorfxed orderquantitysystem(Quantitybased).
Fixed period based systems (also called 'cyclical systems') are designed so that each inventory item is reviewed •and reorders are placed after a predetermined time interval
Orderpointsystem/fxedorderquantitysystemofinventorycontrolisbasedontheorderpointandorderquantity•factors rather than on the time factor.
Dependent demand occurs when the need for parts, supplies or materials is dependent upon a predetermined •usage or production schedule. In such cases, a description and quantity of components needed and the exact dateofeachneedisdefnedbyaproductionschedule.
Material Requirement Planning (MRP) happens to be the best model of dependent demand pattern of inventory. •Under it, the requirement of an item is predetermined as it depends upon the actual need of it, triggered by certain production schedule.
MRP has two main characteristics: the known requirement and the known period of requirement (time). •
Materials Requirements Planning (MRP) is a set of techniques that takes the master production schedule and •other information from inventory records and product structure records as inputs to determine the requirements and schedule of timing for each item
InputsofMRPare:masterproductionschedule(MPS),billofmaterials(BOM),andinventoryrecordfle•(IRF).
Outputs of MRP are purchase order, work orders, and action notices.•
Inventory turnover indicates the ratio of materials consumed to the average inventory held.•
References
Ghosh, S. & Gagnon, R., 1989. • A Comprehensive Literature Review and Analysis of the Design, Balancing and Scheduling of Assembly Systems, International Journal of Production Research.
Martinich, S. J., 2008. • Production And Operations Management: An Applied Modern Approach, John Wiley & Sons.
Facility Layout• , [Pdf] Available at: <http://www.me.utexas.edu/~jensen/ORMM/omie/design/unit/layout/layout.pdf> [Accessed 13 February 2013].
CHAPTER FIVE FACILITY LAYOUT• , [Pdf] Available at: <http://labs.fme.aegean.gr/decision/images/stories/docs/HealthCare_FacilityLayout.pdf> [Accessed 13 February 2013].
Prof. Kanda, A., 2008. • Lecture - 31 Layout planning , [Video online] Available at: <http://www.youtube.com/watch?v=IhGBUcMM-rE> [Accessed 13 February 2013].
Prof. Kanda, A., 2008. • Lecture - 30 Mathematical Models for Facility Location , [Video online] Available at: <http://www.youtube.com/watch?v=xk7hS8zCHgA> [Accessed 13 February 2013].
Recommended Reading
Bitner, M. J., 1992. • Servicescapes: The Impact of Physical Surroundings on Customers and Employees, Journal of Marketing 56.
Bollinger, S., 1998. • Fundamentals of Plant Layout, Society of Manufacturing Engineers in Association with Richard, Muther and Associates
Francis, R. L. & White, J. A. 1992. • Facility Layout and Location: An Analytical Approach. Englewood Cliffs, NJ: Prentice Hall.

65/JNU OLE
Self Assessment
Inventory turnover indicates the ratio of materials consumed to the ____________.1. average inventory helda.
opening stockb.
closing stockc.
purchasesd.
The two main characteristics of material requirement planning are the known requirement and___________.2. known period of manufacturinga.
known period of stockb.
known period of planning c.
known period of requirement d.
Which of the following statements is false?3. MRP is a framework for providing useful information for decision makers.a.
MRP does need carrying of any inventory ahead of requirement.b.
Material Requirement Planning (MRP) happens to be the best model of dependent demand pattern of c. Inventory.
Orders are placed for each item equal to the difference between current inventory level and a predetermined d. maximum.
Which of the following statements is true?4. Many a times the suppliers of raw material come with an offer of discount on the catalogue price if a certain a. minimum quantity is ordered.
In cyclical systems, time between reorders is variable, but reorder quantity is constant.b.
Predetermined minimums are set with a consideration of order lead time.c.
Unitsofanitemareissueduntilthelevelofthatinventoryislowthanthepredefnedreorderpoint.d.
Average inventory held can be calculated as:5. (Opening Stock + Closing Stock)/3a.
(Opening Stock + Current Stock)/2b.
(Optimum Stock + Closing Stock)/2c.
(Opening Stock + Closing Stock)/2d.
What does DIL stands for?6. Desired Inventory Levela.
Determined Inventory Levelb.
Desired Inventory Leadc.
Demand inventory Leveld.

Purchase and Material Management
66/JNU OLE
___________turnover can be indicated in terms of number of days in which average inventory is consumed.7. Stocka.
Inventoryb.
Goodsc.
Servicesd.
___________and a timely lead time happen to be the main determinant of its success in a run.8. Accurate forecasta.
Inventory planningb.
Fixed orderc.
Inventory controld.
Orderpointsystem/fxedorderquantitysystemofinventorycontrolisbasedonthe___________9. order point and order planninga.
order time and order quantityb.
order point and order quantityc.
order point and order turnoverd.
ThekeytorealisingthebeneftsfromanyMRP systemisthe___________10. ability of the inventory planner to use the information wella.
other information from inventory recordsb.
requirement of an item c.
demand pattern of inventoryd.
67/JNU OLE
Chapter VI
Purchase Management
Aim
The aim of this chapter is to:
explain the concept of purchase management•
elucidate the objectives of purchasing•
introduce the students to the concept of vendor management•
Objectives
The objectives of this chapter are to:
defnethefunctionsofpurchasemanagement•
explicate the concept of purchase requisition•
enlist purchase procedure•
Learning outcome
At the end of this chapter, you will be able to:
understand the types of tenders•
recognise about inspection of materials•
identify the discrepancies in material receipts•

Purchase and Material Management
68/JNU OLE
6.1 Introduction to Purchase Management
Corporate purchasing dates back to its history sometimes to the late 1890s. Purchasing was mainly seen then as a different department except some railroad organisations. Even during the early 1900s, purchasing was considered to be a clerical work. During World War I and II, purchasing function increased due to the importance of obtaining raw materials, supplies and services needed to keep the factories and mines operating.
During 1950s and 60s, purchasing continued to gain stature as the techniques for performing the function became morerefned andasthenumberoftrainedprofessionalsincreasedbutstillpurchasingagentswerebasicallyorder-placing clerical personnel serving in a staff-support position.
In the late 1960s and early 70s, purchasing personnel became more integrated with a materials system. As materials became a part of strategic planning, the importance of the purchasing department increased.
In the 1970s the oil embargo and the shortage of almost all basic raw materials brought much of business world’s focus to the purchasing arena. The advent of just-in-time purchasing techniques in the 1980s, with its emphasis on inventory control and supplier quality, quantity, timing and dependability, made purchasing a cornerstone of competitive strategy.
During early 1990s, value proposition in purchasing is increased. People realised that by letting purchaser negotiate and ask for discount bring lots of cost reduction. Cost savings become a buzz word and of course control over the buying process remains one important function of purchasing.
During late 1990s, the purchasing evolved into strategic sourcing. Enterprise wide process that continuously improves and re-evaluates the purchasing activities of a company had started. More emphasis on supplier data base begun. Contracts were sourced for long term basis to have better cost. Supplier relationship building and supplier management started.
Purchasing function in a business environment is one of the most critical functions as it provides the input for the organisation to convert into output. Materials today are lifeblood of industry. They must be available at the proper time,intheproperquantity,attheproperplaceandtheproperprice.Companycostsandcompanyprofts aregreatlyaffected by them as normally, a manufacturing organisation spends nearly 50% of its revenue in purchasing.
6.1.1 Objectives of Material Management
The key objectives of material management are given below:
to buy the materials at the lowest price•
consistent with desired quality and service•
to maintain continuity of supply of materials and services to users•
Purchasing administration plays an important role in this regard. Every organisation establishes a purchase department to carry out different functions. Purchasing is responsible for spending nearly half of a company’s income for buying the input materials. Obviously, any saving achieved by it results into direct saving for the company and all such savings areacompany’sproft.Onepercentsavingachievedinpurchasing resultsin5%proftforanyorganisation.
6.2 Functions of Purchase Department
The job of a materials manager is to provide, to the user departments, the right material at the right time in right quantity of right quality at right price from the right source. To meet these objectives, the activities undertaken include selectionofsourcesofsupply,fnalisationoftermsofpurchase,placementofpurchaseorders,followup,maintenanceof relations with vendors, approval of payments to vendors, evaluating, rating and developing vendors.

69/JNU OLE
The functions of purchase department are to:
supportcompanyoperationswithanuninterruptedfowofmaterialsandservices•
buy competitively and wisely•
help keep a minimum inventory•
develop reliable alternate sources of supply•
develop good vendor relationship and a good continuing supplier relationship•
achievemaximumintegrationwiththeotherdepartmentsofthefrm•
trainanddevelophighlycompetentpersonnelwhoaremotivatedtomakethefrm aswellastheirdepartment•succeed
develop policies and procedures which permit accomplishment of the preceding objectives at the lowest •reasonable operating cost
Before deciding the quantity to be purchased, the following factors should be taken into consideration:
Quantity already ordered•
Quantity reserved: It may happen that a particular quantity, though in hand, might have been reserved for a •particular job which is not available for other purposes. In such cases, this quantity is treated as if it is not in stock.
Funds availability: Amounts which are kept aside for drawing up purchase budget should be considered are •used.
Foranyorganisation,purchasingfunctionassumesimportanceforthereasonthatitfulfls, toagreatextent,theinputneeds of the organisation. An organisation needs input of right quality at right price from the right source in right quantity at the right time. Called 5 R’s (right things to do), these determine the broad parameters within which the purchasing functions in any organisation. Depending upon the size and nature of operation, the quantum of purchase of product and services vary. Purchase Department carries out all the tasks associated with the development of policies, procedures, controls and the mechanics for coordinating purchasing operations with those of other departments.
The following are the important activities of a purchase department:
Buyingactivity:Itaddressestoawidegamutofactivitiessuchas,reviewingrequisitions,analysingspecifcations,•investigating vendors, interviewing sales people studying costs and prices and negotiating.
Expediting: This is basically the order follow up activity involving various types of vendor relationship work. It •involvesreviewingorderstatus,providingclarifcationsontransportation,writingandemailingvendorsetc.
Special projects (Non routine): In order to facilitate smooth purchasing in a highly competitive business •environment, purchasing authorities have to keep building the capacity to do better by taking up as special projects activities such as vendor development, vendor registration, value analysis, market studies, system studies etc.
Routine:Purchasingprocessorprocedureinvolvingroutineoreverydayactivitiessuchasdealingspecifc•purchasefle,placingorders,maintainingrecordsofcommodities,vendorsetc.
6.2.1 Purchasing Function vs. Purchase Department
Purchasing functions Purchase department
This function is commonly seen in all those •organisations that undertake purchasing activities.
It is usually performed by a specialised and •centralised purchasing department.
It is a unit of an organisation that performs •purchasing function.
Itisdirectedbyaneffcientmanagertoachieve•the performance in an economical manner.
Table 6.1 Purchasing function vs. purchase department

Purchase and Material Management
70/JNU OLE
6.2.2 Procurement vs. Purchasing
Procurement is one of several supply functions involved in logistics activities. In the broadest sense procurement includes the entire process by which all classes of resources (people, materials, facilities and services) for a particular project are obtained.
Where as Purchasing is a unique function, it differs a bit from procurement in the sense that while procurement, with the same objective has a wider domain, purchasing with the same objective is included in it.
6.2.3 Objectives of Purchasing
The basic objective of purchasing is to derive the maximum value for each unit of money spent in buying. A purchaser hastofndanswerstothefollowingquestions:
Are we buying at right cost? •
Supplier is producing it at right quantity or not? •
Whether supplier is producing the right product or not? •
Whether material will come at right time or not? •
Whether buyer is buying for the company or for personnel gain? •
Formalised systems and procedures are required to run its purchasing function, to ease in operation and accountability. Formal procedures are required to be laid down for initiating purchase, selecting suppliers, placing purchase orders, follow-up, receiving materials and so on.
6.3 Purchase Requisition
Purchase Requisition is an indication given to the purchases department to purchase certain material. It is issued either by the storekeeper (in respect of material required for regular production purposes) or by production department (in respect of special materials required).
Following particulars must appear in purchase requisition:
Materialtobepurchased:Itshouldbeclearlyspecifed. Tomakeitmorespecifc, inadditiontothedescription•ofthematerialrequired,thecodenumbershouldalsobespecifed.
When it is required: Unless the material is required for regular production purposes (when the storekeeper •himself will place the purchase requisition as soon as it reaches the ordering level), purchase requisition should mention the last date by which the material is required. Ideally the material should be purchased whenever the market for the same is favourable.
How much to be purchased: Purchase requisition should state the quantity of the material required. •
6.3.1 Types of Purchase Requisitions
Different kinds of requisitions used are as follows:Standard requisitionAlso called as indent for material (or service), materials requisition plan etc., a requisition is made by an authorised personintheconcerneddepartment.However,ithastobecountersignedbyasenioroffcer whocheckstheentriesmade in. Normally a requisition, in a pre-printed format, contains particulars such as, the detailed description of materials or services to be purchased, desired quantity, schedule for receipt of such material/service, the estimated price, possible sources and the account head, requisitioner’s identity.
In any organisation, only a limited number of personnel are empowered to countersign the requisition as it amounts toauthorisationoftheexpenditure.Purchasedepartmentusuallymaintainsalistofsuchoffcers soastocheckthe validity of the purchase requisitions. Normally, there is a delegation of power of authority for authorising a requisition.Thisisexpressedintermsofthefnancial limitsuptowhichanoffcer canauthorisearequisitionforacapital or revenue item. These details must also be available with the purchase department.

71/JNU OLE
Travelling requisitionAs the name suggests, this requisition form travels from the requisitioning department to the purchaser directly who then only authorises the supplier through a purchase order to deliver the required material. This document is generally used for requisitioning items that are required frequently in bulk quantities over a long period of time. Usually, for repeat items such as, in inventory, a card containing the details of previous supply containing material specifcations,suppliersdetails,lastpurchasedprice,reorderpoint,usagedetailsarewrittenpermanentlyandprovisions for entering date, quantity required, names of requisitioned and authoriser are available. On getting it, the purchaser only has to take these details for placement of order. The travelling requisition which is a permanent document of the originating department is returned to it. It reduces the paper work and eases the operation.
Bills of materialsBill of material is a comprehensive list of materials needed to produce a product or service. It is basically the details ofmaterialsneeded,theirspecifcation, quantity,requireddeliveryschedule,etc.Itisoftenusedasasequeltofrmingof a production plan, a stage where the exact material/service needs are known.
6.4 Purchase Procedure
A purchase department is usually engaged in purchasing a number of materials and services falling in different categories.Theactivitiesareperformedregularlybypurchaseprofessionalswiththeobjectiveoffulfllingorganisation’s materials and services needs. Therefore, depending upon the nature of procurement, environmental practices etc the purchasing systems and procedures may also vary substantially. However, purchase procedure can be seen to have a bit of standardisation across the globe.
A professional purchasing system does show following steps that eventually constitute a purchasing cycle:
recognition and description of need•
transmission of need•
selection of source to satisfy the need•
contracting with the accepted source•
following up with the source•
receiving and inspecting material•
payment and closure of the case•
6.5 Types of Purchasing
The following are the different types of purchasing:
Forward buying•
Tender buying•
Systems contract•
Speculative buying•
Rate contracts•
Reciprocity in buying•
Zero stock buying•
Blanket orders•
6.5.1 Forward Buying
Forward buying, as the name suggests, is the system under which buying is done with longer term in perspective. It is not meant for meeting the present consumption requirement. It is rather a commitment on part of both the buyer and theseller,normallyforaperiodofoneyear.Dependingupontheavailabilityoftheitem,thefnancial policies,theeconomic order quantity, the quantitative discounts and the staggered delivery, the future commitment is decided.

Purchase and Material Management
72/JNU OLE
A few organisations do hedge, particularly in the commodity market by selling or buying contracts. Forward buying helpsafrm inbookingcapacityofasupplierandthusoftenresultsintoasafeguardagainstacompetitoracquiringhis capacity. It is usually done for raw materials but is not limited to it. Such an arrangement is a win-win situation for both, the buyer and the supplier
6.5.2 Tender Buying
Tender buying has always been considered the only way of buying materials/services in the government and quasi government procurements. Selecting a supply source (supplier) out of many sources available is called tender buying. Many applicants are invited to participate in the tendering process and then one or more than one tender is selected for order placement. Such tenders are also called the accepted tender's (A/Ts). The main focus through tender buying is on competition of price and quality. Usually, the best quality (T1 or Q1) is selected after assessment of the technical offers and then the lowest offered price (L1) tender is selected for order placement.
Process of tender buying
A purchase function starts with the raising of a requisition (indent/material procurement requisition) for an item •which is required for a stated purpose.
This requisition is then converted into an enquiry form which is issued to the probable vendors who are asked to •respond within a given date and time (called tender opening date) as mentioned in the enquiry issued to them.
The interested vendors respond to the tender enquiry by giving their tenders.•
Tendersthus,receivedareopenedonthetenderopeningdateatthefxedtime.•
Thetendersarethensubjectedtoevaluationwithrespecttoatenderer’scapability,fnancialaswellastechnical,•and other criteria as laid down in the tender enquiry.
Thisstepalsowitnessesseriesofdiscussions,clarifcationsandnegotiationwiththetenderers.•
Some tenders can be rejected at this stage as they might not meet the requirement of the purchaser.•
Finally, the tenders that are found suitable are subjected to price comparison and usually the tenderer offering •the lowest price (L1) is selected for placement of order.
The process explained above shows a great deal of variations depending upon a company’s procurement •policy.
In some places, the best quality offering tenders are accepted for subsequent price comparison whereas in some •other place all the tenderer’s who meet the minimum requirement are considered accepted for price comparison and order placement.
Similarly, in some places the order is placed only on L1 (lowest offered price) whereas in some other places •it may not be rigidly followed so.
Price/Quantity High Medium Low
Low Q1L1 Q2L1 Q3L1
Medium Q1L2 Q2L2 Q3L2
High Q1L3 Q2L3 Q3L3
Table 6.2 Matrix of price and quality of the tenders
Q1L1, Q1L2 and Q1L3 are short listed. After negotiations Q1L1 is selected normally. Q3L1, Q3L2 and Q3L3 are normally rejected at the initial stage.
Types of tenders Since the tenders are sent to the probable vendors, knowledge of vendors for the item in question is a necessity. It’s based on this concept that the types or mode of tendering is decided against a particular purchase requisition. Most commonly used types of tendering/tender buying are mentioned below:
73/JNU OLE
Global tender•Aglobaltenderisfoated withaviewtoelicitoffers/responsefromanyvendorsituatedanywhereinthe ?world.
The need for a global tender arises when the purchaser either does not know about the vendors for a particular ?item in question or when he thinks that a wider choice of vendor is possible through it, irrespective of his nation’s boundaries.
Open tender•An open tender too like a global tender tends to invite tender from any interested vendor. ?
The basic difference assumed between an open tender and a global tender enquiry is essentially the range of ? its applicability. While a global tender gets the worldwide publicity, an open tender is limited only within a country. Otherwise, the concept remains the same as it also seeks to elicit better or wider response.
Since the open tender enquiry is limited within the country itself, besides the internet mode, the enquiry ?is also printed in the national dailies, internal trade bulletins etc. for ensuring its wide publicity, within the country. Any vendor who meets the tender requirements can make an offer.
Limited tender•When the issue of tender enquiry is limited only to a selected few vendors, it is called limited tender enquiry ?(LTE).
LTE is issued when the capabilities of the vendors is well known to the purchaser. ?
It is considered better than global and open tender modes as there is always an element of uncertainty in ?those two modes with respect to the capabilities of the vendors.
For issuing LTE, a purchaser maintains a list of approved /registered vendors whose capabilities are checked ?periodically.
Single tender enquiry•An STE is issued only when either the item is proprietary in nature, that is only one supplier produces that ?item or where there may be more vendors but due to certain exigencies it is not possible to devote time on evaluatingthevendorsoffers/onesuppliercanfulfltheneeds.
The mode to tender depends on many factors as well a company’s procurement policy. For example, for ?a small value purchase, if the policy does not prohibit, single tender enquiry or limited tender enquiry is considered ideal.
These are also ideal for high value and frequently bought items. On the other hand, for high value and non- ?frequently bought items/systems, open/global tenders are suited.
In many government organisations, whose procurements are also called public procurements for the reason ?that they spend public money for the public cause, all the tenders are to be invited only through open/global tenders.
6.5.3 Systems Contract
Systems contract is a contract of system of buyer with that of the seller. It is a release system in which items, usually,commonlyavailableoff-the-shelf,areidentifed andpre-pricedinanticipationofcertainusage.Deliveryreleases are made against existing orders placed by purchase. This is a procedure intended to help the buyer and the seller to reduce administrative expenses and at the same time to ensure proper controls. The system authorises the designatedpersonsofthebuyertoplaceordersdirectlytothesupplierwiththespecifc materialsduringagivencontractperiod.Thecontractisthusfnalised onlyafteritisensuredthatanattempthasbeenmadetointegrateasmany buyer-seller materials management functions as possible.
In this system the original indent, duly approved by competent authorities, is shipped back with the items and avoiding the usual documents like purchase orders, materials requisitions, expediting letters and acknowledgements, goods in transit report, etc. The contract is simple, covering only delivery period, price and invoicing procedure. System contractingisparticularlyusefulforitemswithlowunitpriceandhighconsumptionprofle andthus,relievesthebuyers of the routine work.

Purchase and Material Management
74/JNU OLE
While systems contract has certain features in common with other purchasing agreements, it is this integration of buyer-seller operations that clearly distinguishes it from other types of contracts. Obviously, the systems contracts areanexcellentwayofsimultaneouslycuttingcostswhilebuildingeffcienciesthroughsimplifcations.
6.5.4 Speculative Buying
When purchasing is done purely from the point of view of taking advantage of a speculated rise in price of the commodity it is called speculative buying. The intent is not to buy for the internal consumption but to resell the commodityatalaterdatewhenthepriceshavegoneupandtomakeaproft byselling.Theitemsmaybethosethat are needed for internal consumption but the quantity shall be much more than the requirement so as to take advantage of the coming price rise.
6.5.5 Rate Contracts
Rate contracts are mutual agreements between the buyer and the seller to operate a set of chosen items, during a givenperiodoftime,forafxed priceorpricevariation.Underthissystemtheratesarefxed andattimeseventhequantity of the selected items. As and when the need arises the buyer issues a purchase order directly on the basis of the rate chart available on the supplier who in turn supplies the items.
The system of rate contract is prevalent in public sector organisations and government departments. It is common for the suppliers to advertise that they are on rate contract with the DGS&D (Directorate General of Supply & Disposal),forthespecifc periodforthegivenitems.Afternegotiation,thesellerandthebuyeragreetotheratesofitems. Application of rate contract helps organisations cut down the internal administrative lead time as individual frmsneednotgothroughthecentralpurchasingdepartmentsandcanplaceordersdirectlywiththesuppliers.
However, suppliers always demand higher prices for prompt delivery, as rate contracts normally stipulate only the rateandnotthescheduleonwhichtheitemisneeded.Thisdiffculty hasbeenavoidedbyensuringthedeliveryofaminimumquantityattheagreedrates.Thisprocedureoffxing aminimumquantityiscalledtherunningcontractand is being practiced by the railways and the DGS&D.
As mentioned above, this system of buying helps an organisation reduce its internal as well as the external lead time,reduces administrativework loadasthefles don’tneedtogoupanddown,helpsinbuildingbuyer-supplierrelationship as the contract period is usually one year and then there is always a chance of the same players doing the next contract.
The system works well normally in a situation where the selected items are routinely consumed. However, there is no compulsion that the demand be uniform over the period of time.
6.5.6 Reciprocity in Buying
In certain business situations a buyer may give preference to a supplier who also happens to be his customer. This relationship is known as reciprocity. It is something like 'I buy from you if you buy from me'.
One of the main questions for which this, otherwise simple way of buying, is always under the scanner of purchasing ethics is its undue ability to restrict competition and fair play. One of the major roles that any purchaser plays for hisfrm isincostreductionarenawhichisattemptedbygeneratingcompetitionamongthesuppliers.Thisprinciplegets a jolt through reciprocity in buying. However, when factors such as quality, after sales service, price etc, are equal normally a buyer would like to buy from his customer, if for nothing then at least for having a good working relationship. However, the distinct disadvantages of reciprocal buying outweigh the limited and narrow advantage thatafrmmayderiveoutofit.
Some of the main disadvantages of reciprocity are not being able to follow the well laid criteria of quality, price and service. A purchasing executive should not indulge in reciprocity on his initiative when the terms and conditions are notequalwithothersuppliers.Itisoftenfoundthatlesseffcient manufacturersanddistributorsgainbyreciprocitywhat they are unable to gain by price and quality. Since this tends to discourage competition and might lead to higher prices and fewer suppliers, reciprocity should be practiced on a selective basis.

75/JNU OLE
6.5.7 Zero Stock Buying
Zero stock buying refers to buying in a manner that the system ensures that the material is delivered by the seller only when it is required and that no prior inventory of the item is maintained by the buyer. As the competition becomes more intense the need for a lean manufacturing system becomes more focussed. Keeping inventory thus isblockinghugemoneythatisidleforthefrm. Thus,zerostockbuyingismoreofaninventorysafeguardratherthan the normal buying.
Normally,underthissystemthefrms trytooperateonthebasisofzerostockandthesupplierholdsthestockforthesefrms. Usually,thefrms ofthebuyerandsellerareclosetoeachothersothattherawmaterialofoneisthefnished productofanother.Alternatively,thesystemcouldworkwellifthesellerholdstheinventoryandifthetwo parties work in close coordination. However, the price per item in this system is slightly higher as the supplier may include the inventory carrying cost in the price. In this system, the buyer need not lock up the capital and so thepurchasingroutineisreduced.Thisalsosignifcantly reducesobsolescenceofinventory,leadtimeandclericalefforts in paper work. Thus, the seller can devote his marketing efforts to other customers and production scheduling becomes easy.
In practice, the buyer is called upon to pay to the supplier only when the material is delivered as per the need. For example,inIndiasaytheIndianOilLimitedmaintainsitspetrolanddieselreflling stationsinsidethemanufacturingpremisesofmanycompanies.Asandwhenpetrolordieselisrequired,sayinalorry,IOLflls thatandacouponissigned by the driver of the lorry. Buyer makes the payment to IOL against that coupon.
Zero stock is becoming popular with the concepts such as Just-in-time approach that is similar to it. However, in situations where the supplier has to transport material from one place to the other with a fair distance in between, this system needs careful handling as one never knows the road or weather conditions. Normally, the system caters tothoseitemsthatarenotverycriticaltomanufacturing.Itbestsuitsthesituationswheretheoutputofonefrm istheinputoftheotherfrmwithboththefrmslocatednearby.
6.5.8 Blanket Orders
Underthissystem,anagreementisdonebetweenthebuyerandthesuppliertoprovidearequiredquantityofspecifeditems, over a period of time, usually for one year, at an agreed price. This system minimises the administrative expenses and is useful for ‘C’ class items for which rigid controls are not required. Deliveries are made depending upon the buyer’s needs. The system relieves the buyer from routine work, giving him more time for focusing attention on high value items such as ‘A’ and part of ‘B’ class. It requires fewer purchase orders and thus reduces clerical work. It often achieves lower prices through quantity discounts by grouping the requirements. The supplier, under the system, maintains adequate inventory to meet the blanket orders, but he does not incur selling costs, once the negotiationsarefnalised.
6.6 Vendor Management
Prerequisite to a successful materials management is the availability of a sound vendor base which is now rightly acknowledged as an extended arm of the business. One of main reasons of failure of many supply chains has been the inability to hold trusted vendors together. Vendor management, therefore, requires careful planning and execution, over a fairly long period of time.
Management of vendors is attempted through the following ways:
Vendor Registration•
Vendor Development•
Vendor Rating•
Vendor Exploration•
For ensuring continuous supply of right quality materials required, at the optimum cost, it is essential to have a dependable, competent & competitive vendor base. The Limited Tender Enquiry (LTE) is issued only when reliable manufacturers/suppliers/traders/contractors are known and for this purpose, there is a need to maintain a list of registered vendors. So, vendors are empanelled for the supply of various categories/subcategories of items.

Purchase and Material Management
76/JNU OLE
Vendor registrationForthispurpose,thevendorsinterestedtosupplythespecifc category/subcategoryofitemsareaskedtosubmittheapplicationalongwithallthedocumentsrequiredtoestablishtheirfnancial &technicalcapability.Theapplicationforms so received are scrutinised and the vendor capacity assessment is carried out through inspection department/ technical experts to establish the technical capability of the vendors. These vendors are listed as ‘registered’ after following up certain processes.
Vendor development Many process industries like to search the alternative and less costly material as substitution of the currently usedcostliermaterials.Thelesstheprocurementcostthemoreistheproft. Also,theremaybesituationswherethe existing suppliers may not be willing to supply the items on various grounds thus, necessitating, looking into differentalternatives.Aneffcient materialsmanagerwoulddevoteenoughtimetodevelopsubstitutes&sourcesofsupply with a view to reduce cost of input materials and also to have reliable alternative source for foreign sources. Normally, in large manufacturing organisations, a Vendor Development Cell (VDC) remains engaged all through for the purpose. When the need to develop a vendor for an item is felt the requisition for such items is made by concerned department indicating the trial quantity and the potential vendors. Trial orders are placed on potential vendors and also necessary help is rendered to them to come up to the desired level.
Vendor ratingThe vendors also like to be given priority to be the purchaser if it constantly improves its selling performance which from a purchaser point of view is mainly its offered price, quality and punctuality in delivery. For purchaser, there shall always be a need to continuously monitor and update its registered vendor base so that the organisation continues to have the most competent & competitive vendors in its list of vendors. For this purpose the efforts are made to monitor supply performance of the vendors and rate them objectively. The major factors usually considered for such vendor rating are competitiveness of vendor (price), quality of supply and delivery adherence. Vendor rating may also be used for removing a vendor from registered vendor list and also in the selection of vendors while issuing Limited Tender Enquiry.
Vendor explorationTo have competitive & competent sources of supply, efforts are made to explore suitable vendors from various sources like, internet websites, international bulletins, vendors list of other similar manufacturing organisations etc. This is known as vendor exploration and in the competitive environment it is taken as a serious activity.
6.7 Inspection of Materials
Any organisation, big or small, shall look for quality input (materials) from suppliers to have the desired output or use. For this reason, it devises ways to control the incoming materials by having a check system on quantity, quality and readiness for use. Control on incoming materials is exercised through inspection by the purchaser. Inspection is an important aspect of integrated materials management. It is an accessory to the purchase function to ensure that the incoming materials of right quality are procured for use.
The word quality has numerous meanings. The most appropriate meaning of quality in the present context is“ConformancetoOrderedSpecifcation&FitnessforUse”,whetherforproductsorservices.Dependingupon the nature, criticality & value of items, inspection is conducted either at supplier’s premises or at plant stores after receipt.
There are several ways of carrying out inspection. A few of these are mentioned below:6.7.1 Pre Dispatch Inspection
Thisisinspectionbeforedispatchofmaterial.Usuallyspecifed inthePurchaseOrder(PO),theinspectioniscarriedout at supplier’s premises (works). Supplier gives an Inspection Request (IR) to the inspection agency mentioned inthePO.OnreceiptofIR,theinspectingoffcer visitsthesupplier’spremisesalongwithdocumentsnecessaryforinspectingsuchascopyofPO,drawing,specifcation,etc.

77/JNU OLE
The following checks are conducted depending on the nature of item:
Visual check •
Dimensional check •
Functional check •
Physical testing such as hardness, pressure test, load test etc •
Electrical and other on-bed testing such as high voltage test, insulation resistance test etc. •
The accepted materials are marked by stamping/punching/stickers/seal/ tag etc as a mark of acceptance. The supplier is asked to deliver the same to the consignee as mentioned in the PO.
6.7.2 Stage Inspection/Final Inspection
Forcriticalitems,itisrequiredtoconductstageinspectionofsemi-fnished items(suchas,castings,forgingsetc.)at suppliers premises. In such cases, the supplier gives an interim Inspection Request (IR) to the inspection agency. Duringstageinspection,sampleiscollectedbytheinspectingoffcer for chemical analysis/physical testing at either their own facility or at 3rd party locations.
Onreceiptoftestresults,conformancetospecifcation isverifed &clearanceisgiventothesupplierforfurtherprocessing of the item. After readiness of the material in all respect & internal checking, the supplier gives the fnal inspectionrequesttotheinspectionagency.Insomecriticalcases,jointinspectionbyindenter&inspectionis carried out at supplier’s premises.
6.7.3 Document Inspection
Sometimesandusuallyforeverystandard,offtheshelfitems,inspectioncanbecarriedoutthroughtheverifcation ofsuppliergivencertifcatessuchas,MaterialTestCertifcate(MTC),ManufacturingCertifcate(Mfg.TC),GuaranteeCertifcate (GC)etc.Afterensuringconformanceofmaterialstotheorderedspecifcation inallrespect,InspectionCertifcate(IC)isissuedbytheinspectingoffcertothesupplier.
6.7.4 Stores/Receipt Inspection
Majority of items are inspected through this route. Materials are received in the receiving bays of stores. Such items areusuallyacceptedbasedonvisualexamination&verifcation ofdocuments.Materialsinthereceivingbayaresegregated into several categories, based on their quality control status and destination. Procedures in receiving provide for storage and transport of material in each category.
The major categories include:
Awaiting inspection: This category consists of material that has been received and is awaiting inspection before •being moved into stock.
Acceptanceuponcertifcation: Thiscategoryconsistsofmaterialthatmaybeacceptedpendingcertifcation.•
Rework: This category contains the materials that are defective and must be reworked. •
Return: This category contains materials that are defective and will be returned to the supplier for credit or •replacement.
Materials to be tested: This category consists of materials which have been received and are awaiting delivery •to the using/testing department.
6.7.5 Third Party Inspection
Incaseofspecialiseditems,whichrequirespecialprofciency forinspection,helpofthirdpartyinspectionagenciesis taken. After material is received from the supplier, the quantity received actually, is compared with quantity ordered. Variations if any, are taken up with the supplier again.

Purchase and Material Management
78/JNU OLE
Excess material received may be dealt with using any of the following ways:
accepting all the material received•
accepting the material ordered and return the excess to the supplier•
Before accepting, material may be subjected to inspection. The extent of inspection may vary from material to material. The supplier’s invoice received for the supply of material is subjected to scrutiny before a voucher is passed for the same for making the entry in the books of accounts. For this purpose, the supplier’s invoice may be compared along with the following documents.
Purchase Order•
Goods Received Note•
Inspection Report•
If the quantity and/or rate as per purchase order and invoice match with each other, the invoice of the supplier is passed for making the entry in the books of accounts. If the quantity and/or rate as per purchase order and invoice differ from each other, the difference is adjusted by raising a debit or credit note in favour of the supplier.
Discrepancies in material receiptsThe material physically received when compared with material ordered as per the purchase order may reveal certain discrepancies which may take any of the following forms:
Quantity received in excess•
Quantity received in short•
Quantity received of different quality•
Excess quantity received may be retained and accepted, if required, with the approval of the purchase department. Alternatively, if it is not accepted, it may be returned to the supplier with Goods Returned Note (GRN). The usual form in which Goods Returned Note is prepared in the following format:
GOODS RETURNED NOTE
To: No.
Date:
Following material supplied by you vide your D.C. No.____________ and Invoice No.____________
against our Purchase Order No. ______________is being returned to you for the reasons stated below:
Description Quantity Reasons
Signature
Usually, three copies of Goods Returned Note (GRN) are prepared to be distributed as below:
one copy to the supplier•
one copy to the purchase department•
one copy to be retained by the stores department •
79/JNU OLE
Excess quantity acceptedIf excess quantity is already billed in the invoice, it will be approved and paid. If not, either the supplier may be asked to give a supplementary invoice or credit note may be issued to the supplier for amending the amount.
Excess quantity returnedIf excess quantity is already billed in the invoice, debit note may be issued to the supplier for amending the amount. In case the quantity received is short, purchase department may take up the case with the supplier or carrier or insurer as per the terms of purchases. If quantity short supplied is billed in the invoice, invoice is suitably amended and debit note is issued to the supplier. If quantity received is of different quality and is rejected in inspection, it can either be retained or returned. It may be retained by accepting some mutually decided concessional price. The variation in prices may be adjusted by issuing either the credit note or debit note in favour of the supplier.

Purchase and Material Management
80/JNU OLE
Summary
Purchasing function in a business environment is one of the most critical functions as it provides the input for •the organisation to convert into output.
Purchasing is responsible for spending nearly half of a company’s income for buying the input materials.•
The job of a materials manager is to provide, to the user departments right material at the right time in right •quantity of right quality at right price from the right source.
Factors to be kept in mind before deciding the quantity to be purchased are: quantity already ordered, quantity •reserved and funds availability.
The important activities of purchase department are: buying activity, expediting, special projects, and routine.•
Purchase Requisition is an indication given to the purchases department to purchase certain material. It is issued •either by the storekeeper or by production department.
Standard requisition is also called as indent for material; it is a requisition is made by an authorised person in •theconcerneddepartment,whichhastobecountersignedbyasenioroffcerwhocheckstheentriesmadein.
Travelling requisition form travels from the requisitioning department to the purchaser directly who then only •authorises the supplier through a purchase order to deliver the required material.
Bill of material is a comprehensive list of materials needed to produce a product or service. It is often used as •asequeltofrmingofaproductionplan,astagewheretheexactmaterial/serviceneedsareknown.
The steps in a purchasing cycle are: recognition and description of need, transmission of need, selection of •source to satisfy the need, contracting with the accepted source, following up with the source, receiving and inspecting material, and payment and closure of the case.
Different types of purchasing are: forward buying, tender buying, systems contract, speculative buying, rate •contracts, reciprocity in buying, zero stock buying and blank orders.
Aglobaltenderisfoatedwithaviewtoelicitoffers/responsefromanyvendorsituatedanywhereinthe•world.
An open tender too like a global tender tends to invite tender from any interested vendor. The basic difference •assumed between an open tender and a global tender enquiry is essentially the range of its applicability. While a global tender gets the worldwide publicity, an open tender is limited only within a country.
When the issue of tender enquiry is limited only to a selected few vendors, it is called Limited Tender Enquiry •(LTE). LTE is issued when the capabilities of the vendors is well known to the purchaser.
A Single Tender Enquiry (STE) is issued only when either the item is proprietary in nature, that is only one •supplier produces that item or where there may be more vendors but due to certain exigencies it is not possible todevotetimeonevaluatingthevendors’ offers/onesuppliercanfulfltheneeds.
Management of vendors is attempted through; vendor Registration, vendor Development, vendor rating, and •vendor Exploration.
Control on incoming materials is exercised through inspection by the purchaser. Inspection is an important •aspect of integrated materials management.
References
Francis, R. L. & White, J. A., 1992. • Facility Layout and Location: An Analytical Approach. Englewood Cliffs, NJ: Prentice Hall.
Ghosh, S. & Gagnon, R., 1989. • A Comprehensive Literature Review and Analysis of the Design, Balancing and Scheduling of Assembly Systems, International Journal of Production Research.
Production System Design: Work Structuring Revisited• , [Pdf] Available at: <http://www.leanconstruction.org/pdf/WP_11_Work_Structuring.pdf> [Accessed 13 February 2013].
Nadler, G., • WORK SYSTEMS DESIGN: THE IDEALS CONCEPT, [Pdf] Available at: <http://www.library.wisc.edu/selectedtocs/da1311.pdf> [Accessed 13 February 2013].

81/JNU OLE
Prof. Kanda, A., 2008. • Lecture - 1 Project and Production Management - An Overview, [Video online] Available at: <http://www.youtube.com/watch?v=obzp6biyAN0> [Accessed 13 February 2013].
Prof. Jain, K. P., 2009. • Mod-1 Lec-1 Production Planning and Control, [Video online] Available at: <http://www.youtube.com/watch?v=yYIVumq6sVM&playnext=1&list=PL54140420A2274299&feature=results_main> [Accessed 13 February 2013].
Recommended Reading
Norman, R., 1991. • Service Management, 2nd ed., New York: John Wiley and Sons.
Manufacturing and Operations Management• , Nirali Prakashan.
Brown, S., Blackmon, K., Cousins, P. & Maylor, H., 2012. • Operations Management: Policy, Practice and Performance Improvement, Routledge.
Purchase and Material Management
82/JNU OLE
Self Assessment
Standard requisition is also known as____________.1. Bill of materialsa.
Indent of materialb.
Open requisitionc.
Global requisitiond.
__________is basically the order follow up activity involving various types of vendor relationship work.2. Expeditinga.
Purchasingb.
Sellingc.
Inspectiond.
Which of the following statements is false?3. Purchasing is responsible for spending nearly half of a company’s income for buying the input materials.a.
Foranyorganisation,purchasingfunctionassumesimportanceforthereasonthatitfulfls, toagreatextent,b. the input needs of the organisation.
An organisation needs input of right quality, at right price, from the right source in right quantity at the c. right time.
Formalised systems and procedures are required to run its manufacturing function, to ease in operation and d. accountability.
__________ is one of several supply functions involved in logistics activities.4. Procurementa.
Inspectionb.
Tender buyingc.
Purchasingd.
The basic difference assumed between an open tender and a global tender enquiry is _________.5. order follow up activitya.
capabilities of the vendorsb.
receiving and inspecting materialc.
essentially the range of its applicabilityd.
Which of the following is issued only when either the item is proprietary in nature, that is only one supplier 6. produces that item or where there may be more vendors?
Open tendera.
Single tender enquiryb.
Global tenderc.
Limited tender enquiryd.

83/JNU OLE
Which of the following statements is true?7. A purchase department is usually engaged in purchasing a number of materials and services falling in one a. category.
Forwardbuyinghelpsafrm inbookingcapacityofasupplierandthusoftenresultsintoasafeguardagainstb. a competitor acquiring his capacity.
Tenderbuyingisselectingfvesupplysourcesorsuppliersoutofmanysourcesavailable.c.
Aglobaltenderisfoated withaviewtoelicitoffers/responsefromanyvendorsituatedanywherewithind. the country.
In certain business situations a buyer may give preference to a supplier who also happens to be his customer, 8. this relationship is known as ________.
reciprocitya.
indentationb.
expeditingc.
procurementd.
_____________is a comprehensive list of materials needed to produce a product or service.9. Purchase requisitiona.
Inventory listb.
Bill of materialc.
Open tenderd.
Materials in the receiving bay are segregated into several categories, based on their quality control status 10. and________.
destinationa.
industry typeb.
costc.
usaged.
Purchase and Material Management
84/JNU OLE
Chapter VII
Stores Management
Aim
The aim of this chapter is to:
introduce the students to the concept of store management•
explain the functions of stores department •
elucidate the company motives to hold the inventory•
Objectives
The objectives of this chapter are to:
defnethefourtypesofmovementsofmaterialfromthestoresdepartment•
explicate the concept of bin card and stores ledger•
enlist proper storage function•
Learning outcome
At the end of this chapter, you will be able to:
understand the methods for valuation of issues•
identify about valuation of material in three ways•
recognise the comparison of value of stock under different methods•

85/JNU OLE
7.1 Introduction to Stores Management
Management of inventory assumes importance due to the fact that investment in inventory constitutes one of the major investments in current assets. The various forms in which a manufacturing concern may carry inventory are:
Rawmaterial:Theserepresentinputspurchasedandstoredtobeconvertedintofnished productsinfutureby•making certain manufacturing process on the same.
Work in progress: These represent semi-manufactured products which need further processing before they can •betreatedasfnishedproducts.
Finishedgoods: Theserepresentthefnishedproductsreadyforsaleinthemarket.•
Storesandsupplies:Theserepresentthatpartoftheinventorywhichdoesnotbecomeapartoffnal product•but are required for production process. They may be in the form of cotton waste, oil and lubricants, soaps, brooms,lightbulbs,etc.Normally,theyformaveryminorpartoftotalinventoryanddonotinvolvesignifcantinvestment.
7.1.1 Motive to Hold Inventory
A company may hold the inventory with the following motives:
Transaction motive: A company may be required to hold the inventories in order to facilitate the smooth and •uninterrupted production and sales operations. It may not be possible for the company to procure raw material whenever necessary. There may be a time lag between the demand for the material and its supply. Hence it is needed to hold the raw material inventory. Similarly, it may not be possible to produce the goods immediately aftertheyaredemandedbythecustomers.Henceitisneededtoholdthefnished goodsinventory.Theneedtohold work in progress may arise due to production cycle.
Precautionary motive: In addition to the requirement to hold the inventories for routine transactions, the company •may like to hold them to guard against the risk of unpredictable changes in demand and supply forces. For example- the supply of raw material may get delayed due to the factors like, strike, transport, disruption, short supply, lengthy processes involved in import of the raw materials etc. Hence the company should maintain suffcient levelofinventoriestotakecareofsuchsituations.Similarly,thedemandforfnished goodsmaysuddenly increase (especially in case of seasonal types of products) and if the company is unable to supply them, itmaymeangainofthecompetitions.Hence,thecompanywillliketomaintainsuffcient stockoffnishedgoods.
Speculative motive: A company may like to purchase and stock the inventory in the quantity which is more •than needed for production and sales purpose. This may be with the intention to get the advantages in terms of quantity discounts connected with bulk purchasing or anticipated price rise.
After the material is received, inspected and approved, the process of storing comes into operation which deals with storing the material in good condition till it is required for use by production departments and issuing the same whenever required. Stores department plays an important role in this respect.
7.2 Functions of Stores Department
The following are the types of movement of the material from the stores department:
Receipt of material•
Issue of material •
Return of material from Production Department to Stores Department. •
Transfer of material•
7.2.1 Receipt of Material
Usually the receipt of material is accompanied by delivery challan given by the supplier. On receipt of the material, quantity received is checked with the quantity ordered by the stores department. The received material may be inspected, before acceptance either by separate inspection department or by stores department itself. A document known as Goods Received Note or Goods Received Report (GRN or GRR) is prepared to record the details of the

Purchase and Material Management
86/JNU OLE
material received. The usual form in which GRN or GRR is prepared is as below:
GOODS RECEIVED NOTE No. Date:
Sr. No. Description Code Qty. Recd. Qty. Accepted Qty. Rejected Remarks
Prepared by Received by Inspected by Store Keeper
It may be prepared in quadruplicate to be distributed as follows:
one copy to purchases department for comparing with purchases order and approving the invoice of the •supplier
one copy to accounts department for making the payment of supplier’s invoice•
one copy to costing department for pricing and entering in stores record•
one copy to be retained by stores department•
GRN/GRR should be serially numbered in order to locate the material which is physically received but for which invoice is not received.
7.2.2 Issue of Material
Here, the issue of material refers to issue of material from stores department to production department. The material should not be issued from the stores unless a proper authority in writing is produced before the stores department. Usually, this authority is in the form of material requisition note or material requisition slip.
The normal contents of this note/slip are as follows:
number and date (ideally, they should be serially numbered)•
department demanding the material•
description and code of material demanded•
quantity of material demanded•
signature of authority approving the demand•
signature of the person receiving the material•

87/JNU OLE
Normally one note/slip is prepared for requisitioning a single item of material. The usual form in which it is prepared is as below:
MATERIAL REQUISITION NOTE Production/Job Order No. No.
Bill of Materials No.
Date :
Department :
Description
Code
Qty.
Unit Cost (for costing Dept. only)
Rate per unit Amount Rs.
Authorised by Issued by Received by Entered by Valued by
Normally, it is prepared in three copies. Two copies to stores department which in turn passes one copy to costing department for pricing while second copy is retained by the stores department. One copy is for demanding department.
7.2.3 Return of Material
There can be some situations, when material once issued to production department is returned back to the stores. It can happen in the following circumstances:
material issued in excess than the requirement•
scrap or defective work arising out of the production processes•
Under these circumstances, a document in the form of materials returned note is prepared, which is to record return of unused materials. The usual form in which this document is prepared is as below:

Purchase and Material Management
88/JNU OLE
MATERIALS RETURNED NOTE
Production/Job Order No. No.
Bill of Materials No. Date :
Department :
Description Code Qty. Unit Cost (for costing Dept. only)
Rate per unit Amount Rs.
Authorised by Received by Posted by
As far as the valuation of the returned material is concerned, it may be treated as the fresh receipt of the material or alternatively, it may be treated as the negative (minus) issues.
7.2.4 Transfer of Materials
In some situations, considering the urgency for the requirement of the material, it may be necessary to transfer the material from one production/job order to another. Such transfer of material is usually accompanied by preparing a document in the form of material transfer note. The usual form in which this document is prepared is as below:
MATERIAL TRANSFER NOTE No. Date :
From…………Dept. To…………..Dept.
Production/Job Production/Job
Order No. Order No.
Description Code No. Qty. Cost (for costing Dept. only)
Rate per unit Amount Rs.
Authorised by Received by Posted by
Transfer of materials does not result into any fresh issue of material. However, material transfer notes will have to be valued and considered in order to compute the material cost as per the job orders and production orders.
7.2.5 Proper Storage Function
The proper conduct of storage function requires that material should be properly stored in a good condition till it is required for use by production departments and should be issued whenever required. This proper conduct is ensured by what is known as 'Perpetual Inventory System'. The aims of the perpetual inventory system are two fold:
Recording receipts and issues in such a way so as to know at any time, the stock in hand, in quantity and/or •value, without the need of physical counting. This aim is achieved by maintaining what is called as bin card and stores ledger.
Continuousverifcationofphysicalstockatregularintervals.•
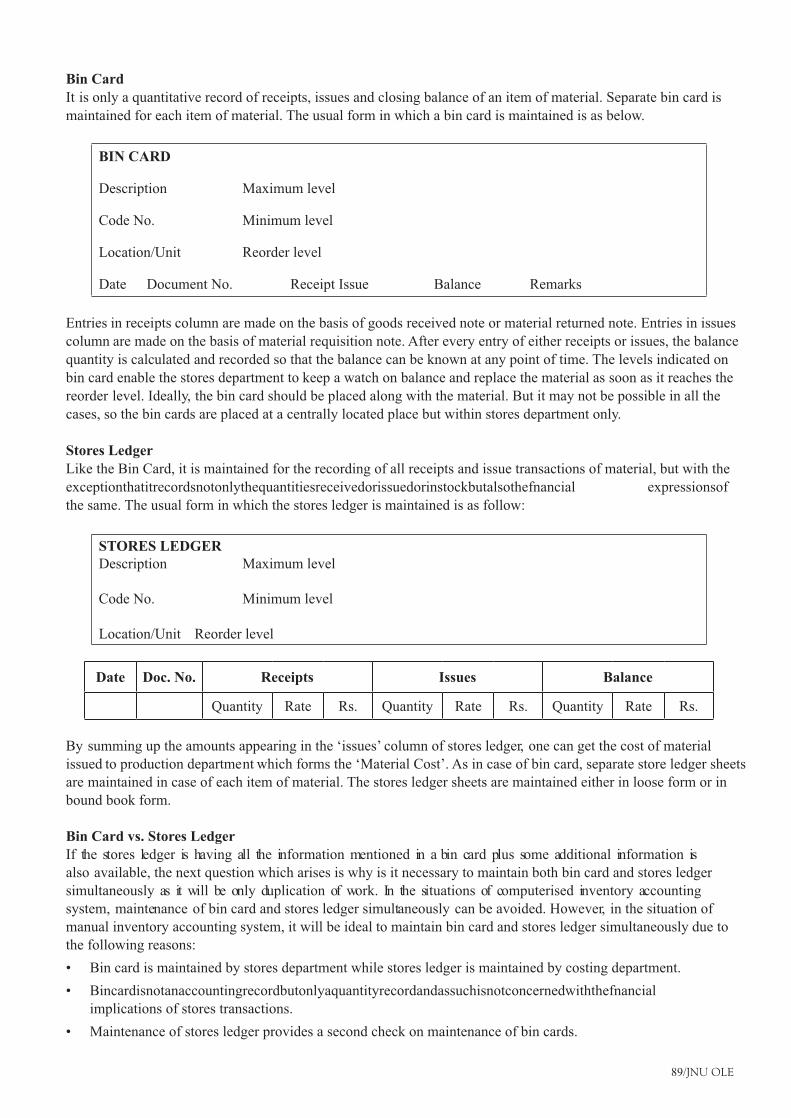
89/JNU OLE
Bin Card It is only a quantitative record of receipts, issues and closing balance of an item of material. Separate bin card is maintained for each item of material. The usual form in which a bin card is maintained is as below.
BIN CARD
Description Maximum level
Code No. Minimum level
Location/Unit Reorder level
Date Document No. Receipt Issue Balance Remarks
Entries in receipts column are made on the basis of goods received note or material returned note. Entries in issues column are made on the basis of material requisition note. After every entry of either receipts or issues, the balance quantity is calculated and recorded so that the balance can be known at any point of time. The levels indicated on bin card enable the stores department to keep a watch on balance and replace the material as soon as it reaches the reorder level. Ideally, the bin card should be placed along with the material. But it may not be possible in all the cases, so the bin cards are placed at a centrally located place but within stores department only.
Stores Ledger Like the Bin Card, it is maintained for the recording of all receipts and issue transactions of material, but with the exceptionthatitrecordsnotonlythequantitiesreceivedorissuedorinstockbutalsothefnancial expressionsofthe same. The usual form in which the stores ledger is maintained is as follow:
STORES LEDGER Description Maximum level
Code No. Minimum level
Location/Unit Reorder level
Date Doc. No. Receipts Issues Balance
Quantity Rate Rs. Quantity Rate Rs. Quantity Rate Rs.
By summing up the amounts appearing in the ‘issues’ column of stores ledger, one can get the cost of material issued to production department which forms the ‘Material Cost’. As in case of bin card, separate store ledger sheets are maintained in case of each item of material. The stores ledger sheets are maintained either in loose form or in bound book form.
Bin Card vs. Stores LedgerIf the stores ledger is having all the information mentioned in a bin card plus some additional information is also available, the next question which arises is why is it necessary to maintain both bin card and stores ledger simultaneously as it will be only duplication of work. In the situations of computerised inventory accounting system, maintenance of bin card and stores ledger simultaneously can be avoided. However, in the situation of manual inventory accounting system, it will be ideal to maintain bin card and stores ledger simultaneously due to the following reasons:
Bin card is maintained by stores department while stores ledger is maintained by costing department. •
Bincardisnotanaccountingrecordbutonlyaquantityrecordandassuchisnotconcernedwiththefnancial•implications of stores transactions.
Maintenance of stores ledger provides a second check on maintenance of bin cards. •

Purchase and Material Management
90/JNU OLE
Reconciliation of Bin Card and Stores LedgerAs the source documents for the entries in Bin Card and Stores Ledger are the same, the closing balances disclosed by both of them should match with each other. But in practice, they may not match due to the following reasons.
arithmetical error in calculating balance•
non-posting of a certain document in either of these documents •
posting on wrong bin card or stores ledger sheet•
treating receipts transaction as issue transaction or vice versa•
If the closing balance as per bin card and stores ledger is not matching, the very purpose of maintaining these two documents simultaneously will be defeated. As such, it is necessary to reconcile both balances at regular intervals by keeping all the entries up to date. If the balances as on a particular day are not matching, all the previous transactions should be checked to locate differences.
7.3 Valuation of Material
Thestoresledgerconsidersnotonlythemovementofmaterialintermsofquantitybutalsointermsofitsfnancialimplications. As such, it is necessary that all the possible movements of material are valued properly and are expressed in terms of money. We will consider this problem under the following heads:
Valuation of receipts•
Valuation of issues•
Valuation of returns from production department to stores department •
7.4 Valuation of Receipts
Valuation of receipts is a relatively easy task, as the invoice or bill received from the supplier of the material is available as a starting point. Following propositions should be considered for this purpose:
The price as billed by the supplier will be the valuation of the receipts. The trade discount is deducted from •the basic price and all other amounts as billed by the supplier are added, like excise duty, sales tax, octroi duty, transport/insurance charges, etc. There are different opinions in respect of the treatment of cash discount. One opinionsaysthatcashdiscountshouldbeignored,beingpurelyofafnancial nature,whilevaluingthereceipts,while another opinion says that it should be considered while valuing the receipt of the material.
In some cases, more than one item of material is included in one single bill and some costs are jointly incurred •for all the items of material. Such joint costs may be distributed on the basis of the basic price of the material.
In case of the imported material, the cost of the material consists of a basic price (which may be stated in foreign •currency and should be converted in Indian Rupees), customs duty, clearing charges, transport charges, octroi duty, etc. In some cases, the point of receipt of imported material and the point of making the payment of invoice amount may be different. As such, the rate of foreign currency may be different at the time of payment of the customs duty and at the time of payment of the invoice amount. In such cases, the rate of exchange existing at the time of making the payment of invoice amount should be considered for valuing basic cost of material imported.
Illustration 1The particulars relating to 1,200 kilograms of a certain raw material purchased by a company during April, 2010 are as below:
Lot prices quoted by suppliers and accepted by the company for placing the purchase order. a.
Lot up to 1000 kgs. @ Rs. 22 per kg. For
Between 1000 - 1500 kgs. @ Rs. 20 per kg. Supplies
Between 1500 - 2000 kgs @ Rs. 18 per kg. to Factory
Trade Discount 20%.
Additional charge for containers @ Rs. 10 per drum of 25 kg.

91/JNU OLE
Credit allowed on return of containers @ Rs. 8 per drum.
Sales Tax at 10% on raw material and 5% on drums.
Total freight paid by the purchaser Rs. 240.
Insurance at 2.5% (on net invoice value) paid by the purchaser.
Stores Overheads applied at 5% on total purchase cost of material.
The entire quantity was received and issued to production:
The containers are returned in due course. Draw up a suitable statement to show:
total cost of material purchased•
unit cost of material issued to production•
SolutionStatement showing cost of purchasesb.
Basic Cost (Rs.) Rs.1,200 kg x Rs. 20/kg = 24,000
Less: Trade discount @ 20% 4,800
Total cost 24,000 – 4,800 = 19,200
Container Cost
48 Drums x Rs. 10/Drum 480
Total cost 19,200 + 480 = 19,680
Sales Tax
10% on Rs. 19,200 192
5% on Rs. 480 24
Total Tax 216
Total cost 19,680 + 216 = 19,896
Other charges
Insurance 2.5% on Rs. 21,264.00 531.60
Freight 240.00
20.667
Less: Credit for drums returned
Rs. 8 per Drum x 48 Drums 384.00
TOTAL COST 22,020.60
Add: Stores Overheads 5% 1,101.03
23,121. 63Unit cost for valuation of issues: Rs. 23,121/1,200 kg = Rs. 19.268/kgc.
7.5 Valuation of Issues
This is a more complex process than the valuation of the receipts. It is because of this reason that the material may be issued out of the various lots which might have been purchased at various prices. As such, a problem may arise as to which of the receipt prices should be used to value the material requisition notes.

Purchase and Material Management
92/JNU OLE
Various methods used for this purpose are as below:
First In First Out (FIFO)•
Last In First Out (LIFO)•
Highest In First Out (HIFO)•
Simple Average Rate (SAR)•
Weighted Average Rate (WAR)•
Market rate•
7.5.1 First In First Out (FIFO) Method
Underthismethod,thepriceoftheearliestavailablelotisconsideredfrst andifthatlotisexhausted,thepriceofthe next available lot is considered. It should be remembered that the physical issue of the material may not be made out of the said lots, though it is presumed that it is made out of these lots.
IllustrationFollowing transactions have taken place in respect of a material during March 2010. Date: 1 Opening Balance 400 units @ Rs. 10 per unit3 Purchased 100 units @ Rs. 9.5 per unit7 Issued 300 units10 Purchased 600 units @ Rs. 9.75 per unit15 Issued 200 units22 Issued 50 units28 Purchased 300 units @ Rs. 10.25 per unit30 Issued 350 units
Prepare the Stores Ledger assuming that the issues are valued on FIFO basis.
SolutionValuation of stock by FIFO method
Date Receipts Issues Balance Total
Quantity Rate Rs. Quantity Rate Rs. Quantity Rate Rs. Value
1 400 10.00 4,000 4,000
3 100 9.50 950 400 10.00 4,000
100 9.50 950 4,950
7 300 10 3,000 100 10.00 1,000
100 9.50 950 1,950
10 500 9.75 4,875 100 10.00 1,000
100 9.50 950
500 9.75 4875 6,825
15 200 10 2,000 500 9.75 4875 4,875
22 50 10 488 450 9.75 4,388 4,388
28 300 10.25 3,075 450 9.75 4,388
300 10.25 3,075 7,463
30 350 10 3,413 100 9.75 975
300 10.25 3,075 4,050
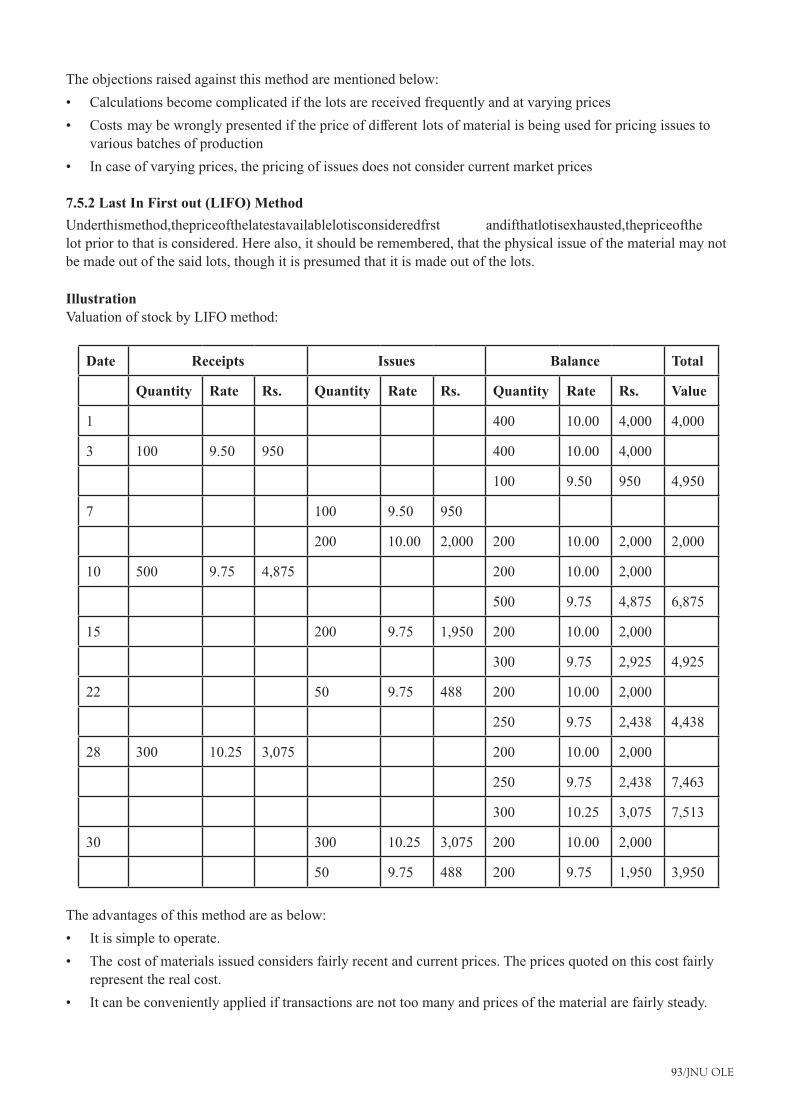
93/JNU OLE
The objections raised against this method are mentioned below:
Calculations become complicated if the lots are received frequently and at varying prices•
Costs may be wrongly presented if the price of different lots of material is being used for pricing issues to •various batches of production
In case of varying prices, the pricing of issues does not consider current market prices•
7.5.2 Last In First out (LIFO) Method
Underthismethod,thepriceofthelatestavailablelotisconsideredfrst andifthatlotisexhausted,thepriceofthelot prior to that is considered. Here also, it should be remembered, that the physical issue of the material may not be made out of the said lots, though it is presumed that it is made out of the lots.
IllustrationValuation of stock by LIFO method:
Date Receipts Issues Balance Total
Quantity Rate Rs. Quantity Rate Rs. Quantity Rate Rs. Value
1 400 10.00 4,000 4,000
3 100 9.50 950 400 10.00 4,000
100 9.50 950 4,950
7 100 9.50 950
200 10.00 2,000 200 10.00 2,000 2,000
10 500 9.75 4,875 200 10.00 2,000
500 9.75 4,875 6,875
15 200 9.75 1,950 200 10.00 2,000
300 9.75 2,925 4,925
22 50 9.75 488 200 10.00 2,000
250 9.75 2,438 4,438
28 300 10.25 3,075 200 10.00 2,000
250 9.75 2,438 7,463
300 10.25 3,075 7,513
30 300 10.25 3,075 200 10.00 2,000
50 9.75 488 200 9.75 1,950 3,950
The advantages of this method are as below:
It is simple to operate.•
The cost of materials issued considers fairly recent and current prices. The prices quoted on this cost fairly •represent the real cost.
It can be conveniently applied if transactions are not too many and prices of the material are fairly steady.•

Purchase and Material Management
94/JNU OLE
The objections raised against this method are as below:
Calculations become complicated if the lots are received frequently and at varying prices.•
Costs may be wrongly presented if the price of different lots of material is used for pricing issues to various •batches of production.
In case of falling prices in the market, this method may give wrong results.•
7.5.3 Highest In First Out (HIFO) Method
This method assumes that the stock should always be shown at the minimum value and hence the issues should always be valued at the highest value of receipts. For example, assume a situation as follows:Mar. 1 Purchased 100 units @ Rs. 12Mar. 5 Purchased 125 units @ Rs. 18Mar. 10 Purchased 75 units @ Rs. 15
On March 20, 120 units are issued to production and they will be valued at Rs. 18 per unit being the highest price. This method is not very popular. It always overvalues the issues and undervalues the closing stock. This method may be useful in case of the organisations dealing with monopoly products which is a rare possibility.
IllustrationValuation of stock by HIFO method:
Date Receipts Issues Balance Total
Quantity Rate Rs. Quantity Rate Rs. Quantity Rate Rs. Value
1 400 10.00 4,000 4,000
3 100 9.50 950 400 10.00 4,000
100 9.50 950 4,950
7 300 10.00 3,000 100 10.00 1,000
100 9.50 950 1,950
10 500 9.75 4,875 100 10.00 1,000
500 9.75 4875 6,825
15 100 10.00 1,000 100 9.50 950
100 9.75 975 400 9.75 3900 4,850
22 50 9.75 488 100 9.50 950
350 9.75 3,413 4,363
28 300 10.25 3,075 100 9.50 950
350 9.75 3,413
300 10.25 3,075 7,438
30 300 10.25 3,075 100 9.50 950
50 9.75 488 300 9.75 2,925 3,875
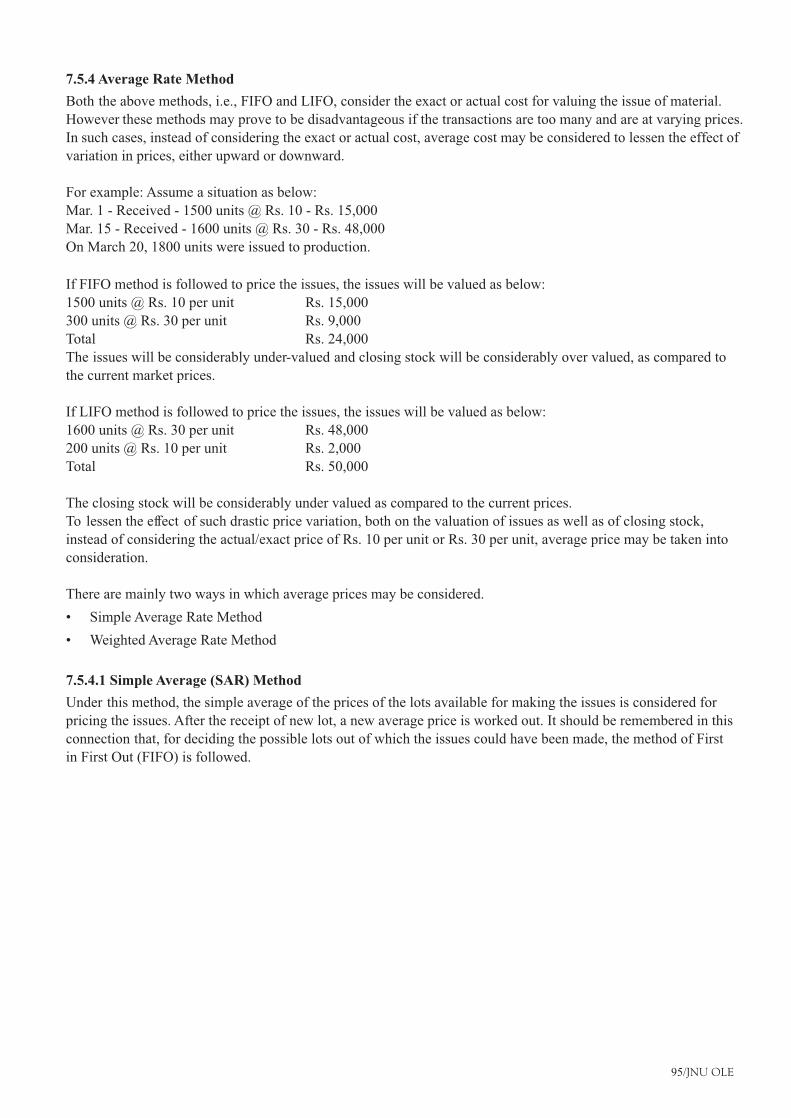
95/JNU OLE
7.5.4 Average Rate Method
Both the above methods, i.e., FIFO and LIFO, consider the exact or actual cost for valuing the issue of material. However these methods may prove to be disadvantageous if the transactions are too many and are at varying prices. In such cases, instead of considering the exact or actual cost, average cost may be considered to lessen the effect of variation in prices, either upward or downward.
For example: Assume a situation as below: Mar. 1 - Received - 1500 units @ Rs. 10 - Rs. 15,000 Mar. 15 - Received - 1600 units @ Rs. 30 - Rs. 48,000 On March 20, 1800 units were issued to production.
If FIFO method is followed to price the issues, the issues will be valued as below:1500 units @ Rs. 10 per unit Rs. 15,000300 units @ Rs. 30 per unit Rs. 9,000Total Rs. 24,000The issues will be considerably under-valued and closing stock will be considerably over valued, as compared to the current market prices.
If LIFO method is followed to price the issues, the issues will be valued as below:1600 units @ Rs. 30 per unit Rs. 48,000200 units @ Rs. 10 per unit Rs. 2,000Total Rs. 50,000
The closing stock will be considerably under valued as compared to the current prices. To lessen the effect of such drastic price variation, both on the valuation of issues as well as of closing stock, instead of considering the actual/exact price of Rs. 10 per unit or Rs. 30 per unit, average price may be taken into consideration.
There are mainly two ways in which average prices may be considered.
Simple Average Rate Method •
Weighted Average Rate Method •
7.5.4.1 Simple Average (SAR) Method
Under this method, the simple average of the prices of the lots available for making the issues is considered for pricing the issues. After the receipt of new lot, a new average price is worked out. It should be remembered in this connection that, for deciding the possible lots out of which the issues could have been made, the method of First in First Out (FIFO) is followed.
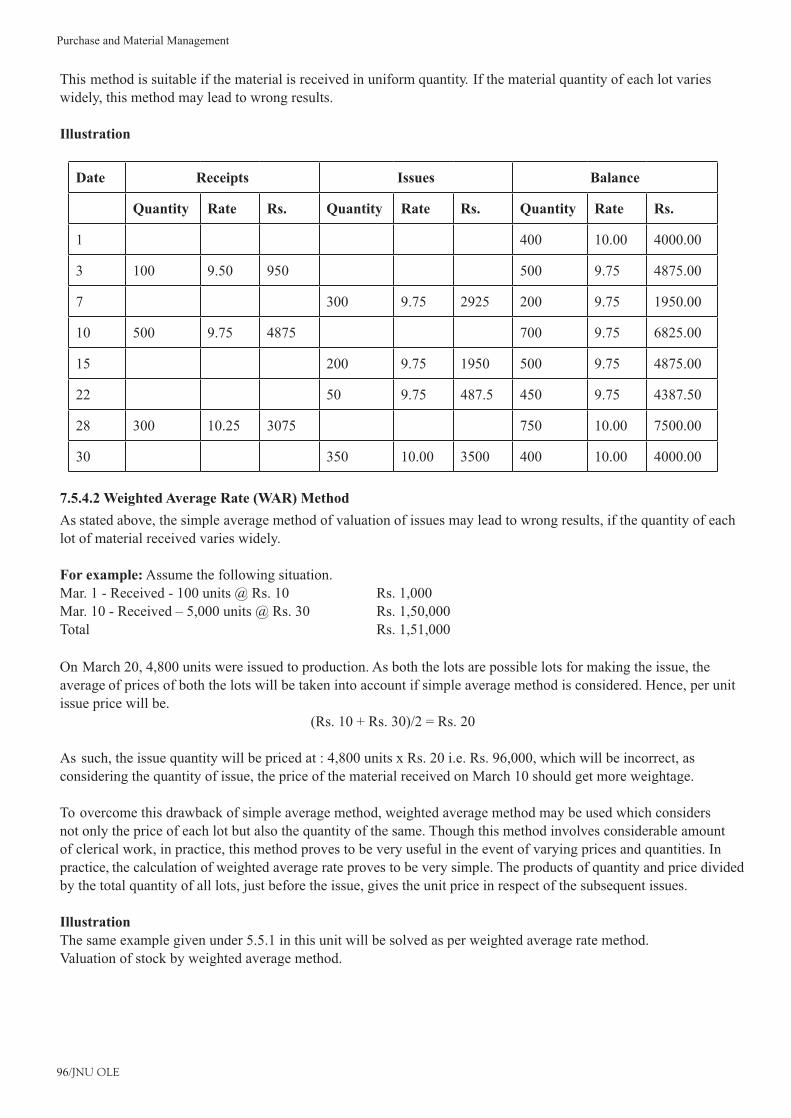
Purchase and Material Management
96/JNU OLE
This method is suitable if the material is received in uniform quantity. If the material quantity of each lot varies widely, this method may lead to wrong results.
Illustration
Date Receipts Issues Balance
Quantity Rate Rs. Quantity Rate Rs. Quantity Rate Rs.
1 400 10.00 4000.00
3 100 9.50 950 500 9.75 4875.00
7 300 9.75 2925 200 9.75 1950.00
10 500 9.75 4875 700 9.75 6825.00
15 200 9.75 1950 500 9.75 4875.00
22 50 9.75 487.5 450 9.75 4387.50
28 300 10.25 3075 750 10.00 7500.00
30 350 10.00 3500 400 10.00 4000.00
7.5.4.2 Weighted Average Rate (WAR) Method
As stated above, the simple average method of valuation of issues may lead to wrong results, if the quantity of each lot of material received varies widely.
For example: Assume the following situation.Mar. 1 - Received - 100 units @ Rs. 10 Rs. 1,000Mar. 10 - Received – 5,000 units @ Rs. 30 Rs. 1,50,000Total Rs. 1,51,000
On March 20, 4,800 units were issued to production. As both the lots are possible lots for making the issue, the average of prices of both the lots will be taken into account if simple average method is considered. Hence, per unit issue price will be.
(Rs. 10 + Rs. 30)/2 = Rs. 20
As such, the issue quantity will be priced at : 4,800 units x Rs. 20 i.e. Rs. 96,000, which will be incorrect, as considering the quantity of issue, the price of the material received on March 10 should get more weightage.
To overcome this drawback of simple average method, weighted average method may be used which considers not only the price of each lot but also the quantity of the same. Though this method involves considerable amount of clerical work, in practice, this method proves to be very useful in the event of varying prices and quantities. In practice, the calculation of weighted average rate proves to be very simple. The products of quantity and price divided by the total quantity of all lots, just before the issue, gives the unit price in respect of the subsequent issues.
IllustrationThe same example given under 5.5.1 in this unit will be solved as per weighted average rate method.Valuation of stock by weighted average method.

97/JNU OLE
Date Receipts Issues Balance
Quantity Rate Rs. Quantity Rate Rs. Quantity Rate Rs.
1 400 10.00 4000.00
3 100 9.50 950 500 9.90 4950.00
7 300 9.90 2970 200 9.90 1980.00
10 500 9.75 4875 700 9.79 6855.00
15 200 9.79 1959 500 9.79 4896.43
22 50 9.79 489.6 450 9.79 4406.79
28 300 10.25 3075 750 9.98 7481.79
30 350 9.98 3492 400 9.98 3990.29
Q1R1 = 4000 Q2R2 = 950 Q1R1+ Q2R2 = 4950. Q1+Q2 = 500 Weighted Average Cost = (Q1R1+Q2R2)/( Q1+Q2) = 4950/500 = 9.9
Comparison of value of stock under different methods:
Sl. No. Method of valuation Value of Inventory
1 First in First Out 4,050.00
2 Last in First out 3,950.00
3 HighestinfrstOut 3,875.00
4 Simple Average 4,000.00
5 Weighted Average 3,990.29
From the above table it is clear that the value of stock will be different in different methods of valuation. It is expected that a company should follow the same method every year. This is called principle of consistency in accounting. If themethodofvaluationischanged,itmayleadtochangeinproft. Insuchcase,theeffectofchangeinthemethodonproftabilityhastobeshownseparately.
7.5.5 Market Rate
Explained below are three methods of valuation under market rate:Market PriceUnder this method, market price is considered to be the base for pricing the issues. In this case, market price may be treated as the latest purchase price, realisable price or replacement price. This method is used mainly in respect of obsolete stock items or non-moving stock items. The defect in respect of this method is that the price concessions obtainedinrespectofbulkpurchasesarenotrefectedinthecostofmaterial.
Specifc PriceIfthematerialispurchasedagainstaspecifc joborproductionorder,theissueofmaterialispricedatactualpurchaseprice. This method can be adopted if the purchase prices are fairly stable.

Purchase and Material Management
98/JNU OLE
Standard PriceThis is the normal or ideal price which will be paid in the normal circumstances, based on the basis of estimated market conditions, transportation costs and normal quantity of purchases. Any issue of material will be priced at standardpricesirrespectiveofactualprices.Thisenablesthesimplifcation ofaccountingsystemwithreducedclericalworkandalsoenablestodecidetheeffciencyofpurchasedepartment.
7.6 Valuation of Returns
This indicates the material returned by the production department to stores department. The way in which the returned material can be valued is shown below:
At the same price as when issued•The original price of issue will be a base for valuing the returns, for which original material requisition ?note will be the base.
At the current price of issues•The method which is followed for valuing the issue on the same date is considered for valuing the ?returns.
This will avoid the clerical efforts, but at the same time the track of original issue of material can’t be ?maintained.
Treatment of shortagesInsomecases,thephysicalverifcation ofstockmayrevealthatthephysicalstockislessthanthestockasperthestores ledger. The valuation of this shortage is done as if it is an issue of material. The treatment given to the valuation of shortages in cost accounts depends upon the nature of the shortage i.e. normal shortage or abnormal shortage.
Bill of materialsIn order to ensure proper inventory control, the ‘basic principle to be kept in mind is that proper material is available for production purposes whenever it is required. This aim can be achieved by preparing what is normally called as 'Bill of Materials'.
A bill of material is the list of all the materials required for a job, process or production order. It gives the details of the necessary materials as well as the quantity of each item. As soon as the order for the job is received, bill of materials is prepared by production department or production planning department.
The form in which the bill of material is usually prepared is as below:
BILL OF MATERIALS
No. Date of Issue Production/Job Order No.
Department authorised
Sr. No. Description Code Qty. For Department Use only
Remarks of Material No. Material Date Quantity
Requisition No. demanded
The functions of bill of materials are as below:
Bill of material gives an indication about the orders to be executed to all the people concerned.•
Bill of material gives an indication about the materials to be purchased by the purchases department if the same •is not available with the stores.
99/JNU OLE
Bill of material may serve as a base for the production department for placing the material requisitions ships.•
Costing/Accounts Department may be able to compute the material cost in respect of a job or a production •order. A bill of material prepared and valued in advance may serve as a base for quoting the price for the job or production order.
Perpetual Inventory System: In order to exercise proper inventory control, perpetual inventory system may be •implemented. It aims at two facts, given below.
maintenance of bin cards and stores ledger in order to know about the stock in quantity and value at any ?point of time
continuousverifcationofphysicalstocktoensurethatthephysicalbalanceandthebookbalancetallies ?
The continuous stock taking may be advantageous from the following angles:
Physical balances and book balances can be compared and adjusted without waiting for the entire stocktaking •to be done at the year-end. Further, it is not necessary to close down the factory for annual stocktaking.
Thefguresofstockcanbereadilyavailableforthepurposeofperiodicproftandlossaccount.•
Discrepancies can be located and adjusted in time.•
Fixation of various levels and bin cards enables the action to be taken for the placing the order for acquisition •of material.
A systematic maintenance of perpetual inventory system enable in locating the slow and non-moving items and •to take remedial action for the same.
Stock details are correctly available for getting the insurance of stock.•

Purchase and Material Management
100/JNU OLE
Summary
Management of inventory assumes importance due to the fact that investment in inventory constitutes one of the •major investments in current assets. The various forms in which a manufacturing concern may carry inventory are;rawmaterial,workinprogress,fnishedgoodsandstoresandsupplies.
A company may hold the inventory with the following motive: transaction motive, precautionary motive, and •speculative motive.
The types of movement of the material from the stores department are: receipt of material, issue of material, •return of material from production department to stores department, and transfer of material.
The proper conduct of storage function requires that material should be properly stored in a good condition till •it is required for use by production departments and this is ensured by perpetual inventory system.
Valuation of material is done in valuation of receipts, valuation of issues and valuation of returns from production •department to stores department.
Valuation of receipts is a relatively easy task, as the invoice or bill received from the supplier of the material •is available as a starting point.
Valuation of the issues is done by First In First Out (FIFO), Last In First Out (LIFO), Highest In First Out •(HIFO), Simple Average Rate (SAR), Weighted Average Rate (WAR) and Market rate.
Highestinfrst outmethodassumesthatthestockshouldalwaysbeshownattheminimumvalueandhence•the issues should always be valued at the highest value of receipts.
Simple average (SAR) method, the simple average of the prices of the lots available for making the issues is •considered for pricing the issues.
Weighted average (WAR) method considers not only the price of each lot but also the quantity of the same.•
Valuation of the returns is done on two bases: at the same price at which issued and at the current price if •issues.
References
Crosby, Philip, B., 1974. • Quality Without Tears: The Art of Hassle-Free Management , New York: McGraw-Hill.
Evans, J. R. & Lindsay, W. M., 1999. • The Management and Control of Quality , 4th ed., Cincinnati: South Western.
Quality Management Systems• , [Pdf] Available at: <http://www.abahe.co.uk/business-administration/Quality-Management-Systems.pdf> [Accessed 13 February 2013].
Rijn, J., • QUALITY MANAGEMENT An Introduction,[Pdf]Availableat:<http://www.indevelopment.nl/PDFfles/QualityManagement.pdf> [Accessed 13 February 2013].
Prof. Chakravarti, K., 2010. • Lec-13 Total Quality Management , [Video online] Available at: <http://www.youtube.com/watch?v=ksR4Xy6tFcM> [Accessed 13 February 2013].
Module 11: Quality Management• , [Video online] Available at: <http://www.youtube.com/watch?v=QJNVrY_Z2NM> [Accessed 13 February 2013].
Recommended Reading
Goetsch, D. L. & Stanley, D., 1995. • Implementing Total Quality, Upper Saddle River, N. J: Prentice-Hall.
Hall, R., 1977. • Attaining Manufacturing Excellence, Burr Ridge III: Down-Jones Irwin.
Kitazawa, S. & Sarkis, J., • The Relationship Between ISO 14001 and Continuous Source Reduction Programs, International.

101/JNU OLE
Self Assessment
Which of the following document is used to record the details of the material received?1. Inspection receipta.
Goods received reportb.
Bin cardc.
Stores ledgerd.
Which of the following methods assumes that the stock should always be shown at the minimum value and 2. hence the issues should always be valued at the highest value of receipts?
Firstinfrstouta.
Lastinfrstoutb.
Highestinfrstoutc.
Simple average rated.
Ifthematerialispurchasedagainstaspecifc joborproductionorder,theissueofmaterialispricedat_________3. purchase price.
actuala.
costb.
sellingc.
inventoryd.
Which of the following statement is false?4. A company may be required to hold the inventories in order to facilitate the smooth and uninterrupted a. production and sales operations
Usually the receipt of material is accompanied by delivery challan given by the supplierb.
On receipt of the material, quantity received is checked with the quantity ordered by the stores c. department
The material can be issued from the stores without a proper authority in writing is produced before the d. stores department
Which of the following system ensures the proper conduct of storage?5. Perpetual inventorya.
Bin cardb.
Stores ledgerc.
Valuation of receiptsd.
Which of the following method may be useful in case of the organisations dealing with monopoly products 6. which is a rare possibility?
Firstinfrstouta.
Lastinfrstoutb.
Highestinfrstoutc.
Simple average rated.
Purchase and Material Management
102/JNU OLE
Which of the following statements is true?7. Bill of material gives an indication about the orders to be executed to all the people of the organisationa.
Bill of material gives an indication about the materials to be purchased by the purchases department if the b. same is available with the stores
Bill of material may serve as a base for the production department for placing the material requisitions c. ships
Bill of material prepared and valued later on and may serve as a base for quoting the price for the job or d. production order
Bin card is maintained by stores department while stores ledger is maintained by ________department.8. manufacturinga.
distributionb.
packagingc.
costingd.
The levels indicated on bin card enable the stores department to keep a watch on balance and replace the material 9. as soon as it reaches the ___________level.
minimuma.
re-orderb.
actualc.
valuationd.
The stores ledger considers not only the movement of material in terms of quantity but also in terms of its 10. _________implications.
distributiona.
economicalb.
fnancialc.
productiond.
103/JNU OLE
Chapter VIII
Quality Management
Aim
The aim of this chapter is to:
explicate the concept of quality management in operations management•
explain the terms: 'quality' and 'quality management'•
enlist different types of costs in quality management•
Objectives
The objectives of this chapter are to:
explain the tools of quality control•
elucidate the quality standards in quality management•
explicate the total quality management in operations management•
Learning outcome
At the end of this chapter, you will be able to:
understandthereasonsforfailureofqualitymanagementinvariousfelds•
identify the importance of quality standards in management education and try to apply it•
describe total quality management•

Purchase and Material Management
104/JNU OLE
8.1 Introduction
Successfulcompaniesunderstandthepowerfulimpactcustomer-defned qualitycanhaveontheirbusiness.Forthisreasonmanycompetitivefrms continuallyincreasetheirqualitystandards.Forexample,boththeFordMotorCompany and the Honda Motor Company have recently announced that they are making customer satisfaction their numberonepriority.Thesloweconomyof2003impactedsalesintheautoindustry.Bothfrms believethatthewaytoreboundisthroughimprovementsinquality,andeachhasoutlinedspecifc changestotheiroperations.Fordis focusing on tightening already strict standards in their production process and implementing a quality program called Six-Sigma. Honda, on the other hand, is focused on improving customer-driven product design. Although bothfrms havebeenleadersinimplementinghighqualitystandards,theybelievethatcustomersatisfactionisstillwhat matters most.
8.2 Defnition of Total Quality Management
Total Quality Management (TQM) is an integrated effort designed to improve quality performance at every level of theorganisation.Customer-defnedQualityisdefnedbythecustomersiscalledCustomer-defnedQuality.
8.2.1 Defning Quality
Conformance to specifcationsHow well a product or service meets the targets and tolerances determined by its designers.
Fitness for useIt is the quality that evaluates how well the product performs for its intended use.
Value for price paidQualityisdefnedintermsofproductorserviceusefulnessforthepricepaid.
Support servicesQualitydefnedintermsofthesupportprovidedaftertheproductorserviceispurchased.
Psychological criteriaIt is the quality that focuses on judgmental evaluations of what constitutes product or service excellence:
TQM is an integrated organisational effort designed to improve quality at every level. •
In this chapter you will learn about the philosophy of TQM, its impact on organisations, and its impact on your •life.
YouwilllearnthatTQMisaboutmeetingqualityexpectationsasdefnedbythecustomer;thisiscalled•customer-defnedquality.
However,defning qualityisnotaseasyasitmayseem,becausedifferentpeoplehavedifferentideasofwhat•constituteshighquality.Let’sbeginbylookingatdifferentwaysinwhichqualitycanbedefned.
8.3 Cost of Quality
The reason quality has gained such prominence is that organisations have gained an understanding of the high •cost of poor quality. Quality affects all aspects of the organisation and has dramatic cost implications.
The most obvious consequence occurs when poor quality creates unhappy customers and eventually leads to •loss of business. However, quality has many other costs, which can be divided into two categories.
The f rstcategoryconsistsofcostsnecessaryforachievinghighquality,whicharecalledqualitycontrol•costs.
These are of two types: Prevention Costs and Appraisal Costs. •
The second category consists of the cost consequences of poor quality, which are called Quality Failure costs. •
These include External Failure Costs and Internal Failure Costs. These costs of quality are shown in Table 8.1 •
Thefrsttwocostsareincurredinthehopeofpreventingthesecondtwo.•

105/JNU OLE
Prevention costs are all costs incurred in the process of preventing poor quality from occurring. They include •quality planning costs, such as the costs of developing and implementing a quality plan.
Also included are the costs of product and process design, from collecting customer information to designing •processesthatachieveconformancetospecifcations.
Employee training in quality measurement is included as part of this cost, as well as the costs of maintaining •records of information and data related to quality.
Appraisal costs are incurred in the process of uncovering defects. They include the cost of quality inspections, •product testing, and performing audits to make sure that quality standards are being met.
Also included in this category are the costs of worker time spent measuring quality and the cost of equipment •used for quality appraisal.
Internal Failure Costs are associated with discovering poor product quality before the product reaches the •customer site. One type of internal failure cost is rework, which is the cost of correcting the defective item.
Sometimes the item is so defective that it cannot be corrected and must be thrown away. This is called scrap, •and its costs include all the material, labor, and machine cost spent in producing the defective product.
Other types of internal failure costs include the cost of machine downtime due to failures in the process and the •costs of discounting defective items for salvage value.
External Failure Costs are associated with quality problems that occur at the customer site. •
Thesecostscanbeparticularlydamagingbecausecustomerfaithandloyaltycanbediffculttoregain.•
They include everything from customer complaints, product returns, and repairs, to warranty claims, recalls, •and even litigation costs resulting from product liability issues.
Afnal componentofthiscostislostsalesandlostcustomers.Forexample,manufacturersoflunchmeats•and hot dogs whose products have been recalled due to bacterial contamination have had to struggle to regain consumerconfdence.
Other examples include auto manufacturers whose products have been recalled due to major malfunctions such •as problematic braking systems and airlines that have experienced a crash with many fatalities.
External failure can sometimes put a company out of business almost overnight. •
Companies that consider quality important invest heavily in prevention and appraisal costs in order to prevent •internal and external failure costs.
The earlier defects are found, the less costly they are to correct. For example, detecting and correcting defects •during product design and product production is considerably less expensive than when the defects are found at the customer site as shown in Fig. 8.1.
External Failure Costs tend to be particularly high for service organisations. The reason is that with a service the •customer spends much time in the service delivery system, and there are fewer opportunities to correct defects than there are in manufacturing. Examples of external failure in services include an airline that has overbooked fights,longdelaysinairlineservice,andlostluggage.
Prevention Cost Cost of preparing and implementing quality
Appraisal Cost Costs of testing, evaluating, and inspecting quality
Internal failure Costs of scrap, rework, and material losses.
External failure Costs of failure at customer site, including returns, repairs, and recalls.
Table 8.1 Cost of quality

Purchase and Material Management
106/JNU OLE
Cos
t of
def
ect
Des
ign
Production Customer
Location of Defect
Fig. 8.1 Cost of defects
8.4 Continuous Improvement (Kaizen)
Another concept of the TQM philosophy is the focus on Continuous Improvement. •
Traditional systems operated on the assumption that once a company achieved a certain level of quality, it was •successful and needed no further improvements.
Wetendtothinkofimprovementintermsofplateausthataretobeachieved,suchaspassingacertifcation test•or reducing the number of defects to a certain level.
Traditionally, change for American managers involves large magnitudes, such as major organisational •restructuring.
The Japanese, on the other hand, believe that the best and most lasting changes come from gradual •improvements.
To use an analogy, they believe that it is better to take frequent small doses of medicine than to take one large •dose.
Continuous improvement, called 'Kaizen' by the Japanese, requires that the company continually strive to be •better through learning and problem solving. Because we can never achieve perfection, we must always evaluate our performance and take measures to improve it.
Now let’s look at two approaches that can help companies with continuous improvement: The Plan-Do-Study-•Act (PDSA) cycle and benchmarking.
8.4.1 Plan to Study Cycle
The Plan-Do-Study-Act (PDSA) cycle describes the activities a company needs to perform in order to incorporate continuous improvement in its operation. This cycle, shown in Fig. 8.2 is also referred to as the Shewhart cycle or the Deming wheel. The circular nature of this cycle shows that continuous improvement is a never-ending process. Let’slookatthespecifcstepsinthecycle.
Plan
ThefrststepinthePDSA cycleistoplan.•
Managersmustevaluatethecurrentprocessandmakeplansbasedonanyproblemstheyfnd.•
They need to document all current procedures, collect data, and identify problems. •
Thisinformationshouldthenbestudiedandusedtodevelopaplanforimprovementaswellasspecifcmeasures•to evaluate performance.
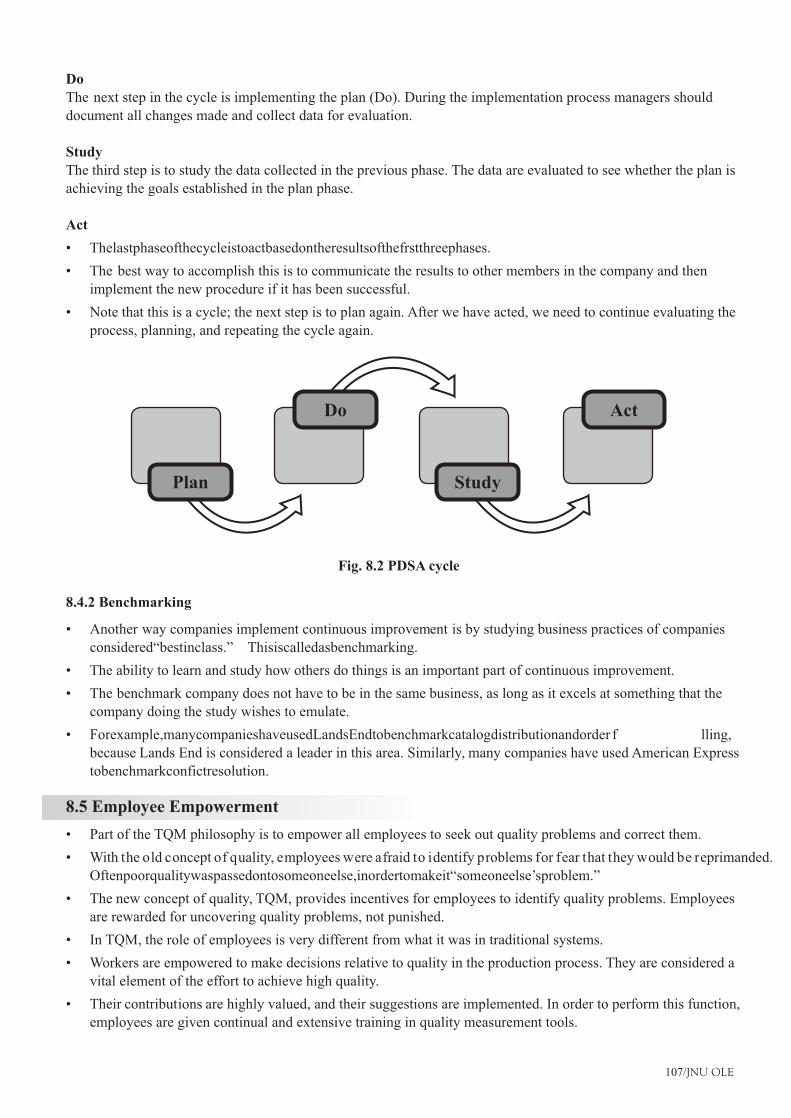
107/JNU OLE
DoThe next step in the cycle is implementing the plan (Do). During the implementation process managers should document all changes made and collect data for evaluation.
StudyThe third step is to study the data collected in the previous phase. The data are evaluated to see whether the plan is achieving the goals established in the plan phase.
Act
Thelastphaseofthecycleistoactbasedontheresultsofthefrstthreephases.•
The best way to accomplish this is to communicate the results to other members in the company and then •implement the new procedure if it has been successful.
Note that this is a cycle; the next step is to plan again. After we have acted, we need to continue evaluating the •process, planning, and repeating the cycle again.
Plan
Do
Study
Act
Fig. 8.2 PDSA cycle
8.4.2 Benchmarking
Another way companies implement continuous improvement is by studying business practices of companies •considered“bestinclass.” Thisiscalledasbenchmarking.
The ability to learn and study how others do things is an important part of continuous improvement.•
The benchmark company does not have to be in the same business, as long as it excels at something that the •company doing the study wishes to emulate.
Forexample,manycompanieshaveusedLandsEndtobenchmarkcatalogdistributionandorder f lling,•because Lands End is considered a leader in this area. Similarly, many companies have used American Express tobenchmarkconfictresolution.
8.5 Employee Empowerment
Part of the TQM philosophy is to empower all employees to seek out quality problems and correct them. •
With the old concept of quality, employees were afraid to identify problems for fear that they would be reprimanded. •Oftenpoorqualitywaspassedontosomeoneelse,inordertomakeit“someoneelse’sproblem.”
The new concept of quality, TQM, provides incentives for employees to identify quality problems. Employees •are rewarded for uncovering quality problems, not punished.
In TQM, the role of employees is very different from what it was in traditional systems. •
Workers are empowered to make decisions relative to quality in the production process. They are considered a •vital element of the effort to achieve high quality.
Their contributions are highly valued, and their suggestions are implemented. In order to perform this function, •employees are given continual and extensive training in quality measurement tools.

Purchase and Material Management
108/JNU OLE
To further stress the role of employees in quality, TQM differentiates between external and internal •customers.
External customers are those that purchase the company’s goods and services. Internal customers are employees •of the organisation who receive goods or services from others in the company.
For example, the packaging department of an organisation is an internal customer of the assembly department. •Just as a defective item would not be passed to an external customer, a defective item should not be passed to an internal customer.
8.5.1 Team Approach
TQM stresses that quality is an organisational effort. To facilitate the solving of quality problems, it places great •emphasisonteamwork. Theuseofteamsisbasedontheoldadagethat“twoheadsarebetterthanone.”
Using techniques such as brainstorming, discussion, and quality control tools, teams work regularly to correct •problems. The contributions of teams are considered vital to the success of the company. For this reason, companies set aside time in the workday for team meetings.
Teams vary in their degree of structure and formality, and different types of teams solve different types of •problems.
One of the most common types of teams is the quality circle, a team of volunteer production employees and •their supervisors whose purpose is to solve quality problems.
The circle is usually composed of eight to ten members, and decisions are made through group consensus. The •teams usually meet weekly during work hours in a place designated for this purpose.
They follow a preset process for analysing and solving quality problems. Open discussion is promoted, •and criticism is not allowed. Although the functioning of quality circles is friendly and casual, it is serious business.
Qualitycirclesarenotmere“gabsessions”.Rather,theydoimportantworkforthecompanyandhavebeen•verysuccessfulinmanyfrms.
8.6 Tools of Quality Control
You can see that TQM places a great deal of responsibility on all workers. If employees are to identify and •correct quality problems, they need proper training.
They need to understand how to assess quality by using a variety of quality control tools, how to interpret •fndings,andhowtocorrectproblems.
In this section we look at seven different quality tools. These are often called the seven tools of quality control •and are shown in Fig. 8.3.
They are easy to understand, yet extremely useful in identifying and analysing quality problems. Sometimes •workers use only one tool at a time, but often a combination of tools is most helpful.
8.6.1 Cause-and-Effect Diagrams
Cause-and-effect diagrams are charts that identify potential causes for particular quality problems. They are •oftencalledfshbonediagramsbecausetheylooklikethebonesofafsh.
Ageneralcause-and-effectdiagramisshowninFig.8.3.The“head”ofthefsh isthequalityproblem,suchas•damaged zippers on a garment or broken valves on a tire.
Thediagramisdrawnsothatthe“spine”ofthefsh connectsthe“head”tothepossiblecauseoftheproblem.•These causes could be related to the machines, workers, measurement, suppliers, materials, and many other aspects of the production process.
Eachofthesepossiblecausescanthenhavesmaller“bones”thataddressspecifcissuesthatrelatetoeachcause.•
For example, a problem with machines could be due to a need for adjustment, old equipment, or tooling problems. •Similarly, a problem with workers could be related to lack of training, poor supervision, or fatigue.
109/JNU OLE
Cause-and-effect diagrams are problem-solving tools commonly used by quality control teams. •
Specifc causesofproblemscanbeexploredthroughbrainstorming.Thedevelopmentofacause-and-effect•diagram requires the team to think through all the possible causes of poor quality.
8.6.2 Flowcharts
Afowchartisaschematicdiagramofthesequenceofstepsinvolvedinanoperationorprocess.•
It provides a visual tool that is easy to use and understand. By seeing the steps involved in an operation or •process, everyone develops a clear picture of how the operation works and where problems could arise.
8.6.3 Checklists
A checklist is a list of common defects and the number of observed occurrences of these defects. It is a simple •yeteffectivefact-fndingtoolthatallowstheworkertocollectspecifcinformationregardingthedefectsobserved.
The checklist in Fig.8.3 shows four defects and the number of times they have been observed. It is clear that •the biggest problem is ripped material.
Thismeansthattheplantneedstofocusonthisspecifc problemforexample,bygoingtothesourceofsupply•or seeing whether the material rips during a particular production process.
A checklist can also be used to focus on other dimensions, such as location or time. For example, if a defect is •being observed frequently, a checklist can be developed that measures the number of occurrences per shift, per machine, or per operator.
In this fashion we can isolate the location of the particular defect and then focus on correcting the problem.•
8.6.4 Control Charts
Control charts are a very important quality control tool. •
These charts are used to evaluate whether a process is operating within expectations relative to some measured •value such as weight, width, or volume.
Forexample,wecouldmeasuretheweightofasackoffour, thewidthofatire,orthevolumeofabottleof•softdrink. Whentheproductionprocessisoperatingwithinexpectations,wesaythatitis“incontrol.”
To evaluate whether or not a process is in control, we regularly measure the variable of interest and plot it •on a control chart. The chart has a line down the center representing the average value of the variable we are measuring.
Above and below the center line are two lines, called the Upper Control Limit (UCL) and the Lower Control •Limit (LCL). As long as the observed values fall within the upper and lower control limits, the process is in control and there is no problem with quality. When a measured observation falls outside of these limits, there is a problem.
8.6.5 Scatter Diagrams
Scatter diagrams are graphs that show how two variables are related to one another. They are particularly useful •in detecting the amount of correlation, or the degree of linear relationship, between two variables.
For example, increased production speed and number of defects could be correlated positively; as production •speed increases, so does the number of defects.
Two variables could also be correlated negatively, so that an increase in one of the variables is associated with •a decrease in the other.
For example, increased worker training might be associated with a decrease in the number of defects •observed.
The greater the degree of correlation the more linear are the observations in the scatter diagram. On the other •hand, the more scattered the observations in the diagram, the less correlation exists between the variables.

Purchase and Material Management
110/JNU OLE
Of course, other types of relationships can also be observed on a scatter diagram, such as an inverted. •
This may be the case when one is observing the relationship between two variables such as oven temperature •and number of defects, since temperatures below and above the ideal could lead to defects.
8.6.6 Pareto Analysis
Pareto analysis is a technique used to identify quality problems based on their degree of importance. •
The logic behind Pareto analysis is that only a few quality problems are important, whereas many others are not •critical. The technique was named after Vilfredo Pareto, a nineteenth-century Italian economist who determined that only a small percentage of people controlled most of the wealth.
This concept has often been called the 70 – 20 rule and has been extended to many areas. •
In quality management the logic behind Pareto’s principle is that most quality problems are a result of only a •few causes. The trick is to identify these causes.
One way to use Pareto analysis is to develop a chart that ranks the causes of poor quality in decreasing order •based on the percentage of defects each has caused.
For example, a tally can be made of the number of defects that result from different causes, such as operator •error, defective parts, or inaccurate machine calibrations.
Percentages of defects can be computed from the tally and placed in a chart like those shown in Fig. 8.3. We •generallytendtofndthatafewcausesaccountformostofthedefects.
8.6.7 Histograms
A histogram is a chart that shows the frequency distribution of observed values of a variable. •
We can see from the plot what type of distribution a particular variable displays, such as whether it has a normal •distribution and whether the distribution is symmetrical.
1. Cause and Effect Diagram 4. Control Chart
5. Scatter Diagram
6. Pareto Chart
7. Histogram
2. Flowchart
Suppliers
3. Checklist
The seven tools of quality control
Environment
Workers
Process
Machines
Material
Quality Problems
UCL
LCL
Y
X
Detect type No. of Defects TotalBroken Zipper 333 3Ripped material 3333333 7Missing buttons 333 3Faded colour 33 2
A B C D E
A B C D
%
E
Frequency
Fre
qu
ency
Fig. 8.3 Seven tools of quality control(Source: http://www.scribd.com/doc/24650872/Seven-Tools-of-Quality-Control)

111/JNU OLE
8.7 Process Management
According to TQM a quality product comes from a quality process. This means that quality should be built •into the process.
Quality at the source is the belief that it is far better to uncover the source of quality problems and correct it •than to discard defective items after production.
If the source of the problem is not corrected, the problem will continue. For example, if you are baking cookies •youmightfnd thatsomeofthecookiesareburned.Simplythrowingawaytheburnedcookieswillnotcorrectthe problem.
You will continue to have burned cookies and will lose money when you throw them away. It will be far more •effective to see where the problem is and correct it. For example, the temperature setting may be too high, the pan may be curved, placing some cookies closer to the heating element, or the oven may not be distributing heat evenly.
Qualityatthesourceexemplifes thedifferencebetweentheoldandnewconceptsofquality.Theoldconcept•focused on inspecting goods after they were produced or after a particular stage of production.
If an inspection revealed defects, the defective products were either discarded or sent back for reworking. All •this cost the company money, and these costs were passed on to the customer.
The new concept of quality focuses on identifying quality problems at the source and correcting them.•
8.8 Quality Standards
Various quality standards are discussed below:8.8.1 ISO 9000 Standards
Increases in international trade during the 1970s created a need for the development of universal standards of •quality. Universal standards were seen as necessary in order for companies to be able to objectively document their quality practices around the world.
Thenin1977theInternationalOrganisationforStandardisation(ISO)publisheditsfrst setofstandardsfor•quality management called ISO 9000.
The International Organisation for Standardisation (ISO) is an international organisation whose purpose is to •establish agreement on international quality standards.
It currently has members from 91 countries, including the United States. To develop and promote international •quality standards, ISO 9000 has been created.
ISO9000consistsofasetofstandardsandacertifcation processforcompanies.ByreceivingISO9000•certifcation,companiesdemonstratethattheyhavemetthestandardsspecifedbytheISO.
The standards are applicable to all types of companies and have gained global acceptance. •
InmanyindustriesISOcertifcation hasbecomearequirementfordoingbusiness.Also,ISO9000standards•have been adopted by the European Community as a standard for companies doing business in Europe.
InDecember2000the f rstmajorchangestoISO9000weremade,introducingthefollowingthreenew•standards:
ISO 9000:2000 Quality Management Systems Fundamentals and Standards: Provides the terminology and ?defnitionsusedinthestandards.Itisthestartingpointforunderstandingthesystemofstandards.
ISO9001:2000QualityManagementSystemsRequirements:Thisisthestandardusedforthecertifcation ?ofafrm’s qualitymanagementsystem.Itisusedtodemonstratetheconformityofqualitymanagementsystems to meet customer requirements.
ISO 9004:2000 Quality Management Systems Guidelines for Performance: Provides guidelines for ?establishing a quality management system. It focuses not only on meeting customer requirements but also on improving performance.

Purchase and Material Management
112/JNU OLE
8.8.2 ISO 14000 Standards
The need for standardisation of quality created an impetus for the development of other standards. In 1996 the International Standards Organisation introduced standards for evaluating a company’s environmental responsibility. These standards, termed ISO 14000, focus on three major areas:
Management systems standards measure systems development and integration of environmental responsibility •into the overall business.
Operations standards include the measurement of consumption of natural resources and energy.•
Environmentalsystemsstandardsmeasureemissions,effuents,andotherwastesystems.•
8.9 Reason for TQM Failure
The most important factor in the success or failure of TQM efforts is the genuineness of the organisation’s •commitment. Often companies look at TQM as another business change that must be implemented due to market pressure without really changing the values of their organisation.
Recall that TQM is a complete philosophy that has to be embraced with true belief, not mere lip service. Looking •atTQMasashort-termfnancialinvestmentisasurerecipeforfailure.
Another mistake is the view that the responsibility for quality and elimination of waste lies with employees •otherthantopmanagement.Itisa“lettheworkersdoit”mentality.
A third common mistake is over or under reliance on Statistical Process Control (SPC) methods. •
SPC is not a substitute for continuous improvement, teamwork, and a change in the organisation’s belief system. •However, SPC is a necessary tool for identifying quality problems. Some common causes for TQM failure are:
Lack of a genuine quality culture ?
Lack of top management support and commitment ?
Over- and under-reliance on statistical process control (SPC) methods. ?
Companiesthathaveattainedthebeneftsof TQMhavecreatedaqualityculture.•
Thesecompanieshavedevelopedprocessesforidentifyingcustomer-defnedquality.•
In addition, they have a systematic method for listening to their customers, collecting and analysing data •pertaining to customer problems, and making changes based on customer feedback.

113/JNU OLE
Summary
Total Quality Management (TQM) is different from the old concept of quality because its focus is on serving •customers, identifying the causes of quality problems, and building quality into the production process.
Therearefourcategoriesofqualitycosts.Thefrst twoarepreventionandappraisalcosts,whichareincurred•by a company in attempting to improve quality. The last two costs are internal and external failure costs, which are the costs of quality failures that the company wishes to prevent.
Seven features of TQM combine to create the TQM philosophy: customer focus, continuous improvement, •employee empowerment, use of quality tools, product design, process management, and managing supplier quality.
QualityFunctionDeployment(QFD)isatoolusedtotranslatecustomerneedsintospecifcengineering•requirements. Seven problem-solving tools are used in managing quality. Often called the seven tools of quality control,theyarecause-and-effectdiagrams,fowcharts, checklists,scatterdiagrams,Paretoanalysis,controlcharts, and histograms.
Reliability is the probability that the product will function as expected. The reliability of a product is computed •as the product of the reliabilities of the individual components.
Companies are evaluated in seven areas, including quality leadership and performance results. These criteria •have become a standard for many companies that seek to improve quality.
ISO9000isacertifcation basedonasetofqualitystandardsestablishedbytheInternationalOrganisationfor•Standardisation. Its goal is to ensure that quality is built into production processes. ISO 9000 focuses mainly on quality of conformance.
References
Gopalkrishan, P. & Sundaresan, M., 1977. • Materials Management, An Integrated Approach, New Delhi: Prentice Hall.
Kalakota, R. & Whinston, A. B., 1996, • Frontiers of Electronic Commerce, Addison Wesley.
U.S. Department of Energy, 2003. • Work Breakdown Structure , [Pdf] Available at: <http://condor.depaul.edu/dmumaugh/readings/handouts/SE477/WorkBreakdownStructure.pdf> [Accessed 13 February 2013].
WORK BREAKDOWN STRUCTURE (WBS)• , [Pdf] Available at: <http://www.projectmanagementdocs.com/template/Work-Breakdown-Structure.pdf> [Accessed 13 February 2013].
What is a work breakdown structure? lynda.com overview• , [Video online] Available at: <http://www.youtube.com/watch?v=CQ_QfrClfR4> [Accessed 13 February 2013].
Introduction to Project Planning• , [Video online] Available at: <http://www.youtube.com/watch?v=VgdChg5kF1E> [Accessed 13 February 2013].
Recommended Reading
Norman, G. & Fraizer, G., • Operations Management, 9th ed., Thomson South Western.
Krajewski, L. & Ritma, L., • Operations Management, Processes and Value chains, 7th ed., India: Prentice Hall.
Drucker, P., 1981. • Managing Turbulant Times, London: Pan books.
Purchase and Material Management
114/JNU OLE
Self Assessment
The category consists of costs necessary for achieving high quality, which are called ________ costs. 1. quality control costsa.
prevention costs b.
appraisal costsc.
quality failure costsd.
________ includes quality planning costs, such as the costs of developing and implementing a quality plan.2. Appraisal costsa.
Internal failure costsb.
Prevention costs c.
External failure costs d.
The______isthefrststepofShewartCycle.3. Plana.
Dob.
Studyc.
Actd.
___________ is an integrated organisational effort designed to improve quality at every level.4. TPMa.
TQMb.
Kaizenc.
Kanband.
In1977theInternationalOrganisationforStandardisation(ISO)publisheditsfrst setofstandardsforquality5. management called ___________.
ISOa.
ISO 9001b.
ISO 9000c.
ISO 14000d.
In 1996 the International Standards Organisation introduced standards for evaluating a company’s environmental 6. responsibility called as___________.
ISOa.
ISO 9000b.
ISO 14000c.
ISO 9001d.
Which of the following phases explains the data are evaluated to see whether the plan is achieving the goals 7. established in the plan phase?
Plana.
Dob.
Studyc.
Actd.

115/JNU OLE
___________ is the sequence of steps involved in an operation or process.8. Checklista.
Flowchartb.
Control chartsc.
Cause and effect diagramsd.
Technique used to identify quality problems based on their degree of importance is known as___________.9. Parreto analysisa.
Statistical process control b.
Histogramc.
Scatter diagramsd.
Inwhichtypeofdiagramsorchartsaretheuppercontrollimitandthelowercontrollimitrefected?10. Scatter chartsa.
Histogramsb.
Control chartsc.
Statistical Process controld.
Purchase and Material Management
116/JNU OLE
Case Study I
Materials Handling Management
IntroductionThere is a strong concern to adjust the supply system in a company to achieve a higher service level internally and to the outside customers. This brings to a higher operational level and even a possible differential when compared with the other competitors.
Materials handling management is among many factors that contribute to improve a company’s performance. The MaterialsHandlingIndustryofAmerica[MHIA]defnesmaterialshandlingmanagementas“MaterialHandlingisthemovement, storage, control and protection of material, goods, and products throughout the process of manufacturing, distribution, consumption and disposal. The focus is on the methods, mechanical equipment, systems and related controlsusedtoachievethesefunctions”.Thenitisobservedthathandlingisbroaderthansimplematerialsmovement,although both terms are sometimes used as synonyms.
Therelevanceofmaterialshandlingstemsfromtheintrinsicrelationshipthatithaswithproductionfow. Whenitpresentsanimbalance,thereisformationofextrastockorruptureinsupply.Whenthefow doesnothaveenoughvelocity, transit time is long and the system is not capable of serving the customers when they need it. It is well understood that material handling improvement may have positive effects over production. However, it is not onlyproduction,butthewaytheemployeesseethenewsituation.Whentheperceptionisfavourable,thebeneftsare possible; if not, behavioural issues can emerge. Evaluations are important when interventions into the work environmentareimplemented. Thepresentworkisspecifcallyrelatedtomaterialshandlingmanagement.
By means of effective materials handling management, the company’s operational performance may improve aiming to satisfy the customers or meet their expectations in terms of their needs, desires and demands. The case study related in this work was performed in an automotive industry located in the north eastern part of Rio Grande do Sul StateofBrazil.Itwasfoundedmorethan50yearsagoandisclassifed asalarge-sizedcompanysinceithasmorethan 2000 employees. This region contains a cluster of industries of metal-mechanic, automotive and metallurgical sectors that in its majority belong to production chains which demand a high internal performance level from their partners.
Thecompanyinquestion,afteranalysingproductionfow asawhole,identifed thatamongothermeasuresitwouldbe necessary to improve materials handling management in the manufacturing process. This was motivated by the observed delay in forklifts service and their high maintenance cost. Forklifts were used both for parts handling and transportation and to assist in tooling changes, which many times resulted in excessive setup time leading to production delays. Changes were made in the materials handling process to address these concerns.
The main objective of this case study was to evaluate internal customers’ satisfaction levels after the change. In order to do this, it was necessary to identify the factors that explain overall satisfaction; to do it, open-ended questionnaires wereapplied.Therespondents–26peopledirectlylinkedtodailymaterialsfow –wererequestedtoidentifytheattributesandunfoldthemintosub-factorswhichrepresentedtheinternalprocessinmoredetails.Theidentifedattributes were cost, safety in service, service reliability and agility. After this step, a second questionnaire with close-ended questions was applied to the same respondents in order to evaluate performance satisfaction at each factor and sub-factor and also overall satisfaction. The questions requested the respondent perception about the improvement – perceived or not – after the interventions.
The collected data were analysed with multiple regressions. Data analysis indicated that the factors agility, service reliability and cost are able to explain overall satisfaction. In addition to that the satisfaction level of most of internal customers with the new materials handling management system is equal or even superior when compared to the previous one.
117/JNU OLE
Material FlowMaterialshandlingmakesproductionfowpossible,asitgivesdynamismtostaticelementssuchasmaterials,products,equipments, layout and human resources. Groover highlights that despite its importance, materials handling is a topicthatfrequentlyistreatedsuperfcially bythecompanies.However,otherauthorshaveperceiveditsrelevance.During the period in which Shingo contributed to the development of the Toyota Production System, he developed the Production Function Mechanism that proposes to explain how the production phenomenon happens.
Shingo indicated that, in the West, production was treated as a process of a sequence of operations. In the Production Function Mechanism, the concepts are directly related to a production analysis focus. A process analysis consists ofanobservationoftheproductionfows thatturnrawmaterialsintofnal products.Fromthisconcept,theauthorhighlights that the main analysis is the one associated with the process, because it follows the production object. The analysis of the operations comes later because it focuses on production subjects (operators and machines). When making this distinction, it is possible to perceive the relevance of materials handling.
Beyond the basic function of movement, it is also relevant to cite the functions of storage and information transfer, which occurs simultaneously and has both strategic and operational dimensions. Organisations are relying on information systems using tools like Electronic Data Interchange (EDI), or similar information technology resources, to gain in precision and reliability, in the interchange, and availability of information.
According to Asef-Vaziri & Laporte (2005) an important proportion of manufacturing expenses can be attributed to material handling and the most critical material handling decisions in this area are the arrangement and design of materialfow patterns.ThisideaissharedbyIoannou(2002),whicharguesthatanimportantaspectofanyproductionsystem is the design of a material handling system (MHS) which integrates the production operations. The relevance also occurs in another context. Ballou (1993) states that the storage and handling of goods are essential among the set of logistics activities, and their costs can absorb 12% to 40% of its costs. In addition, the MHIA estimates that 20% to 25% of manufacturing costs are associated to handling. According to Sule (1994) apud Sujono & Lashkari (2006),materialhandlingaccountsfor30–75%ofthetotalcostofaproductalongtheproductionchain,andeffcientmaterial handling can be responsible for reducing the manufacturing system operations cost by 15–30%.
For Bowersox and Closs (1996), the main logistic responsibility in manufacturing is to formulate a master-program for the timely provision of materials, components and work-in-process. Stevenson (2001) understands that logistics (includingmaterialsandgoodsfowing inandoutofaproductionfacilityaswellasitsinternalhandling)hasbecomevery important to an organisation to acquire competitive advantages, as the companies struggle to deliver the right productatthecorrectplaceandtime.Themainchallengeistopromote,withlowcost,afow whosevelocityallowsthe execution of manufacturing process with the expected satisfaction level.
Elements and Characteristics of a Material Handling SystemMaterialshandlingstudyrequiresthatseveralelementsareconsidered.Thefrst isahandlingsystemproject,whichcovers activities of sequencing, velocity, layout and routing. In order to complete the analysis, Groover (2001) recommendsanalyzingthematerialitself(orobject)tobetransported.Therefore,itsuggeststheclassifcation ofMuther and Hagan, which considers:
physical state (solid, liquid, gas)•
size (volume, length, width, height)•
weight•
condition (hot, cold, dry, dirty, sticky, adhesive)•
risk of damage (weak or strong)•
safetyhazards(explosive,fammable,toxic,corrosive,etc)•

Purchase and Material Management
118/JNU OLE
Additionally,theissueofequipmentanddevicesmustbeexamined.Diasadoptstheterm“moving”todescribewhat,in this article, is called management (handling) to adopt the terminology of Groover. When dealing with equipment, Diaspresentsabroadclassifcationthatcoversfvecategories:
transporters (belts, chains, rollers)•
cranes, hoists and lifts•
industrial vehicles (carts, tractors, pallet transporters, forklifts)•
positioning equipment, weighing and control •
(ramps, transfer, equipment)•
stents and support structures (pallets, holders, reels)•
According to Chan, Ip & Lau (1999), a key factor in material handling system design process is the selection and confguration ofequipmentformaterialtransportation.Thisisdirectlyrelatedtothisstudy.AccordingtoGurgel(1996), the equipment should be selected based on some preliminary considerations: take into account the utilisation ofthefactoryfoor anditsloadcapacity;examinethedimensionsofdoorsandcorridors;paycloseattentiontoceiling height, identify the environmental conditions and their nature, avoid the use of combustion engines traction equipments in storage of food products, meet all safety standards to protect humans and to eliminate the possibility of incurring criminal and civil liabilities arising from accidents, and examine all kinds of available energy options and their capacity to supply required movements.
The right choice of equipment and location of working-process is fundamental for the optimisation of a company’s manufacturing capacity. Bowersox and Closs (1996) state that; a critical factor in positioning stocks in process is a balancebetweenconvenienceandconsolidationtocreateeffciencies whenthestockfows alongthevaluechain.Theimportanceoflayout,whichdefnes theplacementofequipmentand,consequently,restrictspossibleroutesandsequencing, can be perceived by the prominence that the subject is treated in production management literature. The analysis of the relationship between layout studies and material handling, however, does not receive much attention in the same literature. This lack of attention can be seen in works like Gaither and Frazier (2002), Chase, Jacobs and Aquilano (2006) and Slack, Chambers, Harland, Harrison and Johnston (1997).
Finally, the systems and information technology constitute essential factors for materials handling management. Stair and Reynolds (2006), Laudon and Laudon (2006) and O’Brien and Marakas (2007) support the study of fundamentals and general principles of information systems. In order to improve the performance of distribution operationsand,inthisspecifc case,theinternalmaterialhandlingprocess,itisimportanttoconsiderbothhumanand technical factors. In this sense, this study assesses the internal customers’ perception of a material handling process improvement. With regard to the attributes to be considered in a material handling system, according to Kulak(2005),effectiveuseoflabor,providingsystemfexibility, increasingproductivity,decreasingleadtimesandcostsaresomeofthemostimportantfactorsinfuencingselectionofmaterialhandlingequipment.
These factors are directly related to some attributes found in the present study. The determination of a material handling system involves both the selection of suitable material handling equipment and the assignment of material handling operations to each individual piece of equipment. Hence, according to Sujono & Lashkari (2006) material handlingsystemselectioncanbedefnedastheselectionofmaterialhandlingequipmenttoperformmaterialhandlingoperations within a working area considering all aspects of the products to be handled. In this context it is important to mention that, in this study, only the selection of the material handling equipment was considered.
Problem and Intervention DescriptionThefrst sub-sectiondescribesthesituationpriortotheintervention,identifyingtheproblemsthatwerefound.Thesecond describes the factors that motivated the change. The third describes the changes and the situation after its completion. Besides variables and sub-variables, customers’ overall satisfaction regarding the implemented changes was also evaluated.

119/JNU OLE
Situation Prior to the InterventionThis study was conducted in the manufacturing sector of an automotive company. The manufacturing sector is responsible for almost all of the supply of assembly lines, including the components that go through a pre-assembly processbeforeproceedingtofnal productassembly.Inthissectorareconcentratedcuttingandbendingtoolsanddies required for components manufacturing to assembly lines.
The whole process runs with the aid of forklifts. Often, the setup time is equal to or higher than the time needed for parts manufacturing. This situation, coupled with the cost of downtime, demonstrates the importance of the tooling exchange process. Besides helping in the execution of setups and carrying out internal transport managed by an electronic scoreboard installed in the factory roof, forklifts also performed activities for transporting materials between pavilions. When executing this last activity, the forklifts often travelled on uneven roads, which caused great bouncing, burdening maintenance cost for equipment wear or premature breakage.
Often, when a forklift leaves its workplace to transport a container between pavilions, delays in machines’ setups are generated, causing unnecessary costs and stress on the forklift operator. The operator could do little besides feel forced to increase the speed during the route, creating risks of accidents with personal injury and/or materials damage. This activity as well as the studied process relate to Goldratt’s Theory of Constraints (TOC) to seek bottlenecks and reduce or eliminate them.
Although there were enough forklifts to meet the demand from the manufacturing sector, many times it was not possible to meet immediately the manufacturing needs due to reasons like long distances to travel and frequent maintenance due to excessive use of the equipment. This directly affected internal customers’ satisfaction. The presented problem was: how to increase internal customer satisfaction, while stabilising or decreasing forklifts’ maintenance cost?
Change MotivatorsDuetodevelopmentofnewmarkets,manufacturingdemandsforalargevarietyofcomponentsandfnal productassemblies increased. This demand growth led to speed increases and changes in how materials and tools were being handled and transported in order to monitor manufacturing requirements. With these changes and demands for manufacturing to attain the company’s goals, there was also pressure for growth and lack of tolerance with forklift operators, since the work did not always run quickly and with quality. Additionally, forklift maintenance costs were increasing, demanding sometimes excessive spending that jeopardized the budget. The dissatisfaction and de-motivation of forklift operators was notorious, and an increase was also noticed in the number of collisions between the equipments. Finally, boxes and containers were unsatisfactorily stored in the hallways together with the machines to attempt to reduce production interruptions.
The Changes and the Situation after the ImplementationOne suggested solution was to rent two forklifts as a way to solve the problem. But this only served to soften it, and brought a larger cost to the company. It was realised then that it was not the quantity of equipments that was going to solve the problem but the way material handling was being executed in relation to the necessity of the presented changes.Fromthisobservation,processesandmaterialfowsweremappedandseparatedintwoways:
vertical movements which make greater efforts and little ground movement•
horizontal movements that rely on traction to travel longer distances, including transport out of the work •units
Anotherproposedsolutionwastouseatractortowingsmall“wagons”,formingakindoftrain.Ballou(1993)statesthat; this approach is more economical for larger volumes that must be moved over long distances along the same route.Severalcargo(pallets)unitswereconstructedwithspecialwheels,ftted withsuspensioncoupledtosupportthematerialweightandtraversethegapsbetweenthepavilions.Afterwards,several“cages”weremadetobeusedfor holding the parts that go through the processes of bath and painting. More robust containers for heavier and less delicate parts storage were also constructed.
Purchase and Material Management
120/JNU OLE
The next step was to create spaces (pit stops) for pallets with their mobile parts on each workstation. In order to the truckdrivertoknowwhenhecouldtransportmaterial,itwasnecessarytocreateanidentifcation system.Itwasdecidedthateverytimethattheoperatorfnished theprocessinhisstation,hewouldputonthepackagingagreensign indicating that the container would be ready to be transported to the next production step. The truck driver, whenremovingaflledcontainer,shouldreplaceitwithanemptyoneinthevacantpost.
Testswereconductedwithatimetableforthetrainpassage,butthisalternativedidnotmeettheneedforfexibility incase of emergencies (pieces to technical assistance and replacement of damaged materials in the assembly process). It was then decided to set a path that would follow the manufacturing process sequence. To inform the train operator of some urgency, a mobile phone was given to him. Thus, the supervisor could communicate with the operator instantly when there were critical parts and/or components to be collected. After the changes were completed, it was necessary to evaluate their impacts. This study evaluated internal customers’ satisfaction level with the new materialshandlingandtransportingconfguration.
Research MethodologyResearch methodology is explained with the help of various points in the section below:Company CharacterisationThe studied company, Marcopolo S/A., is one of the main bus body producers in the world. Founded in 1949, in Caxias do Sul, the company is divided into four business units:
bus, with bodies of Marcopolo and Ciferal brands•
LCV, with complete minibus under the Volare brand•
plastic products, with MVC brand•
parts and components, with service parts for the company brands and parts for other segments of the Syncroparts •brand
The company maintains a technology transfer contract with the Iveco SPA. The transferred technology from the lines Midi bus, Low Entry and High Decker was made in the factory of CBC-Iveco in China. Currently, Marcopolo hasarepresentativeoffce calledMarcopoloChangzhouOffce atChangzhouandhasalsobeendevelopingajointventure agreement with Tata Motors in India. This study took place only at the Brazilian facility.
ObjectivesThe present study had as its objective to evaluate, in a systematic way, the impact of the implemented changes in materials handling management on the internal customers’ perceptions at the manufacturing department in MarcopoloS/A.unitlocatedinCaxiasdoSul–RS.Toreachthisobjective,thefollowingspecifc objectiveswereestablished:
describe the changes in material handling processes at the company•
evaluateinternalmaterialhandlingfowinmanufacturing,verifyingtheimprovements•
analyse internal customers’ satisfaction levels relative to the new system•
Data CollectionThesamplewasthepeopledirectlyinvolvedwiththedailyfowofmaterials,selectedintentionally.Therespondentsheld positions as leaders, supervisors, forklift drivers and warehouse operators, enabling a comprehensive view of the problem. Data collection for the satisfaction survey was divided into two stages.
Thefrst stepwasanopen-endedquestionsurvey.Respondentswereaskedabouttheirperceptionsregardingthechangesinmaterialshandlingemphasizingevidenceoftheimprovements,problemsstillidentifed afterchangeimplementationandsuggestionsfortherelevantattributesinquestion.Twocriteriawereusedtodefne factorsandsub-factors from the obtained answers:
the factor must be cited by respondents of all positions (leaders, supervisors, forklift drivers and warehouse •operators)
the number of times that the criterion has been cited by the 26 respondents. Table 1 shows the evaluated factors, •theirdefnitionsandtheassociatedsub-factors

121/JNU OLE
Factors Factors Description Sub-factors
CostMonetary value available to maintain the operation: expenditures with periodic maintenance linked to forklifts use
Mechanical shutdownsElectrical shutdownsCorrective painting
Safety in ServiceIdentifesforkliftsoperator’sconductonnew handling and internal transport way
Safety in handlingTooling storageEffcientrouting
Service Reliability
Identifesmanufacturingsatisfactionlevelin terms of reliability
Operator’s autonomyOperator’s performance and availability
Agility
Identifesthetimespentwithtoolexchange coupled handling (discounting the times associated with the machine, suchaslooseand/orfxarraysortools)
Setup agilityMaterial handling quicknessTooling handling quickness
Table 1 Factors and sub-factors of satisfaction survey
Performance improvements (current state vs. status quo) were measured using the following scale: 1 = much worse, 2=worse,3=same,4=betterand5=muchbetter.Forinstance,theemployeewasasked:“Comparingpreviousand current procedures for handling and internal transport, how do you assess the costs related to mechanical downtime?”Toanswerthequestion,theoptionsofthescalementionedabovewereoffered.Atthispointitisimportant to highlight that the study was evaluating the respondents’ perception, starting from the assumption that they had knowledge enough (even empirical) because they are directly involved in the process.
(Source: MATERIALS HANDLING MANAGEMENT: A CASE STUDY, [Pdf] Available at: <http://www.joscm.com.br/download/JOSCM_VOL4_NUMBER%202_2.pdf> [Accessed 13 February 2013]).
QuestionsDefneMHIA1.
Answer
Material Handling is the movement, storage, control and protection of material, goods, and products throughout the process of manufacturing, distribution, consumption and disposal. The focus is on the methods, mechanical equipment, systems and related controls used to achieve these functions.
What does a process analysis consists?2.
Answer
Aprocessanalysisconsistsofanobservationoftheproductionfowsthatturnrawmaterialsintofnalproducts.
What is the use of Forklifts here?3.
Answer
Forklifts were used both for parts handling and transportation and to assist in tooling changes, which many times resulted in excessive setup time leading to production delays.
Purchase and Material Management
122/JNU OLE
Case Study II
JIT in TOYOTA
IntroductionTheJustinTime,JITisasetoftechniquesthatwasfrst adoptedandpublicizedbyToyotaMotorCorporationofJapan as part of its Toyota Production System (TPS).
History of JITThetechniquewasfrst usedbytheFordMotorCompanyduring1920s,butthetechniquewassubsequentlyadoptedand publicized by Toyota Motor Corporation of Japan as part of its Toyota production System (TPS). In 1954 Japanese giant Toyota implemented this concept in order to reduce wasteful overstocking in car production.
JIT ImplementationBack in Japan, Sakichi customised the Ford production system to suit Japanese market. He also devised a system wherein each process in the assembly line of production would produce only the number of parts needed at the next step on the production line, which made logistics management easier as material was procured according to consumption. This system was referred to as Just-in-Time (JIT) within the Toyota Group.
TheJITproductionwasdefned as‘producingonlynecessaryunitsinanecessaryquantityatanecessarytimeresulting in decreased excess inventories and excess workforce, thereby increasing productivity.’
Benefts OF JIT
Reduced set up times in warehouse – TOYOTA in this case focused on other processes that might need •improvement.
Improvedfowsofgoodsin/through/outwarehouseemployeeswereabletoprocessgoodsfaster.•
Employeeswhopossessedmulti-skillswereutilisedmoreeffciently.•
Better consistency of scheduling and consistency of employee work hours if there is no demand for a product •at the time
(Source: Radisic, M., Just-In-Time concept,[Pdf]Availableat:<http://smallb.in/sites/default/fles/Just-In-Time%20Concept_0.pdf> [Accessed 13 February 2013]).
QuestionsExplain the Just in Time technique?1. Why Japanese implemented JIT technique?2. How was JIT implemented in Toyota?3.
123/JNU OLE
Case Study III
Ford Production System-A Lean Manufacturing
IntroductionFord has established several innovative automobile manufacturing techniques from its beginning. In the mid 1990s, Fordmoderniseditsmanufacturingoperationsinitseffortstoinducemorefexibility andenhancetheeffciencyof its automobile production systems. The restructuring effort was known as Ford Production System (FPS). Ford was established by Henry Ford on June 16, 1903, with an initial investment of $100,000.
Ford Production SystemIn January 1995, Ford employed a company-wide re-engineering initiative called Ford 2000. One of the major objectives of Ford 2000 program was to develop and implement a new manufacturing system called the Ford ProductionSystem(FPS).AccordingtoFord’swebsite,“ThevisionofFPSisalean,fexible anddisciplinedcommonproductionsystem,defned byasetofprinciplesandprocesses,thatemploysgroupsofcapableandempoweredpeople, learning and working safely together, in the production and delivery of products that consistently exceed customersexpectationsinquality,costandtime.”
Lean ProductionLean production aimed at bringing together human, material and mechanical resources at the right time and place to accomplish a task. It strived to eliminate every kind of waste including wastage of time, labour, scrap material, defective parts, etc.
Benefts of Lean Production
Production cost reduction by 50%•
Manufacturing cycle times decreased by 50%•
Labor reduction by 50% while maintaining or increasing throughput•
Inventory reduction by 80% while increasing customer service levels•
Capacity in current facilities increase by 50%•
(Source: The Ford Production System , [Online] Available at: <http://www.icmrindia.org/casestudies/catalogue/Operations/Ford%20Production%20System-Operations%20Management%20Case%20Studies.htm> [Accessed 21 February 2013]).
QuestionsHow was the Ford Production System established?1. What was the vision of FPS?2. WhatarethebeneftsofLeanProduction?3.

Purchase and Material Management
124/JNU OLE
Bibliography
References
2008. • Capacity Planning and Capacity Management Tips , [Video online] Available at: <http://www.youtube.com/watch?v=m4NJnhekJPw> [Accessed 13 February 2013].
2008. • Production Plannning and Control , [Video online] Available at: <http://www.youtube.com/watch?v=b143Y7dTfIA> [Accessed 13 February 2013].
2010. • Introduction to Product Management , [Video online] Available at: <http://www.youtube.com/watch?v=ONrbwhPxJUc> [Accessed 13 February 2013].
2012. • Capacity Planning & Facility Location , [Pdf] Available at: <http://www1.pu.edu.tw/~ylai/OM/1011/ppts_f12/1011_OM_Ch09_F12.pdf> [Accessed 13 February 2013].
Arora, K. C., 2004. • Production and Operations Management, Batch Production, Firewall Media.
Aswathappa, K. & Bhat, K. S., 2010. • Production and Operations Management, Introduction to operations Management, 2nd ed., Himalaya Publishing House.
Aswathappa, K., 2010. • Production and Operations management Manufacturing and Service operations , Himalaya publishing House.
Birla Institute of Technology and Science, • Production, Planning &Control , [Online] Available at: <http://discovery.bits-pilani.ac.in/dlpd/courses/coursecontent/courseMaterial%5Cmmzg511%5CMOML18.pdf> [Accessed 15 November 2010].
CHAPTER FIVE FACILITY LAYOUT• , [Pdf] Available at: <http://labs.fme.aegean.gr/decision/images/stories/docs/HealthCare_FacilityLayout.pdf> [Accessed 13 February 2013].
Crosby, Philip, B., 1974. • Quality Without Tears: The Art of Hassle-Free Management , New York: McGraw-Hill.
Dr. Oke, A., 2012. • Introduction to Operations Management 1, [Video online] Available at: <http://www.youtube.com/watch?v=skg_lg-4m2o> [Accessed 13 February 2013].
Dr. Oke, A., 2012. • Introduction to Operations Management 2, [Video online] Available at: <http://www.youtube.com/watch?v=nT2b5CGuIvM> [Accessed 13 February 2013].
Dr. Sumukadas, N., 2013. • [1.a] Introduction to Operations Management, [Video online] Available at: <http://www.youtube.com/watch?v=Y28MsljBgvU> [Accessed 13 February 2013].
Evans, J. R. & Lindsay, W. M., 1999. • The Management and Control of Quality , 4th ed., Cincinnati: South Western.
Facility Layout,• [Pdf] Available at: <http://www.me.utexas.edu/~jensen/ORMM/omie/design/unit/layout/layout.pdf> [Accessed 13 February 2013].
Francis, R. L. & White, J. A., 1992. • Facility Layout and Location: An Analytical Approach. Englewood Cliffs, NJ: Prentice Hall.
Ghosh, S. and Gagnon, R., 1989. • A Comprehensive Literature Review and Analysis of the Design, Balancing and Scheduling of Assembly Systems, International Journal of Production Research.
Gopalkrishan, P. & Sundaresan, M., 1977. • Materials Management, An Integrated Approach, New Delhi: Prentice Hall.
Graves, S. C., • Manufacturing Planning and Control , [Pdf] Available at: <http://web.mit.edu/sgraves/www/ProdPlanCh.PDF> [Accessed 13 February 2013].
Introduction to Operations Management• , [Pdf] Available at: <http://highered.mcgraw-hill.com/sites/dl/free/0073377848/609567/stevenson_sample_chapter1.pdf> [Accessed 13 February 2013].
Introduction to Operations Management• , [Pdf] Available at: <http://highered.mcgraw-hill.com/sites/dl/free/0073525251/886181/stevenson11_sample_ch01.pdf> [Accessed 13 February 2013].
Introduction to Product and Operations Management• , [Pdf] Available at: <http://www.newagepublishers.com/samplechapter/001233.pdf> [Accessed 13 February 2013].

125/JNU OLE
Introduction to Project Planning• , [Video online] Available at: <http://www.youtube.com/watch?v=VgdChg5kF1E> [Accessed 13 February 2013].
Kalakota, R. & Whinston, A. B., 1996, • Frontiers of Electronic Commerce, Addison Wesley.
Kolli, S., • Essentials of Production and Operations Managemen-Different Production Systems , Research and entertainment Association.
Martinich, S. J., 2008. • Production And Operations Management: An Applied Modern Approach , John Wiley & Sons.
Module 11: Quality Management• , [Video online] Available at: <http://www.youtube.com/watch?v=QJNVrY_Z2NM> [Accessed 13 February 2013].
Nadler, G., • WORK SYSTEMS DESIGN: THE IDEALS CONCEPT, [Pdf] Available at: <http://www.library.wisc.edu/selectedtocs/da1311.pdf> [Accessed 13 February 2013].
PRODUCTION PLANNING AND CONTROL, • CHAPTER 4: FACILITY CAPACITY, LOCATION AND LAYOUT, [Pdf] Available at: <http://www1.pu.edu.tw/~ylai/OM/1011/ppts_f12/1011_OM_Ch09_F12.pdf> [Accessed 13 February 2013].
Production System Design: Work Structuring Revisited• , [Pdf] Available at: <http://www.leanconstruction.org/pdf/WP_11_Work_Structuring.pdf> [Accessed 13 February 2013].
Prof. Chakravarti, K., 2010. • Lec-13 Total Quality Management , [Video online] Available at: <http://www.youtube.com/watch?v=ksR4Xy6tFcM> [Accessed 13 February 2013].
Prof. Jain, K. P., 2009. • Mod-1 Lec-1 Production Planning and Control, [Video online] Available at: <http://www.youtube.com/watch?v=yYIVumq6sVM&playnext=1&list=PL54140420A2274299&feature=results_main> [Accessed 13 February 2013].
Prof. Jain, P. K., • Mod-1 Lec-1 Production Planning and Control , [Video online] Available at: <http://www.youtube.com/watch?v=yYIVumq6sVM> [Accessed 13 February 2013].
Prof. Kanda, A., 2008. • Lecture - 1 Project and Production Management - An Overview, [Video online] Available at: <http://www.youtube.com/watch?v=obzp6biyAN0> [Accessed 13 February 2013].
Prof. Kanda, A., 2008. • Lecture - 30 Mathematical Models for Facility Location, [Video online] Available at: < http://www.youtube.com/watch?v=xk7hS8zCHgA> [Accessed 13 February 2013].
Prof. Kanda, A., 2008. • Lecture - 31 Layout planning , [Video online] Available at: <http://www.youtube.com/watch?v=IhGBUcMM-rE> [Accessed 13 February 2013].
Prof. Singh, I., 2010. • Mod-4 Lec-6 Capacity Planning – I , [Video online] Available at: <http://www.youtube.com/watch?v=FHauhdppEDA> [Accessed 13 February 2013].
Quality Management Systems• , [Pdf] Available at: <http://www.abahe.co.uk/business-administration/Quality-Management-Systems.pdf> [Accessed 13 February 2013].
Rijn, J., • QUALITY MANAGEMENT An Introduction,[Pdf]Availableat:<http://www.indevelopment.nl/PDFfles/QualityManagement.pdf> [Accessed 13 February 2013].
S. Anil Kumar, 2006. • Production and operations management-Introduction to production and operations management, New Age International.
Schonberger, R. J., 1986. • World Class Manufacturing, New York: Free Press.
Shim, J. K. & Siegel, J. G., 1999. • Operations Management, Scope of Operations Management, 1st ed., Barrons Education Series Inc.
Sommers, M. S. & Kernan, J. B., 1965. • A Behavioural Approaching to Planning, Layout and Display.
Tutor2u, • Introduction to POM, [Online] Available at: <http://tutor2u.net/business/production/pom_introduction.htm> [Accessed 13 February 2013].
U.S. Department of Energy, 2003. Work Breakdown Structure• , [Pdf] Available at: <http://condor.depaul.edu/dmumaugh/readings/handouts/SE477/WorkBreakdownStructure.pdf> [Accessed 13 February 2013].
What is a work breakdown structure? lynda.com overview, [Video online] Available at: <http://www.youtube.•com/watch?v=CQ_QfrClfR4> [Accessed 13 February 2013].
Purchase and Material Management
126/JNU OLE
WORK BREAKDOWN STRUCTURE (WBS), [Pdf] Available at: <http://www.projectmanagementdocs.com/•template/Work-Breakdown-Structure.pdf> [Accessed 13 February 2013].
Recommended Reading
Adam, Everette, E. & Ebert, R. J., 2003. • Production and Operations Management - Concepts Models and Behaviour, New Delhi: Pearson Education.
Arora, K. C., 2004. • Production and Operations Management, Service Operations, Firewall Media.
Bitner, M. J., 1992. • Servicescapes: The Impact of Physical Surroundings on Customers and Employees, Journal of Marketing 56.
Bollinger, S., 1998. • Fundamentals of Plant Layout, Society of Manufacturing Engineers in Association with Richard, Muther and Associates.
Brown, S., Blackmon, K., Cousins, P. & Maylor, H., 2012. • Operations Management: Policy, Practice and Performance Improvement, Routledge.
Buffa, E.S., 1988. • Modern Production Management, New Delhi: Wily.
Charantimath, P., 2003. • Total Quality Management, Pearson Education, New Delhi.
Drucker, P., 1981. • Managing Turbulant Times, London: Pan books.
Francis, R. L. & White, J. A. 1992. • Facility Layout and Location: An Analytical Approach. Englewood Cliffs, NJ: Prentice Hall.
Gaither, N., Fraizer, G., 2002. • Operations Management-Overview, Thompson Learning, 9th ed.
Ghosh, S. & Gagnon, R., 1989. • A Comprehensive Literature Review and Analysis of the Design, Balancing and Scheduling of Assembly Systems, International Journal of Production Research.
Goetsch, D. L. & Stanley, D., 1995. • Implementing Total Quality, Upper Saddle River, N. J: Prentice-Hall.
Hall, R., 1977. • Attaining Manufacturing Excellence, Burr Ridge III: Down-Jones Irwin.
Khanna, • Production And Operations Management, PHI Learning Pvt. Ltd.
Kitazawa, S. & Sarkis, J., • The Relationship Between ISO 14001 and Continuous Source Reduction Programs, International.
Kolli, S., • Essentials of Production and Operations Management, Research and entertainment Association.
Krajewski, L. and Ritma, L., • Operations Management, Processes and Value chains , 7th ed., India: Prentice Hall.
Krajewski, L., Ritzman, L. P., Malhotra, M, K., 2009. • Operations Management: process and supply chain, Operations Management, Prentice Hall Publication.
Manufacturing and Operations Management• , Nirali Prakashan.
Murthy, P. R., 2006. • Production and Operations Management, Introduction to Operations Management , 2nd ed., New Age International Publishers.
Norman, G. & Fraizer, G., • Operations Management, 9th ed., Thomson South Western.
Norman, R., 1991. • Service Management, 2nd ed., New York: John Wiley and Sons.

127/JNU OLE
Self Assessment Answers
Chapter Ib1. a2. d3. d4. c5. c6. a7. b8. a9. a10.
Chapter IIc1. d2. d3. a4. b5. b6. b7. d8. a9. d10.
Chapter IIIa1. d2. b3. a4. d5. a6. b7. a8. c9. a10.
Chapter IVc1. b2. a3. d4. b5. d6. c7. c8. c9. a10.
Purchase and Material Management
128/JNU OLE
Chapter Vc1. b2. a3. d4. b5. d6. c7. c8. c9. a10.
Chapter VIb1. a2. c3. a4. d5. b6. b7. a8. c9. a10.
Chapter VIIb1. c2. a3. d4. a5. c6. c7. d8. b9. c10.
Chapter VIIIa1. c2. a3. b4. c5. c6. c7. b8. a9. c10.