
Puravankara Projects Limited
31
Results – 31 Mar 2012 Puravankara Projects Limited March 2013
Transcript of Puravankara Projects Limited
Results – 31 Mar 2012
Puravankara Projects Limited March 2013
Disclaimer
2
This presentation has been prepared by Puravankara Projects Limited (the “Company”) solely for information purposes, without regard to any specific objectives, financial situations or informational needs of any particular person. This presentation may not be copied, distributed, redistributed or disseminated, directly or indirectly, in any manner, in whole or part. By reviewing this presentation, you are agreeing to be bound by the trailing restrictions regarding the information disclosed in these materials. This presentation does not constitute or form part of and should not be construed as an offer or invitation, directly or indirectly, or inducement to sell or issue or any solicitation of any offer to purchase or subscribe for any securities of the Company by any person in any jurisdiction, including in India and the United States. Neither this document nor any part of it or the fact of its distribution should form the basis of or be relied upon in connection with any investment decision or any contract or commitment to purchase or subscribe for any securities. Any person placing reliance on the information contained in this presentation or any other communication by the Company does so at his or her own risk and neither the Company nor any of its affiliates, advisers or representatives shall be liable for any loss or damage caused pursuant to any act or omission based on or in reliance upon the information contained herein. No representation or warranty, guarantee or undertaking, express or implied, is or will be made as to, and no reliance should be placed on, the fairness, accuracy, completeness or correctness of the information, estimates, projections and opinions contained in this presentation. Such information and opinions are in all events not current after the date of this presentation. You must make your own assessment of the relevance, accuracy and adequacy of the information contained in this presentation and must make such independent investigation as they may consider necessary or appropriate in connection with the potential future performance of the business of the Company. Further, past performance is not necessarily indicative of future results. This presentation is not a complete description of the Company. This presentation may contain statements that constitute forward-looking statements. All forward looking statements are not guarantees of future performance and are subject to risks, uncertainties and assumptions that could cause actual results to differ materially from those contemplated by the relevant forward-looking statement. Important factors that could cause actual results to differ materially include, among others, future changes or developments in the Company’s business, its competitive environment and political, economic, legal and social conditions. Given these risks, uncertainties and other factors, viewers of this presentation are cautioned not to place undue reliance on these forward-looking statements. The Company disclaims any obligation to revise or update these forward-looking statements to reflect future events or developments. Except as otherwise noted, all of the information contained herein is indicative and is based on management information, current plans and estimates in the form as it has been disclosed in this presentation. Industry and market-related information is obtained or derived from industry publications and has not been verified by us. Any opinion, estimate or projection herein constitutes a judgment as of the date of this presentation and there can be no assurance that future results or events will be consistent with any such opinion, estimate or projection. The Company may alter, modify or otherwise change in any manner the content of this presentation, without obligation to notify any person of such change or changes. The accuracy of this presentation is not guaranteed, it may be incomplete or condensed and it may not contain all material information concerning the Company. This presentation should not be construed as legal, tax, investment or other advice. This presentation is not an offering circular, a statement in lieu of a prospectus, offer document or a prospectus as defined under the Companies Act, 1956, as amended, the Securities and Exchange Board of India (Issue of Capital and Disclosure Requirements) Regulations, 2009, as amended, or any other applicable law in India. It is clarified that this presentation is not intended to be an advertisement or document inviting offers or invitations to offer or solicitations to offer from the public or any class of investors for the subscription to or sale purchase of any securities. Neither this presentation nor any copy of portion of it may be sent or taken, transmitted or distributed, directly or indirectly, in or into the United States or any other jurisdiction which prohibits the same. The Company’s equity shares have not been and will not be registered under the U.S. Securities Act of 1933, as amended (the “Securities Act”) or any state securities laws in the United States. The equity shares may not be offered or sold in the United States absent registration or pursuant to an exemption from, or in a transaction not subject to, the registration requirements of the Securities Act and the applicable state or local securities law in the United States. No public offering of securities of the Company has been or will be made in the United States.
Overview
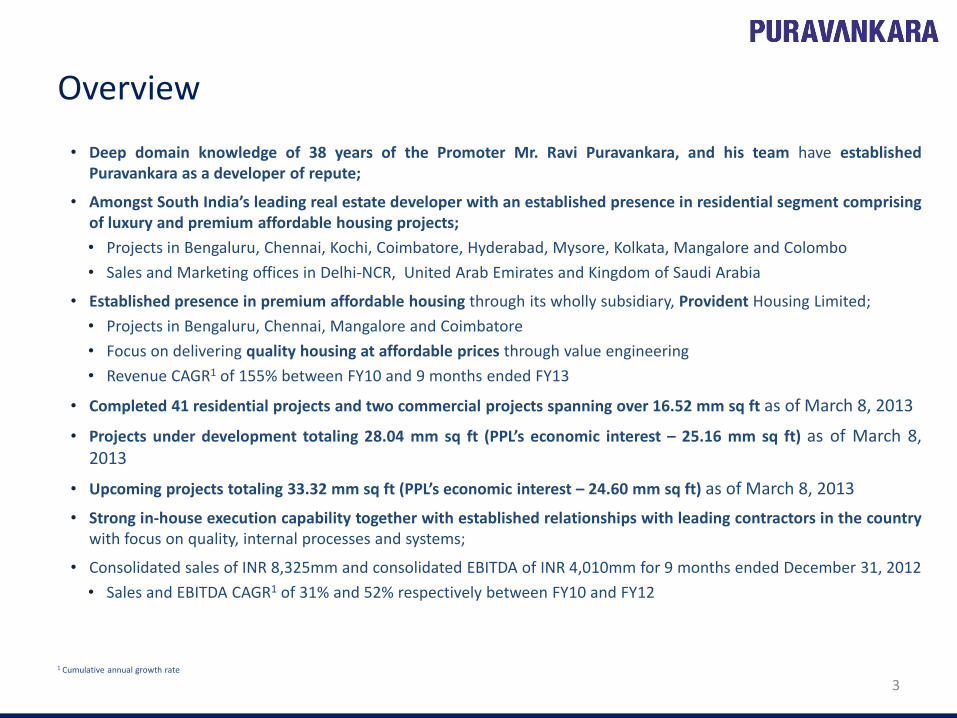
• Deep domain knowledge of 38 years of the Promoter Mr. Ravi Puravankara, and his team have established Puravankara as a developer of repute;
• Amongst South India’s leading real estate developer with an established presence in residential segment comprising of luxury and premium affordable housing projects;
• Projects in Bengaluru, Chennai, Kochi, Coimbatore, Hyderabad, Mysore, Kolkata, Mangalore and Colombo
• Sales and Marketing offices in Delhi-NCR, United Arab Emirates and Kingdom of Saudi Arabia
• Established presence in premium affordable housing through its wholly subsidiary, Provident Housing Limited;
• Projects in Bengaluru, Chennai, Mangalore and Coimbatore
• Focus on delivering quality housing at affordable prices through value engineering
• Revenue CAGR1 of 155% between FY10 and 9 months ended FY13
• Completed 41 residential projects and two commercial projects spanning over 16.52 mm sq ft as of March 8, 2013
• Projects under development totaling 28.04 mm sq ft (PPL’s economic interest – 25.16 mm sq ft) as of March 8, 2013
• Upcoming projects totaling 33.32 mm sq ft (PPL’s economic interest – 24.60 mm sq ft) as of March 8, 2013
• Strong in-house execution capability together with established relationships with leading contractors in the country with focus on quality, internal processes and systems;
• Consolidated sales of INR 8,325mm and consolidated EBITDA of INR 4,010mm for 9 months ended December 31, 2012
• Sales and EBITDA CAGR1 of 31% and 52% respectively between FY10 and FY12
3
1 Cumulative annual growth rate
Puravankara has well defined plays in the right markets
4
Source: The ‘Bird of Gold’: The Rise of Indian Consumer Market, 2007, Mckinsey & Co.
Focus on South India
Product across price bands
Pioneers in affordable housing
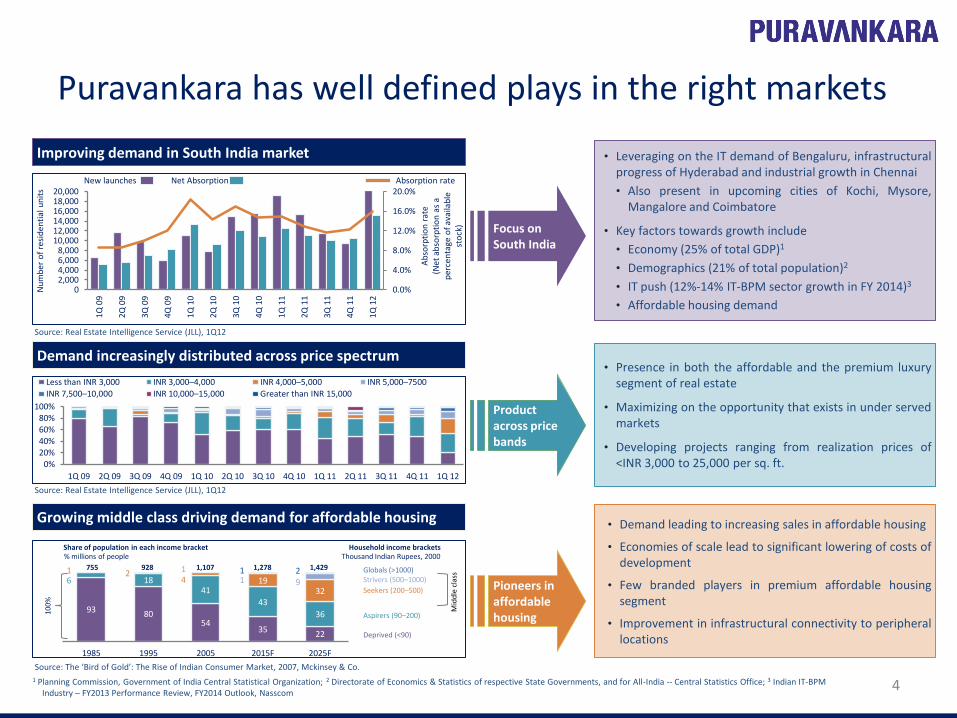
Improving demand in South India market
0.0%
4.0%
8.0%
12.0%
16.0%
20.0%
0 2,000 4,000 6,000 8,000
10,000 12,000 14,000 16,000 18,000 20,000
1Q
09
2Q
09
3Q
09
4Q
09
1Q
10
2Q
10
3Q
10
4Q
10
1Q
11
2Q
11
3Q
11
4Q
11
1Q
12
Ab
sorp
tio
n r
ate
(N
et a
bso
rpti
on
as
a p
erce
nta
ge o
f av
aila
ble
st
ock
)
Nu
mb
er o
f re
sid
enti
al u
nit
s
New launches Absorption rate Net Absorption
Source: Real Estate Intelligence Service (JLL), 1Q12
Demand increasingly distributed across price spectrum
0% 20% 40% 60% 80%
100%
1Q 09 2Q 09 3Q 09 4Q 09 1Q 10 2Q 10 3Q 10 4Q 10 1Q 11 2Q 11 3Q 11 4Q 11 1Q 12
Less than INR 3,000 INR 3,000–4,000 INR 4,000–5,000 INR 5,000–7500
INR 7,500–10,000 INR 10,000–15,000 Greater than INR 15,000
Source: Real Estate Intelligence Service (JLL), 1Q12
Growing middle class driving demand for affordable housing
93 80 54
35 22
6 18 41
43
36
1 2 4 19
32
1 1 9
1 2
1985 1995 2005 2015F 2025F
Share of population in each income bracket % millions of people
Household income brackets Thousand Indian Rupees, 2000
Globals (>1000) Strivers (500–1000)
Seekers (200–500)
Aspirers (90–200)
Deprived (<90)
Mid
dle
cla
ss 755 928 1,107 1,278 1,429
100%
• Leveraging on the IT demand of Bengaluru, infrastructural progress of Hyderabad and industrial growth in Chennai
• Also present in upcoming cities of Kochi, Mysore, Mangalore and Coimbatore
• Key factors towards growth include
• Economy (25% of total GDP)1
• Demographics (21% of total population)2
• IT push (12%-14% IT-BPM sector growth in FY 2014)3
• Affordable housing demand
• Presence in both the affordable and the premium luxury segment of real estate
• Maximizing on the opportunity that exists in under served markets
• Developing projects ranging from realization prices of <INR 3,000 to 25,000 per sq. ft.
• Demand leading to increasing sales in affordable housing
• Economies of scale lead to significant lowering of costs of development
• Few branded players in premium affordable housing segment
• Improvement in infrastructural connectivity to peripheral locations
1 Planning Commission, Government of India Central Statistical Organization; 2 Directorate of Economics & Statistics of respective State Governments, and for All-India -- Central Statistics Office; 3 Indian IT-BPM Industry – FY2013 Performance Review, FY2014 Outlook, Nasscom
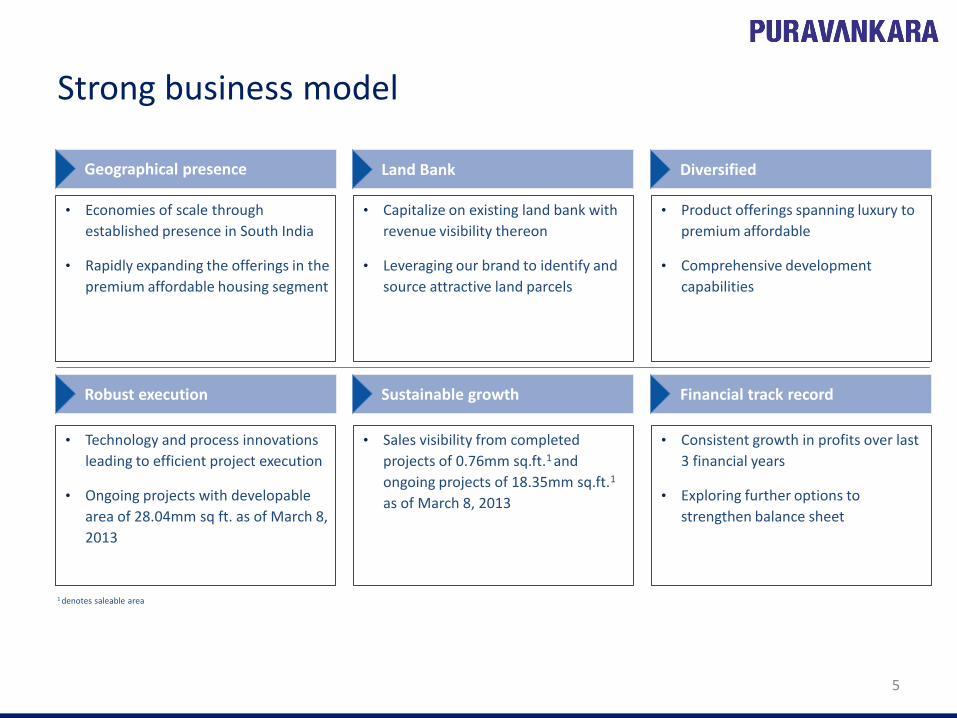
Strong business model
5
• Economies of scale through
established presence in South India
• Rapidly expanding the offerings in the
premium affordable housing segment
Land Bank Geographical presence Diversified
Robust execution Sustainable growth Financial track record
• Capitalize on existing land bank with
revenue visibility thereon
• Leveraging our brand to identify and
source attractive land parcels
• Product offerings spanning luxury to
premium affordable
• Comprehensive development
capabilities
• Technology and process innovations
leading to efficient project execution
• Ongoing projects with developable
area of 28.04mm sq ft. as of March 8,
2013
• Sales visibility from completed
projects of 0.76mm sq.ft.1 and
ongoing projects of 18.35mm sq.ft.1
as of March 8, 2013
• Consistent growth in profits over last
3 financial years
• Exploring further options to
strengthen balance sheet
1 denotes saleable area
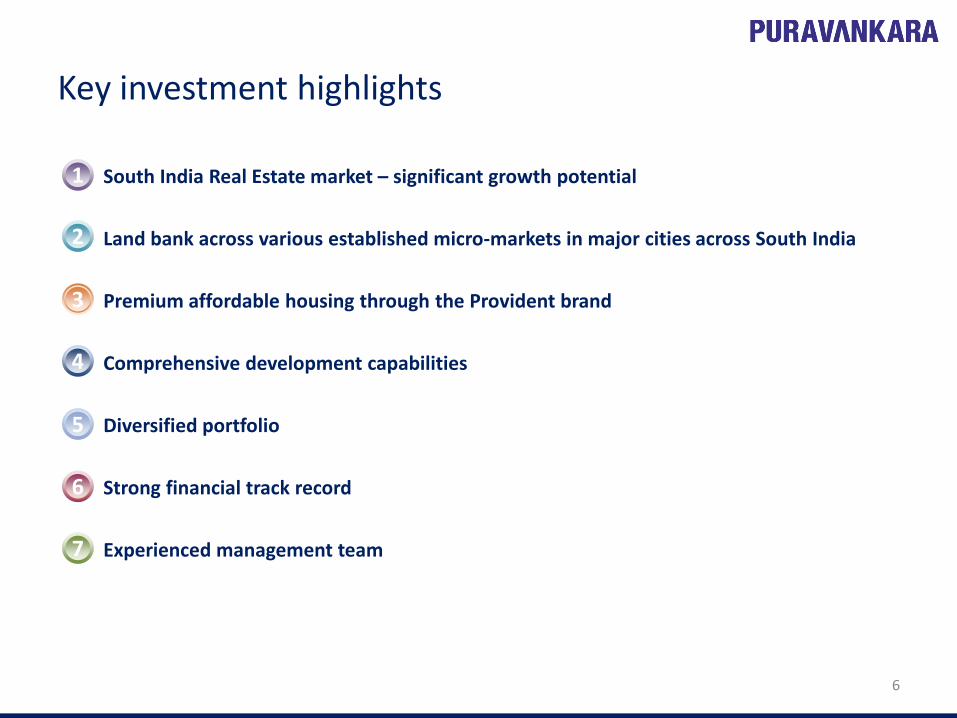
Key investment highlights
6
South India Real Estate market – significant growth potential
Land bank across various established micro-markets in major cities across South India
Premium affordable housing through the Provident brand
Comprehensive development capabilities
Diversified portfolio
Strong financial track record
Experienced management team
2 1
2 2
2 3
2 4
2 5
2 6
2 7
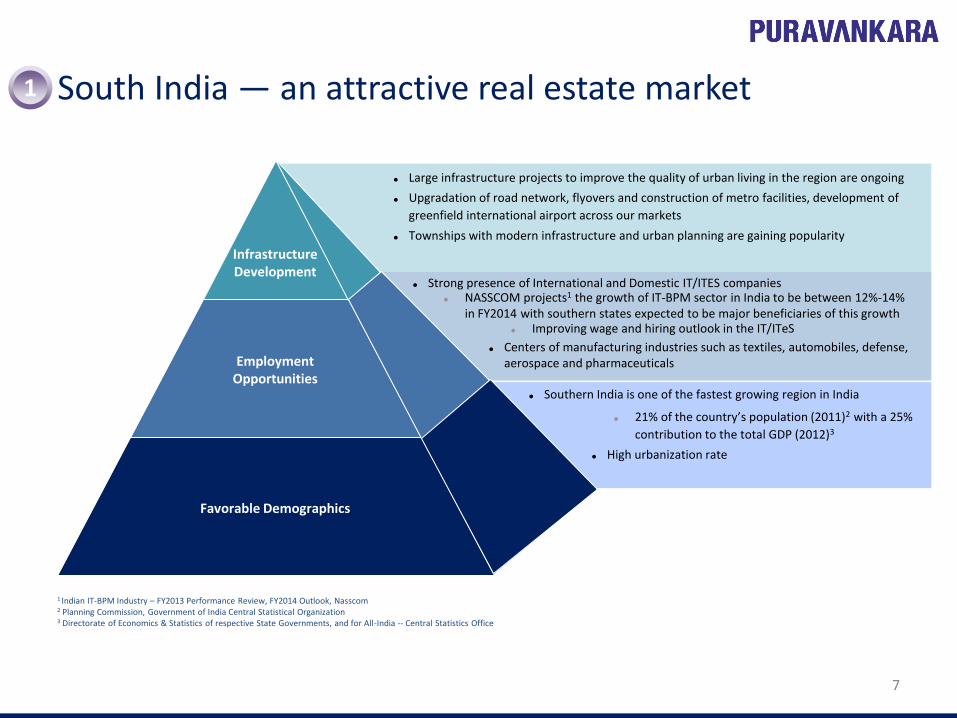
Large infrastructure projects to improve the quality of urban living in the region are ongoing
Upgradation of road network, flyovers and construction of metro facilities, development of
greenfield international airport across our markets
Townships with modern infrastructure and urban planning are gaining popularity
Improving wage and hiring outlook in the IT/ITeS
Centers of manufacturing industries such as textiles, automobiles, defense, aerospace and pharmaceuticals
21% of the country’s population (2011)2 with a 25%
contribution to the total GDP (2012)3
High urbanization rate
South India — an attractive real estate market
7
2 1
1 Indian IT-BPM Industry – FY2013 Performance Review, FY2014 Outlook, Nasscom
2 Planning Commission, Government of India Central Statistical Organization 3 Directorate of Economics & Statistics of respective State Governments, and for All-India -- Central Statistics Office
Favorable Demographics
Employment Opportunities
Infrastructure Development
Strong presence of International and Domestic IT/ITES companies NASSCOM projects1 the growth of IT-BPM sector in India to be between 12%-14%
in FY2014 with southern states expected to be major beneficiaries of this growth
Southern India is one of the fastest growing region in India
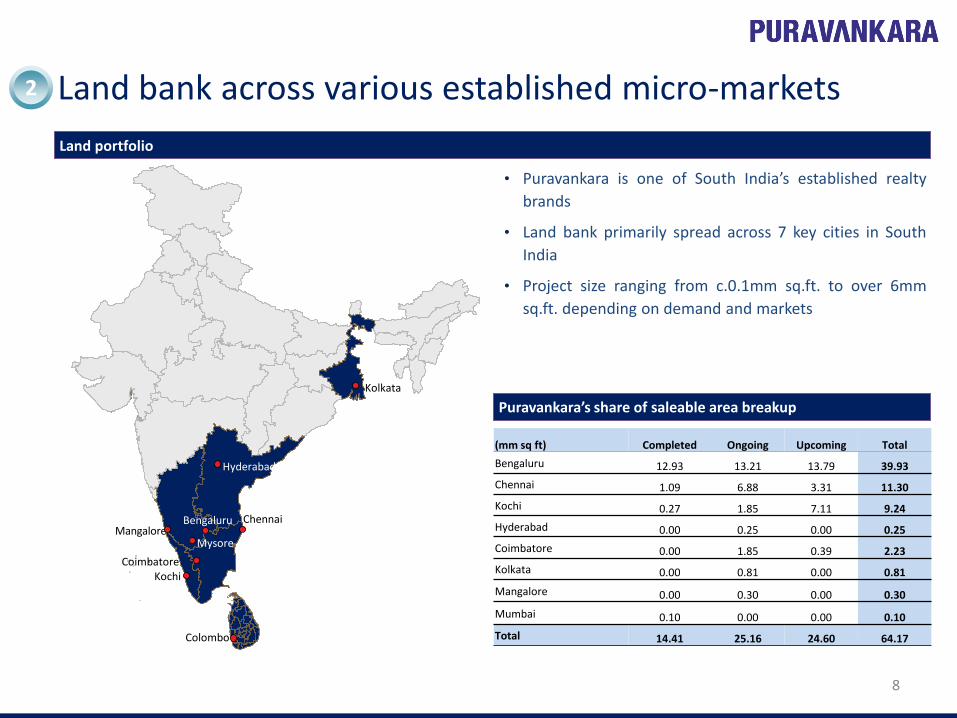
Land bank across various established micro-markets
8
2 2
Land portfolio
Coimbatore
Bengaluru Chennai Mangalore
Mysore
Colombo
Kochi
Hyderabad
Kolkata
• Puravankara is one of South India’s established realty
brands
• Land bank primarily spread across 7 key cities in South
India
• Project size ranging from c.0.1mm sq.ft. to over 6mm
sq.ft. depending on demand and markets
(mm sq ft) Completed Ongoing Upcoming Total
Bengaluru 12.93 13.21 13.79 39.93
Chennai 1.09 6.88 3.31 11.30
Kochi 0.27 1.85 7.11 9.24
Hyderabad 0.00 0.25 0.00 0.25
Coimbatore 0.00 1.85 0.39 2.23
Kolkata 0.00 0.81 0.00 0.81
Mangalore 0.00 0.30 0.00 0.30
Mumbai 0.10 0.00 0.00 0.10
Total 14.41 25.16 24.60 64.17
Puravankara’s share of saleable area breakup
Premium Affordable housing through Provident Brand
9
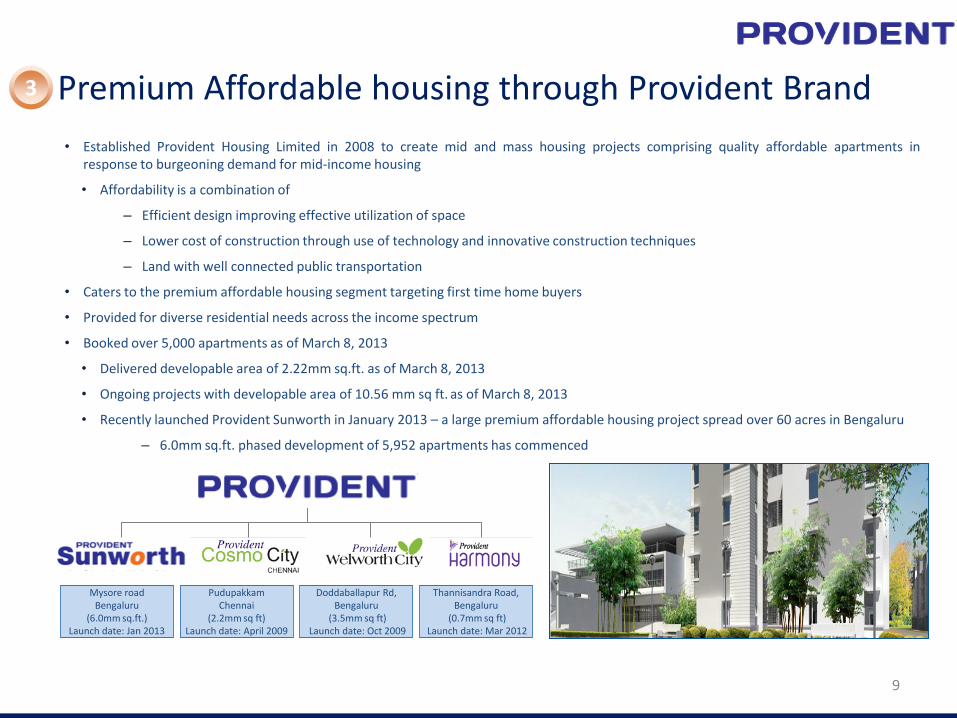
• Established Provident Housing Limited in 2008 to create mid and mass housing projects comprising quality affordable apartments in response to burgeoning demand for mid-income housing
• Affordability is a combination of
– Efficient design improving effective utilization of space
– Lower cost of construction through use of technology and innovative construction techniques
– Land with well connected public transportation
• Caters to the premium affordable housing segment targeting first time home buyers
• Provided for diverse residential needs across the income spectrum
• Booked over 5,000 apartments as of March 8, 2013
• Delivered developable area of 2.22mm sq.ft. as of March 8, 2013
• Ongoing projects with developable area of 10.56 mm sq ft. as of March 8, 2013
• Recently launched Provident Sunworth in January 2013 – a large premium affordable housing project spread over 60 acres in Bengaluru
– 6.0mm sq.ft. phased development of 5,952 apartments has commenced
Pudupakkam Chennai
(2.2mm sq ft) Launch date: April 2009
Doddaballapur Rd, Bengaluru
(3.5mm sq ft) Launch date: Oct 2009
Thannisandra Road, Bengaluru
(0.7mm sq ft) Launch date: Mar 2012
Mysore road Bengaluru
(6.0mm sq.ft.) Launch date: Jan 2013
2 3
Comprehensive development capabilities
10
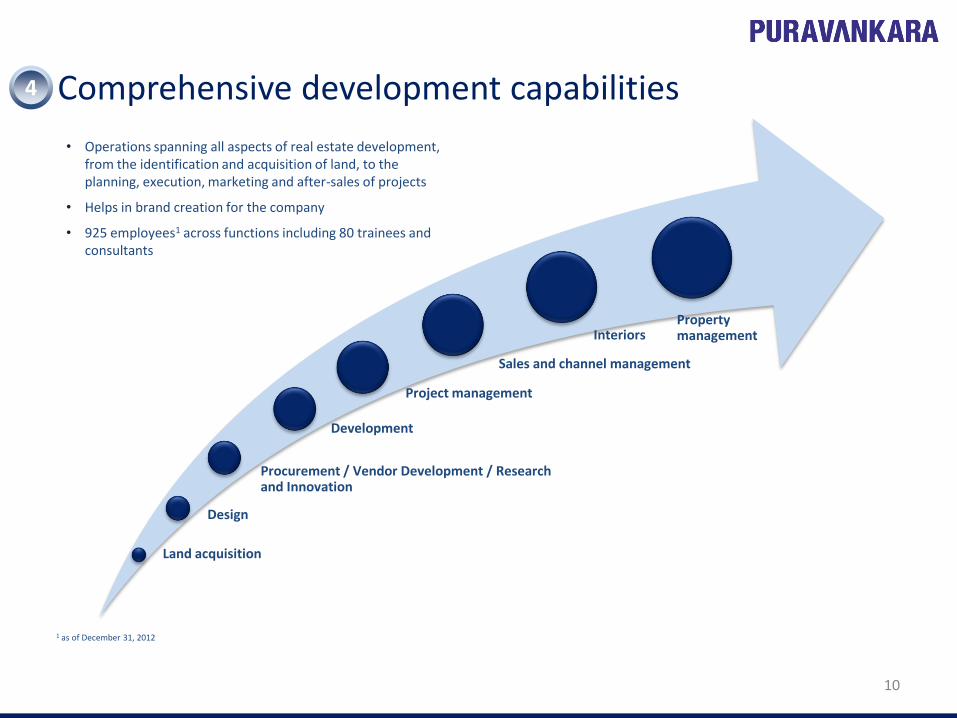
• Operations spanning all aspects of real estate development, from the identification and acquisition of land, to the planning, execution, marketing and after-sales of projects
• Helps in brand creation for the company
• 925 employees1 across functions including 80 trainees and consultants
1 as of December 31, 2012
2 4
Land acquisition
Development
Project management
Sales and channel management
Interiors Property management
Design
Procurement / Vendor Development / Research and Innovation
Diversified portfolio
11
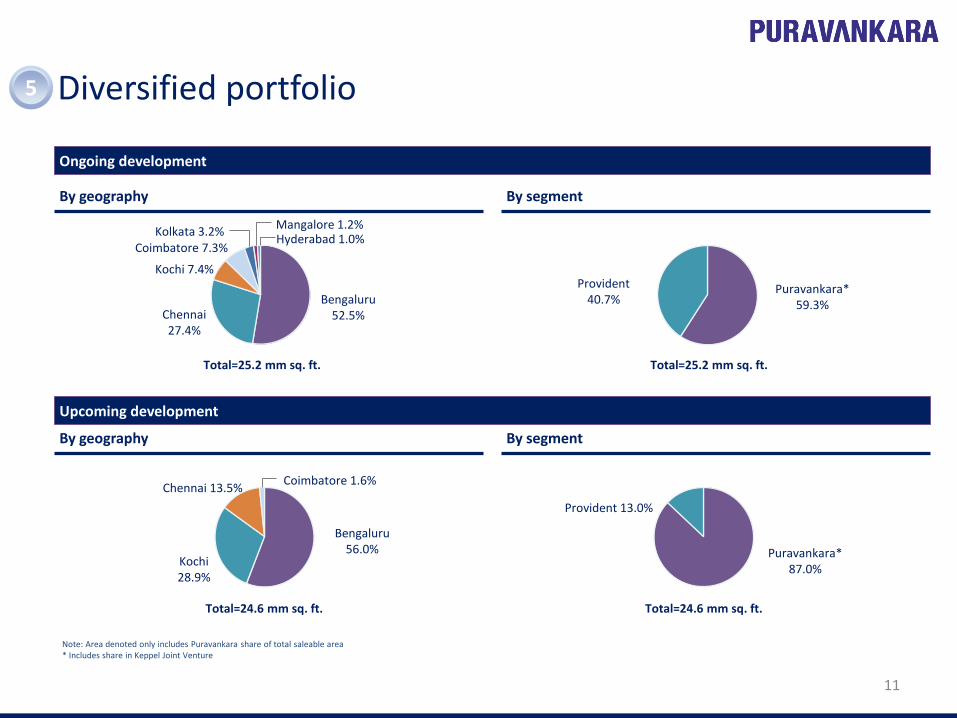
Ongoing development
By geography By segment
By geography By segment
Upcoming development
Bengaluru 52.5% Chennai
27.4%
Kochi 7.4%
Coimbatore 7.3% Kolkata 3.2%
Mangalore 1.2%
Total=25.2 mm sq. ft.
Puravankara* 59.3%
Provident 40.7%
Total=25.2 mm sq. ft.
Bengaluru 56.0%
Chennai 13.5%
Kochi 28.9%
Coimbatore 1.6%
Total=24.6 mm sq. ft.
Provident 13.0%
Puravankara* 87.0%
Total=24.6 mm sq. ft.
2 5
Note: Area denoted only includes Puravankara share of total saleable area * Includes share in Keppel Joint Venture
Hyderabad 1.0%
Summary financial performance
12
2 6
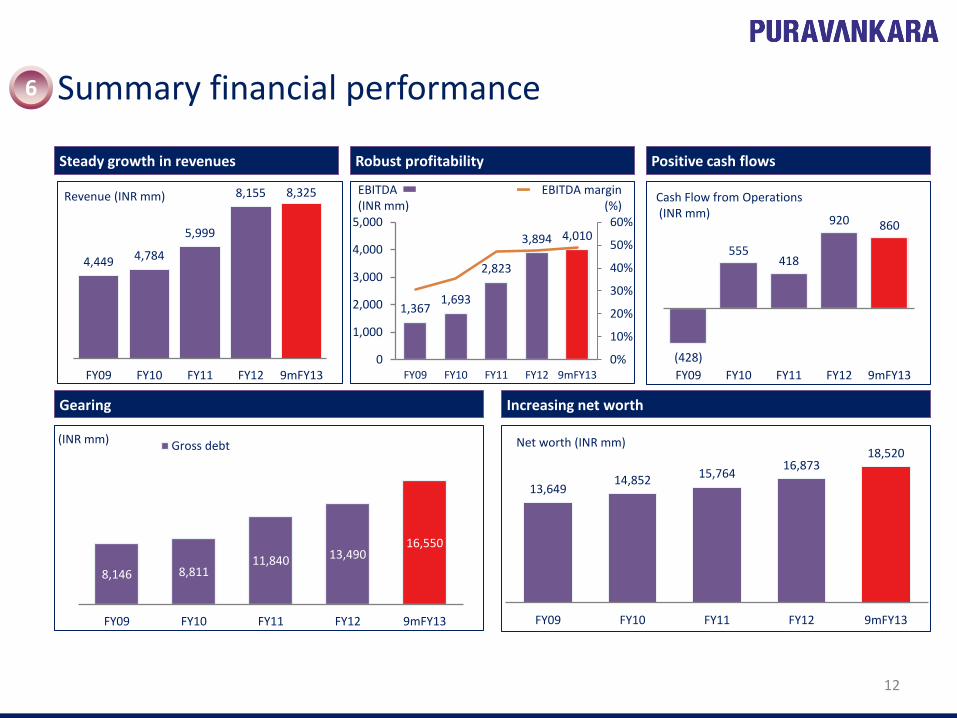
Steady growth in revenues Robust profitability Positive cash flows
4,449 4,784
5,999
8,155 8,325
FY09 FY10 FY11 FY12 9mFY13
Revenue (INR mm)
1,367 1,693
2,823
3,894 4,010
0%
10%
20%
30%
40%
50%
60%
0
1,000
2,000
3,000
4,000
5,000
FY09 FY10 FY11 FY12 9mFY13
(428)
555 418
920 860
FY09 FY10 FY11 FY12 9mFY13
EBITDA (INR mm)
EBITDA margin (%)
Cash Flow from Operations (INR mm)
Gearing Increasing net worth
8,146 8,811 11,840 13,490
16,550
FY09 FY10 FY11 FY12 9mFY13
Gross debt
13,649 14,852
15,764 16,873
18,520
FY09 FY10 FY11 FY12 9mFY13
Net worth (INR mm) (INR mm)
13
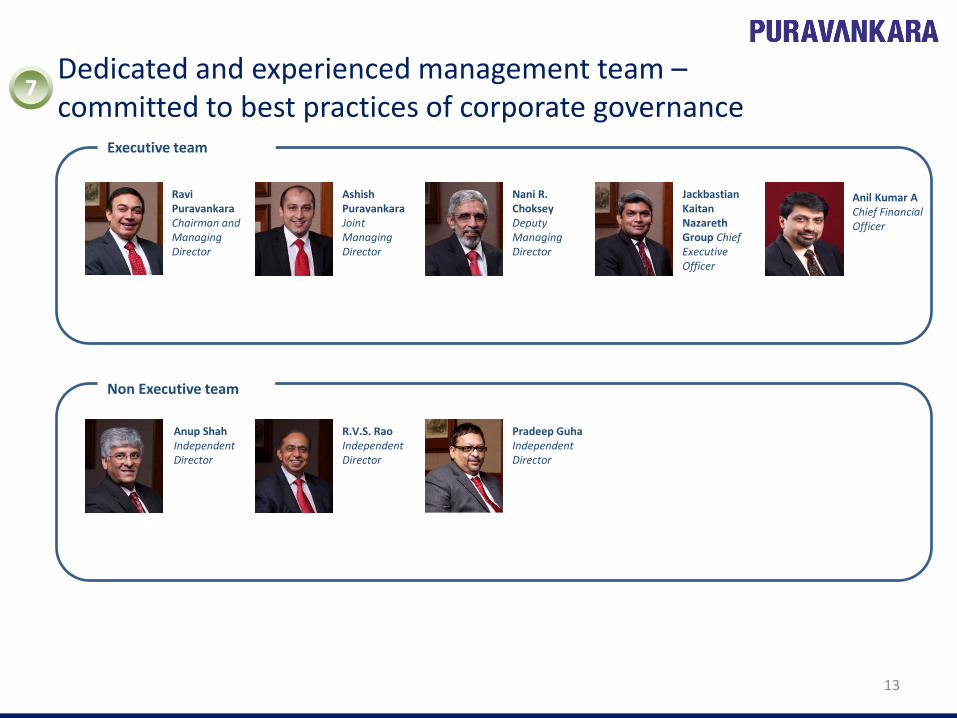
Dedicated and experienced management team – committed to best practices of corporate governance
2 7
Ravi Puravankara Chairman and Managing Director
Nani R. Choksey Deputy Managing Director
R.V.S. Rao Independent Director
Jackbastian Kaitan Nazareth Group Chief Executive Officer
Ashish Puravankara Joint Managing Director
Anup Shah Independent Director
Pradeep Guha Independent Director
Anil Kumar A Chief Financial Officer
Executive team
Non Executive team
14
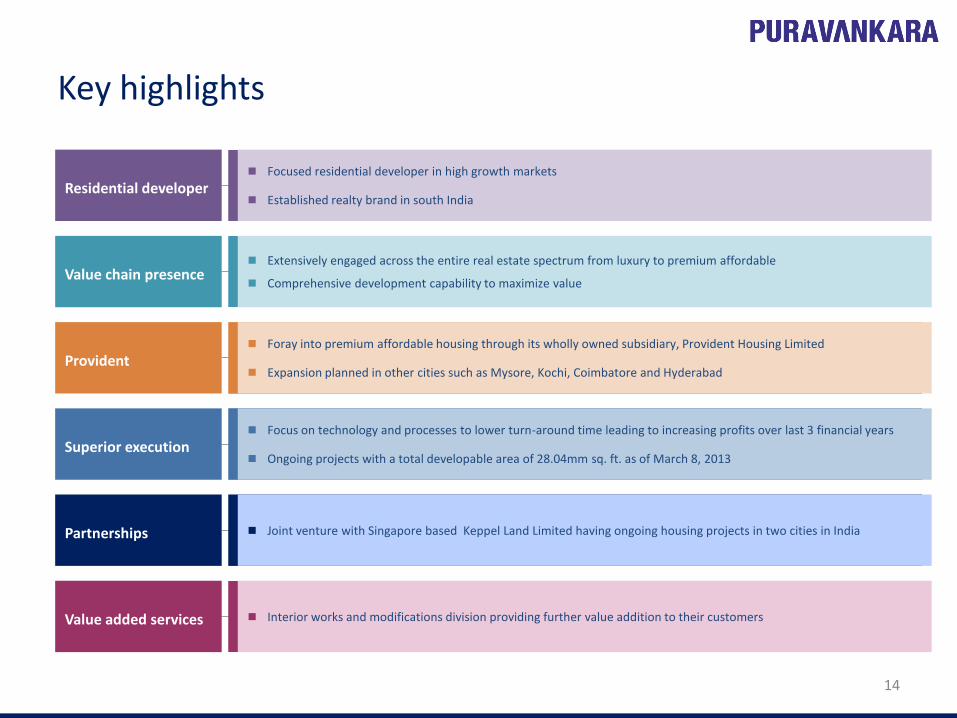
Key highlights
Residential developer
Value chain presence
Provident
Superior execution
Focused residential developer in high growth markets
Established realty brand in south India
Extensively engaged across the entire real estate spectrum from luxury to premium affordable
Comprehensive development capability to maximize value
Foray into premium affordable housing through its wholly owned subsidiary, Provident Housing Limited
Expansion planned in other cities such as Mysore, Kochi, Coimbatore and Hyderabad
Focus on technology and processes to lower turn-around time leading to increasing profits over last 3 financial years
Ongoing projects with a total developable area of 28.04mm sq. ft. as of March 8, 2013
Partnerships Joint venture with Singapore based Keppel Land Limited having ongoing housing projects in two cities in India
Value added services Interior works and modifications division providing further value addition to their customers
Corporate strategy
• Replenish land bank at strategic locations across south India
• Continue to enhance our brand and reputation by focusing on our execution capabilities and
delivering value to our customers
• Focus on the expansion of our premium affordable housing projects under our Provident brand
• Increase the scale of our operations
• Pursue project diversification
15
Appendix
• Project Details
• Historical Financial Information
• Awards and recognitions
• Project location map
• Select projects
16
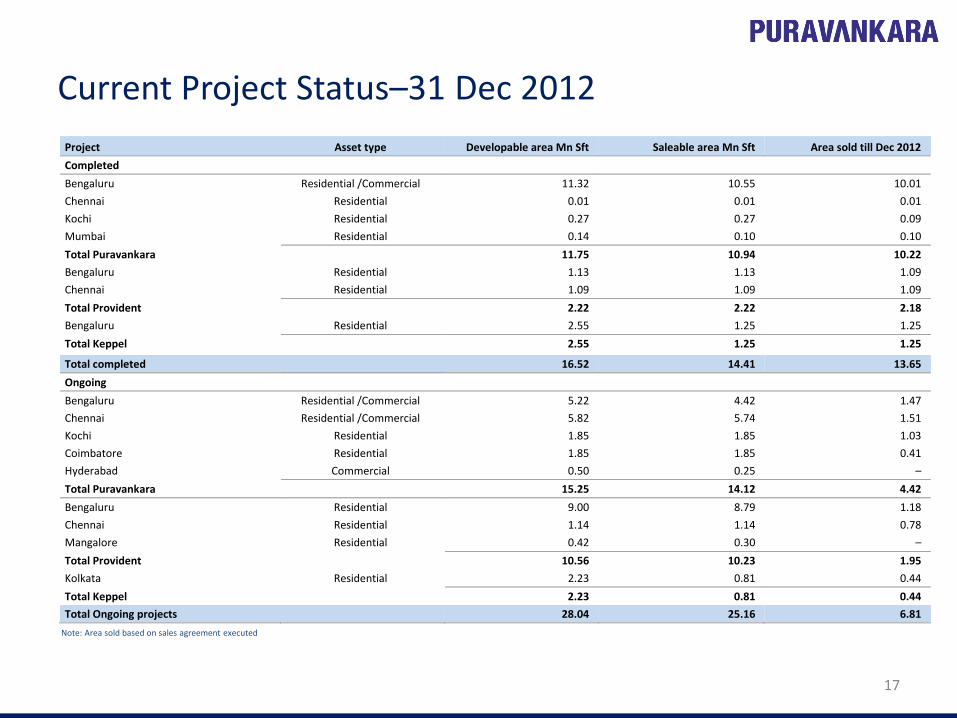
Current Project Status–31 Dec 2012
17
Note: Area sold based on sales agreement executed
Project Asset type Developable area Mn Sft Saleable area Mn Sft Area sold till Dec 2012
Completed
Bengaluru Residential /Commercial 11.32 10.55 10.01
Chennai Residential 0.01 0.01 0.01
Kochi Residential 0.27 0.27 0.09
Mumbai Residential 0.14 0.10 0.10
Total Puravankara 11.75 10.94 10.22
Bengaluru Residential 1.13 1.13 1.09
Chennai Residential 1.09 1.09 1.09
Total Provident 2.22 2.22 2.18
Bengaluru Residential 2.55 1.25 1.25
Total Keppel 2.55 1.25 1.25
Total completed 16.52 14.41 13.65
Ongoing
Bengaluru Residential /Commercial 5.22 4.42 1.47
Chennai Residential /Commercial 5.82 5.74 1.51
Kochi Residential 1.85 1.85 1.03
Coimbatore Residential 1.85 1.85 0.41
Hyderabad Commercial 0.50 0.25 –
Total Puravankara 15.25 14.12 4.42
Bengaluru Residential 9.00 8.79 1.18
Chennai Residential 1.14 1.14 0.78
Mangalore Residential 0.42 0.30 –
Total Provident 10.56 10.23 1.95
Kolkata Residential 2.23 0.81 0.44
Total Keppel 2.23 0.81 0.44
Total Ongoing projects 28.04 25.16 6.81
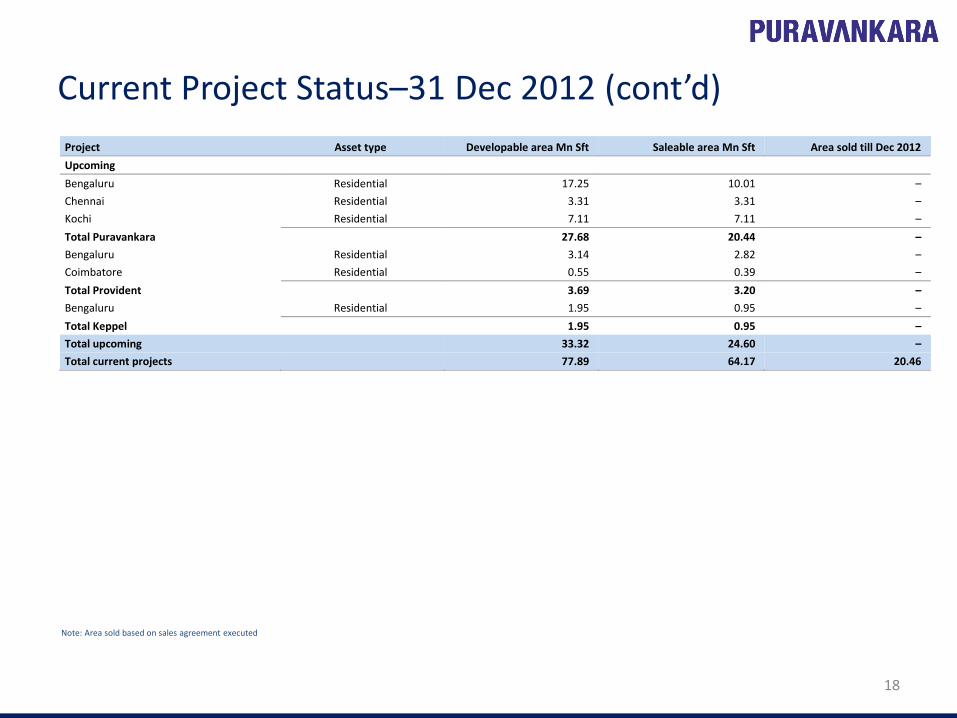
Current Project Status–31 Dec 2012 (cont’d)
18
Note: Area sold based on sales agreement executed
Project Asset type Developable area Mn Sft Saleable area Mn Sft Area sold till Dec 2012
Upcoming
Bengaluru Residential 17.25 10.01 –
Chennai Residential 3.31 3.31 –
Kochi Residential 7.11 7.11 –
Total Puravankara 27.68 20.44 –
Bengaluru Residential 3.14 2.82 –
Coimbatore Residential 0.55 0.39 –
Total Provident 3.69 3.20 –
Bengaluru Residential 1.95 0.95 –
Total Keppel 1.95 0.95 –
Total upcoming 33.32 24.60 –
Total current projects 77.89 64.17 20.46
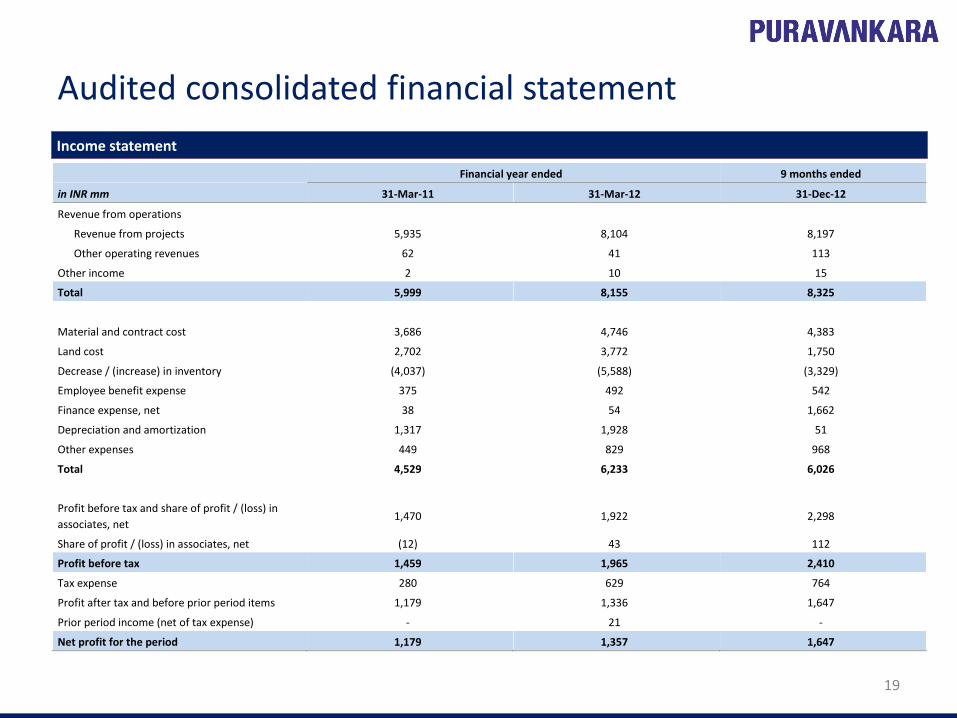
Audited consolidated financial statement
19
Income statement
Financial year ended 9 months ended
in INR mm 31-Mar-11 31-Mar-12 31-Dec-12
Revenue from operations
Revenue from projects 5,935 8,104 8,197
Other operating revenues 62 41 113
Other income 2 10 15
Total 5,999 8,155 8,325
A
Material and contract cost 3,686 4,746 4,383
Land cost 2,702 3,772 1,750
Decrease / (increase) in inventory (4,037) (5,588) (3,329)
Employee benefit expense 375 492 542
Finance expense, net 38 54 1,662
Depreciation and amortization 1,317 1,928 51
Other expenses 449 829 968
Total 4,529 6,233 6,026
A
Profit before tax and share of profit / (loss) in
associates, net 1,470 1,922 2,298
Share of profit / (loss) in associates, net (12) 43 112
Profit before tax 1,459 1,965 2,410
Tax expense 280 629 764
Profit after tax and before prior period items 1,179 1,336 1,647
Prior period income (net of tax expense) - 21 -
Net profit for the period 1,179 1,357 1,647
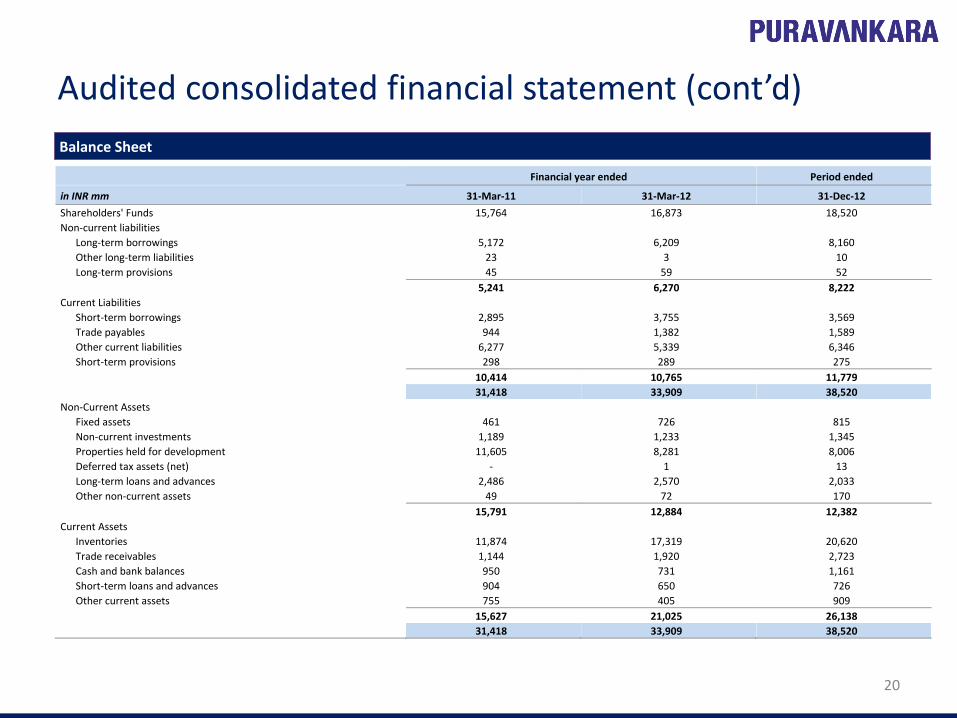
Audited consolidated financial statement (cont’d)
20
Balance Sheet
Financial year ended Period ended
in INR mm 31-Mar-11 31-Mar-12 31-Dec-12
Shareholders' Funds 15,764 16,873 18,520
Non-current liabilities
Long-term borrowings 5,172 6,209 8,160
Other long-term liabilities 23 3 10
Long-term provisions 45 59 52
5,241 6,270 8,222
Current Liabilities
Short-term borrowings 2,895 3,755 3,569
Trade payables 944 1,382 1,589
Other current liabilities 6,277 5,339 6,346
Short-term provisions 298 289 275
10,414 10,765 11,779
31,418 33,909 38,520
Non-Current Assets
Fixed assets 461 726 815
Non-current investments 1,189 1,233 1,345
Properties held for development 11,605 8,281 8,006
Deferred tax assets (net) - 1 13
Long-term loans and advances 2,486 2,570 2,033
Other non-current assets 49 72 170
15,791 12,884 12,382
Current Assets
Inventories 11,874 17,319 20,620
Trade receivables 1,144 1,920 2,723
Cash and bank balances 950 731 1,161
Short-term loans and advances 904 650 726
Other current assets 755 405 909
15,627 21,025 26,138
31,418 33,909 38,520
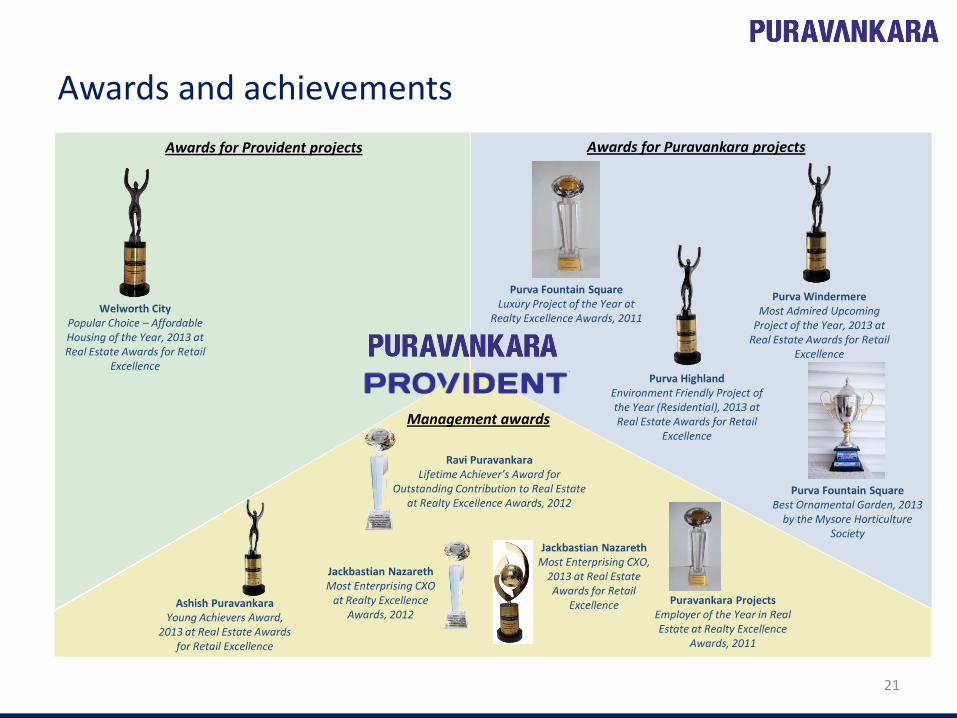
Awards and achievements
21
Ashish Puravankara Young Achievers Award,
2013 at Real Estate Awards for Retail Excellence
Purva Highland Environment Friendly Project of the Year (Residential), 2013 at Real Estate Awards for Retail
Excellence
Purva Windermere Most Admired Upcoming
Project of the Year, 2013 at Real Estate Awards for Retail
Excellence
Welworth City Popular Choice – Affordable Housing of the Year, 2013 at Real Estate Awards for Retail
Excellence
Purva Fountain Square Luxury Project of the Year at
Realty Excellence Awards, 2011
Puravankara Projects Employer of the Year in Real Estate at Realty Excellence
Awards, 2011
Purva Fountain Square Best Ornamental Garden, 2013
by the Mysore Horticulture Society
Management awards
Awards for Puravankara projects Awards for Provident projects
Jackbastian Nazareth Most Enterprising CXO,
2013 at Real Estate Awards for Retail
Excellence
Ravi Puravankara Lifetime Achiever’s Award for
Outstanding Contribution to Real Estate at Realty Excellence Awards, 2012
Jackbastian Nazareth Most Enterprising CXO
at Realty Excellence Awards, 2012
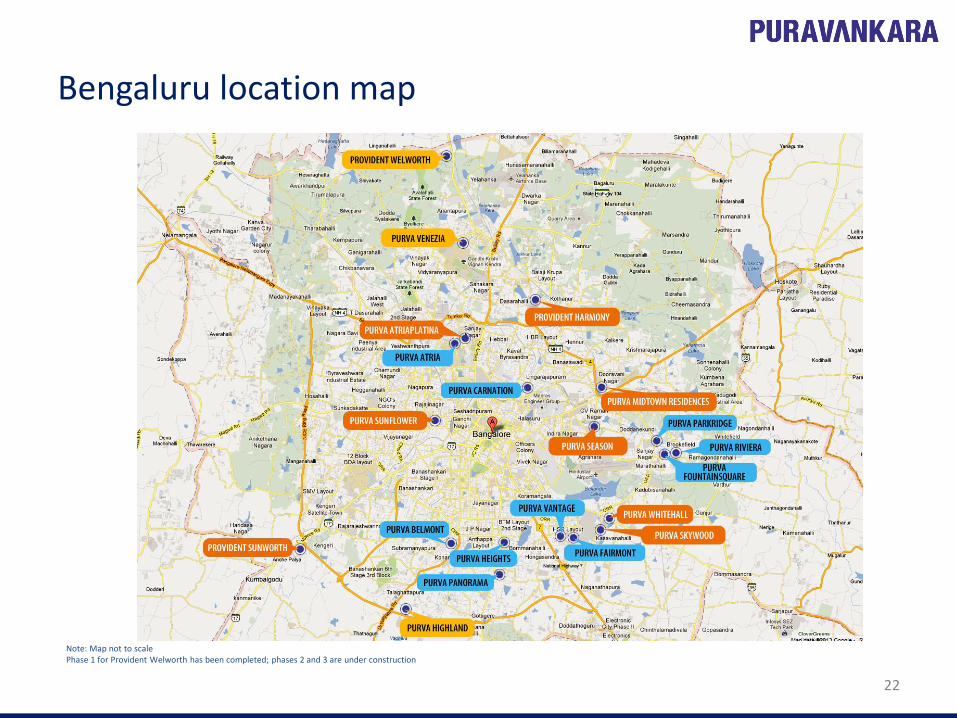
Bengaluru location map
22
Note: Map not to scale Phase 1 for Provident Welworth has been completed; phases 2 and 3 are under construction
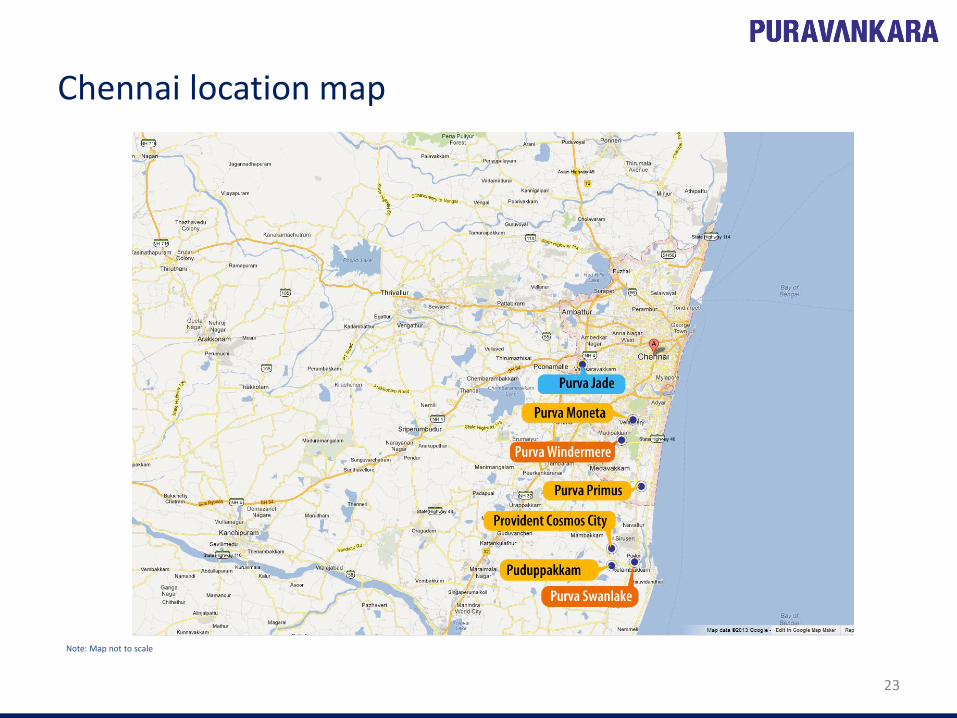
Chennai location map
23
Note: Map not to scale
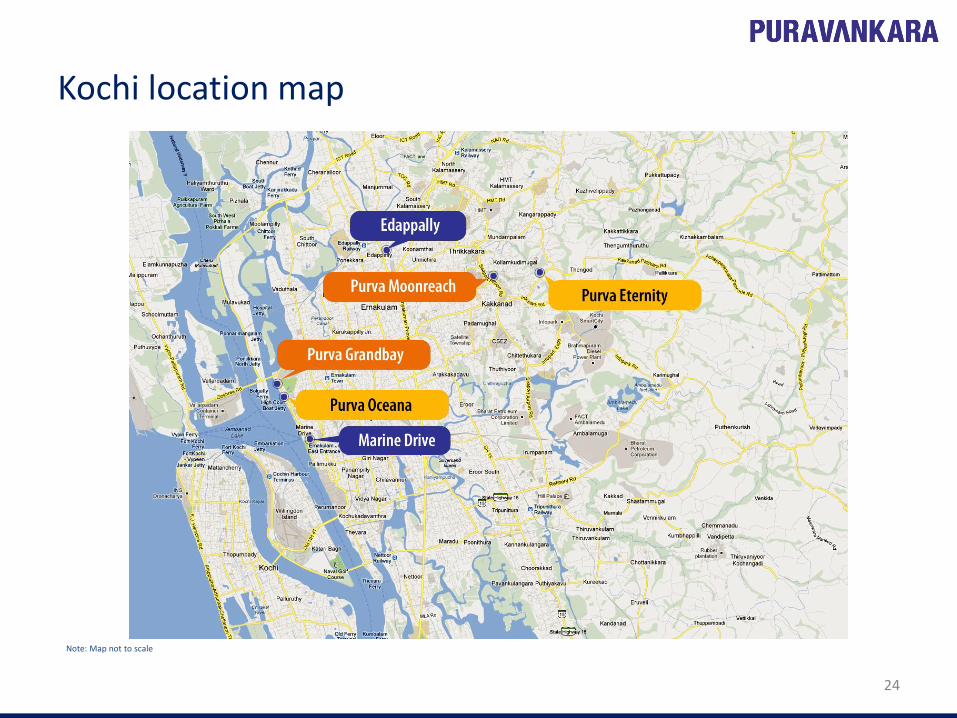
Kochi location map
24
Note: Map not to scale
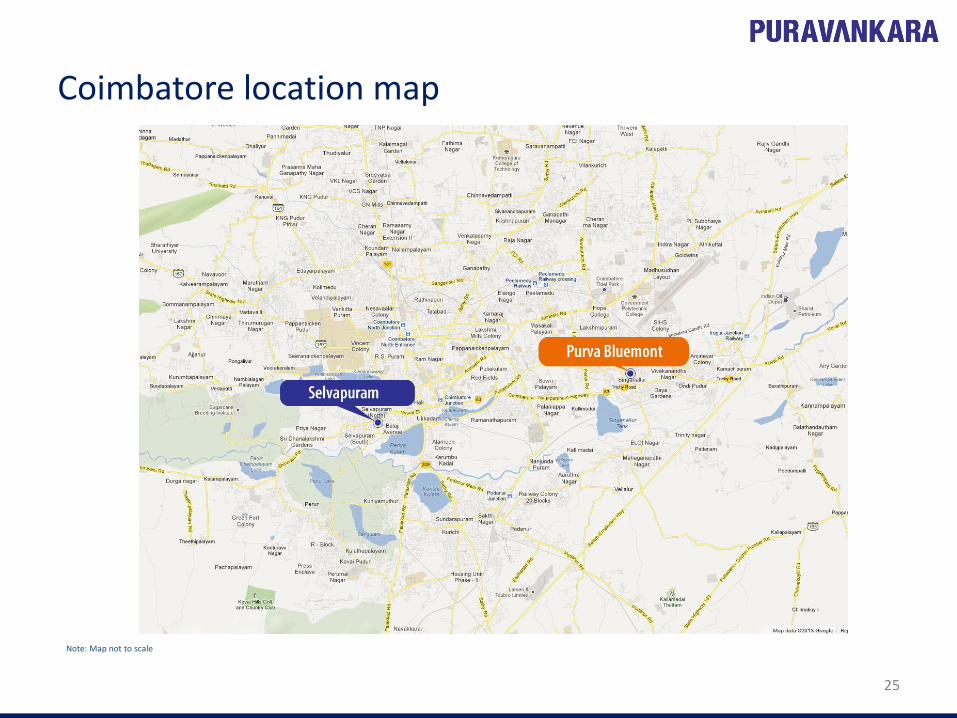
Coimbatore location map
25
Note: Map not to scale
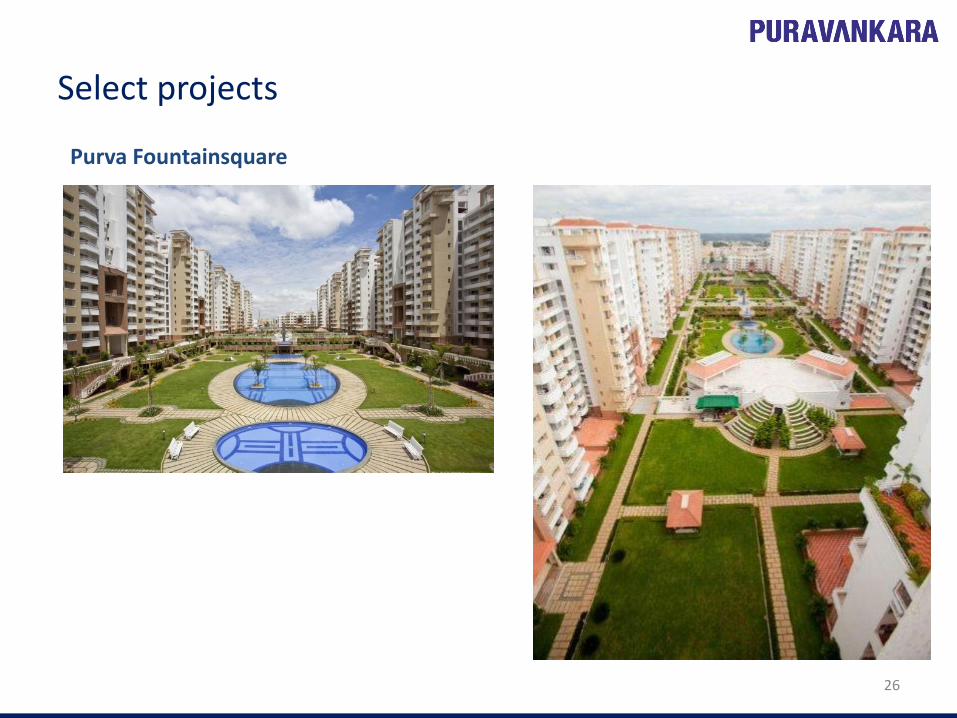
Select projects
26
Purva Fountainsquare
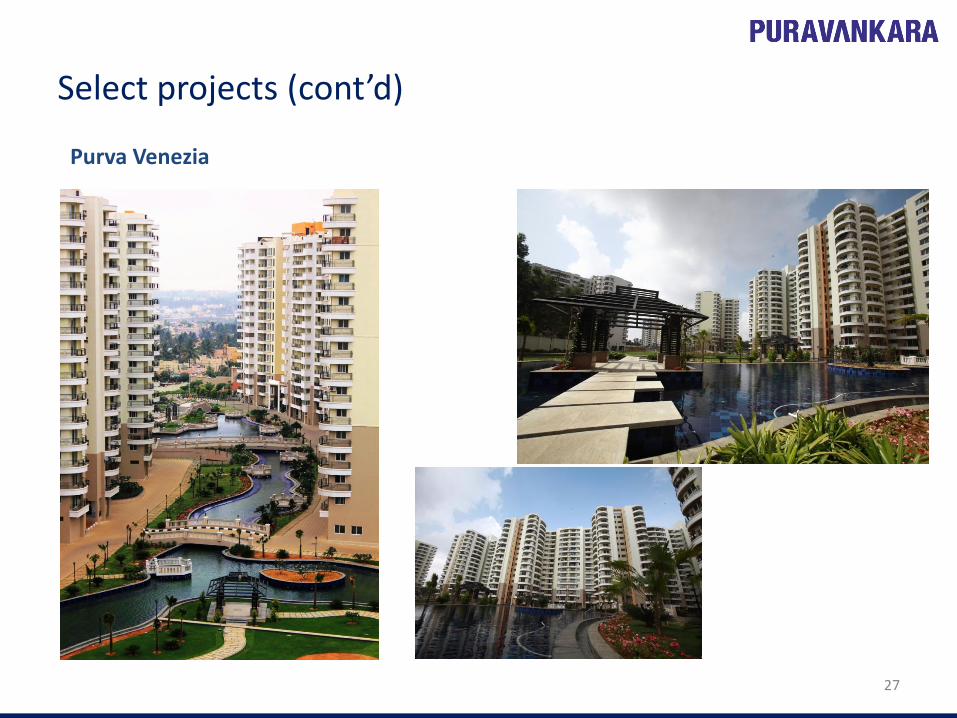
Select projects (cont’d)
27
Purva Venezia
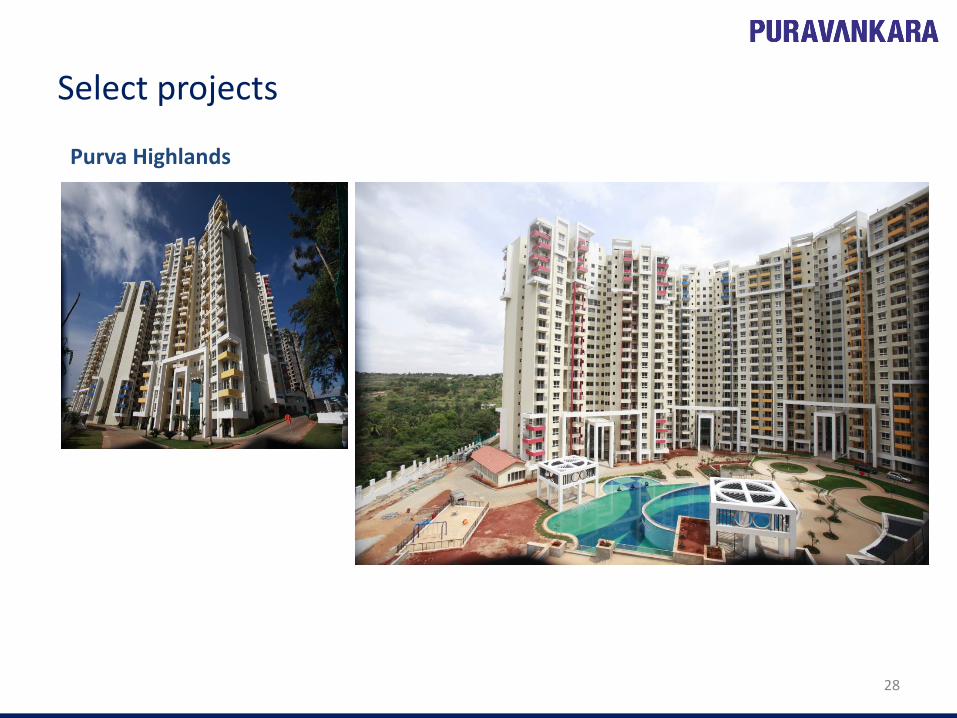
Select projects
28
Purva Highlands
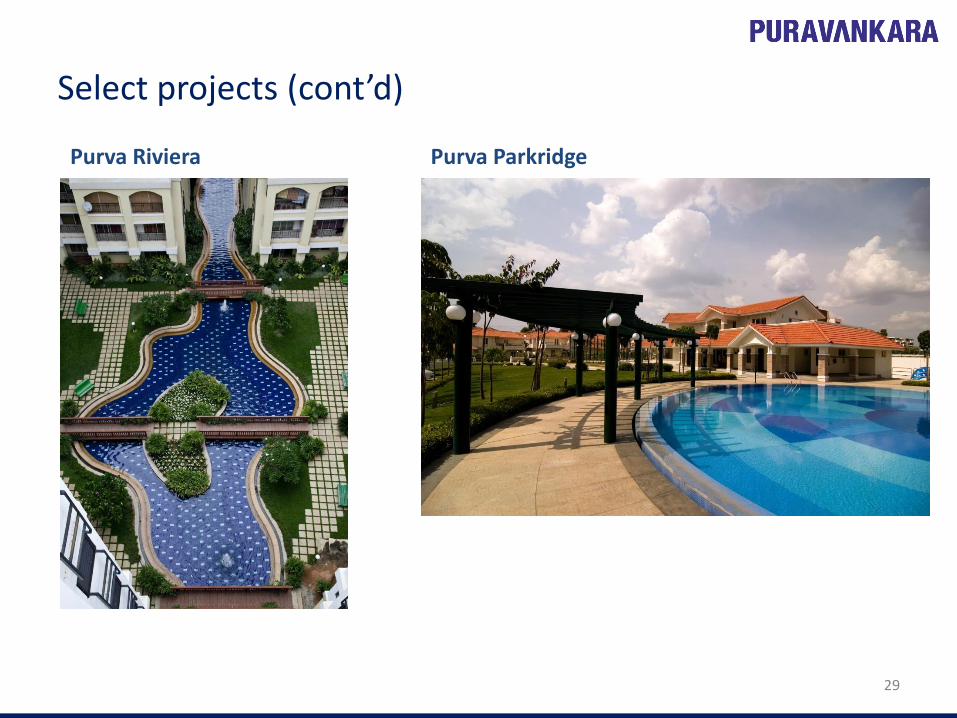
Select projects (cont’d)
29
Purva Riviera Purva Parkridge
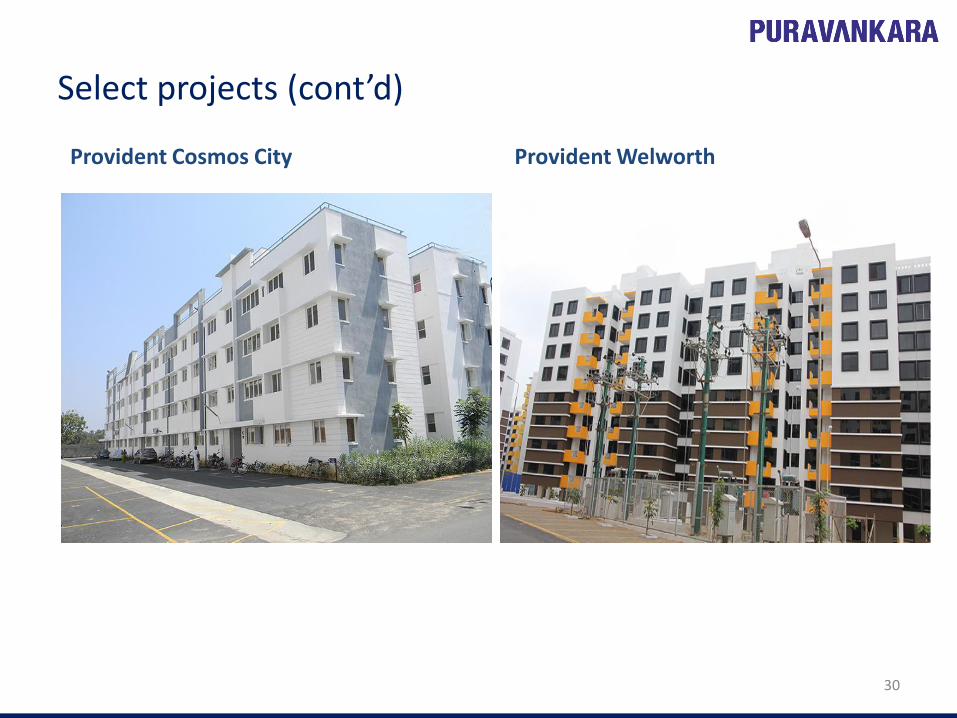
Select projects (cont’d)
30
Provident Cosmos City Provident Welworth
THANK YOU Puravankara Projects Limited
130/1, Ulsoor Road,
Bengaluru - 560042
Tel: 080-25599000/43439999
31