Pump Ratio and Performance Charts Concept and Theory Ratio and... · Pump Ratio and Performance...
23
Graco, Inc. P.O. Box 1441 Minneapolis, MN 55440-1441 ©1996 Graco Inc. Form No. 321-042 1/96 Rev 2 SL Training 11/14 Pump Ratio and Performance Charts Concept and Theory
Transcript of Pump Ratio and Performance Charts Concept and Theory Ratio and... · Pump Ratio and Performance...
Graco, Inc. P.O. Box 1441 Minneapolis, MN 55440-1441 ©1996 Graco Inc. Form No. 321-042 1/96 Rev 2 SL Training 11/14
Pump Ratio and Performance Charts Concept and Theory
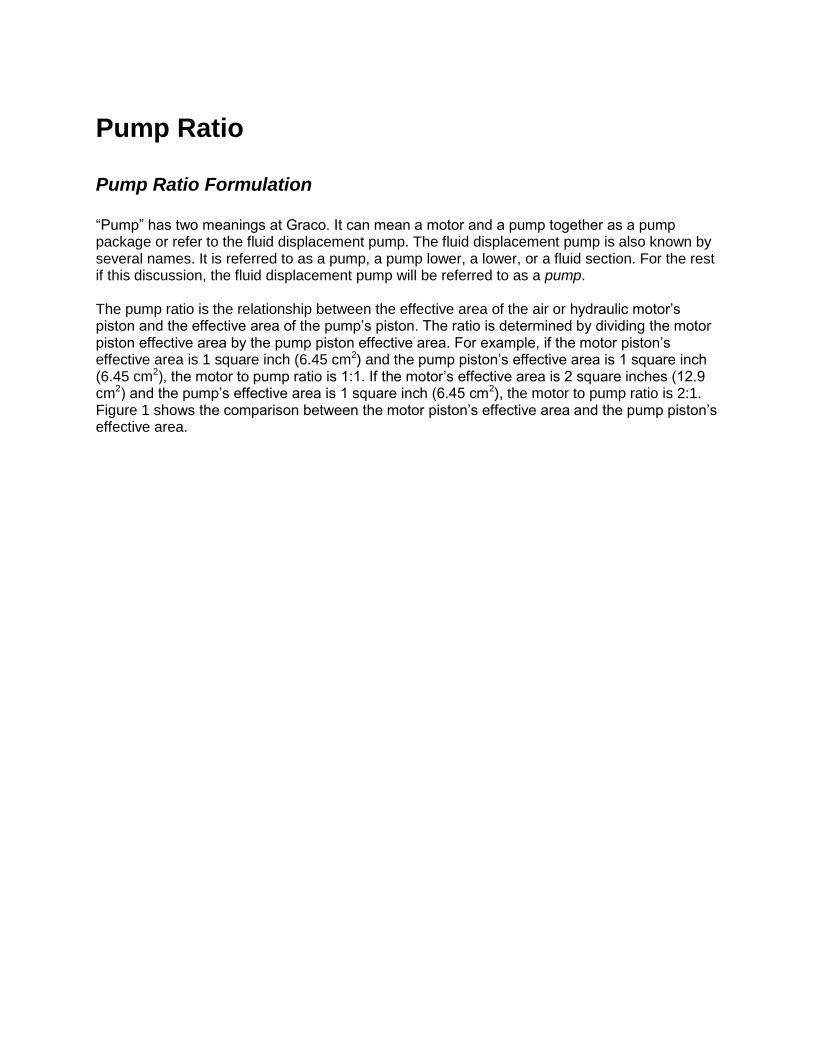
Pump Ratio Pump Ratio Formulation “Pump” has two meanings at Graco. It can mean a motor and a pump together as a pump package or refer to the fluid displacement pump. The fluid displacement pump is also known by several names. It is referred to as a pump, a pump lower, a lower, or a fluid section. For the rest if this discussion, the fluid displacement pump will be referred to as a pump. The pump ratio is the relationship between the effective area of the air or hydraulic motor’s piston and the effective area of the pump’s piston. The ratio is determined by dividing the motor piston effective area by the pump piston effective area. For example, if the motor piston’s effective area is 1 square inch (6.45 cm2) and the pump piston’s effective area is 1 square inch (6.45 cm2), the motor to pump ratio is 1:1. If the motor’s effective area is 2 square inches (12.9 cm2) and the pump’s effective area is 1 square inch (6.45 cm2), the motor to pump ratio is 2:1. Figure 1 shows the comparison between the motor piston’s effective area and the pump piston’s effective area.
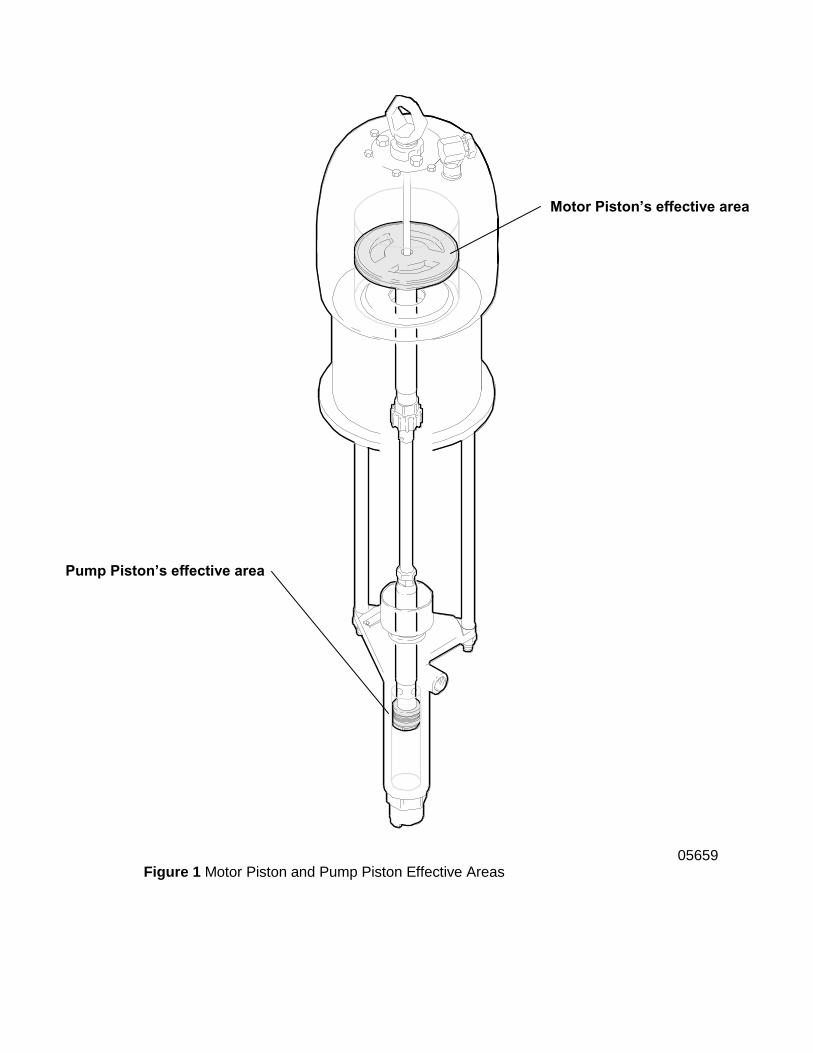
05659 Figure 1 Motor Piston and Pump Piston Effective Areas
Pump Piston’s effective area
Motor Piston’s effective area
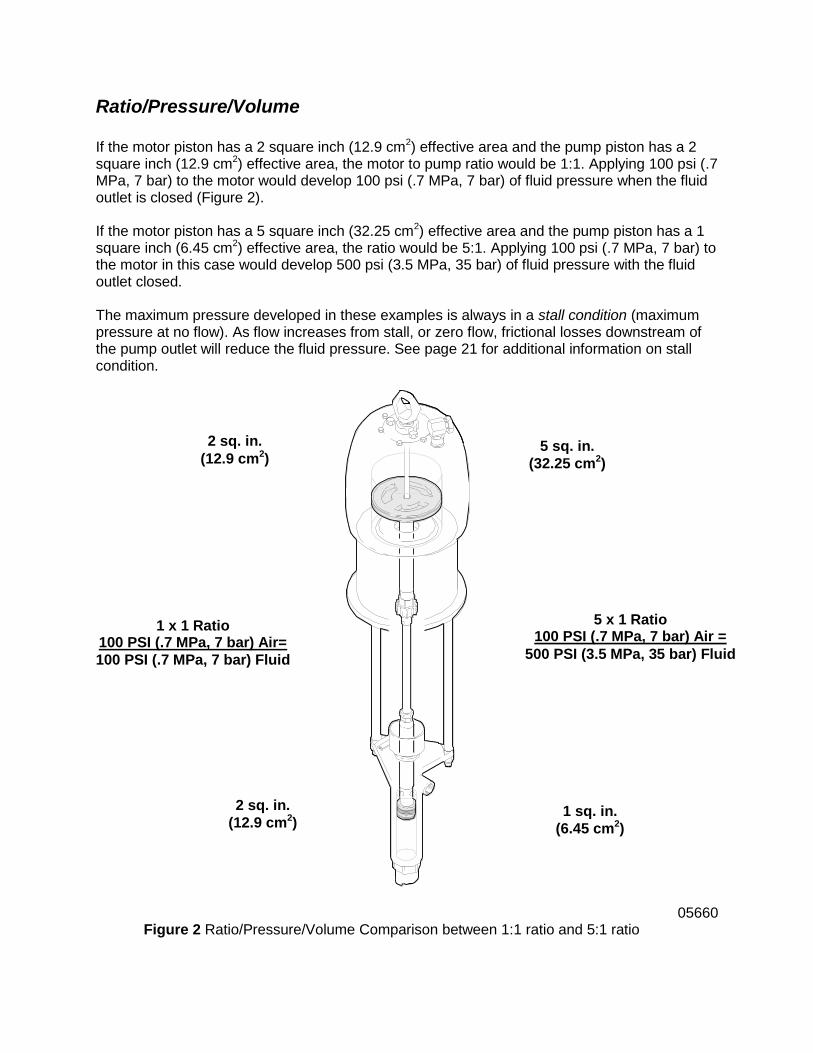
Ratio/Pressure/Volume If the motor piston has a 2 square inch (12.9 cm2) effective area and the pump piston has a 2 square inch (12.9 cm2) effective area, the motor to pump ratio would be 1:1. Applying 100 psi (.7 MPa, 7 bar) to the motor would develop 100 psi (.7 MPa, 7 bar) of fluid pressure when the fluid outlet is closed (Figure 2). If the motor piston has a 5 square inch (32.25 cm2) effective area and the pump piston has a 1 square inch (6.45 cm2) effective area, the ratio would be 5:1. Applying 100 psi (.7 MPa, 7 bar) to the motor in this case would develop 500 psi (3.5 MPa, 35 bar) of fluid pressure with the fluid outlet closed. The maximum pressure developed in these examples is always in a stall condition (maximum pressure at no flow). As flow increases from stall, or zero flow, frictional losses downstream of the pump outlet will reduce the fluid pressure. See page 21 for additional information on stall condition.
05660 Figure 2 Ratio/Pressure/Volume Comparison between 1:1 ratio and 5:1 ratio
2 sq. in.
(12.9 cm2)
1 x 1 Ratio 100 PSI (.7 MPa, 7 bar) Air=
100 PSI (.7 MPa, 7 bar) Fluid
2 sq. in.
(12.9 cm2)
5 sq. in.
(32.25 cm2)
5 x 1 Ratio 100 PSI (.7 MPa, 7 bar) Air =
500 PSI (3.5 MPa, 35 bar) Fluid
1 sq. in.
(6.45 cm2)

Pressure vs. Volume – Same Air Motor When using the same air motor with different pumps the ratio will change. If the ratio goes up the flow will decrease. If the ratio goes down the flow will increase. Figure 3 illustrates this relationship.
05661 Figure 3 Same air motor with different pumps For example, a pump and motor with a 5:1 ratio at maximum air pressure of 100 psi (.7 MPa, 7 bar) will result in a maximum fluid pressure of 500 psi (3.5 MPa, 35 bar) and a flow volume of 15 gpm (56.77 lpm) at 60 cycles per minute or ¼ gpm (.941 lpm) per cycle). Note: Liters Per Minute, lpm, may also be abbreviated as l/min. Whereas the same motor and a smaller pump that has a 10:1 ratio, will produce a 1000 psi (7 MPa, 70 bar) maximum fluid pressure and a flow volume of 7.5 gpm (28.38 lpm) at 60 cycles per minute, or 1/8 gpm (.12 lpm) per cycle, at a maximum inlet air pressure of 100 psi (.7 MPa, 7 bar). A motor has a finite amount of power available, you can use it to develop maximum flow at low pressure. You can use it to develop maximum pressure at no flow, or some balance of the two.
3:1 5:1 10:1 30:1

Pressure vs. Volume – Same Pump Lower Assembly When you change motors and keep the same pump you will change the ratio and the pressure. A larger motor will increase the ratio and the pressure. A smaller motor will reduce the ratio and the pressure. Figure 4 illustrates this relationship. Note: As long as the cycle rate does not change, the flow rate will not change. For example, the 20:1 Bulldog pump has an air motor diameter of 7 inches (17.78 cm). At 120 psi (.85 MPa, 8.5 bar) maximum air pressure, the fluid pressure will be 2400 (16.8 MPa, 168 bar) and the flow volume will be 8.1 oz. (230 g) per cycle. Whereas the 45:1 King pump, which has an air motor diameter of 10 inches (25.40 cm) and the exact same pump as the 20:1 Bulldog, will produce a fluid pressure of 4050 psi (28.35 MPa, 283.5 bar) and a flow volume of 8.5 oz. (241 g) per cycle at a maximum inlet air pressure of 90 psi (.63 MPa, 6.3 bar). When the size of the air motor changes, the amount of power available also changes. And since the flow volume output does not change, the fluid pressure must.

05662 Figure 4 Same pump with different air motors
Bulldog Air Motor 7 inch (17.78 cm) diameter
King Air Motor 10 inch (25.40 cm)
diameter
20:1
45:1
Air vs. Hydraulic Ratios Air and hydraulic ratios work exactly the same way. The only difference is that hydraulic pressures are much higher and the ratio of motor to pump is much lower. Air compressor systems typically operate with pressures up to 100 psi (.7 MPa, 7 bar), while hydraulic power systems operate with pressures up to 1500 psi (10.5 MPa, 105 bar). So to achieve similar pump pressures the effective surface area of the hydraulic motor will be much smaller than the effective surface area of the air motor. Typically, a 10:1 air motor/pump combination is equivalent to a 1:1 hydraulic motor/pump combination because typical hydraulic pressure is 1000 psi (7 MPa, 70 bar) and typical air pressure to 100 psi (.7 MPa, 7 bar). In this example, both the air powered and hydraulic systems have an identical pump. The required outlet fluid pressure for each system is 1000 psi (7 MPa, 70 bar). With an air compressor supplying 100 psi (.7 MPa, 7 bar) to the air motor, a 10:1 pump ratio would be necessary to deliver a 1000 psi (7 MPa, 70 bar) outlet pressure. Whereas a hydraulic system supplying 1000 psi (7 MPa, 70 bar) to the hydraulic motor, would only require a 1:1 pump ratio to deliver 1000 psi (7 MPa, 70 bar). In this example, if the effectiveness surface of the pump is 1 square inch (6.45 cm2), the air motor’s effective surface area is 10 square inches (64.5 cm2) and the hydraulic motor’s effective surface area is 1 square inch (6.45 cm2).
Progress Check Directions: After answering the following questions, compare your answers with those provided in the answer key following the progress check. If you respond to any items incorrectly, return to the text and review the appropriate topics.
1. Explain the term “pump ratio”.
______________________________________________________________________
______________________________________________________________________
______________________________________________________________________
______________________________________________________________________
______________________________________________________________________
2. If the pump ratio is 5:1 and the motor piston’s effective area is 10 square inches (64.5
cm2), the effective area of the pump is _____ square inches (_____ cm2).
a. 50 (322.5)
b. 2 (12.9)
c. 1 (6.45
d. 10 (64.5)
e. 5 (32.25)
3. If the pump ratio is ¼:1 and the motor piston’s effective area is 1 square inch (6.45 cm2),
the effective area of the pump is _____ square inches (_____cm2).
a. 4 (25.8)
b. ¼ (1.61)
c. ¾ (4.84)
d. 3 (19.35)
e. 14 (90.3)
4. If the pump ratio is 20:1 and the pump’s effective area is ¼ square inch (1.61 cm2), the
effective area of the motor piston is _____ square inches (_____cm2).
a. 20 (129)
b. 15 (96.75)
c. 5 (32.25)
d. 1 (6.45)
e. ¼ (1.61)

5. If the motor piston has a 2 square inch (12.9 cm2) effective area and the pump piston
has a 2 square inch (12.9 cm2) effective area, the pump ratio would be 2:2. Applying 100
psi (.7 MPa, 7 bar) to the motor would develop 200 psi (1.4 MPa, 14 bar) of fluid
pressure when the fluid outlet is covered.
a. True
b. False
6. Select the correct statement.
When using the same air motor with different pumps:
a. If the ratio goes up, the flow will increase. If the ratio goes down, the flow will
decrease.
b. If the ratio goes up, the flow will decrease. If the ratio goes down the flow will
increase.
c. The flow will always stay the same regardless of the ratio.
d. Ratios do not change.
7. Select the correct statement.
When you change the motors and keep the same pump:
a. A larger motor will increase the ratio and the pressure. A smaller motor will
decrease the ratio and the pressure.
b. A larger motor will decrease the ratio and the pressure. A smaller motor will
increase the ratio and the pressure.
c. A larger motor will increase the ratio and a smaller motor will decrease the ratio,
but the pressure will always stay the same.
d. A larger motor will decrease the ratio and a smaller motor will increase the ratio,
but the pressure will always stay the same.
8. Typically, a __________ air pump ratio is equivalent to a 1:1 hydraulic pump ratio.
a. 20:1
b. 5:1
c. ½:1
d. 10:1

Answers to Progress Check
1. Pump ratio is the relationship between the air or hydraulic motor piston’s effective area
and the pump piston’s effective area.
2. B. 2 (12.9)
3. A. 4 (25.8)
4. C. 5 (32.25)
5. B. False. If the motor piston has a 2 square inch (12.9 cm2) effective area and the pump
piston has a 2 square inch (12.9 cm2) effective area, the motor to pump ratio would be
1:1. Applying 100 psi (.7 MPa, 7 bar) to the motor would develop 100 psi (.7 MPa, 7 bar)
of fluid pressure when the fluid outlet is closed.
6. If the ratio goes up, the flow will decrease. If the ratio goes down, the flow will increase.
7. A. A larger motor will increase the ratio and the pressure. A smaller motor will reduce the
ratio and the pressure.
8. D. 10:1

System Design Considerations System Design To properly design a Graco pumping system you must know the characteristics of the fluid being moved, the customer’s application needs and the application requirements. This will provide you with the information necessary to make a correct pump selection. Specifically, system design research will provide fluid volume requirements, fluid pressure requirements, and air availability.
Fluid Characteristics What fluid is your customer pumping? A fluid’s characteristics greatly affect proper equipment recommendations. Some of the fluid characteristics you will have to consider include:
Abrasiveness Corrosiveness Specific Gravity Viscosity Shear Rate Surface Tension Moisture Sensitivity Vapor Pressure
Note: See Graco’s Concept and Theory Training Module, Fluid Basics (Module #321-026), for a complete discussion of fluid characteristics and how they affect pump selection.
Application Needs Fluid application is dependent upon what the customer wants to do with the fluid being moved. There are four types of applications:
Transfer Application is moving a fluid from one location to another. For example, from a
railroad tank car outside the plant to a storage tank inside the plant. Extrusion Application is depositing a fluid (typically a sealant or adhesive) under uniform
pressure and flow to make a bead. Dispense Application is transferring and metering a fluid in a given volume to accomplish
a specific task. Spray Application (atomizing) is typically used for painting and coating systems.
Application Requirements Once the customer’s basic application needs have been determined, you must consider physical layout factors before selecting a pump. Some factors to consider include:
Compressed Air Availability. Will air driven pumps have sufficient air volume, scfm
(m3/min), and pressure, psi (MPa, bar), to meet this new pumping requirement. If the
existing compressed air system is at its capacity limits, consider a hydraulic system.
That would save the customer the expense of purchasing another large air compressor.
Number of application points (Drops) off of the main header.
Fluid Volume required per drop. This would take into consideration:
Tip or nozzle size
Booth type and length
Conveyor system speed (if applicable)
Total Fluid Volume requirements. Once the fluid volume per drop has been determined,
fluid volume for the entire system can be calculated by adding the volume requirements
of each drop.
Pump Location and Line Length. Once pump and application point locations have been
indicated, line length can be determined. When line length, line diameter, and the
viscosity of the fluid being moved are known, fluid pressure loss can be calculated.
Fluid Pressure Loss. System pressure loss is the cumulative total of line loss, fitting loss,
hose loss, and application equipment pressure loss. Total pressure loss must be
overcome in order to meet the system’s discharge pressure and fluid volume
requirements.
Note: Additional information on many aspects of application needs and application requirements can be found in Graco’s Concept and Theory Training Modules; Fluid Basics (Module #321-026) and Moving Fluids (Module #321-037).
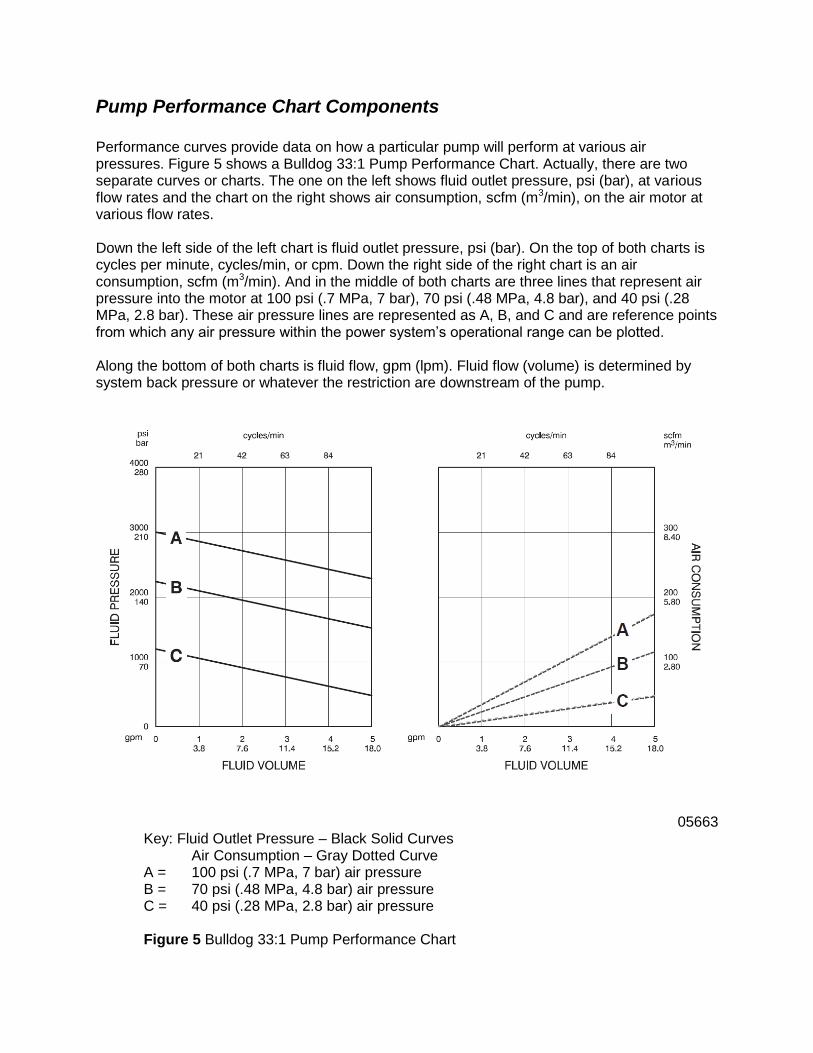
Pump Performance Chart Components Performance curves provide data on how a particular pump will perform at various air pressures. Figure 5 shows a Bulldog 33:1 Pump Performance Chart. Actually, there are two separate curves or charts. The one on the left shows fluid outlet pressure, psi (bar), at various flow rates and the chart on the right shows air consumption, scfm (m3/min), on the air motor at various flow rates. Down the left side of the left chart is fluid outlet pressure, psi (bar). On the top of both charts is cycles per minute, cycles/min, or cpm. Down the right side of the right chart is an air consumption, scfm (m3/min). And in the middle of both charts are three lines that represent air pressure into the motor at 100 psi (.7 MPa, 7 bar), 70 psi (.48 MPa, 4.8 bar), and 40 psi (.28 MPa, 2.8 bar). These air pressure lines are represented as A, B, and C and are reference points from which any air pressure within the power system’s operational range can be plotted. Along the bottom of both charts is fluid flow, gpm (lpm). Fluid flow (volume) is determined by system back pressure or whatever the restriction are downstream of the pump.
05663 Key: Fluid Outlet Pressure – Black Solid Curves Air Consumption – Gray Dotted Curve A = 100 psi (.7 MPa, 7 bar) air pressure B = 70 psi (.48 MPa, 4.8 bar) air pressure C = 40 psi (.28 MPa, 2.8 bar) air pressure
Figure 5 Bulldog 33:1 Pump Performance Chart
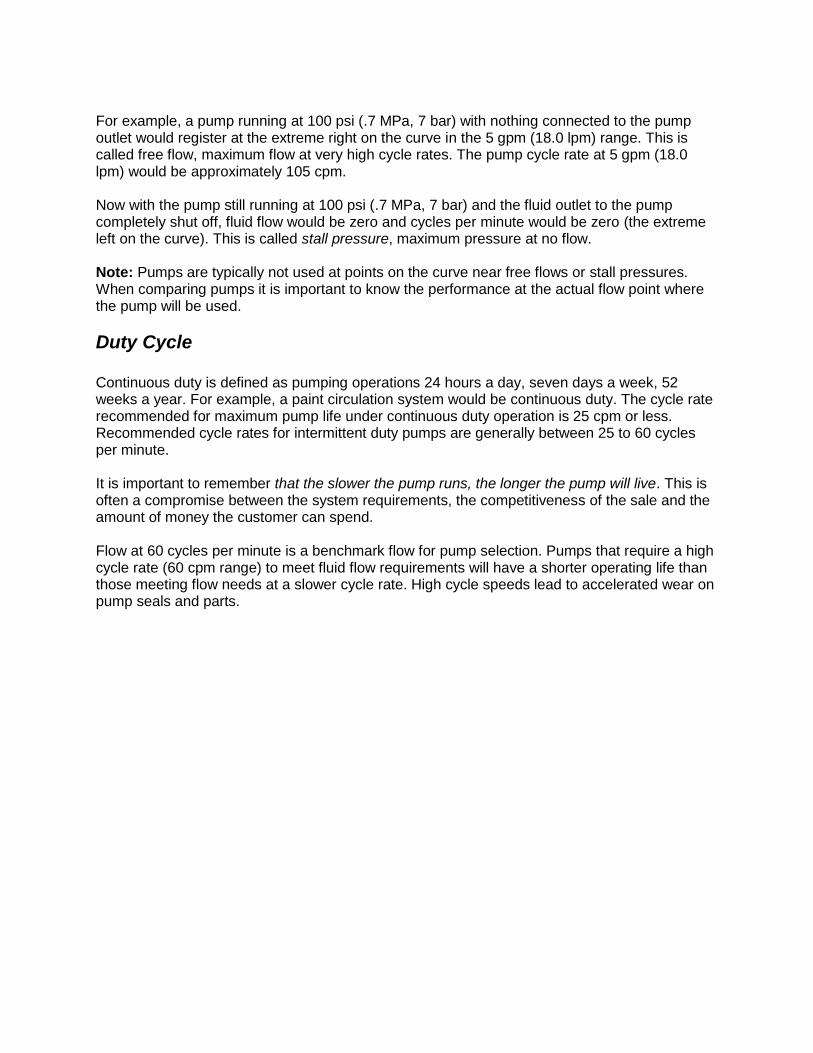
For example, a pump running at 100 psi (.7 MPa, 7 bar) with nothing connected to the pump outlet would register at the extreme right on the curve in the 5 gpm (18.0 lpm) range. This is called free flow, maximum flow at very high cycle rates. The pump cycle rate at 5 gpm (18.0 lpm) would be approximately 105 cpm. Now with the pump still running at 100 psi (.7 MPa, 7 bar) and the fluid outlet to the pump completely shut off, fluid flow would be zero and cycles per minute would be zero (the extreme left on the curve). This is called stall pressure, maximum pressure at no flow. Note: Pumps are typically not used at points on the curve near free flows or stall pressures. When comparing pumps it is important to know the performance at the actual flow point where the pump will be used.
Duty Cycle Continuous duty is defined as pumping operations 24 hours a day, seven days a week, 52 weeks a year. For example, a paint circulation system would be continuous duty. The cycle rate recommended for maximum pump life under continuous duty operation is 25 cpm or less. Recommended cycle rates for intermittent duty pumps are generally between 25 to 60 cycles per minute. It is important to remember that the slower the pump runs, the longer the pump will live. This is often a compromise between the system requirements, the competitiveness of the sale and the amount of money the customer can spend. Flow at 60 cycles per minute is a benchmark flow for pump selection. Pumps that require a high cycle rate (60 cpm range) to meet fluid flow requirements will have a shorter operating life than those meeting flow needs at a slower cycle rate. High cycle speeds lead to accelerated wear on pump seals and parts.
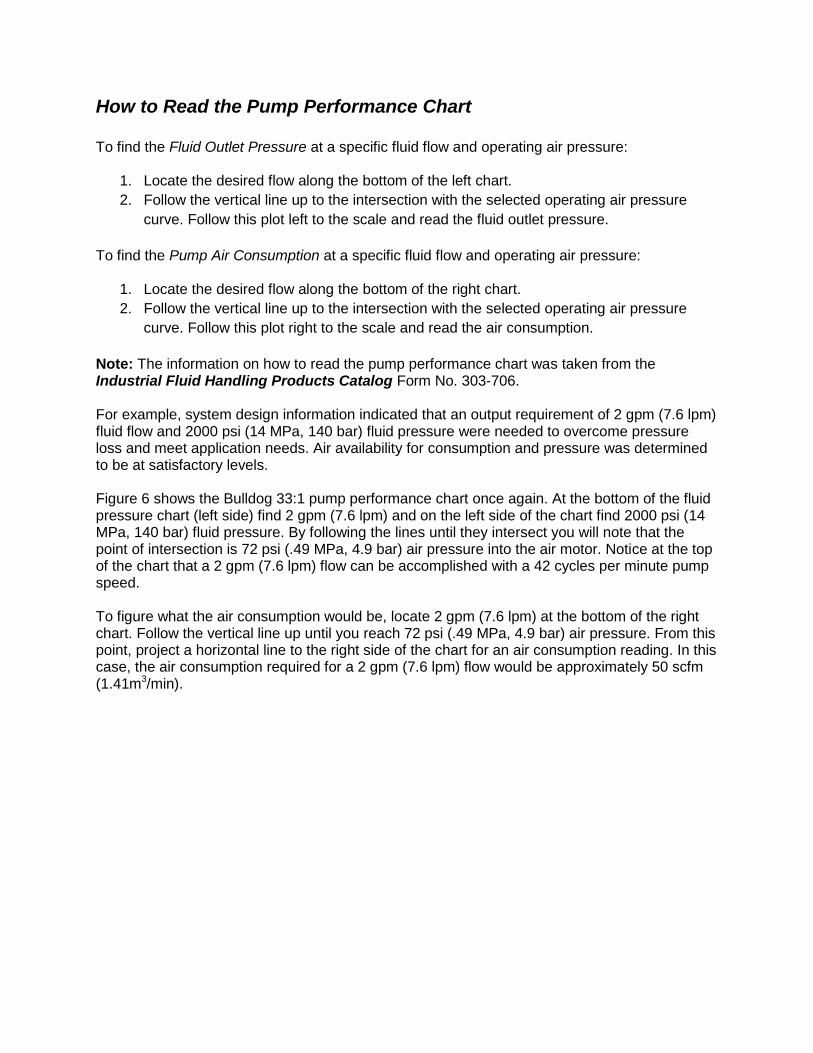
How to Read the Pump Performance Chart To find the Fluid Outlet Pressure at a specific fluid flow and operating air pressure:
1. Locate the desired flow along the bottom of the left chart.
2. Follow the vertical line up to the intersection with the selected operating air pressure
curve. Follow this plot left to the scale and read the fluid outlet pressure.
To find the Pump Air Consumption at a specific fluid flow and operating air pressure:
1. Locate the desired flow along the bottom of the right chart.
2. Follow the vertical line up to the intersection with the selected operating air pressure
curve. Follow this plot right to the scale and read the air consumption.
Note: The information on how to read the pump performance chart was taken from the Industrial Fluid Handling Products Catalog Form No. 303-706. For example, system design information indicated that an output requirement of 2 gpm (7.6 lpm) fluid flow and 2000 psi (14 MPa, 140 bar) fluid pressure were needed to overcome pressure loss and meet application needs. Air availability for consumption and pressure was determined to be at satisfactory levels. Figure 6 shows the Bulldog 33:1 pump performance chart once again. At the bottom of the fluid pressure chart (left side) find 2 gpm (7.6 lpm) and on the left side of the chart find 2000 psi (14 MPa, 140 bar) fluid pressure. By following the lines until they intersect you will note that the point of intersection is 72 psi (.49 MPa, 4.9 bar) air pressure into the air motor. Notice at the top of the chart that a 2 gpm (7.6 lpm) flow can be accomplished with a 42 cycles per minute pump speed. To figure what the air consumption would be, locate 2 gpm (7.6 lpm) at the bottom of the right chart. Follow the vertical line up until you reach 72 psi (.49 MPa, 4.9 bar) air pressure. From this point, project a horizontal line to the right side of the chart for an air consumption reading. In this case, the air consumption required for a 2 gpm (7.6 lpm) flow would be approximately 50 scfm (1.41m3/min).

If system design information were to indicate a 2 gpm (7.6 lpm) flow requirement, a 2000 psi (14 MPa, 140 bar) fluid pressure requirement and an air pressure availability to the air motor of only 50 psi (.35 MPa, 3.5 bar), the performance chart would indicate that the 33:1 Bulldog was the wrong pump for the job. At 2 gpm (7.6 lpm) and 50 psi (.35 MPa, 3.5 bar) air pressure, the best fluid pressure possible would be approximately 1000 psi (7 MPa, 70 bar).
05804 Key: Fluid Outlet Pressure – Black Solid Curves Air Consumption – Gray Dotted Curve A = 100 psi (.7 MPa, 7 bar) air pressure B = 70 psi (.48 MPa, 4.8 bar) air pressure C = 40 psi (.28 MPa, 2.8 bar) air pressure
Figure 6 Example Bulldog 33:1 Pump Evaluation
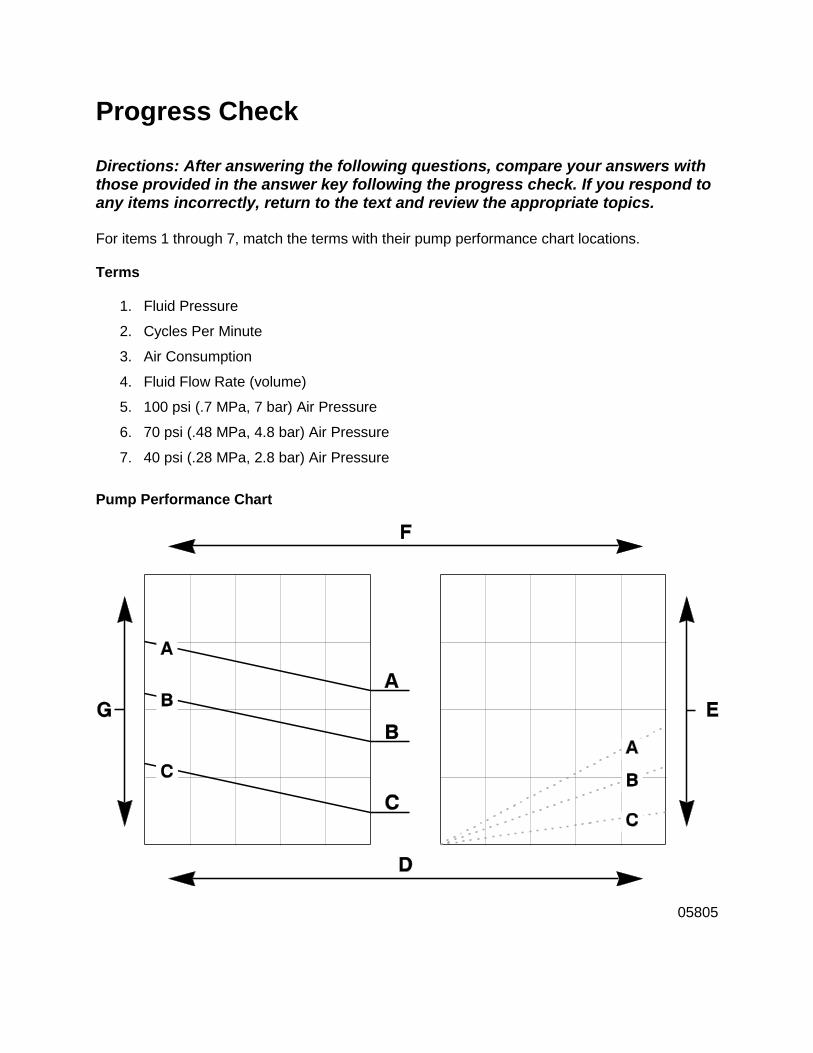
Progress Check Directions: After answering the following questions, compare your answers with those provided in the answer key following the progress check. If you respond to any items incorrectly, return to the text and review the appropriate topics. For items 1 through 7, match the terms with their pump performance chart locations. Terms
1. Fluid Pressure
2. Cycles Per Minute
3. Air Consumption
4. Fluid Flow Rate (volume)
5. 100 psi (.7 MPa, 7 bar) Air Pressure
6. 70 psi (.48 MPa, 4.8 bar) Air Pressure
7. 40 psi (.28 MPa, 2.8 bar) Air Pressure
Pump Performance Chart
05805

8. Maximum flow at very high cycle rates is called __________.
9. Maximum pressure at zero flow is called __________.
10. The cycle rate recommended for maximum pump life under continuous dry operations is
_____ cycles per minute or less.
a. 15
b. 20
c. 25
d. 30
e. 60

For items 11 and 12, plot the information on the pump performance charts and answer the questions.
11. When there is a 4 gpm 15.2 lpm) fluid flow and 85 psi (.59 MPa, 5.9 bar) air pressure
into the air motor:
What is the fluid pressure? __________
What is the air consumption rate? __________
What is the cycle rate? __________
05806
Key: Fluid Outlet Pressure – Black Solid Curves Air Consumption – Gray Dotted Curve A = 100 psi (.7 MPa, 7 bar) air pressure B = 70 psi (.48 MPa, 4.8 bar) air pressure C = 40 psi (.28 MPa, 2.8 bar) air pressure Number 11 Pump Performance Chart

12. When there is a 1 gpm (3.8 lpm) fluid flow and a 1500 psi (10.5 MPa, 105 bar) fluid
pressure:
What is the air pressure into the motor? __________
What is the air consumption rate? __________
What is the cycle rate? __________
05806
Key: Fluid Outlet Pressure – Black Solid Curves Air Consumption – Gray Dotted Curve A = 100 psi (.7 MPa, 7 bar) air pressure B = 70 psi (.48 MPa, 4.8 bar) air pressure C = 40 psi (.28 MPa, 2.8 bar) air pressure
Number 12 Pump Performance Chart

Answers to Progress Check
1. G. Fluid Pressure
2. F. Cycles Per Minute
3. E. Air Consumption
4. D. Fluid Volume
5. A. 100 psi (.7 MPa, 7 bar) Air Pressure
6. B. 70 psi (.48 MPa, 4.8 bar) Air Pressure
7. C. 40 psi (.28 MPa, 2.8 bar) Air Pressure
8. Free Flow
9. Stall Pressure
10. C. 25
11. Fluid Pressure: 2000 psi (14 MPa, 140 bar)
Air Consumption: 125 scfm (3.54 m3/min)
Cycle Rate: 84
12. Air Pressure: 55 psi (.385 MPa, 3.85 bar)
Air Consumption: 25 scfm (.70 m3/min)
Cycle Rate: 21