Pulsed NMR studies in solid D2. I. Solid echo
33
Journal of Low Temperature Physics, Vol. 91, Nos. 3/4, 1993 Pulsed NMR Studies in Solid D2. I. Solid Echo David Clarkson, Xi Qin, and Horst Meyer Department of Physics, Duke University, Durham, North Carolina27708-0305 (Received October 6, 1992 by J. P. Harrison; revised December 30, 1992) The solid echoes for both I = 1 and I = 2 nuclear spins from a two-pulse sequence are studied for p-De concentrations between 0.06 and 0.5 and for 0.06 < T < 1.5 K. The drop of the I = 1 echo amplitude from Curie's law reported earlier is confirmed and is discussed. The density matrix method, previously developed to describe the I = 1 echo properties in solid He as a function of various parameters, is applied to p-De, and similarly accounts for most of the observations. An analysis of the I =2 echoes for o-1)2 is carried out in similar fashion in the absence of a complete density matrix theory. Studies of the echo amplitude for the I = 1 and I =2 spins versus r.f pulse widths are reported and discussed. Various measurements associated with the echo decay as a function of the time r between the two r.f pulses are described. They include the I =2 echo maximum shift respective to that of I = 1, the echo amplitude ratio S(I = 1)/S(I =2), the intermolecular nuclear interaction magnitude, the local inhomogeneous field distribution, and the absence of expected satellite echoes for I = 2. A comparison is made with the results of a similar study on solid H2. 1. INTRODUCTION We have undertaken a systematic study of the solid echo that follows a r.f. pulse sequence /3~-r-/32.~,, where the first pulse tips the nuclear spins by an angle 131, usually 90 ~ and a second refocusing pulse rotates them by an angle/32 with a phase qb respective to that of the first pulse. An echo is then formed, centered at a time t'= r after the second pulse. The theory describing the solid echo properties in solid H2 with I = 1 has been derived along two different approaches 1'2, where the echo ampli- tude S at r was expressed as a function of the experimental variables. The resulting expressions were then compared with the respective experiments of the two research groups. Esteve and Sullivan I used an operator formalism while Yu et al. 2 developed expressions via a density matrix approach with a "closed form" method. Yu et al. 2 showed the respective resulting equations for the echo amplitude to be of the same general form. 119 0022-2291/93/0500-0119507.00/'0 "c~ 1993 Plenum Publishing Corporation
-
Upload
david-clarkson -
Category
Documents
-
view
214 -
download
0
Transcript of Pulsed NMR studies in solid D2. I. Solid echo

Journal of Low Temperature Physics, Vol. 91, Nos. 3/4, 1993
Pulsed NMR Studies in Solid D2. I. Solid Echo
David Clarkson, Xi Qin, and Horst Meyer
Department of Physics, Duke University, Durham, North Carolina 27708-0305
(Received October 6, 1992 by J. P. Harrison; revised December 30, 1992)
The solid echoes for both I = 1 and I = 2 nuclear spins from a two-pulse sequence are studied for p-De concentrations between 0.06 and 0.5 and for 0.06 < T < 1.5 K. The drop of the I = 1 echo amplitude from Curie's law reported earlier is confirmed and is discussed. The density matrix method, previously developed to describe the I = 1 echo properties in solid He as a function of various parameters, is applied to p-De, and similarly accounts for most of the observations. An analysis of the I =2 echoes for o-1)2 is carried out in similar fashion in the absence of a complete density matrix theory. Studies of the echo amplitude for the I = 1 and I =2 spins versus r.f pulse widths are reported and discussed. Various measurements associated with the echo decay as a function of the time r between the two r.f pulses are described. They include the I =2 echo maximum shift respective to that of I = 1, the echo amplitude ratio S(I = 1) /S ( I =2), the intermolecular nuclear interaction magnitude, the local inhomogeneous field distribution, and the absence of expected satellite echoes for I = 2. A comparison is made with the results of a similar study on solid H2.
1. I N T R O D U C T I O N
We have undertaken a systematic study of the solid echo that follows a r.f. pulse sequence /3~-r-/32.~, , where the first pulse tips the nuclear spins by an angle 131, usually 90 ~ and a second refocusing pulse rotates them by an angle/32 with a phase qb respective to that of the first pulse. An echo is then formed, centered at a time t '= r after the second pulse.
The theory describing the solid echo properties in solid H2 with I = 1 has been derived along two different approaches 1'2, where the echo ampli- tude S at r was expressed as a function of the experimental variables. The resulting expressions were then compared with the respective experiments of the two research groups. Esteve and Sullivan I used an operator formalism while Yu et al. 2 developed expressions via a density matrix approach with a "closed form" method. Yu et al. 2 showed the respective resulting equations for the echo amplitude to be of the same general form.
119
0022-2291/93/0500-0119507.00/'0 "c~ 1993 Plenum Publishing Corporation

120 D. Clarkson, X. Qin, and H. Meyer
The purpose of this study has been to extend to solid D2 (spin I = 1 and I = 2) the study of the solid echo amplitudes as carried out ~'2 for solid H2. In particular we wanted to understand several unexplained observations in previous D2 NMR experiments.
The interest in studying both solid H2 and D2, which are prepared as ortho-para mixtures, comes to a major extent from their orientational ordering, 3'4 which can be followed via NMR techniques. These molecular solids crystallize in the hcp phase. Both o-H 2 and p-D2 have rotational angular momenta J = 1 and nuclear spin I = 1 and an electric quadrupole moment. The intermolecular quadrupolar interaction causes orientational ordering, which depends on the concentration X ( J = 1). For X > X~ = 0.53, and at temperatures below a transition line T~. (X), the crystalline phase is cubic and the ordering is long-range. At lower X, the ordering is short-range, and the structure is always hcp. The p-H2 modification with J = 0 and I = 0 has no NMR signal and its expected very weak ordering cannot be observed. However, the induced weak ordering in o-D2 (with J = 0 and a small admixture of J = 2, and where 5/6 of the particles have I = 2) has been extensively studied via CW and pulsed NMR methods. 3
For a better introduction of the subject, we first briefly review solid D2 NMR pulse experiments, where the solid echo was specifically studied. The first report is that by Constable and Gaines. 5 They observed and identified the two components from the I = 2 and I = 1 spins and noted that the maxima of the two component peaks did not occur at the same time t' after the second pulse. They speculated the shift to be a function of the p-D2 concentration X. In subsequent work, Weinhaus et al. 6 used a phase coherent pulse system and a 90~-z-90y sequence where x and y commonly denote
= 0 ~ and 90 ~ respectively. They recorded again the shift between the maxima of the two components and which was found to increase with z. (We henceforth use the standard notation of "xx" and "xy" to describe sequences with @ = 0 ~ or 90 ~ Unless specifically stated, the sequences are wi th /~ =/~2 = 90~
Based on the solid echo work on solid H2 by Metzger and Gaines 7 who investigated the echo decay as a function of r, Weinhaus et aL concluded that the time shift was related to the broad echo asymmetry caused by the intermolecular interaction that leads to solid echo damping. In order to minimize this shift, their NMR study of the spin-spin relaxation used T = 230/~sec. Also in subsequent research, both by Semack et al. s and in this laboratory, 9 1~ this method of working at small z was followed. The purpose of these pulse experiments was to study the solid echo Fourier transform, i.e. the NMR lineshape in frequency space, and its second moment M2 as a function of T and of X. This was done both in the hcp phase 9 with short-range orientational order and in the cubic phase 8'1~

Pulsed N M R Studies in Solid D 2. I. Solid Echo 121
with long-range order. Furthermore the spin-lattice relaxation time for various ortho-para mixtures was determined as a function of the tem- perature. The anisotropy of lineshapes and of the relaxation times were also studied. T M
It is well known 3 that the cubic phase in D2 is formed below a transition line Ta(X) where T~(X = 1) = 4.0 K and tends sharply to zero for X -- 0.53. In this phase, the orientational ordering is nearly complete and therefore the effective intramolecular nuclear dipolar interaction leads to a broad N M R structure. 8"1t'12 It is approximately 120 kHz wide for the I = 1 spins and 10 kHz for the I = 2 spins which are polarized by the J = 1 orientational ordering. This polarization means an admixture of the J = 2 state into the J = 0 ground state, ~3 which is present also in the short-range ordered hcp phase above T~.
During the experiments in this laboratory, 9 11 several unusual and unexplained observations were made. These were (i) the striking departure of the echo amplitude S(I= 1) from Curie's lawg--in contrast to the normal behavior in H 2 - - a n d (ii) the anisotropy of signal amplitude for both spins in the ordered and the nearly-ordered regime. ~ Furthermore it became clear that a systematic study of the echo as a function of z and of other parameters in the r.f. pulse sequence needed to be carried out for a system of spins I = 2, and in particular in D2. Therefore the research to be described below has the following main goals:
(1) Study the apparent "loss" of I = 1 spins with decreasing T, as evidenced by the departure from Curie's law.
(2) Extend to solid D2 the N M R study carried out in solid H2 by Yu et aL, 2 where the solid echo was investigated as a function of various parameters. These are ~-, /32, qb, T, X and the applied off-resonance field (/40+ ~H), where /4o is the field at the Larmor frequency.
(3) Examine in particular the shift in time between the I = 1 and I = 2 echo peaks as a function of various parameters.
(4) Quite generally investigate the ratio of the I = 1 and I = 2 echo amplitudes as a function of various parameters.
(5) Observe the two predicted satellite echoes for the I = 2 spins for large enough T. A prediction of the multiple echoes was made by Boden and Kahol ~4 for D in deuterated acetone. More recently these satellites were predicted and observed for D2 adsorbed in hydrogenated amorphous silicon 15 and on MgO. 16
Our study, to be described below, includes a systematic recording of the solid echo as a function of r at several temperatures for xx and xy s e q u e n c e s with 200- </32-< 160 ~ Also the I = 1 and I = 2 echo amplitudes at t ' = ~- were measured as a function of T between 0.06 and 1.5 K. Several samples of D2 were used with initial concentrations X = 0.49, 0.40, 0.33,

122 D. Clarkson, X. Qin, and H. Meyer
and 0.06, where X was left to decay as a function of time via J = 1 to J = 0 conversion.
2. BRIEF R E V I E W OF T H E N M R IN S O L I D D 2
Here we summarize the available predictions for solid echoes in sold D2. The nuclear energy levels in a strong magnetic field in both p-D2 with I = 1 and in o-D2 with I = 2 were first discussed in detail by Harris. 13 A density matrix approach was used to predict the solid echo maximum amplitude for I = 1 spins in the presence of intermolecular dipolar interac- t ionsf For I = 2, a prediction has so far been made only in the absence of such interactions, which in practice restricts the comparison with experi- ments to echoes at small r, where the amplitude has not decayed through dipolar interactions. We now treat both spin species in sequence.
2.1. Spins I = 1
For the I = 1 spin system in D2, the situation is the same as for solid H 2 and the NMR transition frequencies for a molecule i without inter- molecular dipolar coupling with neighbors are given by ~3
w,-Wo +3(dM + do) ( 1 3 2 A _ 27r - - ~ J z , ) T [ 3 ( n , " ~ ) 2 1] (1)
Here Wo = yHo is the Larmor frequency, dM= 2.74 kHz and d o = 22.50 kHz are the constants of the free molecule describing the intramolecular nuclear dipole-dipole and the nuclear quadrupole-molecular electric field interac- tion. Furthermore J: is the projection of J onto a local quantization axis. The quantity in the bracket ( ) r is the average axial order parameter, and the last bracket [ ] expresses the angular dependence where ~ is the direction of molecular axis and /1 that of the applied field. It is therefore to be expected that the solid echo properties of the spin-1 system are similar to those already described 2 for solid H2. In particular the echo is formed with its maximum at t '= z, where t' is the time after the second pulse.
We introduce the relevant parameters that arise from intermolecular interactions. These are
2
fl~j = ~ (1 - 3 cos 2 OR,in) (2)
that represents the local dipolar field, where Rij the distance between neighbors i andj. Also 0&n is the angle between the applied the field and the i to j axis, and #p is the nuclear magnetic moment. Furthermore ~i is a

Pulsed NMR Studies in Solid D~. I. Solid Echo 123
frequency representing a local magnetic field change ( H i - H0),
2~p ai = ~ (Hi - Ho) (3)
The field Hi has a homogeneous component, the applied field Ho. It has further an inhomogeneous component that varies over the crystal 2 which will again be investigated in solid D2.
For/3~ =90 ~ the normalized real part of the echo signal amplitude at t' = r, and that includes the effect from intermolecular interactions and from the field H, is found to be 2
S(I = 1) = - 6 l sin 2/32{[�89 cos 2/32+2 cos/32 + 1)
+2 sin 2/32 cos~-~+�89 -cos/32) 2 cos 2/3r] cos 2qb
-[�89 cos 2/32-2 cos/32+ 1)+2 sin 2/32 cos/3r
+�89 +COS/32)2 C-'0-7 2/3r] cos 2~r} (4a)
where
l cos( ij ) 4b,
1 cos 2 a t -= - - Y cos(2air) (4d)
N i
We also repeat expressions for special cases, listed in Ref. 2, which will be used in comparison with our data. They are:
2.1.1. Homogeneous, Nonzero Off-Resonance Field (~g = ~t ~ O)
In the two pulse sequences, xx and xy, we have at t '= r
-~(~+2 cos/3r+�89 213r ) (1 -cos2a r ) (5a) xx,/32=90~ S ( I = I ) = i l
-~(~+2 cos cos xy,/32 90~ S(I 1) = 1 1 - - 1 = = /3r+~ 2/3r)(1 + cos 2~r) (5b)
where cos 2/3r is the average over the intermolecular dipolar interactions in the sample [Eq. (4c)]. Therefore we expect oscillations of the echo amplitudes in both types of sequences when the magnetic field or the r.f. frequency are changed. The oscillation period in frequency at constant applied field and r is given by
A~o = "rr/r (6)

124 D. Clarkson, X. Qin, and H. Meyer
2.1.2. Spin-Spin Relaxation
Another useful relation for obtaining information on the spin-spin interaction is obtained from Eq. (4) by combining the results for xx and xy sequences,
[1 (2r)2 A~9Minter + 3 ISx~[+lSxy[=sinZlJ2 L - - - ~ - ( 1 - c o s f l 2 ) ( l + ,3~ 2 " ' " (7)
Here the coefficient A is a function of the lattice structure and the crystal orientation with respect to the magnetic field, as given by Eqs. (19) and (20) of Ref. 2. Also M~ ~ in (rad/sec) 2, is the part of the second moment from static intermolecular dipolar interactions,
Minter 4 Aarvv (8) 2 = 9 ' '* 2
where M vv is the total Van Vleck second moment. 17 Equation (7) is valid for
27"<< 38(1 - I -~ ) - l /2 (M~nte r ) -1 /2 (9)
For longer times, Eq. (7), together with experimental data for H=, suggests the expression
ISx,,I + ISx.vl- exp ( - 2 r / T ~ nter) (10)
where Ti nter is the spin-spin relaxation time for intermolecular dipolar interactions. A discussion of the relation between M~ ~ and ~nter. T2 m Ref. 2 for the case of solid H2 leads to the approximate expression
Tilter ~ [(2 inter --1/2 In 2)M2 ] (11)
2.1.3. Relaxation from an Inhomogeneous Magnetic Field Distribution
From Eq. (4), we obtain a measure of the inhomogeneous field distribu- tion by forming the ratio
!) t- Sxx+Sxy cos 2 a t (12a)
where
cos 2ar = ~. cos(2air) = f ( a ) cos(2ar) da - F(2r) (12b)
Here f ( a ) and F(2r) are the normalized distribution functions of the inhomogeneous local frequency ai and the corresponding Fourier transform at t ' = z. Experience with solid H2 suggests the following representations:
(2r)2 - i,hom (2M~.hom)-,/2 8l --~ 1 . . . . . M2 for 2r<< (13a) 2
T2 ) for larger r (13b) ,~R ~ exp ( -2 r / inhom

Pulsed NMR Studies in Solid D2. I. Solid Echo 125
2.2. Sp ins I = 2
The extension of Eq. (4) to spins I = 2 is very laborious and has not been carried out. However, Fedders ~8 has developed expressions for the case of/3~ = ai = 0. We first recapitulate the transition frequencies in a strong magnetic field. They are given by ~3
~~ (D~ +_(ai+ 3bi/2) (14a) 2~
and
( D i - - ( D O
2r~ = + ( a ~ - b , / 2 ) (14b)
where
a, = ~ C,[3(fii. I2I) 2 - 1 ] d 0 (14c)
5 . _ _ b,=-~CiE3(~, fl)2 l]dM (14d)
Here Ci is the admixture factor from the J = 2 state into the J = 0 ground state of spin i, or polarization factor, that depends on X and on the orienta- tional ordering of the neighboring J = 1 molecules, Volz et aL 1S have shown that for these resonances, three solid echoes should be observed, namely centered at time t' = Tk, with
1 + 3bi/2ai 1 - bi/2ai k l - 1 - b ~ / 2 a ~ ' k 2 = 1, k 3 - 1 + 3b~/2a~ (15)
It is important to note that although both a~ and b~ are functions of the polarization and of the angle between H and ~, their ratio is not. Therefore the three echoes, given by Eq. (15), should be observed regardless of orientational order. This should be so even though there is a distribution of orientational ordering among the spins I = 2, leading to a Gaussian-like NMR line in the hcp phase, instead of the four predicted peaks in Eqs. (14a, b). Multiple echoes located at the predicted times have been observed by Volz et aL ~5 and by Jeong et aL 16 in D2 in silicon and in D2 adsorbed on MgO. We also note the prediction of the echo amplitudes by Fedders 18 who finds, for r = 0,
S x x ( r k l ) = S x x ( z k 3 ) = 2 sin 2 f12 cos/32;
S~y('rkO = Sxy( 7"k3) = sin 4/32 (16a)
Sxx(z) = - 4 sin 2/32 cos/3:;
Sx~,(~') = (3+2 cos 2/32) sin 2/32 (16b)

126 D. Clarkson, X. Qin, and H. Meyer
Hence, assuming the multiple echoes to be broad enough not to be resolved, one obtains for the total amplitudes
Sxx = 0, Sxy=5sin2/32 (17)
This functional dependence on/32 is the same as for spins I = 1, as can be seen from Eq. (4) in the limit r ~ 0.
Inserting the numerical values for dQ and dM for D2 into Eq. (15) we obtain kl = 0.86, k2 = 1, and k3 = 1.17. We calculate that for an echo width (FWHM) of At' =400/zsec corresponding 5 to a sample with X = 0.33 at T - 0 . 1 K, pulse spacings by ~" > 2 msec are necessary to resolve the triple
T2 , echo. As we shall see later, a r of this magnitude is much larger than inter and therefore the remaining signal after decay by intermolecular dipolar interactions will be small. This makes Eq. (16) inapplicable for predicting the triple echo amplitudes in solid D2.
Here we mention that the combination of factors that lead to echo formation is quite different for the central echo and for the satellite echoes. 19 This can already be seen from the derivation in Ref. 15, described for l i d in Eqs. (4) and (5). For the central echo at r, the dephasing due to any inhomogeneous magnetic field is refocussed, along with the dephasing due to the intramolecular dipolar and quadrupolar couplings. But for the auxiliary (kl~" and k3~') echoes, the spins evolve forward in phase under any inhomogeneous field without this phase being refocussed. Thus the amplitudes of the early and late echoes will be destroyed or reduced by static field inhomogeneities, while this is not true of the central echo at r. This will have an important consequence on the results to be discussed in Sect. 4.1.4.
For the D resonance in deuterated acetone, where the D atoms are coupled by dipolar interactions, Boden et alfl ~ found that their experimental echo amplitude could be represented by
Sxy = a ( r ) sin 2/32+ b(r) sin 2/32 cos2/32 (18a)
S,x = -c (~) sin 2132 cos/32 (18b)
Here the terms a0"), b0"), and c(r) represent the solid echo envelope, which is a function of the inter-deuteron dipolar interaction.
In the absence of detailed predictions for the I = 2 echo amplitudes in solid D2 as a function of the various experimental parameters, we will carry out the same data presentation as for the I = 1 spins, so that a comparison is made available. The simultaneous observation of the two signals enables one to plot the ratio R = S(I= 1)/S(I= 2) as a function of experimental variables, such as f12, ~, T etc.
We expect the individual echo amplitudes S ( I = I ) and S ( I = 2 ) at r ~ 0 to follow Curie's law. If the theoretical expression for these amplitudes

Pulsed NMR Studies in Solid D2. I. Solid Echo 127
were identical, their ratio would be that of the respective nuclear suscep- tibilities, and which is given by
R = S ( I = 1 ) / S ( I =2) = 2 X / ( 5 [ I - X ] ) (19)
As was found in previous experiments, 9 1l this relation does not hold. We will report here in some detail how this ratio is strongly dependent on various parameters.
3. EXPERIMENTAL
We have used the same phase-coherent pulse system as before, 2'9 where we added a tuned power amplifier stage 21 on top of the Arenberg tuned amplifier and we were able to produce rectangular 90 ~ pulses in D2 with 4.5-6/xsec width at the frequency v = 5.9 MHz. This pulse width was narrow enough to tip practically all the spins over a frequency range of 80 kHz, which is larger than the NMR spectrum width of the I = 1 spins in the hcp phase. Hence the correction for incomplete saturation made in previous D2 experiments T M was no longer necessary.
The solid echo signals were stored in a Biomation transient recorder and transferred into a PC. Signal averaging was used, with up to 200 sequences spaced in time by 5T~. Here ~t is the longer time component of the spin-lattice relaxation process, and which ranged 9 from approximately 2 to 50 sec. The use of IGOR software for the Macintosh computer produced copies of the echoes where various portions of the spectrum could be amplified for examination and analysis.
Tuning the spectrometer to the Larmor frequency was accomplished by minimizing the number of beats seen in the free induction signal obtained in the liquid U 2 sample. A quadrature system provided the in-phase and the out-of-phase components of the solid echo, and the instrument was adjusted so as to minimize the latter component at the Larmor frequency. Calibration and periodic checks of the angles/31 and/32 from the r.f. pulse width was done by assigning a tipping angle of 180 ~ when the I = 2 F1D signal of the solidified sample passed through a sharp minimum value.
For off-resonance experiments (Sect. 4.1.2) the output from the tuned r.f. receiver amplifier was fed into another r.f. amplifier with video output which was then connected to the Biomation transient recorder. Again signal averaging was used in recording the echo shape and corrections for amplifier nonlinearity were made.
In Fig. 1 we show two representative echo profiles for any xy and xx sequence, the amplitude of which is positive and negative with respect to the FID signal, respectively, and where we have plotted the absolute value. Here the I = 1 signal maximum is located at a time r after the second pulse, but the peak of the broader I = 2 echo can occur both for tmax smaller and

128 D. Clarkson, X. Qin, and H. M e y e r
700
Echo 500
Signal
arb. I units) 300
' ' ' I ' ' ' p ' ' ' I ' ' '
X--0.46, T=0.6K
/ ~ 10~
xy,T=700gS
100 ' ' ' ' ' ' ' ' ' ' ' ' ' ' 50 0 400 800 1200
t(I.ts)
250, , , , , , , , , , ,
x x,x--400/.ts
, . . I . . . I . . .
400 800 1200
t(p.s)
Fig. 1. Representat ive echoes , s h o w n in absolute magni tude , at X = 0 . 4 6 and T = 0.6 K for xy and xx s e q u e n c e s with /32 = 90 ~ r = 700 tzsec, and 400 t tsec . The respect ive ampl i tudes S ( I = 1) and S ( I = 2) at t '= "r are indicated on the left figure.
larger than z. For x y sequences, tma x is always found to be smaller than z, while for x x sequences the shift changes sign with increasing r. We define this shift as
~ t = 7 " - /max
which can be positive or negative. These features will be studied and
10o0 50o
S(I=2)
100 50
10
' ' I I ' [ ' ' l ' '
X=0.45 ~ 1 7 6 1 7 6 T=O.IK
N ee ly �9
o o ~ o o �9 o o
o S o
o
o
o
lO
5
SO=l)
1,
' ' I ' ' F ' ' I ' '
l e e e o e
Sxy e �9 �9
o o
o o O ~
o o o �9
Sx x o o
o o o
600 1200 1800 2400 600 1200 1800 2400
2x(las) 2x(gs)
Fig. 2. Representat ive e c h o ampl i tudes S ( I = 1) and S ( I = 2) in arbitrary units as a funct ion o f 2% both for xy and xx s e q u e n c e s wi th f12 = 90~ X = 0.45, and T = 0 . 1 K.

Pulsed NMR Studies in Solid D 2. I. Solid Echo 129
discussed in Sect. 4.3. Figure l also defines the signal amplitudes S ( I = 1) and S ( I = 2).
Figures 2(a) and (b) show a representative echo amplitude plot versus ~" for both spin systems and where both sequences xy (solid circles) and xx (open circles) were produced at resonance frequency. The xx sequence amplitude is zero for ~" = 0, increases to a maximum with r and then decays. The absolute values of the amplitudes are in arbitrary units, which are the same for both figures.
4. RESULTS AND D I S C U S S I O N
Because of the abundance of data and their complexity, we will present them in various sections and roughly follow the order and outline used 2 for the description of the H2 results. We first start with some specific tests of Eq. (2), which show that the spins ( 1 = 2 ) follow nearly the same predictions as the spins ( I = 1). However, a plot of the amplitude ratio R = S ( 1 - - 1 ) / S ( I =2) shows more sensitively the difference between the respective behavior of the two spin systems. We then describe measurements of S ( I = 1) and S(1 -- 2) versus temperature for various samples and show the strong anomalous I = 1 behavior. The anomaly stimulated another test of the echo amplitudes versus/31 and/32. Thirdly we present the echo decay studies and finally the measurements of the shift ~t as a function of ~- and of the temperature. A tabulation of many of the data and of R is available from one of the authors (H.M.).
4.1 . T e s t s o f the G e n e r a l E q u a t i o n
4.1. I. Off-Resonance Amplitude Periodicity
For a homogeneous, nonzero off-resonance field AH or frequency Aw = yAH, the amplitude S ( I -- 1) is predicted to oscillate with this field (or frequency change) as per Eq. (6).
We first present some test results by examining the off-resonance amplitude of both the I - - 1 and the I = 2 resonances as a function of Av = v - v 0 where Vo is the Larmor frequency. This was done manually in small step increments of the frequency generated by the synthesizer. Both xx and xy pulse sequences were used with ~-= 400 psec. From Eqs. (5a) and (5b), we see that the amplitude should be zero at its minimum, and the data in Fig. 3 confirm this. Also the amplitudes for the two types of sequences are out of phase, as predicted. The oscillations follow approxi- mately a cosine form with a period ~ , = 1.25 • 0.1 kHz for both spins systems, in excellent agreement with the predicted 6~, = 1/2~" -- 1.25 kHz for the I -- 1 spin system. This result shows that for the I --2 spins, Eq. (5) should also apply. We do not understand, however, why the observed curves- -both for

130 D. Clarkson, X. Qin, and H. Meyer
S x x
(arb. units)
Sxy
(arb. units)
. . . . . . . . . . . . . . . . i 4 T=0.2K,X=0.26, x=4001.tsec I o I=1 �9 I=2
,o ~ , �82 ,e, ~, e ; I �9 �9 u
~ i i j L I t s 9 # I
�9 t r t
2 : ', [ ' ' ; I ~ ' ~ ,/
t i r t , , r i i i f
;
O~-,-~,r,,,,qx,, . . . . l . . . . f U . , , , , , r ' ' ' ' I ' ' ' ' I ' ' ' ' I ' ' �9 ' I ' , , ' I , , '
0 -3.0
/ ~ / ~ ~ �9 i
, I ' j
, ',. : i i. ": ',. , ', i ~i J �9 i t ~ f ;"
f l i ~ t j i l �9 / . . . . /
, / u ~ �9 ~ . - O ~ O o ' j o e ~ o ~ / ~ c r Q ~ o ,o.ot:o.O.o ;, / e oe~c
. . . . '
-2.0 -I.O 0.0 1.0 2.0 3.0
Av(kHz) Fig. 3. The S(I= 1) and S(I=2) echo amplitudes for T=0.2 K, X =0.26, and r = 400 #sec. as a function of the frequency change A~o/27r = Av = u - v L where v L is the Larmor frequency. The dashed lines are a guide to the eye.
I = 1 and I = 2 - - s h o w a d i s to r ted cosine form. Measu remen t s with smal le r f r equency intervals and over a range o f Av = 2 kHz show that the m i n i m u m
for bo th S(I = 1) and S(I = 2) is smooth and not a s ingular i ty . These and re la ted observa t ion will be desc r ibed in more deta i l elsewhere. 22
F ina l ly we note tha t f rom o ther s imi lar tests, the m a x i m a o f S(I --- 1) and S(I = 2) a lways occur at near ly the same Av, regardless o f T and X, i.e. i n d e p e n d e n t o f the state o f o r i en ta t iona l order ing . This impl ies that the i n h o m o g e n e o u s field c o m p o n e n t s ai a p p e a r to have near ly the same average value for I = 1 and I = 2 spins (see also Sect. 4.2.3).
M o r e in fo rma t ion is ob t a ined by examin ing the rat io R o f curves such as p resen ted in Fig. 3. This is shown in Fig. 4 for X = 0.32 at two t empera tu res for xy sequences with r = 4 0 0 / z s e c . There are in t r iguing pe r iod i c sin- gular i t ies near the min ima o f the ampl i t udes in Fig. 3, and which are t empe ra tu r e dependen t . These s ingular i t ies might poss ib ly be assoc ia ted with (i) a different funct ional form of the I = 2 ampl i tude from tha t of the I = 1 spin, and (ii) a small t empera tu re -dependen t frequency shift between the I = 1 and I = 2 resonances. We p lan to describe elsewhere the analysis

Pulsed NMR Studies in Solid D2. I. Solid Echo 131
S 0 = l ) S ( I = 2 )
0.25
0.20
0.15
0.10
0.25
0.20
0.15
0.10
-2.0
' ( ' I ' ' ' ' I ' ' ' ' I . . . .
X=0.31 T=0.09K xy
0
0 0 0
0 0 o 0 0 0 0 0
0 0 OOOooO o oOOOOo o o o O O o o o 0
0
* , , , I , , , , I , * , , I , , ,
' ' ' ' 1 ' ' ' ' 1 ' ' ' ' 1 ' ' ' '
T=0.9K O O
Oo O 000 0 o~176 0 o 0 O0 O0
OOooO Oo O o OOo OOooOO
. . . . ' ' ' 0 ' 0 . . . . 1 '0 . . . . -1 0 2.0
A v ( k H z )
Fig. 4. The amplitude ratio R versus off-resonance frequency A~, at three temperatures. The r.f. pulse sequence was xy with ~" = 400 #sec.
o f these results, z: once the complete derivation o f S(I = 2) as a funct ion o f the various parameters has been carried out.
4.1.2. Off-Resonance Signal Amplitudes
Similarly to experiments in Ref. 2, we have observed the oscillatory behavior o f S( ! = 1) and S( I -- 2) as a funct ion of r when the r.f. f requency was off-resonance. In Fig. 5(a) and (b), we present on a semilogari thmic scale the absolute values o f the ampli tudes for ~u = 2.52 kHz. In Fig. 6, the addi t ion o f the absolute ampli tudes is presented versus 2 r and compared with the results obtained on-resonance, A v = 0 . It can be seen that the oscillations for I = 2 have been entirely canceled, while there is a small remnant for I = 1. This compensat ion of oscillations is predicted by Eq. (7) for spins I = 1, but experiments show that it also applies to I = 2. A more sensitive indicat ion o f the echo ampli tude behavior o f the spin systems is given by the ratio R = S ( I = 1 ) / S ( I = 2) for the individual xx and xy sequen- ces. A periodici ty is seen, with a singularity in the region where both ampli tudes tend to zero. These observations are similar to those shown in Fig. 4 and are not reproduced here.
4.1.3. Echo Amplitude Versus fie
In Fig. 7, the ampli tudes versus 132 for various values o f r for Av = 0 are shown for both spin systems. As r increases, the echo max imum

132 D. Clarkson, X. Qin, and H. Meyer
' ' I ' ' ' ,
104 , Av=2.52kHz, T--0.2K, X=0.32
x x x
S(I=2) 103 " [~, ~ ~ , , o �9 xy
101
103
102 , x
S(I=I) " "'o 101; !�82
i I
i I i i
10 o " d
0 1000 2000
2"c(~ts) Fig. 5. Oscillatory behavior of S(I = 1) and S( I = 2) with/32 = 90 ~ as a function of 2r for an off-resonance of Av=2.52kHz, T=0.2 K, and X=0.32. The symbols are: solid circles, xy; crosses, xx sequence. The data are in arbitrary units, shown as absolute magnitude. The solid and dashed curves are a guide to the eye through the crosses and circles.
a m p l i t u d e for both spin systems shifts f rom/32 = 90 ~ to 30 ~ and this is also s imi lar to the observa t ions 2 in sol id H2.
The d a s h e d curves in Fig. 7 for the I = 1 spins are a result o f the fit o f Eq. (2) to the data , and were ob t a ined in the same way as desc r ibed for H2:2 Fo r each value o f r, there are three fit pa ramete r s , namely cos 2 a t , cos [3r and cos 2flz. Unl ike in Ref. 2, however , the receiver gain was not
kept the same for all the series of measurements . As a result, the ampl i tude factor F de te rmined in Ref. 2 is i r relevant here. F o r each z, the ca lcula ted curve was no rma l i zed to the m a x i m u m value for the xy sequence. Cos 2a7 was o b t a i n e d f rom the da t a using Eq. (12a), and fo l lowing this ope ra t ion , cos [3r and cos 2fir were de t e rmined as free pa rame te r s to achieve bes t ag reemen t be tween expe r imen t and theory. The co -de t e rmined cos [3z and cos 2fir could be var ied by abou t • and +0.1 wi thout changing too much the qual i ty o f the fit. Fo r smal l values o f r it makes sense that cos [3r is pos i t ive and decreases as z increases. The fit pa rame te r s are l is ted in

Pulsed N M R Studies in Solid D 2. I. Solid Echo 133
103
10 2
Isx, l§
1 0 ]
oOmO ' J
O O 0 o o
oOo%%,% A v = 2 . 5 2 k H z T=0 .2K, X = 0 . 3 2
000 ~ O 0 ~ O O O O o
O o 0 0 0 0 0 o g a g
0 0 0 0 O ~
0 0 0 0 0 �9
0 0 0 0 0 �9
o I=1 "Oo, �9 I=2 %~176
0 o 0
0 o 0 o
10 0 L ~ , , I , , , , 0 1 0 0 0 2000
2z(~ts)
Fig, 6. Sum of the absolute magni tudes o f IS~[ + IS,,[ from the data s h o w n in Fig. 5, plotted versus 2r for Av = 2.52 kHz.
S(I=2)
8 0 0
4 0 0
0
-400
-80(] 40
' I I '
x ( m s ) = 0 . 5
�9 " " o x y - - X X
'o oO0 . . o
o o o
o o
o o o
�9 ~ "k
' I u ' ~
1.0
ooO~176 -
o o
o
o o
o o o
- - , . .P,
a,
f ~ . * ~
S(I=l) 0 ~,,...'~- -~o'-
o 9' d, o'
boo,O'
-80 ' ' . . . . ' ' ' ' . . . . t ' ' ) . . . . . . 50 150 50 150 50 150
~ 2 ( d e g )
Fig. 7. Ampl i tudes S ( I = 1) and S ( I = 2) for xx and xy sequences as a function of f12 for four values of ~. The dashed curves result from a fit of theory for spin (I = 1 ). The fit param- eters are given in Table I. The ampli tude units are arbitrary but the same for xx and xy at a given ~.
' J I ' , I I '
1.5 2 . 0
_ _ T--0.2K,X=0.24 ~ I
,~ . . e * *
�9 . . . . . . . . . . . _ o g ~ a , ~ , ~ a ~ ~ ooooo~176176176176 .OooO
.o o
- - ~176
' ' , ' , : : I I :
, I . . . . I .
50 150
134 D. Clarkson, X. Qin, and H. Meyer
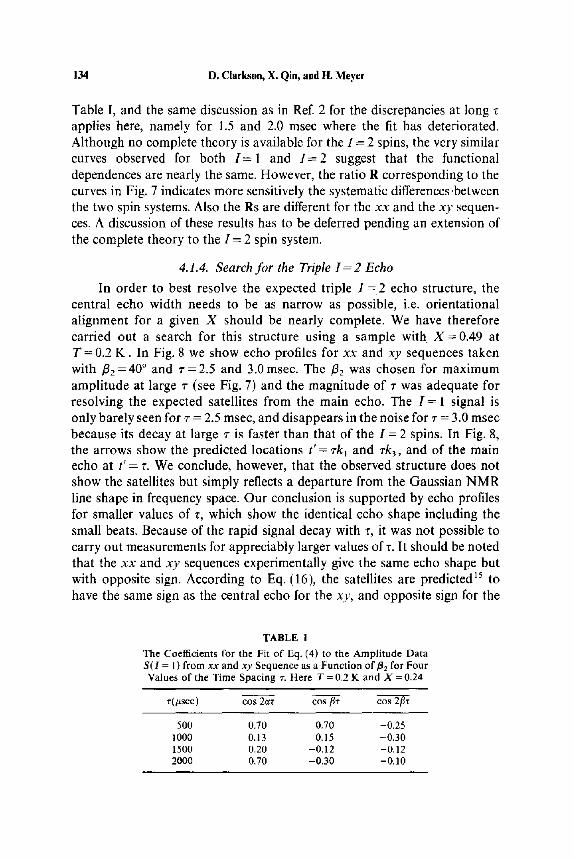
Table I, and the same discussion as in Ref. 2 for the discrepancies at long applies here, namely for 1.5 and 2.0 msec where the fit has deteriorated. Although no complete theory is available for the I = 2 spins, the very similar curves observed for both I = 1 and I = 2 suggest that the functional dependences are nearly the same. However, the ratio R corresponding to the curves in Fig. 7 indicates more sensitively the systematic differences-between the two spin systems. Also the Rs are different for the xx and the xy sequen- ces. A discussion of these results has to be deferred pending an extension of the complete theory to the I = 2 spin system.
4.1.4. Search for the Triple 1=2 Echo
In order to best resolve the expected triple I = 2 echo structure, the central echo width needs to be as narrow as possible, i.e. orientational alignment for a given X should be nearly complete. We have therefore carried out a search for this structure using a sample with X =0.49 at T = 0.2 K. In Fig. 8 we show echo profiles for xx and xy sequences taken with/32 = 40 ~ and r = 2.5 and 3.0 msec. The /32 was chosen for maximum amplitude at large r (see Fig. 7) and the magnitude of r was adequate for resolving the expected satellites from the main echo. The I = 1 signal is only barely seen for r = 2.5 msec, and disappears in the noise for r = 3.0 msec because its decay at large r is faster than that of the I = 2 spins. In Fig. 8, the arrows show the predicted locations t' = rkl and 7"k3, and of the main echo at t ' = r. We conclude, however, that the observed structure does not show the satellites but simply reflects a departure from the Gaussian NMR line shape in frequency space. Our conclusion is supported by echo profiles for smaller values of r, which show the identical echo shape including the small beats. Because of the rapid signal decay with z, it was not possible to carry out measurements for appreciably larger values of ~. It should be noted that the xx and xy sequences experimentally give the same echo shape but with opposite sign. According to Eq. (16), the satellites are predicted is to have the same sign as the central echo for the xy, and opposite sign for the
TABLE I
The Coefficients for the Fit of Eq. (4) to the Amplitude Data S ( I = 1) from xx and xy Sequence as a Function of B2 for Four Values of the Time Spacing r. Here T = 0.2 K and X = 0.24
r(#sec) cos 2at cos fir cos 2Br
500 0.70 0.70 -0.25 1000 0.13 0.15 -0.30 1500 0.20 -0.12 -0.12 2000 0.70 -0.30 -0.10

Pulsed NMR Studies in Solid D2. I. Solid Echo 135
,+o~ . . ~ / ' \ x~o.28~ xx , f \ x--0.28 1
. . . . . . . . " ~ . . . . . . . . . . . . . . . . . . . . 1 ~5oo 2tin0 2500 3000 3500 20o0 2500 3o0o 3500 ~oo
t(~ts) t(~ts)
Fig. 8. Echo profiles for xx and xy sequences as a function of time t with 132 = 40 ~ and 7" = 2.5 and 3 msec at T = 0.2 K and X = 0.28. The vertical arrows indicate the position of the expected echoes at zk~, r, and +'k3, as given by Eq. (15).
x x sequence. Thus any distortion of the echo shape due to unresolvable satellite echoes would lead to shape changes for both x x and x y sequences.
Further recordings of 1 = 2 echoes produced by x x and x y sequences with T between 2 and 3 msec, with X = 0.49, 0.3 and also with X = 0.06 at T = 0 . 2 K, also failed to show the predicted satellites. In those last measurements, done with less orientationally ordered D2, there were no beats of the main echo.
According to a suggestion by Conradi, ~9 failure to observe the predicted satellites might be due to the presence of an inhomogeneous field (to be discussed in Sect. 4.3.3) which causes a more rapid decay of these echoes in D2. By contrast, such an inhomogeneous field might be negligible in comparison with the much larger intramolecular field for D2 absorbed in hydrogenated silicon or adsorbed on MgO. In these systems, the satellite echoes have been clearly observed.~5'~6
4.2. Echo Amplitude as a Function of Temperature
We have conducted a systematic study of the signal amplitudes for the I = 1 and I = 2 spins as a function of T for different values of X . T h e x y
sequence was used with +" = 200 or 400/zsec, and results were corrected to 0-= 0 using the echo decay results described in Sect. 4.3. Usually the pro- cedure was to cool the sample to the lowest temperature, and keep it there for about 10 hr, then to take data in successive steps of increasing tem- perature. In Fig. 9 the results are shown by plots of S • T (in arbitrary units) versus T at constant X. For clarity of display, we have normalized the data

136 D. Clarkson, X. Qin, and H. Meyer
100
S(I=2)xT 50
(arb. units) 20
10 1
100'
S(I=I)xT 5o i
(arb. units) 20
10
' I . . . . . . . . . ' . . . . . . . . . ' . . . . ' . . . . ' ' ' ' ' I "
x �9 0 . 4 5 x 0 . 3 0 A 0 . 2 6
, I . . . . . . . . . , . . . . . . . . . , . . . . . . . . . , , . , , I ,
" I . . . . . . . . . ' . . . . . . . . . �9 . . . . ' . . . . �9 " �9 " " I
. . . . . . . . . . _ _ _ - - - - , - y ~ - - .
~ ~ A & A X x X � 9 �9 - - I I -~
A X X ~ X � 9 1 4 9 �9
X X X X X X
x �9 X �9 �9 �9 0 . 4 5
�9 �9 x 0.30 �9 �9 �9 " A 0.26
�9 I . . . . . . . . . , . . . . . . . . . , . . . . ~ . . . . , ' I l I J ,
0.1 0.2 0.5 1.0
T(K)
Fig. 9. Plot of the suitably normalized products S• T for both ( I = 1) and ( I = 2) spins as a function of T for several p-D z concentrations X. An xy sequence with f12 = 90 ~ was used. A horizontal line of points (dashed line) would indicate that Curie's law is obeyed.
for both spin systems to 100 at the high temperature end. The actual ratios at T = 1.0 K for the mixtures displayed are 0.32, 0.13, and 0.10 for X = 0.45, 0.30, and 0.26. The expected ratios from Eq. (19) for these compositions are 0.33, 0.17, and 0.14.
It is clear that the I - - 2 spins follow Curie's law within experimental scatter, while there is a strong departure from this law for the I -- 1 spins. The minimum in the dip of the I - - 1 curve in Fig. 9 shifts to lower tem- peratures with decreasing X, and also the magnitude of the anomaly decreases. We have made careful checks that this "spin loss" is not an instrumental effect resulting from amplifier bandwidth, drifts in r.f. frequency or in Ho, and from thermal relaxation times. Thermal cycling was carried out where data were taken during cooling and subsequent warming of the sample with X = 0.26, and the data were perfectly reproduc- ible. We have also failed to observe an anomalous rapid decay of S(I -- 1) in xy sequences for 15 < z < 200/xsec, Our data extend smoothly to lower z the curves of the type shown in Fig. 2(b), where the decay is governed mainly by intcrmolecular dipolar interaction. If such rapid decay existed, it

Pulsed NMR Studies in Solid D2. I. Solid Echo 137
must be for r < 15/~sec. Hence one possible reason for the spin loss is that a portion of these spins are located on a very broad component of the NMR line which the present r.f. pulse system, covering a spectrum of 3v = _+80 kHz, is unable to detect. We note that from Eq. (1) the maximum span of the expected NMR line is Av = +_3d = +75 kHz for axial alignment parallel to the applied field where d= dM + d e defined previously. However, since the molecular distribution is in clusters with various orienta- tions, nearly all the spins described by Eq. (1) are over a smaller frequency range. We do not know where such a broad component of the NMR line could originate from. To summarize, the origin of the spin loss as discussed above is not understood.
The plot for I = 1 in Fig. 9 is similar to that for the ratio R versus T shown in Fig. 5 of Ref. 9. Since S(1 = 2) follows Curie's law, R in Ref. 9 is equivalent to S(I = 1) x T. A sharp dip of R is observed at X = 0.55, becom- ing broader and moving to lower T for X = 0.45. As mentioned before, 9 this anomalous behavior is not observed for S(1 = 1) in solid H2, where Curie's law is observed at X =0.5 both from solid echo and from CW lineshape experiments 24 down to 0.4 K. Below this temperature, the gradual departure from Curie's law is attributed to thermal gradients in the sample from ortho-para conversion heat. This difference in behavior is not under- stood because the orientational ordering mechanism in both isotopic solids, namely intermolecular electric quadrupolar interaction, is the same. Also the average correlation times rc from T1 experiments have a similar behavior (see Fig. 20 of Ref. 9). We do not believe that there is a well-defined transition to a quadrupolar glass state in either solid H2 or D2, as discussed before, 9 but rather a gradual freezing into such a state as T decreases.
We note that such a signal loss has been observed by Cochran et al. 25"26 who used proton solid-echo NMR techniques of H2 impurities as a probe to study the orientational ordering in solid D2. For X = 0.50, their signal loss and partial recovery with decreasing temperature was comparable with that shown in Fig. 10 for X = 0.45 and in Ref. 9 for X = 0.55. The authors point out that their results are qualitatively similar to those in spin-echo experiments in some spin-glass systems. This would then indicate a collapse in the correlation frequency spectrum near the phase transition to the quadrupolar glass state. 25"26
A more recent reference to a spin-glass system containing Fe spins is that of Chen and Slichter, 27 where the results are discussed in terms of model calculations of the correlation times of Fe spins. These times show a maximum at the phase transition temperature. The authors also observed a sharp departure of the NMR intensity from Curie's law, which they attribute to a fraction of spins experiencing large local fields. This produces a very short T2 preventing the spin detection with their spectrometer. In

138 D. Clarkson, X. Qin, and H. Meyer
xy X--0.29 T=0.1K x--3oolas T=0.9K
80
S(I=1) 40
0.14 . . . . . . . . , . . . . . . . .
10OO
S(I=2) 5OO
0.12
R O.lO 0.08
0.06
0
0 0 0 0 O o o
O 0
0 0 0 0
0 , . . . . , , , I , , , , , ,
90
' �9 ' . . . . . I . . . . ' ' ' '
d
i I I . . . . I i . . . . . . .
, , , , , , , , i , , , , , , 4
f 0 o 0 0
O O ~
O 0
O 0
0
? , , . , , , , , I , , , , , . , ,
180 0 90 180
131(deg)
Fig. 10. The amplitudes S(I = 1) and S(I = 2) and the corresponding ratio R as a function of fit, following an xy sequence with /32=90 ~ and r=300 p~sec. Plots a,c,e: T=0.1 K, plots b,d, f: T=0.9 K.
our s i tua t ion with sol id De, such a large local field cannot be invoked , however .
Sul l ivan 28 has sugges ted that the I = 1 s ignal loss might be an effect o f sa tu ra t ion and o f s low spect ra l diffusion. He p r o p o s e d as a test to lower the r.f. field s ignif icant ly to see whe ther R wou ld increase. We have conduc- ted a de ta i l ed series o f tests bo th at 0.1 and 0.9 K, where we s tud ied S ( I = 1), S(I = 2), and R as a func t ion of /3 : with/32 = 90 ~ and r -- 300 p.sec. Because the first pu lse is the sa tu ra t ing one, we can expec t Socs in i l l . The results ( symbols ) in Figs. 10 (a ) - (d ) show indeed a s inuso ida l behav io r (sol id cur- ves) for bo th spin systems. The sl ight depa r tu r e f rom the expec ta t ions might

Pulsed N M R Studies in Solid D 2. L Solid Echo 139
reflect a sensitivity to spectrometer tuning. The ratio R in Figs. 10(e) and (f) show a variation as a function of/31. Although a higher value of R is measured for small/31 at 0.1 K, the effect is too small to explain the I = 1 "spin loss" observed in Fig. 9. We note that at T = 0.9 K, where the NMR line is narrower and the spectral diffusion presumably faster than at 0.1 K, the trend of R with/31 is in the opposite direction.
4.3. Echo Decay Studies
4.3.1. Static Intermolecular Interaction
In Figs. 2(a) and (b) we have shown representative echo amplitudes S ( I = I ) and S ( 1 = 2 ) after xx and xy sequences as a function of r. The scatter in the I = 1 signal is a consequence of the low signal intensity, discussed in Sect. 4.2. In Fig. 11 we show the addition of the absolute amplitudes Isxxl+lSyyl versus 2r for each spin. The insert shows a plot versus (2r) 2 which is linear, as expected from Eq. (7), and we obtain (1 + A)M2inter. For T > 500/xsec, the approximately straight line of the semi-
i n t e r �9 logarithmic plots leads to T2 via Eq. (10). However, beyond r = 1.2 msec, there is a departure from the exponential decay, and it is in this regime that the I = 1 signal decays faster than for the I = 2 spins, disappearing completely for r of the order of 3 msec.
Experience with a similar study on solid H2 suggests that (1 + A)M~ nter and T~ nter a re only weakly dependent on temperature, and the same is found to be the case in D2 within the experimental scatter. In Fig. 12 and 13 we
1000
500
ISxyl+lSxx I
200
100
' ' I ' ' I ' ' [ ' '
X~x X--0.45,T=0.1K
00000%00 I=2
I 0 0 0
o ~ o ~ \ (2x)'(gs)-
, , I , , I , , t , ,
600 1200 1800 2400
2x(Bs)
100
5C
213
10
x:015TLK �9 1=1
0 ( 2 ~ ) 2 ( i . ~ ) 2 2 x i o 6 " ~
600 1200 1 8 0 0 2400
2x(p.s)
Fig. 11. Sum of the absolute ampli tudes I Sx.~l + IS~v[ versus 2r for both (I = 1) and (I = 2) for T = 0.1 K and X = 0.45. The insert shows a plot versus (2~-) 2. The solid lines are guides to the eye.

1 4 0 D . C l a r k s o n , X. Q i n , and H . M e y e r
(1 + ~,) Minter (2tr)2 2
(kHz) 2
0.20 I ' I ' I ' I ' I '
0.15
0.10
0.05
T(K) I=2 o 0.1K
�9 0.2K t, OAK . . . . . . . . . . . . . : o:6 .
/ �9 /
' i , i , i , i , i ,
T ( K )
I=1 o OAK �9 0.2K a 0.4K �9 0.6K
/ �9
o o 01, 012 013 014 015 0 6 o o '01, '012 013 '014 015 0 6 X X
Fig. 12. The parameter (1 +A)M~ nter for spins ( I = 1) and ( I = 2), as obtained from decays of the type shown in Fig. 11. It is plotted as a function of X, and taken at several temperatures for different samples. The solid lines show the expected (1 +A)M~ nter, calculated from Eqs. (8) and (20) and normalized to the data at X = 0.48. The dashed lines are guides to the eye through the data.
plot these parameters for the I = 1 and I = 2 spins versus X. Here we have
used the same analysis for both spin systems, as if the theory were valid
for both. As can be seen, the results are the same for both spin systems
9 0 0 , [ , [ i i i ]
T(K) I=2 800 o 0.1K
�9 0 .2K OAK
700 �9 0.6K ~ 1.2K
T 2 inter..., t ~ 600 �9 %~
~ s ) 5oo �9 �9 ~ o
4OO
30~1.0 0.1 0.2 0.3 0'.4 0'.5 0.6 0.0 011 012 01.3 01.4 01.5 0.6
X X
Fig. 13. The parameter T ~ n t e r for spins I = 1 and I = 2, obtained from the exponential part of the solid echo decay of the type shown in Fig. 11. The plot is presented at various temperatures for different samples as a function of X. The solid line shows the calculated T~ nter as explained in the text.
T(K) I=l o 0.1K �9 0.2K t, 0.4K �9 0 .6K * 1.2K
o

Pulsed NMR Studies in Solid D2. I. Solid Echo 141
within the experimental scatter. In Fig. 12, the parameter (1 + A)Mi nter shows a decrease with decreasing X. The weakness of the I = 1 signal prevented data analysis for X = 0.05.
For comparison with expectations, we note that for D2, M2 vv has been directly determined from a CW study of NMR lineshapes 29 above 2 K, and the powder average results are in agreement with the predictions for a rigid lattice (Eq. (3) of Ref. 29)
M2VV/(27r)2=O.O31(5-3X) (kHz) 2 (20)
For an hcp single crystal in both H2 and D2, Mz vv is anisotropic, u'3~ with an angular variation of approximately 30%. We have not investigated the anisotropy in our different crystals, but we believe that it might be the cause of part of the scatter in Fig. 12 between various samples.
In Fig. 12 we represent by a solid line the expected dependence of (1 + ) t ) M i 2 nter o n X assuming A [the coefficient introduced in Eq. (7), and which is a function of lattice structure and crystal orientation] to be constant. Here we have normalized the curve to the data at X --0.48 with a value of ;t = 1.2. It can be seen that the observed dependence on X is quite different from the expected one, and this implies that )t is a function of X. This result is unexpected from the definition of A [Eqs. (19) and (20) of Ref. 2] and is also different from the data analysis for H2, where the fit of predictions and experiments led to ;t = 0.5, independent of X.
From the echo decay at larger r we derive the expected T~ nter via Eq. (10), shown by symbols in Fig. 13. The solid line represents the expected ~2Tinter, calculated from Eqs. (11) and (20) without adjustable parameters. Given the fact the Eq. (11 ) is just a Gaussian approximation, the agreement is very acceptable.
In summary, Figs. 11-13 show that the solid echo decay, at least up to r = 1.2 msec, is the same for spins I = 1 and I = 2, and is determined to a major extent by intermolecular dipolar interactions that are temperature independent. The behavior of the parameter 2 is not understood. A more detailed analysis is in progress.
For larger z, the decay is no longer exponential and, as mentioned before, the I = 1 signal decays faster than that of the I = 2 spins. This phenomenon has not been investigated in detail, and needs to be clarified.
4.3.2. Dependence of the Decay on f12
In Fig. 14(a) we present several amplitude measurements of
S . . . . (I = 1) = {[Sxx(I = 1)[ + ]Sxy(I = 1)l}/sin 2/3z (21)

142 D. Ciarkson, X. Qin, and H. Meyer
1.0 a)
0.5
Snorm
(I=1)
0.1
b) 1.0:
0.5
Snonn ( I=2)
0.1
- - , , , ,
X=0.28 T=O.2K
, i , , . ,
- B ~ �9 x ~ �9 o
~ x �9
Q
I , ,
1000
+
+ �9
�9 ~ 1350�9 �9 ~2~5 o
! �9 110 o �9
�9 650 �9 �9
l . * , . l , * * . l .
' ' I ' ' ' ' I ', [
0 0
0 O
X �9 0 X & 0
0 A X &
o o ~2=450 A X � 9 0
D X � 9 0
A 0
110% A 135~ o o o
650 o A ~0
0 , , I , J , , I , . , , I
2 ~ 0 3 ~ 0 4000
2 ~ ( ~ s )
Fig. 14. Normalized amplitude measurements of Snorm, ars defined by Eq. (21), plotted versus 2z for various pulse angles /32. The definition of S . . . . has been extended to spins (I = 2).
which , according to Eq. (7) can be written as
S . . . . ( I = 1)oc 1 -A( f12) (2r )2+ ' ' ' (22)
with
A(fl2) = (1 - c o s / 3 2 ) ( 1 + A)Mi9 nter (23)
In Fig. 14(b), we present the same plot for the ! = 2 spin system. For small e n o u g h r, the decay is again l inear on a plot versus (2r) 2 (not shown) . We note that as f12 increases, the decay rate increases until f12 = 110 ~ and then becomes smaller again. This result is different from that for H2, where the decay increases with f12 (see Fig. 11 in Ref. 2).
In Fig. 15a we plot the ratio A(/32) /A(/32=90 ~ as a funct ion of /32 for both ! = 1 and ! = 2. The symbols s h o w the experimental results and the

Pulsed N M R Studies in Solid 13 2. I. Solid Echo 143
a) 1.5
1.0
A(90 ~ 0.5
0.0
' ' I
.,//-,
' ' I
I = 1 ~
b) 1.5, , . ~ . ,
f S , S~ /
A (90 ~ ~ x
0 . 0 ~ , , 910 ' ' 180 0
(aeg.)
' ' I ' '
i i [ i i
90 180
~(deg.)
Fig. 15. The ratios A(flz)/A(fl2=90 ~ and A*(flz)/A*(fl2=90 ~ defined by Eqs. (23) and (25), as a function of f12. The data are obtained from the plot of Fig. 14 for both spins (I= 1) and (I=2). The solid lines are calculated as explained in the text.
solid curve the calculat ion f rom Eq. (23), assuming it applies also to the I = 2 spins. The agreement is good except for the largest angle, where the d iscrepancy is not unders tood.
Similarly to Ref. 2, we seek to express for larger r the sum of the absolute ampli tudes as
ISxxl + I Sx~,l oc e x p [ - 2 r A * ] (24)
with
A , ( / 3 2 ) = ( T ~ n t e r ) - l ( 1 - C O S / 3 2 ) 1 / 2 ( 2 5 )
The ratio A*([32)/A*(/32 = 9 0 ~ f rom the decays in Fig. 14 is plotted as a funct ion of/32 in Fig. 15(b), where the solid lines are the expectat ions f rom Eq, (25) with the experimental ly determined inter Tz . Except for the point at the largest angle, the agreement between experiments and expectat ions is very good.
144 D. Clarkson, X. Qin, and H. M e y e r
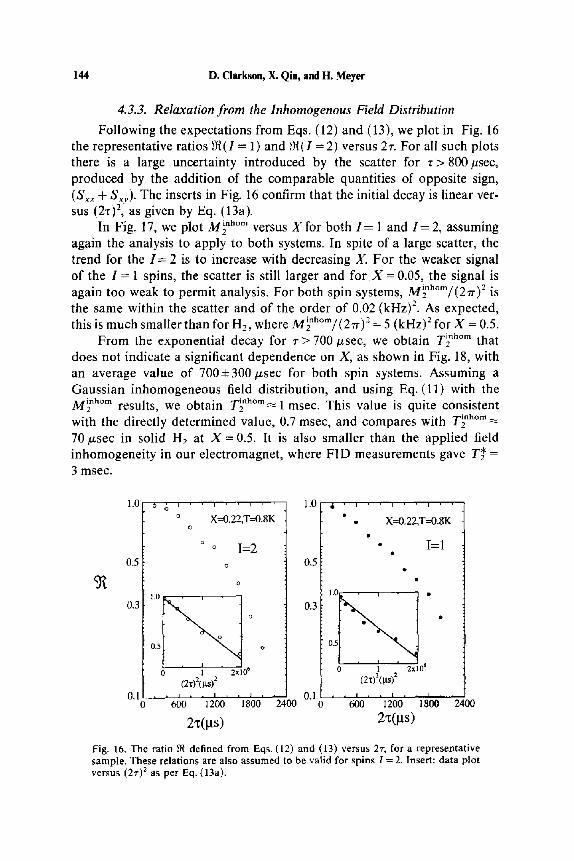
4.3.3. Relaxation from the Inhomogenous Field Distribution
Following the expectations from Eqs. (12) and (13), we plot in Fig. 16 the representative ratios ~ ( I = 1) and ~ ( ! = 2) versus 2r. For all such plots there is a large uncertainty introduced by the scatter for z > 800/~sec, produced by the addition of the comparable quantities of opposite sign, (Sxx + Sxy). The inserts in Fig. 16 confirm that the initial decay is linear ver- sus (2z) 2, as given by Eq. (13a).
In Fig. 17, we plot ~rinhom ""2 versus X for both I = 1 and I = 2, assuming again the analysis to apply to both systems. In spite of a large scatter, the trend for the I = 2 is to increase with decreasing X. For the weaker signal of the I -- 1 spins, the scatter is still larger and f o r X = 0.05, the signal is again too weak to permit analysis. For both spin systems, Mi2nh~ 2 is the same within the scatter and of the order of 0.02 (kHz) 2. As expected, this is much smaller than for H2, where M~nh~ 2 = 5 (kHz) 2 for X = 0.5.
From the exponential decay for r > 700/zsec, we obtain T ~ h~ that does not indicate a significant dependence on X, as shown in Fig. 18, with an average value of 700+300/~sec for both spin systems. Assuming a Gaussian inhomogeneous field distribution, and using Eq. (11) with the A/finh~ results, we obtain inhom T2 ~ 1 msec. This value is quite consistent l v l 2
T i n h o r n with the directly determined value, 0.7 msec, and compares with -2 70 p.sec in solid H2 at X = 0.5. It is also smaller than the applied field inhomogeneity in our electromagnet, where FID measurements gave T* -- 3 msec.
1.0 1.0
0.5
0.3
0.1
o ~ i �9 ' i ' i ,
o X--0.22,T--0.8K o
o ~ 1=2
o
0 ' 5 f , I , ~ . o
0 1 2 x 1 0 ~ (2x)Z(gs) 2
' ' ' ' 1 2 n'O0 ' ' ' " 600 1800 2400
2z(~s)
0.5
0.3
0.1 0
�9 X--0.22,T=0.8K
�9 I - - 1
1.0L . j �9 . �9
0 ~
(2~)z(las) z
, i , ,
' ' 600 ' '12'00' 1800 2400
2Z(l.tS)
Fig. 16. The ratio ,~ defined from Eqs. (12) and (13) versus 2% for a representative sample. These relations are also assumed to be valid for spins I = 2. Insert: data plot versus (2r) 2 as per Eq. (13a).

Pulsed NMR Studies in Solid D2. I. Solid Echo 145
0,06 , i , i , i , i , i ,
f T(K) o 0.1K �9 0 . 2 K 0.05 1=2 t, OAK �9 0 . 6 K
M2inh~ 2 0"04 f0.03 $ ~* �9 1.2K
(knz)2 f �9 ~ ~ ~ ** 0.02 �9 ~ o o"
o
0.0,
} , t , t , I , I , t , 0.0 0.1 0.2 0.3 0.4 0.5
X
' I ' I ' I ' I ' I '
T(K) o OAK
I=l �9 0 . 2 K ,~ OAK �9 0 , 6 K �9 1 . 2 K
�9 o �9
�9 o a o ~-
o
o6 o o 01, 012 013 014 015 0 6 X
M 2 / (2~ ' ) versus X for bo th ( I = 1) and ( I = 2) at var ious tem- Fig. 17. Plot of inhom 2 perature .
4.4. The S h i f t o f the I = 2 M a x i m u m
4.4.1. Analysis of the Shift from the Solid Echo Decay
The shift o f the I = 2 max imum with respect to the expected locat ion o f the echo at ~" has been defined by 6t = ~'- t . . . . In Fig. 19, we plot 6t versus r for the xy and xx sequences with/32 = 90 ~ at a given X and T. For the xy sequence, the shift increases f rom zero as a funct ion o f r, and passes over a very b road maximum. By contrast, 6t in an xx sequence starts from a negative value and changes sign with increasing ~-. This change is located at a smaller r than the max imum ampli tude o f Sxx. (Compare with Fig. 2.)
T2 inhom
(V.S)
2000 .
1500
1000
500
T(K) o 0.1K �9 0 . 2 K
* OAK �9 0 . 6 K
�9 1 . 2 K
I=2
�9 �9 o � 9
�9 o
A o �9 A
A �9 �9
i �9
' I � 8 4 I
T(K) o OAK �9 0.2K ,~ 0.4K �9 0 . 6 K
�9 1 . 2 K
f=l
o o
o o 011 012 013 014 015 o6 o o 011 012 013 014 015 X X
Fig. 18. Plot o f " / m 2 n h ~ v e r s u s X for bo th ( I = 1) and ( I =2) .
0.6

146 D. Clarkson, X. Qin, and H. Meyer
10(
5t (gs)
I I i i i I
T = 0.3K X = 0.3 xy
I I I I 0 016 112
0
0 0.6
10s
i , i i r
x x
I 1.2
z(ms)
Fig. 19. The shift in time 6t versus T for x y and x x sequences with f l2=90 ~ for X = 0.30 and T = 0.30 K. Solid lines: calculated as explained in the text.
We now analyse this shift as a result of the distortion of the broader I = 2 echo by the envelope decay caused by intermolecular dipolar interac- tions. 5 We examine the xx and xy echo decays of the type presented in Fig. 2 and make use of the echo shapes in Figs. 20(a) and (d).
We start with the simpler decay profile from an xy sequence and note that for 1.0 > z > 0.4 msec the amplitude Sxy can be approximately represented by the form
Sxy(I = 2) = A0 e x p [ - ( z / b ) ] (24)
a) b) c)
~~ ' A x,; , ~ ; ~oo . . . . . . t,~oj . . . . . . i | / ~ d T=0.3K t ~ 'C=700ps
~ \ x.. K ,>,, o , o
0 0.6 1.2 0.2 0.8 1.4 0.2 0.8 1.4
d) e) t(ms) 1)
S(t)[i~r k 411 ,801"f~', ,'~i ",X: :=200~ 120601/~0~[, ....,, i~, 0%=;00~ 14020~ ..... 0 0.4 0.8 1.2 0.4 O.S 1.2 0.8 1.2 1.6
t(ms)
Fig. 20. Echo shapes after an r.f. sequence with f12 = 9 0 ~ for three different values of ~. Figures 20(a)-(c): x y sequence; (d)-(f): x x sequence, for X = 0.30 and T = 0 . 3 0 K. The solid lines are the best fits (a) and (b) and predictions (b), (c), (e), and (f) based on these fits, as described in the text.

Pulsed NMR Studies in Solid D 2. I. Solid Echo 147
where b is a free parameter that is related to the characteristic times T~ nter -r~nhom discussed before. The analysis proceeds in three steps. and -2 (1) First the solid echo envelope decay is fit to Eq. (24) and b is
determined. (2) Then as a first approximation, the observed ( I = 2) echo shape E, .
for r = 400 #sec [Fig. 20(a)] is fit to a Gaussian,
Exy(t -/max) = e x p [ - ( t - t m a x ) 2 / a 2] (25)
and the parameter a is obtained, which can be written as
a = Ah/2(ln 2) ~/2 (26)
where Aft~2 is the halfwidth at half amplitude. (3) In the decay fit, Eq. (24), the weighted sum [~:t + (1 - s c) r] is empiri-
cally substituted for ~'. We then form the product
E x y ( t , , r ) = A o e x p { - ( t - r ) 2 / a 2 } e x p { - [ ~ t + ( 1 - ~ ) r ] / b } (27)
which represents a Gaussian shape centered at r, distorted by an exponential decay and where ~ is a fit parameter. This is representative of the solid echo formation, namely in the time r between the pulses, a fraction of the spins decay out of the initial coherence and the number of remaining spins is proportional to e x p { - ( 1 - ~)z/b}. The parameter ~ is a measure of this spin decay rate. After the second pulse, there is also a continuous decay of spins represented by the term exp[ - (~ . t /b ) ] , which distorts the expected Gaussian echo shape centered at t = r, making it appear shifted. Note that at t = r , one regains the original decay shape, Eq. (24). Furthermore Eq. (27) is fit to an observed echo to determine the weighting parameter ~. This fit is shown in Fig. 20(a) by a solid line.
All fit parameters are thus known and we calculate from Eq. (27) the echo shape for 1.0> r > 0 . 4 msec. Figures 20(b) and 20(c) show two rep- resentative curves generated from this empirical fit for r = 0.7 and 1.0 msec. Now ~t may be extracted from Eq. (27) by differentiating with respect to
t. We find
6t = a2~/2b = (Atl /2)2~/(2b In 2) (28)
This is shown in Fig. 19(a) by a solid line that spans the range of validity of Eq. (24) 0.4 < ~ < 1.0 msec.
We now extend the same method to the xx sequences, but take into account the more complicated echo envelope profile, shown in Fig. 2. Here the envelope is fit to the form
Sxx( r) = Ao e x p ( - r / b )[1 - e x p ( - r ' / d ) ] (29)
over the range 1.1 > r > 0.2 msec and the parameters Ao, b, c, and d are determined, where b reflects again the echo decay and should have nearly

148 D. Clarkson, X. Qin, and H. Meyer
the same value as for the xy sequence. To calculate the I = 2 echo shape and shift, we use Eq. (25) that expresses the solid echo Gaussian form with the same parameter a as before. In the same spirit as with the xy sequence echoes, we form the product
Exx (t, r) = A o exp{ - ( t - z)2/a 2 } exp[ - { [~t + (1 - ~)z]/b } ]
x {1 - exp[ - [ {qt + (1 - r/)~ }'/d] ] } (30)
Here 77 is a new parameter with the same purpose as ~:. That is, they both divide the echo formation into two parts, one before and one after the second pulse. We determine ~ by fitting Eq. (30) to an echo at long enough r, where the echo envelope has a nearly exponential decay. Then T/ is determined by fitting Eq. (30) (with the known ~:) to an echo at short r. This equation then reproduces the echo shapes Exx(t, z) for various z and representative examples are shown in Figs. 20(d), (e), (f). The agreement is surprisingly good. In particular, the calculation reproduces the change in sign of the shift, as shown in Fig. 19(b) by the solid line.
Finally, it is instructive to show the shift at constant r versus temperature for an xy sequence. This is done in Fig. 21 for a sample with X = 0.27 and r = 400/zsec, where we present by symbols both the observed echo halfwidth At,/2 (left side) and the shift 6t (right side). As the induced polarization in o-D2 through the J = 1 orientational ordering increases to a limiting value, both the echo width and the shift diminish with decreasing T, and reach a limiting value. Note that Eq. (28) gives the relationship between the shift 6t and the characteristic width At]/2, where the parameters b and ~: are constant with temperature, since they are determined by the intermolecular dipolar interactions (see also Table II). Also a is obtained from At1/2 via
450
Ate/2 (gs)
350
250
. . . . . . i . . . . . . . . I
X=0.27
*
0.1 1.0
140
1oo
60 . . . . . . i . . . . . . . . i
0.1 1.0
T(K)
Fig. 21. The echo ha l fwid th Ate~2 and the t ime shif t 6t versus t empera tu re T for X = 0.27 and z = 400 p.sec. The sol id l ine is ca lcula ted , as exp la ined in the text, with a ra t io ~/b= 1.15x l0 -3.

Pulsed N M R Studies in Solid D 2. I. Solid Echo 149
TABLE II
The Coefficients for the Fit of the Echo Shape E(I=2) and of the Amplitude S(I=2), Eqs. (25), (27) and Eqs. (28), (29) for xy and xx Sequences to the Experimental Data as
Described in the Text
Temp. r.f. a 2 • 10-4 b d • 10 6 (K) seq. Ao (#sec) 2 (~zsec) (l~sec) c c ~ q
0.1 xy 3100 8.04 243 0.4 - - xx 1800 8.04 230 1.12 2.25 0.65 0,26
0.3 xy 3000 10.0 251 - - - - 0.45 - - xx 1587 10.0 264 14.22 2.67 0.65 0.25
1.2 xy 4000 20.0 230 - - - - 0.45 - - xx 2206 20.0 246 156.5 3.02 0.45 0.22
Eq. (26). The solid line in Fig. 21 is then ob ta ined by adjus t ing the ra t io b/~ to fit the da t a at an in termedia te t empera tu re and the agreement is very sat isfactory, showing the shift mechanism to be qual i ta t ively unders tood.
5. S U M M A R Y
In this s tudy the sol id echo p roper t i e s were inves t iga ted as a func t ion
o f a var ie ty o f pa ramete r s , bo th in the r.f. sequence and in the sample c o m p o s i t i o n and t empera tu re . The two last pa rame te r s de te rmine the degree o f o r i en ta t iona l o rde r ing in p-D2 and the i nduc e d order ing in o-D2, as de tec ted by the N M R o f the 1 = 1 and I -- 2 spins. In pa r t i cu la r the echo a m p l i t u d e S at the t ime z af ter the second pulse was inves t iga ted in detai l . The ma in results are as fol lows:
(1) The a m p l i t u d e S ( I = 2) fol lows Cur ie ' s law as expec ted , but there are s t rong depa r tu re s for S ( l = 1) that are a funct ion of X. These ind ica te
that a f ract ion of the I = 1 spins might be d is t r ibuted over a very wide N M R line tha t cannot be detected with our ins t rumenta t ion , or that there is a very rap id init ial decay of the echo envelope. Such a behavior is s imilar to tha t repor ted near a sp in-g lass t ransi t ion. However this p h e n o m e n o n is not observed in solid H2 a l though the in terac t ions leading to or ien ta t iona l order ing are the same as in D2. Tests imply that the depa r tu re from Curie 's law in D 2 is not related to the slow spectral diffusion in the shor t - range near ly o rdered state.
(2) Just as in sol id H2, the S ( I = 1) behav io r as a funct ion of the pa rame te r s o f the r.f. sequence can be well u n d e r s t o o d in terms o f the dens i ty mat r ix theory d e v e l o p e d previously . Fo r the I = 2 system, there is as yet no de t a i l ed theory. However , the exper imen t s show a very s imi lar behav io r to that o f the I = 1 spins.

150 D. Clarkson, X. Qin, and H. Meyer
(3) The amplitude ratio R = S ( I = 1 ) / S ( I = 2) for a given sample com- position and temperature is a function of the pulse sequence parameters, It is also smaller than expected from the respective abundances of p-D2
and o-D2. The ratio dependence on the various parameters can only be understood once a complete treatment of S for I = 2 spins is available.
(4) The expected triplet echo structure for the I = 2 spins has not been observed, contrary to findings for D2 absorbed in silicon and adsorbed on MgO, where the static intramolecular fields are much larger than in solid D2.
(5) The intermolecular dipolar interaction parameters, determined from the solid echo decay have been studied and compared with expectations for both spin systems. The (I = 1) echo is found to decay faster than the (I = 2) echo at long enough r.
(6) Just as in solid H2, there is in solid D2 evidence of an inhomogeneous field, which might be responsible for causing the absence of the two satellites in the expected ! = 2 triplet structure.
(7) The I = 2 echo peak shift 8t has been analyzed as an effect of the echo width and the echo decay with r. An empirical formula was developed to describe ~t for both xy and x x sequences. This model describes well the observed temperature dependence of the shift.
In conclusion, it is hoped that the large amount of data accumulated on D2 will stimulate an extension of the complete matrix theory to the I = 2 system. Also the striking anomalies observed in some of the properties, such as the departure from Curie's law for the I = 1 spins, and the absence of the I = 2 satellite structure deserve further study.
ACKNOWLEDGMENTS
The authors are most grateful to R. E. Norberg for the gift of enriched p-D2 gas produced by J. R. Gaines, and for advice and insight in the early stages of the experiment. One of the authors (H.M.) has greatly benefited from stimulating correspondence, discussions and comments on a draft of this manuscript by M. S. Conradi, I. Yu, S. Washburn, and N. S. Sullivan. The insight provided by M. Conradi on the satellite echoes has been particularly appreciated. A helpful conversation on the missing I = 1 spins with C. P. Slichter is acknowledged. The authors thank P. Sokol for supplying a copy of his PhD thesis. This work has been supported by the NSF Low Temperature Physics Grant DMR 8820479.
REFERENCES
1. D. Esteve and N. S. Sullivan, J. Phys. C: Solid State Phys. 15, 4881 (1982). 2. I. Yu, S. Washburn, and H. Meyer, J. Low Temp. Phys. 51,369 (1983).

Pulsed N M R Studies in Solid D 2. I. Solid Echo 151
3. I. F. Silvera, Rev. Mod. Phys. 52, 393 (1980). 4. J. Van Kranendonk, Solid Hydrogen (Plenum Press, New York, 1983). 5. J. Constable and J. R. Gaines, Phys. Rev. B 3, 1556 (1971). 6. F. Weinhaus, H. Meyer, and S. M. Meyers, Phys. Rev. B 7, 2948 (1973). 7. D. S. Metzger and J. R. Gaines, Phys. Rev. 147, 644 (1966). 8. M. G. Semack, J. E. Kohl, D. White, and J. R. Gaines, Phys. Rev. B 18, 6014 (1978). 9. M. Calkins, R. Banke, X. Li, and H. Meyer, J. Low Temp. Phys. 65, 47 (1986).
10. M. Calkins, R. Banke, X. Li, and H. Meyer, J. Low Temp. Phys. 65, 90 (1986). 11. R. Banke, X. Li, D. Clarkson, and H. Meyer, J. Low Temp. Phys. 72, 99 (1988). 12. W. N. Hardy and A. J. Berlinsky, Phys. Rev. B 8, 4996 (1973). 13. A. B. Harris, Phys. Rev. B 2, 3495 (1970). 14. N. Boden and P. K. Kahol, Chem. Phys. Lett. 68, 158 (1979). 15. M. P. Volz, P. Santos-Filho, M. S. Conradi, P. A. Fedders, and R. E. Norberg, Phys. Rev.
Lett. 63, 2582 (1989). 16. E. K. Jeong, B. Ouyang, R. E. Norberg, P. Fedders, and M. S. Cofiradi (to be published). 17. J. H. Van Vleck, Phys. Rev. 74, 1168 (1948). C. P. Slichter, Principles of Magnetic Resonance
(Springer, Berlin, 3rd Edition, 1989), Section 3.3, p. 71. 18. P. Fedders, private communication. 19. M. S. Conradi, private communication. 20. N. Boden, S. M. Hanlon, Y. K. Levine, and M. Mortimer, Chem. Phys. Lett. 57, 151 (1978). 21. Henry Radio Model 2KD "'CLASSIC" Linear Amplifier. 22. X. Qin and H. Meyer, to be published. 23. C. P. Slichter, Principles of Magnetic Resonance (Springer, Berlin, 3rd Edition, 1989),
Section 5.12, p. 206. 24. S. Washburn, M. Calkins, H. Meyer, and A. B. Harris, J. Low Temp. Phys. 53, 585 (1983). 25. W. T. Cochran, J. R. Gaines, R. P. McCall, P. E. Sokol, and B. R. Patton, Phys. Rev. Lett.
45, 1576 (1980). 26. P. E. Sokol, Thesis, Ohio State University, 1981 (unpublished). 27. M. C. Chen and C. P. Slichter, Phys. Rev. B 27, 278 (1983). 28. N. S. Sullivan, private communication. 29. F. Weinhaus, S. M. Myers, B. Maraviglia, and H. Meyer, Phys. Rev. B 3, 3730 (1971). 30. S. Washburn, M. Calkins, H. Meyer, and A. B. Harris, J. Low Temp. Phys. 49, 109 (1982).