PULSE OF THE FASHION INDUSTRY · It aims to provide transparency on the indus- try’s stance in...
74
PULSE OF THE FASHION INDUSTRY
Transcript of PULSE OF THE FASHION INDUSTRY · It aims to provide transparency on the indus- try’s stance in...

PULSE OF THE FASHION INDUSTRY
PULSE OF THE FASHION INDUSTRY
Publisher: Global Fashion Agenda & The Boston Consulting Group
Copywriter: John Kerr, John Landry
Graphic Designer: Daniel Siim
Art director: Thomas Blankschön
Cover photo: Copenhagen Fashion Week
Photos: Machines documentary - Rahul Jaan I:CO/SOEX GroupCopenhagen Fashion WeekGreenpeace - Jeff Lau, Lu Guang, Andri Tambunan, Peter Caton, Rezza Estily, Liu Feiyue
Print: KLS PurePrint A/S
2017 Copyright © Global Fashion Agenda and The Boston Consulting Group, Inc.
Version 1.2: Updated exhibit 16, page 42 and exhibit 28, page 77 (Cradle to gate environmental impact by material) based on the latest Higg MSI Scores provided by the Sustainable Apparel Coalition
All rights reserved. Reproduction is strictly prohibited without prior written permission from the authors.
Every effort has been made to trace the copyright holders for this publication. Should any have been inadvertently overlooked, Global Fashion Agenda and The Boston Consulting Group will be pleased to make the necessary changes at the first opportunity.
Acknowledgements
The authors would like to thank the Sustainable Apparel Coalition for providing the data that made it possible to take the Pulse of the Fashion Industry, and the colleagues who contributed to this report: Jason Kibbey, Baptiste Carrière-Pradal, Julie Holst and Betsy Blaisdell.
A big thanks goes out to all the respondents who participated in the Pulse Survey.
In addition, we would like to thank all the experts that donated their time and expertise to make this report come to life, including Hendrik Alpen, Michael Beutler, Marc Binder, Marie-Claire Daveu, Sabine Deimling, Anna Gedda, Linda Greer, Sarah Jastram, Leslie Johnston, Ivanka Mamic, William McDonough, John Mowbray, Emmanuelle Picard-Deyme, Irene Quarshie, Harsh Saini, Mark Sumner, Géraldine Vallejo, Dilys Williams and Åsa Östlund
The authors would also like to thank all the members of the BCG fashion and sustainability community for their contribution to this report, including Olivier Abtan, Christine Barton, Filippo Bianchi, Bharat Khandelwal, Stefan Rasch and Christina Synnergren.
This report is Cradle to Cradle Certified™ and environmentally neutral. The paper and ink contains no harmful chemicals or heavy metals, and are 100% biodegradable. Printed by KLS PurePrint A/S, a 100% sustainable printing house.
GLOBAL FASHION AGENDA
Global Fashion Agenda is a global leadership forum on fashion sus-tainability founded in 2016 and anchored around Copenhagen Fash-ion Summit, the world’s principal event on sustainability in fashion for industry decision-makers. Global Fashion Agenda advances a year-round mission to mobilize the international fashion industry to trans-form the way we produce and consume fashion, for a world beyond next season. In partnership with sustainability pioneering industry leaders including Kering, H&M, Target, Li & Fung and Sustainable Ap-parel Coalition, Global Fashion Agenda sets the agenda for the indus-try on the most critical environmental, social and ethical issues, and advocates for a collective industry focus on the largest opportunities. Global Fashion Agenda is a not-for-profit initiative. For more informa-tion, please visit www.copenhagenfashionsummit.com/global-fashion-agenda
THE BOSTON CONSULTING GROUP
The Boston Consulting Group (BCG) is a global management con-sulting firm and the world’s leading advisor on business strategy. We partner with clients from the private, public and not-for-profit sec-tors in all regions to identify their highest-value opportunities. Our customized approach combines deep insight into the dynamics of companies and markets with close collaboration at all levels of the client organization. This ensures that our clients achieve sustainable competitive advantage, build more capable organizations, and secure lasting results. Founded in 1963, BCG is a private company with 85 offices in 48 countries. For more information, please visit www.bcg.com
G L O B A L F A S H I O N A G E N D A

INTRODUCTION / PAGE 1
Towards a Better Fashion Industry
CHAPTER 1 / PAGE 7
The Case for Change is Indisputable
CHAPTER 2 / PAGE 25
Pulse Check of the Industry
CHAPTER 3 / PAGE 69
A Landscape for Change
CHAPTER 4 / PAGE 105
A Call for Collaboration and Innovation
CONTENTS

INTRODUCTION
TOWARDS A VISION OF A BETTER FASHION INDUSTRY
About the report
The authors of this report—The Boston Consulting Group (BCG) and Global Fashion Agenda (GFA)—have developed a common fact base on the health of the in-dustry, and have evaluated and quantified the overall opportunity for sustainability in fashion. GFA and BCG worked in close collaboration with GFA’s strategic partners that have acted as a sounding board, com-prising H&M, Kering, Li & Fung, Target, and the Sustainable Apparel Coalition (SAC). Further, the SAC has acted as an exclusive data provider through the Higg Index. BCG has analyzed this data in depth, and has complemented the input to get a representative metric on sustainability in fashion: the Pulse Score.
The fashion industry has a clear opportunity to act differently, pursu-ing profit and growth while also creating new value for society and there-fore for the world economy. It comes with an urgent need to place environ-mental, social, and ethical improvements on management’s agenda.
In recent decades, the fashion industry has been an engine for global development. One of the world’s largest consumer industries,1 generating €1.5 trillion in annual apparel and footwear revenues in 2016,2 it employs around 60 million people along its value chain.3
To continue the growth trajectory, the fashion industry needs to ad-dress its environmental and social footprint. The earth’s natural resourc-es are under pressure, and the fashion industry, although not the most obvious contributor, is a considerable one. Social conditions—also in the fashion industry—are far from those set forth in the United Nations’ goals for sustainable development. With current trajectories of production and consumption, these pressures will intensify by 2030 to the point of threat-ening industry growth itself.
With resources becoming even scarcer, the industry will face rising costs from labor to materials and energy. Based on conservative projec-tions, fashion brands’ profitability levels are at risk in the range of at least 3 percentage points if they don’t act determinedly, and soon.
The facts show a clear need for acting differently. The good news is that by changing practices, the industry can both stop the negative impact and generate a high amount of value for society, while also protecting profitability. We estimate that the world economy would gain about €160 billion annually if the fashion industry would successfully address those environmental and social issues.
As of today, the sustainability ‘pulse’ of the industry is weak. The new-ly developed global Pulse Score, a health measure for the sector (see page 28 for more details), is only 32 out of 100. The industry is not yet where it could and should be. The spread of performance is also quite large. The best performers on sustainability are the very big players as well as some mid-sized, family owned companies, while over half of the market, mainly small to medium-sized players, has shown little effort so far. The rest of the industry is somewhere in between. This is confirmed by the Pulse Survey (further information on pages 35/36), where two-thirds of polled fashion executives have not made environmental and social factors guiding princi-ples for their companies’ strategy.
Fashion brands with targeted initiatives will be best placed to improve their environmental and social footprint and counteract the rising costs of apparel production. They will pull ahead of their competitors with innova-tive ways of doing business and efficient production techniques that min-imize the use of water, energy, and land, as well as hazardous chemicals. By realizing better working conditions and improving workers’ safety, they will minimize their operational and reputational risks and create significant value for themselves and the world economy. These initiatives will improve the overall industry Pulse, raising the average and creating inspiring best practices for the low performers to learn from.
However, even if the entire industry caught up to the best practice front-runners, it would not be enough. Under optimistic and ambitious as-sumptions, only less than half of the €160 billion could be captured.4 The industry needs coordinated action beyond today’s solutions. This report explains the size of the challenge and the need for innovation, collabora-tion and supporting regulatory action to close the gap.
2PULSE OF THE FASHION INDUSTRY

This first edition of the Report on the Pulse of the Fashion Indus-try exposes the challenges in a number of sustainability impact areas and along the industry’s value chain, from design and development to end-of-life for apparel and footwear. It aims to provide transparency on the indus-try’s stance in terms of its environmental, social, and ethical footprints—topics that have been much debated, yet without a common baseline and framework against which to evaluate change. It also reviews ways in which the industry can maintain and even strengthen its profitability despite the pressures of rising costs.
The overarching objective of the report is to provide a direction and guidance towards a better fashion industry. As a starting point, the report provides a common fact base on the current sustainability performance of the industry. Based on that it lays out a Landscape for Change and pre-sents pragmatic, concrete, and economical actions that are already availa-ble for producing palpable change. The report promotes collaboration and innovation as main drivers to accelerate change.
BOLDER LEADERSHIP NEEDED NOW
What will it take to tackle the changes necessary to improve the in-dustry’s standing—and to safeguard its profitability? First, it is important to acknowledge that many laudable efforts are already being made across the industry. Individually, many companies are striving to optimize busi-ness practices. Collectively, too, many initiatives have been launched with the goals of educating consumers, striving for substantial improvements, building broad industry networks dedicated to environmental, social and ethical objectives, and more.
There is no shortage of non-government organizations and private foundations to provide education, incentive, and oversight. There are also working groups, forums, and conventions, with the Global Fashion Agen-da’s annual Copenhagen Fashion Summit as the world’s leading event on sustainability in fashion.5 Much effort has gone to develop transparency indexes as standard supply chain measurement tools, such as the Sustain-able Apparel Coalition’s (SAC) Higg Index that is already in use by many companies. These enable all industry participants to understand the en-vironmental and social impacts of making and selling their products and services.6
All of these well-staffed and well-thought-out initiatives have helped companies make real progress in sustainability and built a foundation for future improvement. Despite those efforts, the pulse of the industry is weak. Therefore we advocate for a consolidation and realignment of ef-forts and resources towards high impact levers, with fewer and stronger initiatives. It’s now time to work for the broad commitment necessary to make the extensive, industry-wide changes required. We need to go be-yond campaigns driven by single entities that yield incremental results. In-dividual fashion brands cannot drive major changes on a large scale across value chains, impact areas and geographies. And individual governments cannot set the regulatory framework for a global industry.
We need well-orchestrated, system-wide actions that involve a broad coalition of stakeholders. That requires bold leadership: from fashion busi-nesses in prioritizing, collaborating and committing to actions on criti-
cal areas for improvement; from bodies such as NGOs, industry associ-ations, and consortia in coordinating and driving the cross-industry and cross-functional collaboration to propel change; and from regulators in amplifying change with supportive incentives—or in interfering with strong dictates when the industry moves too slowly.
All this is more easily said than done.
There is, however, every possibility that change can happen in a short time. The fashion industry has in-built advantages: the creativity that is its most emblematic trait and the public admiration it continues to enjoy. Sup-ported by disruptive technologies, fashion has the talent, the networks, the funding, and all of the resources it needs to transform itself. Now is the time to start doing things differently.
4PULSE OF THE FASHION INDUSTRY3 INTRODUCTION

©CFW

CHAPTER
THE CASE FOR CHANGE IS INDISPUTABLE
The fashion industry is highly fragmented, with thousands of actors involved and one of the most complex global production networks and supply chains. There is not a standard path for the cotton produced in one country, spun in another, dyed and processed in a different one and con-verted into a garment in a factory far away from the store. And often, there is no view of the ‘real cost’ incurred.
It is challenging then to truly gain an understanding of what the crit-ical sustainability issues are and to fully grasp the magnitude of the value at stake.
In fact, there is a lack of reliable facts to guide action. It is not enough to respond to unsubstantiated statements such as “The global fashion industry is the second most polluting industry in the world”. Data and agreed-upon links between cause and effect are what spark ideas, create conviction, and sponsor action. With this report, GFA and BCG intend to start building a frame of reference that transcends misconceptions and for the first time offer a common baseline of facts and ideas, empowering the fashion industry to act.
This chapter provides global environmental and social facts at a glance and looks at how they relate to the fashion industry. It also pre-sents a projection to 2030 that assumes the fashion industry continues on its current trajectory of production and consumption. To highlight the opportunity, we conclude by calculating the value at stake for the world economy and arguments for businesses to start acting now.
2030: 8.5 BILLION PEOPLE WILL REQUIRE CLOTHING
If the global population rises as expected to 8.5 billion people by 20307 and the GDP per capita grows at 2% per year in the developed world and 4% in the developing world,8 GFA and BCG project that the overall apparel consumption will rise by 63%, from 62 million tons today to 102 million tons in 20309—an equivalent of more than 500 billion T-shirts. Concurrently, soaring demand for apparel—much of it from developing nations—will see the annual retail value of apparel and footwear reach at least €2.0 trillion by 2030 (an over 30% increase of €500 billion between now and then).10
We explore below how the growth of the industry—in terms of value and volume—comes with increased environmental and social costs. We consider these mounting costs from the global and the industry perspec-tive.
To gain a sense of the importance of each impact area, GFA and BCG have placed a monetary value on each externality. This enables a transpar-ent illustration of how much value is at stake for the world economy—rep-resenting human economic activity, social and natural capital—in a tangi-ble and comprehensive way. In this report we present exemplary evidence for the economic viability of sustainability initiatives. Estimating the full business opportunity for individual companies implementing sustainable practices will be a topic of future editions of the Pulse report. This assess-ment will be carried out in cooperation with corporate frontrunners on the subject.
18PULSE OF THE FASHION INDUSTRY

The Planetary Boundaries Have Already Been Breached
In 2030, the Planetary Boundaries Will Be Even Further Exceeded
Note: Illustration adapted from UN Environment Programme, Rockström et al. and Steffen et al., representing today's statusSource: BCG analysis; UN Environment Programme (2012); Rockström et al. (2009); Steffen et al. (2015)
1. Fashion consumption of apparel and footwearSource: BCG analysis
Planetary boundary
Energy emissions
Land use
Water consumption
Chemicals usage
Waste creation
Distance from planetary boundary
Exhibit 1 The Planetary Boundaries 2015
Exhibit 2 The Planetary Boundaries 2030
PHOSPO
RUS C
YCLE
NIT
RO
GE
N C
YC
LE
PHOSPO
RUS C
YCLE
NIT
RO
GE
N C
YC
LE
Increasing Fashion Consumption is Creating Further Environmental StressProjected Environmental Impacts
Projected global fashion consumption1 (Million tons)
Exhibit 3
2015
62
2030
102
79
2015 2030
1,715
37
92 +62%
+63%
+50%118
2,791
148
Water consumption
Consumed water(billion cubic meters)
Emissions of CO2(millions tons)
Chemicals management(Pulse Score in %)
Pulse Score not to be projected
Produced waste(million tons)
Energy emissions
Chemicals usage
Waste creation
Env
iro
nmen
tal i
mp
act63%
ENVIRONMENTAL PRESSURES PUT €110 BILLION VALUE AT STAKE When we look at the planet from the perspective of several plan-
etary boundaries, delimiting an environmentally sustainable safe operat-ing space for humanity, as defined by a group of earth environmental sci-entists led by researchers from the Stockholm Resilience Center and the Australian National University, it becomes clear that the planet is already facing significant tensions based on human activity.11,12 According to these researchers the planet is already beyond its safe operating space in terms of climate change, waste pollution, changes in land use, and biochemical output.13,14 (See Exhibit 1.) That means we face increasingly higher risk of destabilizing the state of the planet,15 which would result in sudden and ir-reversible environmental changes with potentially large damaging impact on the world economy.
Although the harm is, of course, not all due to the fashion industry, the industry’s present linear business model is an obvious contributor to stress on natural resources.
If production and consumption of apparel and footwear follow their current trajectories, increasing by another 63%, fashion’s environmental footprint will continue to contribute to the negative impacts on the planet. (See Exhibit 3.)
The additional strain of an expanding environmental footprint can be observed on a number of impact areas, specifically water use, CO2 emis-sions, use of chemicals, and generation and disposal of waste.
Given that the natural resources of the planet are already burdened, the projected increase in the industry’s environmental footprint will exac-erbate the situation. (See Exhibit 2.) In the worst case, the fashion industry will face distinct restrictions on one or more of its key input factors, leaving it unable to grow at the projected rate and in the long run unable to con-tinue under its current operating model.
To understand the magnitude, context, and opportunities related to each area of environmental impact, it is useful to look at each in more detail.
109 PULSE OF THE FASHION INDUSTRYCHAPTER 1

Water ConsumptionAlthough on average, global freshwater use has not yet exceeded its
planetary boundary16 freshwater access is unevenly distributed across the planet. Certain areas of the world (e.g., North Africa, the Middle East, and South Asia) already live in a state of near-permanent water stress.17
The volume consumed by the fashion industry today is already large with nearly 79 billion cubic meters—enough to fill nearly 32 million Olym-pic-size swimming pools. GFA and BCG anticipate that water use will in-crease by 50% by 2030,18 which is critical, because some of the main cot-ton-producing countries such as China and India are located in areas that are already suffering from high or medium to high levels of water stress.19 Those levels are projected to become even more severe, as the shortfall between demand and supply of water is projected to reach 40%20 by 2030. Thus, as water scarcity becomes more extreme, cotton-growing na-tions and the fashion industry may face the dilemma of choosing between cotton production and securing clean drinking water.
Estimating the value for the world economy (see Impact Area Over-view on page 21/22 for more detail) of the 39 billion additional cubic me-ters expected to be consumed annually by 2030,21 results in €32 billion at stake per year. That is the potential benefit to the world economy if the fashion industry can find ways to consume no more water than it does today. The most significant water use occurs during the production of raw materials—notably in cotton cultivation—but many aspects of textile pro-cessing are also water intensive. Additionally, consumers are responsible for further consumption as they wash their clothes.
Energy EmissionsThe level of atmospheric CO2 already today exceeds by about 20%
what is considered safe, according to the latest earth system research.22,23 The industry’s CO2 emissions are projected to increase by more than 60% to nearly 2.8 billion tons per year by 203024—the equivalent of emissions produced by nearly 230 million passenger vehicles driven for a year, as-suming average driving patterns.
The value opportunity at stake to the world economy of improved energy management in the fashion industry is the largest in magnitude across all impact areas with €67 billion, representing effects such as shift-ing climate patterns. Because some of the fashion sector’s primary manu-facturing locations are particularly vulnerable to climate change and rising sea levels, large benefits can be reaped for both the world economy and the suppliers to the fashion industry. The industry’s greatest impacts on the climate is from processing, followed by the use of apparel and the pro-duction of raw materials.25,26
Chemicals UsageThe level of biochemical flows, represented by the flow of phospho-
rus from fertilizers to erodible soils, already exceeds the safe operating space by more than 220%.27 Through cotton production, the fashion in-dustry is a large user of fertilizers, with cotton consuming 4% of nitrogen fertilizers and phosphorous globally.28 Excessive use of fertilizers can lead to runoff from the land into waterways. The negative effects include algal blooms depleting oxygen in the water.29 Further, although the cultivation area of cotton covers only 3% of the planet’s agricultural land, its produc-
tion consumes an estimated 16% of all insecticides and 7% of all herbi-cides.30 Finally, organic and inorganic toxic substances (such as mercury and arsenic) discharged to waterways from processing plants damage the environment.31 The impacts to human health of water pollution include tox-ins building up in the body, possibly leading to cancers, acute illnesses, or other conditions.
To approximate the monetary impact, these effects are tied to occu-pational illnesses attributed to carcinogens and airborne particulates (see Impact Area Overview for details, page 21/22). By eliminating such health impacts due to poor chemical management by 2030, an annual value of around €7 billion can be gained.
Waste CreationToday, humankind produces 2.1 billion tons of waste per year.32 In
terms of annual ecological footprint, the world’s population already pro-duces more than 1.6 times what the earth can absorb in the same time-frame.33
Assuming today’s current solid waste34 during production and at end-of-use, the industry’s waste will increase by about 60% between 2015 and 2030, with an additional new 57 million tons of waste generated an-nually.35 This brings the total level of fashion waste in 2030 to 148 million tons—equivalent to annual waste of 17.5 kg per capita across the planet.36 The vast majority of clothing waste ends up in landfills or is incinerated; globally, only 20% of clothing is collected for reuse or recycling.37
A large opportunity for value creation awaits the world economy if the fashion industry manages to convert textile waste into raw materials through the use of advanced recycling techniques (discussed in more depth in chapter 3). But this type of recycling technology is not yet avail-able for a broad range of fibers and it has yet to be proved economically viable at scale. Therefore, the current value is based on pure waste re-duction along a linear value chain. Consequently, the opportunity to the world economy is modest at around €4 billion per year in 2030—although under a circular model of production and consumption, this value would be manifold higher.
THE FASHION INDUSTRY WILL FACE RESTRICTIONS ON ONE OR MORE OF ITS KEY INPUT FACTORS, RISKING GROWTH
AT THE PROJECTED RATE
1211 PULSE OF THE FASHION INDUSTRYCHAPTER 1

OF THE TOTAL EMPLOYMENT IN MANUFACTURING ACROSS KEY ASIAN PRODUCTION COUNTRIES
34%
87%
OVER50%OF WORKERS ARE NOT PAID THE MINIMUM WAGE IN COUNTRIES LIKE INDIA OR THE PHILIPPINES
MINIMUM WAGES IN THE INDUSTRY ARE½OF WHAT CAN BE
CONSIDERED A LIVING WAGE
NON COMPLIANCE TO MINIMUM WAGES CAN BE AS HIGH AS
The Mandate Is Clear: The Fashion Sector Has the Opportunity to Drive Improvements
Exhibit 4
COMPANIES ON AVG. SPEND
THE INDUSTRY HAS ON AVG.
OF SALES ON COMMUNITY SPENDING, WHILE THE UN PROPOSES 0.7% IN ITS DEVELOPMENT GOALS¹
FOR WOMEN WHILE IT IS 27% FOR MEN IN PAKISTAN
INJURIES PER 100 WORKERS PER YEAR, WHILE IN SUPPLIERS' FACTORIES OF A LARGE SPORTS GOODS MANUFACTURER NUMBER IS ONLY 2.5
0.2%
5.6
SHARE OF EXPORTS IN COUNTRIES SUCH AS BANGLADESH OR CAMBODIA
60-80%
1. U
N fi
gu
re g
iven
fo
r so
vere
ign
sta
tes
1413 PULSE OF THE FASHION INDUSTRYCHAPTER 1

Social Issues Will Intensify with Increasing Fashion ConsumptionExhibit 5 Projected Social Impacts
2015
62
2030
102
14
2015 2030
1.4
7+35%
+7%
+52%21
1.6
9
Laborpractices
Workers paid less than 120% of min. wage2 (millions)
No. of recorded injuries (millions)
Foregone community/ext. spending (€ billions)
Health & safety
Community& ext. engangement
Soci
al im
pac
t
63%
Land UseThe area of forested land that has been cleared for various uses, in-
cluding land intended for cotton cultivation, has exceeded the safe oper-ating space by 17%.38,39 By 2030, it is predicted that the fashion industry will use 35% more land for cotton, forest for cellulosic fibers, and grassland for livestock—altogether over 115 million hectares that could be used to grow crops for an increasing and more demanding population or to pre-serve forest.40 A global population of 8.5 billion in 2030 will require a 60% increase in agricultural production in order to feed everyone,41 which, as with the case of water, will result in the dilemma of whether to produce raw materials for textiles or to grow food for an increasing population. This is a strong incentive for the fashion industry to consider the impact of its raw materials on land use and to shift the material mix toward less land-in-tensive inputs. The scarcity of arable land might lead to higher cost of land or even restricted access for non-food crops in the future.
SOCIAL PRESSURES PUTTING €50BN VALUE AT STAKE
With approximately 60 million people employed in the fashion indus-try42 and 26 million of those employed upstream,43 the fashion industry has an opportunity to create large-scale social change for millions. It pro-vides employment for roughly every third manufacturing worker across key Asian production countries44 and is a key driver of economic growth, accounting for as much as 80% of merchandise exports in Bangladesh and 66% in Cambodia,45 for instance. The mandate for the fashion industry to drive positive improvements becomes very apparent. (See Exhibit 4.)
The growth in apparel consumption will also leave its mark along sev-eral social impact areas, specifically labor practices, health and safety, and community and external engagement. (See Exhibit 5.) In the following, each impact area is addressed in more detail—in terms of both social pres-sures and opportunities.
Labor PracticesAs recently as 2015, 10% of the world’s workers and their families
were living below the international poverty line of €1.8 (in purchasing pow-er parity) per day.46 If current patterns persist, 4% to 6% of the world’s population will still be below the poverty line in 2030, falling significantly short of the UN Sustainable Development Goal of zero poverty by 2030.47 The fashion industry is not solely responsible for eradicating all poverty and hunger, but as a major employer and driver of economic prosperity in many developing countries, it is well placed to make a difference and improve social conditions.
In many Asian nations, the sector’s minimum wages are less than half of what can be considered a living wage.48 The gaps between minimum wages and living wages are equally staggering in Eastern Europe and Tur-key.49 This issue is heightened with the many factories that fail to comply with their countries’ minimum wage laws. For example, in major textile manufacturing countries like India, the level of noncompliance reaches 51%.50 If there is no systematic, concerted push to respond to those reali-ties, more than one-third of workers in the sector globally are projected to be paid less than the minimum wage by 2030.51
At a global level, gender equality has an especially long journey ahead, with 52 countries lacking constitutionally guaranteed equality. Fur-ther, the United Nations views gender equality as “not only a fundamen-tal human right, but a necessary foundation for a peaceful, prosperous and sustainable world.”52 This gender inequality also manifests itself in the fashion industry, where women are particularly vulnerable to low wage levels due to persistent gender pay gaps. (In India, women face a pay gap of 39% compared with men for the same job; in Pakistan, that figure is as great as 48%.)53 Further, women are more likely than men to be paid be-low the minimum wage. For instance, in Pakistan’s garment sector, 87% of women are paid less than the minimum wage, while the figure is 27% for men.54 This is critical, as women often constitute the majority of the appar-el, footwear, and textile workforce—as much as 74% to 81% in Cambodia, Vietnam, and Thailand.55
The topic of labor practices encompasses a broad range of social issues such as compensation, working hours, worker treatment, worker rights, gender equality, and child labor. In order to provide the broadest representation of this impact area, the focus in this part of the report is wages. Paying fair wages is a key area for the industry to act on. Because a large gap exists between minimum wages and living wages (see Impact Area Overview on page 21/22 for details), the first step could be for the industry to aim for ‘extreme compliance’ to minimum wages (paying 120% of the legal minimum) as reported by ILO.56
Currently 14 million workers are paid below this 120%-threshold. If wages are not increased, that number is projected to exceed 21 million by 2030.57 By not increasing the number of workers being paid less than this level, while maintaining the projected growth of the industry, there is an annual value opportunity at stake of approximately €5 billion by 2030.
Health and SafetyThe early stages in the fashion value chain expose garment workers
to health and safety concerns, ranging from factory fires to exposure to hazardous chemicals to working overtime. If business continues as usual,
1. Fashion consumption of apparel and footwear 2. The authors of this report do not recommend 120% min. wage as representative of a living wage; level of 120% min. wage taken to show general insufficiency of min. wage level to make a living; further the taken threshold is advanta-geous due to data availability in ILO reports on min. wage compliance
Projected global fashion consumption1
1615 PULSE OF THE FASHION INDUSTRYCHAPTER 1

THERE IS A €160 BILLION-PER-YEAR UPSIDE FOR THE WORLD ECONOMY ROUGHLY 11% OF
THE CURRENT RETAIL VALUE
OF THE GLOBAL APPAREL AND FOOTWEAR
SECTOR
1817 PULSE OF THE FASHION INDUSTRYCHAPTER 1©Rezza Estily/Greenpeace

the number of recorded injuries in the industry is projected to reach 1.6 million by 2030 compared to 1.4 million today.58 The increase in the total number of injuries is modest at 7%. This is attributed to a decreasing trend as the industry is already striving to provide a safer working environment. Nevertheless, there is room for improvement when comparing the 2015 average industry recordable injury rate of 5.6 with that of industry front-runners—for instance Nike, with a recordable injury rate of 2.5 for 2015.59
More than €32 billion a year can be reclaimed if the fashion indus-try were to succeed in preventing all workplace injuries (see Impact Area Overview on page 21/22 for details).
Community and External EngagementFinally, it is worthwhile to compare the fashion industry’s commu-
nity spending levels with a few global benchmarks. The UN Millennium Development Goals stipulate that the governments of the world’s wealthy countries should commit 0.7% of their gross national product to official development assistance to developing countries—a goal reaching back to the 1970s.60 While nations and companies may not be directly comparable, it is interesting to note that fashion brands spend on average only around 0.2% of sales on community spending and other Corporate Social Respon-sibility-related activities.61 This is on a par with spending in the consumer electronics industry but lags far behind mining and pharmaceuticals, with averages of 0.4% and 1.2%, respectively.62
If brands across the industry were to commit to increase spending to 0.7% (in line with UN goals) from 0.2% of sales, there is an annual value to be gained of €14 billion in 2030.
In summary, GFA and BCG contend that there is a €160 billion-per-year upside for the world economy that can be realized through more efficient and diligent use of scarce resources, by treating workers fairly, and by making progress on a range of issues up and down the value chain (see Exhibit 6 on page 20 and Impact Area Overview on page 21/22 for a summary). This is equal to roughly 11% of the current retail value of the global apparel and footwear sector or 90% of its current profit pool.
In addition to the environmental and social impact areas men-tioned above, there is an ethical facet to a sustainable fashion indus-try. While we do not review in detail the ethical dimension in this first edition of the Pulse Report, it is by no means a trivial topic. The ethical
THE FASHION INDUSTRY HAS AN OPPORTUNITY TO CREATE LARGE-
SCALE SOCIAL CHANGE FOR MILLIONS
Water consumption
1
2
3
4
5
6
7
8
Laborpractices
Reduced waterconsumption
€32 billion
€67 billion
€7 billion
€4 billion
€5 billion
€32 billion
€14 billion
~€160 billion/year
Workers earning 120% min. wage1
Reduced energy emissions
Reduced number of recorded injuries
Reduced occupational illnesses
Increased community spending
Not to be quantified
Reduced amount of waste
Energy emissions
Health& safety
Chemical usage
Community & ext. eng.
Waste creation
Ethicalpractices
Env
iro
nmen
tal
Soci
alE
thic
al
A Value of €160bn per Year Is at StakeExhibit 6 The Value Opportunity of Sustainable Fashion to the World Economy
Impact Value at stake Until 2030
dimension tackles challenging topics such as animal welfare, loss of biodiversity, corruption, and negative imagery – such as inadvertently pressuring girls and young women to live up to body ideals that might lead to eating disorders. These ethical reflections are important for the fashion industry to consider and are deemed to be a focus area in fu-ture issues of the report.
We focus in this report on the impact areas mentioned above, due to the availability of reliable data sources that would keep the subject tangible to the reader.
WHAT IS AT STAKE FOR BUSINESSES?
For businesses, acting differently than today and pursuing novel solutions offer an opportunity to maintain and ensure profitable growth going forward.
If no action is taken, fashion brands will find themselves likely squeezed between falling average per-item prices, deeper discount levels, rising costs, and resource scarcity along the value chain. Indeed, the sector today is built on a linear ‘one-way street’ of take, make, and waste: take, with raw material inputs that are becoming more expen-sive; make, with labor costing more and more; and waste, with value lost as clothing ends up in landfills.
1. The authors of this report do not recommend 120% min. wage as representative of a living wage; level of 120% min. wage taken to show general insufficiency of min. wage level to make a living; further the taken threshold is advanta-geous due to data availability in ILO reports on min. wage compliance
2019 PULSE OF THE FASHION INDUSTRYCHAPTER 1

Chosen proxy
Chosen proxy
Chosen proxy
Chosen proxy
Chosen proxy
Chosen proxy
Chosen proxy
Value per unit1
Value per unit5
Value per unit7
Value per unit8
Value per unit2
Value per unit4
Value per unit
Projected overall value at stake by 2030
Projected overall value at stake by 2030
Projected overall value at stake by 2030
Projected overall value at stake by 2030
Projected overall value at stake by 2030
Projected overall value at stake by 2030
Projected overall value at stake by 2030
The total monetary value represents the potential benefit to the world economy if the fash-ion industry achieves the projected retail volume growth while consuming no more water by 2030 than it does today. The figures represent the effect of water consumption on society in terms of: health im-pacts (malnutrition); resource depletion; subsidy cost of water; opportunity cost of water; and the environmental impacts of the water supply sector. The most significant usage is during raw material production — notably for cotton cultivation — but many aspects of textile processing are water-intensive too. Additionally, consumers are responsible for further consumption as they launder garments.
The overall value shows the value opportunity by not further increasing the number of workers being paid less than 120% of the local minimum wage while maintaining the pro-jected growth of the industry.Labor practices encompass a broad range of social issues such as compensation, working hours, worker treatment, worker rights, gender equality and child labor. Paying fair wages is a key area for the industry to act. One speaks of 'fair wages' when those are able to support the worker as well as two adult dependents or one adult and two children or four children, covering food, clothing, housing, travel costs, children's education, health costs and 10% towards discretionary income (e.g. savings, pension). The level of 120% of minimum wage is chosen to reflect the fact that the local minimum wage in the main textile-producing countries is often considered insufficient to make a living6. It does not represent a recom-mended level.The value per worker represents the opportunity to the world economy of increased eco-nomic consumption and increased private investments.
The overall value represents the opportunity to the world economy if the fashion industry succeeds in eliminating workplace injuries from a current average of 5.6 per 100 workers to 0 by 2030.
The value per unit represents the cost to the world economy per worker injury, representing such effects as shorter healthy life expectancy, risk of premature death due to occupational hazards, and inability to provide for the worker's family.
The overall value opportunity to society is estimated based on the industry increasing community spending and other CSR-related activities to 0.7% of sales from today's level of 0.2%. Today, the fashion industry is not on par with other industries with regard to commu-nity spending; for instance, the pharmaceuticals and mining sectors donate 1.2% and 0.4% respectively.This represents effects such as increased quality of life for workers and their families.
As the ethical impact area comprises many, vastly different topics, representing it with a single proxy would go too short, even more so than in other impact areas. Furthermore, the overall value of many ethical issues can hardly be represented by monetary values based on currently available research and methodologies. Further, available monetary estimates for single topics lack applicability to the fashion industry and/or do not allow for a delim-ited consideration of the industry's impacts. We therefore decided to exclude this impact area in this type of analysis.
The value opportunity at stake here is the largest in magnitude across all impact areas. The overall value is calculated based on the industry avoiding all additional emissions through energy use projected in 2030 compared to today. It represents effects such as shifting cli-mate patterns, sea levels rising and increasingly extreme weather events. With some of the fashion sector's primary manufacturing locations especially vulnerable to climate change and rising sea levels, there are large benefits to be reaped for both the world economy at large as well as for the suppliers to the fashion industry. The climate impact of the fashion industry is largest during processing, followed by the use phase and raw materials production
The overall figure represents the value if the industry achieves to generate no more waste by 2030 than it already generates today while achieving the projected growth in retail volume.An immense value creation opportunity is at stake for the world economy if the fashion industry manages to convert waste into raw materials through the use of advanced recy-cling techniques. However, this type of recycling technology is not yet available for a broad range of fibers and it is yet to be proven economically viable on a large scale. The current value is therefore based on pure waste reduction along a linear value chain. The value per ton of waste represents effects such as emissions from decomposing waste (methane) and waste incineration (greenhouse gasses, air pollutants) and the effects of landfills and incineration sites (noise, dust, litter, odor, vermin, visual intrusion).
The overall figure shows the value opportunity if the industry eliminates today's negative health impacts due to poor chemicals management by 2030.Because of limited transparency in the early value chain and a plethora of different chem-icals with varying levels of hazardous impact, it is difficult to choose a proxy that captures impacts ranging from pollution of waterways to the health effects of airborne chemicals. To encompass a multitude of initiatives aimed at better chemicals management, the chosen proxy is the Pulse Score in chemicals management, which is then tied to occupational illnesses attributed to carcinogens and airborne particulates measured in DALYs (disabili-ty-adjusted life-years). The €-value of each DALY lost due to mismanagement of chemicals in the workplace is estimated at €143,0003. This average value is calculated under consid-eration of a number of factors across large apparel and footwear producing nations such as the life expectancy, the value of a statistical life and number of garment workers in a given country.
Env
iro
men
tal
WATER
ENERGY
WASTE
CHEMICALS
Soci
al
Water consumption (billion cubic meters)
No. of workers earning <120% minimum wage (in millions)
No. of recorded injuries (in millions)
Foregone communityspending(in billion €)
Emissions of CO2-eq. (million tons)
Amount of waste (million tons)
Pulse Score in chemicals (% achieved)
€0.81/m³
€642/worker
T€21/injury
€1.5/€1 spent
€62/t
€66/t
T€143/DALY
€32 billion per year
€5 billion per year
€32 billion per year
€14 billion per year
€67 billion per year
€4 billion per year
€7 billion per year
The value per unit represents the monetary value to the world economy of one unit of the indicated proxy. The overall value at stake represents the yearly total monetary value to the world economy at risk by 2030 if the fashion industry continues 'business as usual'
3. The source of this value are BCG calculations based on PWC (2015); WHO (2017); Markandya (1998); Clean Clothes Campaign (2014); SAC Higg Facility Module (2017); BCG Analysis
6. See amongst others ILO (2015). Employment, wages and working conditions in Asia’s Garment sector: Finding new drivers of competitiveness. ILO Asia-Pacific Working Paper Series. Bangkok: ILO Regional Office for Asia and the Pacific
LABOR PRACTICES
HEALTH & SAFETY
COMMUNITY & EXTERNAL ENGAGEMENT
ETHICAL PRACTICES
1. PUMA. (2011). PUMA’s Environmental Profit and Loss Account for the year ended 31 December 2010
2. Kering. (2015). Environmental Profit & Loss (E P&L) – 2014 Group Results.
4. BCG calculations, mainly based on PUMA. (2011). PUMA's Environmental Profit and Loss Account for the year ended 31 December 2010.
5. BCG calculation, based on data from Eurostat; Huynh, P., & Cowgill, M. (2016). Weak minimum wage compliance in Asia’s garment industry. ILO Regional Office for Asia and the Pacific. (Asia-Pacific Garment and Footwear Sector Research Note, [5]); Clean Clothes Campaign. (2014). Living Wage in Asia.; Clean Clothes Campaign. (2014). Stitched Up: Poverty Wages for Garment Workers in Eastern Europe and Turkey; results from the Boston Consulting Group and the World Food Programme. (2009). School Feeding Cost Benefit Analysis.
7. BCG calculation, based on Nike Inc. (2015). Sustainable Innovation Is a Powerful Engine for Growth - Sustainability Business Report; National Safety Council. (2015). The ROI of Safety – Injury Facts; PricewaterhouseCoopers LLP (2015). Valuing cor-porate environmental impacts: PwC methodology Document; World Health Organization. (2017). [Global Health Observatory (GHO) Data: Life Expectancy]; Markandya, A. (1999). The valuation of health impacts in developing countries. Environmental Economics and Policy Making in Developing Countries.; Clean Clothes Campaign. (2014). Living Wage in Asia.
8. BCG calculation, based on results from the Boston Consulting Group and the World Food Programme. (2009). School Feeding Cost Benefit Analysis.
Impact Area Overview
22

Between now and 2030, the industry’s labor costs are expected to continue to outpace growth in retail value. While retail value is projected to grow at 2% annually,63 the cost of labor in large garment-producing coun-tries is expected to grow at least 4%64 and as much as 5% a year.65,66 While this is a positive development for the industry’s workers and supported by many brands, it does increase the pressure on fashion brands’ profitability.
While cotton prices have been projected to remain relatively stable at a projected real annual growth of 1%,67 we would assume that figure could increase given increasing water scarcity worldwide and how it might affect the cost of future cotton production. Energy prices are projected to increase steadily, with annual growth of at least 2.3%68 to as much as 3.5% over the same period.69 While energy is estimated to account for 6% to 10% of production and material costs, the greatest cost impact of energy prices is contributed by the close correlation between oil prices and the price of polyester.70
The consequences for fashion brands are at hand: even if base-case projections are used for growth in energy prices and in wages, GFA and BCG project that, by 2030, fashion brands will see a decline in EBIT mar-gins of more than 3 percentage points if they continue ‘business as usual.’71 (See Exhibit 7.) That adds up to approximately €45 billion per year of prof-it reduction for the industry as a whole.
Production cost
Selling, General and Administrative Expenses
Material cost
Other Operating Expenses
Factory profit
Logistics & tariff cost
Labor cost [Supplier]
Store Occupancy cost
Fabric cost
Factory running cost
Labor cost [Brand]
G&A
Other material cost
Total Revenues
Sources of rising costs Labor Energy Water
Gross Profit
EBIT
10,000
5,000 6,535 1.8%
1,200 1,162
∆ = -3.4 pptsEBIT at risk
13,522 2.0%
1,144 2,019
256 341
2,059 2,542
1,400 2,360 3.5%
841 1,108
300 419 2.3%
400 559 2.3%
2,900 3,649 1.5%
3,700 5,238 2.3%
1,280 1,736
1,178 1,823
1,241 1,678
100 135 2.0%
2015 2030Projected
CAGR1
Continuing Business As Usual Will Place 3 Percentage Points EBIT at Risk
Exemplary P&L (€ million)
Exhibit 7 Exemplary P&L For A Fashion BrandO
per
atin
gE
xpen
ses
C
ost
of
Go
od
s So
ld
100% 100%
50%
12%
48%
8.6%
1. Note that we do not assume the same growth rate for every year in the study, so the CAGR represents an indica-tion of magnitude over 15 yearsSource: BCG analysisNote: Differences in sums can occur due to rounding
There are good reasons to consider the possibility of still higher costs. Wages may rise faster in the fashion sector than in other industries as the industry draws more public attention for its environmental impact and its low minimum wage compliance. Also, oil prices may rise faster than antic-ipated—particularly should strife in the Middle East expand or Venezuela experiences an economic collapse. In addition, governments may up prices on increasingly scarce water.
If energy, water prices, and labor costs grow strongly, the industry’s profitability will be under even more pressure. Factoring in the negative externalities of increased water use (such as health impacts from water deficiency) in the price of water puts another 2 percentage points of fash-ion brands’ margins at risk. The high-case assumption for labor costs adds another 2 percentage points and the same assumption for energy costs inflates that figure by an additional 9 percentage points.72
Through investments in water, energy, and waste efficiency as well as labor productivity already feasible today, fashion brands will be able to counteract in a lasting manner several of those percentage points due to the cost pressures outlined above. As this report will show, there is a viable business case for environmental and social measures. The report also lays out the Landscape for Change and highlights the economic viability of robust, committed, long-term initiatives.
GFA AND BCG PROJECT THAT, BY 2030, FASHION BRANDS WILL SEE A
DECLINE IN EBIT MARGINS OF MORE THAN 3 PERCENTAGE POINTS IF THEY
CONTINUE BUSINESS–AS–USUAL
2423 PULSE OF THE FASHION INDUSTRYCHAPTER 1

2CHAPTER
PULSE CHECK OF THE INDUSTRY REVEALS THE NEED TO INTENSIFY EFFORTS
Worldwide, the fashion industry does not perform well on sustaina-bility. Its overall pulse is weak, with a score of just 32 out of 100, and some dimensions are far below that figure. This chapter takes the pulse along two dimensions: 1) the overall fashion value chain, from design to disposal; and 2) eight impact areas, from water use and carbon footprint to labor conditions and ethical stance.
GFA and BCG analyze, for the first time, the detailed data from the Sustainable Apparel Coalition’s Higg Index—the industry’s self-assessment tool for environmental and social impacts throughout the supply chain. We complemented the Higg Index results with a survey of industry executives (the Pulse Survey), as well as with multiple interviews with experts, to ar-rive at an overall Pulse Score for the entire global fashion industry.
PERFORMANCE GAPS ACROSS SEGMENTS, VALUE CHAIN STAGES AND IMPACT AREAS
The Pulse is not uniformly weak across the fashion industry. There is a considerable gap in sustainability performance by segment and company. The clear driver of sustainability is company size, not price positioning. So the largest enterprises and a few sustainability-focused niche players are most advanced, while small and midsize companies, which together ac-count for more than half of the industry, rate lowest. (See Exhibit 8.) These low-rating entities are a blind spot in addressing sustainability. Companies in the top revenue quartile have an average Pulse Score of 63, while bot-tom-quartile contenders are at 11.
Not surprisingly, the Pulse Survey showed executives of large fashion brands indicating a stronger commitment of funds, head count, and other resources to progress toward sustainability than those from small compa-nies. (See Exhibit 9.) Projections show the same pattern.
Small brands constituting around half of the industry, are lacking the knowledge and resources to significantly improve their footprint. They also have little control over and transparency along their supply chains. Even when their intent is good, they lack the critical reach to effect change.
THE FASHION INDUSTRY DOES NOT PERFORM WELL ON
SUSTAINABILITY, WITH A PULSE SCORE OF ONLY 32 OUT OF 100
26PULSE OF THE FASHION INDUSTRY

About the Higg Index
WHY A PULSE SCORE?
METHODOLOGY THE PULSE SCORE
The Pulse Score is a global and holistic baseline of sustainability perfor-mance in the fashion sector. It is based on Sustainable Apparel Coalition's proprietary Higg Index and extends its scope to extrapolate its findings to the entire industry. The Higg index is the most extensive and representa-tive existing transparency measurement tool of the industry. It covers the majority of large companies and was extended to gain a view on currently underrepresented small to medium-sized players.
Gaining full transparency on the sustainability level of the industry as a whole is important because it gives the industry a common understanding of what the most critical issues across the value chain and by impact areas are. Perhaps more important, it creates a foundation for the landscape for change, channeling investment and innovation into those areas that smart businesses will capture and benefit from.
As the Pulse report will be released annually, the Pulse Score further allows tracking the progress of the industry over time.
The Pulse Score was developed based on:
SAC Higg Index Brand Module as underlying data set source, clustered into segments to detect patterns1
And complemented by:1. Expert interviews going through Higg Index Brand Module
questions to test patterns and validate and pressure testing answers live with Sustainability Managers
2. Pulse Survey answers to reconfirm sustainability patterns and performance to increase sample size and fair market rep-resentation further
3. Expert sounding board to validate and discuss results
To get a representative view of the entire market, results were analyzed by company size and price positioning and reweighted according to the overall market structure based on revenue contribution.
The Pulse is a performance score for measuring and tracking the sustainabil-ity of the global fashion industry on key environmental and social impact areas. By design it is impossible to achieve a score of 100 on sustainability, as this is intended to be aspirational.
Overall, the Pulse Score of the fashion industry is:
Measured on a scale from
32 / 100
TAKING THE PULSE OF THE FASHION INDUSTRY
The Higg Index, developed by the Sustainable Apparel Coalition, is a suite of self-assessment tools that empower brands, retailers and facilities of all sizes, at every stage of their sustainability journey, to measure their impact on environmental and social dimensions and to identify areas for improvement.
The Higg Index has three modules: brand, facilities and product. The brand module measures amongst others the degree of transparency, environmental/social impact tracking as well as fashion brands’ collab-oration with facilities. The facilities module focuses on environmental and social measures implemented by fashion-industry suppliers. The product module provides general frameworks to be utilized especial-ly by brands in their design processes to optimize design and material choices with regard to sustainability.
1−100
20-29
<20
30-39
40-49
50-59
60-69
>=70
1. The brand module is unverified, meaning in this context that it is based on a self assessment and that it has not been audited or reviewed externally.
Weak
Strong
2827 PULSE OF THE FASHION INDUSTRYCHAPTER 2
©CFW

Average Pulse Scores Across Market Segments and Revenue Sizes
Strong Variation in Pulse Scores
Exhibit 8
Luxury market < €0.1-3.2Bn
< €0.1-0.45Bn
> €3.2Bn
> €3.2Bn
> €3.2Bn
> €3.2Bn
€0.45-3.2Bn
€0.1-0.45Bn
< €0.1Bn
< €0.1Bn
€0.1-0.45Bn
< €0.1Bn
Luxury Big Players
SMEs > €0.1Bn
SMEs <€0.1Bn
Sustainability Champions2
Unregulated
SMEs <€0.1Bn
Mid-size middlemainstream fashion
SMEs >€0.1Bn
Sportswear
Middle mainstream fashion
Fast Fashion & Low Price / Entry Fashion
Pre
miu
m
Mid
dle
Seg
men
tLo
wer
Mid
dle
/ E
ntry
Pri
ce P
oin
ts
<20
Average Pulse Score
20-29 30-39 40-49 50-59 60-69 70-79 80-89 90-100Rev. sizePrice position Value share ofoverall market
5%
2%
3%
20%
5%
5%
14%
7%
10%1
19%1
5%
5%
Current
Future
Large Fashion Brands Indicate Stronger Commitments to Sustainability
Current-1 No dedicated and focused sustainability measures are taken in this area yet
0 Efforts currently exist, but largely without distinct objectives and only limited monetary commitment
1 It is currently an absolute priority w/ clear objectives and monetary commitment
Future-1 No dedicated and focused sustainability measures are taken in this area yet
0 Efforts currently exist, but largely without distinct objectives and only limited monetary commitment
1 It is currently an absolute priority w/ clear objectives and monetary commitment
Exhibit 9 Current and Future Commitment to Sustainablity Initiatives by Fashion Executives
among other reasons to better labor conditions at their production sites, located mostly in higher-wage European countries.
The data indicates that family-owned brands are taking a stronger leadership role, as public companies are more likely to follow shareholders’ expectations for short-term value maximization. Yet we can learn from the positive examples of some listed front-runner companies with credible activities.
Geographically, European brands score better along environmental dimensions, while US brands are more compliant on social and labor prac-tices.
PERFORMANCE DIFFERENCES ALONG THE VALUE CHAIN
Pulse Scores also differ along the value chain. (See Exhibit 10.) The end-of-use and raw material stages are at an average score of 9 and 17, re-spectively, while design and development is little better at 22. Processing and transportation are the highest at 38 and 41. Some stages may enjoy better scores because their solutions are manageable for the company
1. Approximation 2. Sustainability cluster defined by niche brand positioning with sustainability as core part of value propositionSource: BCG analysis; SAC Higg Index Brand Module, Jan 2017; Expert InterviewsSource: BCG, GFA Pulse Survey
SME<€0.45 billion
-1 -1 -1 -1 -1 -1 -1 -10 0 0 0 0 0 0 01 1 1 1 1 1 1 1
Design & development Raw materials Processing Manufacturing Transportation Retail Use End of use
Big player> €4.4 billion
Mid-Size€0.45-4.4 billion
Overall Pulse Survey Results
The report reveals that so called ‘fast fashion’ does not automatically represent a threat to the environment and the world economy. At least the large high-street players score consistently higher than most of the market. Many large entry-price high-street and sportswear brands achieve strong Pulse Scores, as do the small ‘sustainability champions’. But most small and midsize premium brands show scores in the midfield.
The premium/luxury segment in the Pulse Score analyses comprises a broad selection of players from ‘upper middle premium bridge’ to high-end luxury. Large luxury conglomerates show strong performance, thanks
20-29 30-39 40-49 50-59 60-69 >70<20
Weak Strong
3029 PULSE OF THE FASHION INDUSTRYCHAPTER 2

by itself, while improvements at stages such as end-of-use require broad collaboration and scaled-up initiatives.
There are substantial gaps in performance between top- and bot-tom-quartile companies in most stages. The gap is biggest in transporta-tion, with a 50-point difference, and in raw materials and manufacturing, which both show a gap of 45 points. These are stages of low-hanging-fruit for sustainability, where leaders have shown what is possible.
Other stages such as consumer use, where all companies did poorly (only a 10-point gap), require greater attention and a collective push for-ward. As the survey confirmed, firms are committing far less funds, head count, or other resources to stages at the beginning and the end of the value chain and are currently not planning to do so in the future.
Note: Quartiles weighted by revenue; Normalized – unverified data Source: BCG analysis; SAC Higg Index Brand Module, Jan 2017; Expert Interviews
Gap of 52 Points Between Top and Bottom PerformersAverage Pulse Score by Value Chain Stage and Performance QuartileExhibit 10
Design & development Raw materials Processing Manufacturing
Total
Top quartile
2nd quartile
3rd quartile
Bottom quartile
22
37
22
19
10
17
47
16
4
2
38
66
43
29
14
28
56
26
22
11
Transportation Retail Use End of use Total Pulse Score
41
67
47
34
17
28
33
35
29
14
23
24
26
29
14
9
21
9
4
2
32
63
32
22
11
20-29 30-39 40-49 50-59 60-69 >70<20
Weak Strong
THE CLEAR DRIVER OF SUSTAINABILITY IS
COMPANY SIZE, NOT PRICE POSITIONING
GAPS BY IMPACT AREA
We see further gaps and imbalances when we look across areas of impact. (See Exhibit 11.) Brands are more likely to return higher scores in areas like health and safety, which are regularly in the media spotlight and, especially in Europe, under regulatory scrutiny. Chemical use, subject to the EU’s REACH (Registration, Evaluation, Authorization and restriction of Chemicals) laws, also delivers higher scores for many fashion brands: a Pulse Score of 37. But waste management and water management, which get much less consumer attention, are at only 20. If we examine impact areas by revenue quartiles, the trends are much the same. Energy shows the biggest gap, at 58 points, while waste – where the top quartile is at a mediocre 24, shows a difference of only 12 points.
3231 PULSE OF THE FASHION INDUSTRYCHAPTER 2
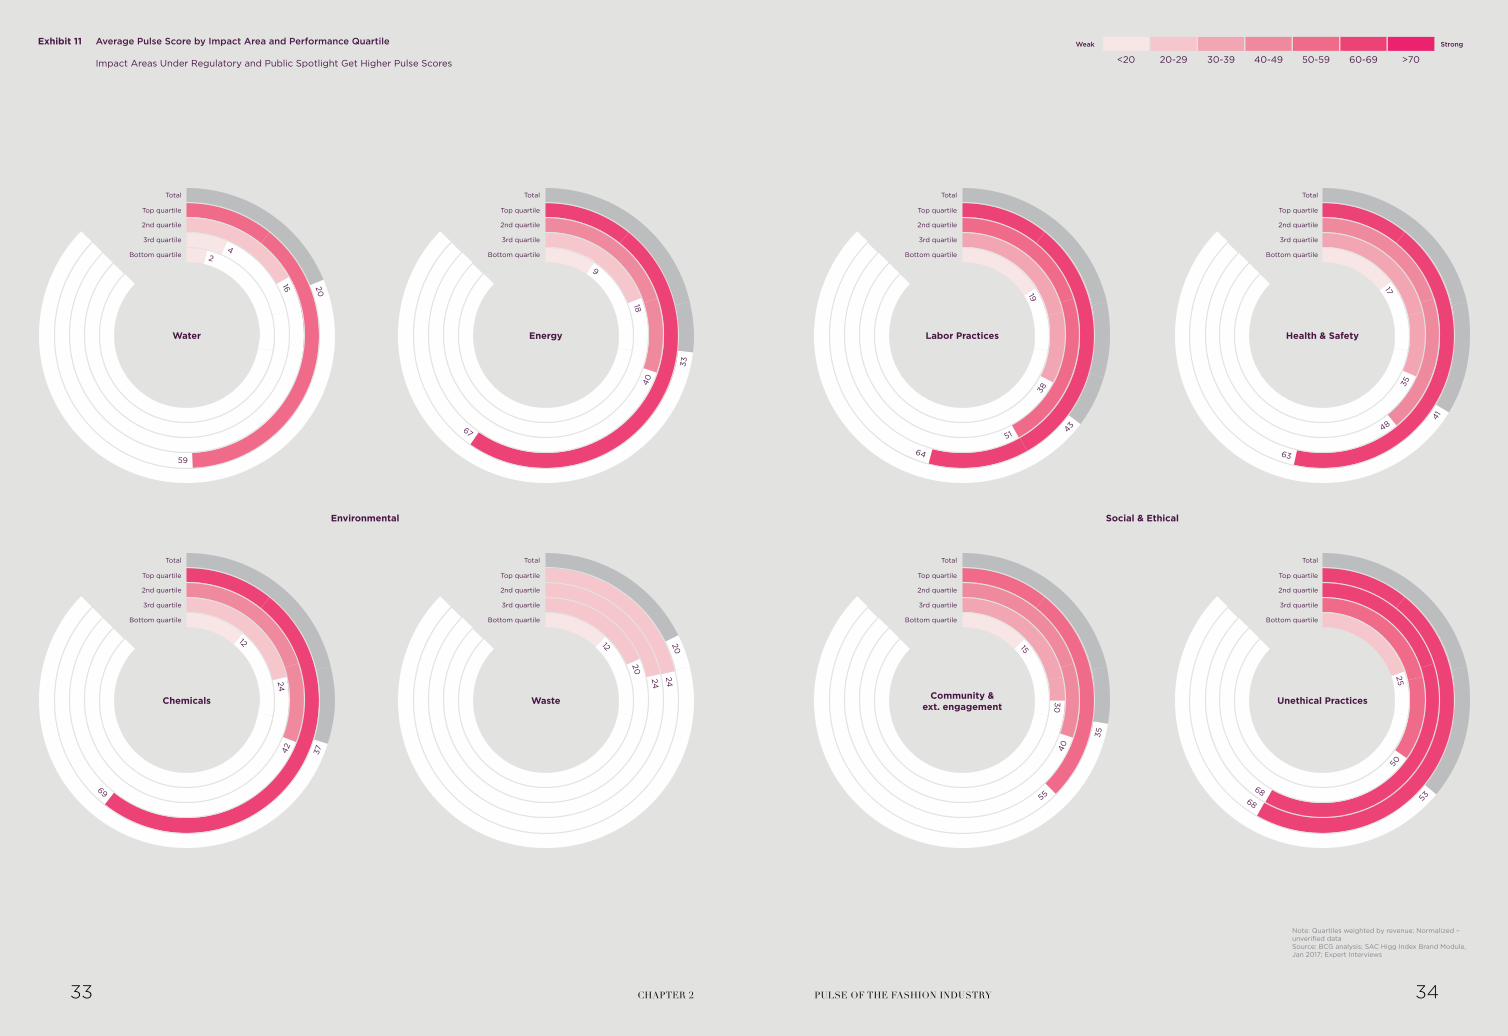
Exhibit 11
Water
Chemicals
Energy
Waste
59
Impact Areas Under Regulatory and Public Spotlight Get Higher Pulse Scores
Community &ext. engagement
Labor Practices
Environmental Social & Ethical
Unethical Practices
Health & Safety
Note: Quartiles weighted by revenue; Normalized – unverified data Source: BCG analysis; SAC Higg Index Brand Module, Jan 2017; Expert Interviews
20-29 30-39 40-49 50-59 60-69 >70<20
Weak StrongAverage Pulse Score by Impact Area and Performance Quartile
Top quartile
Total
2nd quartile
3rd quartile
Bottom quartile
33
16
40
4
18
29
Top quartile
Top quartile
Total
Total
2nd quartile
2nd quartile
3rd quartile
3rd quartile
Bottom quartile
Bottom quartile
20
67
20
24
20
12
24
Top quartile
Total
2nd quartile
3rd quartile
Bottom quartile
3742
24
12
69
35
40
30
15
55
Top quartile
Total
2nd quartile
3rd quartile
Bottom quartile
53
68
50
25
68
Top quartile
Total
2nd quartile
3rd quartile
Bottom quartile
41
48
35
17
63
Top quartile
Total
2nd quartile
3rd quartile
Bottom quartile
43
51
38
19
64
Top quartile
Total
2nd quartile
3rd quartile
Bottom quartile
3433 PULSE OF THE FASHION INDUSTRYCHAPTER 2

THE REALITY AS EXPERIENCED BY FASHION
SUSTAINABILITY PROFESSIONALS
About the SurveySTATUS QUO
PATH TO CHANGE
Half of companies have extensive sustainability target setting – nearly all participants have at least a few targets
Consumers willingness to pay, missing regulation and collaboration seen as main barriers to progress
Responsibility to drive industry progress put upon other stakeholders
Participants final remarks Survey sample
Integration of targets into business steering is, however, limited...
...and sustainability initiatives have little consumer-facing exposure
Respondents say status quo mainly influ-enced by regulators, with senior manage-ment ranking after NGOs
BCG and GFA polled over 90 senior man-agers responsible for sustainability issues across a range of fashion firms, from large international brand names to small and medium-sized companies spanning various price tiers and distribution models globally.
The managers were asked about the integration of sustainability topics in their organization and its sustainability strategy as a whole, and queried about specif-ic focus topics along impact areas and value chain steps. Additionally, their views were sought on which barriers prevent progress and which stakeholders should take responsibility. The respondents were also invited to share their perspectives on the best ways to advance the industry’s standing on sustainability.
1. Estimate based on mid-value of survey categories – e.g. 1-5% interpreted as 2.5% 2. Participants were asked to chose their top 5 influencing parties, percentages show share of top 3 ranks given 3. Based on MIT / BCG survey amongst Managers to C-Suite across industries (BCG Market Research; MIT Sloan Management Review / BCG Report "Sustain-ability's Next Frontiers", Dec 2013) n=91
4. Participants were asked to chose their top 5 barriers, per-centages show share of top 3 ranks given5. Participants were asked to chose their top 5 responsible parties, percentages show share of top 3 ranks given
"Are there sustainability related company targets (such as reduction of CO2 emissions by x% by 2020 or at least x% of suppliers meeting specific labor standards by 2018)?"
"In your view, which barriers exist today hindering your company from be-coming more sustainable (environmentally, socially and ethically)?"4
"To whom would you attribute the major responsibility for driving the industry towards more sustainability?"5
% of Top 3 ranks
% of Top 3 ranks
% of participants
"What role do these sustainability related company targets play in the overall strategy?"
"Which share of your volume is made of sustainable materials (e.g., organic, recycled, re-generated, fair trade, BCI, Tencel®)?"
"Which stakeholder groups are most influential in shaping your company's sustainability agenda?"2
Senior management rank uncommonly low – ranked 1st across all other industries3
Estimated avg.:26% sustainable materials across survey sample1
Estimated avg.:15% sustainable materials across survey sample1
Only 4% of participants charge a substantial price premium
Overall SME <€0.45 Mid-Size €0.45-4.4Bn Big Players >€4.4Bn
"Which share of your revenue is currently achieved with products explicitly marketed as sustainable?"
"Which price premium does your company achieve on average with products explicitly marketed as sustainable (such as Organic Cotton, Fair Trade label, clearly visible to the consumer)?"
No, there are no sustainability related company targets
They are not yet an influencing part of the company’s strategy
Not currently used
< 1%
1-5%
6-15%
16-30%
31-50%
>50%
I don't know
Not currently used
< 1%
1-5%
6-15%
16-50%
>50%
I don't know
We deliberately do not charge a price premium1%
15%
10%
13%
10%
9%
28%
14%
Policy makers/regulators
Employees
Consumers
NGOs
Senior Management
Industry associations
Competitors
Investors/Shareholders
Suppliers
Local Communities
Other
Consumers
Investors/Shareholders
Industry Associations
Governments/policy makers / regulators
NGOs
Brand / Retailer
Suppliers
Employees
Competitors
Local Communities affected by operations
<€45M
Lower middle price
Discount
Premium
Mid-market
Luxury
Affordable Luxury
Europe Americas Asia Pacific
27%
11%35%44%7%
1%2%
65% 23% 12%
12%11%11%24%4%13%
€180-449M
€45M-179M
€0.9-4.4B
€450-889M
>€9B
€4.5-9B
Company Price Segment
Company Size
Region of Headquarter
Low consumer willingness to pay a premium for sustainable products
Missing regulations/policies
Brands focusing on self-optimization rather than collaboration
Lack of consumer awareness on sustainable products
Short-termism of planning and budgeting cycles
Missing technological innovations
Insufficient company resources to address these issues
Lack of an economically viable business case
Lack of a standardized model for incorporating sustainability in the core business
Lack of supplier drive and support to make change happen
No competitive pressure to do so
Multitude of certifications/labels
Silo-thinking across business units or geographies
Industry associations and other initiatives not promoting collaboration
Consumers skeptical about sustainable products
Insufficient support from NGOs in providing business oriented solutions
35%
33%
30%
27%
26%
26%
26%
23%
23%
13%
7%
37%
36%
36%
31%
29%
25%
23%
19%
14%
4%
38%
31%
36%
29%
21%
19%
33%
19%
10%
2%
38%
38%
41%
38%
34%
34%
17%
24%
10%
10%
36%
36%
14%
29%
36%
29%
14%
14%
36%
26%
24%
23%
22%
22%
14%
13%
13%
13%
12%
12%
11%
8%
7%
4%
3%
5%
29%
18%
12%
5%
16%
15%
41%
22%
14%
1%
3%
20%
No price premium possible
1-10%
11-25%
41-60%
I don't know
They are not part of (senior) management performance assessment
They are included in the company’s strategy but other factors mostly guide decision making They are factored in when evaluating (senior)
management performance but do not influence executive compensation
"Building a Sustainable Business is a market share game as only Sustainable Businesses can survive and thrive in a Sustainable World and a Sustainable World can only contain Sustainable Businesses."
"I believe in joined forces and that increased pressure from international political level is needed, together with a commercial "under-standable project" like a yearly "Textile/En-vironmental Band Aid" project to put focus on the problems we are facing right now and not only in the future."
"I believe that the companies' risk-averse attitude to invest in new technologies and research will separate forerunners from the ones that get left behind.
The role of research and development in a wider sense than just product development will increase in the future. The companies that are able to turn their company culture into innovative one are the ones to shine in consumers minds in the future.
The challenges that our industry is facing cannot be beaten alone. We need collaboration and our competitors need to become our partners. The main competitive advantage of design brand and retailers is not in the materials we use, it's in the design."
"Sustainability is no longer optional it is a must."
"We strongly believe that now is the time for the industry to act collectively and roll out common tools like the SAC Higg Index or the ZDHD MRSL and Wastewater Guideline. However while most brands and retailers would support such a statement, the adoption of commonly developed tools by brands and retailers is often slow, leading to confusion and double efforts in the supply chain."
They drive the company’s strategy, acting as a guiding principle for nearly every decision They are factored in when evaluating (senior)
management performance and influence executive compensation
14%
8% 34%
Yes, but only a few sustainability related company targets exist30%
58% 29%
Yes, multiple sustainability related company targets exist (more than five)
56%
34% 26%
35 CHAPTER 2

Exhibit 12
Exhibit 13
The Fashion Value Chain
Eight Areas in Which the Fashion Industry Can Make a Difference
Design & Development Raw materials Processing Manufacturing Transportation Retail Use End of use
Water
Energy
Labor practices
Unethical practices
Chemicals
Health & safety
Waste
Community & external engagement
Consumption of freshwater, output and processing of wastewater
Compensation, working hours, worker treatment, worker involvement, worker rights (to vacation, to form unions etc), gender equality, child labor
Corruption, animal welfare, use of models and imagery that sets a poor standard
Use of renewable energies and CO2 emission management
Facility standards (fire doors, sufficient emergency exits etc; established emergency procedures/training), exposure to chemicals and dangerous equipment
Amount and toxicity of employed chemicals, processing of utilized chemicals
Interactions with and services for the community, such as providing education facilities for children of factory workers, engagement with external stakeholders and consumers
Amounts and types of waste generated, treatment of waste
Environmental
Social
Ethical
EXAMINING THE PULSE FROM DESIGN TO END-OF-USE
To help the industry break through its environmental, social, and eth-ical challenges, this report assesses the industry's level of sustainability at each value chain step and identifies key issues. (See Exhibit 12.) It also calls attention to the eight impact areas chosen for this report. (See Exhibit 13.) This assessment draws on GFA’s and BCG’s proprietary analyses of the Pulse Score and the Pulse Survey.
3837 PULSE OF THE FASHION INDUSTRYCHAPTER 2
©I:CO/SOEX Group

DESIGN AND DEVELOPMENT
Water Very high
Medium
High
High
Low
Low
Very low
High
Choice of materials, e.g., high water consumption of cottonChoice of colors (dyeing), finishing
Choice of fabrics, e.g., oil as input for polyester
Choice of material treatments, e.g., softening of fabricsChoice of colors (dyeing)
Choice of recycled fabrics and blendsDesign for longevityChoice of cuts and possibility to glue
Design implies choice of supplier due to necessary capabilities
Design implies choice of supplier due to necessary capabilities
Choice of materials (animal welfare)Influence on marketing and trendsChoice of cuts and sizing setting role models
Energy
Chemicals
Waste
Labor practices
Health & safety
Community & ext. eng.
Ethical practices
Impact area Magnitude of impact Biggest drivers
Adidas: The brand released athletic shoes under their 'No Dye' de-sign principles, using materials in their natural 'greige' colour to avoid water or chemical use due to dyeing. www.adidas-group.com/en/sustainability/products/sustainability-in-novation/#/adidas-nodye/
TED (Textile Environment Design): Practice-based sustainable design strategies that assist designers in creating textiles that have a reduced impact on the environment. Their approach is summarized in their report The TEN, including such topics as Design to minimize waste, Design for cyclability, and Design to reduce the need to con-sume. The TED team has led customized training activities at compa-nies including VF Corporation to teach about sustainable design. www.tedresearch.net/teds-ten-aims/
Levi’s: In 2013, the brand released its Wellthread product develop-ment process and clothing line focused on sustainability. Instead of following a cost of goods target, the aim was to “do the right thing at every decision point”. This resulted in complexity reductions and decisions against producing certain products if this aim could not be achieved. The company states it was able to lower its price points by 30% year over year through this approach, achieving profitability, as indicated by a company representative in an interview in Ecouterre.www.levistrauss.com/sustainability/products/levis-wellthread-collec-tion/
ENCOURAGING MOVES
Exhibit 14 Water, Chemicals, and Waste Impact Highly Influ-enced in Design Phase
In the design and development phase, brands can reduce lifecycle impacts by considering the foot-print of proposed garments upfront. (See Exhibit 14.) Designs, especially the choice of raw materials, deter-mine much of a garment’s destiny and impact. The fiber mix of a garment can impede or facilitate recy-cling, while the colors and prints will limit the options for dyes and process chemicals.
The design function in fashion brands has to over-come two challenges. One is the lack of awareness of their influence on the environmental and social foot-print, which goes hand in hand with the absence of tools to assess their impact. The other is many brands’ tendency to ‘design to cost’, letting immediate mate-rials costs drive design choices—instead of total envi-ronmental and social costs over the entire value chain. With a full understanding of the implications of their decisions, they can adjust their designs to lighten the load for the entire production process.
The overall score in this stage of the value chain is just 22, well below the overall average of 32. Apart
from a few niche sustainability champions, the compa-nies that best connect design to sustainability are big international sportswear and large entry-price players. Their scores are around 40.
The Pulse Survey further confirms that fashion design has significant catch-up potential: It is the stage with the second largest difference between fashion brands’ current low level of commitment and their intent to focus on this area in the future.
Indeed, some leading brands have made head-lines with more sustainable designs. Nike has “designed out” waste from the start with its FlyKnit collection of footwear, whose one-piece upper avoids multiple stitched or glued panels, cutting waste volume during production by 60%.73 (See Encouraging Moves). But the industry would still benefit from universal design standards discouraging fiber combinations that pol-lute, harm, or consume excessive resources, and rais-ing awareness in designers of their role and their col-lective impact.
4039 PULSE OF THE FASHION INDUSTRYCHAPTER 2
©CFW

RAW MATERIALS
Water High
High
High
Very low
Medium
Medium
Very low
High
Irrigation methods, e.g., choice between conventional cotton versus more sustainably sourced cotton
Using recycled plastics/fibers, e.g., replacing virgin polyester
Amount and frequency of fertilizer and pesticide use
Low level of wagesPrevalence of child labor
Safeguarding safety standards
Guaranteeing animal welfareExtensive land use, consideration of use for food production
Energy
Chemicals
Waste
Labor practices
Health & safety
Community & ext. eng.
Ethical practices
Impact area Magnitude of impact Biggest drivers
Cow leather
Silk
Cotton
Bast fiber
Wool
Synthetic leather
Nylon
Modal
Viscose/Rayon
Acrylic
Elastane/Spandex
Lyocell
Polyester
Polypropylene
Exhibit 16 Cradle to gate environmental impact by material
Cradle to gate environmental impact index per kg of material
Scoring currently qualitative. Once method-ology is more mature, ecotoxicity and human toxicity will be assessed quantitatively in the MSI. Data collection is ongoing. Prevalent in the raw materials and processing phases
Emissions of greenhouse gasses. Prevalent in processing and manufacturing phases
Environmental damages of water use for hu-man health, ecosystem quality, and resources. Prevalent in the raw materials and processing phases
Depletion of natural resources faster than they can be replenished. Prevalent in raw materials and manufacturing (sundries and packaging)
Excessive richness of nutrients in a lake or oth-er body of water, frequently due to runoff from the land, causing dense growth of plant life and death of animal life from lack of oxygen. Prevalent in the raw materials phase
Chemistry Abiotic Resource Depletion, Fossil Fuels Eutrophication
Global Warming Water Scarcity
Exhibit 15 Water, Energy, Chemicals, and Ethical Practices Drive Footprint in Raw-Material
Source: Higg Materials Sustainability Index, msi.higg.org, data retrieved on 27 September 2017; Levi's (2015); H&M (2017); BCG Analysis
Note: These results were calculated using the Higg MSI Tools provided by the Sustainable Apparel Coalition. The Higg MSI Tools assess impacts of materials from cradle-to-gate for a finished material (i.e. to the point at which materials are ready to be assembled into a product). The Higg MSI scores provided herein are for a single production stage within the Higg MSI scope (e.g. fiber or raw material) and do not provide a holistic view of the impacts involved with material production."
The raw materials stage also has a disproportion-ately large impact on sustainability, partly because of the effect it has on recyclability. It involves the culti-vation and sourcing of base materials, such as natural and synthetic fibers. (See exhibit 15.) Suppliers at this stage are referred to as Tier 3, whereas Tier 2 refers to processing and Tier 1 to manufacturers.
Data from the Higg Materials Sustainability In-dex (MSI), a cradle-to-gate material scoring tool by the Sustainable Apparel Coalition (SAC), shows that the materials with the overall highest environmen-tal impact are leather and natural fibers (silk, cotton, wool). (See Exhibit 16.) These materials show the high-est negative impacts across all dimensions. And even within one type of material there are considerable dif-ferences. Water use for cotton depends a great deal on the method of cultivation, while incorporating recy-
cled polyester reduces a garment’s energy footprint. The raw materials stage as a whole scores next to last in the value chain, at 17. But there is wide variation: the niche sustainability champions and large players reach scores of 60, while smaller companies come in as low as 5.
The Pulse Survey confirms the Pulse Score find-ings. Large players are certainly more cognizant of the impact of their raw materials. Interestingly, the survey asked respondents to estimate what proportion of raw materials were sustainable (e.g., organic, recycled, re-generated, fair trade, BCI, Tencel®), and the average was a fifth. Yet only a tenth was labeled as sustainable and explicitly marketed as such.
There is a small but perceptible shift toward broader use of sustainably sourced materials. (See En-couraging Moves). One marker is the rising share of or-
THE RAW MATERIALS STAGE HAS A DISPROPORTIONATELY LARGE IMPACT
ON SUSTAINABILITY, PARTLY BECAUSE OF THE EFFECT IT HAS ON RECYCLABILITY
4241 PULSE OF THE FASHION INDUSTRYCHAPTER 2
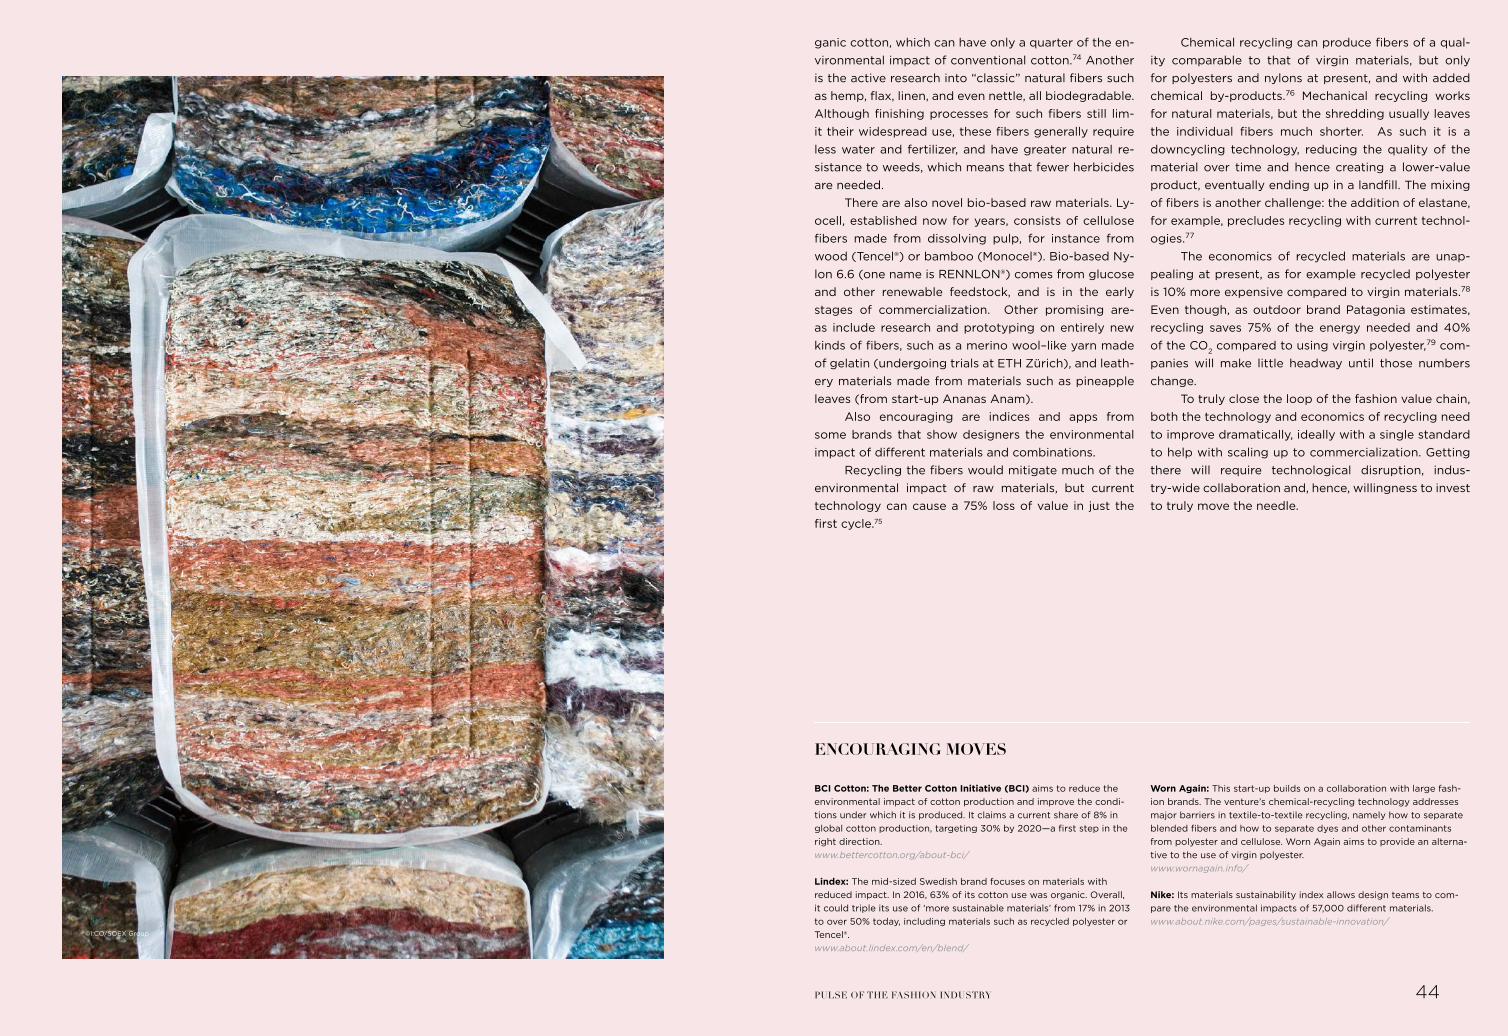
BCI Cotton: The Better Cotton Initiative (BCI) aims to reduce the environmental impact of cotton production and improve the condi-tions under which it is produced. It claims a current share of 8% in global cotton production, targeting 30% by 2020—a first step in the right direction. www.bettercotton.org/about-bci/
Lindex: The mid-sized Swedish brand focuses on materials with reduced impact. In 2016, 63% of its cotton use was organic. Overall, it could triple its use of ‘more sustainable materials’ from 17% in 2013 to over 50% today, including materials such as recycled polyester or Tencel®. www.about.lindex.com/en/blend/
Worn Again: This start-up builds on a collaboration with large fash-ion brands. The venture’s chemical-recycling technology addresses major barriers in textile-to-textile recycling, namely how to separate blended fibers and how to separate dyes and other contaminants from polyester and cellulose. Worn Again aims to provide an alterna-tive to the use of virgin polyester. www.wornagain.info/
Nike: Its materials sustainability index allows design teams to com-pare the environmental impacts of 57,000 different materials. www.about.nike.com/pages/sustainable-innovation/
ENCOURAGING MOVES
ganic cotton, which can have only a quarter of the en-vironmental impact of conventional cotton.74 Another is the active research into “classic” natural fibers such as hemp, flax, linen, and even nettle, all biodegradable. Although finishing processes for such fibers still lim-it their widespread use, these fibers generally require less water and fertilizer, and have greater natural re-sistance to weeds, which means that fewer herbicides are needed.
There are also novel bio-based raw materials. Ly-ocell, established now for years, consists of cellulose fibers made from dissolving pulp, for instance from wood (Tencel®) or bamboo (Monocel®). Bio-based Ny-lon 6.6 (one name is RENNLON®) comes from glucose and other renewable feedstock, and is in the early stages of commercialization. Other promising are-as include research and prototyping on entirely new kinds of fibers, such as a merino wool–like yarn made of gelatin (undergoing trials at ETH Zürich), and leath-ery materials made from materials such as pineapple leaves (from start-up Ananas Anam).
Also encouraging are indices and apps from some brands that show designers the environmental impact of different materials and combinations.
Recycling the fibers would mitigate much of the environmental impact of raw materials, but current technology can cause a 75% loss of value in just the first cycle.75
Chemical recycling can produce fibers of a qual-ity comparable to that of virgin materials, but only for polyesters and nylons at present, and with added chemical by-products.76 Mechanical recycling works for natural materials, but the shredding usually leaves the individual fibers much shorter. As such it is a downcycling technology, reducing the quality of the material over time and hence creating a lower-value product, eventually ending up in a landfill. The mixing of fibers is another challenge: the addition of elastane, for example, precludes recycling with current technol-ogies.77
The economics of recycled materials are unap-pealing at present, as for example recycled polyester is 10% more expensive compared to virgin materials.78 Even though, as outdoor brand Patagonia estimates, recycling saves 75% of the energy needed and 40% of the CO2 compared to using virgin polyester,79 com-panies will make little headway until those numbers change.
To truly close the loop of the fashion value chain, both the technology and economics of recycling need to improve dramatically, ideally with a single standard to help with scaling up to commercialization. Getting there will require technological disruption, indus-try-wide collaboration and, hence, willingness to invest to truly move the needle.
4443 PULSE OF THE FASHION INDUSTRYCHAPTER 2
©I:CO/SOEX Group

PROCESSING
Water High
Very high
Very high
Medium
Very high
Very high
Low
Low
Water use in dyeingWater use in cleaning, rinsing of fibers
Share of renewable energy useEnergy efficiency of equipment
Lack of waste water treatment in dyeingChemicals for fiber treatments
Waste of fibers/fabrics (e.g., roll ends, off-cuts, samples)
Low level of wages, non-compliance to min. wage laws, gender inequalityWorker wellbeing, bonded and child labor
Building safetyChemical exposure of workers
Prevalence of corruption
Energy
Chemicals
Waste
Labor practices
Health & safety
Community & ext. eng.
Ethical practices
Impact area Magnitude of impact Biggest drivers
Exhibit 17 Both the Environmental and the Social Footprints Have a Large Impact in the Processing Phase
Wastewater Pollution in Fashion
Measuring the chemical pollution of wastewater is a complex procedure due to a large number of hazardous sub-stances and the variation in their impact. Fortunately, it is possible for companies to mitigate wastewater pollution without performing advanced analyses.
How does water pollution work? The sources of water pollution in the fashion industry are twofold. First, exces-sive amounts of nutrients (e.g. nitrogen and phosphorous) in agriculture can lead to runoffs from the land ending up in waterways. The resulting negative effects include algal blooms leading to a lack of available oxygen in the water. Second, or-ganic and inorganic toxic substances (e.g.
mercury and arsenic) discharged from factories to waterways can cause unde-sirable change in the natural environment and bioaccumulation in the food web. Such toxic chemicals are numerous and have diverse water pollution impacts.
How large is the relative impact?In their 2015 EP&L, Kering estimates that water pollution contributes 12% of the total environmental footprint of the company – as compared with greenhouse gas emissions at 37%, and land uses at 24%. The vast majority of water pollution occurs during raw material production and raw material processing. The effects of manufacturing, assembly, and stores, warehouses and offices are negligible.
Out of all the raw materials used in the fashion industry, metals – in particular precious metals – have the highest water pollution impact.
Why should we care?There are multiple adverse effects of water pollution on the environment. For human health toxins can build up in the body, potentially leading to cancer and other acute conditions. Excessive nutri-ents can reduce the oxygen in water and kill off the fish stock. Polluted drinking water for livestock may reduce the pro-duction, quality and safety of the meat.
Source: based on Kering EP&L for 2013, 2014,
2015
Nike: For its 2016 Super Bowl collection of apparel, Nike used a novel dyeing process by Dutch company DyeCoo, in which pressur-ized CO2, in a nearly closed loop process (95% of ingoing materials are recycled), is used as the dyeing medium instead of water, thus requiring zero water and process chemicals. www.dyecoo.com/co2-dyeing/
Timberland: The firm introduced its Green Index in 2007, tracking climate impact, use of chemicals, and other resources during production. www.greenindex.timberland.com/
ZDHC (Zero Discharge of Hazardous Chemicals): The program ad-vocates eliminating hazardous chemicals from the fashion industry. Participating brands commit to adhering to a Restricted Substances List and report on results from wastewater testing. 79 companies currently participate, thereof 22 brands such as Burberry, Gap or Puma.www.roadmaptozero.com/programme/
ENCOURAGING MOVES
The processing phase includes spinning, weav-ing, and other preparation of fabrics, all activities with substantial environmental and social footprints.80 (See Exhibit 17.)
This stage has the second-highest Pulse score, at 38, with companies scoring from 80 to 0. That’s one of the biggest performance gaps, suggesting that tre-mendous improvements are feasible if the small com-panies catch up.
H&M estimates that 47% of the climate impact and 6% of the water impact occurs in processing.81,82 Dyeing fabrics alone can require as much as 150 lit-ers of water per kilogram,83 and the water is often dis-
charged unfiltered into waterways. Wastewater pollu-tion can be considered as a major area of challenges within processing but also in raw materials stages due to the use of nutrients and fertilizers. (See Wastewater Pollution in Fashion).
Moreover, the social impact within processing is described by many actors as high, primarily because of garment workers’ exposure to hazardous chemi-cals.84
The limited transparency and traceability are a fundamental weakness in this stage.85 Few brands ef-fectively monitor their Tier 2 suppliers, especially on labor practices and workers’ safety, partly because of
the proliferation of suppliers and the distance from brand operations. The issue is further complicated when processing suppliers, facing high demand, out-source and sub-contract to third-party suppliers un-known to the brand or retailer.
With environmental factors, transparency is es-pecially an issue with chemical usage. Suppliers are looking to increase energy efficiency, a much-needed step as processing is very energy-intensive.
Production technologies are improving, galva-nized by demand from brands and retailers keen to im-prove the eco-friendliness of their products. (See En-couraging Moves) But technology is no substitute for the protocols that help change practices everywhere along the value chain. Using technology to increase transparency and analysis is one thing; doing some-thing with the resulting insights is another.
4645 PULSE OF THE FASHION INDUSTRYCHAPTER 2

© Andri Tambunan/Greenpeace

MANUFACTURING
Water Low
Medium
Low
Medium
Very high
Very high
Medium
Medium
Water use in garment finishing
Share of renewable energy useEnergy efficiency of equipment
Toxicity of materials used for prints
Waste from cut-and-sew, samples
Low level of wages, non-compliance to min. wage and overtime laws, gender inequalityWorker co-determination (unions)
Issues in building safetyInsufficient length of rest times
Setup of local infrastructure and services to workers
Prevalence of corruption
Energy
Chemicals
Waste
Labor practices
Health & safety
Community & ext. eng.
Ethical practices
Impact area Magnitude of impact Biggest drivers
Exhibit 18 The Impact of Health and Safety, and Labor Practices is High During Manufacturing
The manufacturing stage involves cutting, sew-ing, buttonholing, gluing, welding, and seam taping the fabric, along with some dyeing and finishing such as stonewashing. Social factors are the main issue here with labor and health and safety standards having been in public spotlight recently. (See Exhibit 18.)
Manufacturing lags behind processing with a Pulse Score of 28. As elsewhere, the big sportswear players outperform the others with a score of 76, while the midsize and small segments reveal their catch-up potential with scores ranging from 18 to 43.
The Pulse Survey results are largely in agreement. They reveal brands’ declared intent to invest in more environmentally and worker friendly manufacturing processes. More than three-quarters of the compa-nies polled state that they plan to elevate the topic by assigning head count and funding to it—the highest
number for any of the value-chain steps. They realize there is much to do to “clean up” these operations.
Social impact is the main challenge. Brands and retailers are intensifying the spotlight on working conditions in their suppliers’ factories by closer mon-itoring, often with their own evaluations and clear minimum requirements. (See Encouraging Moves). Consumers are increasingly seeking transparency in the value chain.
Yet in Myanmar textile factories, wages can still be as low as €55 per month, and little higher in Bang-ladesh.86 That’s half of what’s needed to sustainably support the workers and their families.87 A central challenge is the continual drive-down of pricing com-bined with the fierce competition among low-wage factories. Concerned about their international com-petitiveness, governments in many producing coun-
tries have hesitated to set minimum wages that meet workers’ basic needs.88
Factories, of course, work under local laws gov-erning labor conditions (for example, controlling working hours), environmental aspects (for exam-ple, governing chemical use) and other well-intend-ed rules. Voluntary agreements abound, such as the bluesign label to certify production processes, the UN
Global Compact, and Bangladesh’s Accord on Fire and Building Safety. The International Labour Organ-ization publishes standards, albeit without the ability to directly implement or enforce them. Yet there is no cross-country legal framework that addresses all—or even a large part of—what is needed to secure fair wages and safe working conditions.
Levi’s: The brand launched its Worker Well-Being Initiative in 2011, implementing programs to increase social sustainability at supplier factories. The brand had expanded its initiative to 12 countries by 2016 and aims to do so with 80% of its product volume by 2020. www.levistrauss.com/sustainability/people/
Povigy: The technology startup will soon launch a mobile app that lets shoppers evaluate the sustainability of participating brands directly in store. Povigy plans to base the evaluations on its own ver-ification of the brands and on documentation describing upstream manufacturing processes. www.povigy.com
ENCOURAGING MOVES
5049 PULSE OF THE FASHION INDUSTRYCHAPTER 2
©Liu Feiyue/Greenpeace

TRANSPORTATION
Water Very low
Medium
Very low
Medium
Low
Low
Very low
Very low
Excessive use of energy in transport modes (airplanes)
Waste generated through packaging, pallet use
Non-compliance to contract terms (sub-contracting)Excessive working hours
Insufficient length of rest times
Energy
Chemicals
Waste
Labor practices
Health & safety
Community & ext. eng.
Ethical practices
Impact area Magnitude of impact Biggest drivers
Exhibit 19 Transportation Phase with Overall Low Relative Environmental and Social Footprint
Nike: The brand offers an example for brands that have invested significantly in their warehouse operations to reduce their environ-mental impact. In 2016 the brand opened a new distribution center in Belgium, using 100% renewable energy from its own wind turbines and solar panels. It claims to recycle more than 95% of the waste generated onsite. www.news.nike.com/news/nike-laakdal-belgium-campus/
Inditex: The retailer introduced its Green to Pack program in 2015 to reuse and optimize packing materials and methods, saving 660 sea-container shipments and more than 185,000 m² of cardboard that year, equivalent in area to a 25 football fields. www.inditex.com/sustainability/environment/logistics/
ENCOURAGING MOVES
Transportation, which includes packaging as well as distribution, has clear impacts related to sustain-ability. (See Exhibit 19.) Yet the environmental and social footprints in this stage are much smaller than in other stages. That’s partly because the activities in this stage are similar to what happens in other in-dustries, so that fashion brands can benefit from the scale and innovation already in place elsewhere. For all the energy expended in moving apparel globally, this stage contributes only 2% of the climate-change impact of the entire value chain.89 The effects on water and chemicals are negligible.
Indeed, transportation’s overall Pulse Score is 41,
highest of all the stages. Even the lowest-scoring per-formers in this stage do not fall below 28, while the top players exceed 90.
The Pulse Survey showed that brands spend little money, time and resources on transportation, as sug-gested in expert interviews because they already have programs, in collaboration with logistics partners, to optimize the flow of goods. Transportation is also one of the few instances where cost and environmental impact are closely tied together (See Encouraging Moves). Companies have built-in disincentives to dis-courage routine air-shipments.
51 CHAPTER 2

RETAIL
Water Very low
Medium
Very low
Medium
Medium
Very low
Medium
Medium
Energy efficiency in stores (e.g., lighting)
Low level of wages, excessive working hoursLimited social security, temporary employment
Waste generated through packaging, tags, hangers, bags
Engagement with consumers on sustainability awareness and impacts
Choice of models and imageryInfluence on consumption patterns
Energy
Chemicals
Waste
Labor practices
Health & safety
Community & ext. eng.
Ethical practices
Impact area Magnitude of impact Biggest drivers
Exhibit 20 Retail Phase with Varied Environmental, Social and Ethical Impact Areas to Consider
Kering: The brand promotes renewable energy use in its headquar-ters and the stores of its brands. For single brands' operations it states 'green energy' shares of over 80%. It also invests in onsite production of clean energy through solar panels, announcing to have saved nearly 400 tons of CO2 in 2014. It also encourages LED lighting in the stores of its brands to gain energy savings of up to 90% over older technologies. In 2015, Gucci invested €2.4 million to replace in-store lighting. www.kering.com/en/sustainability/
Inditex: By the end of 2016, Inditex had 4,519 eco-efficient stores accounting for over 60% of its stores, with the aim of reaching 100% by 2020. These stores save 20% in electricity and up to 50% of water consumption in comparison with conventional stores. The brand follows the guidelines and recommendations of the LEED certificate and the European BREEAM seal in order to ensure that the initiative keeps moving in the right direction.www.inditex.com/sustainability/environment/ecoefficient_stores
ENCOURAGING MOVES
Retail is where the magic happens for shoppers—where ambience and aspiration turn into purchase. It gets little attention for sustainability, which is unfortu-nate because it has great potential for improving ener-gy use, reducing waste, and engaging with consumers. (See Exhibit 20.)
The retail stage’s Pulse Score is only 28, with low variation across the industry. The exceptions are the premium and luxury players, which fall short with scores around 13, and the sustainability champions, which have built their customer experience around the subject, at 75. Many of the latter have point-of-sale measures to drive a reduced footprint.
The Pulse Survey backs up those conclusions but adds that the big players deviate from this pat-tern with a higher level of commitment. With the retail
stage as the main point of customer contact, brands can influence consumer behavior regarding wear and care of the products. And with many large stores, these companies are realizing that energy efficiency (on lighting and air conditioning for instance) may bring significant cost savings.
At first glance, it’s hard to grasp the overall im-pact of the retail stage. Inventory usually turns quickly, and staff are treated well, especially in premium stores. But all the bright lighting, heating, and ventilation can account for around 5% of the CO2 generated over the value chain.90 Regulation is unlikely to play a part; as with transportation, most retailers will act in their eco-nomic interests to reduce energy consumption. (See Encouraging Moves.)
©CFW
5453 PULSE OF THE FASHION INDUSTRYCHAPTER 2

©CFW

CONSUMER USE
Water Medium
High
Medium
Medium
Very low
Very low
Very low
Low
Water use of washing by consumers
Energy consumption of washing, drying, ironing
Toxicity of detergentsPollution of waste water (e.g., chemical processing residues, micro-plastics)
Prolonging product use avoiding resource wasteUsing second hand sources for products saving resources
Participation in trends encouraging waste
Energy
Chemicals
Waste
Labor practices
Health & safety
Community & ext. eng.
Ethical practices
Impact area Magnitude of impact Biggest drivers
Exhibit 21 Energy with the Highest Impact During the Use Phase
The consumer use phase is where the product is handled, washed, repaired, and possibly passed on. The magnitude of this phase’s impact is not yet con-clusively assessed in research and comprehensive data is lacking. A future edition of this report will elaborate on the topic in more detail. Yet, it is reasonably safe to assume that the main drivers are the energy and water consumption from washing, as well as energy-inten-sive drying. (See Exhibit 21.) The type and amount of detergents influence the impact as well.
Also important are attitudes about prolonged use. Not long ago, most apparel was carefully looked after, repaired, and handed down. With the coming of fast-fashion, in the past decade the number of gar-ments purchased by the average consumer has more than doubled. Some consumers treat garments as nearly disposable, throwing them out after only a cou-ple of wears.91
With a Pulse Score of 23, the industry seems to be neglecting this stage. Even the big fast-fashion and sportswear firms that do well elsewhere on the value chain are unable to top 20 at the consumer use stage. Only the sustainability champions surpass 50. The Pulse Survey underscores the Pulse Score findings, especially with regard to the lack of commitments to funding and resources into the future. This suggests that either most companies do not consider the use phase their responsibility, or that technologically and economically viable solutions do not yet exist.
Yet brands do have an opportunity to promote awareness here, especially on environmentally friendly washing and the options for reuse—which in turn can boost consumer engagement with their brands.
Several large brands have initiatives to educate consumers about responsible use of their products. More than that: some offer incentives to care and
resources to act on their concern. (See Encouraging Moves.) Regulators can help with inducements for prolonging a product’s life, as Sweden did by halving the tax rate on product repairs.
Meanwhile an intriguing sub-industry has emerged around clothing rental, using the web to minimize one-time use of garments. Start-ups include MUD jeans and VIGGA organic children’s wear. A ca-veat to these online rental business models, however, is the additional need for transport and for garments to be washed between rentals. Further, hardly anyone
has yet managed to succeed in this concept profitably at scale.
As for reuse, more than half of respondents to a UK survey had bought used clothes in the previous year, and a fourth indicated that they would buy more if the choices improved. Two-thirds said they would consider participating in retailer buy-backs.92 Research in other EU countries, though, shows the long journey ahead: only 10% of respondents considered buying second-hand in their three most recent purchases.93
Patagonia: Through the brand’s Worn Wear program consumers can send in worn or lightly damaged Patagonia apparel to be repaired. The program involves 45 full-time repair technicians at a service center, completing about 40,000 repairs a year. The program also extends to a collaboration with iFixit, an online repair resource, to create care and DIY repair guides for consumers. www.patagonia.com/worn-wear.html/
Stella McCartney: Together with Clevercare the brand releases an ongoing series on steps consumers can take to prolong the useful life of its products and reduce their own environmental impact during use. It also equips its products with the Clevercare label, providing for instance washing advice to minimize the footprint of product care. www.stellamccartney.com/experience/the-clevercare-series/
Rent the Runway: The clothing rental firm started off in 2009, and in 2015 it introduced its Unlimited subscription, allowing customers to hold on to as many as three pieces of apparel at a time for as long as they want for €130 per month. Rent the Runway even partnered with high-end retailer Neiman Marcus in late 2016 to offer its rental services in store outlets. The concept is clearly a winner: in 2016, the company generated annual revenue of more than €90 million, up from €40 million in 2014 (according to Recode).www.renttherunway.com/unlimited/
ENCOURAGING MOVES
IN THE PAST DECADE THE NUMBER OF GARMENTS PURCHASED PER CONSUMER HAS MORE THAN DOUBLED, AND SOME CONSUMERS THROW THEM OUT AFTER
ONLY A COUPLE OF WEARS
5857 PULSE OF THE FASHION INDUSTRYCHAPTER 2

END-OF-USE
Water Medium
Medium
Very low
Very high
Very low
Very low
Very low
Medium
Premature disposal leading to unnecessary resource waste
Premature disposal leading to unnecessary resource waste
Disposing end-of-use products generating waste and connected negative externalities (e.g., leachate emissions from landfills)
Premature disposal leading to unnecessary resource waste
Energy
Chemicals
Waste
Labor practices
Health & safety
Community & ext. eng.
Ethical practices
Impact area Magnitude of impact Biggest drivers
Exhibit 22 Environmental Impact Driven by Waste During End-of-Use Phase
Innovating on novel technology
"Changing the traditional fashion cycle/mindset to promote buying less and making it last longer"
"Chemicals phase-out will be a huge win"
Expanding environmental sustainability efforts to include raw material production and processing
Prolonging useful life of garments (e.g. repairs, re-use)
Fostering different business models, such as fashion rental services
Fostering design for durability and cyclability
Expanding social and ethical sustainability efforts to include raw material production and processing
Increasing use of virgin organic or novel bio-based (e.g. Lyocell/Tencel®) fibers
Improving recycling collection and sorting
Engaging and informing consumers on more sustainable product care
Increasing use of recycled fibers
Others, please specify below
26
% of Top 3 ranks
22
22
13
13
13
12
12
8
4
14
Exhibit 23 Pulse Survey Results: "Which levers show the potential to have the greatest impact on improving sustainablity?"
Recycling Options Are Not Thought of As Levers for Improving Sustainability
1. Participants were asked to chose their top 5 levers, percentages show share of top 3 ranks given n=91Source: BCG, GFA Pulse Survey
When it comes to the end of the life cycle of fashion products, different fates are possible. They can be put to a different use (e.g., second use with a new owner), up- or down-cycled, fully recycled (feeding back to the fashion value chain to ‘close the loop’) or just disposed of, winding up in landfills. Here lies the largest driver of this stage: preventing products from ending up as pure waste. (See Exhibit 22.)
The Pulse Score here is 9, the lowest of all the stages. Even segments that score well in other stages do poorly, some as low as 15. Only the sustainability champions do well at 46. As with consumer use, this low achievement level likely reflects little industry at-tention or a lack of technologically and economically viable solutions.
The Pulse Survey underscores these results and reveals that across the value chain, recycling options are perceived to be the least relevant improvement levers. (See Exhibit 23.) Further, in interviews, compa-nies have expressed a wish to “fix the basics” of sus-tainability elsewhere in the value chain before working on end-of-use.
But does the fashion industry even need to get involved? Don’t consumers already use the clothing drop boxes available and respond to the leaflets from non-profits offering free pickups of castoffs? Some do—yet across the EU27 nations, only 18% of clothing is reused or recycled94 (See Exhibit 24) and the U.S. number is even worse.95 The global average is 20%.96 In contrast to glass, plastic, and paper waste, apparel
THE PULSE SCORE FOR END-OF-USE IS ONLY 9, THE LOWEST OF THE STAGES,
LIKELY DUE TO LACK OF INDUSTRY ATTENTION AND TECHNOLOGY
6059 PULSE OF THE FASHION INDUSTRYCHAPTER 2

End of use
80%
10%
35% 20%
40% 8%
30% 25%
57%
50% 10%
70%
Clothing in useRaw materials
Final share of clothing waste
Ultimate Disposal
Collection & sorting
Incineration
Reuse
Landfill
RecyclingWaste after raw materials have been delivered to the fiber producer1,2
Processing, manufacturing, transportation
& retail
Clothing retained for next year
54%
Most Clothing Waste Ends Up in Landfill or Being Incinerated
Exhibit 24
1. ~9% waste in fiber production, ~91% in yarn, fabric and garment production 2. Excluding co-products and waste associated with chemical, oil and agricultural productionNote: Figures based on studies of the UK and the EU27Source: BCG analysis; Wrap (2012); Beton et al. (2014)
gets little respect at disposal. Indeed, when it comes to packaging, recovery and recycling rates are at 98% in Germany and 79% in Belgium.97
The used-textile market was worth close to €4 billion worldwide in 2015.98 But consumer hesitance toward second-hand clothing in developed countries make it unlikely that the reuse market can develop as a robust, growing part of the fashion industry’s value chain without major changes in fashion brands’ and consumers’ views.
Transitioning to a ‘closed loop’ fashion value chain is needed, where discarded products are used
as raw materials for production—a ‘circular’ industry model. End-of-use already receives some notable at-tention from individual brands, such as Patagonia’s Common Threads program for Teijin polyester, which is chemically recycled for use in new garments. While admirable, this and other advances (see Encouraging Moves) lack scale, and must be amplified in coordinat-ed efforts among brands, regulators, and consumers. (See Chapter 3.)
H&M: The brand has partnered with I:CO, a solutions provider for clothing and footwear reuse and recycling. Its facility in Germany receives 25 to 30 truckloads a day from collection bins at H&M stores. The brand has similar facilities in the US and India. In 2016 it collected nearly 16,000 tons, a 29% increase from the year before. The brands CEO Karl-Johan Persson is satisfied with the program’s results, as he states: “According to our customers surveys, our gar-ment collecting program quickly became the sustainability initiative with the highest awareness amongst our customers. It is tangible for consumers and makes them a part of it.” He also confirms that many
stores reported positive feedback, both in terms of handling process-es and customer reactions.www.about.hm.com/en/sustainability/get-involved/recy-cle-your-clothes.html
Esprit: Since 2016, together with the charity Packmee, the brand lets customers donate clothing via free shipping to the company, which gives part of the revenue generated to the Red Cross, along with a 10% discount voucher back to the customer. www.esprit.com/sustainability
ENCOURAGING MOVES
61 CHAPTER 2
©I:CO/SOEX Group
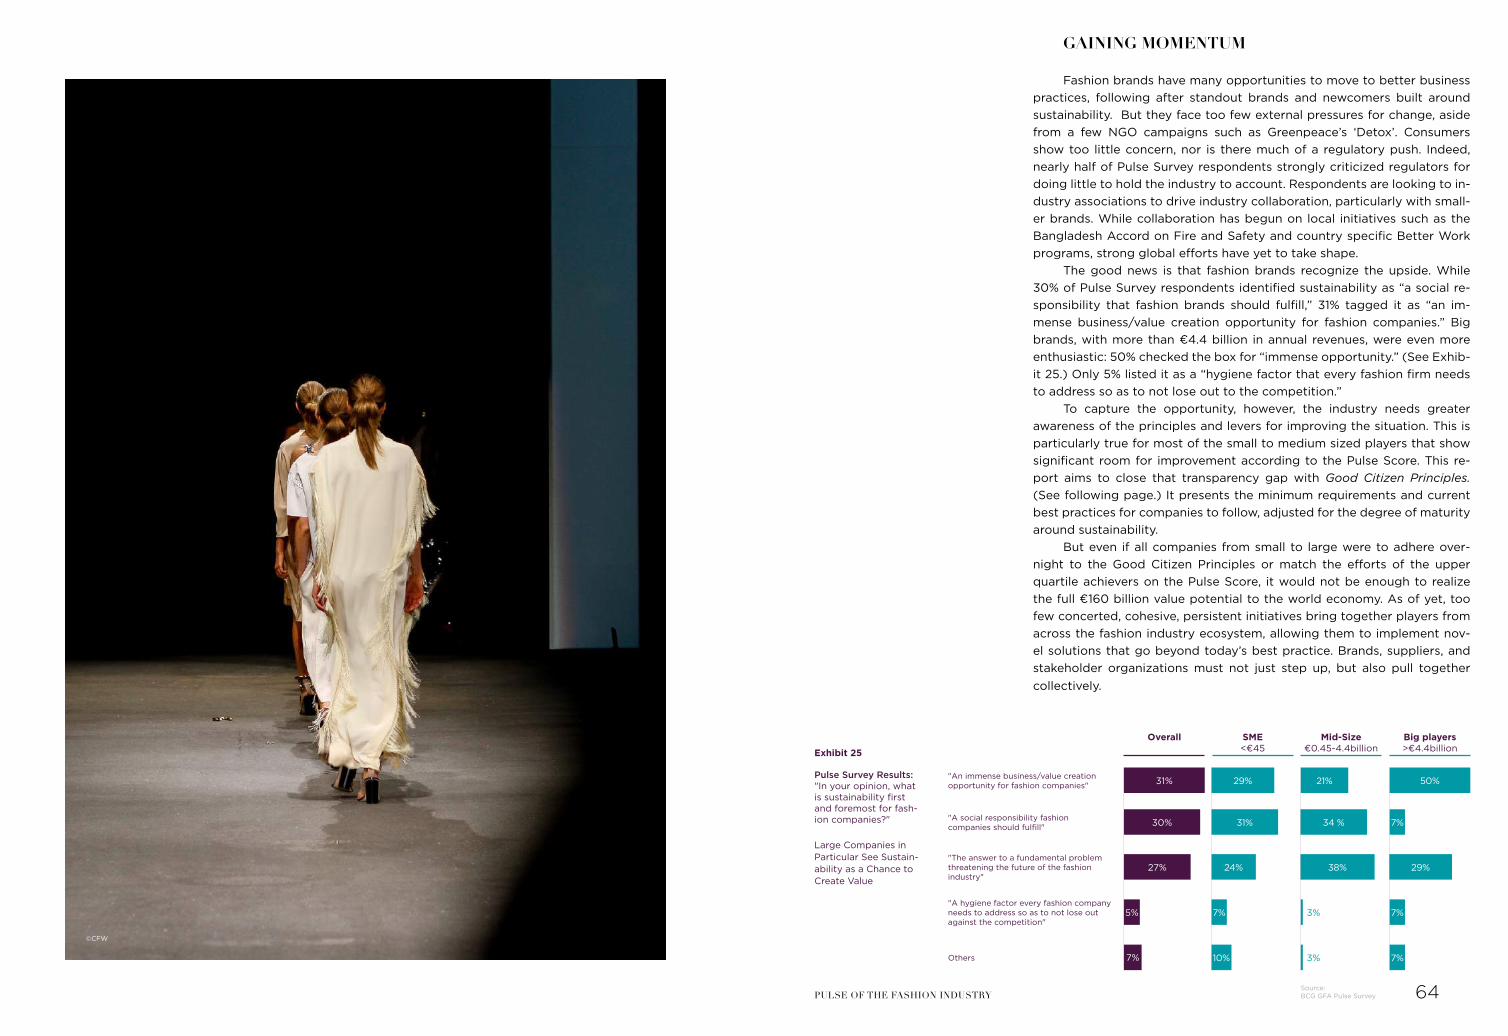
GAINING MOMENTUM
Fashion brands have many opportunities to move to better business practices, following after standout brands and newcomers built around sustainability. But they face too few external pressures for change, aside from a few NGO campaigns such as Greenpeace’s ‘Detox’. Consumers show too little concern, nor is there much of a regulatory push. Indeed, nearly half of Pulse Survey respondents strongly criticized regulators for doing little to hold the industry to account. Respondents are looking to in-dustry associations to drive industry collaboration, particularly with small-er brands. While collaboration has begun on local initiatives such as the Bangladesh Accord on Fire and Safety and country specific Better Work programs, strong global efforts have yet to take shape.
The good news is that fashion brands recognize the upside. While 30% of Pulse Survey respondents identified sustainability as “a social re-sponsibility that fashion brands should fulfill,” 31% tagged it as “an im-mense business/value creation opportunity for fashion companies.” Big brands, with more than €4.4 billion in annual revenues, were even more enthusiastic: 50% checked the box for “immense opportunity.” (See Exhib-it 25.) Only 5% listed it as a “hygiene factor that every fashion firm needs to address so as to not lose out to the competition.”
To capture the opportunity, however, the industry needs greater awareness of the principles and levers for improving the situation. This is particularly true for most of the small to medium sized players that show significant room for improvement according to the Pulse Score. This re-port aims to close that transparency gap with Good Citizen Principles. (See following page.) It presents the minimum requirements and current best practices for companies to follow, adjusted for the degree of maturity around sustainability.
But even if all companies from small to large were to adhere over-night to the Good Citizen Principles or match the efforts of the upper quartile achievers on the Pulse Score, it would not be enough to realize the full €160 billion value potential to the world economy. As of yet, too few concerted, cohesive, persistent initiatives bring together players from across the fashion industry ecosystem, allowing them to implement nov-el solutions that go beyond today’s best practice. Brands, suppliers, and stakeholder organizations must not just step up, but also pull together collectively.
"An immense business/value creation opportunity for fashion companies"
"A social responsibility fashion companies should fulfill"
"The answer to a fundamental problem threatening the future of the fashion industry"
"A hygiene factor every fashion company needs to address so as to not lose out against the competition"
Others
Exhibit 25
Large Companies in Particular See Sustain-ability as a Chance to Create Value
Overall
31%
3%
3%
30% 31% 34 %
38%
29%
29%
21% 50%
24%
7%
7%
7%
7%10%
27%
5%
7%
SME<€45
Mid-Size€0.45-4.4billion
Big players>€4.4billion
Source: BCG GFA Pulse Survey
Pulse Survey Results:"In your opinion, what is sustainability first and foremost for fash-ion companies?"
64PULSE OF THE FASHION INDUSTRY
©CFW

Sampling • Considerate production of samples; avoid short notice samples due to potentially negative im-plications on social labor conditions in facilities
• Replacement of physical samples with virtual samples in all basic items; avoid short notice samples due to potentially negative implica-tions on social labor conditions in facilities
• Impact assessment of materials made available for designers, at least for those with high volume—e.g., through LCA results, Higg MSI index, footprint tools
• Recommendations set on preferred materials and environmentally friendly substitutes
• Durability criteria for large majority of materi-als, supported by lab testing
• Optimization of basic items for waste reduc-tion, e.g., when cutting fabrics and sewing with minimized excess fabric
• First initiatives started to improve low transpar-ency, e.g., through participation in multi-stake-holder collaborations
• Optimization of majority of items for waste reduction, e.g., when cutting fabrics (pattern efficiency)
• Design for enabling closed loop recycling in choice of fabrics, trim, design elements and processing
• Specific measures in place to improve high (but still not full) transparency in the future: e.g., personal visits, participation in 3rd party verified collaborations, only work with agents showing better levels of transparency
• Full coverage of lab testing for materials, at least half of styles subject to field testing
• Consider simplicity/timelessness of design also across seasons to ensure efficient manufacturing androbust products
• Impact assessment of materials made read-ily available for designers for all items at all times—e.g., through LCA results, Higg MSI index, footprint tools, company e-P&L—and standard-ized consideration thereof in the design process
• Recommendations set on preferred materials and environmentally friendly substitutes
• Targets for environmental impact of material use
Optimization of materials (fiber types and mix)
Planning of durability (material and design)
Optimization of design recycling
Supplier transparency & traceability
Step in value chain
Des
ign
and
Dev
elo
pm
ent
Minimum Requirements Industry Best PracticeGOOD CITIZEN PRINCIPLES
The principles outlined on the following pages aim to close the gap be-tween laggards and best performers, as identified by the Pulse Score and the Pulse Survey. The principles outline the minimum requirements for fashion brands as well as the current industry best practice achievable today
Environmental footprint tracking
• First measures in place to track environmental impacts for known suppliers, initiate setup of certified supplier base
• Active in collaborations to tackle environmental issues more efficiently
• Full environmental risk tracking initiated where visibility is already available; action plan on how to extend to additional suppliers
• Clear targets for proportion of certified suppliers and materials (e.g., 100% organic cotton)
• Increase supplier engagement based on personal visits or collaborations; industry leaders help shape agenda of collaborations to distribute knowledge across the industry
• Lead collaborations and provide training to sup-pliers to improve environmental impact
• Provision of guidelines for sustainable sourcing of main materials, e.g. mandatory certifications, minimum compliance requirements
• Clear action plan developed to track social labor standards for known suppliers and to set up certified supplier base, work towards preventing child labor
• Active in collaborations to tackle social labor issues more efficiently
• Use fair trade suppliers where possible (e.g., to al-low for funds into extra wages or into community projects), certify that no child labor is in place and monitor efforts
• Provide training to workforce to reduce health & safety risks
• Use more sustainable sourcing for all key materi-als, such as organic cotton, recycled polyester
• Set targets for key materials, e.g., 50% of cotton sourced from cotton initiatives such as organic cotton, Cotton made in Africa, Better Cotton Initiative
Sustainable material mix
Social labor conditions
Raw
Mat
eria
ls
6665 PULSE OF THE FASHION INDUSTRYCHAPTER 2
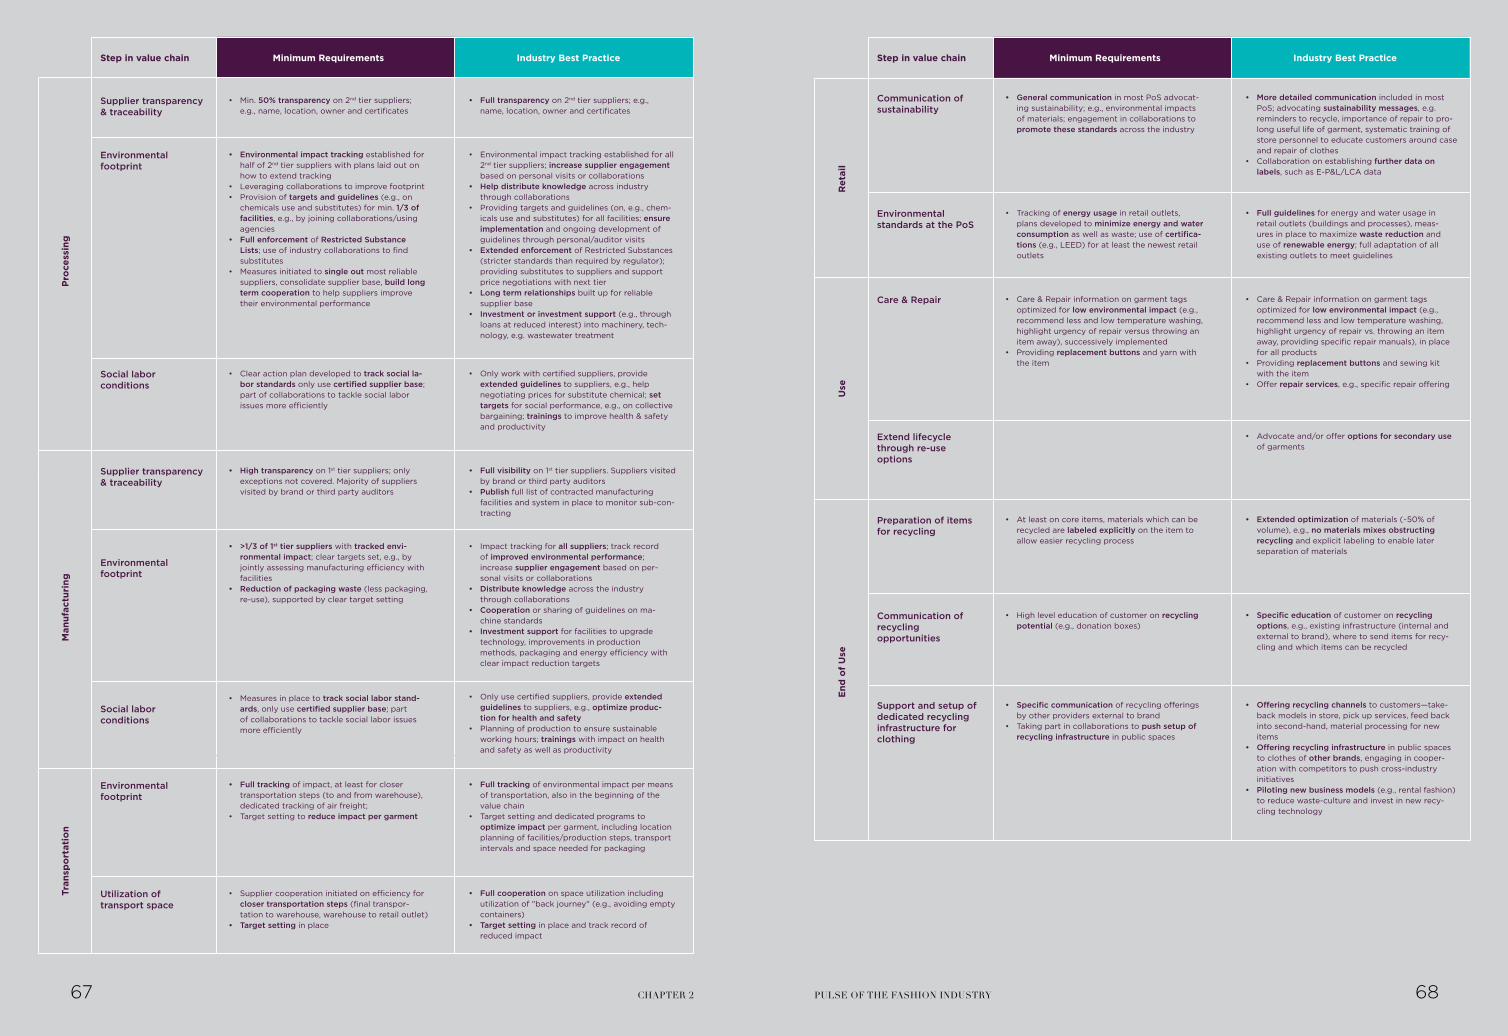
Environmental footprint
• Full tracking of impact, at least for closer transportation steps (to and from warehouse), dedicated tracking of air freight;
• Target setting to reduce impact per garment
• Full tracking of environmental impact per means of transportation, also in the beginning of the value chain
• Target setting and dedicated programs to optimize impact per garment, including location planning of facilities/production steps, transport intervals and space needed for packaging
• Supplier cooperation initiated on efficiency for closer transportation steps (final transpor-tation to warehouse, warehouse to retail outlet)
• Target setting in place
• General communication in most PoS advocat-ing sustainability; e.g., environmental impacts of materials; engagement in collaborations to promote these standards across the industry
• At least on core items, materials which can be recycled are labeled explicitly on the item to allow easier recycling process
• High level education of customer on recycling potential (e.g., donation boxes)
• Specific communication of recycling offerings by other providers external to brand
• Taking part in collaborations to push setup of recycling infrastructure in public spaces
• Tracking of energy usage in retail outlets, plans developed to minimize energy and water consumption as well as waste; use of certifica-tions (e.g., LEED) for at least the newest retail outlets
• Care & Repair information on garment tags optimized for low environmental impact (e.g., recommend less and low temperature washing, highlight urgency of repair versus throwing an item away), successively implemented
• Providing replacement buttons and yarn with the item
• Full guidelines for energy and water usage in retail outlets (buildings and processes), meas-ures in place to maximize waste reduction and use of renewable energy; full adaptation of all existing outlets to meet guidelines
• Care & Repair information on garment tags optimized for low environmental impact (e.g., recommend less and low temperature washing, highlight urgency of repair vs. throwing an item away, providing specific repair manuals), in place for all products
• Providing replacement buttons and sewing kit with the item
• Offer repair services, e.g., specific repair offering
• More detailed communication included in most PoS; advocating sustainability messages, e.g. reminders to recycle, importance of repair to pro-long useful life of garment, systematic training of store personnel to educate customers around case and repair of clothes
• Collaboration on establishing further data on labels, such as E-P&L/LCA data
• Extended optimization of materials (~50% of volume), e.g., no materials mixes obstructing recycling and explicit labeling to enable later separation of materials
• Specific education of customer on recycling options, e.g., existing infrastructure (internal and external to brand), where to send items for recy-cling and which items can be recycled
• Offering recycling channels to customers—take-back models in store, pick up services, feed back into second-hand, material processing for new items
• Offering recycling infrastructure in public spaces to clothes of other brands, engaging in cooper-ation with competitors to push cross-industry initiatives
• Piloting new business models (e.g., rental fashion) to reduce waste-culture and invest in new recy-cling technology
• Full cooperation on space utilization including utilization of "back journey" (e.g., avoiding empty containers)
• Target setting in place and track record of reduced impact
• Advocate and/or offer options for secondary use of garments
Utilization oftransport space
Extend lifecycle through re-use options
Care & Repair
Communication of sustainability
Preparation of items for recycling
Environmental standards at the PoS
Communication of recycling opportunities
Support and setup of dedicated recycling infrastructure for clothing
Step in value chain Step in value chainTr
ansp
ort
atio
n
End
of
Use
Ret
ail
Use
Minimum Requirements Minimum RequirementsIndustry Best Practice Industry Best Practice
• High transparency on 1st tier suppliers; only exceptions not covered. Majority of suppliers visited by brand or third party auditors
• >1/3 of 1st tier suppliers with tracked envi-ronmental impact; clear targets set, e.g., by jointly assessing manufacturing efficiency with facilities
• Reduction of packaging waste (less packaging, re-use), supported by clear target setting
• Measures in place to track social labor stand-ards, only use certified supplier base; part of collaborations to tackle social labor issues more efficiently
• Impact tracking for all suppliers; track record of improved environmental performance; increase supplier engagement based on per-sonal visits or collaborations
• Distribute knowledge across the industry through collaborations
• Cooperation or sharing of guidelines on ma-chine standards
• Investment support for facilities to upgrade technology, improvements in production methods, packaging and energy efficiency with clear impact reduction targets
• Full visibility on 1st tier suppliers. Suppliers visited by brand or third party auditors
• Publish full list of contracted manufacturing facilities and system in place to monitor sub-con-tracting
Supplier transparency & traceability
Environmental footprint
Social labor conditions
Man
ufac
turi
ng
• Clear action plan developed to track social la-bor standards only use certified supplier base; part of collaborations to tackle social labor issues more efficiently
• Min. 50% transparency on 2nd tier suppliers; e.g., name, location, owner and certificates
• Environmental impact tracking established for half of 2nd tier suppliers with plans laid out on how to extend tracking
• Leveraging collaborations to improve footprint• Provision of targets and guidelines (e.g., on
chemicals use and substitutes) for min. 1/3 of facilities, e.g., by joining collaborations/using agencies
• Full enforcement of Restricted Substance Lists; use of industry collaborations to find substitutes
• Measures initiated to single out most reliable suppliers, consolidate supplier base, build long term cooperation to help suppliers improve their environmental performance
• Full transparency on 2nd tier suppliers; e.g., name, location, owner and certificates
• Environmental impact tracking established for all 2nd tier suppliers; increase supplier engagement based on personal visits or collaborations
• Help distribute knowledge across industry through collaborations
• Providing targets and guidelines (on, e.g., chem-icals use and substitutes) for all facilities; ensure implementation and ongoing development of guidelines through personal/auditor visits
• Extended enforcement of Restricted Substances (stricter standards than required by regulator); providing substitutes to suppliers and support price negotiations with next tier
• Long term relationships built up for reliable supplier base
• Investment or investment support (e.g., through loans at reduced interest) into machinery, tech-nology, e.g. wastewater treatment
• Only work with certified suppliers, provide extended guidelines to suppliers, e.g., help negotiating prices for substitute chemical; set targets for social performance, e.g., on collective bargaining; trainings to improve health & safety and productivity
Social labor conditions
Supplier transparency & traceability
Environmental footprint
Pro
cess
ing
• Only use certified suppliers, provide extended guidelines to suppliers, e.g., optimize produc-tion for health and safety
• Planning of production to ensure sustainable working hours; trainings with impact on health and safety as well as productivity
6867 PULSE OF THE FASHION INDUSTRYCHAPTER 2

CHAPTER
A LANDSCAPE FOR CHANGETURNING OPPORTUNITIES INTO REALITIES
3Thus far, GFA and BCG have pointed to a host of initiatives that are
to be applauded and encouraged. There is plentiful evidence that many fashion brands are aware of their impact and ready to engage further at many stages of the value chain. But it has been demonstrated as well, that over 50 percent of the industry, especially small and medium-sized players have not started to take actions yet.
It is also clear that more needs to be done to counteract the impacts that come with the projected increase in consumption. Even if all compa-nies lived up to the good citizen principles, planetary boundaries would still be stretched and only less than half of the €160 billion outlined value potential to the world economy could be realized, even under optimistic and ambitious assumptions, as will be outlined.
So what is the best way forward? What could we do that we do not do today or are not thinking about today? Are there new and different ways to design, produce, sell, and use clothing?
MANY FASHION BRANDS ARE AWARE OF THEIR IMPACT AND READY TO ENGAGE
FURTHER. HOWEVER OVER 50 PERCENT OF THE INDUSTRY HAS NOT STARTED TO TAKE
ACTION YET
TURNING OPPORTUNITIES INTO REALITIES
In the following, we will guide you through the full Landscape of Change as we see it, based on what we already know today. Each dimen-sion of change will take the two outlined perspectives:
1. Pragmatic, immediate actions that can produce palpable change in economically viable ways: These can be implemented with to-day’s technologies and capabilities with ambitious targets and initiatives, going beyond pure good citizen principles
2. Novel solutions and disruptive actions based on collaborating and innovating: These rely on bolder technologies and collective approaches, potentially going beyond what we know today, to achieve outsize impact
The proposed landscape is a first attempt to sketch out the spectrum of options available. It is meant to invite further input and rich discussions during the coming year. And of course, new technologies and solutions will emerge that we cannot imagine today. These will find their way onto future versions of the Landscape for Change.
70PULSE OF THE FASHION INDUSTRY

INTRODUCING THE LANDSCAPE FOR CHANGE
The Landscape for Change will have the following change levers and goals. (See Exhibit 27.)
Environmental:
• Closed loop recycling – No value leakage, e.g., one garment re-cycled for every new garment produced
• Sustainable material mix – 100% sustainable fibers with low foot-print, e.g., replacing conventional cotton
• Reduced energy footprint – Minimized energy consumption and 100% carbon neutrality
• Chemical and water optimization – No hazardous chemicals and no water pollution
• Production-to-demand – No overproduction
Social:
• Rebalanced industry economics – Fair and equal pay to worker and skill development for all workers
• Health and safety excellence – 100% safe working places foster-ing well-being and morale
• Advocacy of human rights – No human rights abuses and full rights advocacy
Overarching:
• Transparency and traceability – Full visibility on all tiers’ supplier performance and conditions
• Consumer engagement – Complete customer information on a garment’s life-cycle impact, environmentally and socially
• Novel business models – Full utilization of purchased fashion products
Moving toward these goals will go a long way toward achieving the €160 billion a year opportunity for the world economy described in chap-ter 1. Staying on the current path, by contrast, will put the industry at risk of significantly higher costs.
A COLLECTIVE EFFORT IS REQUIRED TO GO BEYOND WHAT IS POSSIBLE TODAY
GFA and BCG have quantified a number of initiatives available to indi-vidual companies to demonstrate that there is value to be captured today if the industry starts acting now. The quantifications of these levers will be further outlined in the course of this chapter.
Disclosing the result up front: By summarizing all quantifiable levers, it can be seen that there is a combined value opportunity of ~€60bn avail-able to the world economy through the use of ambitious yet realistic le-
vers that can be implemented by individual businesses already today. (See Exhibit 26.)
But with a value of at least €160bn at stake, ~€60bn clearly falls short of the target. In order to access the remaining value opportunity, a col-lective push is needed across the industry. This collective movement will bring the industry toward well-balanced, outward-looking practices en-suring that fashion brands can prosper while making smart choices that benefit their growth as well as the economy at large. Possible disruptive solutions for industry-wide collaborative initiatives will be explored in de-tail across environmental, social, and overarching levers.
Exhibit 26 Quantification of Impact of Exemplary Levers More Is Needed to Close the Gap
1. Only effect of reduced water consumption considered, no possible negative secondary effects of increased polyester production regarded here
2. No circularity considered, therefore amount does not include value to be realized through up-/down-/recyclingSource: BCG analysis
€18 billion/p.a.1
€13 billion/p.a.
€12 billion/p.a.
€6 billion/p.a.
€5 billion/p.a.
€4 billion/p.a.2
€3 billion/p.a.
~€60billion/p.a.
Reduce conventional cotton useReplacing 30% of 2030 cotton with polyester saves 22.6 bn m³ water
Increase renewable energy use (focus: processing)Moving all processing steps for cotton & polyester to 40% renewable energy saves over 200 M t CO2-eq
Increase energy efficiency in processing stepsIncreasing efficiency in all processing steps for cotton and polyester by ~10% saves over 95 M t CO2-eq
Realize industry best practice safety levelsReaching an injury level comparable to frontrunners by all industry players
Establish minimum wage pay (focus: gender wage gap)Allowing all garment workers paid less than 120% of the local minimum wage to reach that level
Offer in-store end-of-use collection schemesMoving collection rates globally to 60% would reduce waste by nearly 54 M t p.a.
Increase transparency on chemicals usageReach 60% score in chemicals section of Higg index, reduce workers' exposure to chemicals
TO CAPTURE THE FULL €160 BILLION OPPORTUNITY, THE INDUSTRY NEEDS A
COLLECTIVE PUSH
Closed loop recycling
Sustainable material mix
Change area Change lever Estimated impact
Reduced energy footprint
Reduced energy footprint
Chemical & water optimization
Rebalanced industry economics
Health & safety excellence
7271 PULSE OF THE FASHION INDUSTRYCHAPTER 3

Directly implementable solutions
Individual company effort
Collaborative industry effort
Implement supplier health & safety scoring
Use common standard to assess and remediate sustainability performance
Ensure gender equality
Improve energy efficiency(focus: processing)
Intensify engagement with supplier baseand provide order security for suppliers
Reduce conventional2 cotton use(focus: water consumption)
Continuous sustainability education
Re-use Repair Wearables Renting
Reduce toxic fertilizer and chemicals in raw
materials stage
Ensure full payment and avoid forced
overtime
Reduce water pollution
Establish minimum wage pay
Improve chemicals management in
processing
Increase renewable energy use (focus: processing)
Reduce overproduction and markdowns ("create what can be sold in store")
Increase use of sustainable materials
Implement wear & care instructions
Exhibit 27 Landscape for Change Outlining Ambition and Prioritized Initiatives
Low
Magnitude of collaboration and innovation
Non-exhaustive landscape—to be collectively expanded
1. E.g., conventional cotton or leather 2. Cotton grown traditionally; excludes Better Cotton Initiative, Cotton Made in Africa, organic cotton, recycled cottonSource: BCG analysis
High
100% closed loop
0% high impact materials1
100% renewable utilities
0% hazardous chemical use, no water pollution
0% overproduction
100% fair and equal pay to workers
0% avoidable health impact
0% human rights violations
100% enabled businesses
100% consumer information
Full utilization
Disruptive solutions AmbitionLever
Establish industry-wide end-of-use garment
collection
Refine chemical- and water-reduced pro-
cessing (focus: dyeing)
Offer to a 'Segment of One' ('create what customers want')
Move to living wages
Prevent child labor further upstream
Realize same oppor-tunities regardless of
orientation, beliefs and background
Realize industry best practice safety levels
Use intermediaries as enforcer
Establish labels showing info on
environmental LCA
Establish labels showing info on
working conditions
Develop technologies enabling full source
traceability
Change industry standards for markup
structures
Move toward automation at scale
Utilize 3D printing at scale
Use technology to drive assessment of Occupational Health
and Safety (OHS)
Make hazardous chemical use
redundant
Develop innovative man-made fibers
Establish 100% renewable energy use (focus: processing)
Develop polyester enhancements
Design for recyclability Breakthrough in recycling technology
Sharing Lifecycle management Slow fashion Customization
Establish common standard for animal
treatment
Offer end-of-use in-store garment collection scheme
Env
iro
nmen
tal
Soci
alO
vera
rchi
ng
Closed loop recycling
Sustainable material mix
Reduced energy footprint
Chemical & water optimization
Production-to-demand
Rebalanced industry economics
Health & safety excellence
Advocacy of human rights
Transparency & traceability
Consumer engagement
Novel business models
Ensure worker representation
7473 PULSE OF THE FASHION INDUSTRYCHAPTER 3

Since one of the largest determinants of the industry’s environmental footprint is the material mix, especially leather and natural fibers, fashion brands should carefully consider the fiber mix choices. Certificates for sus-tainable materials and production methods are on the rise, such as Cra-dle-to-Cradle (see Sustainable Products Possible at Competitive Prices—Evidence with New C2C-Certified™ T-shirt).
Immediate Actions:Reduce conventional cotton use. We calculate that reducing con-
ventional cotton by 30% can yield more than €18 billion in annual water savings. Polyester, more than any other alternative, has the cost efficien-cies and production scale to be a practical substitute. (See more details on the footprint advantages of polyester over cotton in Exhibit 28.) Polyester already makes up most of the global textile fiber mix, and after decades of development, we can make it with characteristics resembling those of cotton
The mathematics works as follows. Replacing 30% of cotton use by polyester in 2030 would save roughly 23 billion m³ of water annually—wa-ter valued at €0.81 per m3. The goal is realistic, especially since it would call for an increase of only 17% in today’s polyester production, considering a one-to-one cotton-to-polyester substitution.
Polyester is no perfect answer, of course. It comes with its own chal-lenges. In a 2017 study, it is estimated that 15% to 30% of plastics pollut-ing the oceans can be attributed to primary micro-plastics,99 with 35% of those attributed to laundering of synthetic textiles.100 (See Micro-plastic Contaminating Oceans.) Moreover, polyester’s production relies heavily on fossil fuels. It is a non-renewable resource and is not biodegradable.
Yet polyester lends itself to fiber-to-fiber recycling better than cotton does. It can also be made from waste products such as plastic bottles. Fur-ther positive developments include innovations that minimize the impact
Sustainable Material Mix:Target 2030: 100% sustainable fibers with low footprint, such as replacing conventional cotton
PROOF OF CONCEPTC&A: Sustainable Products Possible at Competitive Prices—Evi-dence with New C2C-Certified™ T-shirt
The fashion retailer C&A partnered with two Indian suppliers to develop and produce two Cradle to Cradle (C2C) Certified™ T-shirts. The Cradle to Cradle Certified Products Program includes standards on raw material and chemicals usage, design-ing products with materials that allow reutilization, releasing only clean water, using only renewable energy sources, and providing safe and dignified working conditions. After nine months of development the partners developed garments that were C2C Certified at the "Gold" level, the first fashion garment produced in Asia at scale complying with the extensive environmental and social standards in the C2C Certi-fied Products Program.
But the most interesting achievement can be seen in the price point set by the company: The basic T-Shirt will retail in Europe for €7, with the retailer indicating a positive contribution margin. Released in Europe in June, as well as Brazil and Mexico in the fall, C&A plans to expand this effort into more categories and higher volumesC&A further shares its experiences and learnings from the pilot project to allow other fashion brands to follow suit (see the Good Fashion Guide on www.fashionforgood.com).
If the industry manages to fully close the loop between the end-of-use phase and the raw materials phase, recycling apparel and footwear waste into new input materials, the environmental footprint of the entire industry will be drastically reduced. This type of circular model is the ulti-mate aim of all actions targeting recycling.
Immediate ActionsOffer end-of-use in-store garment collection scheme. Driving down
current and future waste levels is essential. Hence, progress starts with increasing collection rates at the end of a garment’s life. Through their interface with consumers, brands and retailers can lead in boosting col-lection rates.
We anticipated that today’s 20% collection rate could be tripled by 2030—worldwide. With a 60% collection rate, and the same allocation to end-of-use processing as today, the industry could save more than €4 bil-lion in value to the world economy. This value only represents products not ending up in landfills—not to mention the additional value to be realized by ‘closing the loop’ and feeding products back to the value chain as raw material. The industry would still be creating vast volumes of waste—more than 90 million tons a year—but the absolute amount would no longer grow with rising production. Clearly, this target calls for a dramatic change in consumers’ mindsets, not to mention much more attractive collection options.
Fashion brands can step up collection programs for end-of-use—es-pecially in their own-brand stores. They can set up reverse supply chains—or work with third-party logistics and processing providers—to sort the apparel, process it, and send as much recycled raw material as possible back to their suppliers’ factories.
Disruptive Actions:Establish industry-wide end-of-use garment collection. These go
beyond brand-specific pickup, and could take the form of every brand de-ploying boxes in every store for every garment type. It can also mean mov-ing to a more overarching setup of public collection points in areas with currently limited garment collection opportunities.
Design for recyclability. While maximizing collection is essential, we need to work toward true recycling—feeding previously used materials back into textile production, rather than downcycled into low-value uses. The industry can craft clear guidelines for designers to collaborate with others along the value chain.
Breakthrough in recycling technology. Technology offers the best way to eliminate barriers to large-scale recycling. Smart garments would allow sorting machines to detect fiber types and determine the practicality of and next steps for further processing. The industry has to advance to new process technologies that will make it possible to chemically recycle every possible fiber combination at scale and to mechanically recycle with no significant loss in fiber quality.
ENVIRONMENTALClosed loop Recycling:Target 2030: No value leakage, such as one garment recycled for every new garment produced
7675 PULSE OF THE FASHION INDUSTRYCHAPTER 3

of plastic microfibers, for example through protective bags for clothing during washing (such as Patagonia partner Guppy Friend) and filters for washing machines (such as filters from Wexco).
Other alternatives to traditional cotton include organic, recycled, re-generated, fair trade, or BCI cotton. These are viable options, especially in the short term, where fashion brands and consumers may not be ready for a complete elimination of cotton. (See Reduce Toxic Fertilizer and Chemi-cals in Raw-Materials Stage under Chemical and Water Optimization.)
Increase use of sustainable materials. Several environmentally pref-erable alternatives exist or are under development besides polyester. Sub-stituting cotton with bast reduces the environmental impact by more than half, with the largest gains in water conservation. (See Exhibit 28.) Viscose and lyocell also have lower water and energy footprints. The challenge here is to convince consumers that alternative fibers are as comfortable and good looking as cotton. There already is research in that direction, as with the CRAiLAR FTI process for bast, giving it a softer cotton like hand feel and appearance.101
Cotton
Cow leather
Silk
Viscose/Rayon
Modal
Synthetic leather
Lyocell
Bast fiber
Elastane/Spandex
Wool
Nylon
Acrylic
Polyester
Polypropylene
Silk
Wool
Cow leather
Nylon
Bast fiber
Modal
Synthetic leather
Viscose/Rayon
Cotton
Lyocell
Elastane/Spandex
Acrylic
Polyester
Polypropylene
Cow leather
Bast fiber
Silk
Cotton
Wool
Acrylic
Nylon
Synthetic leather
Modal
Viscose/Rayon
Lyocell
Elastane/Spandex
Polyester
Polypropylene
Silk
Bast fiber
Synthetic leather
Nylon
Cow leather
Modal
Acrylic
Elastane/Spandex
Polyester
Viscose/Rayon
Cotton
Polypropylene
Wool
Lyocell
Exhibit 28 Polyester Outperforms Cotton, Viscose, and Wool On Three of Four DimensionsEnvironmental Impact of Selected Textiles
Cradle to gate environmental impact index per kg of material
Water Scarcity Global Warming Eutrophication Abiotic Resource Depletion
Exhibit 29 Examples of Material Alternatives
Virgin Polyester
PET, conventional cotton, PP
Conventional Cotton
Conventional Cotton
Reduced non-renewable energy use compared to conven-tional alternatives (-75% compared to PET), reduced global warming potential, reduced chemical use compared to conventional cotton
Organic: No use of synthetic chemicals (pesticides, mineral fertilizer) in crop cultivation, soil protection measures are en-couraged; CmiA: standards define minimum requirements for ecological, social, and economic aspects of cotton production and processing
Avoids the impact of both, cotton cultivation and dyeing steps, based on selection of raw materials obtained from textile wastes
Reduced use of fossil resources, non-renewable primary ener-gy demand (and related impacts) reduced up to 50%
Recycled Polyester (mechanically, chemically), e.g., rPET (recycled PET)
Man-made cellulose fibre (Lyocell: Modal, Viscose, Tencel)
Organic Cotton, CmiA cotton
Recycled Cotton
Standard material Alternative material Impact
Environmental damages of water use for human health, ecosystem quality, and resources. Preva-lent in the raw materials and processing phases
Emissions of greenhouse gasses. Prevalent in processing and manufacturing phases
Excessive richness of nutrients in a lake or other body of water, frequently due to runoff from the land, causing dense growth of plant life and death of animal life from lack of oxygen. Prevalent in the raw materials phase
Depletion of natural resources faster than they can be replenished. Prevalent in raw materials and manufacturing (sundries and packaging)
Water Scarcity
Global Warming
Eutrophication
Abiotic Resource Depletion, Fossil Fuels
Source: Higg Materials Sustainability Index, msi.higg.org, data retrieved on 27 September 2017; Levi's (2015); H&M (2017); BCG Analysis
Source: Thinkstep
No
te: T
hese
res
ults
wer
e ca
lcul
ated
usi
ng t
he H
igg
MS
I To
ols
pro
vid
ed b
y th
e S
usta
inab
le A
pp
arel
Co
alit
ion.
The
Hig
g M
SI T
oo
ls a
sses
s im
pac
ts o
f m
ater
ials
fro
m c
rad
le-t
o-g
ate
for
a fi
nish
ed m
ater
ial (
i.e. t
o t
he p
oin
t at
whi
ch m
ater
ials
are
rea
dy
to b
e as
sem
ble
d in
to a
pro
duc
t). T
he H
igg
MS
I sco
res
pro
vid
ed h
erei
n ar
e fo
r a
sing
le p
rod
ucti
on
stag
e w
ithi
n th
e H
igg
M
SI s
cop
e (e
.g. fi
ber
or
raw
mat
eria
l) a
nd d
o n
ot
pro
vid
e a
holis
tic
view
of
the
imp
acts
invo
lved
wit
h m
ater
ial p
rod
ucti
on.
"
77 CHAPTER 3
©Peter Caton/Greenpeace

Synthetic leather has only a third of the environmental impact of cow leather. (See Exhibit 28.) As Kering says in its 2015 EP&L statement, differ-ent leathers can have an over tenfold difference in environmental impact based on their type and origin, how the animal was raised, and how the tanning process took place. Switching to alternative materials can directly improve a product’s footprint. (See Exhibit 29.)
Disruptive Actions:Establish common standard for animal treatment. In its 2030 Agen-
da for Sustainable Development the United Nations sets as one of its goals to achieve a state “in which wildlife and other living species are protect-ed”102. While animal welfare in general is a topic that most can approve of, agreeing on what it implies for industrial production processes is much more difficult.103 Fashion brands’ policies around the subject are less de-veloped today than those concerning the environment.104 The focus areas are angora (rabbit), down, fur, leather, and wool. Collaboratively developed standards would go far to guarantee the ethical treatment of animals, en-abling them to live healthy lives without suffering from pain, fear or dis-tress.105 These would include rejecting methods such as force-feeding or live plucking of waterfowls, as well as promoting transparency in farming and processing practices. A common standard establishes a global bench-mark and helps fashion brands communicate expectations along their sup-ply chain, as well as the sharing of best practices.106 Promising initiatives include the recently launched Responsible Wool Standard (RWS), the Re-sponsible Down Standard (RDS) or the Sustainable Fibre Alliance (SFA) on cashmere production. Widened partnerships of such initiatives and indus-try-wide adoption would be the next step.
Micro-plastics Contaminating Oceans
Micro-plastics are small pieces of plastic invisible to the human eye. Primary micro-plastics are directly released into the envi-ronment as small particles, whereas secondary micro-plastics largely stem from the degradation of larger plastic waste after entering the ocean.The main sources of primary micro-plastics are tires, synthetic textiles, marine coatings, road markings, personal-care prod-ucts, plastic pellets, and city dust. Thus, the sources range from household to commercial activities conducted on land and at sea.
The full consequences of increasing amounts of micro-plastics in the world oceans are not conclusively known. However, the suspected consequences include human health concerns due to accumulation of micro-plastics in the food chain as well as the absorption of toxicants in plastic traveling through the environ-ment1.
1. Boucher, J., & Friot, D. (2017). Primary Micro-plastics in the Oceans: A
Global Evaluation of Sources. Gland, Switzerland: IUCN
PROOF OF CONCEPTLi & Fung: Investments in lowered impact breaking even after one year
A recent pilot conducted by Li & Fung at their LF Beauty factory in the UK, show promising results from the use of sensors to drive energy efficiency in production. More specifically, the wire-less sensors capture energy and production data at a granular level to counteract the major operational cost of electricity. The facility had already captured ‘low hanging fruits’ by installing LED lighting and lights switch-off policies in order to increase the energy efficiency.
The project required investment in 30 sensors along a single production line and at key points in the facility. The investment broke even already within the first year due to the realized ener-gy savings. The company is currently exploring how to implement this type of technology in its garment factories.
Source: Company information
8079 PULSE OF THE FASHION INDUSTRYCHAPTER 3©CFW
Develop innovative man-made fibers. Some innovative man-made fibers are emerging with reduced water and energy intake and without the negative externalities of other fibers. Adidas, for instance, presented in 2016 a shoe featuring a fully biodegradable, protein-based yarn named Biosteel® that relies on nature-based finishing.107
Develop polyester enhancements. Another priority is to develop next-generation polyester. The industry must overcome the problem of polyester micro-particles and produce polyester fibers without heavy met-als (e.g. antimony free). There is also work to do to persuade consumers that polyester can be as appealing as cotton. Branded materials such as Tencel® show how materials that originally did not directly speak to con-sumers—in this case Lyocell—can successfully be marketed toward them. Designers must also embrace and promote these fibers in their creations.
Chemical and water optimization has traditionally been difficult to address for fashion brands due to low transparency in the earliest stages of the supply chain. But with increased media and corporate attention, brands can engage with suppliers to set targets.
Immediate Actions:Reduce toxic fertilizer and chemicals in raw-materials stage. Today’s
excessive use of chemicals leads to heavy pollution of waterways. These concerns can be mitigated by more sustainable cultivation methods.112 The Better Cotton Initiative (BCI) projects a 16% pesticide reduction in China and a 20% decrease in India, through its improved cultivation principles.113 Cotton made in Africa (CmiA), for instance, says that cotton grown with their methods uses only rainwater and has a 40% lower CO2 footprint.114 Or-ganic cotton yields can be 25% less than conventional yields,115 and require more manual labor,116 but research indicates that the benefits outweigh the costs of producing better cotton.117 So moving from conventional cotton to organic/BCI or CmiA is a first interim step; in the long run, lower-impact materials than cotton should prevail.
Reduce water pollution. Shifting away from conventional cotton will reduce excess nutrients in waterways. Processing mills can better detect leaks and reuse water-in-process,118 but a full solution requires wastewater treatment plants on site, with sufficient testing.119 The Zero Discharge of Hazardous Chemicals Programme (ZDHC)—a collaboration of 22 signatory brands and 24 value-chain affiliates – is working on guidelines. Signatory brands include H&M, Kering, Primark, Adidas, and Inditex.
Reduced Energy Footprint: Target 2030: Minimized energy consumption and 100% carbon neutrality
Disruptive Actions:Establish 100% renewable-energy use. The benefits of installing solar
panels or wind turbines at or near large production facilities transcend straightforward operating-cost benefits. Self-sustaining energy supplies from renewables can mitigate risks in countries such as Pakistan, where power cuts are common and diesel generators are expensive and costly to maintain. Large installations can further reduce operating costs if they supply numerous nearby facilities at the same time. Of course, that calls for unprecedented levels of collaboration among multiple suppliers.
Energy is the largest individual impact area in terms of the value op-portunity to the world economy. Further, many solutions for improved ef-ficiency are already available.
Immediate Actions:Increasing efficiency in the value chain’s most energy-intense step
of processing. The energy-intensive processing stage, with its high glob-al-warming footprint, is an obvious target. The energy-efficiency potential is greatest in the least-developed countries, where most fashion products are made. But the more developed producing countries can also improve. Measures include combined heat and power sources, high-efficiency mo-tors and boilers, variable-frequency drives, and improved sensors. With assumed increases in efficiency of 10% to 30%, an annual amount of 90 million tons of CO2 equivalent can be saved globally, representing nearly €6 billion to the world economy. Suppliers can realize significant savings in upgrading their facilities. (See Investment in Lowered Impact Breaking Even After One Year).
Using renewable energy in the production stage. We estimate that this lever can release €12.5 billion in annual savings, assuming the industry can quickly reach a global target of 40% renewable energy. At that rate, approximately 200 million tons of CO2 could be saved—equivalent to 7% of global annual emissions in 2030 for the fashion industry. Spinning, weav-ing, and pre-treatment, as well as dyeing and finishing processes, are ener-gy intensive.108 While the International Renewable Energy Agency projects that by 2030 the use of renewable energy in the US will increase to 27%,109 in Africa to 22%,110 and in the EU to 27%,111 this will fall short of offsetting the additional anticipated emissions. Far-reaching actions by textile sup-pliers and continuous pressure from brands and consumers can push these numbers higher.
Chemical and Water Optimization: Target 2030: No hazardous chemicals and no water pollution
PROOF OF CONCEPTKering: Making metal-free tanning economical
It is 20 to 25 percent more expensive to tan skins without the use of metals. The higher expense stems from salting of the skins at the beginning of the process, which ruins some of the skins and thereby creates waste. As a way to drive down costs, Kering resells those skins to other industries using skins of that quality. This has reduced the cost of the process to 10 to 12 percent more expensive than tanning us-
ing metals. The company is confident to further drive down costs with scale of production—ideally driven in a joint industry effort. Source: Company information
Source: Interview with Kering CEO François-Henri Pinault in 2016, as pub-
lished in Bloomberg Businessweek
8281 PULSE OF THE FASHION INDUSTRYCHAPTER 3

Improve chemicals management in processing. The use of chemi-cals is one of the areas with the lowest transparency throughout the value chain, particularly in processing. The lack of transparency hinders compli-ance and leads to the exposure of workers to hazardous chemicals. We es-timate the fashion industry can save the world economy nearly €3 billion if fewer workers become ill due to imprudent chemical use. Given the cur-rent low achievement scores on chemicals management across the indus-try on the Higg Index, change can start with actions by individual brands to enforce their Restricted Substances List. Further measures might entail upfront investment but could quickly become financially viable. (See Mak-ing metal-free tanning economical).
Disruptive Actions:Refine chemical- and water-reduced processing. Major improve-
ments in production steps are required to fully move beyond using haz-ardous chemicals and also to reduce wastewater pollution, especially in dyeing.
For a start, there have been several promising developments for re-ducing the water and energy required during dyeing, such as H2COLOR, a novel dye produced by Ecofoot.120 The company promises to reduce ener-gy use by 80% and water intake by 70% because the negatively charged particles used in its dyes wash off easily. Use of Ecofoot’s dye takes 45% less processing time than conventional dyeing does. Another possibility is for the fibers themselves to be more receptive to dyes. DyeCoo is pio-neering in the field of fully waterless processing, with CO2 replacing water and process chemicals.121 So far it is suitable only for polyester and the machines are costly. But further measures available to suppliers can suc-cessfully reduce resource consumption while having positive influence on costs. (See Supplier Realizing Optimized Impact from the Outset)
Make hazardous chemical treatment redundant. The ultimate ob-jective should be to eliminate chemicals and other hazardous input fac-tors. OrganoClick is working on making outdoor wear waterproof without perfluorinated chemicals. Their product OC-aquasil Tex is still a chemical additive but achieves its water-repellent effect without using PFC and is
biodegradable under certain conditions. It also needs less energy in its application, because it requires lower temperatures than conventional products122. A glimpse of full revolution comes from NEFFA, whose Myco-Tex research project uses pure mushroom roots that grow by replicating over and over again in a molded form.123 It allows for flexible clothing with-out spinning, weaving, or chemical treatment, and is fully biodegradable. Startup Pili Bio relies on micro-organisms for its dyes and could soon go commercial.124
PROOF OF CONCEPTHirdaramani Group: Supplier Realizing Optimized Impact from the Outset
Suppliers play a key role in driving initiatives for improving environmental and social impact and, more broadly, conscious business practices in the early stages of the value chain. Hirdaramani, supplier to brands such as Marks & Spencer, Calvin Klein, and Tommy Hilfiger with 38 production facilities across Sri Lanka, Vietnam, Bangladesh, and Ethiopia, opened a factory focusing on sustainable manufacturing which compared with conventional apparel manufacturing facilities shows:• 50% reduction in energy consumption, through an ad-
vanced evaporative cooling system, a prismatic skylight system, solar-powered street lamps, energy-saving fixtures, and solar-panel systems providing up to 8% of the factory’s power needs and exporting excess power to the national power grid.
• 60% reduction in water consumption due to, for instance, wastewater recycling, rainwater harvesting, and water-sav-ing fixtures.
• Zero waste ending up in landfills, among other means by reusing thread cones and recycling waste cuts.
As the company reported, the reduction of the environmental footprint is considered an overarching business opportunity comprising cost savings, improved processes, an engaged work-force, and an increasing number of orders from brands searching for environmentally and socially responsible suppliers.
Source: Company information
Production-to-Demand: Target 2030: No overproduction
Overstock is one of the most pressing problems of the industry, lead-ing to high markdowns and lost value. Planning production to match de-mand is necessary and beneficial to businesses and the economy alike to avoid wasting natural resources.
Immediate Actions:Intensify engagement with supplier base and provide order security
for suppliers. By embracing and including suppliers in the calculation of the supply–demand equation, brands can improve demand planning and production scheduling. It allows for better workforce planning at the sup-pliers, limiting excessive overtime and outsourcing to third-party suppliers unknown to the brand. Constant dialogue and closer relationships with a preferred supplier base also boosts flexibility and transparency.
Minimize overproduction and markdowns. Next, the model of “sell what you create” should move toward “create what can be sold”. This model yields higher full price sell-through rates and less overstock. Driven by the traditional fashion calendar, the industry typically places high-vol-ume orders well in advance, but supply too often exceeds actual demand. The consequence: large quantities of clothing are heavily discounted. Many shoppers now expect and anticipate those markdowns, which in turn effectively invites them to over-consume. Fortunately, many sophisticated tools are now available to fine-tune demand forecasts. Other consumer goods categories use predictive analytics based on big data and customer relationship management technologies to optimize assortment creation. Some small brands are built on the concept of ensuring that the firm’s supply exactly matches demand in the form of pre-orders from custom-ers—TWO THIRDS for instance, which bundles orders by consumers and only then places its production order in the respective size.125
Amazon is showing how to drive this principle further with a recently filed patent for an ‘on-demand’ factory. An algorithm collects orders and coordinates them in the most efficient way possible, based on needed ma-terials or manufacturing processes.126 Such a factory would produce only according to individual orders exactly matching demand and minimize in-ventory—very different from fashion’s current approach.
8483 PULSE OF THE FASHION INDUSTRYCHAPTER 3

Disruptive Actions:Offer to a “Segment of One.” The ultimate goal is prediction algo-
rithms for true segment-of-one markets by product type, style, size, and so on, to “create what people want.” By using artificial intelligence beyond current forecasting methods, fashion brands can “know what a consumer wants before he or she knows it.” Optimized offers, driven by algorithms matching individual style and fitting needs, will better satisfy consumers and lead to longer use of products, reducing consumption and waste. Some companies have already taken steps in this direction, moving toward ‘codifying’ design. Stitch Fix sends clients five curated pieces of cloth-ing monthly, based on data gleaned from Pinterest, customer surveys, and personal notes to stylists. As the client answers questions or communi-cates with a stylist, the algorithm improves its predictive power further.127
Move toward automation at scale. Catering to individual consumers’ needs case by case requires efficient and speedy production processes. Manufacturing of apparel, footwear, and home textiles lags behind other types of manufacturing, making the industry a clear target for large-scale automation with an average labor productivity catch-up potential of 157% across Cambodia, Indonesia, the Philippines, Thailand and Vietnam com-pared to the average of their respective manufacturing sectors.128
Increased automation is a natural next step, albeit a disruptive and capital-intensive one for most manufacturers. (See Automation: The Op-portunity). As has happened in many other industries, robots can take on tasks that are repetitive, or physically demanding, or hazardous. They also offer workers the opportunity to re-skill. Workers can move into machine monitoring jobs, or into calibrating and maintaining automation equip-ment, and effectively participate in the enhanced productivity through wage increases in the short- to mid-term.
There is a social catch: automation could lead to value migrating to-ward more technologically advanced countries. (See Automation: A So-cial Threat?) It may become economically viable for companies to move manufacturing from developing countries and thus closer to the consum-er with shorter distances travelled and therefore reduced CO2 emissions. Manufacturers will no longer have to go to where labor is cheapest; they will become smaller, local, and highly configurable.
Automation: The Opportunity
There are plenty of natural incentives for fashion brands to extend automation. Robot costs are falling and technology continues to advance rapidly with such recent developments as specialized machines called sewbots. Selected innovations are being implemented, such as bonding/gluing techniques as alternatives to sewing, and computer-controlled tools for pattern making and cutting to get more from each area of fabric and to reduce leftover material. Sportswear brands are the front-runners with automation thus far: Adidas opened its SpeedFactory automated plant in 20161; North Face has its FuseForm production technique2; Nike an-nounced a partnership with high-tech manufacturing firm Flex3. But a bigger, more concerted, more disruptive push is needed. Manufacturing as a whole is undergoing a transformation; Indus-try 4.0 is the term used to describe the myriad changes coming, extending far beyond, say, robotics, to the Internet of Things, cognitive computing, and more. By 2020, 25% of manufacturing
will be conducted by robots, eliminating one-sixth of labor cost, according to the World Economic Forum. The fashion sector can and must benefit too. The International Labor Organization estimates that sewbots could dramatically cut costs in China and Thailand; the ILO’s calculation is that by 2020, human labor may be up to 50% more expensive than sewbots in China.
1. The Economist. (2017). Adidas’s high-tech factory brings production back to Germany. Retrieved April 4, 2017, from http://www.economist.com/news/business/21714394-making-trainers-robots-and-3d-printers-adidass-high-tech-factory-brings-production-back2. Evo. (2015). The North Face Launches Fuseform. Retrieved April 4, 2017, from http://culture.evo.com/2015/02/north-face-fuseform/3. Nike. (2015). Nike’s Manufacturing Revolution Accelerated by New Part-nership with Flex. Retrieved April 4, 2017, from http://news.nike.com/news/nike-s-manufacturing-revolution-accelerated-by-new-partnership-with-flex
86PULSE OF THE FASHION INDUSTRY
©CFW

Utilize 3D printing at scale. 3D printing also offers leap-forward gains to farsighted fashion brands. It enables rapid prototyping, on-demand, segment-of-one products, and local production with no inventory, and no waste, among other benefits. Today 3D printing is more suited to limited scale than high volumes, and is still relatively expensive. It is better suited to hard products—jewelry and shoes—than to textiles. In terms of sustain-ability, what first comes to mind is preventing long product journeys from production to consumer and therefore avoiding greenhouse gas emissions. But the high temperatures now needed in the process strain the ecological footprint of production, and the environmental impact of materials has to be carefully assessed.
Many in the industry got their first glimpse of 3D printing’s potential in 3D-printed shoes now available from New Balance and Under Armor, but at very high prices. Adidas is making an additional attempt at making 3D printing available at scale through the testing of a fully automated 3D printing and robotics shoe factory (the Speedfactory) in Germany and is planning to open a second one in the US this year. This will enable quicker reactions to consumer needs and faster delivery due to the closer proxim-ity to customers.129 Concerning 3D printing fabrics, TamiCare is one of the front-runners with its product CosyFlex™, which features a fully automated process without cuts and therefore no wasted fabric.130 Several startups are also working on 3D-printer-style knitting machines for fashion, for in-stance, Unmade131 and Kniterate.132
Immediate Actions:Ensure full payment and avoid forced overtime. Mismatched pro-
duction planning often leads to excessive and forced overtime, together with delayed wage payments to workers. This is especially prevalent when brands change, cancel, rush, or place late orders. Lead times can be set unreasonably short, requiring excessive overtime. When brands pay their suppliers late or delay payments, workers may see their wages delayed too.133 A closer relationship with suppliers can help in remediating such issues through assessing impacts of purchasing practices and establishing control measures preventing harm. The assessments can include track-ing relevant indicators such as the percentage of orders placed late or changed after placement.134 Possible control measures are using pricing models accounting for the cost of wages and benefits, clearly communi-cating deadlines to the purchasing team, and sharing the purchasing plan with suppliers.135 (See Intensify Engagement with Supplier Base in the cat-egory Production-to-Demand.)
Establish minimum wage pay To improve the prevailing labor prac-tices in garment production, GFA and BCG contend that wages must in-crease substantially. While decent working conditions have a wider scope than merely improving wages—such as limits on regular working hours and overtime—increasing wages is viewed as the strongest lever with which to ensure decent work. We see it as symbiosis, with reasonable working hours moving in tandem with a living wage.
As a first step, suppliers’ compliance with international standards and national legislation has to be assessed. Support for effective wage fixing and enforcement mechanisms has to be clearly demonstrated. In a joint effort with suppliers, brands need to establish wage-management systems, together with complete and accurate payroll records, that reduce the risk of fraud in payments. Staff responsible for paying wages have to be trained.
A next step in moving toward living wages for workers and their fam-ilies is to aim for ‘extreme compliance’ to minimum wages (paying 120% of the legal minimum) as reported by ILO–a figure that could benefit the world economy by nearly €5 billion per year,136 representing the value of increased economic consumption and private investments by workers.
As things are today, the sector’s minimum wages in most Asian coun-tries are less than half of what can be considered a living wage137—the consequence of governments fearing that their countries will not be able to compete with other low-wage economies. Often manufacturers do not even comply with the minimum wage. Fair wages would enable workers to support themselves as well as two adult dependents, one adult and two children, or four children, covering food, clothing, housing, travel costs, children’s education, health costs, and 10% toward discretionary income (such as savings or a pension).138
India has the largest fashion-sector workforce. Estimates show that 35% of all workers receive less than 80% of the minimum wage of about €100 per month. It would cost the fashion industry an additional €1.8 bil-lion a year—equivalent to only 1% of the industry’s profit pool today—to bring all of India’s textile workers up to the 120% of minimum wages—mon-ey that would have trickle-down benefits for consumption patterns across the country.139 Crucially, wage increases on this scale would also help offset discrimination toward women --the majority of the garment and footwear
SOCIAL
Automation: A Social Threat?
Automation Has Been Used in Manufacturing for DecadesAutomating repetitive and dangerous tasks, such as dyeing processes, can be seen as advantageous in terms of working conditions, as well as the health and safety of workers. Also, the automation of basic tasks will not mean that people won't find other work. For decades, developed nations, and more recently developing nations, have advanced automation while keeping unemployment rates stable or even falling.Training and transition programs are key, for instance, to making people go into related jobs (such as maintaining robots onsite) or evolving industries that still require manual work (such as service jobs).
Automation = Higher Productivity = Higher ValueThrough automation and the resulting increased productivity, a lot of value is created. The challenge is to ensure that a large part of this value remains in the country in which the production
takes place—then, the local population will also benefit. Little will have been gained in sustainability terms if the value goes only to large multinational brands and robot manufacturers.
Real Revolution: Artificial Intelligence (AI)A true global challenge will be the automation not of basic tasks, but of tasks requiring cognition. With developments in AI, even many office jobs in developed nations might become automated.
The effects of this massive change in the workforce could be much more impactful than the automation in manufacturing that has already been under way for a long time.
For further details, please consider reading the BCG perspective "Compet-ing in the Age of Artificial Intelligence" (https://www.bcgperspectives.com/content/articles/strategy-technology-digital-competing-age-artificial-intel-ligence/)
Rebalanced Industry Economics:Target 2030: Fair and equal pay to workers and skill development for all workers
Rebalancing industry economics would improve the lives of a large number of industry workers by ultimately ensuring that they receive a fair and equal wage. There is a long journey ahead before reaching that target, but brands are well-positioned to start the journey today.
8887 PULSE OF THE FASHION INDUSTRYCHAPTER 3

IT WOULD COST ONLY ABOUT
€1.35 TO DOUBLE THE WAGES OF THOSE
PRODUCING T-SHIRTS THAT RETAIL FOR €25
EACH
89 CHAPTER 3 ©Jeff Lau/Greenpeace

manufacturing workforce,140 who are often especially vulnerable to low wage levels due to the persistent gender pay gap.141
Paying workers 120% of the stipulated minimum wage is merely the first step toward paying all workers fair wages. In order to truly provide better living standards, cross—industry collaboration is needed.
Ensure worker representation. An important step toward paying fair and equal wages to all workers in the fashion industry is to provide them with an opportunity to be heard. While individual brands will not be able to drive the necessary change at a global level alone, brands can contribute to empowering workers through ensuring that all suppliers have demo-cratically elected worker representation.
Worker representation is critical as it provides workers with a plat-form for negotiation and furthers workplace dialogue and peaceful con-flict resolution between workers and management—especially in countries where unionization is restricted by law.142
Disruptive Actions:Move to living wages. Brands in particular can step up to determine
acceptable living wages in the nations where they have suppliers and then to enforce improved compensation. Admittedly, this is not a simple exer-cise; due to big differences from country to country in consumer price lev-els and many other factors, it can be hard to determine what a living wage truly is. To start off, fashion brands could leverage work already done on this topic by organizations such as the International Labor Organization, the Fair Wear Foundation, and the Clean Clothes Campaign.
Another difficult but crucial step: using agreed-upon data on what constitutes living wages to collaborate with suppliers in increasing com-pensation. The issue that comes immediately to mind, of course, is that costs of goods sold will skyrocket. But that’s where deeper levels of collab-oration will be essential in order to improve productivity levels. That can
Ensuring that the health and safety of all workers are protected is an area where strong collaboration between fashion brands and suppliers can make a large difference. There are already immediate actions that can be taken today.
Immediate Actions:Implement supplier health-and-safety scoring. Fashion brands can
add health-and-safety scoring to their sourcing-decision criteria. A bal-anced-scorecard approach—well established as a management tool—can be helpful here. It gives factors such as exposure to chemicals, availability of fire doors, and remediation for injuries in line with the ILO Employment Injury Benefits Convention, appropriate weighting alongside quality, cost,
PROOF OF CONCEPTHow “Better Work” Increases Performance and Improves Workers’ Lives
As a partnership involving the UN’s International Labour Orga-nization, Better Work aims at uniting diverse groups—govern-ments, factory owners, unions, workers, and global brands.
Improved firm performance: Factories collaborating with Better Work were up to 22% more productive, and the average factory in Vietnam experienced a 25% increase in profitability. This is attributable to reduction in worker turnover and injury rates, improvements in balancing production lines, and increases in orders.
Benefits to workers, their families and communities: Across country programs the initiative was able to decrease the gender pay gap by up to 17% and reduce sexual harassment concerns by up to 18%. In Jordan, a 33% increase in the proportion of workers using remittances to educate children could be shown, reflecting a wider shift in how remittances are used: from debt repayment to investments in education, health, and nutrition.
Source: Information provided by Better Work
Exhibit 30 Effect of Markup Model on Final Retail Price Current Industry Markup Structures Leading to Disproportionate Price Increases
Labor cost increased by 99% to allow for living wage (example: India)
Final retail price in store
Final retail price in store
€25
€31.75
€4.17
€5.29
€15.62
€19.85
€0.25
€0.32
€3.22
€3.22
€0.39
€0.39
€1.35
€2.69
VAT
VAT
Brand markup
Brand markup
Supplier profit
Supplier profit
Material cost
Material cost
Factory running cost
Factory running cost
Labor cost
Labor cost
+€6.75
+€1.34
Source: BCG analysis
Health and Safety Excellence:Target 2030: 100% safe working places fostering well-being and morale
happen through worker training, better worker attitudes when working conditions are improved, knocking down barriers to the flow of produc-tion information, and increasing support for investments in more efficient machinery—for example, loans at preferential interest rates. While some of these initiatives can be carried out by individual brands, the entire industry needs to commit in order to move the needle. This is especially true for smaller brands that only account for a fraction of their suppliers’ produc-tion capacity.
Change industry standards for mark-up structures. Rebalancing of industry economics also means changing mark-up structures. Such chang-es could be barely visible to the consumer; it should cost only about €1.35 to double the wages of those producing T-shirts that retail for €25 each. However, under current mark-up structures, where all input price increases are treated equally, doubling the wages of workers would be multiplied and the T-shirt might actually cost €6.75 more on the retail rack. (See Ex-hibit 30.) So what is needed is a business system that allows an additional consumer premium for higher wages to be passed on to workers in its en-tirety. That model calls for truly innovative thinking and breaking business practices in place for decades.
9291 PULSE OF THE FASHION INDUSTRYCHAPTER 3
and delivery. Health and safety would become an explicit decision criterion ‘on eye-height’ with the others.
Disruptive Actions:Realize industry best-practice safety levels. Front-runners in sustain-
ability, have significantly cut the average number of recorded injuries in the industry at their factories.143 One way to support such steps is to cut the number of suppliers, which enables closer relationships144 and require source traceability and other guarantees to clearly prohibit subcontract-ing. Suppliers must develop capabilities through worker and supervisor training, in collaboration with factory managers. Such measures would not only improve working conditions and therefore brands, reputations and risk management, but can actually improve direct performance. (See How “Better Work” Increases Competitiveness and Workers’ Lives.)
Use technology to drive assessment of Occupational Health and Safety (OHS). According to technology providers, mobile applications al-ready exists to help fashion brands identify, reduce, and prevent workplace hazards faster and on a greater scale. These new mobile applications com-bine social technology, gamification, and data-driven insights to improve users’ understanding and engagement with workplace safety. Instead of pen-and-paper methods of training and recordkeeping, an incident report or workplace safety observation can now be done using a smartphone’s GPS, camera, voice-recording, and texting capabilities to capture real-time data. Adidas’ initiative sends text messages to over 260,000 workers in 58 factories, representing around a quarter of its supply chain.145 For train-ing purposes, a quick video of employees doing things correctly can be easily shared with other workers. Data collected can be fed into modeling programs, provide almost instant feedback to employees, fill out reports with a minimum of effort, and track leading indicators. The best of these new technologies go beyond just automating manual tasks to delivering value by driving new behaviors on the factory floor. Online social networks and focused member communities enable workers to share knowledge and learn from each other. Mobile phones today are relatively inexpensive and easy to use and even provide workers with anonymized data about working conditions to enhance visibility across global supply chains. Often an NGO is required to gather and process the data to ensure end-users’ anonymity and security.
Immediate Actions:Ensure gender equality. Findings from a recent Better Work study
demonstrate that workplace policies favorable to female workers give the business greater resilience, profitability, recruitment and retention.146 While there are promising developments, many challenges remain here for the industry with wage discrimination (see Chapter 1), sexual harassment, and lower quality of life for female garment workers. Sexual harassment often arises from power differences, misaligned pay incentives, and the high-pressure nature of garment work—and it undermines productivity as well as hurts workers.147 Female workers reported having less free time as they often bear the burden of the work at home in addition to their fac-tory job. To increase gender equality fashion brands should, for instance, ensure that business partners have recruitment policies that guard against discrimination, harassment, and abuse. Also important are employment policies that prohibit discrimination, including against pregnant women, and encompass remediation plans.148 Brands can also prompt partners to offer flexible work options, and to report on the share of women among all employees and in management positions. Guaranteeing equal opportuni-ties and improving employment conditions in general can further increase productivity. (See Investing in Workers’ Well-being Can Pay Off.)
Prevent child labor further upstream. According to the UN, the num-ber of children engaged in child labor declined globally by one third from 2000 to 2012 (from 246 million to 168 million). Yet more than half of those remaining child laborers in 2012 (85 million) were engaged in hazardous work.149 A supply chain 100% free of child labor should be the goal of every fashion brand, but the risk of short-term and unsound solutions is high due to the complex, multilayered and fragmented supply chains of the industry.
Fashion brands should work with governments to combat child labor while also understanding and supporting comprehensive, bigger picture
PROOF OF CONCEPTLi & Fung: Investing in Workers’ Well-being Can Pay Off
Partnering with non-profit Business for Social Responsibility (BSR), the company rolled out the joint “HER” project to over 85 of its factories in 2014, a workplace program promoting health, financial inclusion, and gender equality.
Responding to local conditions and suppliers’ needs, for instance in Cambodia, a curriculum was created focusing on nutrition and diet, given the high rate of anemia amongst female workers, who might then succumb to fainting. Li & Fung further hosted workshops to share best practices among participating factories and form support networks.
Acting on the belief that such initiatives would not only yield benefits to workers, but also factories and ultimately buyers, the company measured the impact on business. Bangladesh
factories, for instance, showed a decrease in sick leave days
by females of over 2% per month. In Cambodia, a 10% drop
in resignations amongst female employees and productivity
increases between 3% and 18% could be seen over the course of
the program.
LI & Fung points out that the given improvements are data cor-
relations and no guarantee for the direct impact of the program.
But the company affirms that the initiative are accompanied by
economic gains for factories. Based on the gathered experienc-
es, the company plans to roll out a mobile app by the second
half of 2017 promoting employee and factory engagement.
Source: Company information
Advocacy of Human Rights:Target 2030: No human rights abuses and full rights advocacy
Via the Internet of Things, an increasing number of devices and equip-ment are becoming connected to each other and to the internet, making it possible to transfer real-time data that can be used to drive insights and improve OHS programs. This could include notifications alerting workers when they enter areas with unique safety requirements as well as extract-ing data from equipment.
HEALTH AND SAFETY IS AN AREA WHERE STRONG COLLABORATION BETWEEN FASHION BRANDS AND
SUPPLIERS CAN MAKE A LARGE DIFFERENCE
9493 PULSE OF THE FASHION INDUSTRYCHAPTER 3

©CFW

solutions that could include pre-competitive collaboration. According to the OECD there are significant gaps in legal frameworks and law enforce-ment capacity to prevent child labor in many garment-producing coun-tries.150 The OECD encourages fashion brands to work at numerous levels, including increased worker and management awareness through training, establishing management systems, and helping address systemic and root causes of child labor (such as lack of access to education).
Disruptive Actions:Realize same opportunities regardless of orientation, beliefs and
background. Achieving equal opportunities at the workplace means safe-guarding that no one is treated differently or less favorably because of characteristics that are not related to their merit or the direct requirements of the job. This goal is one of the UN’s Ten Principles of the Global Com-pact.151 Besides the already addressed topic of gender equality, discrimina-tion includes sexual orientation, religious beliefs, social background, and disabilities as well as age and political opinion. The aspiration of equal opportunities is to be realized both in fashion brands’ own operations and their entire supply chain. Drafting and implementing anti-discrimination and harassment policies, as well as diversity and inclusiveness policies, is the first step, followed by requiring all commercial business partners to have at least clear anti-discrimination, harassment and abuse policies in place. But companies also need to actively promote equal opportunity. Employees’ awareness has to be raised so that incidents are avoided al-together or can at least be reported without concerns.152 In a concerted move, the fashion industry has to work together to have not just inclu-sive headquarters staff, but to realize equal opportunities along the supply chain.
ical mass of users to ensure fair peer-to-peer comparison. As introduced earlier in this report the Sustainable Apparel Coalition’s Higg index offers a suite of tools empowering brands, retailers and facilities to identify ar-eas of improvement and pointing the way to optimization. The index al-ready covers a large share of the industry, and its continual commitment to refinement and expansion can fill the need for a much needed common standard.
Disruptive Actions:Use intermediaries as enforcers. SMEs usually have little influence
on their suppliers’ practices, as they represent only a tiny fraction of a supplier’s overall orders or source through intermediaries. But these inter-mediates can be used as enforcers of sustainable practices, functioning as gatekeepers in a joint effort with brands by stipulating, for instance, strict guidelines on chemical exposure and workers’ safety. Large numbers of SMEs will need to collaborate to make this happen.
Develop technologies enabling full source traceability. Companies can also aim to know the sources of their raw materials, and the specific factories for each batch of production. That can help with organic certi-fication and with eliminating subcontracting. Emerging tracking technol-ogies such as DNA tracking and blockchain—as pioneered by the startup Provenance153—can help.
OVERARCHINGTransparency and Traceability: Target 2030: Full visibility on all Tier’s supplier performance and conditions
One challenge inhibiting progress along a number of impact areas in the industry is the lack of transparency and traceability.
Immediate Actions:Use common standard to assess and remediate sustainability per-
formance. Many companies lack clarity about sustainability because there is so much “noise”: a plethora of well-meant initiatives that lack sufficient scale, a multitude of certificates, and scattered research. Brands interest-ed in measuring their current performance and identifying the best path ahead lack a standardized methodology or framework. Existing tools are split between individual company efforts (such as Kering’s EP&L or Ni-ke’s Manufacturing Index) and some ambitious multi-stakeholder attempts to fill that vacuum. This fragmentation calls for consolidation in order to channel money and effort at the most promising initiatives.
What is needed is a widely adopted global standard to performance assessment and sustainability reporting, so companies can measure their performance against industry benchmarks. This standard must have a crit-
Consumer Engagement:Target 2030: Complete Customer information on a garment’s life cycle impact – environmentally and socially
When GFA and BCG polled the industry’s sustainability officers to ask who bears the major responsibility for driving the industry toward more sustainability, fashion brands pinpointed consumers as number one. There is an opportunity, then, for brands to engage the consumer and encourage sustainable behavior.
Immediate Actions:Continue sustainability education. By educating, informing and in-
centivizing consumers, companies can make up for consumers’ limited awareness and limited willingness to pay for sustainable products. By ac-tively engaging on the topic of sustainability, consumers may see and ap-preciate the need for it and the value it can create for them personally.
A notable corporate sustainability campaign includes Patagonia’s 2011 ad that appeared in the New York Times on Black Friday. The ad fea-tures a black Patagonia jacket with the headline "don’t buy this jacket". The ad text calls attention to the culture of consumption reflected by Black Friday and the strain that such consumption puts on natural resources. The company ends the ad by saying, “Don’t buy what you don’t need. Think twice before you buy anything.”154
A third approach to consumer awareness communication is exempli-fied in Selfridges’ Material World initiative, carrying the tagline “What on earth are you wearing?” The campaign involved a film designed to raise consumer awareness to the consequences of material choice. It also ad-
9897 PULSE OF THE FASHION INDUSTRYCHAPTER 3

dresses consumers in stores through tags, providing information on the properties and sustainability of the materials used. The brand reports that 83% of 1,000 interviewed customers felt it shifted their knowledge about the issues.
These types of campaigns are a helpful way of introducing the top-ic of sustainability to consumers and enabling them to participate in the broader sustainability effort. As an added benefit to retailers, collection boxes and campaigns may even be able to drive store traffic, as customers will need to visit the stores to donate the garments.
Implement wear and care instructions. The use phase is a large con-tributor to the overall environmental impact because washing, drying, and ironing are so water- and energy-intensive. Companies can help reduce the impact of the use phase through wear and care instructions optimized for low environmental impact, for instance through less frequent washing and washing at lower temperatures. Further, companies should highlight the urgency for repair versus discarding an item and include replacement buttons and yarn.
Eileen Fisher offers extensive step-by-step repair and care guides on its website, enabling consumers to follow instructions on topics ranging from “How to hand wash a sweater” to “How to sew a button.” Taking the initiative a step further, the company offers to repair customers’ garments free of charge; the customer simply has to take the item to the store and then wait eight to ten weeks.155
Disruptive ActionsEstablish information labels. To encourage consumers to make more
sustainable purchasing decisions and influence consumption patterns, large product labels on garments can be powerful instruments. Providing information on the environmental impact of a given product to consumers will help them understand the implications of their purchases. It can also become a competitive advantage if, for instance, the item is compared to an average product that does not use organic input materials or nov-el dyeing processes. A company pioneering in that regard is US fashion brand Reformation: It published environmental impact information for all its products on its website in terms of CO2, water and waste. It also com-pares the footprint of each garment with those of a comparable, conven-tionally produced one.
BY EDUCATING, INFORMING AND INCENTIVIZING CONSUMERS, COMPANIES CAN MAKE UP FOR CONSUMERS’ LIMITED
AWARENESS AND WILLINGNESS TO PAY FOR SUSTAINABLE PRODUCTS
Many emerging business models in the fashion industry circle around the idea of prolonging the life of a garment, be it through reuse or in-creased durability. Such business models can complement existing mod-els or form the basis of a company in its own right. One novel concept promotes consumer access over ownership. Such models can be based on renting clothes rather than purchasing them, at 10% to 15% of their purchase price, or even a Netflix for clothing model where consumers get access to unlimited items, three of which they can hold at a time, based on a monthly subscription fee.158 As a consumer’s wardrobe life-cycle manag-er, the subscription business model can reduce production while satisfying consumers’ need for novelty. (See Novel Business Models at Filippa K.) Admittedly, individual transportation and possibly cleaning after every use could blunt some of the environmental advantages.
Sharing models, boosting the secondary use of products, or promot-ing repair, can reduce the industry’s environmental impact, but they still have to prove their economic viability on the large scale. A major obstacle is the lack of consumer demand: 90% of consumers in EU countries do not consider buying secondhand clothing at all.159 But as examples from other industries show—think Uber and Airbnb—there could still be a vast oppor-tunity. Imagine telling someone 10 years ago that soon, millions of people would regularly share rides with complete strangers and stay in apart-ments of people they have never seen before—and pay for such services.
Building upon existing concepts such as environmental P&Ls and tools such as the Higg index, measuring the environmental impact of one’s products can be achieved in the near future by brands already reporting on the topic. For inexperienced brands undertaking this effort would also help them to better understand their own supply chains, as was concluded by 78% of participants in a French government pilot project on environ-mental labeling.156 Common labeling standards would facilitate consumer understanding. Such a standard seems within reach on the environmental front; more and more companies are making environmental impact assess-ments, with some, such as Kering, going so far as to lay open most of their methodology.157 The same cannot be said for social impact assessments. But standardized labels on working conditions in, say, garment factories, would help raise consumers’ attention to the impact of their choices.
PROOF OF CONCEPTNovel Business Models at Filippa K
Filippa K is a brand that is considering business model inno-vation to emphasize its devotion to reduce, repair, reuse, and recycle. To ensure that all the company's products receive a second or third life through reuse, the company has operated a profitable secondhand store in Stockholm since 2008. Further,
the company has started to rent out clothes in selected stores through its Lease concept. This concept builds on the idea that customers will be able to renew their wardrobes without contrib-uting to increased consumption.
Source: Company information
Novel Business Models: Ambition 2030: Full utilization of purchased fashion producst
10099 PULSE OF THE FASHION INDUSTRYCHAPTER 3

SUSTAINABILITY IS A POSITIVE BUSINESS CASE
The preceding assessments show that the industry can already generate immense value for the world economy through better practices. The com-pany examples showcased in chapter 3 are proof-of-concept that such im-provements can also be economically viable to individual businesses. In its 2015 survey report with MIT Sloan Management Review, BCG found that 60% of managers in publicly traded companies believe that good sustainability practices influence business decisions.160 This stands in contrast to the 75% of senior executives in investment firms who consider a company’s sustainability performance to be materially important for their investment decisions—and nearly half who would not invest in a company with a poor track record in that regard.161 Furthermore, 75% of investors now think that increased operational efficiency often accompanies sustainability investments.162
GFA and BCG aim to assess how far these moves towards improved im-pact can be profitable, or at least not generate additional costs. Besides the company examples mentioned already, we can point to several measures with neutral to positive business cases, based on initial estimates built on available data and ambitious, but reasonable assumptions.
These calculations were performed for investments to boost efficiency in waste and water management, and to improve labor productivity, for an exemplary fashion brand. With waste reduction, the measures included sup-plier training to lower processing waste, wider use of laser cutting to lower manufacturing waste, and new apparel designs that cut down on waste from day one. Water-saving measures included supporting suppliers in adhering to the Better Cotton Initiative’s principles. Measures for productivity included training of factory managers, efforts to change workers’ attitudes and im-prove working conditions, streamlining line-level productivity, and removing information barriers to sharing best practices.
More extensive estimations were made on energy efficiency, which has special significance for fashion brands due to the high energy costs on yarn processing, polyester production, and store occupancy. These investments can reach break-even quickly and even increase EBIT-margins. (See Exhibit 31, Energy Efficiency Reducing Emissions While Enhancing the Bottom Line.). For an exemplary company, comparable to a typical large-scale fashion retail-er, break-even would come within a few years and the EBIT-margin could be improved by one percentage point.
These assessments, along with the multitude of proofs of concepts out-lined in Chapter 3, show that improving a fashion brand’s impact need not come at the detriment of profitability—and this is without calculating the pos-itive effect on risk management and brand building. But more work is to be done on a broader, more detailed set of concrete examples. Such work, to be released in a future edition of the report, will include partnerships with sus-tainability frontrunners to analyze in depth the short- and long-term effects of these investments.
All of these investments can help counteract the cost pressures faced by fashion brands that were described in Chapter 1. But uncertainty prevails and even greater cost increases are possible, if for example policymakers move toward special taxes to enforce lower resource use. This is why the industry needs disruptive new technologies and business models as well as collabo-rative improvements. These would keep businesses the driving force in the industry, supported by policymakers instead of restrained by them.
Exhibit 31 Exemplary Business Case for Energy Measures Energy efficiency reducing emissions while enhancing the bottom line
• Factory running cost • Fabric cost
• Accessory
• Print / embroidery
• Occupancy cost
Energy price increases until 2030 • Base case: 1.8% CAGR• High oil price case: 5.5% CAGR
Influence on
Initial situation:
• The production of fabrics from raw material
is the most energy-intense production step in
the fashion value chain, driven by amongst oth-
ers cotton spinning and weaving or polyester
extruder spinning and knitting
• As illustrated in the model P&L, fabric cost is
often by far the greatest cost factor in the cost
of goods sold; therefore, measures increasing
energy efficiency in this production step have
the greatest impact
• Examples of possible efficiency drivers:
• Update suction fan drive control systems
• Utilize heat energy of exhaust gases
• Install variable frequency drives for humid-
ification system pumps
• In total, those and other energy efficiency
increasing measures are estimated to reduce
energy consumption by 32% in applicable
facilities
• 80% was assumed as a share of applica-
ble facilities, as Tier 2 supplier facilities are
often located in countries such as India or
Bangladesh where many are still equipped
with outdated machinery showing the highest
savings potential
• The investment mainly entails cost for upgrad-
ing the equipment for every facility; due to a
generally large number of supplier facilities, the
capital requirement is large
• Furthermore, cost for capacity building, i.e.
training of workers, has to be taken into ac-
count, although in much smaller dimensions
• Due to the big share of the considered cost
items in the overall cost of goods sold, and
therefore the cost savings, the investment is
calculated to break even within 1-2 years
• In Tier 1 factories, being responsible for the
manufacturing of the garments, energy is a
considerable input factor, however not as large
as in Tier 2
• Furthermore, factory running cost are only
a marginal share of overall production cost;
therefore, energy efficiency measures in this
production step only have very limited impact
• Examples of possible efficiency drivers:
• Install Variable Speed Drives for sewing,
washing, drying machines
• Switch to LED lighting
• Use new, more efficient screw type com-
pressors
• In total, those and other energy efficiency
increasing measures were estimated to reduce
energy consumption by 26% in those facilities
applicable
• 90% was assumed as a share of applicable
facilities as also Tier 1 supplier facilities are
often located in countries such as India or
Bangladesh where many are still equipped
with outdated machinery showing the highest
saving potential
• Again, the investment includes cost for equip-
ment and capacity building
• Capital requirements are, however, consider-
ably smaller than in the case of Tier 2 suppliers
with also less facilities to upgrade overall
• Nevertheless, due to the limited cost saving
impact, the time needed to break-even on that
efficiency measure is calculated to be between
3 and 4 years
• As outlined in the model P&L, store occupancy
cost generally make up a large share of SG&A
costs, roughly on par with labor and G&A
expenses
• Within the store occupancy costs, energy costs
make up a rather small but still considerable
part of the total costs; within energy costs,
especially lighting makes up a major part. Mea-
sures in this area can therefore have a viable
influence on the bottom line
• Examples of possible efficiency drivers:
• LED lighting requiring less direct energy
• Switch of lightning reducing necessary
room cooling energy
• Steering by daylight and occupancy
sensors
• In total, such energy saving measures are esti-
mated to save nearly 23% in energy costs
• Based on similar store concepts in all outlets,
the measures are assumed to be rolled out in
all stores of the model company.
• Upgrading for instance the lighting in stores
requires adaptations in all retail outlets but
can be realized with comparably low capital
requirements, due to standardized easily
scalable technology solutions and installation
processes, however still leading to direct cost
savings
• For the model company, the investments
breaks even within around 1 to 2 years
Tier 2 Supplier Tier 1 Supplier Own stores
EBIT-margin+0.5-0.6 ppts.
EBIT-margin
EBIT-margin+0.05-0.1 ppts.
+0.9 ppts. Base case
High energy price case+1.1 ppts.
EBIT-margin+0.2-0.3 ppts.
Production cost
Business case
Material cost SG&A
Energy efficiency • Rising non-renewable energy costs • Investment into energy efficiency in production stages and retail stores
Source: BCG analysis. The achievable reductions in energy consumption are a result of a triangulation of different sources, amongst others Asian Development Bank. (2014). Bangladesh: Industrial Energy Efficiency Finance Program.; USAID. (2014). The Business Case for Energy Efficiency in Vietnam's Textile Industry.; ICF. (2015). Study on Energy Efficiency and Energy Saving Potential in Industry from Possible Policy Mechanisms. European Commission Directorate - General Energy.
102101 PULSE OF THE FASHION INDUSTRYCHAPTER 3

©Lu Guang/Greenpeace

The Landscape for Change is bold and ambitious, going well beyond what individual players have accomplished thus far and can accomplish going forward. The main challenge to achieve this ambition is not individ-ual commitment and actions, but leadership, collaboration and innovation. How can the industry manage the collective effort to develop new solu-tions and scale promising technologies to commercial viability? Many of these ideas will become practical only with widespread adoption. It’s not enough for a few leading brands or sustainability champions to show proof of concept. We need the broad commitment and coordinated participa-tion of the industry as a whole. With help from industry associations, con-sumers, and regulators, fashion can achieve the vision of a better industry.
CHAPTER
A CALL FOR COLLABORATION AND INNOVATION
4 WHAT IS THE ROLE OF REGULATORS?
Governmental regulators can play several roles in their interactions with the industry, along with international organizations such as the United Nations, the EU, and ASEAN, and their actions will depend on the indus-try’s own course. The best result is for regulators to offer a globally har-monized approach.
Outside of laws on wages and chemical use, the fashion industry so far has seen little regulatory intervention. This is due partly to a lack of reg-ulation generally in the main producing countries. Some initiatives have emerged from voluntary action, such as Bangladesh’s Accord on Fire and Building Safety, which is legally binding for participating parties. The UN Global Compact, in which firms pledge to observe proclaimed standards, is another example.
This voluntary self-regulation of the industry may change—and change quite suddenly—if the industry finds itself blamed for sustainability shortfalls. To avoid unilateral regulation, it is incumbent upon the industry to regulate itself.
THE REGULATOR AS AN AMPLIFIER
By taking the lead, the industry can favorably steer the needed chang-es. Not only would it preempt unilateral restrictions, but it could prompt supportive regulation that reinforces sustainability targets and incentivizes change. Rather than setting out mandates, regulators can motivate and amplify the moves of farsighted companies. They can do this, for example, with incentives for renewable energy or tax discounts for repairs. (See Exhibit 32 for an overview of the broad-solutions landscape envisioned for regulators).
Going further, governments can push the technological frontier with public research grants or subsidies on company- or industry-wide R&D, for instance on sustainable materials or chemical recycling. They can also subsidize investments to match production with demand, as in big data, 3D printing, and large-scale automation.
With fashion lagging behind other industries on recycling, policymak-ers should make it easier to handle clothing waste. They can help make consumers aware of the end-of-life stage and existing collection options as well as simplify the collection process. Regulators can also awaken con-
106PULSE OF THE FASHION INDUSTRY

Amplification
Preferred scenario(ideally on a harmonized global level)
Preferred scenario (ideally on a harmonized global level) Possible scenario if business do not act
Possible scenario if business do not act
Create supporting frame for investments in technology advances
Prevent child labor, implement harsh non-compliance penalties
Incentivize companies to collect end-of-life products
Launch sustainability awareness campaigns
Require regular sustainability assess-ment
Support R&D in sustain-able materials
Follow-up on work-ing time restrictions
Fund health & safety training
programs
Establish tax breaks for repairs
Offer public research grants
earmarked for ma-terials research
Gradually increase mini-mum wages
Promote health services to workers
Encourage energy-effi-cient washing & drying
Set standards for animal treatment
Further restrict allow-able chemicals
Subsidize renewable energy use
Expand and facilitate public collection
Support development and volun-tary implementation sustainability
labels
Define standardized sustainability reporting
Enforce regulator set sustainability targets
Exhibit 32 Guide for Regulatory Action—From Amplification to Strong Regulation
Low
Magnitude of collaboration and innovation
Non-exhaustive landscape—to be collectively expanded
Source: BCG analysis
High
100% closed loop
0% high impact materials1
100% renewable utilities
0% hazardous chemical use, no water pollution
0% overproduction
100% fair and equal pay to workers
0% avoidable health impact
0% human rights violations
100% enabled businesses
100% consumer information
Full utilization
Strong regulation AmbitionLever
Ensure follow-up on wa-ter pollution and chemi-
cal non-compliance
Support formation of unions, collective
bargaining
Set up mandatory state-authorized facto-
ry certifications
Mandate environmen-tal impact labeling
Mandate social impact labeling
Set minimum wages equal to living wages
Implement min. level of community spending
Stipulate mark-down periods
Set minimum targets for durability and
longevity
Require company-sub-sidized health insur-
ance scheme
Set harsher penalties for water pollution and
chemical non-compliance
Set threshold for share of recycled input mate-
rials
Penalize water usage through water tax
Mandate full renewable energy use
Require product take back at end-of-life
Env
iro
nmen
tal
Soci
alO
vera
rchi
ng
Closed loop recycling
Sustainable material mix
Reduced energy footprint
Chemical & water optimization
Production to demand
Rebalanced industry economics
Health & safety excellence
Advocacy of human rights
Transparency & traceability
Consumer engagement
Define level of living wages per country
Provide incentives for investments in building
safety
Encourage water-efficient washing
Influence on Consumers, not businesses
108107

sumers to environmental impacts by requiring labels on water and energy use for washing machines and dryers, and by establishing standards for sustainability labels on garments.
As for the social footprint, regulators can support better labor prac-tices with tax incentives or direct financial support for worker safety train-ing programs and improvements in factory conditions. They can help in-vest in company health services for workers in production countries, help define the living wage, and support collective bargaining.
In all of this, regulators should be aware of the differences in sustain-ability maturity and available resources across the industry. Brands about to embark on the journey face a business reality different from that faced by front-runners with dedicated efforts well under way. Legislation has to reflect these distinctions to support efforts without imposing unmanagea-ble cost on resource-constrained firms.
IF REGULATORS STEP IN
If the fashion industry fails to take the proactive, concerted stance needed to boost sustainability, regulators may take on more than just supporting and amplifying roles. They could take the lead – and as the pharmaceutical industry has found, damage the industry’s profitability.163 Potential steps range from mandates on renewable energy to compulsory labeling for environmental life cycle assessments and social impact -- as was piloted with the Grenelle 2 Act in France; or more broadly in the Euro-pean Commission’s ‘Environmental Footprint’ pilots in 26 consumer prod-uct categories. Regulators could set far-reaching and escalating targets for the industry, with penalties becoming more severe over time.
Other laws might set maximum levels of water and chemical use, as is already the case in drought-stricken regions. Or governments might compensate, through taxes, for the mispricing of water by factoring in the negative side effects of its unconstrained use, comparable to the way car-bon taxes are used today.164 Governments could even mandate “extend-ed producer responsibility”—forcing brands to take in products they sold when consumers return them at end-of-life, as they have already done in many countries with electronics.
Regulators may impose limits on the use of virgin raw materials. Fashion brands that are not yet using low-impact materials, and have no established relations with suppliers of such materials would struggle under such regulation.
On the social side, regulators could start with stricter enforcement of minimum wage levels and escalate to raises in those levels. Labor-re-lations rulings could drive systems for determining and negotiating living wages. Policymakers could also implement a standardized global health-and-safety auditing process. At a minimum, it might set protocols for un-announced audits and restrictions on the choice of auditors. The European Commission is currently working on the ‘EU Garment Initiative’, aiming for responsible management in the supply chain of the garment sector.
Regulators might also force fashion brands to stipulate community investments, such as the minimum percentages of sales allocated to pro-jects that benefit workers at their factories. Or it could insist that foreign direct investments have a minimum level of community investment in, say, the health infrastructure for garment workers.
These are not hypothetical possibilities. There is a growing political will at least within the European Union to regulate the fashion industry. In-itiatives in Germany, The Netherlands and elsewhere have gained momen-tum among policymakers in response to what they see as the industry’s lack of self-governance of supply chains. Such national initiatives could potentially undermine the all-important efforts at global consolidation and harmonization. To head these off, it is imperative for the industry to devel-op and showcase large-scale improvements.
THE CONSUMER WITH THE POWER TO TIP THE SCALE
Consumers are far more sensitive to environmental, social, and ethi-cal concerns than those of previous decades. A third of Millennials strong-ly agree that they are more likely to buy from companies that are mindful of their social responsibilities, while just a quarter of those older than 51 say so.165 But only a tiny proportion of fashion shoppers are willing to pay a premium for sustainable products. In the Pulse Survey only 6% of the fash-ion brands polled said they charged a substantial premium for products explicitly marketed as sustainable. One in four firms named consumers’ unwillingness to pay such a premium for preventing them from revising their practices. At the same time, most consumers have, at best, a hazy idea of what goes into their buys. While some may be attuned to fair-trade sourcing of the materials that go into a desired blouse or jacket, they may know little or nothing about the impact of the dyeing processes used in making the product. They may also be blind to their own participation when quickly disposing of the apparel after only a few wears.
Additionally, consumers who want to make informed decisions about their fashion purchases are hard-pressed to sort through the information available to them. Here lies opportunity for the industry. Farsighted fash-ion brands can join forces with consumers in a long-term push for better practices and transparency in the value chain.
Next to making conscious choices about their consumption patterns, consumers can most easily make a difference in their apparel use. By upgrading washing and drying machines to eco-efficient models, as old machines break, they can save a great deal of water and energy. As for disposal, they can help by donating used garments through in-store col-lection boxes or public collection schemes.
With education, information, and incentives, consumers can gradual-ly change their habits far beyond washing and drying.
THE BEST RESULT IS FOR REGULATORS TO OFFER A GLOBALLY
HARMONIZED APPROACH
110109 PULSE OF THE FASHION INDUSTRYCHAPTER 4

COLLABORATION AND INNOVATION NEEDED ON AN UNPRECEDENTED SCALE
Up to now, individual brands and retailers and selected multi-stake-holder initiatives have shown impressive commitment and have already achieved great progress. Best practices are available across all segments of the industry, and substantial innovations are emerging. Applying and implementing these will do much to improve the industry’s impact. But these will not be enough to capture the full potential outlined in Chapter 1. A collective effort with critical mass would enable the industry to make pro-gress on the major pre-competitive goals, such as a network of collection points to promote recycling.
Such an effort would need a unified agenda with clear goals. It would be led by the large industry brands which as we have shown in Chapter 2, are clearly ahead of the game when it comes to sustainability. (See A Com-mon Global Agenda on Sustainability in Fashion). The key is to set up an ecosystem that encourages all parts of the industry to collaborate on the major issues. Multi-stakeholder initiatives, acting beyond commercial in-terests, can offer guidance and promote cohesion. But today’s scattered, fragmented array of initiatives, memberships, certifications and so on can be confusing to brands, suppliers, innovators and donors. Consolidation is inevitable to focus time, energy and money.
With the industry united around an agenda for change, it can drive the needed systemic change and work jointly on disruptive innovation. (See Changing the Apparel Industry through Innovation and New Busi-ness Models.) As promising ideas emerge, companies can support pilot programs and then quickly scale them up to commercial viability. Such collective investments would drive down costs and enable the magnitudes necessary to ‘move the needle’—as can be seen in other industries where such practices are common.
FOR A WORLD BEYOND NEXT SEASON
This report has laid out the scale of the challenges and broken down the necessary responses, near-term and further out as well as individual and collective. It has advanced the business case for change and estimat-ed the upside of the appropriate responses. It has also sketched out one scenario where the industry acts proactively and forcefully, and a fallback
Fashion for Good: Changing The Apparel Industry Through Innovation and New Business Models
Fashion for Good is a holistic and inclusive open-source initiative, launched in spring 2017. It is bringing together brands, retailers, suppliers, non-profit organizations, innovators and funders in order to jointly work on innovations and new business models which have the potential to transform the industry. The core of Fashion for Good is an open innovation platform aimed at finding, investing in, and accelerating startups that fast-track the transition to a sustainable apparel industry. Per design the platform is open for all likeminded industry players and fo-cuses on pre-competitive areas such as raw materials, processing technologies and end-of-use. Additionally the initiative aims to
set up a EUR 100m acceleration fund to ease access to capital for fashion supply chain players through de-risking investments. Fashion for Good was created with an initial grant from founding partner C&A Foundation, and other partners have joined to help build the foundation of Fashion for Good: C&A, the Cradle to Cradle Products Innovation Institute, the Ellen MacArthur Foundation, IDH the Sustainable Trade Initiative, Impact Hub Amsterdam, Kering, McDonough Innovation, Plug and Play, and the Sustainable Apparel Coalition (SAC).
Source: Information provided by Fashion for Good
Global Fashion Agenda: A Common Global Agenda on Sustainability in Fashion
Global Fashion Agenda was born from the imperative to tran-scend misconceptions and bridge fragmented sustainability efforts, by setting a unified agenda on key environmental, social and ethical issues for the global fashion industry.
Working in partnership with a group of sustainability-pioneering fashion leaders, Global Fashion Agenda aims to create a com-mon understanding of the most critical issues facing the industry across segments, sizes, and geographies, and focus efforts on the highest impact opportunities. This group of partners today
counts H&M, Kering, Li & Fung, Target and Sustainable Apparel Coalition.
Global Fashion Agenda is anchored around Copenhagen Fashion Summit, the world’s principal event on sustainability in fashion for industry decision-makers. Leveraging the strength of this platform, Global Fashion Agenda advocates for focused industry efforts following this common agenda, and creates joint commit-ments for change that has the potential to transform the way we produce and consume fashion today.
case where regulators drive more of the change. We vigorously recom-mend the first scenario, in which fashion businesses take the driver’s seat in making smart choices for the benefit of businesses and the world econ-omy.
In preparing and producing this report, GFA and BCG have signaled the urgency and hidden potential of the sustainability issue and shone a light on practical ways forward. It is our hope that the report becomes a powerful catalyst for real change. As such, the Good Citizen Principles and the Landscape for Change provide concrete recommendations grouped by different maturity phases. More broadly, GFA and BCG wish for this re-port to spark myriad conversations among many different parties that will collectively galvanize change at scale. We hope to continue this conversa-tion in future reports, with input from all interested stakeholders.
Since its beginning—certainly since the development of mass-fashion markets—the fashion industry has always had its eye on the clothing lines to be launched next season. In the context of a world timed by seasons altered already by the heavy hand of humankind, the industry must now look still further forward.
112111 PULSE OF THE FASHION INDUSTRYCHAPTER 4

ENDNOTES
1 BCG comparison of retail market values across consumer indus-tries, based on Euromonitor International. (2017).
2 Market size estimate of the apparel and footwear industry (ex cluding home textiles, accessories and jewelry) based on BCG tri-angulation of: Euromonitor International. (2017, January 18). [Ap-parel and Footwear 2017]; Statista. (2014, September). [Value of the global apparel and footwear market from 2002 to 2015]; Mor-gan Stanley. (2015). Global Athletic Wear - Global Insight: Very Bullish Five-Year Outlook; Cowen and Company. (2015). Disloca-tion in Apparel Will Continue – “Athletic” Brands Will Win; Mar-ketLine. (2016). Global Apparel Retail; Technavio. (2016). Global Women’s Apparel Market
3 FashionUnited. (2016). Global fashion industry statistics - Interna-tional apparel. Retrieved April 4, 2017, from https://fashionunited.com/global-fashion-industry-statistics
4 Based on exemplary calculations as presented in Chapter 35 Copenhagen Fashion Summit 2017. (2017). Retrieved April 4,
2017, from https://www.copenhagenfashionsummit.com/sum-mit-2017/
6 Sustainable Apparel Coalition. (2017). The Higg Index. Retrieved April 4, 2017, from http://apparelcoalition.org/the-higg-index/
7 United Nations. (2015). Probabilistic Population Projections based on the World Population Prospects: The 2015 Revision. Population Division, DESA. http://esa.un.org/unpd/ppp/
8 OECD (2017), GDP long-term forecast (indicator). (Accessed on 05 April 2017)
9 BCG estimate of total apparel and footwear consumption in mil-lion tons. For additional details, please see the methodology ap-pendix.
10 BCG Retail value projection 2015–2030 based on: Euromonitor International. (2017, January 18). [Apparel and Footwear 2017]; The Economist Intelligence Unit. (2017). [Footwear: Market de-mand (% real change pa) and Clothing: Market demand (% real change pa)]; Mintel Group Limited. (2017). [Footwear: Retail mar-ket value in USD adjusted to 2016 prices]. Forecast using con-stant 2016 prices and fixed 2016 exchange rates
11 Steffen, W., Richardson, K., Rockstrom, J., Cornell, S. E., Fetzer, I., Bennett, E. et al. (2015). Planetary boundaries: guiding human development on a changing planet. Science, 347(6223).
12 Rockström, J., Steffen, W., Noone, K., Persson, Å, Chapin, F. S., Lambin, E. et al. (2009). Planetary Boundaries: Exploring the Safe Operating Space for Humanity. Ecology and Society, 14(2).
13 Steffen, W., Richardson, K., Rockstrom, J., Cornell, S. E., Fetzer, I., Bennett, E. et al. (2015). Planetary boundaries: guiding human development on a changing planet. Science, 347(6223).
14 Rockström, J., Steffen, W., Noone, K., Persson, Å, Chapin, F. S., Lambin, E. et al. (2009). Planetary Boundaries: Exploring the Safe Operating Space for Humanity. Ecology and Society, 14(2).
15 Rockström, J., Steffen, W., Noone, K., Persson, Å, Chapin, F. S., Lambin, E. et al. (2009). Planetary Boundaries: Exploring the Safe Operating Space for Humanity. Ecology and Society, 14(2).; Ste-ffen, W., Richardson, K., Rockstrom, J., Cornell, S. E., Fetzer, I., Bennett, E. et al. (2015). Planetary boundaries: guiding human development on a changing planet. Science, 347(6223).
16 Rockström, J., Steffen, W., Noone, K., Persson, Å, Chapin, F. S., Lambin, E. et al. (2009). Planetary Boundaries: Exploring the Safe Operating Space for Humanity. Ecology and Society, 14(2).; Ste-ffen, W., Richardson, K., Rockstrom, J., Cornell, S. E., Fetzer, I., Bennett, E. et al. (2015). Planetary boundaries: guiding human development on a changing planet. Science, 347(6223).
17 World Bank. (2016). High and dry: climate change, water, and the economy. Washington, DC: World Bank.
18 The estimated environmental footprint builds on (1) a triangula-tion of the fiber mix in 2015 and the projected fiber mix in 2030, (2) an estimation of the environmental footprint along the en-
tire value chain by fiber type, and (3) an estimation of total con-sumption in million tons and scaling the footprint. For additional details, please see the methodology appendix.
19 MCL Global. (2015). Closing the loop - Can the apparel industry move from a linear to a circular business model? An essential guide for the global textile supply chain. Normanton, West York-shire, UK: MCL Global.
20 World Bank. (2016). High and dry: climate change, water, and the economy. Washington, DC: World Bank.
21 The estimated environmental footprint builds on (1) a triangula-tion of the fiber mix in 2015 and the projected fiber mix in 2030, (2) an estimation of the environmental footprint along the en-tire value chain by fiber type, and (3) an estimation of total con-sumption in million tons and scaling the footprint. For additional details, please see the methodology appendix.
22 Steffen, W., Richardson, K., Rockstrom, J., Cornell, S. E., Fetzer, I., Bennett, et al. (2015). Planetary boundaries: guiding human development on a changing planet. Science, 347(6223).
23 Rockström, J., Steffen, W., Noone, K., Persson, Å, Chapin, F. S., Lambin, E. et al. (2009). Planetary Boundaries: Exploring the Safe Operating Space for Humanity. Ecology and Society, 14(2).
24 The estimated environmental footprint builds on (1) a triangula-tion of the fiber mix in 2015 and the projected fiber mix in 2030, (2) an estimation of the environmental footprint along the en-tire value chain by fiber type, and (3) an estimation of total con-sumption in million tons and scaling the footprint. For additional details, please see the methodology appendix.
25 Levi Strauss & Co. (2015). The life cycle of a jean: understanding the environmental impact of a pair of Levi’s 501 jeans.
26 H&M. (2017). The H&M Group Sustainability Report 201627 Steffen, W., Richardson, K., Rockstrom, J., Cornell, S. E., Fetzer,
I., Bennett, E. et al. (2015). Planetary boundaries: guiding human development on a changing planet. Science, 347(6223).
28 Heffer, P. (2013). Assessment of fertilizer use by crop at the glob-al level. Paris, The International Fertilizer Industry Association.
29 Kering. (2014). Environmental Profit & Loss (E P&L) – Methodol-ogy and 2013 Group Results.
30 Organic Cotton. (2017). The risks of cotton farming. Retrieved April 4, 2017, from http://www.organiccotton.org/oc/Cot-ton-general/Impact-of-cotton/Risk-of-cotton-farming.php
31 Kering. (2014). Envitonmental Profit & Loss (E P&L) – Methodol-ogy and 2013 Group Results.
32 UNEP (United Nations Environment Programme). (2009). UNEP Yearbook - New Science and Developments in our Changing En-vironment.
33 According to the Global Footprint Network, the ecological foot-print comprises the population’s demand for plant-based food and fiber products, livestock and fish products, timber and oth-er forest products, space for human urban infrastructure, and forest to absorb its carbon dioxide emissions from fuels. Global Footprint Network. (2017). Ecological footprint. Retrieved April 4, 2017 from http://www.footprintnetwork.org/our-work/ecolog-ical-footprint/
34 The amount of waste is measured starting from delivery of the raw materials to the processing stage and ending at the prod-uct’s end-of-life, excluding co-products and wastes associated with agricultural, oil and chemical production (as defined by WRAP. (2012). Valuing Our Clothes: The True Cost Of How We Design, Use And Dispose Of Clothing In The UK.)
35 The estimated environmental footprint builds on (1) a triangula-tion of the fiber mix in 2015 and the projected fiber mix in 2030, (2) an estimation of the environmental footprint along the en-tire value chain by fiber type, and (3) an estimation of total con-sumption in million tons and scaling the footprint. For additional details, please see the methodology appendix.
36 The waste projection builds on (1) a triangulation of the fiber mix in 2015 and the projected fiber mix in 2030, (2) an estimation of the environmental footprint along the entire value chain by fiber type, and (3) an estimation of total consumption in million tons
and scaling the footprint. For additional details, please see the methodology appendix. The population statistics are retrieved from United Nations (2015). Probabilistic Population Projections based on World Population Prospects: The 2015 Revision. Popu-lation Division, DESA.
37 The Ellen MacArthur Foundation. (2014). Towards The Circular Economy, Vol. 3: Accelerating The Scale-up Across Global Supply Chains.
38 Steffen, W., Richardson, K., Rockstrom, J., Cornell, S. E., Fetzer, I., Bennett, et al. (2015). Planetary boundaries: guiding human de-velopment on a changing planet. Science, 347(6223).
39 Rockström, J., Steffen, W., Noone, K., Persson, Å, Chapin, F. S., Lambin, E. et al. (2009). Planetary Boundaries: Exploring the Safe Operating Space for Humanity. Ecology and Society, 14(2).
40 The estimated environmental footprint builds on (1) a triangula-tion of the fiber mix in 2015 and the projected fiber mix in 2030, (2) an estimation of the environmental footprint along the entire value chain by fiber type, and (3) an estimation of total consump-tion in million tons and scaling the footprint. For additional de-tails, please see the methodology appendix.
41 World Bank. (2017). Water overview. Retrieved April 4, 2017, from http://www.worldbank.org/en/topic/water/overview#1.
42 FashionUnited. (2016). Global fashion industry statistics - Interna-tional apparel. Retrieved April 4, 2017, from https://fashionunited.com/global-fashion-industry-statistics
43 BCG estimation based on data from Huynh, P., & Cowgill, M. (2016). Weak minimum wage compliance in Asia’s garment industry. ILO Regional Office for Asia and the Pacific. (Asia-Pacific Garment and Footwear Sector Research Note, [5]); Clean Clothes Cam-paign. (2014). Living Wage in Asia. Amsterdam: Clean Clothes Campaign; Clean Clothes Campaign. (2014). Stitched Up: Poverty Wages for Garment Workers in Eastern Europe and Turkey. Clean Clothes Campaign.
44 The sample includes Cambodia, India, Indonesia, Lao PRD, Pa-kistan, the Philippines, Thailand, and Vietnam. The countries are weighted by the total of wage and salaried employment in ap-parel, footwear and textile in each country. Data based on Huynh, P. (2015). Employment, wages and working conditions in Asia’s garment sector: finding new drivers of competitiveness. ILO Re-gional Office for Asia and the Pacific. (ILO Asia-Pacific working paper series).
45 Van Klaveren, M. (2016) Wages in context in the garment industry in Asia. Amsterdam: WageIndicator Foundation, April. Retrieved April 4, 2017, from http://www.wageindicator.org/main/Wagein-dicatorfoundation/publications.
46 The United Nations. (2017). Sustainable Development Goals - 17 Goals to Transform Our World. Retrieved April 7, from http://www.un.org/sustainabledevelopment/sustainable-develop-ment-goals/.
47 The United Nations. (2017). Sustainable Development Goals - 17 Goals to Transform Our World. Retrieved April 7, from http://www.un.org/sustainabledevelopment/sustainable-develop-ment-goals/.
48 Clean Clothes Campaign. (2014). Living wage in Asia. Amster-dam: Clean Clothes Campaign.
49 Clean Clothes Campaign. (2014). Stitched up: poverty wages for garment workers in Eastern Europe and Turkey. Clean Clothes Campaign.
50 Huynh, P., & Cowgill, M. (2016). Weak minimum wage compliance in Asia’s garment industry. ILO Regional Office for Asia and the Pacific. (Asia-Pacific Garment and Footwear Sector Research Note, [5]).
51 Calculated based on distribution of wage data in Huynh, P., & Cowgill, M. (2016). Weak minimum wage compliance in Asia’s garment industry. ILO Regional Office for Asia and the Pacific. (Asia-Pacific Garment and Footwear Sector Research Note, [5]) and garment worker numbers from Clean Clothes Campaign. (2014). Living Wage in Asia. Amsterdam: Clean Clothes Cam-paign and Clean Clothes Campaign. (2014). Stitched Up: Poverty
Wages for Garment Workers in Eastern Europe and Turkey. Clean Clothes Campaign.
52 The United Nations. (2017). Sustainable Development Goals - 17 Goals to Transform Our World. Retrieved April 7, 2017, from http://www.un.org/sustainabledevelopment/sustainable-devel-opment-goals/.
53 Huynh, P. (2016). Gender pay gaps persist in Asia’s garment and footwear sector. ILO Regional Office for Asia and the Pacific. (Asia-Pacific Garment and Footwear Sector Research Note, [4]).
54 Huynh, P., & Cowgill, M. (2016). Weak minimum wage compliance in Asia’s garment industry. ILO Regional Office for Asia and the Pacific. (Asia-Pacific Garment and Footwear Sector Research Note, [5]).
55 Calculations based on Huynh, P. (2015). Employment, wages and working conditions in Asia’s Garment sector: Finding new drivers of competitiveness. ILO Regional Office for Asia and the Pacific. (ILO Asia-Pacific working paper series).
56 The authors of this report do not recommend 120% min. wage as representative of a living wage; level of 120% min. wage taken to show general insufficiency of min. wage level to make a living; further the taken threshold is advantageous due to data availabil-ity in ILO reports on min. wage compliance (Huynh, P., & Cowgill, M. (2016). Weak minimum wage compliance in Asia’s garment in-dustry. ILO Regional Office for Asia and the Pacific. (Asia-Pacific Garment and Footwear Sector Research Note, [5]))
57 Projection based on Huynh, P., & Cowgill, M. (2016). Weak mini-mum wage compliance in Asia’s garment industry. ILO Regional Office for Asia and the Pacific. (Asia-Pacific Garment and Foot-wear Sector Research Note, [5]); BCG projection of the retail vol-ume of apparel and footwear 2015–2030 based on Euromonitor International. (2017, January 18). [Apparel and Footwear 2017]; The Economist Intelligence Unit. (2017). [Footwear: Market de-mand (% real change pa) and Clothing: market demand (% real change pa)]; Mintel Group Limited. (2017). [Footwear: Retail mar-ket value in USD adjusted to 2016 prices].; Clean Clothes Cam-paign. (2014). Living Wage in Asia. Amsterdam; Clean Clothes Campaign and Clean Clothes Campaign. (2014). Stitched Up: Poverty Wages for Garment Workers in Eastern Europe and Tur-key. Clean Clothes Campaign.
58 Based on a projection of the recordable industry injury rate as presented by Nike. (2015). Sustainable business report FY14/15. Beaverton: Nike Inc., which is based on primary data from the US Department of Labor - Occupational Safety and Health Adminis-tration. The recordable injury rate is scaled by the estimated num-ber of garment workers in the world in 2015 and 2030. These are based on country data and production shares by Clean Clothes Campaign. (2014). Living Wage in Asia. Amsterdam: Clean Clothes Campaign, and Clean Clothes Campaign. (2014). Stitched Up: Poverty Wages for Garment Workers in Eastern Europe and Turkey. Clean Clothes Campaign., as well as BCG projection of the retail volume of apparel and footwear 2015-2030 based on Euro-monitor International. (2017, January 18). [Apparel and Footwear 2017]; The Economist Intelligence Unit. (2017). [Footwear: Market demand (% real change pa) and Clothing: market demand (% real change pa)]; Mintel Group Limited. (2017). [Footwear: Retail mar-ket value in USD adjusted to 2016 prices].
59 Nike. (2015). Sustainable business report FY14/15. Beaverton: Nike Inc.
60 United Nations. (2015). The Millennium Development Goals Re-port 2015. Retrieved April 5, from http://www.un.org/millen-niumgoals/2015_MDG_Report/pdf/MDG%202015%20rev%20(July%201).pdf.
61 BCG triangulation based on annual reports and sustainability re-ports.
62 BCG triangulation based on annual reports and sustainability re-ports.
63 BCG Retail value projection 2015–2030 based on: Euromonitor International. (2017, January 18). [Apparel and Footwear 2017]; The Economist Intelligence Unit. (2017). [Footwear: Market de-
114113 PULSE OF THE FASHION INDUSTRYENDNOTES

mand (% real change pa) and Clothing: Market demand (% real change pa)]; Mintel Group Limited. (2017). [Footwear: Retail mar-ket value in USD adjusted to 2016 prices]. Forecast using con-stant 2016 prices and fixed 2016 exchange rates.
64 Calculation based on a weighted average by garment workers of real earnings (relative to CPI) across China, India, Turkey, Indone-sia, and Malaysia. Earnings data is supplied by Oxford Econom-ics. (2017). [Raw Materials and Labor Costs] and the number of garment workers per country is supplied by Clean Clothes Cam-paign. (2014). Living Wage in Asia. Amsterdam: Clean Clothes Campaign.
65 Calculation based on a continuation of historical growth rates in the primary textile industry as reported by Werner International Management Consultants. (2014). Commentary on Hourly Labor Costs in the Primary Textile Industry 2014, weighted by number of garment workers from Clean Clothes Campaign. (2014). Living Wage in Asia and adjusted for inflation using MUV index by World Bank. (2017, January 2017). [World Bank commodities Price Fore-cast (constant US dollars)].
66 Both growth projections are in real terms.67 World Bank. (2017, January 2017). [World Bank commodities
Price Forecast (constant US dollars)].68 Nominal data from Oxford Economics. (2017). [Raw materials
and labor costs]. Adjusted for inflation using MUV index by World Bank. (2017, January 2017). [World Bank commodities Price Fore-cast (constant US dollars)].
69 High oil case forecast by U.S. Energy Information Administra-tion. (2017). [Energy Prices by Sector and Source] retrieved March 15, from http://www.eia.gov/outlooks/aeo/data/brows-er/#/?id=3-AEO2017®ion=1-0&cases=ref2017~highmac-ro~highprice~highrt&start=2015&end=2050&f=A&linechart=ref2017-d120816a.3-3-AEO2017.1-0~highmacro-d120816a.3-3-AEO2017.1-0~highprice-d120816a.3-3-AEO2017.1-0~highrt-d120816a.3-3-AEO2017.1-0~ref2017-d120816a.4-3-AEO2017.1-0~highmacro-d120816a.4-3-AEO2017.1-0~highprice-d120816a.4-3-AEO2017.1-0~highrt-d120816a.4-3-AEO2017.1-0&map=high-macro-d120816a.3-3-AEO2017.1-0&sourcekey=1 weighted by Oxford Economics. (2017). [Raw Materials and Labor Costs] en-ergy index weights.
70 Mutuc, M., Pan, S., & Hudson, D. (2011). Response of cotton to oil price shocks. Agricultural Economics Review, 12(2), 40–49.
71 See methodology appendix for further details on the estimation of exemplary P&L – including sources and growth assumptions.
72 See methodology appendix for further details on the estimation of exemplary P&L – including sources and growth assumptions.
73 Nike. (2015). Sustainable business report FY14/15. Beaverton: Nike Inc.
74 Kering. (2016). Environmental Profit & Loss (E P&L) – 2015 Group Results.
75 Ellen MacArthur Foundation. (2015). Growth within: a circular economy vision for a competitive Europe. Ellen MacArthur Foun-dation.
76 Textile Exchange. (2016). Material snapshot: chemically recycled polyester (cRPET). Retrieved April 4, 2017, from http://textileex-change.org/wp-content/uploads/2016/11/TE-Material-Snapshot_Chemically-Recycled-Polyester.pdf; Oerlikon. (2013). From Melt to Yard. Fibers and Filaments, (16).
77 Leonas, K. K. (2017). The use of recycled fibers in fashion and home products. Singapore: Springer Science+Business Media;); Ensait / ECO TLC. (2014). Étude des perturbateurs et facilitateurs au recyclage des textiles et linges de maison. Retrieved April 4, 2017, from http://www.ecotlc.fr/ressources/Documents_site/Rapport_provisoire_Etude_des_perturbateurs_et_facilitateurs_au_recyclage_des_textiles_et_linges_de_maison.pdf.
78 Leonas, K. K. (2017). The use of recycled fibers in fashion and home products. Singapore: Springer Science+Business Media;); Textile Exchange. (2016). Material Snapshot: Chemically Recycled Polyester (cRPET). Retrieved April 4, 2017, from http://textile-exchange.org/wp-content/uploads/2016/11/TE-Material-Snap-
shot_Chemically-Recycled-Polyester.pdf; Peterson, A. (2015). To-wards recycling of textile fibers: separation and characterization of textile fibers and blends. Chalmers University of Technology; Patagonia. (n.d.). Reordering the Rs. Retrieved April 4, 2017, from http://eu.patagonia.com/enGB/patagonia.go?assetid=70863.
79 Patagonia. (n.d.). Reordering the Rs. Retrieved April 4, 2017, from http://eu.patagonia.com/enGB/patagonia.go?assetid=70863.
80 H&M. (2017). The H&M Group Sustainability Report 2016.81 H&M. (2017). The H&M Group Sustainability Report 2016.82 Levi Strauss & Co. (2015). The life cycle of a jean: understanding
the environmental impact of a pair of Levi’s 501 jeans.83 DyeCoo. (2014). DyeCoo technology used in new Nike factory
in Taiwan. Retrieved April 4, 2017, from http://www.dyecoo.com/dyecoo-technology-used-in-new-nike-factory-in-taiwan/.
84 Fashion Revolution. (2016). Fashion Transparency Index 2016, report written in conjunction with Ethical Consumer. Retrieved April 4, 2017, from http://fashionrevolution.org/wp-content/up-loads/2016/04/FR_FashionTransparencyIndex.pdf.
85 Fashion Revolution. (2016). Fashion Transparency Index 2016, report written in conjunction with Ethical Consumer. Retrieved April 4, 2017, from http://fashionrevolution.org/wp-content/up-loads/2016/04/FR_FashionTransparencyIndex.pdf.
86 ILO. (2015). Myanmar garment sub-sector value chain analysis. Yangon: International Labour Organization.
87 IndustriALL. (2015). Industry bargaining for living wages. Re-trieved April 4, 2017, from http://www.industriall-union.org/indus-try-bargaining-for-living-wages.
88 ILO. (2017). Redistributing value added toward labor in apparel supply chains: tackling low wages through purchasing practices. Conditions of Work an Employment Series, (83).
89 H&M. (2017). The H&M Group Sustainability Report 2016.90 H&M. (2017). The H&M Group Sustainability Report 2016.91 Barnardos. (2015). Once worn, thrice shy – British women’s ward-
robe habits exposed! Retrieved April 4, 2017, from http://www.barnardos.org.uk/news/media_centre/Once-worn-thrice-shy-8211-British-women8217s-wardrobe-habits-exposed/press_re-leases.htm?ref=105244.
92 WRAP. (2013). Evaluating the financial viability and resource im-plications for new business models in the clothing sector. Ban-bury: Waste and Resources Action Programme.
93 WRAP (2016) – EU Clothing Survey (ECAP) - Wave 1 - November 2016, n=4000.
94 Beton, A., Dias, D., Farrant, L., Gibon, T., & Le Guern, Y. (2014). Environmental Improvement Potential of Textiles. JRC Scientific and Technical Reports. Seville: European Commission JRC – IPTS.
95 EPA. (2015). Advancing Sustainable Materials Management: Facts and Figures 2013. Washington D.C.: United States Environmental Protection Agency.
96 The Ellen MacArthur Foundation. (2014). Towards the Circular Economy Vol. 3: Accelerating the scale-up across global supply chains.
97 Eurostat. (2016). Packaging waste statistics. Retrieved April 4, 2017, from http://ec.europa.eu/eurostat/statistics-explained/in-dex.php/Packaging_waste_statistics.
98 United Nations Commodity Trade Statistics Database (UN Comtrade), based on commodity code 6309 (“Worn clothing and other worn articles.”)
99 Primary micro-plastics are directly released into the environment as small particles, whereas secondary micro-plastics largely stem from degradation of larger plastic waste into smaller plastic com-ponents after entering the ocean.
100 Boucher, J., & Friot, D. (2017). Primary micro-plastics in the oceans: a global evaluation of sources. Gland, Switzerland: IUCN.
101 CRAiLAR Fiber Technologies International. (2017). Benefits of CRAiLAR fiber. Retrieved April 3, 2017, from https://www.crailar-fti.com/benefits-2/
102 United Nations. (2015). Transforming our world: the 2030 Agen-da for Sustainable Development. Retrieved April 4, 2017, from https://sustainabledevelopment.un.org/post2015/transforming-
ourworld103 Plannthin, D.-K. (2016). Animal Ethics and Welfare in the Fashion
and Lifestyle Industries. In S. S. Muthu & M. A. Gardetti (Eds.), Green Fashion (pp. 49–122). Singapore: Springer Singapore.
104 Textile Exchange. (2016). Preferred Fiber Market Report 2016.105 Textile exchange. (2016). Preferred Fiber Market Report 2016.106 H&M. (2017). The H&M Group Sustainability Report 2016.107 Adidas (2016). Adidas unveils world’s first performance shoe
made from Biosteel® Fiber. Retrieved April 3, 2017, from http://www.adidas-group.com/en/media/news-archive/press-releas-es/2016/adidas-unveils-worlds-first-performance-shoe-made-bi-osteel-fiber/.
108 Schlomer, S., Bruckner, T., Fulton, L., Hertwich, E., McKinnon, A., Perczyk, D. et al. (2014). Annex III: Technology-specific cost and performance parameters. Climate Change 2014: Mitigation of Climate Change. Contribution of Working Group III to the Fifth Assessment Report of the Intergovernmental Panel on Climate Change, 1329–1356.
109 IRENA. (2015). Renewable energy prospects: United States of America. REmap 2030 analysis. Abu Dhabi: IRENA.
110 IRENA. (2015). Africa 2030: Roadmap for a renewable energy fu-ture. Abu Dhabi: IRENA.
111 A Ibañez, P., Senra, M. (2013). Energy efficiency and its contribu-tion to energy security and the 2030 Framework for climate and energy policy {SWD(2014), 53(2013), 266–276.
112 Organic Cotton. (n.d.). The risks of cotton farming. Retrieved April 3, 2017, from http://www.organiccotton.org/oc/Cotton-gen-eral/Impact-of-cotton/Risk-of-cotton-farming.php.
113 Better Cotton Initiative - Growth and Innovation Fund. (2014). Mainstreaming Better Cotton for Global Sustainable Impact. Re-trieved April 3, 2017, from http://bettercotton.org/wp-content/uploads/2013/12/GIFProspectus_120216_spread_final_7.pdf.
114 Cotton made in Africa. (2015). Minimizing the footprint: the envi-ronmental balance of Cotton made in Africa. Hamburg.
115 Forster, D., Andres, C., Verma, R., Zundel, C., Messmer, M. M., & Mäder, P. (2013). Yield and economic performance of organic and conventional cotton-based farming systems: results from a field trial in India. PLoS ONE, 8(12).
116 Bachmann, F. (2012). Potential and limitations of organic and fair trade cotton for improving livelihoods of smallholders: evidence from Central Asia. Renewable Agriculture and Food Systems, 27(2), 138–147.
117 Bachmann, F. (2012). Potential and limitations of organic and fair trade cotton for improving livelihoods of smallholders: evidence from Central Asia. Renewable Agriculture and Food Systems, 27(2), 138–147.
118 World Bank. (2014). The Bangladesh Responsible Sourcing Initia-tive - A New Model for Green Growth. Washington, D.C.
119 The Zero Discharge of Hazardous Chemicals Programme (ZDHC). (2016). 2016 Wastewater Guidelines. Retrieved April 3, 2017, from http://www.roadmaptozero.com/fileadmin/content_2016/ZDHC_Wastewater_Guidelines_Print.pdf.
120 Ecofoot. (2013). Technology of H2Color dyes that differentiates it from others. Retrieved April 3, 2017, from http://www.ecofoot.pt/en/h2color
121 Rabobank. (2017). Waterless dyeing. Retrieved April 3, 2017, from https://www.rabobank.com/en/about-rabobank/customer-fo-cus/innovation/start-ups/articles/waterless-dyeing.html.
122 OrganoClick. (2017). Water repellent additives for textile and nonwoven. Retrieved April 3, 2017, from http://organoclick.com/products/performance-textiles-nonwoven/water-repellent-addi-tives/.
123 NEFFA. (2016). MycoTEX. Retrieved April 3, 2017, from http://nef-fa.nl/portfolio/mycotex/.
124 Pili. (2015). Living Colors. Retrieved April 3, 2017, from http://www.pili.bio/.
125 TWOTHIRDS. (n.d.). Sustainability. Retrieved April 3, 2017, from https://twothirds.com/pages/sustainability
126 WWD (2017). Amazon Prepares for On-Demand Fashion Produc-
tion With Patent. Retrieved April 17, 2017, from http://wwd.com/business-news/technology/amazon-going-deeper-into-fash-ion-with-new-on-demand-manufacturing-patent-10869520/
127 Ahuja, S. (2015). What Stitch Fix Figured Out About Mass Cus-tomization. Harvard Business Review. Retrieved from https://hbr.org/2015/05/what-stitchfix-figured-out-about-mass-customiza-tion
128 Calculation based on ILO. (2016). ASEAN in Transformation - Tex-tiles, Clothing and Footwear: Refashioning the Future. Geneva: Bureau for Employers’ Activities (ACT/EMP), Working Paper No 14.
129 ILO. (2016). ASEAN in Transformation - Textiles, Clothing and Footwear: Refashioning the Future. Geneva: Bureau for Employ-ers’ Activities (ACT/EMP), Working Paper No 14.
130 TamiCare. (2016). Cosyflex introduces a new era in fabrics and a whole new world of opportunities for product developers. Re-trieved April 3, 2017, from http://www.tamicare.com/cosyflex.
131 UNMADE. (n.d.). About us. Retrieved April 3, 2017, from http://www.unmade.com/about-us/.
132 Kniterate. (2017). Knitting machines made for everyone. Re-trieved April 3, 2017, from http://www.kniterate.com/index.php/about/.
133 OECD. (2017). Session notes: roundtable on due diligence in the garment and footwear sector. Retrieved April 6, 2017, from https://mneguidelines.oecd.org/2017-Roundtable-Textiles-Ses-sion-Notes.pdf.
134 OECD. (2017). Session notes: roundtable on due diligence in the garment and footwear sector. Retrieved April 6, 2017, from https://mneguidelines.oecd.org/2017-Roundtable-Textiles-Ses-sion-Notes.pdf.
135 OECD. (2017). Session notes: roundtable on due diligence in the garment and footwear sector. Retrieved April 6, 2017, from https://mneguidelines.oecd.org/2017-Roundtable-Textiles-Ses-sion-Notes.pdf.
136 The authors of this report do not recommend 120% min. wage as representative of a living wage; level of 120% min. wage tak-en to show general insufficiency of min. wage level to make a living; further the taken threshold is advantageous due to data availability in ILO reports on min. wage compliance (Huynh, P., & Cowgill, M. (2016). Weak minimum wage compliance in Asia’s garment industry. ILO Regional Office for Asia and the Pacif-ic. (Asia-Pacific Garment and Footwear Sector Research Note. Based on the projections introduced in Chapter 1 concerning la-bor practices.
137 A true living wage, allowing a worker to support him/herself and two additional ‘consumption units, i.e. for instance a partner and two kids, is oftentimes twice as high as minimum wages in the garment sector in developing nations, as brought forward for in-stance by the Clean Clothes Campaign.
138 Clean Clothes Campaign. (2014). Living wage in Asia. Amster-dam: Asia Floor Wage Alliance/Clean Clothes Campaign.
139 GFA and BCG used data presented in the reports from the two previous endnotes (Clean Clothes Campaign and ILO) to estimate that while it would cost not even €2bn per year to bring all Indian garment workers to 120% of the minimum wage, bringing them to a level with which they can support themselves and their depend-ents would cost more than €9bn yearly. Still, for a €25 garment of which the workers today receive around €1.40, increasing pay to a living wage would only mean an additional €1.34—in theory. Because due to current markup structures (see later in text), this would result in a €6.30 final, equaling an over 25% price increase, which could have been a 5% increase without current markup structures.
140 Calculations based on Huynh, P. (2015). Employment, wages and working conditions in Asia’s garment sector: finding new drivers of competitiveness. ILO Regional Office for Asia and the Pacific. (ILO Asia-Pacific working paper series).
141 Huynh, P. (2016). Gender pay gaps persist in Asia’s garment and footwear sector. ILO Regional Office for Asia and the Pacific.
116115 PULSE OF THE FASHION INDUSTRYENDNOTES

(Asia-Pacific Garment and Footwear Sector Research Note, [4]).142 H&M (2017). The H&M Group Sustainability Report 2016.143 Nike. (2015). Sustainable business report FY14/15. Beaverton:
Nike Inc.144 Nike. (2015). Sustainable business report FY14/15. Beaverton:
Nike Inc.145 Adidas. (2015). Adidas Group Sustainability Progress Report
2015. Herzogenaurach: Adidas AG146 Better Work (2016). Women & the Garment Industry in 2015: A
Snapshot from Better Work.147 Better Work (2016). Women & the Garment Industry in 2015: A
Snapshot from Better Work.148 OCED (2017). OECD Due Diligence Guidance for Responsible
Supply Chains in the Garment and Footwear Sector.149 The United Nations. (2017). Sustainable Development Goals -
17 Goals to Transform Our World. Retrieved April 7, 2017, from http://www.un.org/sustainabledevelopment/sustainable-devel-opment-goals/
150 OCED (2017). OECD Due Diligence Guidance for Responsible Supply Chains in the Garment and Footwear Sector.
151 International Labour Organization. (2008). The Labour Principles of the United Nations Global Compact - A Guide for Business. Geneva: ILO.
152 H&M. (2017). The H&M Group Sustainability Report 2016.153 Provenance. (2017). Technology. Retrieved April 3, 2017, from
https://www.provenance.org/technology.154 Patagonia. (n.d.). Worn Wear. Retrieved April 4, 2017, from http://
www.patagonia.com/worn-wear.html.155 Eileen Fisher. (2017). Repair and care: mend, tend, wash. Our
tips for the long haul. Retrieved April 5, from http://www.ei-leenfisher.com/repair-and-care/repair-and-care-overview/?___store=en&___from_store=default.
156 Ernst & Young. (2013). Report on company feedback from the French national environmental labeling pilot. Retrieved January 27, 2017, from http://www.developpement-durable.gouv.fr/img/pdf/synthserapportEYV2_EN_3.pdf.
157 Kering. (2014). Environmental Profit & Loss (E P&L) – Methodolo-gy and 2013 Group Results.
158 Rent the Runway. (2017). Want an unlimited wardrobe? Retrieved April 4, 2017, from https://www.renttherunway.com/unlimited.
159 WRAP (2016). EU Clothing Survey (ECAP) - Wave 1 - Novem-ber 2016. Banbury: The Waste and Resources Action Programme; n=4000.
160 BCG. (2016). Investors care more about sustainability than many executives believe. Retrieved April 4, 2017, from https://www.bcgperspectives.com/content/articles/sustainability-strate-gy-investors-care-more-about-sustainability-than-many-execu-tives-believe/.
161 BCG. (2016). Investors care more about sustainability than many executives believe. Retrieved April 4, 2017, from https://www.bcgperspectives.com/content/articles/sustainability-strate-gy-investors-care-more-about-sustainability-than-many-execu-tives-believe/.
162 BCG. (2016). Investors care more about sustainability than many executives believe. Retrieved April 4, 2017, from https://www.bcgperspectives.com/content/articles/sustainability-strate-gy-investors-care-more-about-sustainability-than-many-execu-tives-believe/.
163 Sood, N., De Vries, H., Gutierrez, I., Lakdawalla, D., & Goldman, D. (2009). The effect of regulation on pharmaceutical revenues: experience in nineteen countries. Health Affairs (Project Hope), 28(1),
164 IMF (2016). After Paris: fiscal, macroeconomic, and financial implications of climate change. IMF Staff Discussion Note. Re-trieved April 4, 2017, from http://www.imf.org/external/pubs/ft/sdn/2016/sdn1601.pdf.
165 BCG 2016 Consumer Sentiment Series, US respondents, n=4518; Millennials defined as born 1982–1996.
118PULSE OF THE FASHION INDUSTRY117 ENDNOTES

APPENDICES
A
B
PAGE 121Forecasting the P&L of an Exemplary Fashion Brand
PAGE 131Environmental footprint projection

FORECASTING THE P&L OF AN EXEMPLARY FASHION BRAND
2.5
2.0
1.5
1.0
0.5
0.0 2030
E
2029
E
2028
E
2027E
2026
E
2025E
2024
E
2023E
2022E
2021E
2020
E
2019
E
2018
E
2017E
2016
E
2015
2014
2013
2012
2011
2010
200
9
200
8
200
7
200
6
200
5
200
4
200
3
200
2
Exhibit A1
CAGR 2016-2030
From a Business Perspective, the Retail Market Will See Further Growth
1. Apparel and footwear market showm using historic constant 2016 prices. forecast constant 2016 prices and historic fixed 2016 exchange rates. forecast fixed 2016 exchange ratesSource: Euromonitor; Economist Intelligence Unit; Mintel; World Bank; BCG Analysis
1.2%
2.8%
2.0%
1.2%1.5%
1.8
2.2
High Growth catch-up to volume growth
Base Case
Low Case
High Case
BCG triangulation
Continuation of historical growth
• Retail value growth is driven by well-performing lead markets such as China and the US as well as rapidly growing emerging markets such as India
• Moreover, 'slow fashion' and quality focus could slow down in marginal terms the price decline by item
Base
Low
2.0%
The profitability at risk for businesses is based on a projection of the profit-and-loss statement of an exemplary fashion brand. The P&L is pro-jected for a base case that assumes conservative growth and for a high case that assumes high costs for energy, wages, and water.
Total revenues of the exemplary brand are projected to grow at the same rate as the retail value of the total apparel and footwear market, estimated at a real rate of 2% per annum between 2015 and 20301. (See Exhibit A1.)
A122PULSE OF THE FASHION INDUSTRY

18
16
14
0
2000 2010 2020 2030
Fashion Brands will be Confronted with Continuously Falling Average per Item Prices
... However, the decline in average price per item appears to be slowing down
Average price per item. €1
Average price per item (EUR)Average
1. Apparel and footwear market show using historic constant 2016 prices. forecast constant 2016 prices and historic fixed 2016 exchange rates. forecast fixed 2016 exchange ratesSource: Euromonitor; Economist Intelligence Unit; Mintel; United Nations; World Bank; BCG Analysis
1. We do not assume the same growth rate for every year in the study, so CAGR represents indication of magnitude over 15 years Source: BCG analysisNote: Differences in sums can occur due to rounding
2030 20.9 235.1 11.2
16.0 201.1 12.6
19.0 222.0 11.7
17.4 210.6 12.1
14.1 197.4 14.0
11.5 205.2 17.8
2025
2020
2015
2010
2005
Items per capita Spend per capita (€1)
Avg. price per item (€1)
Exhibit A2
However, while the overall retail value for apparel and footwear is projected to grow, the retail volume growth is projected to outpace it. As a consequence, the margins of fashion brands will come under pressure as average per item prices continue to fall. (See Exhibit A2.) On a more positive note, the decline in average per item prices appears to be slowing downbe slowing down.
Fashion Companies Face Rising Costs of Raw Materials and Labor – The Base Case
Exhibit A3 provides a detailed overview of the results of the base case projection, including margin assumptions and the magnitude of the individual line items, as well as the CAGRs for the entire period.
Production cost
Selling, General and Administrative Expenses
Material cost
Other Operating Expenses
Factory markup
Logistics & tariff cost
Labor cost [Supplier]
Store occupancy cost
Fabric cost
Indirect labor cost (incl. management)
Labor cost [Brand]
G&A
Accessory
Print / embroidery
Packaging / hang tag
Total Revenues
Gross Profit
EBIT
10,000
5,000 6,535 1.8%
2.0%
1,200 1,162 ∆ = -3.4 ppts
13,522 2.0%
3.5%
916
28%
37%
1%
12%
50%
65%
71%
35%
32%
34%
16%
15%
18%
11%
3%
58%
6%
8%
1,620 3.9%
228
256
399 3.9%
341 2.0%
1.4%
1.6%
2.1%
2.0%
2,059 2,542
1,400 2,360
435
319
87
552
438
118
300 419 2.3%
400 559 2.3%
2.0%
3.0%
2.0%
2,900 3,649 1.5%
3,700 5,238 2.3%
1,280 1,736
1,178 1,823
1,241 1,678
100 135
2015 2030Projected
CAGR1
Exemplary P&L (€ million)Exhibit A3
Op
erat
ing
E
xpen
ses
Co
st o
f G
oo
ds
Sold
Factory running cost
50%
38%
124123 PULSE OF THE FASHION INDUSTRYAPPENDICES

Exhibit A4
The assumptions are based on forecasts from a number of reputable sources as well as BCG triangulations. Exhibit A4 outlines the exact sourc-es used to project the growth by cost buckets and line items as well as the major ingoing assumptions. Line items that are not specifically mentioned in the exhibit are assumed to grow in proportion with total revenues.
CapitalIQ
ILO (2017)
BCG
Oxford Economics (2017)
Clean Clothes Campaign (2014)
Oxford Economics (2017)
UN (2015)
World Bank (2017)
Oxford Economics (2017)
Company Data
Cost of Goods Sold
Production Cost
Material Cost
Selling, General and Administrative Expenses
Financials for selected samplecompanies
Cost breakdown for jeans produced in China, Bangladesh and Cambodia as well as poloshirt and technical t-shirt
BCG estimates for the overall COGS breakdown across countries for an apparel company
Forecast: Real earnings (relative to CPI) for China, India, Turkey, Indonesia and Malaysia Earnings are not specific to the textile industry. Assump-
tion that the growth rate for earnings in the textile industry mirrors the growth across industries in the given countryEarnings are weighted by the number of garment workers in the given country
Used without changes
Averaged with Oxford economics forecast. Input factor for metals proxy for accessories
Averaged with World bank forecast. Input factor for metals proxy for accessories. Deflated by MUV index used by World Bank
Key input factor for polyester proxy. Oil prices are assumed to drive 50% of polyester price.
Deflated by MUV index used by World Bank. The energy mix is estimated to be 50% coal, 25% oil and 25% gas
Earnings are not specific to the textile industry. Assump-tion that the growth rate for earnings in retail sales mirrors the growth across industries in the given countryEarnings are weighted by the population in the given country
Number of garment workers for China, India, Turkey, Indonesia and Malaysia
Forecast (real values): Cotton A Index
Forecast (real values): Aluminum, iron, copper, zinc
Forecast (nominal values): Aluminum, iron, copper, zinc
Forecast: Oil prices (real values)
Forecast: World energy prices (nominal values)
Forecast: Real earnings (relative to CPI) for UK, France, Germany, US, Japan, S. Korea, China, Brazil, Argentina
Population by country for UK, France, Germany, US, Japan, S. Korea, China, Brazil, Argentina
Average across all cases with equal weights
Major P&L line items and margins averaged across sample
SourceP&L topic Description Comment on application
A Number of Sources Contribute to the Estimation and Forecast of the Exemplary P&L – The Base Case
Production cost
Selling, General and Administrative Expenses
Material cost
Other Operating Expenses
Factory markup
Logistics & tariff cost
Labor cost [Supplier]
Store occupancy cost
Fabric cost
Indirect labor cost (incl. management)
Labor cost [Brand]
G&A
Accessory
Print / embroidery
Packaging / hang tag
Total Revenues
Gross Profit
EBIT
10,000
5,000 4,681 -0.4%
2.0%
1,200 -749 ∆ = -17.5 ppts
13,522 2.0%
4.2%
916
28%
37%
1%
12%
50%
65%
71%
35%
32%
34%
16%
15%
18%
11%
3%
58%
6%
8%
1,799 4.6%
228
256
443 4.6%
349 2.2%
4.1%
3.2%
2.4%
2.0%
2,059 3,739
1,400 2,591
435
319
87
700
456
118
300 530 3.9%
400 707 3.9%
2.3%
3.0%
2.0%
2,900 5,012 3.7%
3,700 5,295 2.4%
1,280 1,793
1,178 1,823
1,241 1,678
100 135
2015 2030Projected
CAGR1
Exemplary P&L (€ million)
Exhibit A5
Factory running cost
While the base case projection is built on realistic and conservative estimates, GFA and BCG also calculated the impact on the P&L in the case of high energy, high labor, and high water growth scenarios. Exhibit A5 provides a detailed overview over the high case results, including margin assumptions and the magnitude of the individual line items as well as the CAGRs for the entire period.
Fashion Companies Face Rising Costs of Raw Materials and Labor – The High Case
1. We do not assume the same growth rate for every year in the study, so CAGR represents indication of magnitude over 15 years Source: BCG analysisNote: Differences in sums can occur due to rounding
Op
erat
ing
E
xpen
ses
Co
st o
f G
oo
ds
Sold
50%
38%
126125 PULSE OF THE FASHION INDUSTRYAPPENDICES

U.S. Department of Energy: U.S. Energy Information Adminis-tration (2017)
Werner international Management Consultants (2014)
EDIPTEX (2007)
Clean Clothes Campaign (2014)
World Bank (2017)
BCG (2017)
O'Rouke
Clean Clothes Campaign (2014)
PUMA (2011)
ILO (2017)
Energy
Wages
Water
Forecast (real values): Industrial prices for distillate fuel oil, residual fuel oil, natural gas, metallurgical coal and other industrial coal
Percentage change in hourly wages in USD between 2000 and 2014
Average weight of a t-shirt
MUV inflation index: Unit value index of manufacture exports in US dollar terms for fifteen countries
Water usage in production of 1 kg of cotton
Number of garment workers for China, India, Turkey, Indonesia and Malaysia
Cost to society of water
Average cost of materials in a t-shirt Triangulation of the average cost of materials in a t-shirt
Following Oxford Economics in the base case, the energy mix is estimated to be 50% coal, 25% oil and 25% gas. Oil is defined as the average between distillate fuel oil and residual fuel oil. Coal is defined as the average between metallurgical coal and other industrial oil.
The high wage case is based on a continuation of historical growth of wages in primary textile industry
The average weight of a t-shirt is assumed to be 250 grams
The average MUV inflation index over the period 2015-2030 is used to adjust forecasted growth for inflation
BCB triangulation based on WRAP (2012), Levi Strauss & Co (2015), Velden et. al. (2014), Cotton incoporated (2012) and Skog + Landskap (2014)
Forecasted growth rates are weighted by the number of garment workers in the given country
Pricing the negative externality water is based on the cost to society as measured by PUMA in the company's E-P&L
SourceP&L topic Description Comment on application
Exhibit A6
Exhibit A6 outlines the sources used to project the high cases for each of the chosen high case cost areas. The high energy price and high wage cases are based on year-by-year high case growth rates, modeling the case of high oil prices and the case of continued historical growth in labor cost in the primary textile industry. The high water price case is built on the assumption that in the future, the negative externalities of water to the world economy may be factored into the cotton price, increasing its cost to the exemplary company. This price increase may be the result of regulators introducing a water tax similar to carbon taxes common today in many markets.
A Number of Sources Contribute to the Estimation and Forecast of the Exemplary P&L – The High Case
Factory running cost 36% 39%
23% 65%
27% 60%
37% 42%
36% 40%
78% 98%
78% 98%
23% 24%
27% 28%
23% 36%
Fabric cost
Occupancy cost
Direct labor cost
Fabric cost
Accessories
Accessories
Print / embroidery
Indirect labor cost (incl. management)
Fabric cost
Energy
Wages
Water
Energy contributes 6.1% of the factory running costs, so the effect of the high energy cost has a small impact on this line item
The high energy case impacts the fabric cost is twofold. First, there is an impact on the 9% of cost contributed to energy. Second, there is a large effect through oil on the 55% of costs attributed to the polyester proxy
The high energy case impacts the accessory cost is twofold. First, there is an impact on the 9% of cost contributed to energy. Second, there is a large effect through oil on the 43% of costs attributed to the polyester proxy
Energy contributes 9% of the print/embroidery costs, so the effect of the high energy cost has a small impact on this line item
Energy contributes 9% of the occupancy costs, so the effect of the high energy cost has a small impact on this line item
The high wage case has a large impact on the direct labor cost, which contributes 65% of the production cost
The high wage case has a large impact on the indirect labor cost, which contributes 16% of the production cost
Labor contributes 5% of the fabric costs, so the effect of high wages has a small impact on this line item
Labor contributes 5% of the accessories costs, so the effect of high wages has a small impact on this line item
Pricing in the negative externalities of water through its cost to soci-ety, directly impacts the P&L through the high water usage in cotton production.
Cotton production contributes 31% of fabric cost and, thus, increasing water cost in cotton production has an impact on the cost of raw materials.
Line item impacted Growth: Base case
Absolute growth 2015-2030
Growth: High caseHigh Case Cost Contribution of Impact Factor
Exhibit A7
To make the effect of the high cases on the various line items trans-parent, Exhibit A7 outlines the effect of each case on each line item that is influenced by that cost. The comments outline the share of the cost factors in each line item. Further, the last two columns to the right show the total growth of the line item in the base and high cases, highlighting the mag-nitude of the high cost cases. For instance, the total fabric cost between 2015 and 2030 increases 65% in the high case, up from 23% in the base case. The impact of the high case on the exemplary line item is twofold. First, there is a direct impact on the 9% of fabric cost directly attributed to energy (for example, through the use of spinning machines). Second, there is an indirect impact on the 55% of fabric cost attributed to polyester, as the polyester price closely follows the price of oil.
The High Case Impacts A Number of Line Items on the Exemplary P&L
128127 PULSE OF THE FASHION INDUSTRYAPPENDICES

Base case
3.4
Energy
9.1
Water
2.2
Wages
2.1
Combination Effect
0.8
High case
Wages
Water
Energy
17.5
Factory running cost
Fabric cost
Accessories
Print / embroidery
Occupancy cost
Direct labor cost
Indirect labor cost (incl. management)
Fabric cost
Accessories
Fabric cost
The high case places an additional 14.1 ppts. at risk with the majority of the impact attributed to high energy costs...
...and energy impacting the largest number of line items
In summary, in the high case, the EBIT-margin has 17.5 percentage points at risk until 2030. The increase from the base case of 14.1 percent-age points at risk is contributed by a 9.1 percentage point increase from energy, a 2.1 percentage point increase from wages and a 2.2 percentage point increase from water. The remaining 0.8 percentage points stem from an amplification effect when combining all three high cases. (See Exhibit A8.)
While it is unlikely that the full high case will become reality in the near future, it is not difficult to imagine that a number of input factors will become more expensive as the supply of natural resources becomes increasingly scarce and the cost of labor grows as workers are paid fairer wages.
Exhibit A8 The High Energy Cost Scenario is the Main Driver of Additional EBIT-margin at Risk in the High Case
Source: BCG analysis
130129 PULSE OF THE FASHION INDUSTRYAPPENDICES

ENVIRONMENTAL FOOTPRINT PROJECTION
The projected environmental footprint in 2015 for each impact area builds on the following analysis.
1. Triangulation of the fiber mix in 2015 and the projected fiber mix in 2030 if we continue business as usual
2. Estimation of the environmental footprint from cradle to grave by fiber type
3. Estimation of the total consumption in millions of tons and scal-ing the footprint
In this section, the three steps are examined in more detail.
1: Triangulation of the Fiber Mix in 2015 and the Projected Fiber Mix in 2030 If We Continue Business as Usual
The overall fiber mix for the fashion industry is based on a triangula-tion of, among others, Textile Exchange (2016), Lenzing (2016), Dibdiakova and Timmermann (2014), and CIRFS (2017)2,3,4,5. The fibers were allocated to the following four categories: synthetics/polyester (including other syn-thetic manmade fibers), cotton, viscose (including other cellulosic man-made fibers), and wool.
Through this triangulation, the fiber mix in 2015 is estimated to be 64% synthetics/polyester, 28.5% cotton, 6% viscose/cellulosic fibers, and 1.5% wool. In general across sources and research, the existing forecasts of the shares of wool and viscose are stable across sources, while the approx-imated split between cotton and polyester tend to vary more with a range of 25% to 38% for cotton and 55% to 69% for polyester.
Suggested growth rates for 2015–2020 are 3% to 4% for synthetics/polyester, 1% to 2% for cotton, and 5% to 6% for viscose/cellulosic fibers6,7. It is assumed that, as a natural fiber, wool will grow at the same rate as cotton. Further, growth rates are assumed to remain stable between 2020 and 2030.
By applying the expected growth rates to the triangulated fiber mix in 2015, the fiber mix in 2030 is projected to be composed of 68% syn-thetics/polyester, 22.5% cotton, 8.5% viscose/cellulosic fibers, and 1% wool.
2: Estimation of the Environmental Footprint from Cradle to Grave by Fiber Type
To reflect the differing environmental footprints across fiber types, the footprint is calculated for each impact area for each of the four ma-jor fiber types (synthetics/polyester, cotton, viscose/cellulosic fibers, and wool). The analysis considers the entire value chain from cradle to grave, reflecting the full impact of a given fiber.
The final footprint for each fiber type throughout the value chain is based on a BCG triangulation of, among others, WRAP (2012), van der Velden et al. (2013), and Kirchain et al. (2015)8,9,10,11,12,13,14,15.
Uncertainties are inherent in any type of LCA analysis for the fashion industry. As also emphasized by Thinkstep, there are usually large varia-tions in LCA data. For instance, the results for almost all environmental
B132PULSE OF THE FASHION INDUSTRY

impact categories can vary as much as 60% for cotton at the gin gate, where the cotton is dried, cleaned, and compressed into bales. Further, for both synthetic and cotton fibers in the fabric production phase (from fiber to fabric), the results show a deviation of more than 5016. Additionally, the magnitude of impact of the use phase may be overstated in research, leading to lack of focus on other areas of the value chain. Contrary to this effect, impacts of indirect activities in other phases of the value chain may be overlooked or understated, which again can overemphasize the use phase17.
3: Estimation of Total Consumption in Millions of Tons and Scaling the Footprint
As a final step, the consumption of apparel and footwear in 2015 and 2030 in millions of tons is estimated. The approximation builds on a BCG triangulation of bottom-up and top-down analyses. The bottom-up meth-odology is based on projected consumption of apparel and footwear per capita split by advanced and developing economies18,19,20. The projections are subsequently scaled by population projections21. The top-down meth-odology is based on a BCG triangulation of growth forecasts of retail vol-ume in number of items22 and estimates of the number of items per kg of apparel and footwear.
The result of triangulation across sources and methodologies is con-sumption of 62 million tons in 2015 and 102 million tons in 2030, corre-sponding to total growth of 63% and a CAGR of 3%.
In a final step of the analysis the environmental impact by fiber type is weighted with the projected fiber mix shares to then scale the weighted footprints by total consumption in millions of tons.
ENDNOTES
1 BCG Retail value projection 2015–2030 based on: Euromonitor
International. (2017, January 18). [Apparel and Footwear 2017];
The Economist Intelligence Unit. (2017). [Footwear: Market de-
mand (% real change pa) and Clothing: Market demand (% real
change pa)]; Mintel Group Limited. (2017). [Footwear: Retail mar-
ket value in USD adjusted to 2016 prices]. Forecast using con-
stant 2016 prices and fixed 2016 exchange rates.
2 Dibdiakova, J., & Timmermann, V. (2014). Life cycle assessment
on cotton and viscose fibres for textile production. Norwegian
Forest and Landscape Institute
3 CIRFS (European Man-Made Fibres Association). (2017). World
man-made fibres production. Retrieved April 7, 2017, from http://
www.cirfs.org/keystatistics/worldmanmadefibresproduction.
aspx
4 Textile Exchange. (2016). Preferred Fiber Market Report 2016.
5 Lenzing. (2016). Leading Fiber Innovation - Lenzing Investor
Presentation - Full Year Results 2015.
6 Textile Exchange. (2016). Preferred Fiber Market Report 2016.
7 Lenzing. (2016). Leading Fiber Innovation - Lenzing Investor
Presentation - Full Year Results 2015
8 WRAP. (2012). Valuing Our Clothes: The True Cost Of How We
Design, Use And Dispose Of Clothing In The UK.
9 Levi Strauss & Co. (2015). The life cycle of a jean: understanding
the environmental impact of a pair of Levi’s 501 jeans.
10 Velden, N. M., Patel, M. K., & Vogtländer, J. G. (2013). LCA bench-
marking study on textiles made of cotton, polyester, nylon,
acryl, or elastane. The International Journal of Life Cycle Assess-
ment, 19(2), 331–356.
11 Cotton Incorporated. (2012). Life Cycle Assessment of Cotton
Fiber and Fabric - Full Report.
12 Textile Exchange. (2014). The Life Cycle Assessment of Organic
Cotton Fiber - A Global Average.
13 Dibdiakova, J., & Timmermann, V. (2014). Life cycle assessment
on cotton and viscose fibres for textile production. Norwegian
Forest and Landscape Institute.
14 Kirchain, R., Olivetti, E., Miller, T., & Greene, S. (2015). Sustainable
apparel materials: an overview of what we know and what could
be done about the impact of four major apparel materials: cotton,
polyester, leather, & rubber. Materials Systems Laboratory - Mas-
sachusetts Institute of Technology, Cambridge, MA.
15 Laursen, S. E., Hansen, J., Knudsen, H., Wenzel, H., Larsen, H. F., &
Kristensen, F. M. (2007). EDIPTEX – Environmental assessment of
textiles. The Danish Environmental Protection Agency (Miljøsty-
relsen).
16 Thinkstep. (2017). Hot Spots in the Fiber Mix. Information made
available to BCG by Thinkstep.
17 Cullen, J. M., & Allwood, J. M. (2009). The role of washing ma-
chines in life cycle assessment studies. Journal of Industrial Ecol-
ogy, 13(1), 27–37.
18 Lenzing. (2016). Leading Fiber Innovation - Lenzing Investor
Presentation - Full Year Results 2015.
19 Textile World. (2015, February 03). Man-Made Fibers Continue To
Grow. Retrieved April 7, 2017, from http://www.textileworld.com/
textile-world/fiber-world/2015/02/man-made-fibers-continue-
to-grow/
20 Greenpeace (2016). Timeout for fast fashion.
21 United Nations (2015). Probabilistic population projections based
on the world population prospects: The 2015 revision. Population
Division, DESA.
22 BCG projection of the retail volume of apparel and footwear
2015–2030 based on Euromonitor International. (2017). [Appar-
el and Footwear 2017]; The Economist Intelligence Unit. (2017).
[Footwear: Market demand (% real change pa) and Clothing:
market demand (% real change pa)]; Mintel Group Limited.
(2017). [Footwear: Retail market value in USD adjusted to 2016
prices].
133 APPENDICES 134PULSE OF THE FASHION INDUSTRY

AUTHORS
JONAS EDER-HANSENCHIEF CONTENT OFFICER
GLOBAL FASHION AGENDA
CAROLINE CHALMERCHIEF OPERATING OFFICERGLOBAL FASHION AGENDA
SOFIA TÄRNEBERGCONTENT MANAGER
GLOBAL FASHION AGENDA
THOMAS TOCHTERMANNCHAIRMAN
GLOBAL FASHION AGENDA
JAVIER SEARAPARTNER, GLOBAL LEAD FASHION SECTOR
THE BOSTON CONSULTING GROUP
SEBASTIAN BOGERPRINCIPAL
THE BOSTON CONSULTING GROUP
GABRIELE THEELENPROJECT LEADER
THE BOSTON CONSULTING GROUP
SEBASTIAN SCHWARZCONSULTANT
THE BOSTON CONSULTING GROUP
LISE KRISTENSENCONSULTANT
THE BOSTON CONSULTING GROUP
KRISTINA JÄGERCONSULTANT
THE BOSTON CONSULTING GROUP

GLOBAL FASHION AGENDAFREDERIKSHOLMS KANAL 30-C
1220 COPENHAGEN KDENMARK
WWW.COPENHAGENFASHIONSUMMIT.COM
JONAS [email protected]
CAROLINE [email protected]
THE BOSTON CONSULTING GROUP, INC. ONE BEACON STREET
BOSTON, MA 02108USA
WWW.BCG.COM
JAVIER [email protected]
SEBASTIAN [email protected]
G L O B A L F A S H I O N A G E N D A
GET IN TOUCH
FOR A WORLD BEYOND NEXT SEASON