Pulse 2011 - Effects on Aquatic Life
104
A Report of the Regional Monitoring Program for Water Quality in the San Francisco Estuary pollutant effects on aquatic life pulse of the estuary 2011
-
Upload
san-francisco-estuary-institute -
Category
Documents
-
view
216 -
download
0
Transcript of Pulse 2011 - Effects on Aquatic Life

8/3/2019 Pulse 2011 - Effects on Aquatic Life
http://slidepdf.com/reader/full/pulse-2011-effects-on-aquatic-life 1/104
A Report of the Regional Monitoring Program for Water Quality in the San Francisco Estuary
pollutant effects on aquatic life
pulse of the
estuary
2011
8/3/2019 Pulse 2011 - Effects on Aquatic Life
http://slidepdf.com/reader/full/pulse-2011-effects-on-aquatic-life 2/104
THIS REPORT SHOULD BE CITED AS:San Francisco Estuary Institute (SFEI). 2011. The Pulse of the Estuary: Pollutant Ef fects on Aquatic Life.
SFEI Contribution 660. San Francisco Estuary Institute, Richmond, CA.

8/3/2019 Pulse 2011 - Effects on Aquatic Life
http://slidepdf.com/reader/full/pulse-2011-effects-on-aquatic-life 3/104
A Report of the Regional Monitoring Program for Water Quality in the San Francisco Estuary
2011
pollutant effects on aquatic lifepulse of theestuary

8/3/2019 Pulse 2011 - Effects on Aquatic Life
http://slidepdf.com/reader/full/pulse-2011-effects-on-aquatic-life 4/104
2
overview: pollutant effectson aquatic life
A WILD WORLD AT OUR DOORSTEP
A large part of the magic of San Francisco Bay is the amaz-ing and abundant array of wildlife species that make theirhome right at the doorstep of an urban area supportingseven million people. The Bay supports a diversity of aquatic life, ranging from microscopic plants and animals,to invertebrates like clams and crabs, to fish species large
and small, to the birds and marine mammals at the top of the food chain.
One of the primary goals of Bay water quality managers isto ensure that pollutants do not interfere with the ability of these aquatic species to thrive in Bay waters. In supportof these management efforts, the Regional MonitoringProgram for Water Quality in t he San Francisco Estuary and other programs and projects carefully monitor wheth-er pollutants are affecting aquatic life.

8/3/2019 Pulse 2011 - Effects on Aquatic Life
http://slidepdf.com/reader/full/pulse-2011-effects-on-aquatic-life 5/104
POTENTIAL IMPACTS
OF CHEMICAL POLLUTION
Chemical pollutants can impact Bay aquatic life in many
ways – some more severe, and some more subtle. Someforms of chemical pollution can cause immediate mortal-
ity of aquatic life. Oil spil ls are a vivid example, with their
highly visible impacts on aquatic birds, along with the
less visible impacts on fish (PAGE 72) and invertebrates
beneath the Bay surface.
Discharge of organic waste from sewage into the Bay prior to
the 1970s depleted the oxygen content of the water ( PAGE
51) and made large sh die-o s a common occurrence. In-
vestments in improved wastewater treatment greatly reduced
organic input from this source and sh kills have becomerare. Concern is growing, however, for a possible return of
oxygen depletion due to trends of increasing abundance of
algae in the Bay (PAGE 48). A combination of high concen-
trations of nutrients along with changes in other factors that
a ect algal populations appear to be driving the increase, and
raising the question of whether additional control of nutrient
loads may be needed.
Other pollutants can cause immediate mortality because of
their toxicity to sensitive species. Insecticides, for example,
are designed to kill insects and oen have similar e ects ontheir invertebrate aquatic relatives, and sometimes can be quite
toxic to sh. Pyrethroid insecticides are currently in wide use,
and pose signicant threats to water quality in urban creeks
and are also suspected of possibly playing a role in the decline
of sh species in the Bay and Delta (PAGE 72).
Early life stages of many aquatic species, such as bird embry-
os, sh larvae, and seal pups are particularly vulnerable to the
lethal e ects of pollutants. Methylmercury and PCBs, for ex-
ample, are found in eggs of some Bay birds at concentrations
that are considered likely to cause an increased incidence of
mortality in embryos as they develop (PAGE 78). Early life
stages of sh are also thought to be especially vulnerable to
pollutants such as pesticides, selenium, and PCBs. PCBs and
other synthetic chemical pollutants also reach relatively highconcentrations in seal pups and may pose higher risks during
this life stage (PAGE 91).
Pollutants can also elicit more subtle, sublethal responses that
can still signicantly reduce the viability of populations of sen-
sitive species, and several possible examples of these responses
are suspected in the Bay. Many pollutants can act as endo-
crine disruptors, altering the sensitive systems regulated by
hormone signals. A recent study of the endocrine status of Bay
sh found disruptions of the thyroid and adrenal systems, sug-
gesting an increased risk of impacts on metabolism, growth,
immune function, and reproduction (PAGE 74). Peruorooc-
tane sulfonate (PFOS), a uorine-containing chemical that ac-
cumulates in birds (PAGE 81 and seals (PAGE 96), threatens
to weaken the immune response of these species. Anothertype of sublethal e ect is impairment of sensory abilities. Cop-
per has been shown in laboratory studies to interfere with the
sense of smell in salmon, which can limit their ability to nd
a mate, avoid predators, and to nd their natal stream (PAGE
75). A study is currently underway to evaluate whether this
type of inhibition may be occurring in the Bay. Pollutants can
also have deleterious e ects on behavior. One of the ways in
which methylmercury appears to a ect Forster’s Terns in the
Bay is by reducing the aentiveness of parents, which results in
an increase in the rate of abandoned eggs (PAGE 83).
O V E R V I E W
3
T H E
P U L S E
O F
T H E
E S T U A R
Y 2 0 1 1
Harbor seals and cormorants on Castro Rocks.Photograph by Suzanne Manugian.
Surf Scoters in pursuit of Pacific herring roe. Photograph by Joan Linn Bekins.

8/3/2019 Pulse 2011 - Effects on Aquatic Life
http://slidepdf.com/reader/full/pulse-2011-effects-on-aquatic-life 6/104
OTHER IMPORTANT
FORMS OF POLLUTION
Other forms of pollution also are considered among the
most significant threats to Bay aquatic life. Based on past
experience, exotic species are arguably the greatest threat.
Introductions of exotic species have radically transformed
the species composition o f the Bay, displacing many native
species, and have fundamentally altered the productivity
of the ecosystem. Most of these invasions are essentially
irreversible. Reducing the rate of introductions, however,
appears readily achievable through implementation of state
and federal ballast water discharge regulations.
Trash in the Bay is another form of pollution t hat poses
a continuing threat to aquatic life. Plastic trash threatens
aquatic life through ingestion and entanglement. Largertrash items degrade to tiny f ragments that can have signifi-
cant impacts on small aquatic life through ingestion and
through exposure to pollutants that leach from the plastic
particles. Aggressive new regulatory requirements adopted
in 2010 are expected to significantly reduce the amount of
trash entering the Bay in the next 30 years.
TRACKING PROGRESS
IN MEETING CLEAN
WATER GOALS
A new water quality report card ( PAGE 8) provides an over- view of how well we are doing in providing clean habitat to
support aquatic life in the Bay. e report card also evaluates
progress in making Bay sh safe to eat and in making Bay waters
safe for swimming.anks to a considerable investment in
infrastructure and the diligent e orts of water quality managers,
the Bay is much safer for shing, aquatic life, and swimming
than it was in the 1960s. Substantial control e orts that began
in the 1970s solved most of the obvious problems of the 1960s
and set the Bay on a course for gradual recovery for many
pollutants. However, challenges and uncertainties remain to
respond to many pollutants. Complete and timely resolution of remaining and emerging water quality challenges will require
signicant investments of resources to replace and improve our
aging water quality infrastructure.
THE NEXT PULSE:
EMERGING CONTAMINANTS
In addition to the familiar pollutants that pose threats to
aquatic life, there are thousands of other chemicals used by so-
ciety, including pesticides, industrial chemicals, and chemicalsin consumer products, and many of these make their way from
our homes, businesses, and watersheds into the Bay. Due to in-
adequate screening of the hazards of these chemicals, some may
pose a threat to Bay water quality. As understanding advances,
some of these contaminants emerge as posing signicant risks
to the health of humans and wildlife. e next edition of the
Pulse will focus on the status of these emerging contaminants
in the Bay, and e orts to prevent them from being added to the
toxic legacy that is passed on to f uture generations of humans
and aquatic life that depend upon this productive ecosystem.
4 OVERVIEW
Forster's Tern parent feeding a chick. Photograph by Robert Lewis.
8/3/2019 Pulse 2011 - Effects on Aquatic Life
http://slidepdf.com/reader/full/pulse-2011-effects-on-aquatic-life 7/104
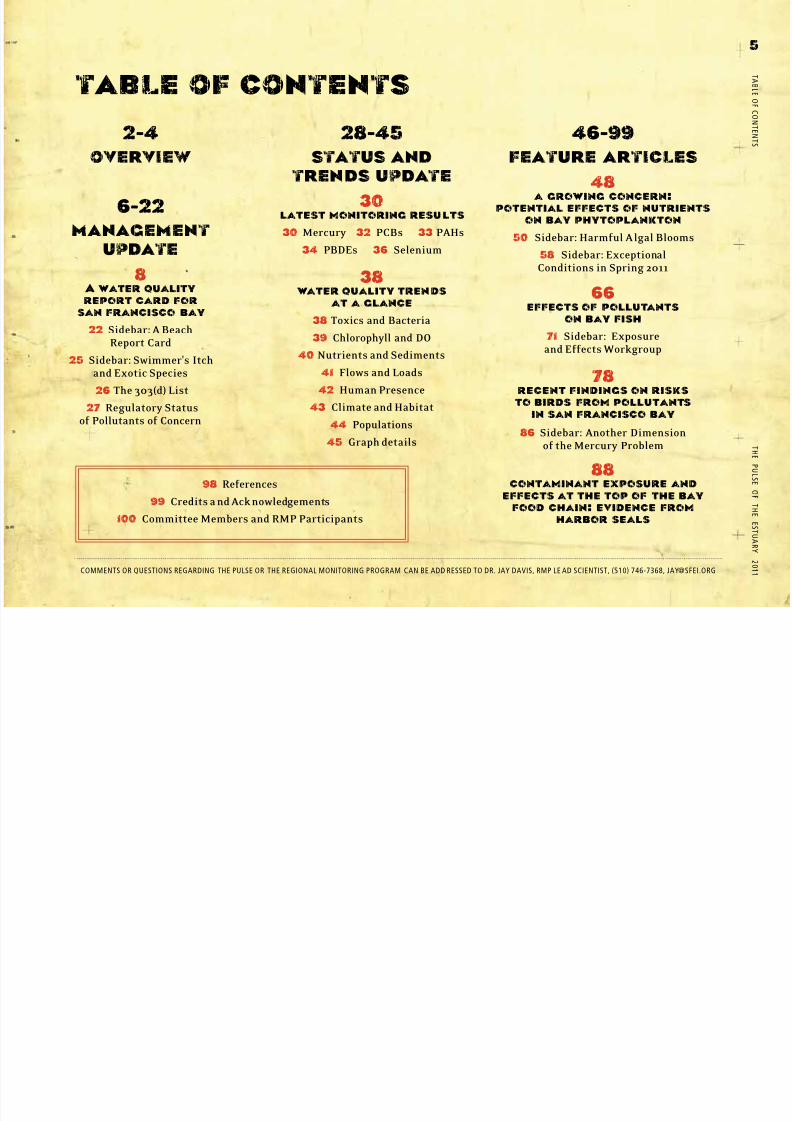
2-4overview
6-22
managementupdate
8 A water qualityreport card for
san francisco bay
22 Sidebar: A BeachReport Card
25 Sidebar: Swimmer's Itchand Exotic Species
26 The 303(d) List
27 Regulatory Statusof Pollutants of Concern
28-45status and
trends update
30 latest monitoring results
30 Mercury 32 PCBs 33 PAHs
34 PBDEs 36 Selenium
38 water quality trends
at a glance
38 Toxics and Bacteria
39 Chlorophyll and DO
40 Nutrients and Sediments
41 Flows and Loads
42 Human Presence
43 Climate and Habitat
44 Populations
45 Graph details
46-99feature articles
48 a growing concern:
potential effects of nutrientson bay phytoplankton
50 Sidebar: Harmful A lgal Blooms
58 Sidebar: ExceptionalConditions in Spring 2011
66
effects of pollutantson bay fish
71 Sidebar: Exposureand Effects Workgroup
78
recent findings on risksto birds from pollutants
in san francisco bay86 Sidebar: Another Dimension
of the Mercury Problem
88
contaminant exposure andeffects at the top of the bay
food chain: evidence fromharbor seals
T A B L E O F C O N T E
N T S
5
T H E
P U L S E
O F
T H E
E S T U A R
Y 2 0 1 1 COMMENTS OR QUESTIONS REGARDING THE PULSE OR THE REGIONAL MONITORING PROGRAM CAN BE ADD RESSED TO DR. JAY DAVIS, RMP LE AD SCIENTIST, (510) 746-7368, [email protected]
table of contents
98 References
99 Credits a nd Acknowledgements
100 Committee Members and RMP Participants

8/3/2019 Pulse 2011 - Effects on Aquatic Life
http://slidepdf.com/reader/full/pulse-2011-effects-on-aquatic-life 8/104
6
managemen

8/3/2019 Pulse 2011 - Effects on Aquatic Life
http://slidepdf.com/reader/full/pulse-2011-effects-on-aquatic-life 9/104
7
update8
a water qualityreport card for
san francisco bay
22 Sidebar: A BeachReport Card
25 Sidebar: Swim mer's Itchand Exotic Species
26 The 303(d) List
27 Regulatory Statusof Pollutants of Concern

8/3/2019 Pulse 2011 - Effects on Aquatic Life
http://slidepdf.com/reader/full/pulse-2011-effects-on-aquatic-life 10/104
Highlights
8 MANAGEMENT UPDATE | WATER QUALITY REPORT CARD
a water quality report cardfor san francisco bay
A new State of the Bay reportsummarizes progress in aainingmanagement goals relating tohabitat, water supply and quality,living resources, ecologicalprocesses, and stewardship
A water quality reportcard is a component of the Report that assesses
whether the Bay is safefor aquatic life, whetherBay sh are safe to eat,
and whether the Bay issafe for swimming
Many monitored pollutantsare considered to pose very low risk to Bay aquaticlife, but a few (especially methylmercury, exoticspecies, the toxicity of sediments, and trash) posesubstantial threats
Fish from the Bay are not
entirely safe to eat, due mainly topolychlorinated biphenyls (PCBs),methylmercury, and dioxins
Most Bay beaches are safe forswimming in the summer, but
bacterial contamination is aconcern at a few beaches in thesummer, and at most beaches in
wet weather
Jay Davis and John Ross, San Francisco Estuary Institute
Mike Kellogg, City and County of San Francisco
Andrew Cohen, Center for Researchon Aquatic Bioinvasions
Andrew Gunther, Center forEcosystem Management and Restoration
highlights
8/3/2019 Pulse 2011 - Effects on Aquatic Life
http://slidepdf.com/reader/full/pulse-2011-effects-on-aquatic-life 11/104
MA N A G E ME N T
U
P D A T E
|
WA T E R Q U A L I T Y R E P O R T C A R D
9
T H E
P U L S E
O F
T H E
E S T U A R
Y 2 0 1 1
WHAT GETS TRACKED
GETS DONE
An ongoing assessment of progress in improving the health
of the Bay is essential. A concise assessment of Bay healthcan communicate the status of this highly valued resource,
and present an accounting of progress in achieving the goal
of protecting the integrity of the Bay. A periodic assessment
of Bay health can also provide a summary of the current
state of knowledge that can be used by scientists and man-
agers as they consider new studies and findings.
The San Francisco Estuary Partnership, a coalition of
resource agencies, non-profit organizations, citizens, and
scientists, has sponsored production of a new State of the
Bay Report ( www.sfestuary.org/StateofSFBay2011/
).
The report summarizes progress in attaining established
management goals relating to the following fundamental
aspects of Bay health:
estuarine open water, watershed);
events); and
management action).
The Partnership plans to prepare State of the Bay reports
on a periodic basis, and to refine and improve the report
with each iteration.
The State of the Bay report is based on the latest and best
available scientific information and is presented in a man-
ner intended to be comprehensible to a broad audience.
Providing all interested parties with an understanding of
“how the Bay is doing” frames the discussion of whether
we are doing enough of the right things to protect the Bay.
The report is intended to encourage and inform thoughtful
discussion about managing and protecting this tremendous
resource, and to support continued efforts by c itizens, pro-
fessionals, and political leaders to protect and enhance themyriad benefits of a healthy and vibrant San Francisco Bay.
THE WATER QUALITY
REPORT CARD
The water quality report card is an i mportant element of
the State of the Bay assessment. Clean water is essential to
the health of the San Francisco Bay ecosystem and to many
of the beneficial uses of the Bay that Bay Area residents en-
joy and depend on. Billions of dollars have been invested in
management of the wastewater and other pollutant sources
that impact Bay water quality, and as a result the Bay is in
much better condition than it was in the 1970s. Inputs of
organic waste and nutrients have been greatly reduced and
no longer cause fish kills or odor problems. Bacterial con-
tamination has also been reduced. Inputs of many toxic pol-
lutants to the Bay have also declined dramatically as a result
of improved wastewater treatment and enforcement of the
Clean Water Act. However, thousands of chemicals are car-
ried into the Bay by society ’s waste streams, and significant
and challenging water quality problems still remain.
The Bay Area is fortunate to have one of the best water
quality monitoring programs in the world, the Regional
Monitoring Program for Water Quality in the San Fran-
cisco Estuary (RMP), to track conditions in the Bay and to
provide the information that water quality managers need
to address the remaining problems. The report card on Bay
water quality is based largely on information generated by
the RMP. Other valuable sources of information are also
available and were considered as well.
The water quality data summarized in the report card were
evaluated using a scheme that takes into account both 1
the distance from the relevant guideline in terms of the es-
timated length of time expected to reach the desired condi-
tion and 2
the severity of the impairment of water quality.
The water quality report card addresses the three main
beneficial uses of the Bay that are affected by water pollu-
tion and protected by the Clean Water Act, answering three
key questions:
Suites of indicators were identified to answer each of these
questions (FIGURE 1).
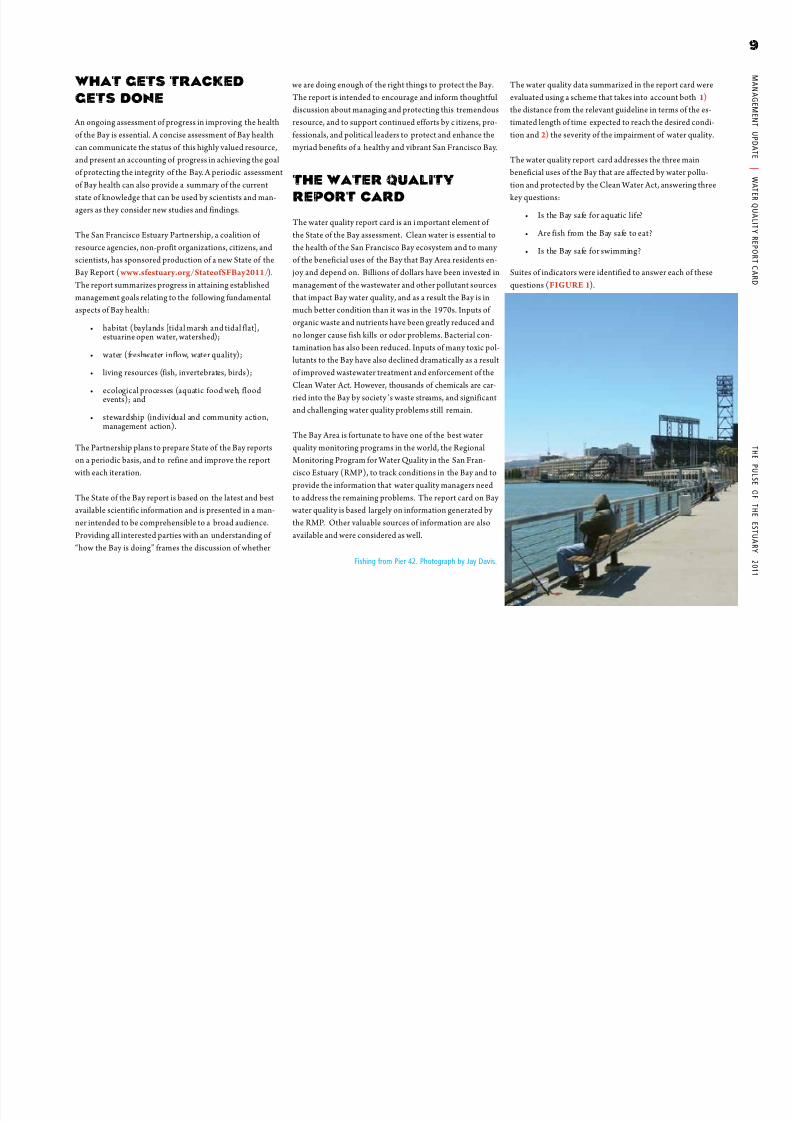
Fishing from Pier 42. Photograph by Jay Davis.

8/3/2019 Pulse 2011 - Effects on Aquatic Life
http://slidepdf.com/reader/full/pulse-2011-effects-on-aquatic-life 12/104
10 MANAGEMENT UPDATE | WATER QUALITY REPORT CARD
Methylmercury
Exotic Species
Sediment Toxicity
Trash
Copper
Dissolved Oxygen
Silver
Other PriorityPollutants
Selenium ?
PAHs ?
PBDEs ?
PFOS ?
EmergingContaminants
?
?
PCBs
Methylmercury
Dioxins
Legacy Pesticides
Selenium
PBDEs
Other PriorityPollutants
EmergingContaminants
Beach Bacteria(April-October)
Beach Bacteria(Wet Weather)
Safe for Aquatic Life Safe to Eat Safe to Swim
FIGURE 1Summary of San Francisco Bay water quality, 2011. e star rat-ings are based on a combination of
the severity of t he problem and theanticipated time needed to aain water quality goals (see FIGURE 2and 5). A ve star rating indicatesthat regulatory goals have been met.Fewer stars indicate varying degreesof distance from regulatory goals.
poor to fair
?
fair
poor
fair to good
good
goals notestablished

8/3/2019 Pulse 2011 - Effects on Aquatic Life
http://slidepdf.com/reader/full/pulse-2011-effects-on-aquatic-life 13/104
MA N A G E ME N T
U
P D A T E
|
WA T E R Q U A L I T Y R E P O R T C A R D
11
T H E
P U L S E
O F
T H E
E S T U A R
Y 2 0 1 1
IS THE BAY SAFE
FOR AQUATIC LIFE?
The “Safe for Aquatic Life” water quality i ndex quanti-
tatively considers five key pollutants, and qualitatively considers many others. This index was compared to goals
set by the State of California f or concentrations of chemical
pollutants in water, methylmercury concentrations in the
food web, and the toxicity of Bay waters and sediments in
laboratory tests. Exotic species and trash are included in
this water quality assessment because they are considered
pollutants subject to provisions of the Clean Water Act.
Enforcement of the Clean Water Act and other environ-
mental laws over the past 39 years has resulted in tremen-
dous improvements in overall Bay water quality, solving
serious threats to aquatic lif e related to reduced dissolved
oxygen and elevated concentrations of silver (FIGURE
2). Many other pollutants are also routinely monitored
and found at concentrations below regulatory goals, and
are considered to pose very low risk to Bay aquatic life.
However, several pollutants still pose a substantial threat
to the health of aquatic life in the Bay. Methylmercury,
exotic species, the toxicity of sediments, and trash are the
principal concerns.
Methylmercury continues to pose significant risks to Bay
wildlife (FIGURE 3). This problem is mainly a legacy of
historic mercury pollution that resulted from gold mining
in the Sierra Nevada and mercury mining in the local Coast
Range. Researchers have concluded that methylmercury
poses a high risk for reducing the hatching and fledging
success of some species of fi sh-eating birds (PAGE 78).
Methylmercury concentrations in the Bay food web have
not changed perceptibly over the past 40 years, and will
probably decline very slowly in the next 30 years. It may
be possible, however, to tackle at least some facets of this
problem. For example, one of the species at greatest risk
in the Bay, the Forster’s Tern, forages primarily in salt
ponds. Agencies that manage these habitats may be able to
manipulate factors, such as water flow through the ponds,
in ways that reduce the production and accumulation of methylmercury.
Exotic species pose the greatest threat to Bay aquatic life
due to their displacement of native species, disruption of
communities and the food chain, and their alteration of
habitat. They also can pose a nuisance for people who swim
in the Bay (SIDEBAR, PAGE 25). Scientists consider
San Francisco Bay to be one of the most highly invaded
estuaries in the world, and the ecological impacts of exotic
species have been immense. Successful invasions by exotic
species are essentially i rreversible. Achievable goals are
best focused on reducing the rate of introductions, which
increased in the late 1900s. Progress on reducing the rate
of introductions is achievable in the near-term. State and
federal ballast discharge regulations could potentially have
a very significant impact on one major vector for exotic
species introductions.
Toxicity of Bay sediments in standard tests is another
indication of possible impacts of pollution on aquatic life
(FIGURE 4). In every year since routine sampling began
in 1993, at least 26% of the sediment samples have been
determined to be toxic. In 2009, 67% of the samples were
found to be toxic. Neither the causes of this toxicity or the
reasons that it is so variable are understood. These results
suggest that pollutant concentrations in Bay sediments may
be high enough to affect the development and survival of
aquatic invertebrates. This problem will p ersist into the
future until the chemicals (or mix of chemicals) causing
this toxicity can be identified and remediated.
Trash in the Bay is also a continuing threat to aquatic life.
Plastic trash persists for hundreds of years in the environ-
ment and threatens wildlife largely through ingestion and
entanglement. Larger trash items degrade to fragments that
can have significant impacts on small aquatic life throughingestion and through exposure to chemical constituents
that leach from the plastic particles or accumulate on them.
Aggressive new regulatory requirements adopted in 2010
should significantly reduce the amount of trash entering
the Bay in the next 30 years.
There are several other pollutants that appear to pose risks
to Bay aquatic life, but for which definitive regulatory
goals for the Bay have not yet been developed. A few of the
most prominent examples include selenium, PAHs, and
perfluorooctanesulfonate (PFOS). Efforts to evaluate these
pollutants and develop appropriate goals are in progress.
Overall, despite great progress in reducing threats to the
health of the Bay's aquatic life, several key pollutants re-
main problematic. Although these pollutants present man-
agement challenges, significant progress appears attainable
in several important areas, including reducing trash inputs
to the Bay, stemming the influx of exotic species, and reduc-
ing methylmercury production in specific habitats.

8/3/2019 Pulse 2011 - Effects on Aquatic Life
http://slidepdf.com/reader/full/pulse-2011-effects-on-aquatic-life 14/104
12 MANAGEMENT UPDATE | WATER QUALITY REPORT CARD
CopperTrashExotic Species Dissolved Oxygen
Silver
Other PriorityPollutants
RapidProgress
Likely
RapidProgress
Unlikely
Sediment ToxicityMethylmercury
HighConcern
ModerateConcern
Low Concern
Goals A ained
FIGURE 2Summary assessment related to t he “safe for aquaticlife” question.e two key dimensions of water quality problems are their severity (degree of concern) and how
quickly t he Bay is anticipated to respond to pollutionprevention actions (whether rapid progress is likely ornot).e assessment scores in FIGURE 1 are based ona combination of these two factors.
poor to fair
?
fair
poor
fair to good
good
goals notestablished

8/3/2019 Pulse 2011 - Effects on Aquatic Life
http://slidepdf.com/reader/full/pulse-2011-effects-on-aquatic-life 15/104
MA N A G E ME N T
U
P D A T E
|
WA T E R Q U A L I T Y R E P O R T C A R D
13
T H E
P U L S E
O F
T H E
E S T U A R
Y 2 0 1 1
0 . 0
0
0 . 0 5
0 . 1
0
0 . 1
5
0 . 2
0
0 . 2
5
2005 2006 2007 2008 2009
0 . 0
0 0
. 0 5
0 . 1
0
0 . 1
5
0 . 2
0
0 . 2
5
M
e t h y l m e r c u r y ( p p m )
M e t h y l m e r c u r y ( p p m )
M e t h y l m e r c u r y ( p p m )
M
e t h y l m e r c u r y ( p p m )
M e t h y l m e r c u r y ( p p m )
2005 2006 2007 2008 2009
0 . 0
0 0
. 0 5
0 . 1
0
0 . 1
5
0 . 2
0
0 . 2
5
2007 2008 2009
0 . 0
0
0 . 0 5
0 . 1
0
0 . 1
5
0 . 2
0
0 . 2
5
2008 2009
0 . 0 0
0 . 0
5
0 . 1
0
0 . 1
5
0 . 2
0
0 . 2
5
2005 2006 2007 2008 2009
Central Bay
San Pablo Bay
Suisun Bay
South Bay
and Lower
South Bay
Lower South Bay
South Bay
Central Bay
San Pablo Bay Suisun Bay
Whole Bay
FIGURE 3 Methylmercury concentrations in smallsh frequently exceed the 0.030 ppm tar-get in the Mercury TMDL for protection
of sh-eating birds. In the most recent sam-pling year, methylmercury concentrationsin prey sh exceeded the 0.03 ppm target inapproximately 95% of the samples collected.Similar results were obtained in 2008, theother year with a larger sample size. Result sfrom a pilot study in 20 05-2007 were lower,
but the distributions for t hose years are basedon a very small sample size. e Bay-wide me-dian concentration in 200 9 was 0.051 ppm.
Footnote: Box plots indicate the 25th, 50th, and 75th percentiles. Data for Mississippi silversides and topsmelt in the3-5 cm size range specified in the Mercury TMDL. The RMP did not specifically target this size range, therefore sample sizes for each year are limited. Reference line is the 0.030 ppm target from the Mercury TMDL.

8/3/2019 Pulse 2011 - Effects on Aquatic Life
http://slidepdf.com/reader/full/pulse-2011-effects-on-aquatic-life 16/104
14 MANAGEMENT UPDATE | WATER QUALITY REPORT CARD
T o x i c S a m p l e s ( % )
1995 20102000 20050
100
10
20
30
40
50
70
80
90
60
0
100
102030
4050
708090
60
1995 20102000 2005
T o x
i c S a m p l e s ( % )
0
100
1020
304050
708090
60
1995 20102000 2005
T o x i c S a m p l e s ( % )
0
100
1020
304050
708090
60
1995 20102000 2005
T o x i c S a m p l e s ( % )
0
100
10
20304050
708090
60
1995 20102000 2005
T o x i c S a m p l e s ( % )
Central Bay
San Pablo Bay
Suisun Bay
South Bay
and Lower
South Bay
Whole Bay
Lower South Bay
South Bay
Central Bay
San Pablo Bay Suisun Bay
FIGURE 4e frequent and continuing toxicity of Bay sediments in standard test s is an im- portant indicator of impacts of pollution
on aquatic life. In every year since routinesampling began in 1993, at least 26% of each
year’s sediment samples have been deter-mined to be toxic . In 2010, 78% of the sam-ples were found to be toxic. e occurrenceof toxic samples is greatest in Suisu n Bay and South Bay. ese results indicate thatpollutant concentrations in Bay sedimentsare high enough to a ect the developmentand survival of aquatic invertebrates. isproblem will persist into the future until thechemicals (or mix of chemicals) causing thistoxicity can be identied and remediated.
Footnote: Percent of Bay sediment samples exhibitingtoxicity in laboratory assays. Sed iment samples aretested in the RMP using amphipods and mussel larvae.

8/3/2019 Pulse 2011 - Effects on Aquatic Life
http://slidepdf.com/reader/full/pulse-2011-effects-on-aquatic-life 17/104
MA N A G E ME N T
U
P D A T E
|
WA T E R Q U A L I T Y R E P O R T C A
R D
15
T H E
P U L S E
O F
T H E
E S T U A R
Y 2 0 1 1
ARE FISH FROM THE BAY
SAFE TO EAT?
e “Safe to Eat” quantitatively considers eight key pollut-
ants, and considers qualitatively the impact of many others.
Pollutant concentrations in sh can be compared to goals
established by the State of California to protect public health.
It is important to note that the comparisons presented in this
assessment are general indications of levels of concern, and are
not intended to represent consumption advice. Consumers can
exercise caution and reduce their exposure to these contami-
nants by following safe eating guidelines for the Bay developed
by the Oce of Environmental Health Hazard Assessment
(OEHHA), which have just been updated this year ( SIDE
BAR, PAGE 16).
Pollutants in fish from the Bay pose a health concern
(FIGURE 5) due mainly to polychlorinated biphenyls
(PCBs) (FIGURE 6), methylmercury (FIGURE 7), and
dioxins, which are generally found in Bay fish at moderate
concentrations. Many other toxic pollutants (e.g., arsenic,
cadmium, chlorpyrifos, diazinon, dieldrin, DDTs, polycy-
clic aromatic hydrocarbons, or “PAHs”, polybrominated
diphenyl ethers, or “PBDEs”, and selenium) are found at
concentrations too low to pose concerns.
Contamination in Bay fish varies by species. Striped bass,
for example, have relatively high concentrations of methyl-
mercury, while jacksmelt are relatively low in this contami-
nant. Shiner surfperch have relatively high concentrations of
PCBs, and California halibut have relatively low concentra-
tions. The safe eating guidelines for the Bay ( SIDEBAR,
PAGE 16) highlight the key differences among species
to allow fish consumers to reduce their exposure. For
example, the guidelines indicate that PCB concentrations
in one group of species – surfperch – are high enough that
OEHHA recommends no consumption.
While moderate contamination is generally found in sh
throughout the Bay, PCBs in shiner surfperch are seen at levels
that pose a greater concern in the Central Bay than in San
Pablo Bay or South Bay (FIGURE 6).is exception to the
paern is due to the tendency of shiner surfperch to spend
their lives in localized nearshore areas, which can result in
greater accumulation when these areas are contaminated with
PCBs.is nding suggests that identifying and cleaning up
contaminated hotspots along the edges of the Bay could hasten
the reduction of contamination at selected locations.
e risk we face today from consuming Bay sh is in large
part a legacy of unregulated discharges of pollutants in the
past. For example, even though a ban on the sale and produc-
tion of PCBs went into e ect in 1979, these persistent chemi-
cals have become thoroughly spread across the Bay watershed
and mixed throughout the Bay, creating a widespread pool
of contamination that will dissipate very slowly. Monitoring
of trends in sh contamination from 1994 to the present has
found no indication of declines for PCBs, methylmercury,
and dioxins. A aining goals for these pollutants in sport sh
will take many decades.
Fishing on Fort Baker Pier.
Photograph by Jay Davis.

8/3/2019 Pulse 2011 - Effects on Aquatic Life
http://slidepdf.com/reader/full/pulse-2011-effects-on-aquatic-life 18/104
16 MANAGEMENT UPDATE | WATER QUALITY REPORT CARD
SIDEBAR
UPDATED FISH
ADVISORY FOR SAN
FRANCISCO BAY
In May 2011 the Oce of Environmental
Health Hazard Assessment (OEHHA)
released an updated health advisory and safe
eating guidelines for sh and shellsh caught
from San Francisco Bay. e guidelines state
that Bay Area anglers should eat a variety
of di erent kinds of sh, avoid sh known
to have high amounts of mercury and other
contaminants, and properly prepare and cook
sh. e advisory also provides special advice
for women of childbearing age and children.
The advisory and guidelines replace an earli-
er 1994 advisory, and draw on over a decade
of more recent data, primarily from the RMP,
showing San Francisco Bay fish contain mer-
cury and polychlorinated biphenyls (PCBs).
They also incorporate nutrition science
showing that fish provide dietary protein and
essential nutrients, including omega-3 fatty
acids that promote heart health and support
neurological development.
Women 18 - 45 and children 1 - 17
ChemicalMeter
ChemicalMeter
Safe to eat
2 servings per week
Do not eatAND
from theLauritzen Channel in
Richmond Inner Harbor
Safe to eat
1 serving per week
OR
California Oce of Environmental Health Hazard Assessment
ChemicalMeter
L o w
M edium
H i g
h
ChemicalMeter
L o w
M edium
H i g
h
ChemicalMeter
L o w
M edium
H i g
h
5-11
= High in Omega-3s
Striped Bass
White sturgeon
Chinook (king) salmon
California halibut
White croaker
Jacksmelt
Shiner perch or other surfperches
Sharks
Red rock crab
Eatonlytheskinless
PCBs are in the fat and skin of
the fish. Cook thoroughly and allow
the juices to drain away.
For crab, eat only the meat.
What is a serving?
For Adults For Children
The recommended serving
thickness of your hand. Give
children smaller servings.
What is the concern?
of PCBs and mercury. PCBsmight cause cancer. Mercury can
develops in unborn babies andchildren. It is especially importantfor women who are pregnantor breastfeeding to follow theseguidelines.
health. Fish have Omega-3s thatcan reduce your risk for heartdisease and improve how thebrain develops in unborn babiesand children.
Jacksmelt photo: Kirk Lombard, CaliforniaHalibut: JohnShelton
8/3/2019 Pulse 2011 - Effects on Aquatic Life
http://slidepdf.com/reader/full/pulse-2011-effects-on-aquatic-life 19/104
MA N A G E ME N T
U
P D A T E
|
WA T E R Q U A L I T Y R E P O R T C A
R D
17
T H E
P U L S E
O F
T H E
E S T U A R Y
2 0 1 1
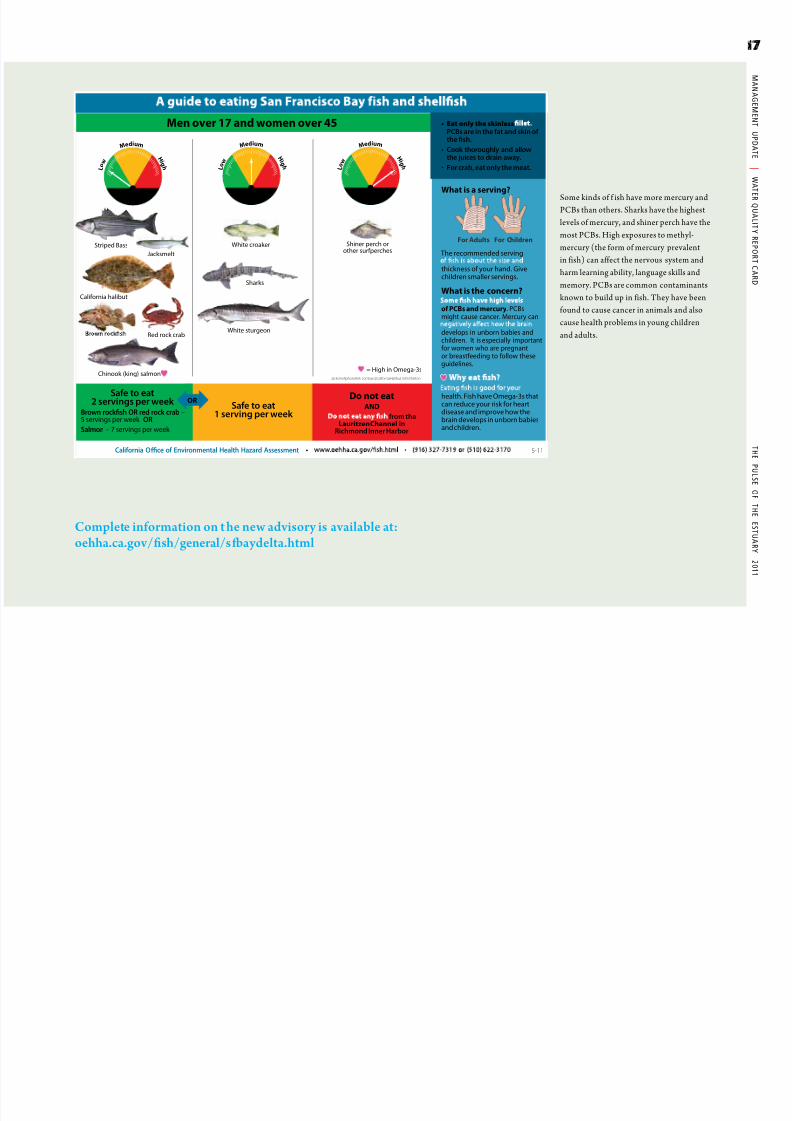
Some kinds of f ish have more mercury and
PCBs than others. Sharks have the highest
levels of mercury, and shiner perch have the
most PCBs. High exposures to methyl-
mercury (the form of mercury prevalent
in fish) can affect the nervous system and
harm learning ability, language skills and
memory. PCBs are common contaminants
known to build up in fish. They have been
found to cause cancer in animals and also
cause health problems in young children
and adults.
Complete information on t he new advisory is available at:oehha.ca.gov/sh/general/saydelta.html
Jacksmelt
Men over 17 and women over 45
ChemicalMeter
ChemicalMeter
Safe to eat2 servings per week
Brown rockfish OR red rock crab –5 servings per week OR
Salmon – 7 servings per week
Do not eatAND
from theLauritzen Channel in
Richmond Inner Harbor
Safe to eat
1 serving per week
OR
California Oce of Environmental Health Hazard Assessment
ChemicalMeter
L o w
M edium
H i g
h
ChemicalMeter
L o w
M edium
H i g
h
ChemicalMeter
L o w
M edium
H i g
h
5-11
= High in Omega-3s
White sturgeonRed rock crab
White croakerStriped Bass
California halibut
Shiner perch orother surfperches
Chinook (king) salmon
Sharks
Eatonlytheskinless
PCBs are in the fat and skin of
the fish. Cook thoroughly and allow
the juices to drain away.
For crab, eat only the meat.
What is a serving?
For Adults For Children
The recommended serving
thickness of your hand. Give
children smaller servings.
What is the concern?
of PCBs and mercury. PCBsmight cause cancer. Mercury can
develops in unborn babies andchildren. It is especially importantfor women who are pregnantor breastfeeding to follow theseguidelines.
health. Fish have Omega-3s thatcan reduce your risk for heartdisease and improve how thebrain develops in unborn babiesand children.
Jacksmelt photo: Kirk Lombard, CaliforniaHalibut: JohnShelton
8/3/2019 Pulse 2011 - Effects on Aquatic Life
http://slidepdf.com/reader/full/pulse-2011-effects-on-aquatic-life 20/104
18 MANAGEMENT UPDATE | WATER QUALITY REPORT CARD
RapidProgress
Likely
RapidProgress
Unlikely
MethylmercuryDioxins*
PCBs
HighConcern
ModerateConcern
Low Concern
Goals A ained
DDT
Dieldrin
Chlordane
Selenium
PBDEs
Other PriorityPollutants
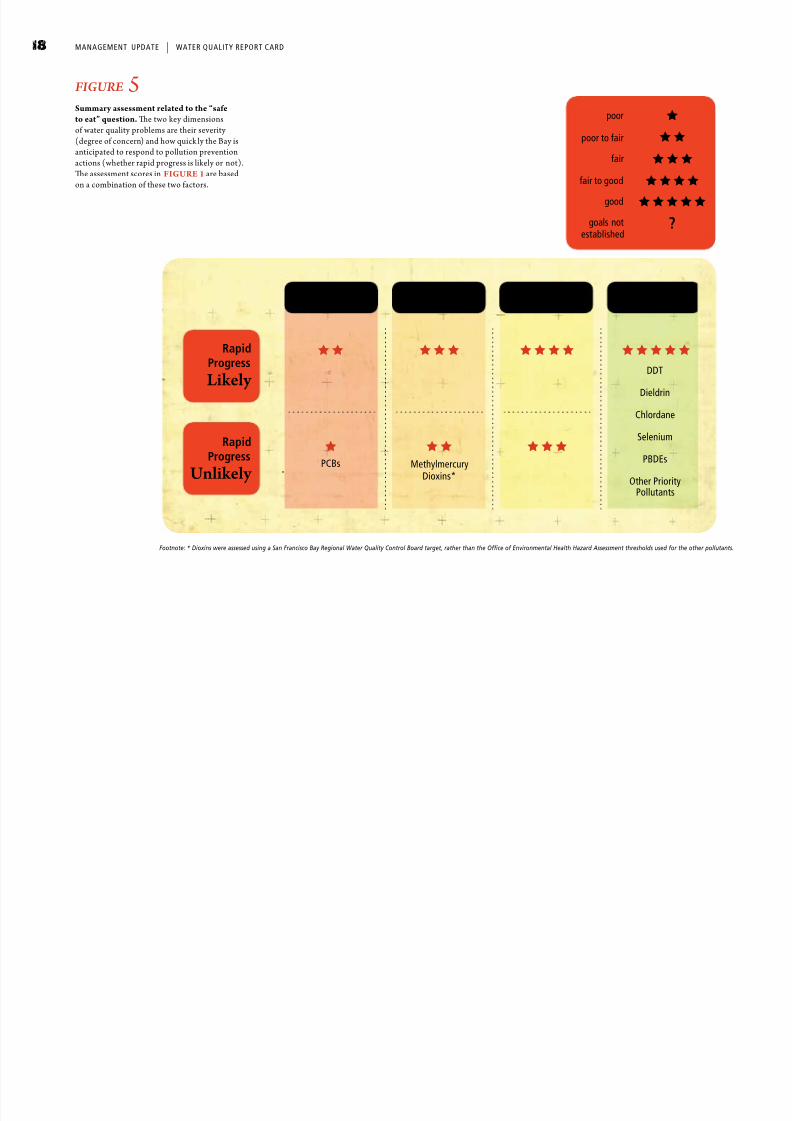
FIGURE 5Summary assessment related to the “safeto eat” question. e two key dimensionsof water quality problems are their severity
(degree of concern) and how quick ly the Bay isanticipated to respond to pollution preventionactions (whether rapid progress is likely or not).e assessment scores in FIGURE 1 are basedon a combination of these two factors.
Footnote: * Dioxins were assessed using a San Francisco Bay Regional Water Quality Control Board target, rather than the Office of Environmental Health Hazard Assessment thresholds used for the other pollutants.
poor to fair
?
fair
poor
fair to good
good
goals notestablished

8/3/2019 Pulse 2011 - Effects on Aquatic Life
http://slidepdf.com/reader/full/pulse-2011-effects-on-aquatic-life 21/104
MA N A G E ME N T
U
P D A T E
|
WA T E R Q U A L I T Y R E P O R T C A
R D
19
T H E
P U L S E
O F
T H E
E S T U A R Y
2 0 1 1
1994 1997 2000 2003 2006 20090
50
150100
200250300
400350
450500
1994
050
150100
200
200
250300
400
350
450500
1997 2000 2003 2006 2009
P C B s ( p p b )
P C B s ( p p b )
P C B s ( p p b )
1994 1997 2000 2003 2006 2009
050
150100
250300
400350
450500
P C B s
( p p b )
1994 1997 2000 2003 2006 2009
0
50
150
100
200
250
300
400
350
450
500
120
21
120
21
120
21
120
21
Shiner Surfperch White Croaker
Central Bay
San Pablo Bay
South Bay
and Lower
South Bay
Whole Bay
Lower South Bay
South Bay
Central Bay
S an Pablo Bay Suisun Bay
OEHHA no consumption threshold
OEHHA 2 meal/wk threshold
FIGURE 6In the most recent sampling year (200 9), both of the PCB indicator species (shinersurfperch and white croaker) had average
concentrations between 21 ppb and 120 ppb. e Bay-wide average for shiner surfperch in2009 (118 ppb) was just below OEHHA's 120ppb no-consumption threshold. Based on thislong-term dataset, the recently updated safeeating guidelines for San Francisco Bay recom-mend no consumption of shiner surfperch andother surfperch species. is corresponds tothe “high concern” category in Figure 5. Noclear paern of long-term decline in PCB con-centrations has been evident in these species.e summary rating for PCBs in Bay sport shis therefore one star.
Footnote: Average PCB concentrations in sport fish indicator species.Sport fish are not routinely sampled in Suisun Bay. The no consumptionadvisory tissue level for PCBs is 120 ppb, and the two serving advisory tissue level is 21 ppb. White croaker were analyzed without skin in 2009, and with skin in previous years. Removing the skin reduced concentrations by 65% in 2009.

8/3/2019 Pulse 2011 - Effects on Aquatic Life
http://slidepdf.com/reader/full/pulse-2011-effects-on-aquatic-life 22/104
20 MANAGEMENT UPDATE | WATER QUALITY REPORT CARD
FIGURE 7 e methylmercury indicator speciessampled in 2009 had average concentrations between 0.44 ppm (striped bass) and 0.08
ppm (jacksmelt). Concentrations in thesespecies in recent years mostly fell between theno consumption advisory tissue level of 0.44ppm and the two serving per week advisory tissue level of 0.07 ppm; this corresponds tothe “moderate concern” category in FIGURE5. Methylmercury concentrations in the Bay food web have not changed perceptibly over thepast 40 years, and it is not anticipated that they
will decline signicantly in the next 30 years.e summary rating for methylmercury in Bay sport sh is therefore two stars.
1 99 4 1 99 7 2 00 0 2 00 3 2 0 06 2 00 9
0.0
0.1
0.3
0.2
0.4
0.5
0.6
0.7
M e t h y l m e r c u r y ( p p m )
1994
0.0
0.1
0.3
0.2
0.4
0.5
0.6
0.7
M e t h y l m e r c u r y ( p p m )
1 99 7 2 00 0 2 00 3 2 0 06 2 00 9
1 99 4 1 99 7 2 00 0 2 00 3 2 0 06 2 00 9
0.0
0.1
0.3
0.2
0.4
0.5
0.6
0.7
M e t h y l m e r c u r y ( p p m )
1994 1997 2000 2003 2006 2009
0.0
0.1
0.3
0.2
0.4
0.5
0.6
0.7
M e t h y l m e r c u r y ( p p m )
0.44
0.07
0.44
0.07
0.44
0.07
0.44
0.07
White SturgeonJacksmelt
California Halibut
Striped Bass
White Croaker
Central Bay
San Pablo Bay
South Bay
and Lower
South Bay
Whole Bay
Lower South Bay
South Bay
Central Bay
San Pablo Bay Suisun Bay
OEHHA no consumption threshold
OEHHA 2 meal/wk threshold
Footnote: Average mercury concentrations in sport fish indicator species. Averages for striped bass based on concentrations for individual fishnormalized to 60 cm. Ave rages for other species based on composite samples. Sport fish are not routinely sampled in Suisun Bay. The noconsumption advisory tissue level for mercury is 0.44 ppm, and the two serving advisory tissue level is 0.07 ppm.

8/3/2019 Pulse 2011 - Effects on Aquatic Life
http://slidepdf.com/reader/full/pulse-2011-effects-on-aquatic-life 23/104
MA N A G E ME N T
U
P D A T E
|
WA T E R Q U A L I T Y R E P O R T C A
R D
21
T H E
P U L S E
O F
T H E
E S T U A R Y
2 0 1 1
IS THE BAY SAFE
FOR SWIMMING?The “Safe to Swim” water quality index is based on mea-
surements of bacteria in water at popular Bay beaches. To
protect beach users from exposure to fecal contamination,
California has adopted standards for high use beaches
that apply from April through October at beaches that are
adjacent to a storm drain that flows in the summer. Heal the
Bay, a Santa Monica-based non-profit, provides compre-
hensive evaluations of over 400 California bathing beaches
in both Annual and Summer Beach Report Cards as a guide
to aid beach users’ decisions concerning water contact rec-
reation (SIDEBAR, PAGE 22). Overall, the latest beach
report card covering the summer of 2010 indicates that
most Bay beaches are safe for swimming in the summer, but
that bacterial contamination is a concern at a few beaches
in the summer, and at most beaches in wet weather.
The frequency of beach closures is another informative
metric for evaluating how safe the Bay is for swimming
(FIGURE 8). Based upon the number of days beaches
were closed or posted by counties with advisories warning
against water contact recreation, Bay beaches were open
80% to 100% of the t ime during the prime beach season of
April through October from 2006 through 2010.
A variety of approaches can be taken to make the Bay safer
for swimming. Sanitary surveys can be conducted to identify
and mitigate contamination sources where possible. Low
impact design installations may be possible at some sites
to retain and treat stormwater before it reaches beaches.
Diversion of storm water away from bathing beaches where
possible may provide another solution. Repair and replace-
ment of defective and aging sanitary sewer systems will be
necessary in many instances before human fecal sources are
considered controlled.
A STEP FORWARD
anks to considerable investment in infra-
structure and the diligent e orts of water
quality managers, the Bay is much safer for
shing, aquatic life, and swimming than it was
in the 1960s. Substantial control e orts that
began in the 1970s, in response to provisions
of the 1972 Clean Water Act, solved most of
the obvious problems of the 1960s and set the
Bay on a course for gradual recovery for many
pollutants.e general pace of water quality
improvement, however, has slowed in the past
three decades, due primarily to a lack of major
new initiatives to control inputs to the Bay
and the naturally decelerating trajectory of re-
covery dictated by the dynamics of sediment
mixing in the ecosystem.
Preventing the entry of problematic pollut-
ants into this vulnerable ecosystem is the
ideal way to protect Bay water quality. We
use thousands of chemicals in our homes and
businesses, including pesticides, indus-
trial chemicals, and chemicals in consumer
products, and many of these enter the Bay. A
lack of information on the chemicals present
in commercial products, their movement in
the environment, and their toxicity hinders
e orts to track and manage the risk posed
to people and aquatic life by these emerging
contaminants. Numeric goals to assess our environmental
measurements for emerging contaminants are not yet avail-
able, but should be part of future assessments of Bay health.
e occurrence of emerging contaminants also underscores
the importance of “green chemistry” e orts to prevent poten-
tially problematic chemicals from entering the Bay in the rst
place so that they do not become additional legacies of health
risk for future generations of Bay and Bay Area residents.
is summary of Bay water quality highlights several pollut-
ants that continue to pose substantial water quality concerns,
and facets of these problems where progress seems aain-
able. Hopefully this summary will serve as a step forward
in e ective communication of progress in achieving water
quality goals and a foundation for future improvements in
reporting and management of Bay water quality.
Photograph courtesy of Swim Across America, raising money and awarenessfor cancer research, prevention and treatment: www.swimacrossamerica.org
8/3/2019 Pulse 2011 - Effects on Aquatic Life
http://slidepdf.com/reader/full/pulse-2011-effects-on-aquatic-life 24/104
22 MANAGEMENT UPDATE | WATER QUALITY REPORT CARD
SunnydaleCove
Windsurfer Circle
JackrabbitBeach
AquaticPark
Coyote Point
KiteboardBeach
LakeshorePark
Oyster Point
North
South
Shoreline Drive
Bath House
Bird Sanctuary
Sunset Road
Windsurf Corner
SchoonmakerBeach
ParadiseCove
China Camp
McNears Beach
0 3 6 Miles
North
KellerBeach
Mid-Beach
South
NortheastNorthwest
Southwest
Hyde Street Pier
West
East
Mid-Beach
Baker Cove
Crissy Field
Aquatic Park Beach
Aquatic Park
KellerBeach
Baker Cove
Crissy Field
EncinalBeach
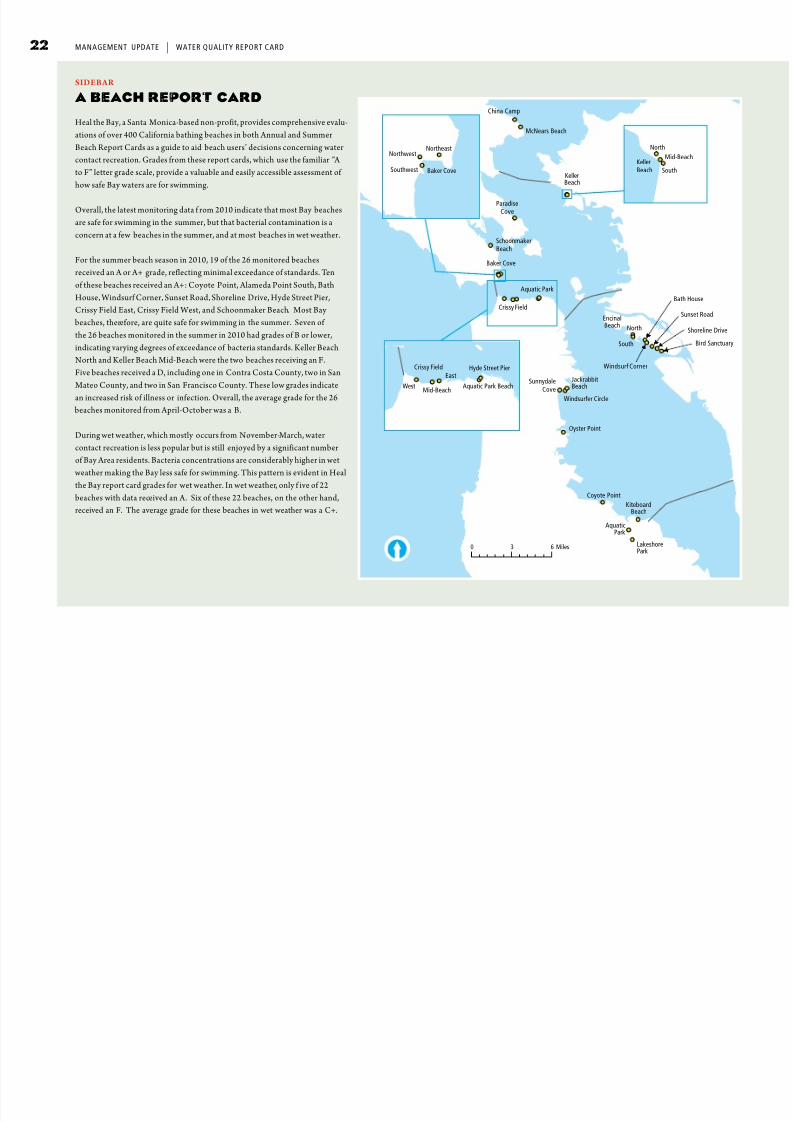
SIDEBAR
A BEACH REPORT CARD
Heal the Bay, a Santa Monica-based non-profit, provides comprehensive evalu-
ations of over 400 California bathing beaches in both Annual and Summer
Beach Report Cards as a guide to aid beach users’ decisions concerning water
contact recreation. Grades from these report cards, which use the familiar “A
to F” letter grade scale, provide a valuable and easily accessible assessment of
how safe Bay waters are for swimming.
Overall, the latest monitoring data f rom 2010 indicate that most Bay beaches
are safe for swimming in the summer, but that bacterial contamination is a
concern at a few beaches in the summer, and at most beaches in wet weather.
For the summer beach season in 2010, 19 of the 26 monitored beaches
received an A or A+ grade, reflecting minimal exceedance of standards. Ten
of these beaches received an A+: Coyote Point, Alameda Point South, Bath
House, Windsurf Corner, Sunset Road, Shoreline Drive, Hyde Street Pier,
Crissy Field East, Crissy Field West, and Schoonmaker Beach. Most Bay
beaches, therefore, are quite safe for swimming in the summer. Seven of
the 26 beaches monitored in the summer in 2010 had grades of B or lower,
indicating varying degrees of exceedance of bacteria standards. Keller Beach
North and Keller Beach Mid-Beach were the two beaches receiving an F.
Five beaches received a D, including one in Contra Costa County, two in San
Mateo County, and two in San Francisco County. These low grades indicate
an increased risk of illness or infection. Overall, the average grade for the 26
beaches monitored from April-October was a B.
During wet weather, which mostly occurs from November-March, water
contact recreation is less popular but is still enjoyed by a significant number
of Bay Area residents. Bacteria concentrations are considerably higher in wet
weather making the Bay less safe for swimming. This pattern is evident in Heal
the Bay report card grades for wet weather. In wet weather, only f ive of 22
beaches with data received an A. Six of these 22 beaches, on the other hand,
received an F. The average grade for these beaches in wet weather was a C+.

8/3/2019 Pulse 2011 - Effects on Aquatic Life
http://slidepdf.com/reader/full/pulse-2011-effects-on-aquatic-life 25/104
MA N A G E ME N T
U
P D A T E
|
WA T E R Q U A L I T Y R E P O R T C A
R D
23
T H E
P U L S E
O F
T H E
E S T U A R Y
2 0 1 1
ALAMEDA COUNTY
website: www.ebparks.org/stewardship/water
hotline: 510-567-6706 (Crown Beach)
CONTRA COSTA COUNTY
website: www.ebparks.org/stewardship/water
CITY AND COUNTY OF SAN FRANCISCO
website: http://beaches.sfwater.org
hotline: 415-242-2214 or 1-877-SFBEACH(732-3224) toll free
MARIN COUNTY
website: www.co.marin.ca.us/ehs/water/beach_monitoring.cfm
hot line : 415-473-2335
SAN MATEO COUNTY
website: www.smhealth.org/environ/beaches
hot line : 650-599-1266
HEAL THE BAY BEACH REPORT CARDS
website: www.beachreportcard.org
CALIFORNIA SAFE TO SWIM WEB PORTAL
website: www.waterboards.ca.gov/mywaterquality/safe_to_swim
CALIFORNIA BEACH WATER QUALITYINFORMATION PAGE
website: www.swrcb.ca.gov/water_issues/programs/beaches/beach_water_quality/index.shtml
SOURCES OF INFORMATION
ON BACTERIA MONITORING
AT BAY BEACHES
HEAL THE BAY ANNUAL BEACH REPORT CARD GRADES
A PR IL - OCTOBER DRY W EATH ER , Y EA R-ROU ND W ET W EAT HER , Y EA R-ROU ND
2006 2007 2008 2009 2010 2006 -07 2007 -08 2008 -09 2009 -10 2010 -11 2006 -07 2007 -08 2008 -09 2009 -10 2010 -11
SAN MATEO COUNTY
Oyster Point A A B A A A A C F D
Coyote Point A A+ A+ A+ A A A+ A B C
Aquatic Park A B F D B F D F F F
Lakeshore Park A D D D C D D F F F
Kiteboard Beach B A F
ALAMEDA COUNTY
Alameda Point North A A+ A A A+ A A+ A C
Alameda Point South A A A+ A A A A+ A A
Crown Beach Bath House A A B A+ A C B A+ C A+ A A
Crown Beach Windsurf Corner A A A A+ A A A A+ A A+ B B
Crown Beach Sunset Road A A+ A A+ A A A A+ F A B B
Crown Beach Shoreline Drive A A A+ A+ A A A A F A+ C B
Crown Beach Bird Sanctuary A A B A C A B A F B D C
CONTRA COSTA COUNTYKeller Beach North B F D F B D D F A A B A
Keller Beach Mid-Beach B C D F B C D F B B B A
Keller Beach South A C D D A C D D A B C B
SAN FRANCISCO COUNTY
Crissy Field Beach West A+ A+ A+ A+ A+ A A C B
Crissy Field mid-Beach A A+ A A+ B A
Crissy field Beach East A A A A A+ C A B A B D A B B C
Aquatic Park Beach A B A A A A C B A B B A C A B
Hyde Street Pier A A A A+ A+ A A A A A A A A+ A A
Jackrabbit Beach A A A A A A A A A A A F D C B
CPSRA Windsurfer Circle A A A A D A A B A F F F F F F
Sunnydale Cove A A A B D A C A C C F F F F F
MARIN COUNTY
Horseshoe Cove NE A A A A+ A
Horseshoe Cove NW A B A A A
Horseshoe Cove SW A A A A A
Schoonmaker Beach A A+ A+ A A+
Paradise Cove A A A+
China Camp D A+ A+ A A
McNears Beach C A A
OVERALL GPA 3.64 3.88 3.61 3.30 3.23 3.71 3.44 3.31 3.12 2.91 2.14 2.05 3.11 2.14 2.38
OVERALL GRADE B+ A- B+ B B A- B+ B+ B B- C C B C C+
(year-round = April 1 - March 31)

8/3/2019 Pulse 2011 - Effects on Aquatic Life
http://slidepdf.com/reader/full/pulse-2011-effects-on-aquatic-life 26/104
24 MANAGEMENT UPDATE | WATER QUALITY REPORT CARD
East
Crissy Field Aquatic Park Candlestick
Point S
n=175Hyde Street Pier
n=166
mid-Beach*n=65
Beachn=170
Jackrabbit Beachn=172
Windsurfer Circlen=193
West*n=96
Sunnydale Coven=183
% Days Posted
% Days Not Posted
98.0%
99.3%
2.0%
97.9%
2.1%
98.6%
1.4%
99.1%
98.9%
1.1%0.7%
99.2%
0.8%
0.9%
96.2%
3.8%
Footnote: Percent of days during the prime beach season (April - October) that City and County of San Franciscobeaches were posted and not posted due to possible fecal contamination from 2006 through 2010 (n=number of samples). Crissy Field mid-Beach sampled 2006-2007 and Crissy Field West sampled 2008-2010.
FIGURE 8County public health and other agencies routinely monitor bacteria concentrations at Bay beaches
where water contact recreation is common and provide warnings to t he public when concentra-tions exceed the standards. e county monitoringdata represent the longest-term data set from the mostlocations in the Bay with which to eva luate the ques-number of days beaches were closed or posted w ithadvisories warning against water contact recreation,Bay beaches were open 80% to 100% of the ti me dur-ing the prime beach season of April through Octoberfrom 2006 through 2010. Data for San Francisco
beaches are shown here as an example.
Swimmer at Aquatic Park Beach. Photograph by Jay Davis.
8/3/2019 Pulse 2011 - Effects on Aquatic Life
http://slidepdf.com/reader/full/pulse-2011-effects-on-aquatic-life 27/104
MA N A G E ME N T
U
P D A T E
|
WA T E R Q U A L I T Y R E P O R T C A
R D
25
T H E
P U L S E
O F
T H E
E S T U A R Y
2 0 1 1
SIDEBAR
SWIMMER’S ITCH AND EXOTIC SPECIES
Exotic species, one of the greatest threats to aquatic life in the Bay, also pose a nuisance for people
who swim in the Bay. Swimmer’s itch, common in some freshwater ponds and lakes, is caused
when a parasitic flatworm that normally develops in a water snail and then burrows through the
skin and into the circulatory system of a water bird (where it matures and mates) instead burrows
into a human swimmer or wader. Symptoms are similar to those caused by exposure to poison
oak, with an itchy, red rash that can last for weeks. It is generally unknown in Pacific coastal waters
except for a few outbreaks associated with exotic organisms.
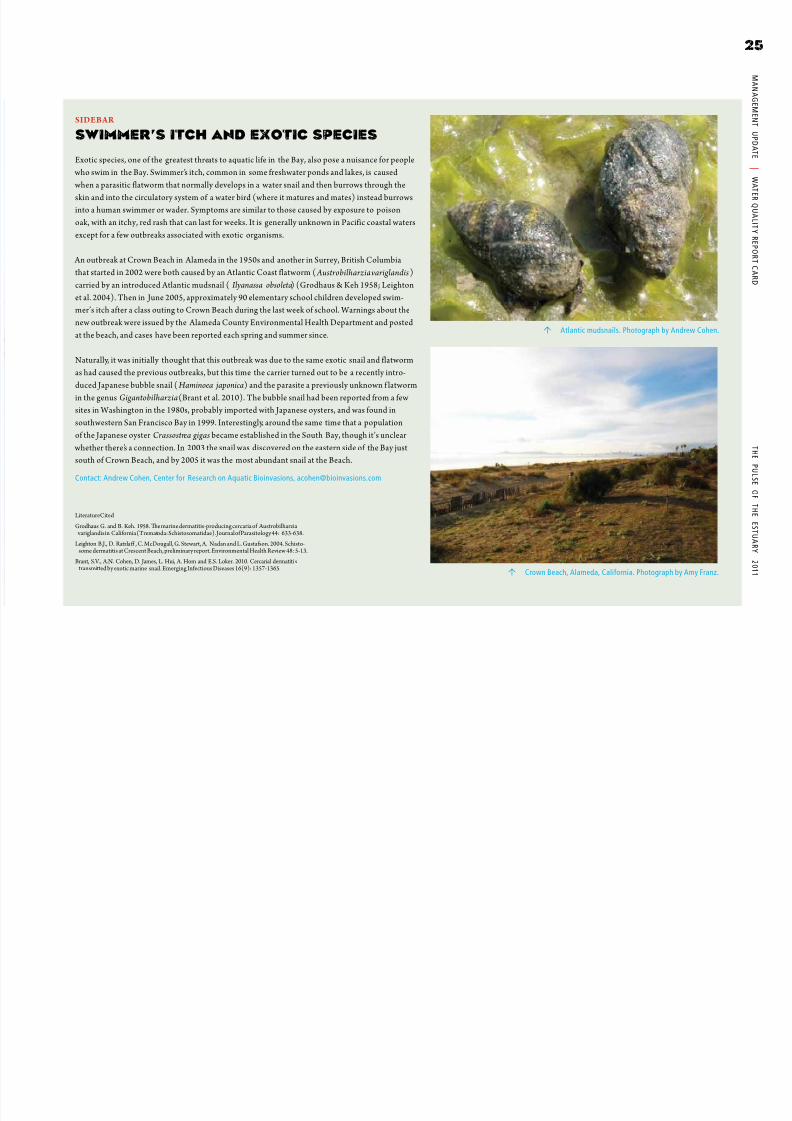
An outbreak at Crown Beach in Alameda in the 1950s and another in Surrey, British Columbia
that started in 2002 were both caused by an Atlantic Coast flatworm ( Austrobilharzia variglandis )
carried by an introduced Atlantic mudsnail ( Ilyanassa obsoleta) (Grodhaus & Keh 1958; Leighton
et al. 2004). Then in June 2005, approximately 90 elementary school children developed swim-
mer’s itch after a class outing to Crown Beach during the last week of school. Warnings about the
new outbreak were issued by the Alameda County Environmental Health Department and posted
at the beach, and cases have been reported each spring and summer since.
Naturally, it was initially thought that this outbreak was due to the same exotic snail and flatworm
as had caused the previous outbreaks, but this time the carrier turned out to be a recently intro-
duced Japanese bubble snail (Haminoea japonica) and the parasite a previously unknown f latworm
in the genus Gigantobilharzia (Brant et al. 2010). The bubble snail had been reported from a few
sites in Washington in the 1980s, probably imported with Japanese oysters, and was found in
southwestern San Francisco Bay in 1999. Interestingly, around the same time that a population
of the Japanese oyster Crassostrea gigas became established in the South Bay, though it’s unclear
whether there’s a connection. In 2003 the snail was discovered on the eastern side of the Bay just
south of Crown Beach, and by 2005 it was the most abundant snail at the Beach.
Contact: Andrew Cohen, Center for Research on Aquatic Bioinvasions, [email protected]
Literature Cited
Grodhaus G. and B. Keh. 1958. e marine dermatitis-producing cercaria of Austrobilharzia variglandis in California (Trematoda: Schistosomatidae). Journal of Parasitology 44: 633-638.
Leighton B.J., D. Ratzla , C. McDougall, G. Stewart, A. Nadan and L. Gustafson. 2004. Schisto-some dermatitis at Crescent Beach, preliminary report. Environmental Health Review 48: 5-13.
Brant, S.V., A.N. Cohen, D. James, L. Hui, A. Hom and E.S. Loker. 2010. Cercarial dermatiti stransmied by exotic marine snail. Emerging Infectious Diseases 16(9): 1357-1365.
Atlantic mudsnails. Photograph by Andrew Cohen.
Crown Beach, Alameda, California. Photograph by Amy Franz.
8/3/2019 Pulse 2011 - Effects on Aquatic Life
http://slidepdf.com/reader/full/pulse-2011-effects-on-aquatic-life 28/104

8/3/2019 Pulse 2011 - Effects on Aquatic Life
http://slidepdf.com/reader/full/pulse-2011-effects-on-aquatic-life 29/104
MA N A G E ME N T
U
P D A T E
|
WA T E R Q U A L I T Y R E P O R T C A
R D
27
T H E
P U L S E
O F
T H E
E S T U A R Y
2 0 1 1 Ducks in San Leandro Bay. Photograph by Jay Davis.
POLLUTANT STATUS
Copper Site-specic objectives approved for entire Bay
San Francisco Bay removed from 303(d) List in 2 002
Dioxins / Furans TMDL in early development stage
Legacy Pesticides (Chlordane,Dieldrin,and DDT)
Under consideration for delisting
Mercury Bay TMDL and site-speci c objectives approved in 2008
Guadalupe River Watershed TM DL approved in 2010
Pathogens Richardson Bay TMDL adopted in 2008
Bay beaches (Aquatic Park, Candlestick Point, China Camp,and Crissy Field) added to 303(d) List in 2006
PCBs TMDL approved in 2009
Selenium TMDL in development – completion projected for 2013
Trash Central and South Bay shorelines added to the 2010 303(d) List
Regulatory Status of Pollutants of Concern

8/3/2019 Pulse 2011 - Effects on Aquatic Life
http://slidepdf.com/reader/full/pulse-2011-effects-on-aquatic-life 30/104
28 STATUS AND TRENDS UPDATE
status & treupdate
8/3/2019 Pulse 2011 - Effects on Aquatic Life
http://slidepdf.com/reader/full/pulse-2011-effects-on-aquatic-life 31/104
29
T H E
P U L S E
O F
T H E
E S T U A R Y
2 0 1 1
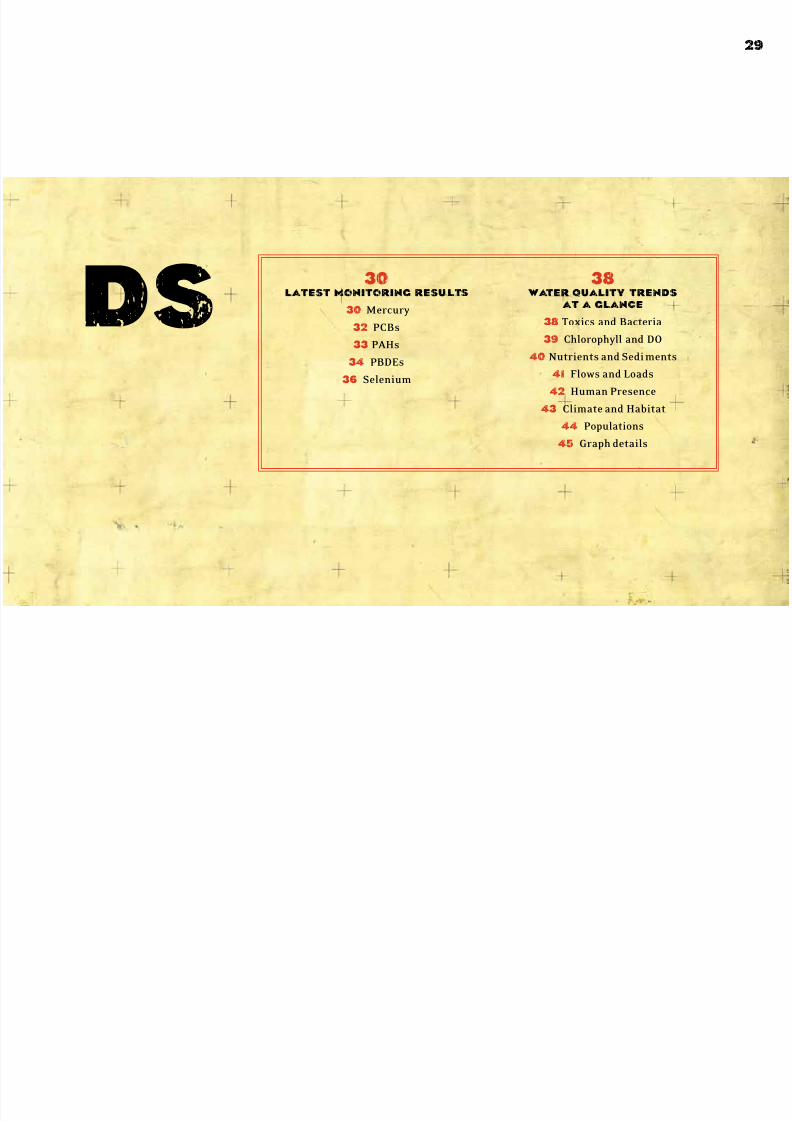
nds30
latest monitoring results
30 Mercury
32 PCBs
33 PAHs
34 PBDEs
36 Selenium
38 water quality trends
at a glance
38 Toxics and Bacteria
39 Chlorophyll and DO
40 Nutrients and Sediments
41 Flows and Loads
42 Human Presence
43 Climate and Habitat
44 Populations
45 Graph details

8/3/2019 Pulse 2011 - Effects on Aquatic Life
http://slidepdf.com/reader/full/pulse-2011-effects-on-aquatic-life 32/104
STATUS AND TRENDS UPDATE | LATEST MONITORING RESULTS30
0.03 0.04 0.05 0.06 0.07 0.08 0.09 0. 1 0.11 0.12
San Pablo Bay Suisun Bay
Rivers
Central Bay
South Bay
Lower South Bay
0 MILES 20
Methylmercury in Water (ng/L)
Water from Lower South Bay had the highe st average concentration of methyl-mercury by fa r (0.11 ng/L) of any segment from 2006 to 2 010. South Bay had thenext highest average (0.06 ng/L). Methylmercury t ypical ly represents only about 1%of the total of all for ms of mercury in water or sediment, but it is the form that is readi ly accumulated in the food web and poses a toxicological threat to highly exposed species.Methylmercury has a complex cycle, inuenced by many processes that vary in spaceand time. No regulatory guideline exists for methylmercury in water. e Bay-wideaverage in 2010 was 0.03 ng/L. e Bay-wide average for the ve-year period was 0.05ng/L. e Bay-wide averages for 2008-2010 were lower than those observed in 200 6 and2007. Additional data wil l be needed to determine whether this reects a real trend.
Latest Monitoring Results
Footnote: Map plot based on 119 RMP data points from 2006-2010. Earlier years not included because a less sensitive method was employed. The maximum concentration was 0.23 ng/L at a site in Lower South Bay in 2009. Trend plot shows annual Bay-wide averages. Data are for total methylmercury. Colored symbols on map show results for samples collected in 2010. Circlesrepresent random sites. Diamonds represent historic fixed stations.
Mercury contamination is one of the top water quality
concerns in the Estuary and mercury clean-up is a highpriority of the Water Board. Mercury is a problem becauseit accumulates to high concentrations and poses risks tosome sh and wildlife species. e greatest health risksfrom mercury are generally faced by humans and wildlifethat consume sh.
0.00
0.02
0.04
0.06
0.08
2003 2005 2007 2009
mercury

8/3/2019 Pulse 2011 - Effects on Aquatic Life
http://slidepdf.com/reader/full/pulse-2011-effects-on-aquatic-life 33/104
S T A T U S A N D
T R E
N D S
U P D A T E
|
L A T E S T M O N I T O R I N G
R E S U L T S
31
T H E
P U L S E
O F
T H E
E S T U A R Y
2 0 1 1
0 0. 2 0. 4 0. 6 0. 8 1 1. 2 1. 4 1. 6
Methylmercury in Sediment (ppb)
San Pablo Bay Suisun Bay
Rivers
Central Bay
South Bay
Lower South Bay
0 MILES 20
Concentrations of methylmercury in sediment south of the Bay Bridge have beenconsistently higher than those in the northern Estuary. Mercury is converted tomethylmercury mainly by bacteria in sediment. Methylmercury production can vary tremendously over small distances and over short time periods, so the colored contoursshown should be viewed as the result of several “snapshots” of Bay conditions at the timeof the surveys in t he summers of 2002-2009. Circles and diamonds represent resultsfrom a rst year of wet-season sampli ng in 2010. e wet-season data show a similar
spatial paern as the long-term average conditions for the dry season. e average for the2010 wet season (0.29 ppb) was lower t han the long-term average for the dry season (0.50ppb), but similar to t he dry season result for 2009 (0.30 ppb). No regulatory gu idelineexists for methylmercury in sediment.
In contrast to methylmercur y, long-term average total mercury concentrations insediment during t he dry season have been highest in San Pablo Bay (0.28 ppm). Also in
contrast to methylmercury, Bay-wide average dry season concentrations of total mercury i nsediment have shown relatively lile variability over thi s period, ranging from 0.19 ppm in2005 to 0.30 ppm in 2009.e lowest Bay-wide average methylmercury concentration overthe eight years of dry season sampling was observed in 2009, coinciding with the highest aver-age total mercury concentration. Circles and diamonds on the map represent results from arst year of wet-season sampling in 2010. e three highest concentrations measured in 2010,ranging from 0.39 to 0.41 ppm, occurred in areas that have had relatively low concentrationsin the dry season.e average for the 2010 wet season (0.26 ppm) was simi lar to t he long-termaverage for the dry season (0.25 ppm) and to annual dry season averages observed from 2002-2009. No regulatory guideline exists for tota l mercury in sediment.
Footnote: Contour plot based on 378 RMP data points over an eight-year period from 2002-2009. The maximumconcentration was 6.1 ppb at a site in Central Bay in 2009. Trend plot shows annual Bay-wide averages. Colored symbols on map show results for samples collected during the wet season (February) in 2010. Circles represent random sites. Diamonds represent historic fixed stations. Red circle on trend plot indicates a wet season sample;other samples were dry season. Concentrations presented on a dry weight basis.
Footnote: Contour plot based on 378 RMP data points over an eight-year period from 2002- 2009. The maximum concentration was 0.94 ppm in Central Bay in 2009. Trend plot showsannual Bay-wide averages. Colored symbols onmap show results for samples collected duringthe wet season (February) in 2010. Circlesrepresent random sites. Diamonds represent historic fixed stations. Concentrations presented on a dry weight basis.
0. 1 0.15 0. 2 0.25 0. 3 0.35 0. 4
San Pablo Bay Suisun Bay
Rivers
Central Bay
South Bay
Lower South Bay
0 MILES 20
Mercury in Sediment (ppm)
0.00
0.20
0.40
0.60
0.80
2002 2003 2004 2005 2006 2007 2008 2009 2010
0.00
0.10
0.20
0.30
0.40
2002 2003 2004 2005 2006 2007 2008 2009 2010
Footnote: Contour plot based on 378 RMP data points over an eight-year period from 2002-2009. The maximumconcentration was 0.94 ppm in Central Bay in 2009. Trend plot shows annual Bay-wide averages. Colored symbolson map show results for samples collected during the wet season (February) in 2010. Circles represent random sites.
Diamonds represent historic fixed stations. Red circle on trend plot indicates a wet season sample; other samples weredry season. Concentrations presented on a dry weight basis.

8/3/2019 Pulse 2011 - Effects on Aquatic Life
http://slidepdf.com/reader/full/pulse-2011-effects-on-aquatic-life 34/104
32 STATUS AND TRENDS UPDATE | LATEST MONITORING RESULTS
0 2 4 6 8 10 12
Sum of PCBs in Sediment (ppb)
San Pablo Bay Suisun Bay
Rivers
Central Bay
South Bay
Lower South Bay
0 MILES 20
0
2
4
6
8
10
12
14
2001 2002 2003 2004 2005 2006 2007 2008 2009 2010
Footnote: Contour plot based on 282 RMP data points from 2004 – 2009. Data from 2002 and 2003 are not available.The maximum concentration was 30 ppb in South Bay in 2008. Trend plot shows annual Bay-wide averages. Colored symbols on map show results for samples collected during the wet season (February) in 2010. Circles represent random sites. Diamonds represent historic fixed stations. Concentrations presented on a dry weight basis.
Average PCB concentrations in Bay sediment have been highest in the southern reach of the Estuar y (Central Bay, South Bay, and Lower South Bay). Circles and diamonds on themap represent results from a rst year of wet-season sampli ng in 2010. e spatial paernobserved in the wet season of 2010 was xx consistent with the general paern observed indry season monitoring from 2002-2009. e Bay-wide average for the wet season samplingin 2010 was 12 ppb, higher than in a ny of the other years (dry season) sampled to date. Fourof the 10 highest samples in t he seven-year period (ranging from 19-24 ppb) were collectedin 2010, all in the southern reach. Models suggest that sediment PCB concentrations mustdecline to about 1 ppb for concentrations in sport sh to fall below the threshold of concern
for human health. Su isun Bay dipped below t his value in 2006 (0.8 ppb), but averaged 2.9ppb in 2010.
PCB contamination remains one of the greatest water quality
concerns in the Estuary, and PCB cleanup is a primary focus of the Water Board. PCBs are a problem because they accumulate to high concentrations in some Bay sh and posehealth risks to consumers of those sh (PAGE 19).
pcbs
8/3/2019 Pulse 2011 - Effects on Aquatic Life
http://slidepdf.com/reader/full/pulse-2011-effects-on-aquatic-life 35/104
S T A T U S A N D
T R E
N D S
U P D A T E
|
L A T E S T M O N I T O R I N G
R E S U L T S
33
T H E
P U L S E
O F
T H E
E S T U A R Y
2 0 1 1
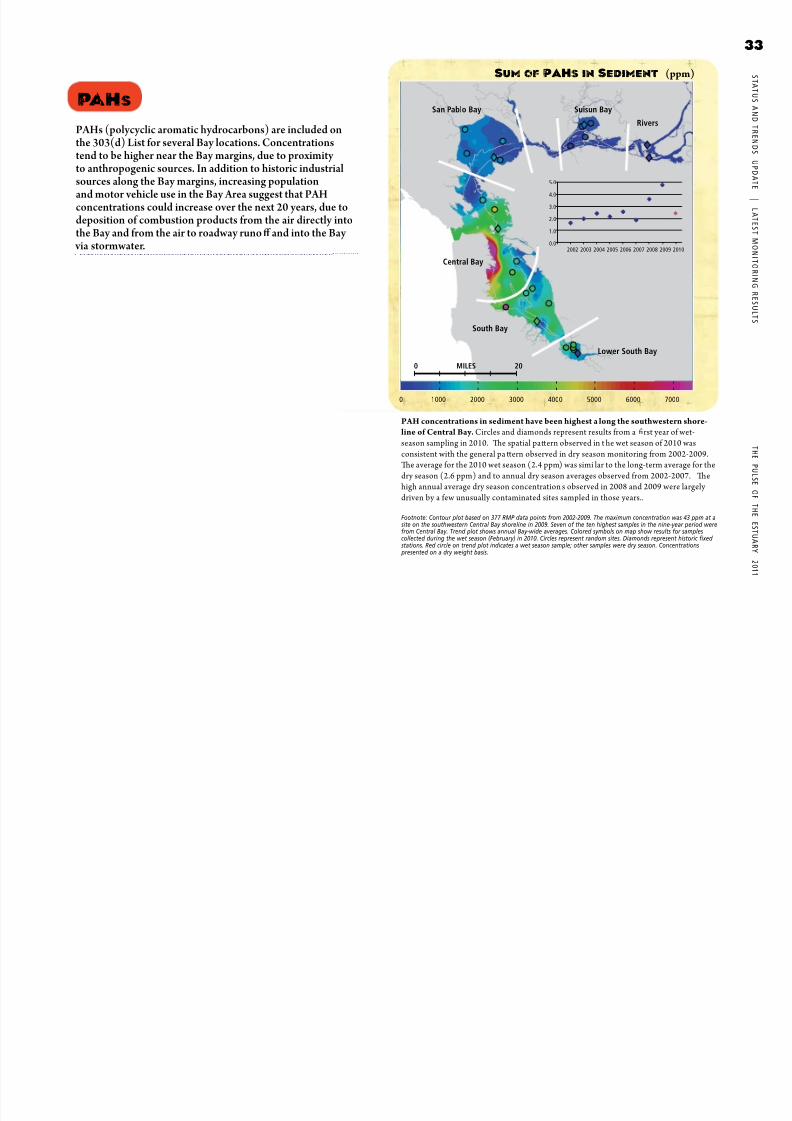
PAH concentrations in sediment have been highest a long the southwestern shore-line of Central Bay. Circles and diamonds represent results from a rst year of wet-season sampling in 2010. e spatial paern observed in t he wet season of 2010 wasconsistent with the general paern observed in dry season monitoring from 2002-2009.e average for the 2010 wet season (2.4 ppm) was simi lar to the long-term average for thedry season (2.6 ppm) and to annual dry season averages observed from 2002-2007. ehigh annual average dry season concentration s observed in 2008 and 2009 were largely driven by a few unusually contaminated sites sampled in those years..
Footnote: Contour plot based on 377 RMP data points from 2002-2009. The maximum concentration was 43 ppm at a site on the southwestern Central Bay shoreline in 2009. Seven of the ten highest samples in the nine-year period werefrom Central Bay. Trend plot shows annual Bay-wide averages. Colored symbols on map show results for samplescollected during the wet season (February) in 2010. Circles represent random sites. Diamonds represent historic fixed stations. Red circle on trend plot indicates a wet season sample; other samples were dry season. Concentrations presented on a dry weight basis.
0 1000 2000 3000 4000 5000 6000 7000
San Pablo Bay Suisun Bay
Rivers
Central Bay
South Bay
Lower South Bay
0 MILES 20
Sum of PAHs in Sediment (ppm)
0.0
1.0
2.0
3.0
4.0
5.0
2002 2003 2004 2005 2006 2007 2008 2009 2010
PAHs (polycyclic aromatic hydrocarbons) are included on
the 303(d) List for several Bay locations. Concentrationstend to be higher near the Bay margins, due to proximity to anthropogenic sources. In addition to historic industrialsources along the Bay margins, increasing populationand motor vehicle use in the Bay Area suggest that PAHconcentrations could increase over the next 20 years, due todeposition of combustion products from the air directly intothe Bay and from the air to roadway runo and into the Bay
via stormwater.
pahs

8/3/2019 Pulse 2011 - Effects on Aquatic Life
http://slidepdf.com/reader/full/pulse-2011-effects-on-aquatic-life 36/104
34 STATUS AND TRENDS UPDATE | LATEST MONITORING RESULTS
e highest long-term average concentration of BDE 47 (one of the most abundantPBDEs and an index of PBDEs as a whole) from 2002-2010 was found in Suisun Bay
(67 pg/L). e maximum concentrations, two samples greater than 300 pg/L, were ob-served at locations in Suisu n Bay and San Pablo Bay, both in 2004.e high concentra-tions in Suisu n Bay suggest the presence of PBDE inputs into the northern Estu ary. eBay-wide average concentration for the nine-year period was 45 pg/L. e Bay-wideaverage for 2010 was the second lowest recorded (19 pg/L). e three lowest annualaverage concentrations were measured in 2008 -2010.
Footnote: BDE 47 shown as an index of total PBDEs. BDE 47 is one of the most abundant PBDEs and was consistently quantified by the lab. Map plot based on 247 RMP data points from 2002-2010. The maximum concentration was337 pg/L observed in Suisun Bay in 2004. Trend plot shows annual Bay-wide averages.
Data are for total BDE 47 in water. Colored symbols on map show results for samples collected in 2010. Circlesrepresent random sites. Diamonds represent historic fixed stations.
20 40 60 80 100 120 140
San Pablo Bay Suisun Bay
Rivers
Central Bay
South Bay
Lower South Bay
0 MILES 20
BDE 47 in Water (pg/L)
0
20
40
60
80
100
120
2002 2003 2004 2005 2006 2007 2008 2009 2010
PBDEs, bromine-containing ame retardants that were
practically unheard of in the early 1990s, increased rapidly in theEstuary through the 1990s and are now pollutants of concern.e California Legislature has banned the use of two types of PBDE mixtures. Tracking the trends in these chemicals will beextremely important to determine what e ect the ban will haveand if further management actions are necessary. No regulatory guidelines currently exist for PBDEs.
pbdes

8/3/2019 Pulse 2011 - Effects on Aquatic Life
http://slidepdf.com/reader/full/pulse-2011-effects-on-aquatic-life 37/104
S T A T U S A N D
T R E
N D S
U P D A T E
|
L A T E S T M O N I T O R I N G
R E S U L T S
35
T H E
P U L S E
O F
T H E
E S T U A R Y
2 0 1 1
In contrast to the results obtained from water monitoring, long-term average dry season concentrations of BDE 47 in sediment have been highest in Lower South Bay
(0.70 ppb). Circles and diamonds represent results from a rst year of wet-season sam-pling in 2010. e spatial paern observed in the wet season of 2010 was consistent withthe general paern observed in dry season monitoring from 2002-2009. ree samples
with relatively high concentration s were observed in northern Suisun Bay, a region thathas been consistently elevated in past sampling. e Bay-wide average for the 2 010 wetseason (0.43 ppb) was simi lar to the long-term average for the dr y season (0.42 ppm) andto annual dr y season averages observed in all prior years (2004-2009).e Bay-wide aver-age has shown lile uctuation over the seven-year period, ranging f rom a low of 0.34 in2005 to a high of 0.49 in 2007.
BDE 209 (also known as decabromodiphenyl ether) represents the one remain-ing class of PBDEs that can still be used in California. Simila r to BDE 47 insediment, long-term average dry season concentrations of BDE 209 from 2004–2009
were highest in Lower South Bay (4.8 ppb). Circles and diamonds represent resultsfrom a rst year of wet-season sampli ng in 2010.e spatial paern observed in the
wet season of 2010 was consistent with t he general paern seen in dry season moni-toring from 2002-2009, wit h the highest concentrations (including samples at 16
ppb in Lower South Bay and 8.4 ppb in San Pablo Bay) occurring in areas previou sly shown to have relatively high concentrations. e average for the 2010 wet season(2.2 ppb) was similar to t he long-term average for the dry season (1.8 ppb) and in themiddle of the range of annual dr y season averages from 2004-2009.
Footnote: BDE 47 is one of the most abundant PBDEs and was consistently quantified by the lab. Contour plot based on 282 RMP data points from 2004–2009. Data from 2002 are available but were inconsistent with data for theother years. The maximum concentration, by far, was 3.8 ppb in Lower South Bay in 2005. Trend plot shows annual Bay-wide averages. Colored symbols on map show results for samples collected during the wet season (February) in
2010. Circles represent random sites. Diamonds represent historic fixed stations. Concentrations presented on a dry weight basis.
0. 2 0. 3 0. 4 0. 5 0. 6 0. 7 0. 8
San Pablo Bay Suisun Bay
Rivers
Central Bay
South Bay
Lower South Bay
0 MILES 20
BDE 47 in Sediment (ppb)
0 1 2 3 4 5 6 7
BDE 209 in Sediment (ppb)
San Pablo Bay Suisun Bay
Rivers
Central Bay
South Bay
Lower South Bay
0 MILES 20
0.0
0.2
0.4
0.6
2002 2003 2004 2005 2006 2007 2008 2009 2010
0.0
1.0
2.0
3.0
4.0
2002 2003 2004 2005 2006 2007 2008 2009 2010
Footnote: BDE 209 shown as an index of the “deca” PBDE mixture. Contour plot based on 282 RMP data points
from 2004, 2006, 2007, 2008, and 2009. The maximum concentration by far was 52 ppb in San Pablo Bay in 2007 (the next highest concentration was 19 ppb in South Bay in 2006). Trend plot shows annual Bay-wide averages.Colored symbols on map show results for samples collected during the wet season (February) in 2010. Circlesrepresent random sites. Diamonds represent historic fixed stations. Red circle on trend plot indicates a wet season sample; other samples were dry season. Concentrations presented on a dry weight basis.

8/3/2019 Pulse 2011 - Effects on Aquatic Life
http://slidepdf.com/reader/full/pulse-2011-effects-on-aquatic-life 38/104
36 STATUS AND TRENDS UPDATE | LATEST MONITORING RESULTS
Selenium concentrations in water are well below the water quality objective
established by the California Toxics Rule (CTR). However, concerns still exist for wildlife exposure as indicated by studies on early life-stages of sh. e highest con-centration observed in water f rom 2002 to 2010 was 1.15 g/L, much lower than theCTR objective (5 g/L). e Lower South Bay had a hig her average concentrationover this period (0.25 g/L) than the other Bay segments, which had very consistentaverage concentrations (all other averages were bet ween 0.12 and 0.14 g/L). eBay-wide average concentration i n 2010 (0.13g/L) was identical to t he long-termBay-wide average (0.13g/L).
Footnote: Map plot based on 247 RMP data points from 2002-2010. The maximum concentration was 1.15 g/L at a historical station in the Southern Sloughs in 2002. Trend plot shows annual Bay-wide averages. Dataare for total selenium. Colored symbols on map show results for samples collected in 2010. Circles represent random sites. Diamonds represent historic fixed stations.
0.05 0. 1 0.15 0. 2 0.25 0. 3 0.35 0. 4 0.45 0. 5
San Pablo Bay Suisun Bay
Rivers
Central Bay
South Bay
Lower South Bay
0 MILES 20
Selenium in Water (ug/L)
0.00
0.10
0.20
0.30
2002 2003 2004 2005 2006 2007 2008 2009 2010
Selenium contamination is a continuing concern in the Estuary.
Selenium accumulates in diving ducks to concentrations thatpose a potential health risk to human consumers. Seleniumconcentrations also pose a threat to wildlife. Recent studiessuggest that selenium concentrations may be high enough tocause deformities, growth impairment, and mortality in early life-stages of Sacramento spliail and white sturgeon.
selenium

8/3/2019 Pulse 2011 - Effects on Aquatic Life
http://slidepdf.com/reader/full/pulse-2011-effects-on-aquatic-life 39/104
S T A T U S A N D T R E N
D S
U P D A T E
|
WA T E R Q U A L I T Y T R E N D
S A T A G L A N C E
37
T H E
P U L S E
O F
T H E
E S T U A R Y
2 0 1 1
0
2
4
6
8
10
12
14
16
18
20
1995 1997 1999 2001 2003 2005 2007 2009
S e l n i u m i n
C l a m s - L e n g t h A d j u s t e d
( p p m d
r y w t )
Contact: Robin Stewart, U.S. Geological Survey, [email protected]
Reference: Kleckner, A.E., Stewart, A.R., Elrick, K., and Luoma, S.N., 2010, Selenium concentrations and stableisotopic compositions of carbon and nitrogen in the benthic clam Corbula amurensis from Northern San FranciscoBay, California: May 1995–February 2010: U.S. Geological Survey Open-File Report 2010-1252, 34 p.
Selenium concentrations in the North Bay clams
continue to uctuate seasonally and from year to year.Corbula amurensis is a dominant clam that accumulatesselenium to an unusual degree due to its slow depuration of this element. ese clams are a primary prey item for white sturgeon, the key target speciesidentied in the North Bay Selenium TMDL project.selenium concentrations in Corbula on a monthly basis to track seasonal and interannual trends and to beer understand factors inuencing variability overtime. For example, clam size was found to inuence
the uptake of selenium by individual clams and thusimpact the apparent selenium burden of the population. Anthropogenic sources of selenium to the Bay, includingagricultural inputs to the San Joaquin River and renery discharges, have been reduced over the last decade. A er 1998, clam selenium concentrations (adjusted fordi erences in clam size) declined to levels 50% of pre-1998 concentrations, but have increased in recent years.Selenium burdens remain higher than levels commonly associated with toxicity and reproductive impairment insh and other wildlife species.
SELENIUM IN CLAMS

8/3/2019 Pulse 2011 - Effects on Aquatic Life
http://slidepdf.com/reader/full/pulse-2011-effects-on-aquatic-life 40/104
White Sturgeon
Jack Smelt
California Halibut
Striped Bass
White Croaker
1994 1997 2000 2003 2006 2009
0.0
0.1
0.3
0.2
0.4
0.5
0.6
0.7
M e t h y l m e r c u r y ( p p m )
0.44
0.07
Methylmercury in sport fish pcbs in sport fish dioxins in sport fish
1994 1997 2000 2003 2006 2009
0.14
3.00
2.50
2.00
1.50
1.00
0.50
0.00
S u m o
f T E Q s ( p p t )
Shiner Sur fper ch Whit e Cr oaker
P C B s ( p p b )
1994 1997 2000 2003 2006 20090
50
150
100
200
250
300
400
350
450
500
120
21
12 3
4
5
NO APPARENT TREND
100
90
80
70
60
50
40
30
20
10
0
T o x i c S a m p l e s ( % )
1 9 9 3
1 9 9 7
2 0 0 1
2 0 0 5
2 0 0 7
2 0 0 9
1 9 9 5
1 9 9 9
2 0 0 3
Percent toxic sediment samples
NO APPARENT TREND
NO APPARENT TREND
2005 2006 2007 2008 2009 2010 2011
0.0
1.0
2.0
3.0
4.0
beach report card grades
No trend instriped basssince 1971
Switchto croakerwithoutskin
Switchto croakerwithoutskin
OEHHA 2meal/wkthreshold
OEHHAno consumptionthreshold
OEHHA 2 meal/wk threshold
OEHHA no consumption threshold
Water Quality Trends at a Glance38
SEE PAGE 45 FOR GRAPH DETAILS
Toxics and Bacteria

8/3/2019 Pulse 2011 - Effects on Aquatic Life
http://slidepdf.com/reader/full/pulse-2011-effects-on-aquatic-life 41/104
S T A T U S A N D T R E N
D S
U P D A T E
|
WA T E R Q U A L I T Y T R E N D
S A T A G L A N C E
39
T H E
P U L S E
O F
T H E
E S T U A R Y
2 0 1 1
chlorophyll in suisun Bay chlorophyll in san pablo bay chlorophyll in south bay12
3
4 5summer chlorophyll in south bay bottom dissolved oxygen in south bay
Time
C h l o r o p h y l l a
( µ g / L )
C h l o r o p h y l l a
( µ g / L )
C h l o r o p h y l l a
( µ g / L )
1980 1990 2000 2010 0
5
1 0
1 5
2 0
2 5
3 0
D i s s o l v e d O x y g e n ( %
s a t u r a t i o n )
1995 2000 2005 2010
4 0
5 0
6 0
7 0
8 0
9 0
1 0 0
1980 1990 2000 2010
1 0
5
0
1 5
2 0
2 5
3 0
C h l o r o p h y l l a
( µ g / L )
1 0
5
0
1 5
2 0
2 5
3 0
1975 1980 1985 1990 1995 2000 2005 2010
2
3
4
5
6
7
8
1980 1990 2000 2010
1986
Corbula
invasion
32%
increase
since
1993
72%
increase
since 1993
4%
decrease
since 1993
105%
increase
since 1993
300% increase
in warm season
since 1990
Chlorophyll and Dissolved Oxygen
SEE PAGE 45 FOR GRAPH DETAILS
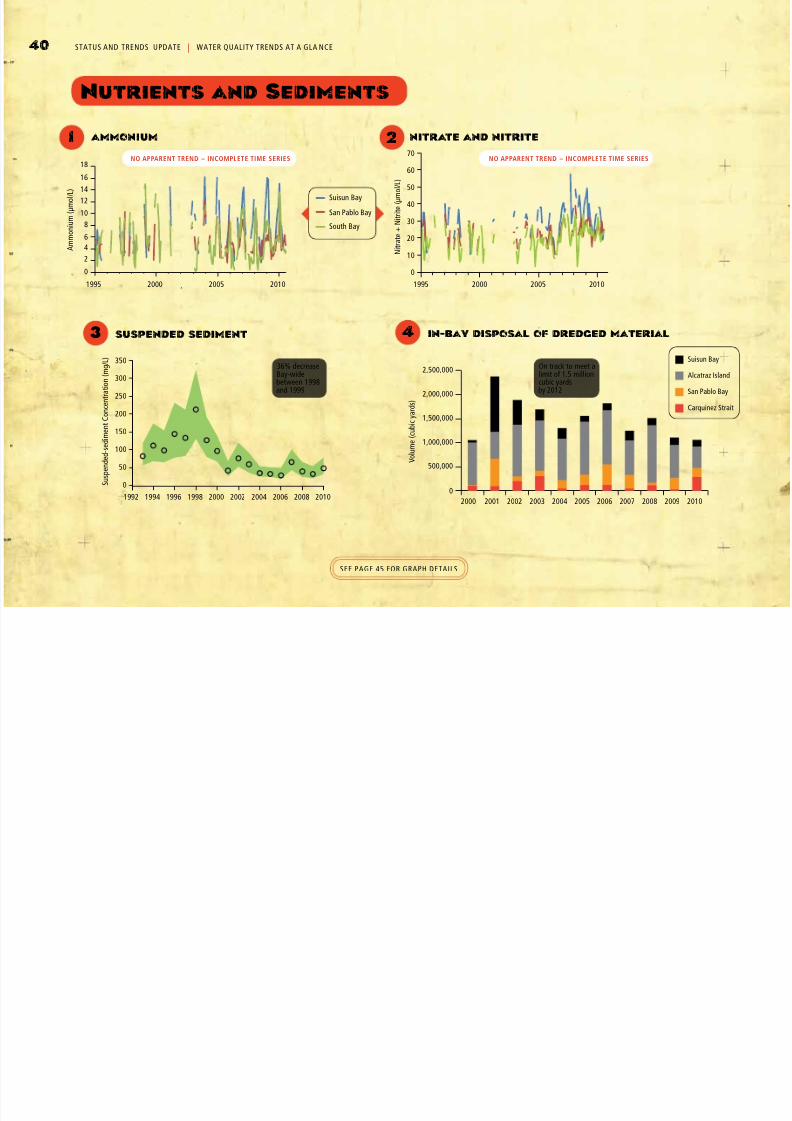
8/3/2019 Pulse 2011 - Effects on Aquatic Life
http://slidepdf.com/reader/full/pulse-2011-effects-on-aquatic-life 42/104
40 STATUS AND TRENDS UPDATE | WATER QUALITY TRENDS AT A GLA NCE
San Pablo Bay
Suisun Bay
South Bay
Suisun Bay
Alcatraz Island
San Pablo Bay
Carquinez Strait
ammonium nitrate and nitrite
N i t r a t e +
N i t r i t e ( µ m o l / L )
70
60
50
40
30
20
10
0
1995 2000 2005 2010
2000 2002 2004 2006 2008 20102001 2003 2005 2007 2009
V o l u m e ( c u b i c
y a r d s )
2,500,000
2,000,000
1,500,000
1,000,000
500,000
0 S u s p e n d e d - s e d i m e n t C
o n c e n t r a t i o n ( m g / L )
1992 1994 1996 1998 2000 2002 2004 2006 2008 2010
0
50
100
150
200
250
300
350
A m m o n i u m ( µ m o l / L )
18
16
14
12
10
8
6
4
2
0
1995 2000 2005 2010
1 2
3 4suspended sediment
NO APPARENT TREND – INCOMPLETE TIME SERIES NO APPARENT TREND – INCOMPLETE TIME SERIES
in-bay disposal of dredged material
36% decreaseBay-widebetween 1998and 1999
On track to meet alimit of 1.5 millioncubic yardsby 2012
Nutrients and Sediments
SEE PAGE 45 FOR GRAPH DETAILS

8/3/2019 Pulse 2011 - Effects on Aquatic Life
http://slidepdf.com/reader/full/pulse-2011-effects-on-aquatic-life 43/104
guadalupe river flow
F l o w ( m
i l l i o n c
u b i c m e t e r s )
60,000
50,000
40,000
30,000
20,000
10,000
01995 1997 1999 2001 2003 2005 2007 2009
2010
1995 1997 1999 2001 2003 2005 2007 2009
S e d i m e n t ( m i l l i o n t o n n e s )
20071995 1997 1999 2001 2003 2005 20090.0
0.5
1.0
1.5
2.0
2.5
3.0
A n n u a l T o t a l M e r c u r y L o a d ( k g )
0
100
200
300
400
500
600
700
1
3 delta outflow
4
Delta mercury load5
Delta sediment load
Large mercuryloads from riversand Yolo Bypassdue to high flowand sediment load
guadalupe rivermercury load
2004 2006 2008 20102003 2005 2007 2009
W e t S
e a s o n T o t a l M e r c u r y ( k g )
100
80
60
40
20
0
120
2
Variationdriven byrainfall
15kg
78 kg
High flowsof 2006
0
50
100
150
200
250
1 9 3 0
1 9 3 5
1 9 4 0
1 9 4 5
1 9 5 0
1 9 5 5
1 9 6 0
1 9 6 5
1 9 7 0
1 9 7 5
1 9 8 0
1 9 8 5
1 9 9 0
1 9 9 5
2 0 0 0
2 0 0 5
2 0 1 0
F l o w ( m
i l l i o n c u b i c m e t e r s )
S T A T U S A N D T R E N
D S
U P D A T E
|
WA T E R Q U A L I T Y T R E N D
S A T A G L A N C E
41
Flows and Loads
SEE PAGE 45 FOR GRAPH DETAILS

8/3/2019 Pulse 2011 - Effects on Aquatic Life
http://slidepdf.com/reader/full/pulse-2011-effects-on-aquatic-life 44/104
42 STATUS AND TRENDS UPDATE | WATER QUALITY TRENDS AT A GLA NCE
Sonoma
Solano
Santa Clara
San Mateo
San Francisco
Napa
Marin
Contra Costa
Alameda
bay area population1
2 bay Area vehicles miles traveled 3 flows from top ten wastewatertreatment plants
Population hasincreasedevery decadesince 1850
183%
increase
1980-2005
7.2 million
12%
decrease
since 1997
P o p u l a t i o n ( M i l l i o n s )
19701850 1870 1890 1910 1930 1950 1990
0
1
2
3
4
5
6
7
8
19801860 1880 1900 1920 1940 1960 2000 2010
V e h i c l e M i l e s T r a v e l e d ( B i l l i o n s )
20001980 1990 2006
0
20
40
60
80
100
120
A v e r a g e D a i l y F l o w
( M G
D )
0
100
200
300
400
500
600
20051985 1995 2007 2008 20011997 1990 20062002 2003 2004 20051998 2000 2007 2007 2009 2010
Human Presence
SEE PAGE 45 FOR GRAPH DETAILS

8/3/2019 Pulse 2011 - Effects on Aquatic Life
http://slidepdf.com/reader/full/pulse-2011-effects-on-aquatic-life 45/104
S T A T U S A N D T R E N D S U P D A T E
|
WA T E R Q U A L I T Y T R E N D
S A T A G L A N C E
43
T H E
P U L S E
O F
T H E
E S T U A R Y
2 0 1 1
Annual Average
20 Year RollingAverage
rainfall in the bay area1
3 water temperature
4 salinity
NO TREND
2 sea level at golden gate
5 Restored wetland opened to tidal action
NO TREND – SHORT TIME SERIES
AND LARGE SEASONAL VARIABILITY
NO TREND – VARIABILITY DRIVENBY FRESHWATER INFLOW
6.4 inch
increase
1920-2005
0
10
20
30
40
50
19701850 1870 1890 1910 1930 1950 199019801860 1880 1900 1920 1940 1960 2000 2010
19701910 1930 1950 1990
2.0
2.4
2.8
3.2
3.6
3.8
19801900 1920 1940 1960 2000 2010
M e a n S e a L e v e l ( f e e t r e l a t i v e t o M L L W )
a
t t h e G o l d e n G a t e
2.2
2.6
3.0
3.4
W a t e r T e m p e r a t u r e ( º C )
R a i n f a l l ( I n c h e s )
1990 1992 1994 1996 1998 2000 2002 2004 2006 2008 201011
13
15
17
19
21
S a l i n i t y ( ‰ )
1990 1992 1994 1996 1998 2000 2002 2004 2006 2008 2010
30
28
26
24
22
20
18
16
32
12,549 ACRES RESTORED SINCE 1986
GOAL IS 100,000 BY 2100
0
2,000
4,000
6,000
8,000
10,000
12,000
14,000
1 9 9 0
1 9 9 5
2 0 0 0
2 0 0 5
2 0 1 0
A c r e s R e s t o r e
d
Climate and Habitat
SEE PAGE 45 FOR GRAPH DETAILS
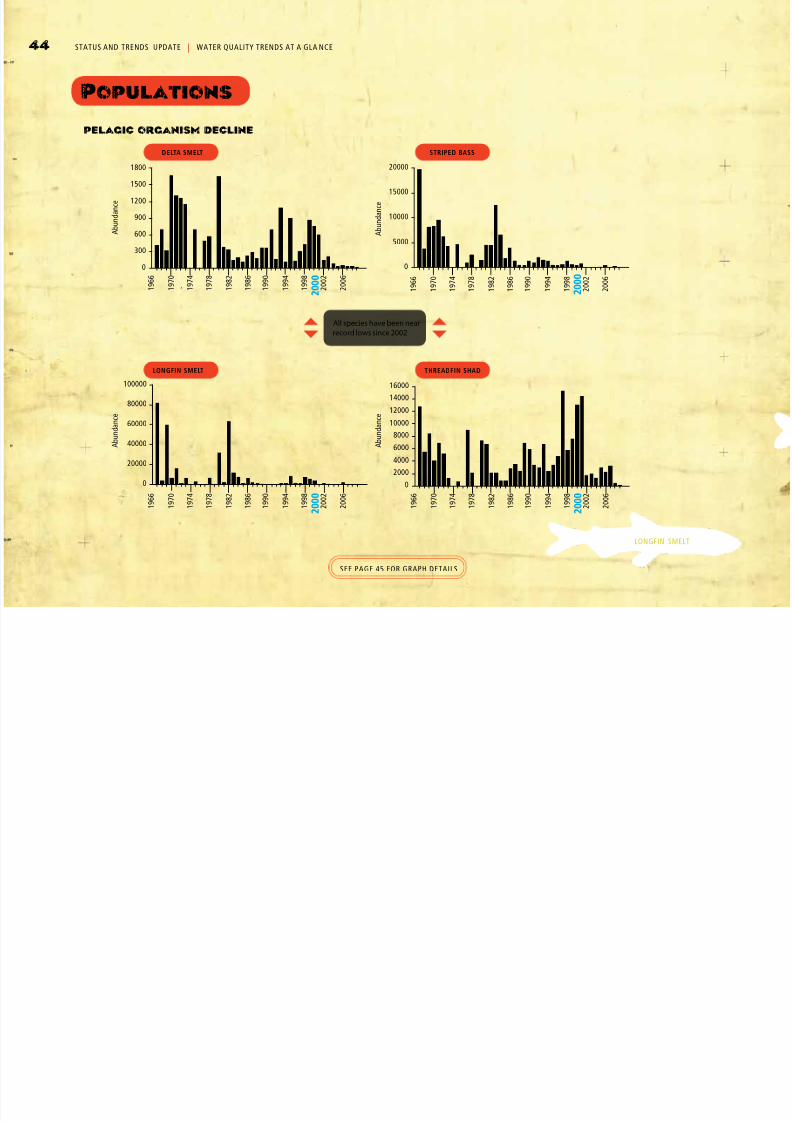
8/3/2019 Pulse 2011 - Effects on Aquatic Life
http://slidepdf.com/reader/full/pulse-2011-effects-on-aquatic-life 46/104
44 STATUS AND TRENDS UPDATE | WATER QUALITY TRENDS AT A GLA NCE
pelagic organism decline
LONGFIN SMELT THREADFIN SHAD
DELTA SMELT STRIPED BASS
All species have been near
record lows since 2002
1 9 6 6
1 9 7 0
1 9 7 4
1 9 7 8
1 9 8 2
1 9 8 6
1 9 9 0
1 9 9 4
1 9 9 8
2 0 0 2
2 0 0 0
2 0 0 6
1 9 6 6
1 9 7 0
1 9 7 4
1 9 7 8
1 9 8 2
1 9 8 6
1 9 9 0
1 9 9 4
1 9 9 8
2 0 0 2
2 0 0 0
2 0 0 6
1 9 6 6
1 9 7 0
1 9 7 4
1 9 7 8
1 9 8 2
1 9 8 6
1 9 9 0
1 9 9 4
1 9 9 8
2 0 0 2
2 0 0
0
2 0 0 6
1 9 6
6
1 9 7
0
1 9 7
4
1 9 7
8
1 9 8
2
1 9 8
6
1 9 9
0
1 9 9
4
1 9 9
8
2 0 0
2
2 0 0
0
2 0 0
6
1800
100000
80000
60000
40000
20000
0
16000
14000
12000
10000
8000
6000
4000
2000
0
20000
15000
10000
5000
0
1500
1200
900
600
300
0
A b u n d a n
c e
A b u n d a n c e
A b u n d a n
c e
A b u n d a n c e
Populations
LONGFIN SMELT
SEE PAGE 45 FOR GRAPH DETAILS

8/3/2019 Pulse 2011 - Effects on Aquatic Life
http://slidepdf.com/reader/full/pulse-2011-effects-on-aquatic-life 47/104
S T A T U S A N D T R E N D S U P D A T E
|
WA T E R Q U A L I T Y T R E N D
S A T A G L A N C E
45
T H E
P U L S E
O F
T H E
E S T U A R Y
2 0 1 1
Graph Details
PAGE 38
1) Bay-wide average methylmercury concentrations. Averages for striped bass
based on concentrations for individual shnormalized to 60 cm. e no consumptionadvisory tissue level for mercury is 440ppb, and the two serving advisory tissuelevel is 70 ppb.
2) Bay-wide average PCB concentrations.e no consumption advisory tissue levelfor PCBs is 120 ppb, and the two servingadvisory tissue level is 21 ppb. Whitecroaker were analyzed without skin in2009, and with skin in previous years.
3) Bay-wide average dioxin TEQ concentrations. e San FranciscoBay Water Quality Control Board has
developed a screening value for dioxinTEQs of 0.14 parts per trillion (ppt). White croaker were analyzed with skinfrom 1994-2006, and without skin in 2009.
4) Sediment samples are tested usingamphipods and mussel larvae.
5) Average of Bay Area summer beachseason (April-October) grades fromHeal the Bay’s annual beach report card
(PAGE 23).
PAGE 39
access/wqdata. Data from prior to 1969 xed stations along the spine of the Bay.Data for stations D10, D8, D7, D6, andD41 from IEP: hp://www.water.ca.gov/
bdma/meta/Discrete/data.cfm.
1) Chlorophyll a, averaged over top 3meters and all stations, in Suisun Bay (stations D10, D8, D7, D6, s4, s5, s6,and s7).
2) Chlorophyll a, averaged over top 3meters and all stations, in San Pablo Bay (stations D41, s11, s12, s13, s14, and s15).
3) Chlorophyll a, averaged over top 3meters and all stations, in South Bay
(stations s21, s22, s23, s24, s25, s26, s27,s28, s29, s30, s31, s32, a nd s33).
4) Chlorophyll a in South Bay, averagedover top 3 meters, all stations, and June-October season for each year. Trend line isa smoothed t.
5) Minimum dissolved oxygen percentsaturation from each South Bay station,averaged over all stations. Minimumdissolved oxygen values typically occurat or near the boom. Horizontal lineindicates 50% saturation.
PAGE 40
1 AND 2 wr.usgs.gov/access/wqdata
3) Suspended-sediment concentration,Dumbarton Bridge, 20 feet below meanlower low water. Based on 15-minute data(Buchanan and Morgan 2010). Water years2008-2010 are provisional data.
4Engineers.
PAGE 41
1Data for all of these graphs are for water
years (Oct 1 to Sep 30).
2) Total loads for each water year. Additional matching funds for this study
3) Daily average Delta outow fromDAYFLOW. DAYFLOW data are availablefrom the California Department of WaterResources (www.water.ca.gov/day ow/).
4)Total sediment loads for each water year. Loads based on continuousmeasurements taken at Mallard Island by cont_monitoring/).
5) Total loads for each water year. Loadsfrom 2002–2006 are based on eld data.Loads for earlier and later years areestimated from relationships observed
between suspended sediment and mercury in 2002–2006.
PAGE 42
1) Data from the Association of Bay Areahp://census.abag.ca.gov/counties/counties.htm
2) Data from Caltrans: hp://trac-counts.dot.ca.gov/
3) Data provided by the ten largest
municipal wastewater dischargers to theBay: San Jose, East Bay Dischargers, EastCosta, Palo Alto, Faireld-Suisun, SouthBayside System Authority, San Mateo,
Vallejo.
PAGE 43
1) Annual rainfall measured at San Joseshown as index for Bay Area rainfall. esedata are for climatic years (July 1 to June30 with the year corresponding to theend date). Source: Jan Null, Golden Gate
Weather Services
2) Data from National Oceanic and Atmospheric Administration: hp://tidesandcurrents.noaa.gov/data_menu.sh
3) Water year median water temperatureand interquartile range, San Mateo Bridge,
4 feet below mean lower low water. FromGeological Survey (Buchanan 2009).1999-2000 not shown because data weretemporarily not collected during bridgeconstructi on. Some variation is caused by di erent periods of missing data.
4) Same information as #3. Salinity reects freshwater inow to the Bay withlower values for higher inows. Ocean
water has a salinity of 35.
5) Data from the California WetlandsPortal (www.californiawetlands.net/tracker/).
PAGE 44
All data from: Baxter, R. et al. 2010.Interagency Ecological Program2010 Pelagic Organism Decline
Work Plan and Synthesis of Results.hp://www.water.ca.gov/iep/docs/FinalPOD2010Workplan12610.pdf
STRIPED BASS
THREADFIN SHAD
DELTA SMELT

8/3/2019 Pulse 2011 - Effects on Aquatic Life
http://slidepdf.com/reader/full/pulse-2011-effects-on-aquatic-life 48/104
46
feature art

8/3/2019 Pulse 2011 - Effects on Aquatic Life
http://slidepdf.com/reader/full/pulse-2011-effects-on-aquatic-life 49/104
47
T H E
P U L S E
O F
T H E
E S T U A R Y
2 0 1 1
cles48 a growing concern:
potential effectsof nutrients on
bay phytoplankton
50 Sidebar: Harmful Algal Blooms
58 Sidebar: ExceptionalConditions in Spring 2011
66
effects of pollutantson bay fish
71 Sidebar: Exposureand Effects Workgroup
78 recent findings on risksto birds from pollutants
in san francisco bay
86 Sidebar: Another Dimensionof the Mercury Problem
88
contaminant exposure andeffects at the top of the bay
food chain: evidence from
harbor seals

8/3/2019 Pulse 2011 - Effects on Aquatic Life
http://slidepdf.com/reader/full/pulse-2011-effects-on-aquatic-life 50/104
48 FEATURE ARTICLES | PHYTOPLANKTON
CHRISTINE WERM E, Independent Consultant
REN TABERSKI, San Francisco Bay Regional Water Quality Control Board
LESTER MCKEE, San Francisco Estuary Institute
TOM HALL , EOA, Inc.
MIKE CONNOR, East Bay Dischargers Authority
Phytoplankton, themicroscopic plants atthe base of the foodchain, are the focus of anew San Francisco Bay Nutrients Strategy
Nutrient loading to the Bay is high, but phytoplankton
biomass has been low compared to other urbanestuaries, in part a result of turbid waters that limit lightpenetration and high grazing
pressures, particularly by invasive clams
Since the late 1990s,phytoplankton biomasshas increased throughoutthe Bay, a response toincreased water clarity andfavorable wider regional
oceanographic conditions
In the Sacramento Riverand northern portions of the Bay, there is evidencesuggesting that high levelsof one form of nitrogen,ammonium, can inhibitrather than stimulate phy-toplankton growth
e complexity of theecosystem and uncer-tainty about futureconditions underlie thegrowing importanceof nutrient and phyto-plankton monitoring,research, and modeling
a growing concern:potential effects of nutrients
on bay phytoplankton
highlights

8/3/2019 Pulse 2011 - Effects on Aquatic Life
http://slidepdf.com/reader/full/pulse-2011-effects-on-aquatic-life 51/104
F E A T U R E A R T I C L E S
|
P H Y T O P L A N K T O N
49
T H E
P U L S E
O F
T H E
E S T U A R Y
2 0 1 1
SIGNS OF TROUBLE
AT THE BASE OF
THE FOOD CHAIN?
At the very base of the food chain in San Francisco Bay and
the Delta are the phytoplankton (also referred to as algae),microscopic plants that dri in the water column and provide
food for zooplankton, clams, and lter-feeding shes. In
the past, the phytoplankton have not been a major focus of
the Regional Monitoring Program for Water Quality in the
San Francisco Estuary (RMP). at is changing with the
development of a new San Francisco Bay Nutrient Strategy,
developed by the RMP in collaboration with other scientists
and environmental managers. In the Bay as a whole, phyto-
plankton biomass is increasing, prompting the question of
whether excess phytoplankton growth, which has not been
a problem for San Francisco Bay, may become one in the fu-
is dominated more by riverine than by oceanic conditions,
there is another concern, that one form of nitrogen – ammo-
nium – from wastewater treatment plant euent has reached
high enough levels to inhibit growth of a group of desirable
phytoplankton species, the diatoms.
ESSENTIAL INDICATORS
OF WATER QUALITY
The abundance and species composition of phytoplankton
communities are important measures of environmental
quality in all freshwater, estuarine, and marine ecosystems.
States and around the world shows signs of eutrophication
– overstimulation of algal growth by an excess of nutrients
– which can lead to low levels of dissolved oxygen, excess
turbidity, and nuisance or harmful algal blooms (SIDE
BAR, PAGE 50
excess nutrients, especially nitrogen from agriculture, urban
runoff, and wastewater treatment plants, is a major focus
of environmental monitoring and management programs.
Phosphorus inputs are also a concern, particularly in areas with low salinity.
In typical, healthy coastal ecosystems, phytoplankton popu-
lations follow seasonal patterns, blooming when tempera-
ture and light levels rise during the spring, then dropping
off a little before rising again in the fall, when cooling
waters promote mixing, returning nutrients f rom deeper
waters to the surface. However, in San Francisco Bay the
water column is usually well-mixed during every season.
Seasonal changes in nutrient concentrations are largely
determined by changes in inputs. Seasonal spring bloomsoccur fairly regularly in South Bay, Central Bay, and San
Pablo Bays, but less frequently in Suisun Bay.
Nitrogen is the nutrient that usually limits phytoplankton
growth in marine and estuarine waters. Nitrogen exists as an
abundant gas in the atmosphere. It is also present in terrestrial
and aquatic systems, in organic molecules such as proteins and
urea, and in inorganic forms, including ammonium, nitrate,
and nitrite. Ammonium and nitrate are the forms that usually
control phytoplankton growth. Nitrogen enters estuaries from
riverine, atmospheric, and groundwater sources and pathways.
Dense human populations can greatly increase nitrogen inputs
through sewage discharges and r uno of fertilizers applied toagriculturalelds, lawns, and other areas.
Phytoplankton studies generally include measurements of
biomass and sometimes include studies of the species compo-
sition of the phytoplankton community. Biomass is measured
as chlorophyll, which is the easily measured plant pigment
that absorbs light, capturing energy in photosynthesis. Species
composition studies can detect changes in the community,
such as shis from larger diatoms to smaller agellates and
blue-green algae (cyanobacteria) or increased incidence of
toxin-producing or other nuisance species. Changes in thecomposition of the phytoplankton community can trigger
changes in the community structure of their predator commu-
nities, which can inuence the rest of the food chain.
Thalassiosira rotula. Illustration by Susan Putney.

8/3/2019 Pulse 2011 - Effects on Aquatic Life
http://slidepdf.com/reader/full/pulse-2011-effects-on-aquatic-life 52/104
50 FEATURE ARTICLES | PHYTOPLANKTON
SIDEBAR
HARMFUL
ALGAL BLOOMS
Take a walk along the Bay’s fishing piers
and you’ll see the posted signs that warnagainst harvesting mussels during May
through October. Similar signs occur
along the entire California coastline.
An annual preventative quarantine for
sport-harvested mussels protects the
public from consuming shellfish that have
accumulated toxins generated during
what are called harmful algal blooms. The
California Department of Public Health
monitors potentially toxic algae through
its volunteer Marine Biotoxin Programand prepares regular reports, available
at www.cdph.ca.gov/healthinfo/envi-
ronhealth/water/Pages/Shellfish.aspx.
Compared to some other parts of the
world, San Francisco Bay is relatively free
from harmful algal blooms, with only six
blooms reported since 1995 But some of
the toxins produced by a number of local
algal species can be deadly.
e historic shellmounds of the SanFrancisco Bay Area provide evidence of
thousands of years of human shellsh
consumption. e rst documented cases
of toxic shellsh poisoning were reported
in 1927, and it took ten years to identify
the cause (Sommer and Meyer 1937). It
was a dinoagellate, Alexandrium catanella.
e toxin produced by many Alexandrium
species, when suciently concentrated
by shellsh, causes a condition known as
paralytic shellsh poisoning. Symptoms
can include numbness, lack of muscle
control, respiratory failure, and death for
marine mammals, sh, and humans. ere
is no antidote or cure for paralytic shellsh
poisoning. Alexandrium blooms with para-lytic shellsh poisoning occur along the
California coast but are rare within the Bay.
Were algal toxins the inspiration for
-
dreds of Sooty Shearwaters went berserk,
crashing into roofs and windows near
Santa Cruz, and shortly thereafter, Hitch-cock began to film Daphne Du Maurier’s
story of a similar incident, choosing
Bodega Bay as his location. The real-life
events may have been the result of a toxin
produced by another phytoplankton
group, diatoms in the genus Pseudo-
nitzchia. At high densities Pseudo-nitzchia
species produce sufficient concentrations
of the toxin domoic acid to cause a condi-
tion known as amnesic shellfish poison-
ing. Symptoms include gastrointestinal
and neurological conditions, including
dementia. In 1990, domoic acid poi-
soning was found in central California
sea lions (Scholin et al. 2000). One
toxin-producing species, Pseudo-nitzchiaaustralis , was blamed for the 1991 deaths
of pelicans, cormorants, and sea lions in
Monterey Bay. Scientists
from The Marine Mam-
mal Center have found
that low doses of domoic
acid can cause epilepsy in
sea lions (Goldstein et al.
2007) and are studying
other possible long-term
effects.
A blue-green alga or cya-
nobacterium, Microcystis
aeruginosa , has recently
been implicated in sea ot-
ter deaths in Monterey Bay
(Fimrite, 2010). Microcystis has also been
blamed for skin rashes among windsurf-
ers. Microcystis blooms have occurred in
the Delta and the North Bay every year
since 1999 (Lehman et al. 2005, 2008),and they are regarded as a potential threat
to humans and wildlife.
Other possibly harmful species known to
occur within the Bay include the raphido-
phyte Heterosigma akashiwo and the di-
noflagellate Akashiwo sanguine . In recent
years, Heterosigma akashiwo blooms have
been detected outside the Golden Gate,
in Richardson Bay, and near the Berkeley
Pier. The species has been implicated
in fish kills in o ther regions. Akashiwo
sanguine does not produce a toxin but can
clog shellfish gills and lead to fish kills
when the bloom ends and decomposing
algae deplete oxygen in the water column. Akashiwa sanguine also produces a foamy,
surfactant-like protein that can coat bird
feathers and lead to hypothermia. As
San Francisco Bay enters a regime with
larger and more frequent phytoplankton
blooms, harmful algae may become more
frequent or have greater consequences.
Fimrite, P. 2010. Monterey sea oers killed by toxic algae.San Francisco Chronicle September 11, 2010 Page C-1.
Goldstein, T., J.A.K. Mazet, T.S. Zabka, G. Langlois, K.M.Colegrove, M. Silver, S. Bargu, F. Van Dolah, T. Leigheld,P.A. Conrad, J. Barakos, D.C. Williams, S. Dennison, M.Haulena, and F.M.D. Gulland. 2007. Novel Symptomatol-ogy and changing epidemiology of domoic acid toxicosis inCalifornia sea lions (Zalophus californianus): an increasingrisk to marine mammal health. Proceedings of the RoyalSociety B 275:267–276.
Lehman, W., G. Boyer, C. Hall, S. Waller, and K. Gertz. 2005.
Distribution and toxicity of a new colonial Microcystisaeruginosa bloom in the San Francisco Estuary, California.Hydrobiologia 541: 87–99.
Lehman, W., G. Boyer, M. Satchwell, and S. Waller. 2008.e inuence of environmental conditions on the seasonal variation of Microcystis cell density and microystinsconcentration in San Francisco Estuary. Hydrobiologia600: 187–204.
Scholin, C.A., F. Gulland, G.J. Doucee, S. Benson, M.Busman, F.P. Chavez, J. Cordaro, R. DeLong, A. De Vogelaere, J. Harvey, M. Haulena, K. Lefebvre, T. Lipscomb,S. Loscuto , L.L. Lowenstine, R. Marin III, P.E. Miller, W.A. McLellan, P.D.R. Moeller, C.L. Powell, T. Rowles, P.Silvagni, M. Silver, T. Spraker, V. Trainer, and F.M. Dolah.2000. Mortality of sea lions along the central Californiacoast linked to a toxic diatom bloom. Nature 403: 80–84.
Sommer, H. and K.F. Meyer. 1937. Paralytic shellsh poison-ing. Archives of Pathology 24:560–598.
Microcystis aeruginosa. Illustration by Linda Wanczyk.

8/3/2019 Pulse 2011 - Effects on Aquatic Life
http://slidepdf.com/reader/full/pulse-2011-effects-on-aquatic-life 53/104
F E A T U R E A R T I C L E S
|
P H Y T O P L A N K T O N
51
T H E
P U L S E
O F
T H E
E S T U A R Y
2 0 1 1
THE HISTORY OF
LOW OXYGEN IN SAN
FRANCISCO BAY
In the 1950s and 1960s, before upgrades to wastewater
treatment facilities, San Francisco Bay experienced oxygendepletion and fish kills, particularly in the South Bay (FIG
URE 1). In other estuaries, such conditions are often due
to decomposing phytoplankton following algal blooms. In
the Bay, it was the large inputs of oxygen-depleting organic
waste that led to foul conditions.
The passage of the Clean Water Act in 1972 required the
conversion from primary to secondary treatment of sewage,
which reduced the loads of organic effluents discharged
into rivers and the Bay. Primary treatment is a physical
process that removes solids through settling, followed by disinfection. Secondary treatment adds bacterial oxida-
tion of remaining particulate and dissolved organic matter
and sedimentation, which greatly decreases the amount
of oxygen-depleting organic matter. In the late 1970s,
municipal dischargers with permits to discharge to shallow
waters implemented additional facilities to further reduce
oxygen-depleting organic matter. Some of these advanced
secondary treatment facilities included filtration and
nitrification, a process that changes ammonium to nitrate,
changing the balance of these two nutrients and reducing
the oxygen demand of the effluent.
1960 1970 1980 1990 2000
0
5
10
15
FIGURE
1Implementation of improved wastewater treatment elimi nated periods of low oxygen and sh kills in the South Bay. Conversion from primary to secondary and ad-
vanced secondary treatment removed oxygen-depleting organic maer from wastewatereuents. J. Cloern, unpublished data.
Footnote: Red line shows 5 mg/L water quality objective.
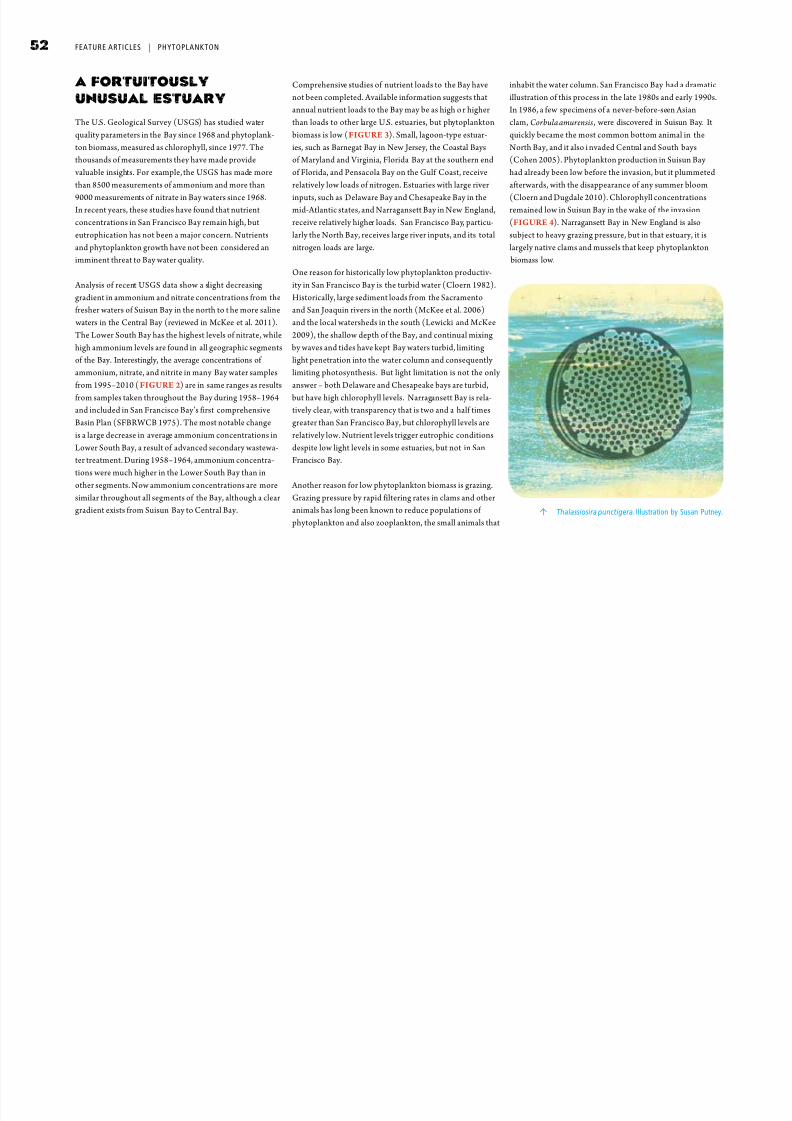
8/3/2019 Pulse 2011 - Effects on Aquatic Life
http://slidepdf.com/reader/full/pulse-2011-effects-on-aquatic-life 54/104
52 FEATURE ARTICLES | PHYTOPLANKTON
A FORTUITOUSLY
UNUSUAL ESTUARY
quality parameters in the Bay since 1968 and phytoplank-
ton biomass, measured as chlorophyll, since 1977. Thethousands of measurements they have made provide
than 8500 measurements of ammonium and more than
9000 measurements of nitrate in Bay waters since 1968.
In recent years, these studies have found that nutrient
concentrations in San Francisco Bay remain high, but
eutrophication has not been a major concern. Nutrients
and phytoplankton growth have not been considered an
imminent threat to Bay water quality.
gradient in ammonium and nitrate concentrations from the
fresher waters of Suisun Bay in the north to t he more saline
waters in the Central Bay (reviewed in McKee et al. 2011).
The Lower South Bay has the highest levels of nitrate, while
high ammonium levels are found in all geographic segments
of the Bay. Interestingly, the average concentrations of
ammonium, nitrate, and nitrite in many Bay water samples
from 1995–2010 (FIGURE 2) are in same ranges as results
from samples taken throughout the Bay during 1958–1964
and included in San Francisco Bay’s first comprehensive
Basin Plan (SFBRWCB 1975). The most notable changeis a large decrease in average ammonium concentrations in
Lower South Bay, a result of advanced secondary wastewa-
ter treatment. During 1958–1964, ammonium concentra-
tions were much higher in the Lower South Bay than in
other segments. Now ammonium concentrations are more
similar throughout all segments of the Bay, although a clear
gradient exists from Suisun Bay to Central Bay.
Comprehensive studies of nutrient loads to the Bay have
not been completed. Available information suggests that
annual nutrient loads to the Bay may be as high o r higher
biomass is low (FIGURE 3). Small, lagoon-type estuar-
ies, such as Barnegat Bay in New Jersey, the Coastal Baysof Maryland and Virginia, Florida Bay at the southern end
of Florida, and Pensacola Bay on the Gulf Coast, receive
relatively low loads of nitrogen. Estuaries with large river
inputs, such as Delaware Bay and Chesapeake Bay in the
mid-Atlantic states, and Narragansett Bay in New England,
receive relatively higher loads. San Francisco Bay, particu-
larly the North Bay, receives large river inputs, and its total
nitrogen loads are large.
One reason for historically low phytoplankton productiv-
ity in San Francisco Bay is the turbid water (Cloern 1982).Historically, large sediment loads from the Sacramento
and San Joaquin rivers in the north (McKee et al. 2006)
and the local watersheds in the south (Lewicki and McKee
2009), the shallow depth of the Bay, and continual mixing
by waves and tides have kept Bay waters turbid, limiting
light penetration into the water column and consequently
limiting photosynthesis. But light limitation is not the only
answer – both Delaware and Chesapeake bays are turbid,
but have high chlorophyll levels. Narragansett Bay is rela-
tively clear, with transparency that is two and a half times
greater than San Francisco Bay, but chlorophyll levels arerelatively low. Nutrient levels trigger eutrophic conditions
despite low light levels in some estuaries, but not in San
Francisco Bay.
Another reason for low phytoplankton biomass is grazing.
Grazing pressure by rapid filtering rates in clams and other
animals has long been known to reduce populations of
phytoplankton and also zooplankton, the small animals that
inhabit the water column. San Francisco Bay had a dramatic
illustration of this process in the late 1980s and early 1990s.
In 1986, a few specimens of a never-before-seen Asian
clam, Corbula amurensis , were discovered in Suisun Bay. It
quickly became the most common bottom animal in the
North Bay, and it also i nvaded Central and South bays(Cohen 2005). Phytoplankton production in Suisun Bay
had already been low before the invasion, but it plummeted
afterwards, with the disappearance of any summer bloom
(Cloern and Dugdale 2010). Chlorophyll concentrations
remained low in Suisun Bay in the wake of the invasion
(FIGURE 4). Narragansett Bay in New England is also
subject to heavy grazing pressure, but in that estuary, it is
largely native clams and mussels that keep phytoplankton
biomass low.
Thalassiosira punctigera. Illustration by Susan Putney.
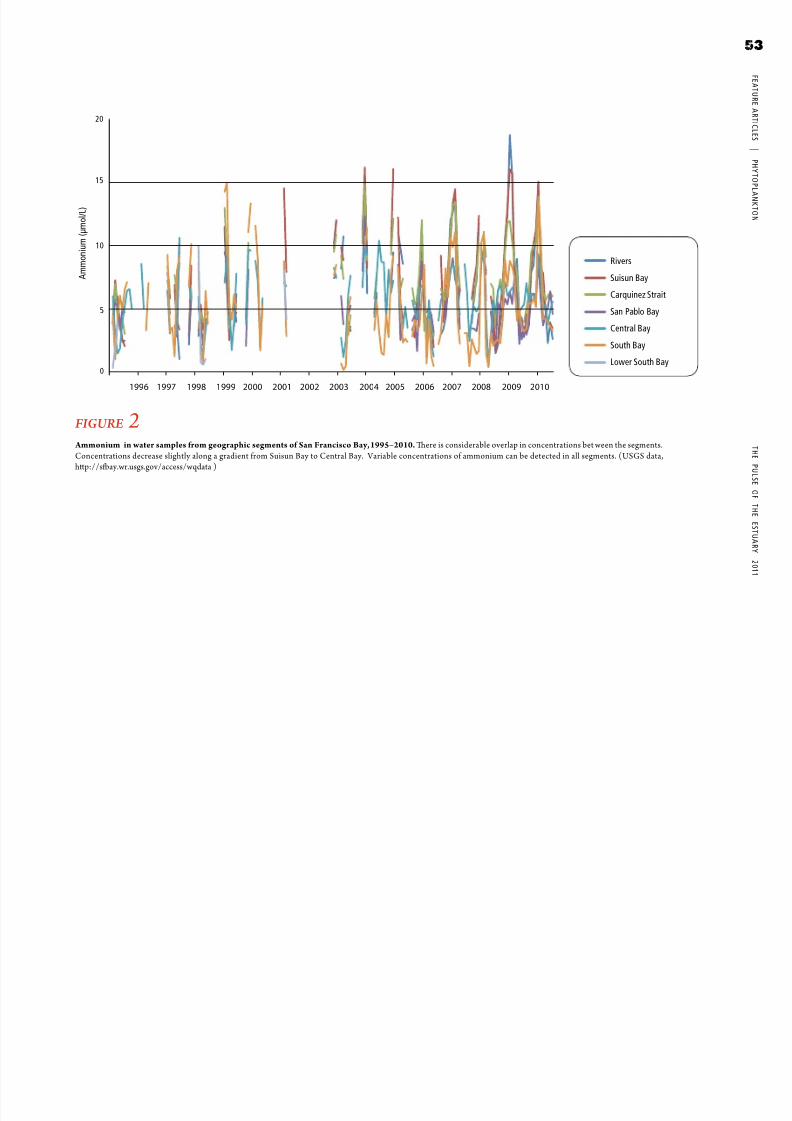
8/3/2019 Pulse 2011 - Effects on Aquatic Life
http://slidepdf.com/reader/full/pulse-2011-effects-on-aquatic-life 55/104
F E A T U R E A R T I C L E S
|
P H Y T O P L A N K T O N
53
T H E
P U L S E
O F
T H E
E S T U A R Y
2 0 1 1
Rivers
Suisun Bay
Carquinez Strait
San Pablo Bay
Central Bay
South Bay
Lower South Bay
20
15
10
5
A m m o n i u m ( µ
m o l / L )
0
1996 1997 19991998 2000 2001 2002 20042003 2005 2006 2007 2009 20102008
FIGURE 2 Ammonium in water samples from geographic segments of San Francisco Bay, 1995–2010.ere is considerable overlap in concentrations bet ween the segments.
54

8/3/2019 Pulse 2011 - Effects on Aquatic Life
http://slidepdf.com/reader/full/pulse-2011-effects-on-aquatic-life 56/104
54 FEATURE ARTICLES | PHYTOPLANKTON
FIGURE 4Chlorophyll concentrations and abundance of the invasive Asian clam Corbula amurensis in Suisun Bay. Grazing pres-sure by the invasive clam eliminated phytoplankton blooms.(Data from the Interagency Ecological Program.)
1970 1975 1980 1985 1990 1995 2000 2005
0
2000
4000
6000
0
10
20
30
40
50
Corbula amurensis
C h l a ( m g / m 3 )
C o r b u l a ( # / m 2 )
C h l o r o p h y
l l ( µ g / L )
Nitrogen load (g N/m2 yr)
20
10
0
50
40
30
60
20151050 353025
Coastal Bays(MD and VA)
Barnegat(NJ)
Florida Bay
Pensacola
Chesapeake
Delaware
Narragansett
San Francisco
FIGURE 3Nitrogen loads to San Francisco Bay are hig h in compar-ison to other U.S. estuar ies, but average Bay phytoplank-ton biomass (chlorophyll) during blooms is low. (Data
from Glibert et al. 2010)
55
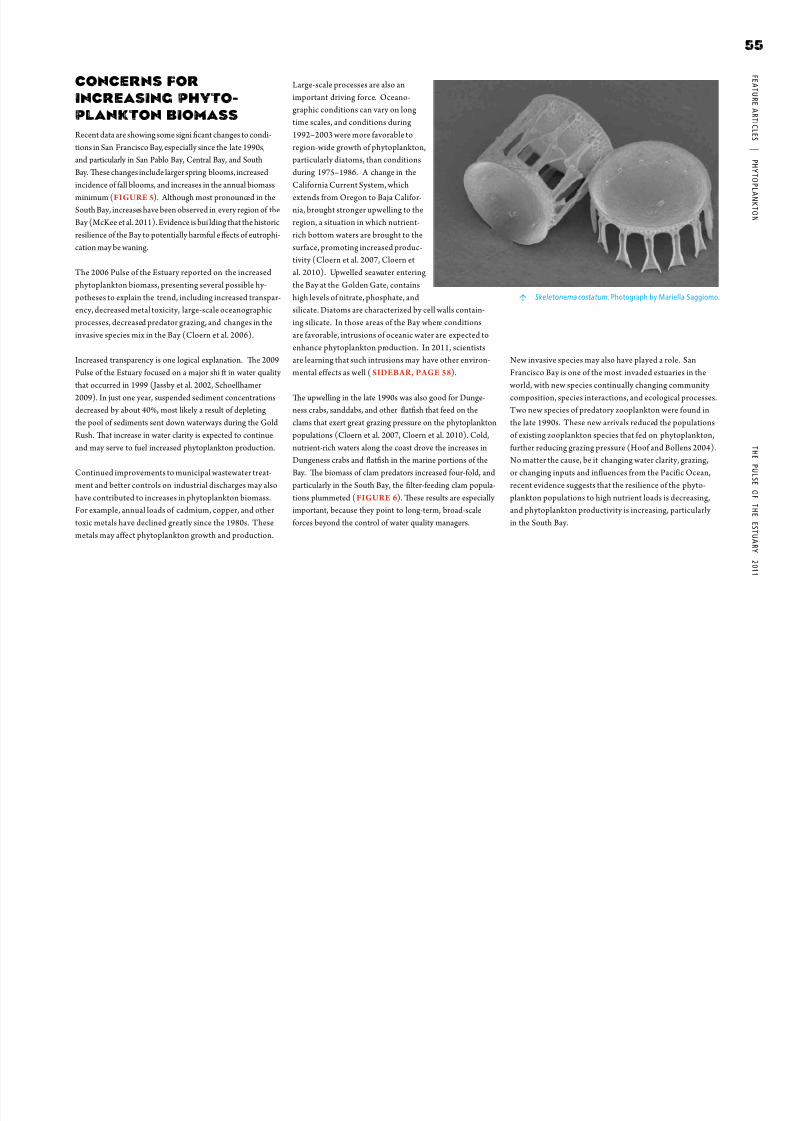
8/3/2019 Pulse 2011 - Effects on Aquatic Life
http://slidepdf.com/reader/full/pulse-2011-effects-on-aquatic-life 57/104
F E A T U R E A R T I C L E S
|
P H Y T O P L A N K T O N
55
T H E
P U L S E
O F
T H E
E S T U A R Y
2 0 1 1
CONCERNS FOR
INCREASING PHYTO-
PLANKTON BIOMASS
Recent data are showing some signicant changes to condi-
tions in San Francisco Bay, especially since the late 1990s,and particularly in San Pablo Bay, Central Bay, and South
Bay.ese changes include larger spring blooms, increased
incidence of fall blooms, and increases in the annual biomass
minimum (FIGURE 5). Although most pronounced in the
South Bay, increases have been observed in every region of the
Bay (McKee et al. 2011). Evidence is bui lding that the historic
resilience of the Bay to potentially harmful e ects of eutrophi-
cation may be waning.
The 2006 Pulse of the Estuary reported on the increased
phytoplankton biomass, presenting several possible hy-potheses to explain the trend, including increased transpar-
ency, decreased metal toxicity, large-scale oceanographic
processes, decreased predator grazing, and changes in the
invasive species mix in the Bay (Cloern et al. 2006).
Increased transparency is one logical explanation. e 2009
Pulse of the Estuary focused on a major shi in water quality
that occurred in 1999 (Jassby et al. 2002, Schoellhamer
2009). In just one year, suspended sediment concentrations
decreased by about 40%, most likely a result of depleting
the pool of sediments sent down waterways during the GoldRush. at increase in water clarity is expected to continue
and may serve to fuel increased phytoplankton production.
Continued improvements to municipal wastewater treat-
ment and better controls on industrial discharges may also
have contributed to increases in phytoplankton biomass.
For example, annual loads of cadmium, copper, and other
toxic metals have declined greatly since the 1980s. These
metals may affect phytoplankton growth and production.
Large-scale processes are also an
important driving force. Oceano-
graphic conditions can vary on long
time scales, and conditions during
1992–2003 were more favorable to
region-wide growth of phytoplankton,particularly diatoms, than conditions
during 1975–1986. A change in the
California Current System, which
extends from Oregon to Baja Califor-
nia, brought stronger upwelling to the
region, a situation in which nutrient-
rich bottom waters are brought to the
surface, promoting increased produc-
tivity (Cloern et al. 2007, Cloern et
the Bay at the Golden Gate, containshigh levels of nitrate, phosphate, and
silicate. Diatoms are characterized by cell walls contain-
ing silicate. In those areas of the Bay where conditions
are favorable, intrusions of oceanic water are expected to
enhance phytoplankton production. In 2011, scientists
are learning that such intrusions may have other environ-
mental effects as well (SIDEBAR, PAGE 58).
e upwelling in the late 1990s was also good for Dunge-
ness crabs, sanddabs, and other atsh that feed on the
clams that exert great grazing pressure on the phytoplanktonpopulations (Cloern et al. 2007, Cloern et al. 2010). Cold,
nutrient-rich waters along the coast drove the increases in
Dungeness crabs and atsh in the marine portions of the
Bay. e biomass of clam predators increased four-fold, and
particularly in the South Bay, the lter-feeding clam popula-
tions plummeted (FIGURE 6). ese results are especially
important, because they point to long-term, broad-scale
forces beyond the control of water quality managers.
New invasive species may also have played a role. San
Francisco Bay is one of the most invaded estuaries in the
world, with new species continually changing community
composition, species interactions, and ecological processes.
Two new species of predatory zooplankton were found in
the late 1990s. These new arrivals reduced the populationsof existing zooplankton species that fed on phytoplankton,
further reducing grazing pressure (Hoof and Bollens 2004).
No matter the cause, be it changing water clarity, grazing,
or changing inputs and influences from the Pacific Ocean,
recent evidence suggests that the resilience of the phyto-
plankton populations to high nutrient loads is decreasing,
and phytoplankton productivity is increasing, particularly
in the South Bay.
Skeletonema costatum. Photograph by Mariella Saggiomo.
56

8/3/2019 Pulse 2011 - Effects on Aquatic Life
http://slidepdf.com/reader/full/pulse-2011-effects-on-aquatic-life 58/104
56 FEATURE ARTICLES | PHYTOPLANKTON
C h l o r o p h y l l a
( µ g / L )
1980 1985 1990 1995 2000 2005
2
4
6 FIGURE 5roughout the Bay, chlorophyll levels have increased
since the late 1990s, particularly in the South Bay. Dataare for the South Bay, August-December (Cloern and Dug-dale 2010). Bars show the middle 50% of values for each year.
57

8/3/2019 Pulse 2011 - Effects on Aquatic Life
http://slidepdf.com/reader/full/pulse-2011-effects-on-aquatic-life 59/104
F E A T U R E A R T I C L E S
| P H Y T O P L A N K T O N
57
T H E
P U L S E
O F
T H E
E S T U A R Y
2 0 1 1
English Sole Bay Shrimp Dungeness Crab
D
E
1980 1985 1990 1995 2000
A n n u a l C a t c h p
e r H e c t a r e
g ( d r y ) p e
r m 2
8
6
4
2
0
20
15
10
5
0
FIGURE 6Top: Mean annual catch per hectare of the bivalve
predators English sole, Bay shri mp, and Dungenesscrab from the marine domains of San Francisco Bay. Datafrom California Department of Fish and Game, presented inCloern et al. (2007).
Boom: Annual median biomass of lter-feedingclams across the shallow habitats of the South Bay.
58 |

8/3/2019 Pulse 2011 - Effects on Aquatic Life
http://slidepdf.com/reader/full/pulse-2011-effects-on-aquatic-life 60/104
58 FEATURE ARTICLES | PHYTOPLANKTON
SIDEBAR
EXCEPTIONAL CONDITIONS
IN SPRING 2011
San Francisco Bay is usually well mixed. In most other estuaries
and coastal waters, seasonal changes in water temperatures and
salinities create stratified conditions, which effectively separate
surface and bottom waters. Phytoplankton in the surface waters
deplete the available nutrients and then die, sinking through the
temperature and salinity barrier to the bottom. While oxygen
levels remain high in the surface waters, levels fall in the bottom
waters, as bottom-dwelling animals respire, and bacteria use up
oxygen as the phytoplankton decompose. Such conditions do not
usually occur in the Bay.
-
out the following summer showed a radically di fferent pattern than
the usual (FIGURE). There was extremely strong stratification,
with high levels of chlorophyll in the surface layer and record low
levels of dissolved oxygen in the bottom waters. Scientists from
-
vironmental Studies and the Water Board were sampling in Suisun
Bay at the same time and also reported strong stratification.
Preliminary analysis of the data suggested that the stratificationresulted from an intrusion of ocean water into the Bay. Cold, salty
water moved into the Bay and remained at the bottom, isolated
from the surface waters. The April 2011 observations were impor-
tant, as they showed that extremely low levels of dissolved oxygen
can occur, even without local eutrophication and phytoplankton
with the wider oceanic regime will be important to understanding
the ongoing changes in Bay water quality.
The USGS Research Vessel Polaris. Photograph by Nicole David.
59

8/3/2019 Pulse 2011 - Effects on Aquatic Life
http://slidepdf.com/reader/full/pulse-2011-effects-on-aquatic-life 61/104
F E A T U R E A R T I C L E S
| P H Y T O P L A N K T O N
59
T H E
P U L S E
O F
T H E
E S T U A R Y
2 0 1 1
Chlorophyll, salinity, temperature, suspended particulate maer,and dissolved oxygen concentrations in the South Bay on Apri l12, 2011, during an unusua l period of stratication (ScreenGraphs show depth proles along the transect shown on the mapat the top.
60 FEATURE ARTICLES | PHYTOPLANKTON
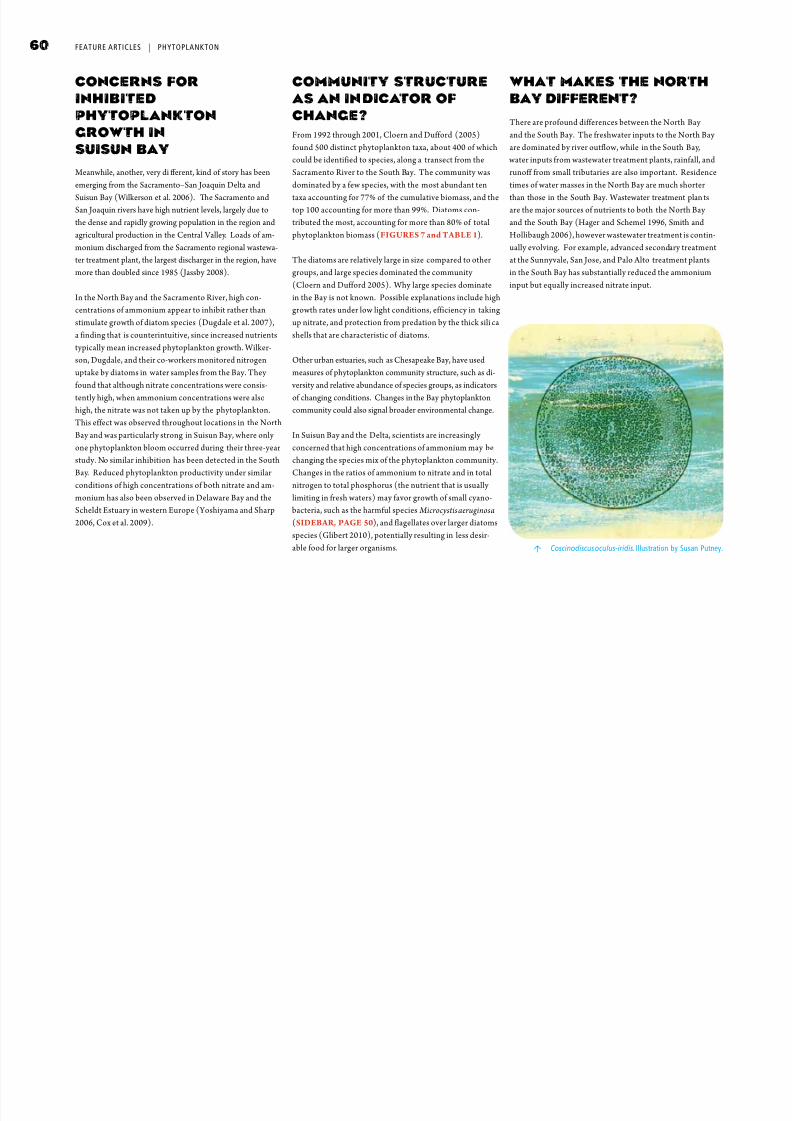
8/3/2019 Pulse 2011 - Effects on Aquatic Life
http://slidepdf.com/reader/full/pulse-2011-effects-on-aquatic-life 62/104
60 FEATURE ARTICLES | PHYTOPLANKTON
CONCERNS FOR
INHIBITED
PHYTOPLANKTON
GROWTH IN
SUISUN BAY
Meanwhile, another, very di erent, kind of story has been
emerging from the Sacramento–San Joaquin Delta and
Suisun Bay (Wilkerson et al. 2006). e Sacramento and
San Joaquin rivers have high nutrient levels, largely due to
the dense and rapidly growing population in the region and
agricultural production in the Central Valley. Loads of am-
monium discharged from the Sacramento regional wastewa-
ter treatment plant, the largest discharger in the region, have
more than doubled since 1985 (Jassby 2008).
In the North Bay and the Sacramento River, high con-
centrations of ammonium appear to inhibit rather than
stimulate growth of diatom species (Dugdale et al. 2007),
a finding that is counterintuitive, since increased nutrients
typically mean increased phytoplankton growth. Wilker-
son, Dugdale, and their co-workers monitored nitrogen
uptake by diatoms in water samples from the Bay. They
found that although nitrate concentrations were consis-
tently high, when ammonium concentrations were also
high, the nitrate was not taken up by the phytoplankton.
This effect was observed throughout locations in the NorthBay and was particularly strong in Suisun Bay, where only
one phytoplankton bloom occurred during their three-year
study. No similar inhibition has been detected in the South
Bay. Reduced phytoplankton productivity under similar
conditions of high concentrations of both nitrate and am-
monium has also been observed in Delaware Bay and the
Scheldt Estuary in western Europe (Yoshiyama and Sharp
2006, Cox et al. 2009).
COMMUNITY STRUCTURE
AS AN INDICATOR OF
CHANGE?
From 1992 through 2001, Cloern and Dufford (2005)
found 500 distinct phytoplankton taxa, about 400 of whichcould be identified to species, along a transect from the
Sacramento River to the South Bay. The community was
dominated by a few species, with the most abundant ten
taxa accounting for 77% of the cumulative biomass, and the
top 100 accounting for more than 99%. Diatoms con-
tributed the most, accounting for more than 80% of total
phytoplankton biomass (FIGURES 7 and TABLE 1).
The diatoms are relatively large in size compared to other
groups, and large species dominated the community
(Cloern and Dufford 2005). Why large species dominatein the Bay is not known. Possible explanations include high
growth rates under low light conditions, efficiency in taking
up nitrate, and protection from predation by the thick sili ca
shells that are characteristic of diatoms.
Other urban estuaries, such as Chesapeake Bay, have used
measures of phytoplankton community structure, such as di-
versity and relative abundance of species groups, as indicators
of changing conditions. Changes in the Bay phytoplankton
community could also signal broader environmental change.
In Suisun Bay and the Delta, scientists are increasingly
concerned that high concentrations of ammonium may be
changing the species mix of the phytoplankton community.
Changes in the ratios of ammonium to nitrate and in total
nitrogen to total phosphorus (the nutrient that is usually
limiting in fresh waters) may favor growth of small cyano-
bacteria, such as the harmful species Microcystis aeruginosa
(SIDEBAR, PAGE 50), and flagellates over larger diatoms
species (Glibert 2010), potentially resulting in less desir-
able food for larger organisms.
WHAT MAKES THE NORTH
BAY DIFFERENT?
There are profound differences between the North Bay
and the South Bay. The freshwater inputs to the North Bay
are dominated by river outflow, while in the South Bay, water inputs from wastewater treatment plants, rainfall, and
runoff from small tributaries are also important. Residence
times of water masses in the North Bay are much shorter
than those in the South Bay. Wastewater treatment plan ts
are the major sources of nutrients to both the North Bay
and the South Bay (Hager and Schemel 1996, Smith and
Hollibaugh 2006), however wastewater treatment is contin-
ually evolving. For example, advanced secondary treatment
at the Sunnyvale, San Jose, and Palo Alto treatment plants
in the South Bay has substantially reduced the ammonium
input but equally increased nitrate input.
Coscinodiscus oculus-iridis. Illustration by Susan Putney.
61

8/3/2019 Pulse 2011 - Effects on Aquatic Life
http://slidepdf.com/reader/full/pulse-2011-effects-on-aquatic-life 63/104
F E A T U R E A R T I C L E S
| P H Y T O P L A N K T O N
61
T H E
P U L S E
O F
T H E
E S T U A R Y
2 0 1 1
TABLE 1Twenty most abundant phytoplankton species in the Bay, based on biomass.
From Cloern and Dufford (2005).
FIGURE 7 Relative contribution to total phytoplankton biomass and cumulativefrequency by cell size, showing that San Francisco Bay is dominated by large phytoplankton species. from the Sacramento R iver to the South Bay in 1992–2001.)
P r o p o r t i o n o f B
i o m a s s
Cell Size (m)
0.2
0
0.40.2
0.60.2
0.80.2
1.0
4 6 8 10 20 40 60 80 100
Cryptophytes 5%Other 1%
Mesodinium 2%
Dinoflagellates 11%
Diatoms81%
Cells larger than 10 umaccount for more than80% of the biomass
From Cloern, J.E., R. Dufford. 2005. Phytoplankton community ecology: principlesapplied in San Francisco Bay. Marine Ecology Progress Series, 285:11-28.
1. Thalassiosira rotula
2. Chaetoceros socialis
3. Skeletonema costatum
4. Ditylum brightwellii
5. Gymnodinium sanguineum
6. Coscinodiscus oculus-iridis
7. Thalassiosira hendeyil
8. Thalassiosira punctigera
9. Plagioselmis prolonga var. nordica
10. Coscinodiscus curvatulus
11. Mesodinium rubrum
12. Teleaulax amphioxeia
13. Chaetoceros debilis
14. Eucampia zodiacus
15. Coscinodiscus radiatus16. Thalassiosira eccentrica
17. Protoperidinium sp.
18. Thalassiosira decipiens
19. Coscinodiscus centralis var. pacifica
20. Rhizosolenia setigera
62 FEATURE ARTICLES | PHYTOPLANKTON

8/3/2019 Pulse 2011 - Effects on Aquatic Life
http://slidepdf.com/reader/full/pulse-2011-effects-on-aquatic-life 64/104
62 FEATURE ARTICLES | PHYTOPLANKTON
STUDIES UNDERWAY
chlorophyll at 39 xed sampling locations, located about
3–6 kilometers apart from the southern limit of the South
Bay to the Sacramento River ( FIGURE 9). e programincludes monthly measurements of chlorophyll, nitrate, ni-
trite, ammonium, phosphate, and silicate. Data are available
The Interagency Ecological Program (IEP) for the San
Francisco Bay/Sacramento–San Joaquin Estuary, wi th ten
member agencies, collects water quality data and other
environmental information that can be used to complement
The IEP Environmental Monitoring Program has 40 years
of data from the Delta and the North Bay.
e state and regional water boards, through the Surface Wa-
ter Ambient Monitoring Program (SWAMP), also continue
to monitor nutrients, with a particular focus on ammonium
and its a ect on phytoplankton blooms in the Delta and
in Suisun Bay. During March through July 2010, scientists
repeatedly sampled seven stations in Suisun Bay (Taberskiet al. 2010). Blooms (dened as chlorophyll concentrations
of 30 g/L or greater) were detected during two of the sam-
pling events, one in mid-April and the other in late May. e
analysis of the blooms aributes them to a combination of
reduced ammonium loading and increased river ow, result-
ing in relatively low ammonium concentrations in the river
as it owed into Suisun Bay (Dugdale et al. submied).
This study is ongoing, and sampling continued in 201l.
Its objectives include determining effects of ammonium
on phytoplankton production and other topics, includingeffects of the invasive clam Corbula and the composi-
tion of the phytoplankton community during bloom and
non-bloom sampling events. The study is also identify-
ing springtime sources of ammonium to Suisun Bay and
comparing spatial patterns of nutrient concentrations, chlo-
rophyll concentrations, primary production, and nitrogen
uptake by phytoplankton. Other goals include investigatingthe role of greater water transparency and the possible ef-
fects of copper, herbicides, and pesticides, through toxicity
tests and Toxicity Identification Evaluations (TIEs). A
coalition including SWAMP, the State and Federal Water
Contractors, the Bay Area Clean Water Agencies (BAC-
WA), and Central Contra Costa County Sanitary District is
funding these studies.
Agencies with permits to discharge stormwater to the Bay
under the Municipal Regional Stormwater Permit (MRP)
are beginning a program to monitor stormwater loads at six stations over three years. Consistent with the MRP and the
Small Tributaries Loading Strategy, the RMP plans to col-
lect specific data on nutrients and other contaminants that
will support development of a regional model for estimat-
ing loads by extrapolation from local studies.
As part of a state-wide e ort, the Water Boards are working
towards developing nutrient objectives for San Francisco
Bay. RMP scienti sts are currently evaluating available data to
identify appropriate indicators of nutrient impacts (McKee
et al. 2011). Possible indicators include water clarity, phyto-plankton productivity and biomass, incidence of harmful or
nuisance algal blooms, and dissolved oxygen. e indicators
will be used to build a Nutrient Numeric Endpoint frame-
work to assess the status of nutrients and their water quality
impacts throughout the Bay. A workplan, developed in coor-
dination with the new San Francisco Bay Nutrient Strategy,
will identify special studies needed to build the assessment
framework and beer understand nutrient issues.
Top left. Chaetoceros socialis.
Top right. Protoperidinium sp.
Bottom left. Mesodinium rubrum.
Bottom right. Ditylum brightwellii.
Illustrations by Susan Putney.
63Station 15
Station 15 Station 6
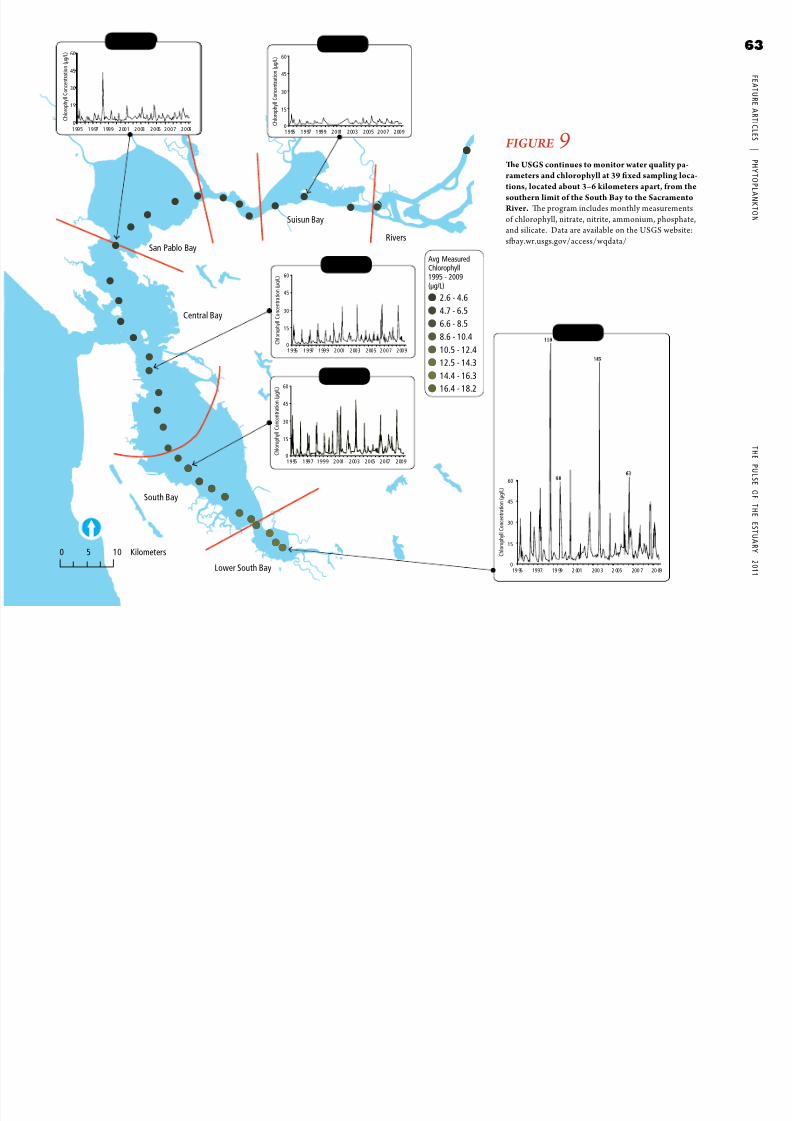
8/3/2019 Pulse 2011 - Effects on Aquatic Life
http://slidepdf.com/reader/full/pulse-2011-effects-on-aquatic-life 65/104
F E A T U R E A R T I C L E S
| P H Y T O P L A N K T O N
63
T H E
P U L S E
O F
T H E
E S T U A R Y
2 0 1 1
!(
!(!(!(
!(!(!(!(!(!(
!(
!!
!!
!
!!!
!
!
!
!
!
!
!
!
!
!
!
!
!
!
!
!
!!!
!!!!!!
!
0 105 Kilometers
Lower South Bay
South Bay
Central Bay
San Pablo Bay
Suisun Bay
Rivers
Avg MeasuredChlorophyll1995 - 2009
(µg/L)!( 2.6 - 4.6
!( 4.7 - 6.5
!( 6.6 - 8.5
!( 8.6 - 10.4
!( 10.5 - 12.4
!( 12.5 - 14.3
!( 14.4 - 16.3
!( 16.4 - 18.2
Station 21
15
30
45
60
0 C h l o r o p h y l l C o n c e n t r a t i o n (
µ g / L )
15
30
45
60
0 C h l o r o p h y l l C o n c e n t r a t i o n (
µ g / L )
Stat o 6
1 99 5 1 9 97 1 99 9 2 00 1 2 0 03 2 0 05 2 0 0 7 2 0 091 9 95 1 9 97 1 99 9 2 0 01 2 00 3 2 00 5 2 0 0 7 2 00 9
15
30
45
60
0 C h l o r o p h y l l C o n c e n t r a t i o n (
µ g / L )
1 9 95 1 9 97 1 99 9 2 0 01 2 00 3 2 00 5 2 0 0 7 2 00 9
Station 27
Station 36
15
30
45
60
0 C h l o r o p h y l l C o n c e n t r a t i o n (
µ g / L )
1 9 95 1 99 7 1 9 9 9 2 0 01 2 00 3 2 0 05 2 0 07 2 00 9
15
30
45
60
0
C h l o r o p h y l l C o n c e n t r a t i o n (
µ g / L )
19 95 1997 19 99 2 001 200 3 2 005 200 7 20 09
FIGURE
9e USGS continues to monitor water quality pa-rameters and chlorophyll at 39 xed sampling loca-tions, located about 3–6 kilometers apart, from thesouthern limit of the South Bay to the SacramentoRiver. e program includes monthly measurementsof chlorophyll, nitrate, nitrite, ammonium, phosphate,
64 FEATURE ARTICLES | PHYTOPLANKTON

8/3/2019 Pulse 2011 - Effects on Aquatic Life
http://slidepdf.com/reader/full/pulse-2011-effects-on-aquatic-life 66/104
64 FEATURE ARTICLES | PHYTOPLANKTON
ADDITIONAL
SCIENCE NEEDS
The complex and sometimes seemingly paradoxical scenar-
ios emerging from San Francisco Bay show the importance
of continued monitoring, research, and modeling. The biggest overall question is whether there are plausible sce-
narios in which the Bay will start to exhibit the symptoms
of eutrophication due to nutrient enrichment that have
been observed in so many other estuaries.
ammonium inhibition, will also be important to deter-mining appropriate management responses to changing
conditions. One hopeful scenario might be the restoration
of primary productivity in nor thern portions of the Bay fol-
lowing controls on ammonium discharges, which are likely
to be imposed by the Water Boards. The Scheldt estuary
of western Europe, where zooplankton communities are
changing in response to nutrient reductions, may provide a
glimpse of what could occur in the Bay (Mialet et al. 2011).
Information gaps are many, and future trends are dif ficult
to predict. The lessons f rom other ecosystems show that
each estuary is unique, further emphasizing the impor tance
phytoplankton dynamics in San Francisco Bay is espe-
cially important, because future conditions could make itnecessary to reduce agricultural or sewage loads. Reduc-
ing agricultural loads, through enhancement of fringing
wetlands and buffer strips, has been an important focus in
Chesapeake Bay and the Mississippi River Delta. Advanced
secondary treatment has already been implemented at the
Palo Alto, Sunnyvale, and San Jose/Santa Clara treatmentplants, and additional advanced secondary treatment
and/or nitrogen-removal technologies may be warranted.
Nitrogen removal has been necessary in many other urban
estuaries around the world.
The new San Francisco Bay Nutrient Strategy is in-
creasing the focus on information gaps and the present
uncertainty surrounding future projections. One focus
is to better understand quantities, timing, and composi-
tion of loads. Although it is known that nutrient loading
to the Bay is high, there is no detailed understanding of
the relative magnitude of loads from individual sources
and pathways. Obtaining this information, which will be
necessary if future conditions suggest that inputs mustdecline, is key.
There has also been no systematic assessment of phy-
toplankton production and species composition within
the Bay and no monitoring of phytoplankton outside the
Golden Gate. Nor is there systematic monitoring of zoo-plankton or benthic grazers. Another key need is for predic-
tive simulation models to assess and manage nutrients and
phytoplankton in the Bay. The RMP is looking to partner
with other programs to rise to the challenge of addressing
these substantial information needs and providing a solid
technical foundation for the consequential decisions that
are on the horizon.
The biggest overall question is whether there are plausible scenarios in whichthe Bay wil l start to exhibit the symptoms of eutrophication due to nutrientenrichment that have been observed in so many other estuaries
65
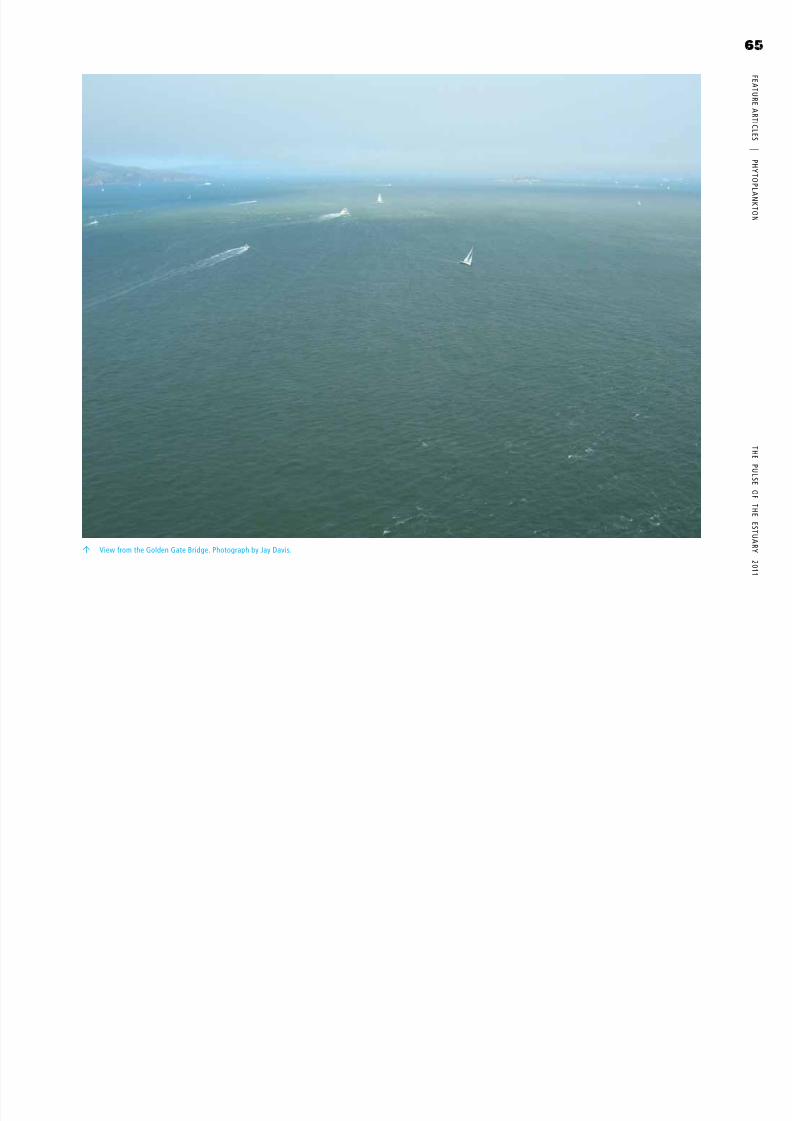
8/3/2019 Pulse 2011 - Effects on Aquatic Life
http://slidepdf.com/reader/full/pulse-2011-effects-on-aquatic-life 67/104
F E A T U R E A R T I C L E S
| P H Y T O P L A N K T O N
65
T H E
P U L S E
O F
T H E
E S T U A R Y
2 0 1 1
View from the Golden Gate Bridge. Photograph by Jay Davis.
66 FEATURE ARTICLES | FISH
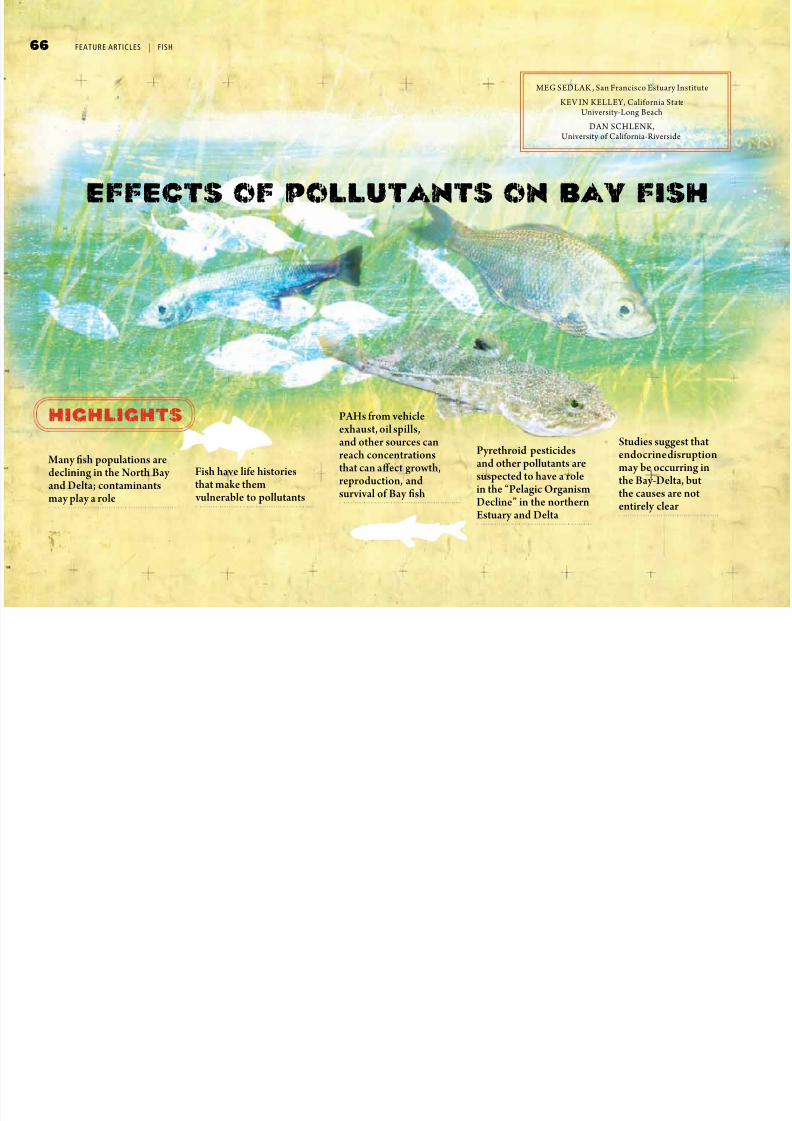
8/3/2019 Pulse 2011 - Effects on Aquatic Life
http://slidepdf.com/reader/full/pulse-2011-effects-on-aquatic-life 68/104
66 FEATURE ARTICLES | FISH
MEG SEDLAK , San Francisco Estuary Institute
KEV IN KELLEY, California State
DAN SCHLENK,
Many sh populations aredeclining in the North Bay and Delta; contaminantsmay play a role
Fish have life historiesthat make them
vulnerable to pollutants
PAHs from vehicleexhaust, oil spills,and other sources canreach concentrationsthat can a ect growth,reproduction, andsurvival of Bay sh
Pyrethroid pesticidesand other pollutants aresuspected to have a rolein the “Pelagic OrganismDecline” in the northernEstuary and Delta
Studies suggest thatendocrine disruptionmay be occurring inthe Bay-Delta, butthe causes are notentirely clear
effects of pollutants on bay fish
highlights
67
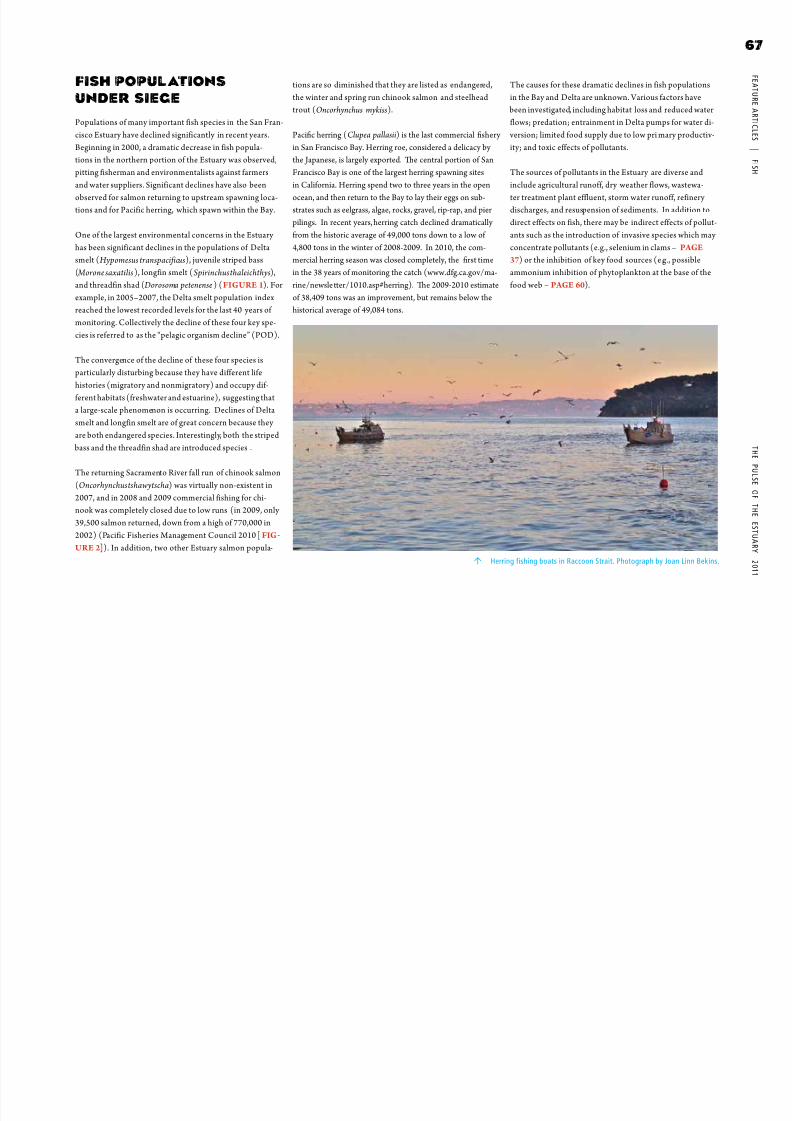
8/3/2019 Pulse 2011 - Effects on Aquatic Life
http://slidepdf.com/reader/full/pulse-2011-effects-on-aquatic-life 69/104
F E A T U R E A R T I C L E S
| F I S H
T H E
P U L S E
O F
T H E
E S T U A R Y
2 0 1 1
FISH POPULATIONS
UNDER SIEGE
Populations of many important fish species in the San Fran-
cisco Estuary have declined significantly in recent years.
Beginning in 2000, a dramatic decrease in fish popula-tions in the northern portion of the Estuary was observed,
pitting fisherman and environmentalists against farmers
and water suppliers. Significant declines have also been
observed for salmon returning to upstream spawning loca-
tions and for Pacific herring, which spawn within the Bay.
One of the largest environmental concerns in the Estuary
has been significant declines in the populations of Delta
smelt (Hypomesus transpacificus), juvenile striped bass
( Morone saxatilis ), longfin smelt (Spirinchus thaleichthys),
and threadfin shad ( Dorosoma petenense ) (FIGURE 1). Forexample, in 2005–2007, the Delta smelt population index
reached the lowest recorded levels for the last 40 years of
monitoring. Collectively the decline of these four key spe-
cies is referred to as the “pelagic organism decline” (POD).
The convergence of the decline of these four species is
particularly disturbing because they have different life
histories (migratory and nonmigratory) and occupy dif-
ferent habitats (freshwater and estuarine), suggesting that
a large-scale phenomenon is occurring. Declines of Delta
smelt and longfin smelt are of great concern because they are both endangered species. Interestingly, both the striped
bass and the threadfin shad are introduced species .
The returning Sacramento River fall run of chinook salmon
(Oncorhynchus tshawytscha) was virtually non-existent in
2007, and in 2008 and 2009 commercial fishing for chi-
nook was completely closed due to low runs (in 2009, only
39,500 salmon returned, down from a high of 770,000 in
FIG
URE 2-
tions are so diminished that they are listed as endangered,
the winter and spring run chinook salmon and steelhead
trout (Oncorhynchus mykiss).
Pacic herring (Clupea pallasii) is the last commercial shery
in San Francisco Bay. Herring roe, considered a delicacy by the Japanese, is largely exported. e central portion of San
Francisco Bay is one of the largest herring spawning sites
in California. Herring spend two to three years in the open
ocean, and then return to the Bay to lay their eggs on sub-
strates such as eelgrass, algae, rocks, gravel, rip-rap, and pier
pilings. In recent years, herring catch declined dramatically
from the historic average of 49,000 tons down to a low of
4,800 tons in the winter of 2008-2009. In 2010, the com-
mercial herring season was closed completely, the rst time
in the 38 years of monitoring the catch (www.dfg.ca.gov/ma-
rine/newsleer/1010.asp#herring). e 2009-2010 estimateof 38,409 tons was an improvement, but remains below the
historical average of 49,084 tons.
The causes for these dramatic declines in fish populations
in the Bay and Delta are unknown. Various factors have
been investigated, including habitat loss and reduced water
flows; predation; entrainment in Delta pumps for water di-
version; limited food supply due to low pri mary productiv-
ity; and toxic effects of pollutants.
The sources of pollutants in the Estuary are diverse and
include agricultural runoff, dry weather flows, wastewa-
ter treatment plant effluent, storm water runoff, refinery
discharges, and resuspension of sediments. In addition to
direct effects on fish, there may be indirect effects of pollut-
ants such as the introduction of invasive species which may
concentrate pollutants (e.g., selenium in clams – PAGE
37) or the inhibition of key food sources (e.g., possible
ammonium inhibition of phytoplankton at the base of the
food web – PAGE 60).
Herring fishing boats in Raccoon Strait. Photograph by Joan Linn Bekins.
68 FEATURE ARTICLES | FISH

8/3/2019 Pulse 2011 - Effects on Aquatic Life
http://slidepdf.com/reader/full/pulse-2011-effects-on-aquatic-life 70/104
|
LONGFIN SMELT THREADFIN SHAD
DELTA SMELT STRIPED BASS
1 9 6 6
1 9 7 0
1 9 7 4
1 9 7 8
1 9 8 2
1 9 8 6
1 9 9 0
1 9 9 4
1 9 9 8
2 0 0 2
2 0 0 0
2 0 0 6
1 9 6 6
1 9 7 0
1 9 7 4
1 9 7 8
1 9 8 2
1 9 8 6
1 9 9 0
1 9 9 4
1 9 9 8
2 0 0 2
2 0 0 0
2 0 0 6
1 9
6 6
1 9
7 0
1 9
7 4
1 9
7 8
1 9
8 2
1 9
8 6
1 9
9 0
1 9
9 4
1 9
9 8
2 0
0 2
2 0 0
0
2 0
0 6
1 9 6 6
1 9 7 0
1 9 7 4
1 9 7 8
1 9 8 2
1 9 8 6
1 9 9 0
1 9 9 4
1 9 9 8
2 0 0 2
2 0 0 0
2 0 0 6
1800
100000
80000
60000
40000
20000
0
16000
14000
12000
10000
8000
6000
4000
2000
0
20000
15000
10000
5000
0
1500
1200
900
600
300
0
A b u n d a n c e
A b u n d a n c e
A b u n d a n c e
A b u n d a n c e
FIGURE 1One of the largest environmentalconcerns in the Estuary has been sig-nicant declines in the populationsof Delta smelt ( Hypomesus transpaci-
cus), juvenile striped bass ( Morone
saxatilis), longn smelt (Spirinchus
thaleichthys), and threadn shad( Dorosoma petenense). For example,in 2005–2007, the Delta smelt popula-tion index reached the lowest recorded
levels for the last 40 years of monitor-ing. Collectively the decline of thesefour key species is referred to as the“pelagic organism decline” (POD).Declines of Delta smelt and longnsmelt are of great concern because t hey are both endangered species.
Footnote : From Baxter, R. et al. 2010. Interagency Ecologi cal Program 2010 Pelagic Organism Decline Work Plan and Synthesis of Results.
69

8/3/2019 Pulse 2011 - Effects on Aquatic Life
http://slidepdf.com/reader/full/pulse-2011-effects-on-aquatic-life 71/104
F E A T U R E A R T I C L E S
|
F I S H
T H E
P U L S E
O F
T H E
E S T U A R Y
2 0 1 1
Sacramento River Fall Run Chinook
1970 1975 1980 1985 1990 1995 2000 2005 2010
N u m b
e r o f R e t u r n i n g F i s h
0
100,000
900,000
200,000
300,000
400,000
500,000
600,000
700,000
800,000
Footnote: From Pacific Fisheries Management Council. 2010. Stock Assessment and Fisheries Evaluation (SAFE) 2010 Ocean Salmon Fisheries.
FIGURE 2e returning Sacramento River fall run of chinook salmon was at a long-term low in 2007, and in 2008 and2009 commercial shing for chinook was completely closed due to low runs (in 2009, only 39,500 salmonreturned, down from a high of 770,000 in 2002). ePacic Fisheries Management Council has set a goal of
between 122,000 to 180,000 returning sh.
70 FEATURE ARTICLES | FISH

8/3/2019 Pulse 2011 - Effects on Aquatic Life
http://slidepdf.com/reader/full/pulse-2011-effects-on-aquatic-life 72/104
FISH ARE SENSITIVE AND
IMPORTANT INDICATORS
Fish are very sensitive to pollutants. In part, this sensitivity
is attributable to their exposure to waterborne pollutants
throughout their lives. The vast majority of Bay fi sh speciesare oviparous (egg-laying) , dispersing thousands of eggs
directly into the water column or anchoring their eggs on
rigid structures such as pier piles. Once the eggs are fertil-
ized, they hatch, and then develop into juvenile fish and
adults. Pollutants can disrupt fish life cycles at many stages.
For example, exposure to the synthetic estrogen hormone
used in birth control pills, ethinylestradiol, at very low
concentrations (around 1 part per trillion) can cause male
fish to exhibit female characteristics (e.g., expression of the
female egg yolk protein, vitellogenin) (Jobling et al. 1998;
Rodgers-Gray et al. 2000). Similarly, exposure to part per billion concentrations of the detergent nonylphenol elicits
a similar response ( Jobling et al. 1996).
Fish are also particularly sensitive to chemical pollutants
because they have multiple routes of exposure, including
ingestion, aquatic respiration, and regulation of osmotic
pressure. Because water contains less oxygen than air, fish
respiration rates are about five times higher than mammals
(Van der Kraak et al. 2001). Gill surfaces must be quite
large to extract sufficient oxygen, and the active movement
of water across the gill increases exposure to waterbornepollutants. Fish in saline and freshwater environments are
also subject to changes that may increase their contaminant
burden as they move water through their bodies to regulate
the osmotic pressure.
Lastly, fish are susceptible to contaminant effects because
of fish is not genetically predetermined and may be influ-
enced by social and environmental factors. For example,
the California sheephead (Semicossyphus pulcher ) which
resides in the Southern California Bight, has one dominant
male and many females. When the dominant male dies, one
of the females will change sex to become the next domi-
nant male. Gender changes may also occur u pon exposure
to a class of chemical pollutants referred to as endocrinedisruptors. Municipal wastewater is one source of these
compounds, often containing trace amounts of steroid hor-
mones, surfactants such as nonylphenol, and many other
chemicals from pharmaceuticals, personal care products,
and consumer products. Furthermore, endocrine-disrupt-
ing chemicals can affect other physiological systems, and
are known to disrupt development and growth, metabo-
lism, immune responses, and other essential processes.
Numerous examples of contaminant effects on fish have
been documented throughout the world. Many pollutants
found in the Bay can elicit adverse effects at elevated levels,
including pesticides, polychlorinated biphenyls (PCBs),
polycyclic aromatic hydrocarbons (PAHs), dioxins, metals,
and endocrine disruptors such as ethinylestradiol, nonyl-
phenol and bisphenol A. The effects of these pollutants onfish are potentially significant and w ide-ranging: elimina-
tion of an entire fish population (17-α ethinylestradiol)
(Kidd et al. 2007), compromised immune systems (Reyn-
aud and Deschaux 2006), liver lesions (Myers et al. 2003),
thyroid dysfunction (Brar et al. 2010), and impairment of
the sense of smell (McIntyre et al. 2008). Many of these
effects occur at concentrations that are observed in the Bay.
Collection of herring for evaluation of effects of oil pollution.
Photograph courtesy of John Incardona.
71

8/3/2019 Pulse 2011 - Effects on Aquatic Life
http://slidepdf.com/reader/full/pulse-2011-effects-on-aquatic-life 73/104
F E A T U R E A R T I C L E S
|
F I S H
T H E
P U L S E
O F
T H E
E S T U A R Y
2 0 1 1
One of the challenges in evaluating pollutant effects on fish is
identifying a direct link between contaminant exposure and
a distinct measurable effect. Few pollutants have had impacts
that are as strongly linked to one contaminant as those associ-
ated with the bioaccumulation of DDT in birds in the 1970s
that resulted in eggshell thinning and population declines. Itis usually very difficult to tease out the impacts of a specific
pollutant on organisms in an environmental setting, and even
more difficult to identify impacts at the population level. The
effects of pollutants on organisms are often subtle, such as
impairment of neurological functions, growth rate, or immune
responses that contribute to adverse outcomes. For example,
low concentrations of pyrethroid insecticides can affect the
swimming ability of fish, making them more vulnerable to
predation (Connon et al. 2009). In addition, fish are exposed
to a myriad of other stressors that may exert even greater pres-
sures on populations, such as loss of habitat, disruptions frominvasive species, and reduction in prey. Isolati ng the effects of
a specific pollutant or pollutant mixtures with so many other
simultaneous stressors is a challenge.
Fish health is an important metric in assessing the health of an
estuary as fish are crit ical components of the food web. Many
higher trophic animals, including seals, cormorants, and stur-
geon, depend upon small fish as prey. Fish from estuaries are
also consumed by humans (PAGE 15). Fish health monitoring
is frequently included in other major water quality programs,
including those in the Southern California Bight, Puget Sound,Great Lakes, and along the Eastern seaboard, and allow us to
place Bay results in context.
SIDEBAR
EXPOSURE AND EFFECTS WORKGROUP
e RMP Exposure and E ects Workgroup provides oversighton RMP studies relating to the e ects of toxic pollutants on
aquatic life, including the work on sh, birds, and seals that issummarized in this edition of e Pulse.
Advisory Panel
MICHAEL F RY,
HARRY OHLENDORF, CH2M Hill
DANIEL SCHLENK
California – Riverside
STEVE WEISBERG, Southern California
Coastal Water Research Project
DON WESTON
Berkeley
Stakeholders
KAREN TABERSKI, San Francisco Bay Regional
Water Quality Control Board
NAOMI FEGER, San Francisco Bay Regional
Water Quality Control Board
MICHAEL KELLOGG, City and County
of San Francisco
ARLEEN FENG, Alameda County
JOE DILLON, National Marine Fisheries Service
, National Marine Fisheries
Service
JOSH ACKERMAN, Western Ecological Research
BRYN PHILLIPS
BRIAN ANDERSON,
California-Davis
72 FEATURE ARTICLES | FISH

8/3/2019 Pulse 2011 - Effects on Aquatic Life
http://slidepdf.com/reader/full/pulse-2011-effects-on-aquatic-life 74/104
FINDINGS FROM RECENT
BAY AREA STUDIES
COMBUSTION, OIL SPILLS, AND PAHS
Fish are highly sensitive to PAHs, a diverse family of compounds that can cause a number of adverse effects
including heart malfunctions, liver lesions, abnormal larval
development, and death. Sources of PAHs to the Bay are
both natural and anthropogenic and include combustion of
fossil fuels and wood, forest fires, petroleum refining, and
oil spills. PAHs are made up of linked hydrocarbon rings,
ranging from relatively light weight two-ring compounds to
heavier compounds with six rings or more. PAHs consisting
of two to four rings are typically derived from petroleum
compounds (e.g., naphthalene, fluorene, di benzothiophene,
phenanthrene and anthracene), while four- to six-ring com-pounds are typically t he result of combustion (e.g., pyrene,
benz(a)anthracene, and chrysene).
Exposure of adult sh to PAHs can cause suppression of
immune systems; lesions on gills, skin, and ns; liver lesions;
and reproductive dysfunction. e National Oceanic and
Atmospheric Administration (NOAA) identied signicant
adverse e ects occurring in English sole ( Parophrys vetulus)
located in areas of PAH-contaminated sediments on the West
-
served an increase in liver lesions, failure to spawn, poor eggquality, and a decline in growth rates (Johnson et al. 2002).
Bay sediments commonly exceed 1 ppm, the concentration
suggested by NOAA as a sediment-quality threshold.
PAHs are widely dispersed throughout the Bay, with areas
of elevated concentrations near the former fuel depots
along the San Francisco waterfront and near the industrial
port of Oakland Harbor (PAGE 33). Oil spills are another
source of PAHs to the Bay. Fortunately, oil spills in the Bay
occur relatively infrequently. In the last 100 years, there
have been three major spills in the Bay: the collision of
a passenger steamer and oil tanker in 1937 that caused a
release of approximately 2,400,000 gallons; a 1971 collision
of two tankers spilling 900,000 gallons of partially refinedfuel oil; and, most recently, the Cosco Busan tanker that
gouged its hull on a Bay Bridge support releasing 54,000
gallons of bunker fuel oil in 2007 .
As a result of oil spills around the country, particularly the
Exxon Valdez in Alaska and more recently the Cosco Busan
in the Bay, the adverse effects of PAH exposure have been
extensively studied. The timing of exposure and the typ e
of PAH greatly affect the outcome. Fish larvae exposed to
high enough concentrations of the three-ring PAHs present
in unrefined crude oil (e.g., fluorenes, dibenzothiophenes,and phenanthrenes) experience swellings in the heart and
yolk sac, small jaws, deformed spines, reduced heart rate,
and heart arrhythmia (FIGURE 3). Pacific herring col-
lected in oiled areas of the Bay after the Cosco Busan spi ll
exhibited many of these effects (Incardona et al. 2008).
The research evaluating the effects of the Cosco Busan spill
found higher acute toxicity in intertidal areas where fuel
oil was exposed to sunlight. Subsequent laboratory studies
have not yet identified the mechanism by which this oc-
biota (Oris and Giesy 1985).
With funding from the Regional Monitoring Program for
Water Quality in the San Francisco Estuary, NOAA is cur-
rently investigating thresholds for PAH effects in juvenile
flatfish. The focus is on the higher molecular weight,
pyrogenic PAHs that result from combustion of petroleum
products and that are endemic to industrial and heavily
urbanized estuaries such as San Francisco Bay. The project
is divided into three phases. The first phase assessed the
effects of individual pyrogenic PAHs on the development
of a laboratory model fish, the zebra fish, Danio rerio .
After these effects were characterized, in the second phase,
experiments on the effect of individual PAHs on Californiahalibut, Paralichthys californicus , are being conducted. Cali-
fornia halibut was selected because it is a resident species
that spawns in the Bay. After the effects of individual PAHs
on California halibut have been identified, the researchers
will use real-world sediments containing similar levels and
mixtures of PAHs as Bay sediments to assess the effects to
developing California halibut and other flatfish.
ROLE OF POLLUTANTS IN THE POD
Pesticides and their effects on fish have been a major focusof the POD research in the Delta. Pesticides are used
extensively in Central Valley agriculture, and the use of py-
rethroids for urban applications in California has increased
dramatically since 1999 with the phase out of organophos-
phate pesticides (2006 Pulse of the Estuary, PAGE 71).
Pyrethroids have been detected in California waters at con-
centrations that can be harmful to fish. P yrethroids are par-
ticularly toxic to fish, blocking the sodium and potassium
channels in nerve cells resulting in tremors, impaired swim-
ming ability, convulsions, and, at high enough concentra-
tions, death. Impairment of swimming ability causes thesefish to be more susceptible to predation. The pyrethroid
esfenvalerate has been shown to impair swimming abi lity
of larval Delta smelt at concentrations as low as 62 ng/L
(Connon et al. 2009). Pyrethroids have also been shown to
inhibit growth and immune responses and delay spawning
(Connon et al. 2009). The concentrations at w hich effects
can occur are as low as 25 ng/L (Floyd et al. 2008). Labora-
tory studies found that juvenile chinook salmon exposed to
esfenvalerate and a virus had a significantly higher mortal-
73

8/3/2019 Pulse 2011 - Effects on Aquatic Life
http://slidepdf.com/reader/full/pulse-2011-effects-on-aquatic-life 75/104
F E A T U R E A R T I C L E S
|
F I S H
T H E
P U L S E
O F
T H E
E S T U A R Y
2 0 1 1
Photographs by John Incardona.
FIGURE 3Fish larvae exposed to high enough concentrations of the three-ring PAHs present in unrened crude oil (e.g.,uorenes, dibenzothiophenes, and phenanthrenes) experience swellings i n the heart and yolk sac, smal l jaws,deformed spines, reduced heart rate, and heart arrhythmia. Pacic herring collected in oiled areas of t he Bay aerthe Cosco Busan spill ex hibited many of these e ects.
YOLK YOLK
YOLK YOLK
Clean Water Oil Contaminated Water
ZebraFish
Herring
74 FEATURE ARTICLES | FISH

8/3/2019 Pulse 2011 - Effects on Aquatic Life
http://slidepdf.com/reader/full/pulse-2011-effects-on-aquatic-life 76/104
ity rate than fish exposed to the virus alone, suggesting
that fish exposed to low levels of pyrethroids may be more
susceptible to disease.
Pyrethroids have generally not been detected in the Bay.
However, they have been detected in urban creeks andstreams at concentrations that exceed these effect levels.
at Berkeley have studied pyrethroids extensively and have
observed concentrations in urban creeks as high as 46 ng/L
(Weston and Lydy et al. 2010).
-
fornia at Davis suggests that Bay-Delta species exposed to
environmentally relevant concentrations of po llutants are
exhibiting toxic responses. Spearow et al. (2010) found
that wild fish in the northern portion of the Bay and inthe Delta showed a number of responses from exposure to
pollutants. Delta striped bass exhibited significantly higher
induction of metabolic enzymes when exposed to Delta
water. These enzymes are induced by exposure to PAHs,
PCBs, dioxins, and other pollutants. Recent work by Dan
that pyrethroids cause induction of vitellogenin in f ish
(Nillos et al. 2010 and Wang et al. 2007). Additional labo-
ratory studies have shown that mi xtures of detergents sig-
nificantly enhanced the estrogenic activity of pyrethroids
and other pesticides used in surface waters of the Central Valley (Xie et al. 2005). W hether the POD is a direct ef fect
of pollutants on the fish or on their invertebrate food sup-
ply remains a mystery. Based on all of the studies collected
to date, the consensus is that no one factor is responsible
for the POD. Most likely, it is a combination of factors in
which pollutants play a role.
POLLUTANTS AND ENDOCRINE
DISRUPTION IN FISH
Synthetic reproductive hormones and compounds that
mimic reproductive hormones are one of the few cases in
which environmentally relevant concentrations have been
shown to potentially have significant population-leveleffects in the wild. It has been well established in field
and laboratory studies that very low concentrations of
hormones in water can affect the endocrine system of fish.
The endocrine systems of all vertebrates including fish are
a series of glands that secrete hormones that regulate not
only reproduction but also growth and development, stress
response, and other processes. Substantial research has
documented that fish downstream of wastewater treatment
facilities frequently exhibit disruption of the reproductive
system. For example, male fish downstream of wastewater
treatment plants have been found to have vi tellogenin(female egg yolk protein) and eggs present in their testes
( Jobling et al. 1998).
Perhaps more disturbing are the results from an experiment
conducted in Canada on a series of experimental lakes in
which one lake was treated with the synthetic hormone
ethinylestradiol at concentrations of 5 to 6 ng/L (Kidd et
al. 2007). Both the control lake and the treated lake con-
tained fathead minnows. After the first year, male fish ex-
hibited female characteristics such as expression of the egg
protein, vitellogenin, and eggs present in their testes. By thesecond year, the population of minnows in the treated lake
had completely collapsed, linking a contaminant effect to
the survival of a population as a w hole.
Within the Bay-Delta, there is limited evidence of repro-
a study in 2006–2007 to evaluate whether reproductive
endocrine disruption was occurring in Bay-Delta fish in
laboratory experiments (Lavados et al. 2009). The team
collected water from 16 locations t hroughout the Bay-Delta
and extracted pollutants from the samples, and then used
the extracts in laboratory exposures. The results indicated
significant endocrine disruption potential in the Napa
and Sacramento river samples; however, the endocrinedisruption not associated with any one contaminant from
chemical classes including steroid hormones, pesticides,
surfactants such as alkylphenol ethoxylates, or a host of
pharmaceutical and personal care products. Ongoing work
suggests that the response may be the result of a mixture of
pyrethroids and surfactants.
The RMP has sponsored studies to determine whether
contaminants are affecting additional components of the
endocrine system. Dr. Kevin Kelley and his research team
completed a two-year study evaluating non-reproductive
forms of endocrine disruption and their relationships
to pollutant exposure in two Bay fish species (Brar et al.
2010). In shiner surfperch (Cymatogaster aggregata) and
Pacific staghorn sculpin ( Leptocottus armatus ), disruptions
in the thyroid endocrine system, including significant re-
ductions in thyroid hormones, were found in f ish sampled
from contaminated industrial and harbor locations (FIG
URE 4). Further experimental analysis found that specific
problems within the thyroid system may be associated with
different classes of contaminants (PCBs and chlordanes).Thyroid hormones are critical regulators of develop-
ment and growth in fish. It was therefore notable that in
fast-growing, young of the year sculpin, thyroid hormone
concentrations were strongly correlated with concentra-
tions of an important growth hormone (FIGURE 5), sug-
gesting that impaired thyroid hormones could translate into
growth effects. However, it is not yet understood whether
the impacted fish exhibit deficits in growth or survival or in
the population at large.
75

8/3/2019 Pulse 2011 - Effects on Aquatic Life
http://slidepdf.com/reader/full/pulse-2011-effects-on-aquatic-life 77/104
F E A T U R E A R T I C L E S
|
F I S H
T H E
P U L S E
O F
T H E
E S T U A R Y
2 0 1 1
0
20
40
80
RedwoodCity
Berkeley San PabloBay
Oakland TomalesBay
RedwoodCity
Berkeley San PabloBay
Oakland TomalesBay
0
20
40
60
60
80
ND
T 4 C o n c e n t r a t i o n ( n g / m l )
T 4 C o n c e n t r a t i o n ( n g / m l )
ShinerSurfperch
PacicStaghornSculpin
In addition to the thyroid disruption, both fish species also
exhibited a dysfunctional adrenal endocrine system, which
generates the hormone, cortisol. Cortisol i s a critical stress
hormone that promotes physiological and behavioral adap-
tations that help when an animal must deal with intraspe-
cific competitors, predators, poor food availability, or otherstressors. Cortisol is also important under normal physi-
ological conditions, and disruptions in cortisol control can
have negative effects on metabolism, immune functions,
growth, and reproduction (Mommsen et al. 1999, Barton,
2002). In the studies by Kelley’s group, fish sampled from
harbor locations like the Oakland and Richmond harbors
and at the San Francisco waterfront, were significantly
impaired in their ability to produce cortisol during a stress
challenge (FIGURE 6). Further analysis of the surf perch
indicated that this endocrine disruption was significantly
related to exposures to petroleum-derived PAHs (phenan-threne, anthracene, and fluoranthene). The fish also had
increased parasitic infestations, suggesting the cortisol dis-
ruptions were related to compromised immune f unction. It
is also notable that the effects on cortisol response did not
routinely coincide with thyroid disruptions (FIGURE 6).
This may reflect differential actions of dif ferent contami-
nant mixtures present at the different Bay locations tested.
COPPER
In conjunction with the RMP, NOAA is also studying
the effect of copper on the olfactory system of salmon.
Their recent research has shown that metals, particularly
copper, inhibit predator avoidance by impairing olfactory
nerve cells. Fish have exquisitely sensitive noses with anability to smell chemicals at the part per billion level to
find a mate, find a bite to eat, avoid being a bite to eat, and
to locate their birth streams. The fish nose is much more
than a nose – it also governs physiological and behavioral
responses. In predator avoidance experiments, juvenile
salmon exposed to copper had a surv ival rate three to five
times lower than control fish. The concentrations at which
this effect was observed were quite low, in the range of 3
µg/L in f reshwater (McIntyre et al. 2008). Dissolved con-
centrations of copper in San Francisco Bay typically range
up to approximately 4 µg/L. Water chemistry in estuarinesystems is dramatically different than freshwater and there
is some evidence to suggest that dissolved organic carbon
and salinity may protect salmon in the Bay from the adverse
effects of exposure to copper. This work w ill investigate the
threshold at which effects occur in a saltwater environment.
Footnote: From Brar et al. (2010).
FIGURE 4In shiner surfperch (TOP) and Pacic staghorn sculpin (BOOM),
disruptions in the thyroid endocrine system include signicant reduc-tions in t hyroid hormone (T4) were found in sh sampled from contami-
nated industrial and harbor locations, including Oakland Harbor.
76 FEATURE ARTICLES | FISH

8/3/2019 Pulse 2011 - Effects on Aquatic Life
http://slidepdf.com/reader/full/pulse-2011-effects-on-aquatic-life 78/104
Thyroid hormone (T4) concentration (ng/mL)
Thyroid hormone (T3) concentration (ng/mL)
G r o w t h
h o r m o n e ( I G F - I )
c o n c e n t r a t i o n ( n g / m L )
G r o w t h h o r m o
n e ( I G F - I )
c o n c e n t r a t i o n
( n g / m L )
70
60
20
50
40
10
30
0
70
60
20
50
40
10
30
0
353010 25205 150 40
762 541 30 8 9
A. Cortisol Response
B. Thyroxine, T4
CatalinaIsland
Redwood City S.F.Waterfront
OaklandHarbor
San LeandroBay
RichmondHarbor
CatalinaIsland
Redwood City S.F.Waterfront
OaklandHarbor
San LeandroBay
RichmondHarbor
P l a s m a C o n c e
n t r a t i o n ( n g / m L )
P l a s m a C o n c e n t r a t i o n ( n g
/ m L )
700
600
200
500
400
100
300
0
800
40
35
10
30
25
5
15
0
20
FIGURE 5Relationships between concentrations of the growth regulatory peptide, insulin-like g rowth factor-I (IGF-I), and the thyroidhormones, thyroxine (T4, upper panel) and triiodothyronine (T3;lower panel), in Pacic staghorn sculpin.
FIGURE 6Fish sampled from harbor locations like the Oakland and Richmondharbors and at the San Francisco waterfront were signicantly impaired in their ability to produce cortisol during a stress chal-lenge. is endocrine disruption was signicantly related to exposures topetroleum-derived PAHs (phenanthrene, anthracene, and uoranthene).e sh also had increased parasitic infestations, suggesting the cortisoldisruptions were related to compromised immune function. e e ectson cortisol response did not routinely coincide with thyroid alterations,suggesting di erential actions of contaminant mixtures present at thedi erent Bay locations.
77

8/3/2019 Pulse 2011 - Effects on Aquatic Life
http://slidepdf.com/reader/full/pulse-2011-effects-on-aquatic-life 79/104
F E A T U R E A R T I C L E S
|
F I S H
T H E
P U L S E
O F
T H E
E S T U A R Y
2 0 1 1
SELENIUM
Selenium is a naturally occurring element found in geo-
logic formations of the Coast Range. An arid climate and
extensive irrigation results in the San Joaquin and Sacra-
mento rivers being the major source of selenium to the Bay,
followed by local tributaries, refineries, and wastewatertreatment plants (Baginska 2011). A vital nutrient for fish,
selenium is critical for the production of thyroid hormones,
regulation of the immune system, and management of
stress. However the window between necessity and toxicity
is one of the smallest known (Baginska 2011).
Relatively low concentrations of selenium are detected in
Bay water; however, the major route of exposure to f ish is
through their diet. Bottom-feeding fish such as splittail
( Pogonichtuhys macrolepidotus) and sturgeon ( Acipenser transmontanus ) are considered to be at substantial risk
for selenium exposure in the Bay (Beckon and Mauer
2008). Splittail and sturgeon are at risk because their diet
consists primarily of the overbite clam (Corbula amurensis)
(PAGE 37), which are selenium-rich relative to other prey
(Stewart et al. 2004). Increased risk factors for sturgeon
include their longevity (they can live over 100 years), their
year-round resident status, and long egg maturation times
(several years) (Beckon and Mauer 2008).
Selenium can cause embryonic deformities such as
malformed spines and impaired feeding systems. In the
preliminary North Bay selenium TMDL report, effects
thresholds for splittail and white sturgeon are characterized
as above 6.0 and 10 µg/g dw, respectively (Baginska 2011).
Splittail collected in the Bay in 2000 did not exceed thisthreshold (Baginska 2011). Between 1997 and 2009, the
RMP analyzed 56 sturgeon for selenium with an average
of 1.4 ppm wet weight. The Water Board has proposed a
sturgeon tissue target of 6.0 to 8.1 µg/g dry weight for the
North Bay (Baginska 2011). Few RMP samples (consid-
ered on a dry weight basis) have exceeded this range.
CONCLUSIONS AND
PRIORITY INFORMATION
GAPSOur understanding of the e ects of individual pollutants
on sh growth, development, and reproduction is gradu-
ally advancing. However, much of the past work has been
conducted by exposing model sh species in a laboratory
seing at concentrations that are much higher than what is
typical ly observed in the environment. In the last decade,
several research groups have begun to design experiments
to evaluate the e ects of pollutants at realistic levels on wild
sh. is work will be critical for improving understanding
of the e ects of pollutants on the health of Bay sh.
There is much to be learned and there are many challenges.
Future studies will need to address the effects of mixtures
that may enhance or ameliorate the potency of individual
California at Riverside and Davis researchers suggests that
commercial formulations of pesticides are more toxic thanthe active pesticide ingredients, indicating that the inactive
-
standing the combined effects of multiple pollutants, in-
cluding pollutants of emerging concern, will be i mportant.
It can be expected that the effect of pollutants on fish will
vary among species and habitats. An additional challenge
will be to understand the effects of pollutants in combina-
tion with other stressors such as fo od scarcity and other
water quality variables (temperature, dissolved oxygen,
turbidity, and salinity). Perhaps the hardest issue to address will be the translation of effects on individuals to effects
on the population as a whole. It may be that pesticides
impair swimming or that pollutants increase susceptibility
to disease within individuals, but this may not necessarily
translate to impacts at the population level.
The RMP will continue to strive, in collaboration with
other Bay-Delta organizations, to provide the scientific
understanding needed to reverse the declines that have
recently been observed in so many important fish species.
e Water Board has proposed a sturgeon tissue target of 6.0 to 8.1 g/g dry weightfor the North Bay - few RMP samples have exceeded this range
78 FEATURE ARTICLES | BIRDS

8/3/2019 Pulse 2011 - Effects on Aquatic Life
http://slidepdf.com/reader/full/pulse-2011-effects-on-aquatic-life 80/104
LETITIA GR ENIER, JAY DAVIS, and JOHN ROSS,San Francisco Estuary Institute
Birds are facing signicanthealth risks in San FranciscoBay, due to their exposure topollutants, and are sensitiveindicators of paerns andtrends of contamination inthe Bay food web
Methylmercury exposureis a major concern for birdsin managed ponds and tidalmarsh and is suspected of a ecting some species at thepopulation level, including
special-status species
Available data suggestthat PCBs exceed risk thresholds in some
birds that forage inthe shallow Bay andmanaged pond habitats
PBDEs are prevalent inspecies foraging in theshallow Bay and managedponds, but there are noe ects thresholds; PBDE
bioaccumulation in tidalmarsh birds is largely unstudied
Dioxin andlegacy pesticideconcentrationsin bird eggs aregenerally below thresholds of
concern
recent findings on risks to birdsfrom pollutants
in san francisco bay
highlights
79AVIAN SENTINELS Aquatic and wetland birds are also important components polybrominated diphenyl ethers (PBDEs) e mercury

8/3/2019 Pulse 2011 - Effects on Aquatic Life
http://slidepdf.com/reader/full/pulse-2011-effects-on-aquatic-life 81/104
F E A T U R E A R T I C L E S
|
B I R D S
T H E
P U L S E
O F
T H E
E S T U A R Y
2 0 1 1
AVIAN SENTINELS
FOR THE BAY
e extent to which San Francisco Bay birds are a ected
by pollutants is a topic of great importance to water quality
managers and to the public. As the largest estuary on the
Pacic Coast of North America, the Bay is a critical habitat
for many estuarine bird species. e Bay and its wetlands area vital refueling stop for large populations of migrating water-
birds and support many species of breeding birds, including
several threatened and endangered species and some types of
birds found nowhere else in the world. Not only are birds im-
portant to the natural heritage of the area, but we also value
them as part of our cultural heritage. Birders, hunters, and
other nature lovers appreciate birds. e support of wildlife,
including birds, is one of many aributes of the Bay that is
protected by state and federal water quality regulations.
Aquatic and wetland birds are also important components
of the food web; many are predators feeding on fish and
invertebrates from several of the main estuarine habitats,
including shallow bay, marshes, and managed ponds. In
addition, studies have indicated that pollutant impacts are
a significant concern for some Bay birds, including special
– status species like the California Clapper Rail ( Rallus
longirostris obsoletus) and the California Least Tern (Sternaantillarum browni). For all of these reasons, it i s important
to know the extent to which estuarine bi rds are negatively
affected by chemical pollutants.
Birds are sensitive to environmental contamination, espe-
cially during early development as embryos and chicks.
Aquatic and wetland birds are exposed to pollutants that
are transferred through the food web, and may be harmed
by substances such as methylmercury, polychlorinated
biphenyls (PCBs), dioxins, selenium, legacy pesticides, and
polybrominated diphenyl ethers (PBDEs). e mercury
cleanup plan for the Bay (the Total Maximum Daily Load, or
TMDL) includes a target for prey sh to protect piscivorous
(sh-eating) birds, particularly the endangered California
Least Tern. Because many Bay bird species have well-under-
stood life histories in terms of their foraging habitat, home
range size, diet, and migratory paerns, they can be excellent
sentinels for tracking the spatial and temporal paerns of pollutants in the food web. Birds are commonly used as
sentinel species in monitoring programs around the world,
including the Great Lakes, the Canadian arctic, the Baltic
Sea, and San Francisco Bay, where the Regional Monitoring
Program for Water Quality in the San Francisco Estuary has
monitored pollutants in birds for nearly a decade.
is article provides an update on what has been learned
about the e ects of aquatic pollutants on estuarine birds
from studies completed in the last decade. ese recent nd-
ings are organized by estuarine habitat type ( FIGURE 1), because many pollutants show spatial paerns that di er by
habitat. For example, PCBs appear to have higher concentra-
tions in sediments near urbanized and industrialized margins
of the Bay (Davis et al. 2007, Ackerman et al. 2008b). Meth-
ylmercury, which is the toxic form of mercury in estuarine
food webs, exhibits di erent paerns of bioaccumulation by
habitat (Greeneld and Jahn 2010, Grenier et al. 2010), like-
ly due to variation in methylmercury cycling. Furthermore,
birds are adapted to forage in particular habitats; therefore,
as sentinel species they tend to represent one or two primary
habitat types. e species of birds that are the most suited
to being used as indicators of pollutant problems in the food
webs of di erent Bay habitats are discussed here. Most of the
recent work on avian e ects has been on these species, but a
few studies on other species are not included in this article
(e.g., Takekawa et al. 2002, Hothem and Hatch 2004).
Cormorants on Seal Rocks. Photograph by Linda M. Wanczyk.
80 FEATURE ARTICLES | BIRDS

8/3/2019 Pulse 2011 - Effects on Aquatic Life
http://slidepdf.com/reader/full/pulse-2011-effects-on-aquatic-life 82/104
Suisun
Bay San Pablo
Bay
South
Bay
MarshPlain
Panne
MarshChannel
WheelerIsland
Oakland
San
Francisco
San Jose
FairfieldPetaluma
Hayward
Habitats taken from the Bay AreaAquatic Resource Inventory, 2011.
http://www.sfei.org/BAARI
Alameda NavalAir Station Least
Tern Colony
RichmondBridge
Alviso
Eden
Landing
Don EdwardsPond
A9/A10
South BayTowers
0 5 10 Miles
Managed Pond
Forster's Tern, Caspian Tern, Black-neckedStilt and American Avocet Habitat
Shallow Bay
Double-crested Cormorantand California Least Tern Habitat
Tidal Marsh
California Clapper Rail, Black Rail,and tidal marsh Song Sparrow Habitat
FIGURE 1Recent ndings on pollutants in Bay birds inthis article are organized by estuarine habitattype, because many pollut ants show spatial pat-
terns that di er by habitat. Furthermore, birdsare adapted to forage in particular habitats; there-fore, as sentinel species t hey tend to represent oneor two primary habitat types. e species of birdsthat are the most suited to being used as indicatorsof pollutant problems in the food webs of di erentBay habitats are discussed.
Least Terns. Photograph by Robert Lewis.
81
8/3/2019 Pulse 2011 - Effects on Aquatic Life
http://slidepdf.com/reader/full/pulse-2011-effects-on-aquatic-life 83/104
F E A T U R E A R T I C L E S
|
B I R D S
T H E
P U L S E
O F
T H E
E S T U A R Y
2 0 1 1
SHALLOW BAYDouble-crested Cormorants ( Phalacrocorax auritus) are used
by the RMP as a sentinel species for the open waters of the
Bay. Cormorant eggs are sampled Bay-wide every three years
for mercury, selenium, PBDEs, PCBs, legacy pesticides, and,
starting in 2009, peruorinated compounds (PFCs). Cor-morants forage in a variety of shallow-water habitats (Hatch
and Weseloh 1999), including managed ponds (former salt
ponds), but they primarily hunt in the subtidal shallows and
over mudats and large sloughs when the tide is in. Califor-
nia Least Terns also forage extensively in these areas, with
a preference for shallow Bay habitat near their nesting area
(Ehrler et al. 2006). Both species are sh-eaters. Bioaccumu-
lation in Least Terns is more dicult to study, because of the
importance of sample collection not adversely impacting this
endangered species. e only recent data available for these
piscivores come from two small studies of fail-to-hatch eggs
from 2000–2002 at the Alameda Naval Air Station colony
(Schwarzbach and Adelsbach 2003, She et al. 2008).
METHYLMERCURY
Cormorant eggs have shown regional spatial variation in
methylmercury with higher concentrations in the South Bay
(FIGURE 2 , but methylmercury is not likely to be adversely
a ecting this species. While eggs from San Pablo and Suisun
Bays have tended to be at or below adverse e ects thresholds
for reproductive impairment in Mallards and R ing-necked
concentrations presented in f ww; Fimreite 1971, Heinz 1979),
those from the South Bay have tended to exceed those levels.
Cormorants, however, are relatively insensitive to methylmer-
cury toxicity compared to other species (Heinz et al. 2009), so
it does not appear likely that these concentrations are harming
the population. e regional paerns have been consistent
over time, with no indication of increasing or decreasing
trends within each region. Cormorant eggs also have indicated
that there is spatial variation in methylmercury bioaccumula-
tion at a even broader regional scale, with higher concentra-
tions in San Francisco Bay (including Suisun Bay) compared
to the Delta (Schwarzbach and Adelsbach 2003).
Very few data are available for methylmercury in California
Least Tern eggs. ree fail-to-hatch Least Tern eggs collect-
ed in 2000 had an average concentration of 0.3 ppm, whichis below the e ects thresholds (Schwarzbach and Adelsbach
2003). However, terns as a group may be somewhat more
sensitive to methylmercury than the species used to develop
the thresholds, based on egg-injection studies, which are
dicult to translate into thresholds for wild birds (Heinz et
al. 2009). Inclusion of a TMDL target to protect the Least
Tern is an indication of the regulatory concern for potential
methylmercury impacts on this endangered species.
PCBS
PCB concentrations in cormorant eggs over the last 10 years
have occasionally approached an e ects threshold of 3.6-6.8
ppm for reproductive impairment in this species (FIGURE
2). Concentrations in this species have been variable and
not shown distinct regional paerns. Concentrations in
San Pablo Bay were relatively high from 2000–2006 (with a
maximum of 4.5 ppm in 2002), but lower in 1999 and 2009.
Some of the samples from the Richmond Bridge in San Pablo
Bay exceeded the lower end of the estimated threshold range
for reproductive impairment.
PCB concentrations in Least Tern eggs also indicate
potential risks of adverse effects. Average PCBs in ten
fail-to-hatch Least Tern eggs collected in 2001 and 2002
(4.0 ppm) were at a published effects threshold for PCBs
in terns (also 4.0 ppm), with multiple individual samples
exceeding the threshold (She et al. 2008).
PBDES
E ect thresholds for PBDEs in birds are not available, but
seemingly high concentrations in some Bay bird egg samples
have raised concern. A recent review showed that PBDE con-
centrations in the eggs of sh-eating birds from the Bay were
an order of magnitude higher than those in birds from Chesa-
peake Bay and the Delaware area (Yogui and Sericano 2009).
Concentrations of PBDEs in cormorant eggs varied consider-
ably in space and time among samples collected from the threesubembayments (FIGURE 2). Concentrations have been
highest at Wheeler Island in Suisun Bay, up to a maximum of
800 ppb in 2002. e results from W heeler Island are interest-
ing as this is the least urbanized sampling location. Concen-
trations at Wheeler Island and the Richmond Bridge were
substantially lower in 2004 and 2006 than in 2002. Continued
monitoring will be needed to determine whether this is indica-
tive of a downward trend. Declines in PBDEs are expected
as a result of the California Legislature’s ban of the use of two
types of PBDE mixtures (“penta” and “octa”) in 2006.
Least Tern eggs had mean concentrations of 770 ppb in
2001 and 500 ppb in 2002, similar to those obser ved in
cormorants at Wheeler Island (She et al. 2008).
PFOS
Cormorant egg monitoring has shown that uorinated stain-
repellents appear to be reaching concentrations of concern in
the Bay food web. Peruorinated chemicals (PFCs) have been
used extensively over the last 50 years in a variety of products
including textiles treated with stain-repellents,re-ghting
foams, refrigerants, and coatings for paper used in contact w ith
food products. As a result of their chemical stability and wide-
spread use, PFCs such as peruorooctane sulfonate (PFOS)
have been detected in the environment. PFOS and related
PFCs have been associated with a variety of toxic e ects in-
cluding mortality, carcinogenity, and abnormal development.
In 2006, the RMP began analyzing cormorant eggs for
PFCs. Consistent with other published studies, PFOS was
the dominant PFC detected in cormorant eggs. Concentra-
tions of PFOS were highest in the South Bay, and higher
82 FEATURE ARTICLES | BIRDS

8/3/2019 Pulse 2011 - Effects on Aquatic Life
http://slidepdf.com/reader/full/pulse-2011-effects-on-aquatic-life 84/104
Don Edwards Pond A9/10
Richmond Bridge
Wheeler Island
South Bay (Towers)
P B D E s
( p p b )
0
100
200
300
400
500
600
700
800
900
2000 2002 2004 2006 2008 2010
2000 2002 2004 2006 2008 2010
M e t h y l m e r c u r y ( p p
m )
0.0
0.2
0.4
0.6
0.8
1.0
1.2
2000 2002 2004 2006 2008 2010
P C B s ( p p m )
0
1
2
3
4
5
FIGURE 2Double-crested Cormorants are monitored by the RMP as asentinel species for the shallow open waters of the Bay . Cor-morant eggs have shown higher concentrations in the South
but methylmercury is not likely to be adversely a ecting thisspecies due to its low sensitivity to t his pollutant. PCB concen-trations over the last 10 years have been variable and not showndistinct regional paerns, and have occasionally approached ane ects threshold for reproductive impairment. Concentrationsof PBDEs have varied considerably among the th ree subembay-ments and over time, and are high relative to other parts of the
world, but a lack of thresholds makes it unclear whether theseconcentrations are a ecting Bay bird species.
Double-crested Cormorant. Photograph by Robert Lewis.
83

8/3/2019 Pulse 2011 - Effects on Aquatic Life
http://slidepdf.com/reader/full/pulse-2011-effects-on-aquatic-life 85/104
F E A T U R E A R T I C L E S
|
B I R D S
T H E
P U L S E
O F
T H E
E S T U A R Y
2 0 1 1
than concentrations reported in other regions (Houde et al.,
2006). Concentrations were similar in 2006 and 2009. The
concentrations in the South Bay exceeded an estimated no
effect concentration of 1 ppm.
OTHER POLLUTANTS
The other bioaccumulative pollutants that have been stud-
ied in Double-crested Cormorant eggs have been below ef-
fect thresholds, and no recent studies have examined other
pollutants in California Least Terns. Since 1999, only one
composite cormorant egg sample from Wheeler Island in
2002 exceeded the 5 ppm effects threshold for reproductive
impacts for DDT (Weseloh et al. 1983) with a concentra-
tion of 7 ppm DDT. No previous or more recent cormorant
egg samples approached any effects thresholds for DDT,
dieldrin, dioxins, or other pollutants.
MANAGED PONDS
Managed ponds are the former salt p onds around the margin
of the Bay that were originally tidal marsh. ese ponds are
now largely managed to support waterbirds, such as terns,
plovers, ducks and shorebirds. Some managed ponds are shal-
low and seasonal, drying out in the summer and fall. Others
are perennially wet and support sh year round. Forster’s Tern
(Sterna forsteri), Caspian Tern (Sterna caspia), American Avo-
cet ( Recurvirostra americana ), and Black-necked Stilt (Himan-
topus mexicanus) all feed and breed primarily in and around
managed ponds, and all have been studied extensively in recent
years, particularly regarding methylmercury accumulation and
e ects. e terns are piscivores, while stilts and avocets feed
on invertebrates in shallower ponds.
METHYLMERCURY
Forster’s Terns appear to face significant ri sk from exposure
to methylmercury. Nearly half (48%) of breeding Forster’s
Terns and approximately 5% of Avocets, Stilts, and Caspian
Terns (Eagles-Smith et al. 2009) exceeded a risk threshold
developed for Common Loon (Gavia immer ) blood of (3
ppm wet weight) at which there was a 40% loss in loon
reproduction (Evers et al. 2008). Estimated reproductive
risks to these species based on egg methylmercury concen-trations are very similar (Eagles-Smith et al. 2009). Tissue
concentrations are consistently higher in the South Bay near
the town of Alviso. Methylmercury concentrations in For-
ster’s Tern eggs have f luctuated considerably over time, w ith
annual averages in the most recent monitoring all exceeding
reproductive effects thresholds.
Despite the strong evidence for risk to these populations
from methylmercury toxicity, verifying reproductive
impacts through field study is difficult. Many other fac-
tors influence avian survival and add to noise in the data
set. Forster’s Tern hatching success shows evidence of
impacts from mercur y. Fai l-to-hatc h eggs of Forster’s Terns
had higher average methylmercury concentrations than
abandoned eggs and random eggs sampled from successful
nests (Eagles-Smith and Ackerman 2008). Stilt and avocet
chicks found dead had higher methylmercury in their feath-
ers than randomly-sampled live chicks of similar age, but
chick survival rates varied little based on their methylmer-
cury bioaccumulation (Ackerman et al. 2008a). Similarly,
fledgling Forster’s Tern survival was not related to blood
methylmercury concentration (Ackerman et al. 2008b). A
detailed summary of this research can be found in the 2008
Pulse of the Estuary (Eagles-Smith and Ackerman 2008).
PCBS
PCB concentrations in some eggs of Forster’s and Caspian
Terns appear to be high enough to pose health risks to
these species. Average PCB concentrat ions in Forster’s
and Caspian Tern eggs collected from 2000-2003 were
below a 4 ppm threshold for impacts on reproduction,
but many individual eggs exceeded this value (She et
al. 2008). Maximum concentrations observed in both
Forster’s Terns and Caspian Terns were similar and nearly
five times greater than the lowest observed adverse effect
level for reproduction. The Eden Landing area in South
Bay had the highest concentrations of PCBs.
PBDES
Some of the highest concentrations of PBDEs observed
anywhere in the world have ra ised concern for pos-
sible impacts on Forster’s Terns in the Bay (Shaw and
Kannan 2009). There is a growing body of data from
many urbanized coasts for comparison, including many
species of fish-eating birds from Canada, New England,
San Francisco Bay, Delaware Bay, Alaska, Washington
state, Europe, South Africa, and China. Annual average
PBDE concentrations in eggs of Forster’s Terns (rang-
ing from 330–990 ppb) and Caspian Terns (320–580
ppb) were similar to concentrations in Least Terns and
cormorants from Wheeler Island (She et al. 2008). A
few of the Forster’s Tern samples from Eden Landing
had the highest PBDE concentrations ever recorded in
wildlife (She et al. 2004).
TIDAL MARSH
Tidal marshes are highly organized habitats that are com-
posed of clearly distinguished sub-habitats (marsh plain,
marsh channel, and panne) that develop because of the
unique hydrology of these wetlands. Food webs may be
somewhat separate among these habitats (Grenier 2004),
so it is important to understand where sentinel species
forage within a tidal marsh. Three tidal marsh bird spe-
cies have been studied for exposure to methylmercury,
although not to the extent of the terns and cormorants
in the shallow bay and managed ponds. Thus, informa-
tion about tidal marsh bird methylmercury exposure
and effects is quite limited and tends to come from a few
studies completed in different marshes at different times,
84 FEATURE ARTICLES | BIRDS California Clapper Rail. Photograph by Robert Lewis.

8/3/2019 Pulse 2011 - Effects on Aquatic Life
http://slidepdf.com/reader/full/pulse-2011-effects-on-aquatic-life 86/104
rather than from long-term programmatic monitoring.
The three bird species that have been studied differ in
the habitats in which they forage. While tidal marsh
Song Sparrows ( Melospiza melodia subspp.) and Califor-
nia Black Rails ( Laterallus jamaicensis coturniculus) for-
age predominantly in the vegetated marsh plain (Grenier
2004, Tsao et al. 2009), California Clapper Rails forage
extensively in marsh channels and somewhat in the
marsh plain (Moffitt 1941).
METHYLMERCURY
Methylmercury is considered a significant concern for
several species of tidal marsh birds. The recovery of the
endangered California Clapper Rail, found o nly in the San
Francisco Estuary, may be impeded by methylmercury con-
tamination. A study conducted from 1991-1999 concluded
that methylmercury was a likely cause of t he unusually high
rates of nonviable Clapper Rai l eggs (31%; Schwarzbach
et al. 2006). Methylmercury was found in rail eggs above
effects thresholds at all of the marshes studied; means by
marsh ranged from 0.27–0.79 ppm wet weight (Schwar-
zbach et al. 2006). Furthermore, laboratory studies have
indicated that Clapper Rails are more sensitive to methyl-
mercury than the pheasant and Mallard species from which
the thresholds of 0.5 and 0.8 ppm fresh wet weight were
derived (Heinz et al. 2009).
Tidal marsh Song Sparrows, a state species of special
concern, and Black Rail, a state threatened species, both
had methylmercury concentrations in blood that indi-
cated potential risks of impaired reproduction. For the
sparrows, comparison to a songbird effects threshold is
appropriate. A recent study linked blood methylmercury
concentrations to reproductive effects in the Carolina
Wren (Thryothorus ludovicianus), yielding an estimated
relationship between reductions in nesting success and
maternal blood concentrations (Jackson et al. in prepara-
tion). Based on that study, maternal songbird blood meth-
ylmercury concentrations of 0.4 ppm wet weight translate
to approximately a 5% reduction in reproductive success.
Average Song Sparrow blood methylmercury concentra-
tions in the South Bay ranged from 0.1–0.6 ppm wet weight
by marsh, and more than half the sparrows were above the
0.4 ppm threshold in both years of the study (FIGURE
3; Grenier et al. 2010). Song Sparrow methylmercury
concentrations were lowest in marshes far from the Bay
and highest in marshes near the Bay (FIGURE 3), which
parallels the salinity gradient (Grenier et al. 2010). Blood
methylmercury concentrations in Black Rails from North
Bay were in the same range as the Song Sparrow concentra-
tions, and about 10% of them were in a range correspond-
ing to a moderate risk for reproductive effects (> 1 ppm
and < 3 ppm wet weight), based on the same Common
Loon model used to describe the Forster’s Tern data above
(Tsao et al. 2009).
OTHER POLLUTANTS
A few studies have examined persistent organic pol lutants
in the eggs of Clapper Rai l (PCBs and legacy pesticides:
Schwarzbach et al. 2006, dioxins: Adelsbach and Maurer
2007, PCBs and PBDEs: She et al. 2008), and one study
measured PCBs and DDT in Song Sparrow eggs f rom
North Bay (Davis et al. 2004). In all cases but one, these
pollutants were detected in the marsh bird eggs, but the
concentrations were relatively low and did not approach
effects thresholds. Adelsbach and Maurer (2007) reported
that four fail-to-hatch Clapper Rail eggs from North and
South Bay had dioxins at concentrations that might impact
reproduction. Thus, based on the few marshes and analytes
examined, very little evidence of the potential f or adverse
effects from persistent organic pollutants on marsh birds
in the Estuary has been found. This is an encouraging
outcome, in that it indicates that a pervasive, Bay-wide
problem is unlikely. However, since these pollutants typi-
cally exhibit hotspots near watershed sources, the sampling
conducted to date cannot rule out problems in unstudied
marshes near industrial and urban areas.
PRIORITYINFORMATION GAPS
Given that there is evidence for potential effects of
pollutants on birds in every habitat in the Estuary that
What information is the most important to gain that
could reduce exposure and risk through improved man-
ARE THERE POPULATION-LEVELEFFECTS?In many cases, exposure in birds exceeds an effects
population in this urbanized environment with many
other stressors absorb a reproductive loss related to pol-
WHAT ARE EFFECTS THRESHOLDS
FOR PBDES, ESPECIALLY IN TERNS?PBDEs reach seemingly high concentrations in terns,
but the adverse effects, if any, are unknown. The RMP
has funded a study by the Patuxent Wildlife Research
Center to evaluate the relative sensitivity of tern embryos
to PBDE exposures. The results will be available at the
beginning of 2012.
85

8/3/2019 Pulse 2011 - Effects on Aquatic Life
http://slidepdf.com/reader/full/pulse-2011-effects-on-aquatic-life 87/104
F E A T U R E A R T I C L E S
|
B I R D S
T H E
P U L S E
O F
T H E
E S T U A R Y
2 0 1 1
SHOULD EXPOSURE IN BIRDS BE
EVALUATED RELATIVE TO AMBIENT
CONDITION RATHER THAN TO
SPECIES-SPECIFIC THRESHOLDS?
Bird species vary in their sensitivit y to each pollutant, yet
species-specific thresholds will not be forthcoming in the
near future. Thus, there are uncertainties associated with
managing and regulating water quality based on effects
thresholds developed with a few laboratory species (e.g.,
chicken, Mallard, pheasant) that cannot accurately repre-
sent the diversity of w ild birds that reside in Bay habitats.
Therefore, it may be valuable to explore other approaches
to evaluating wildlife exposure, particularly comparison to
ambient condition. It seems likely that pollutants impact
many wildlife species in the Bay to some degree, especially
when considered as a compound effect with other pol lut-
ants, disturbance, habitat degradation, and other stressors.
A reasonable approach might be to manage pollutants so
as to improve condition in the worst places or at least not
make things worse through management actions, and then
re-evaluate the situation every 5 or 10 years. A solid un-
derstanding of spatial and temporal patterns in bioaccumu-
lation would be needed to support this type of approach.
HOW CAN SCIENCE BE MORE
CLOSELY LINKED TO IMPROVING
MANAGEMENT DECISIONS?
is is an ongoing challenge for the environmental commu-
nity – to get the most out of research and monitoring dollars
by making sure that they positively a ect decision-making
and improve environmental outcomes. e RMP is funding
a synthesis of mercury information from the Estuary, which
will create conceptual models that tie scientic knowledge to
feasible management actions for reducing methylmercury in
biota. e report will be available by the end of 2011.
86 FEATURE ARTICLES | BIRDS

8/3/2019 Pulse 2011 - Effects on Aquatic Life
http://slidepdf.com/reader/full/pulse-2011-effects-on-aquatic-life 88/104
SIDEBAR
ANOTHER DIMENSION
OF THE MERCURY
PROBLEM
Methylmercury bioaccumulation in songbirds
residing along Bay Area streams may also be high
enough to cause reproductive impacts at some sites.
Song Sparrows ( Melospiza melodia ) were used as
a methylmercury biosentinel for riparian (stream-
side) habitat throughout the Bay Area in 2010.
Twenty sites and 140 Song Sparrows were sampled,
with blood mercury concentrations spanning more
than two orders of magnitude. is project was
guided by a group of regional and national scientic
experts in mercury, riparian habitat, and songbirds
that helped determine the appropriate biosentinel
species and sampling approach.
Sampling sites were chosen based on a conceptual
model in which the key drivers of songbird expo-
sure were 1) total mercury contamination of sedi-
ment and 2) environmental conditions that were
thought to a ect production of methylmercury.
e ndings supported the conceptual model
in that both total mercury contamination and
environmental conditions were related to blood
methylmercury concentrations in sparrows. e
site with the greatest methylmercury exposure in
songbirds was downstream of the New Almaden
Mercury Mining District, but the second highest
site was not inuenced by mining.
More than a dozen other bird species were also
sampled, and a few of those species appeared to
have higher exposure than Song Sparrows. us,
Song Sparrows may be an indicator of riparian
methylmercury accumulation in the food web, but
they may not reect the greatest impacts that are
occurring to riparian wildlife.
Average methylmercury concentrations at two of
the 20 sites sampled were above 0.4 ppm (ww).
A recent study in Carolina Wrens that examined
the relationship between maternal blood mercury
concentration and reproductive e ects found
that concentrations of 0.4 ppm translated to an
approximate 5% reduction in nest survival (the
number of nests that successfully hatched chicks)
(Jackson et al. in prep). e highest mercury con-
centrations measured in riparian Song Sparrows
of the Bay Area were above 2.5 ppm, a level associ-
ated with a 50% decline in nest survival.
Many of the sites in this study were in an urbanized
environment where wildlife populations are subject
to multiple stressors. In these stressed populations,
there may be lile to no surplus of young birds each
year, which would amplify the consequences of
reproductive loss from methylmercury e ects.
is innovative study, which builds on a nascent
body of work on songbird methylmercury east
of the Rockies, appears to have revealed another
dimension of the mercury problem in the Bay
Area. e ndings have implications for mercury
impacts in habitats across California and beyond
that have received lile aention to date.
"0.4 ppm thresholdfor reduced nest survival"
Up. Guadalupe R.Coyote Res. Up.
Guadalupe Crk
Almaden Res. Up.
Up. Walker Crk
Wildcat Crk
Napa R.
Mid. Walker Crk
China Camp S.P.
Mid. Guadalupe R.
San Pablo Crk
San Felipe Crk
Low. Walker Crk
Muddy Hollow
Lagunitas Crk
Mills Crk
Simas Crk
Coyote Crk
Low Guadalupe R.
Hanson’s Cement
Song Sparrow Blood Total Mercury (ppm)
0.0 0.5 1.0 1.5 2.0 2.5 3.0
Footnote: Bars show range of the middle 50% of the observations.
87

8/3/2019 Pulse 2011 - Effects on Aquatic Life
http://slidepdf.com/reader/full/pulse-2011-effects-on-aquatic-life 89/104
F E A T U R E A R T I C L E S
|
B I R D S
T H E
P U L S E
O F
T H E
E S T U A R Y
2 0 1 1
Year
2008
2007
Percent of the Breeding Song Sparrow Population at Risk
100%80%60%40%20%0%
< 5%
5 - 10%
10 - 15%
15 - 20%
> 20%
Modeled PercentReduction inBreeding Success
FIGURE 3 A e estimated risk to the South Bay tidal marsh sparrow population varied somewhat by year. In both 2007 and 2008, more than hal f of the
sparrows were at risk for an esti mated 5% or greater reduction in nesting suc-cess from methylmercury e ects. B Song Sparrow blood methylmercury concentrations (based on 109 birds) were higher in marshes closer to theBay. One hypothesis for this paern is that there may be a relationship betweenmarsh type (brackish versus salt) and methylmercury bioaccumulation.
A
0
0.1
0.2
0.3
0.4
0.5
0.6
0.7
0 2000 4000 6000 8000 10000 12000
Distance to Bay (ft)
M e t h y l m e r c u r y i n S p a r r o w
B l o
o d ( p p m w
e t w e i g h t )
B
Song Sparrow. Photograph by Robert Lewis.
88 FEATURE ARTICLES | SEALS
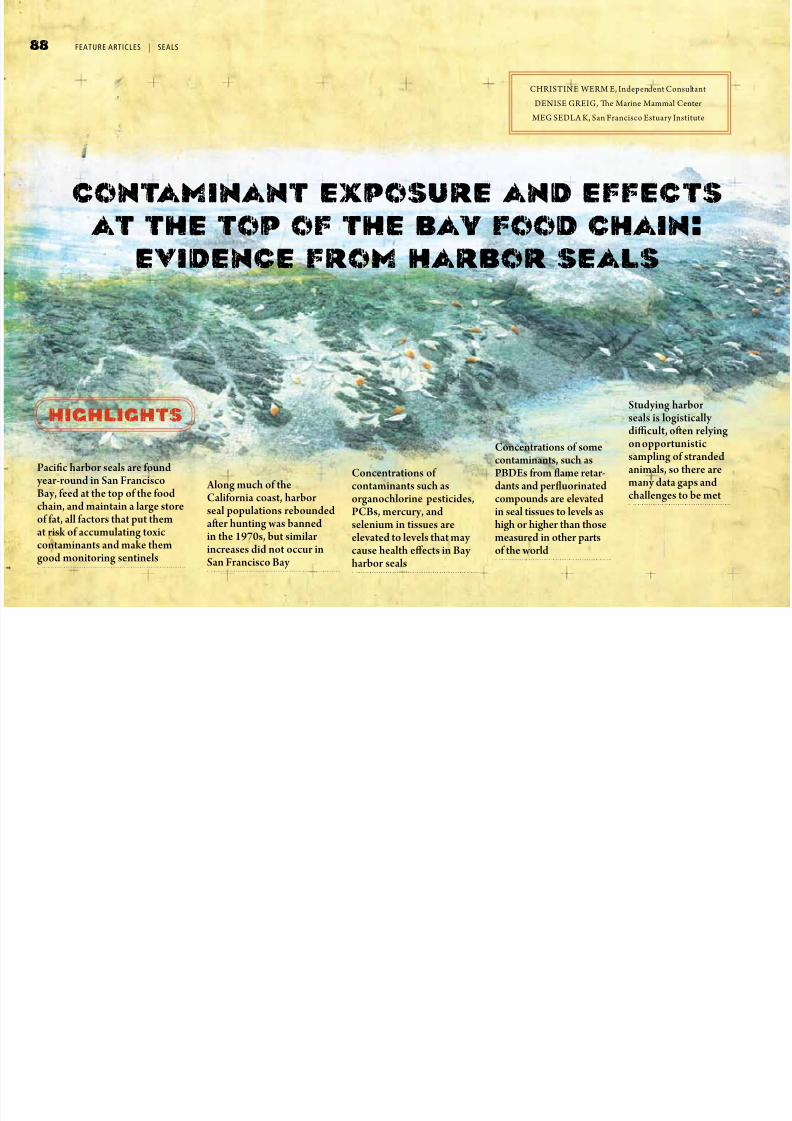
8/3/2019 Pulse 2011 - Effects on Aquatic Life
http://slidepdf.com/reader/full/pulse-2011-effects-on-aquatic-life 90/104
CHRISTINE WERM E, Independent Consultant
DENISE GREIG, e Marine Mammal Center
MEG SEDLA K, San Francisco Estuary Institute
Pacic harbor seals are found year-round in San FranciscoBay, feed at the top of the foodchain, and maintain a large storeof fat, all factors that put themat risk of accumulating toxiccontaminants and make themgood monitoring sentinels
Along much of theCalifornia coast, harborseal populations reboundedaer hunting was bannedin the 1970s, but similarincreases did not occur in
San Francisco Bay
Concentrations of contaminants such asorganochlorine pesticides,PCBs, mercury, andselenium in tissues areelevated to levels that may cause health e ects in Bay
harbor seals
Concentrations of somecontaminants, such asPBDEs from ame retar-dants and peruorinatedcompounds are elevatedin seal tissues to levels ashigh or higher than thosemeasured in other partsof the world
Studying harborseals is logistically
dicult, oen relyingon opportunisticsampling of strandedanimals, so there aremany data gaps andchallenges to be met
contaminant exposure and effectsat the top of the bay food chain:
evidence from harbor seals
highlights
89

8/3/2019 Pulse 2011 - Effects on Aquatic Life
http://slidepdf.com/reader/full/pulse-2011-effects-on-aquatic-life 91/104
F E A T U R E A R T I C L E S
|
S E A L S
T H E
P U L S E
O F
T H E
E S T U A R Y
2 0 1 1
THE TOP OF THE BAY
FOOD CHAIN
The Pacific harbor seal ( Phoca vitulina richardii ) is a year-
round resident of San Francisco Bay and the surrounding
coastal waters. It is the area’s only permanent resident pin-
niped, the group that includes seals, sea lions, and walruses.
Harbor seals are only semi-aquatic, depending on beaches
and other haul-out sites for daily resting and for giving
birth during the spring pupping season. Harbor seals can
be found throughout the Bay. Major haul-out and pupping
sites include Mowry Slough at the Don Edwards San Fran-
cisco Bay National Wildlife Refuge in the South Bay, Yerba
Buena Island, and Castro Rocks, next to the Richmond-San
Rafael Bridge in the North Bay (FIGURE 1).
Harbor seals are at the top of the Bay food chain, generally
feeding close to shore on both boom and schooling shes
and on squid and crustaceans. Healthy harbor seals have
thick blubber, used for insulation and energy reserves, and
may live up to 30 years. ese factors – year-round residency,
feeding at the top of the food chain and close to the shore,
and maintaining a large mass of fa y tissue over many years –
put seals at particular risk of accumulating toxic pollutants.
Excavation of the large Native American shellmounds found
along San Francisco and East Bay shorelines indicates that har-
bor seals have been present in the Bay for thousands of years.
Harbor seals were probably abundant in the Bay until the late
1800s, when hunting for their pelts, oil, and meat began to
take a toll. By the 1920s, hunting had seriously reduced the
population (Grigg 2003, Neale et al. 2005). Systematic surveys
did not begin until the 1970s, when concerns about the e ects
of pollutants and habitat loss spurred the interest of scientists
and the community. Seal hunting ended with the passage
of the federal Marine Mammal Protection Act of 1972, and
aerwards, numbers dramatically increased along most of the
California coast. Population increases have been much slower
in the Bay, largely due to habitat loss and other human distur-
bance, and possibly also due to chemical contaminants. ere
are currently about 34,000 harbor seals in California. About
400–500 harbor seals lived within the Bay during the 1980s,
and the current population remains around 500.
The Marine Mammal Protection Act prohibits any killing
or harassing of seals, elephant seals, sea lions, whales, por-
the National Oceanic and Atmospheric Administration’s
National Marine Fisheries Service (NMFS) leads the
Marine Mammal Health and Stranding Response Program
to investigate strandings and deaths and analyze tissue
samples for toxic substances and diseases. NMFS, in col-
laboration with the National Institute of Standards and
Technology, maintains a tissue bank fo r samples taken from
stranded animals and other sources. The goal of the tissue
bank is to provide material for studies of geographic and
temporal trends. On the state level, the San Francisco Bay
Regional Water Quality Control Board protects the estua-
rine, marine, and wildlife habitat of the harbor seal.
To scientists, harbor seals are useful sentinels of adverse
conditions and have been used to identify regional con-
taminant hotspots, even when tissue contaminant levels are
below those suspected of causing harm. A growing body of
literature from the world’s five subspecies of harbor seals
suggests that exposure to contaminants can reach levels that
contribute to population declines (e.g., Marine Environ-
mental Research Institute 2006).
Studies of harbor seals are challenging, making them dicult
to include in routine monitoring programs. Some studies
acquire samples opportunistically, collecting blood, blubber,
and other samples from dead animals or from animals that
have been rescued. Capturing healthy live animals for sam-
pling requires federal permits and is logistically challenging
because they can be dicult to capture.
The Regional Monitoring Program for Water Quality i n
the San Francisco Estuary (RMP) has benefitted from col-
laboration with The Marine Mammal Center in Sausalito
and other research scientists. The Marine Mammal Center
provides regional expertise and facilities for marine mam-
mal rescue and rehabilitation, serving much of the central
California coastline. They treat stranded animals, including
harbor seals, at their hospital and when possible, release
them back into the wild. In 2010, they treated 132 harbor
seals and were able to release 73 of them. The Marine
Mammal Center staff works with scientists around the
world to learn from the animals they rescue. Their publica-
tions (http://www.marinemammalcenter.org/science/
publications/), provide a valuable resource for understand-
ing the threats to marine mammals, including the threats
from exposure to chemical contaminants.
Year-round residency, feeding at the top of the foodchain and close to the shore, and maintaining a largemass of fa y tissue over many years put seals atparticular risk of accumulating toxic pollutants
Harbor seals on Castro Rocks. Photograph by Suzanne Manugian.
90 FEATURE ARTICLES | SEALS

8/3/2019 Pulse 2011 - Effects on Aquatic Life
http://slidepdf.com/reader/full/pulse-2011-effects-on-aquatic-life 92/104
SuisunBay San Pablo
Bay
Central Bay
South Bay
Lower SouthBay
0 10 20Km
1
2
34
67
8
5
9
10
11
12
1. Tubbs Island
2. Sisters Island
3. Castro Rocks
4. Corte Madera
5. Brooks Island
6. Strawberry Split
7. Angel Island
8. Oakland Entrance
9. Yerba Buena Island
10. Grecko Island
11. Mowry Slough
12. Guadalupe Slough
FIGURE 1 Major harbor seal haul-out sites in San Francisco Bay. Castro Rocks, Yerba Buena Island,and Mowry Slough are the most heavily used sites.
Harbor seal mother and pup. Photograph by Suzanne Manugian.
91

8/3/2019 Pulse 2011 - Effects on Aquatic Life
http://slidepdf.com/reader/full/pulse-2011-effects-on-aquatic-life 93/104
F E A T U R E A R T I C L E S
|
S E A L S
T H E
P U L S E
O F
T H E
E S T U A R Y
2 0 1 1
ORGANIC CONTAMINANTS
ACCUMULATE IN SEAL
BLUBBER AND OTHER
TISSUES
Studies of organic contaminants in San Francisco Bay
harbor seals began in the 1990s (reviewed for the RMP
in Thompson et al. 2007). Those studies documented
elevated levels of organic pollutants, such as PCBs and
organochlorine pesticides, that persist for long periods
in the environment, biomagnify up the food chain, and
accumulate in fatty tissues, such as seal blubber. Other
studies from the 1990s documented a variety of abnormal
health parameters in harbor seals, such as low red blood cell
counts and high white blood cell counts, and hypothesized
that environmental pollutants might be causing some of
those conditions (Kopec and Harvey 1995).
Davis and other organizations, including The Marine Mam-
mal Center, undertook an integrated study of contaminant
levels, immune function, and biological parameters in
healthy, wild seals (Neale et al. 2005). Scientists captured
and took blood samples from 35 free-ranging Bay har-
bor seals. The 13 males and 22 females, including pups,
yearlings, and adults, were captured with beach seines and
tangle nets from haul-out sites. All seals were re-released
to the wild after weighing, measuring, and drawing blood
samples. The blood samples were then analyzed f or DDE
(a breakdown product of the pesticide DDT), polychlori-
nated biphenyls (PCBs), polybrominated diphenyl ethers
(PBDEs), and biological parameters.
The investigators found that higher DDE, PCB, and PBDE
levels in the blood correlated with white blood cell counts,
suggesting that high levels of contaminants might be associ-
ated with increased rates of infection. There was an inverse
relationship between total PBDEs and red blood cells,
although the relation was not strong enough to suggest a
clear contaminant link to anemia. When the scientists com-
pared their results with earlier studies, they found some
evidence of declining levels of PCBs in Bay seals, although
concentrations remained high enough to warrant continu-
ing concerns for reproductive or immunological effects.
Another recent study examined the effects of develop-
mental stages on concentrations of organic contaminants
in very young central California harbor seals (Greig et
al. 2011). Seal pups are exposed to organic contaminants
through the placenta before birth and through milk during
the three-to-five weeks nursing period after they are born.
The study sampled blubber from 180 wild and stranded
young-of-the-year animals, and categorized them by age
and source of contamination (for example, placenta, milk,
or other diet). Blubber samples were also taken from 23
older seals and two fetuses. The samples were analyzed
for a broad range of organic pollutants, including PCBs,
PBDEs, and organochlorine pesticides.
The study found the highest concentrations of organic con-
taminants in blubber from pups that had been weaned in
the wild, lost weight, then stranded and died. These results
showed that harbor seals may be at particular risk during
a post-weaning period, during which contaminants move
newborn pups found dead near the location of birth, the
researchers could begin discern some geographic patterns,
with pups f rom San Francisco Bay having contaminant
profiles suggestive of more urban inputs and those f rom
Monterey Bay showing more agricultural influence.
These studies began to make a case that levels of organic
contaminants in San Francisco harbor seals appeared to be
elevated. Comparable studies have suggested that for some
pollutants, conditions are similar in other parts o f the world
(FIGURE 2).
Organic pollutants, such as PCBs and organochlorine pesticides, persist for longperiods in the environment, biomagnify up the food chain, and accumulate infa y tissues, such as seal blubber
92 FEATURE ARTICLES | SEALS
2
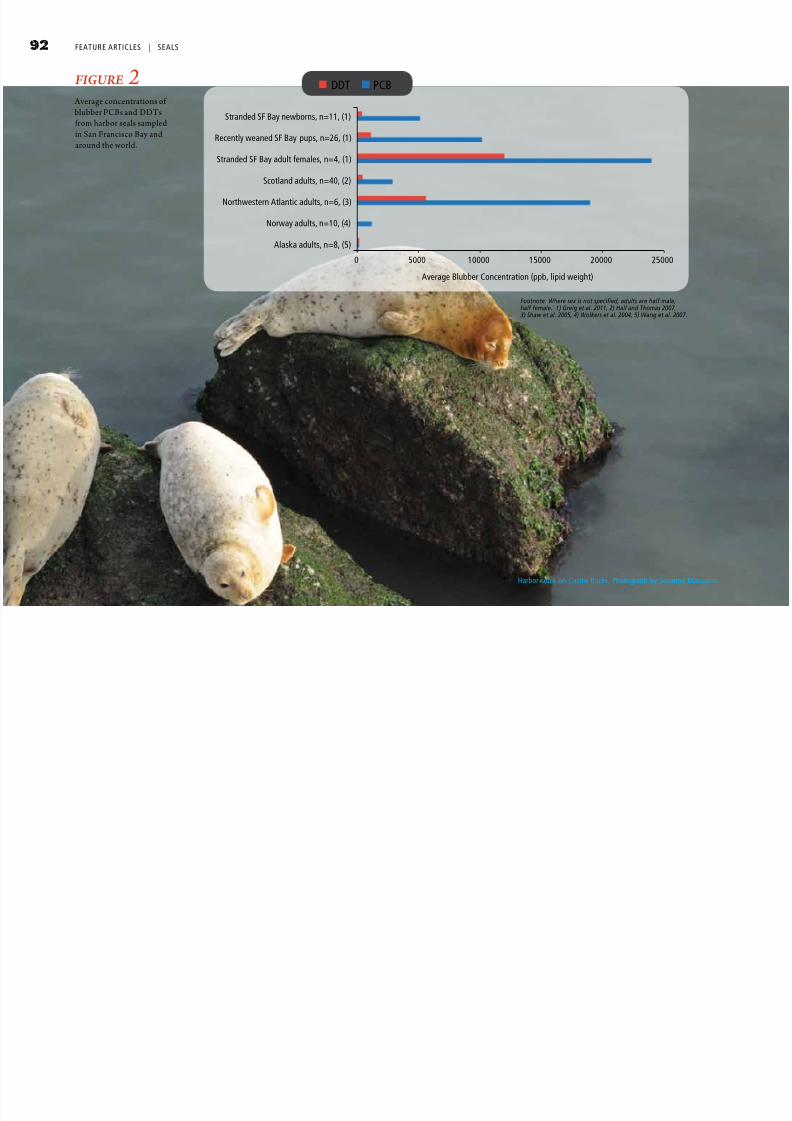
8/3/2019 Pulse 2011 - Effects on Aquatic Life
http://slidepdf.com/reader/full/pulse-2011-effects-on-aquatic-life 94/104
FIGURE 2 Average concentrations of blubber PCBs and DDTsfrom harbor seals sampledin San Francisco Bay andaround the world.
DDT PCB
Average Blubber Concentration (ppb, lipid weight)
2500020000150001000050000
Stranded SF Bay newborns, n=11, (1)
Recently weaned SF Bay pups, n=26, (1)
Stranded SF Bay adult females, n=4, (1)
Scotland adults, n=40, (2)
Northwestern Atlantic adults, n=6, (3)
Norway adults, n=10, (4)
Alaska adults, n=8, (5)
Footnote: Where sex is not specified, adults are half male,half female. 1) Greig et al. 2011, 2) Hall and Thomas 2007,3) Shaw et al. 2005, 4) Wolkers et al. 2004, 5) Wang et al. 2007.
Harbor seals on Castro Rocks. Photograph by Suzanne Manugian.
93

8/3/2019 Pulse 2011 - Effects on Aquatic Life
http://slidepdf.com/reader/full/pulse-2011-effects-on-aquatic-life 95/104
F E A T U R E A R T I C L E S
|
S E A L S
T H E
P U L S E
O F
T H E
E S T U A R Y
2
0 1 1
MERCURY
AND OTHER METALS
Just as the human population is concerned about mercury
levels in seafood, harbor seals are at risk from the legacy of
mercury mining in the South Bay and use of mercury in the
Sierra foothills during the Gold Rush. Selenium is another
environmental concern in the Bay, but it is especially interest-
ing, because it can counteract some harmful e ects of mercury
in harbor seals. Changes in relative levels of the toxic form of
mercury, methylmercury, in comparison to selenium levels can
be indicative of increased mercury toxicity. Seals may also be
at risk of toxicity from other metals, such as lead.
Seals accumulate mercury, in the form of methylmercury,
mostly from eating sh. Methylmercury bioaccumulates and
biomagnies through the food chain. Seals and other mam-
mals are able to transform methylmercury in their digestive
systems and livers into another form, inorganic mercury.
Both methylmercury and inorganic mercury can be retained
in the liver, circulated through the blood system, and
excreted in urine and feces. Total mercury levels in blood,
including both methylmercury and inorganic mercury, are
regarded as good indicators of ongoing exposure to contami-
nation within a specic geographic area.
Mercury, particularly methylmercury, can also be incor-
porated into hair. Mercury levels in hair samples provide a
longer term record of exposure than bloo d samples. Female
seals can also transfer methylmercury to across the placenta
fetuses and, to a lesser degree, into milk.
Mercury and other inorganic elements were the subject of
a 2003–2005 project that analyzed tissue samples from 186
live and 53 dead seals from central and northern California
(Brookens et al. 2007). Live seals were captured in Monterey
Bay, San Francisco Bay, Point Reyes, and Humboldt County
for blood and hair samples. Blood, hair, and liver samples
were taken from dead seals found at sites along the coast of
central California, including San Francisco Bay. All samples
were analyzed for methylmercury, total mercury (methyl
mercury plus inorganic mercury), selenium, and lead.
This study found elevated concentrations of mercury and
selenium in the blood samples, sometimes higher than
levels known to be toxic to mammals. The average total
mercury in the blood samples exceeded levels that had
previously been recorded for harbor seals, although average
values in liver samples were within the known range. Total
mercury concentrations in liver tissues increased linearly
with age, while methylmercury concentrations increased
exponentially for the first five years of life, leveling off in
adults. These results suggested that the mechanisms for
detoxifying methylmercury are not well developed until
harbor seals reach adulthood. Age-related changes in the
mercury to selenium ratios corroborated that finding.
Except for samples from one adult female, lead concentrations
were uniformly low. at seal was weak and experiencing sei-
zures when it came into e Marine Mammal Center facilities
and died four days later. A necropsy found a leadshing sinker
in the seal’s stomach and high lead levels in blood and liver tis-
sues (Zabka et al. 2006).e sinker was a common type used
by sport and commercialshermen and was too large to move
through the digestive system.
No clear geographic trends in metals concentrations were
detected during the Brookens et al. (2007) study, a li ttle
surprising to the scientists, who had anticipated finding
higher mercury levels in San Francisco Bay and Tomales
Bay than the other central California sites. Studies of sedi-
ments, oysters, and fish had found clear differences in San
Francisco Bay and Tomales Bay, both areas with histories
of mercury mining. The scientists attributed the lack of
trends in the harbor seal study to diff iculties in differentiat-
ing sources of exposure in large, mobile animals of varying
ages and developmental stages.
A subsequent study of seal pup tissues suggested that muscle
samples may be the best tissue for mercury monitoring,
when they are available (Brookens et al. 2008). In this study,
scientists sampled brain, heart, liver, kidney, muscle, blubber,
and other tissues from 26 seal pups that were found dead
on the shoreline or that had been admied for rescue but
subsequently died. Total mercury levels were highest in hair
samples, but the levels in muscle samples correlated beer
with results from other tissues, making it the best measure
for comparisons with other studies.
e study found elevated concentrations of mercury and selenium in the bloodsamples, sometimes higher than levels known to be toxic to mammals
94 FEATURE ARTICLES | SEALS
8/3/2019 Pulse 2011 - Effects on Aquatic Life
http://slidepdf.com/reader/full/pulse-2011-effects-on-aquatic-life 96/104
SENTINELS FOR BAY
CONTAMINANTS
Some recent studies of harbor seals in the Bay have gener-
ated considerable public attention. For example, when
scientists analyzed seal blubber samples that had been
collected and archived from stranded, dead harbor seals
during 1989–1998, PBDE levels were among the high-
est ever reported (She et al. 2002). Of most concern, the
highest concentrations came from seals collected in later
years (FIGURE 3). When normalized for lipid content,
the results showed that concentrations were doubling every
1.8 years. These results were reported around the world
and were important for making the case to ban two of three
classes of PBDEs in California. Oregon has banned all
three classes of PBDEs, and the giant retailer Wal-Mart, has
also instituted a ban on all PBDEs. Chemical companies in
-
DEs that are banned in California and will begin to phase
out manufacture of the third ty pe in 2012.
In 2006–2008, the RMP teamed up with scientists from
The Marine Mammal Center to study perfluor inated com-
pounds (PFCs) and other contaminants in blood of harbor
seals from sites near the Richmond Bridge in the North
Bay and in Mowry Slough in the South Bay (Sedlak et al. in
prep). PFCs, which are used in products such as Teflon©
and 3M Scotchgard™, bind to proteins and are ty pically
detected in the blood and liver, rather than in fatty tissues.
The scientists compared the results from Bay samples to
measurements from seals in Tomales Bay, which was con-
sidered an uncontaminated reference site for PFCs. Seal
blood concentrations of PFCs from both San Francisco Bay
sites were about ten times higher than those in seals from
Tomales Bay and higher than most comparable measure-
ments in seals anywhere in the world (FIGURE 3).
To date, lile work has been conducted on the biological
e ects of PFCs in seals. In general, PFCs in mammals are
associated with reproductive problems, suppressed immune
systems, and liver cancer. One study of seals in Lake Baikal
in Russia suggested that PFCs could a ect the signaling
pathway related to transforming normal cells into cancers. A
recent study of the California sea oer population along the
central California coast identied a signicant correlation
between the presence of PFCs and the incidence of disease.
There was good news in another collaboration with The
Marine Mammal Center. The RMP has recently completed
a project to quantif y a newer brominated flame retardant,
hexabromocyclododecane (HBCD), in seal tissues. HBCD
is added to polystyrene insulation that is used in build-
ing construction. The study found relatively low levels of
the compound in Bay seals, lower than levels detected in
similar studies in Asia and much lower than levels detected
in Europe.
Another recent study showed a possible link between a
birth defect and petroleum pollution. is study received
aention because it occurred aer the 2007 San Francisco
bay M/V COSCO Busan oil spill. In April 2008, a newborn
male harbor seal came into e Marine Mammal Center
with a severe birth defect and was euthanized (Harris et al.
2011). e seal pup was less than three days old, undernour-
ished, and su ering from many so tissue masses around the
mouth, which likely prevented it from nursing. Analysis of
bile samples found PAH levels that suggested a recent expo-
sure to diesel or crude oil. How the animal had been exposed
to petroleum pollutants was unclear, but the mouth lesions
suggested that the exposure occurred before birth. e oil
spill occurred about one third of the way through the pup’s
gestation. Although the mother’s movements are unknown,
it is possible that she was exposed to oil from the spill.
CONTINUING
INVESTIGATION
The Marine Mammal Center continues to perform blood
and tissue analyses on the animals within their care. Their
facilities and research capabilities have become a valuable
resource to federal and state agencies, universities, and oth-
er scientific organizations. Their collaborations continue
to work towards understanding the effects that chemical
pollutants have on harbor seal health and reproduction,
determining how and where they enter the food chain, and
ultimately determining the risks they pose to wi ldlife and
human health.
One of these studies, a joint project with the RMP and the
National Institute of Standards and Technology, is currently
identifying a broad range of natural and man-made chemical
-
like previous studies that targeted specic compounds, this
“untargeted” approach takes advantage of recent advances
in analytical instrumentation to examine a broader range of
contaminants than have been studied before.
In another ongoing study, researchers from Moss Landing
Marine Laboratory are evaluating the underlying cause of
incidence of a red coat or pelage in harbor seals from the Bay.
Harbor seals typically have a light or dark spoed coat, but
some seals in the Bay develop a reddish coat, which has been
aributed to iron accumulation. In itself, the red pelage does
not appear to harm the animals, but some red-pelaged seals
have displayed hair loss and shortened vissibrae (whiskers),
which could negatively a ect foraging success. An earlier
study (Kopec and Harvey 1995) suggested that development
of red pelage may be the result of selenium toxicity. e goals
of the ongoing study are to determine whether selenium tox-
icity has the potential to cause red pelage and whether there
are potential adverse health implications.
95

8/3/2019 Pulse 2011 - Effects on Aquatic Life
http://slidepdf.com/reader/full/pulse-2011-effects-on-aquatic-life 97/104
F E A T U R E A R T I C L E S
|
S E A L S
T H E
P U L S E
O F
T H E
E S T U A R Y
2
0 1 1
T o t a l P B D E
C o n c e n t r
a t i o n
( n g / g
f a t )
1988 1990 1992 1994 1996 1998 2000
10
100
1,000
10,000
100,000 FIGURE 3Concentrations of total PBDEs in SanFrancisco Bay harbor seals (from She etal. 2002). e disturbing increase andhigh levels focused aention on PBDEsthroughout the state.
96 FEATURE ARTICLES | SEALS

8/3/2019 Pulse 2011 - Effects on Aquatic Life
http://slidepdf.com/reader/full/pulse-2011-effects-on-aquatic-life 98/104
FIGURE 4In 2006–2008, the RMP teamed up with scientists from e MarineMammal Center to study peruorinated compounds (PFCs) and othercontaminants i n blood of harbor seals from sites near the RichmondBridge in the North Bay and in Mowry Slough in the South Bay. PFCshave been used extensively over the last 50 years in a variety of prod-ucts including textiles treated with stain-repellents, re-ghting foams,refrigerants, and coatings for paper used in contact w ith food products.Peruorooctane sul fonate (PFOS) and related PFCs have been associated
with a variety of toxic e ects including mortality, carcinogenity, and ab-
normal development. PFCs bind to proteins and are typica lly measuredin the blood and liver, rather than in fa y tissues.e scientists comparedthe results from Bay sa mples to measurements from seals i n Tomales Bay,
which was considered an uncontaminated reference site for PFCs. Seal blood concentrations of PFCs from both San Francisco Bay sites wereabout ten times higher than those in seals f rom Tomales Bay and higherthan most comparable measurements in seals any where in the world.
0
20 0
40 0
60 0
80 0
1000
1200
1400
1600
0
50
10 0
15 0
20 0
25 0
30 0
35 0
40 0
45 0
PFOS
Mowry (SF Bay)
Castro Rocks (SF Bay)
Tomales Bay
P F O S i n s e r u m ( n
g / m L )
S e r u m C
o n c e n t r a t i o n ( n g / m
L )
n=6 n=34 n=21
BalticSea
n=18
BalticSea
n=26
Can.Arcticn=12
NorwegianArticn=18
SFBay
n=40
SFRef.
n=21
Source: Giesy, J. and K. Kannan. 2001. Global distribution of pefluorooctanesulfonate in wildlife. Environ. Sci. Technol. vol 35. 1339-1342.
97
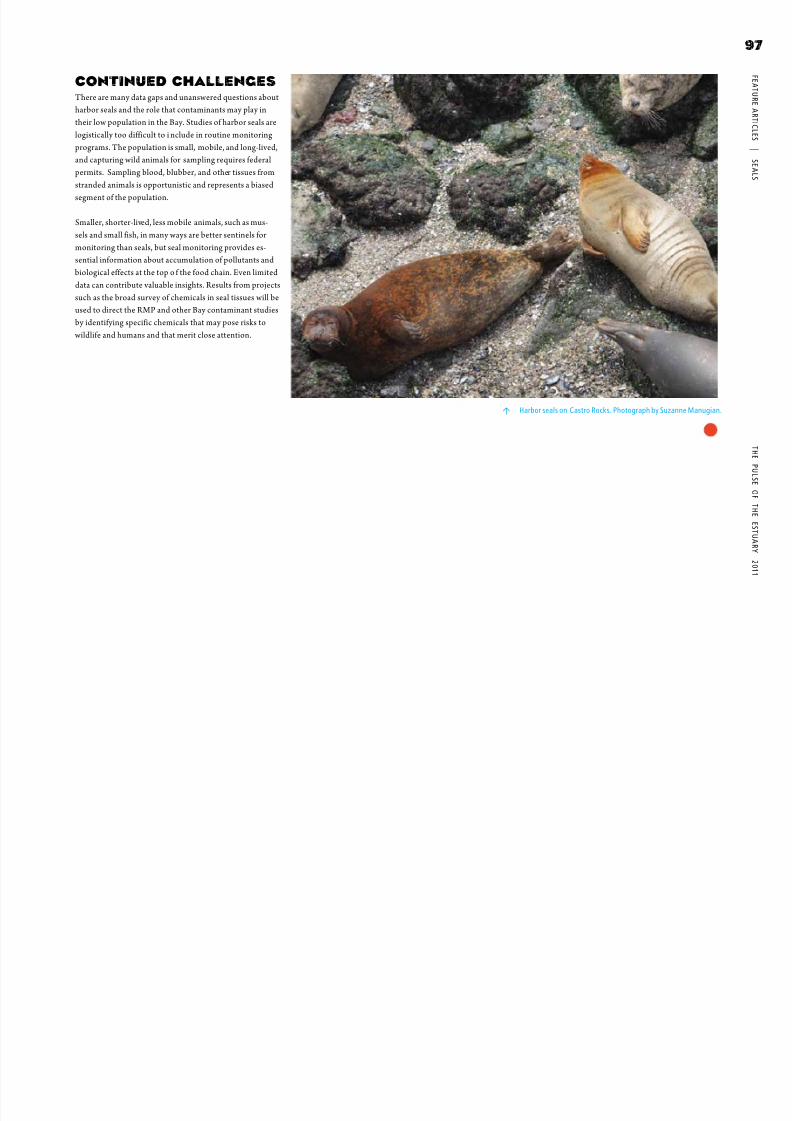
8/3/2019 Pulse 2011 - Effects on Aquatic Life
http://slidepdf.com/reader/full/pulse-2011-effects-on-aquatic-life 99/104
F E A T U R E A R T I C L E S
|
S E A L S
T H E
P U L S E
O F
T H E
E S T U A R Y
2
0 1 1
CONTINUED CHALLENGESThere are many data gaps and unanswered questions about
harbor seals and the role that contaminants may play in
their low population in the Bay. Studies of harbor seals are
logistically too difficult to i nclude in routine monitoring
programs. The population is small, mobile, and long-lived,
and capturing wild animals for sampling requires federal
permits. Sampling blood, blubber, and other tissues from
stranded animals is opportunistic and represents a biased
segment of the population.
Smaller, shorter-lived, less mobile animals, such as mus-
sels and small fish, in many ways are better sentinels for
monitoring than seals, but seal monitoring provides es-
sential information about accumulation of pollutants and
biological effects at the top o f the food chain. Even limited
data can contribute valuable insights. Results from projects
such as the broad survey of chemicals in seal tissues will be
used to direct the RMP and other Bay contaminant studies
by identifying specific chemicals that may pose risks to
wildlife and humans and that merit close attention.
Harbor seals on Castro Rocks. Photograph by Suzanne Manugian.
98 REFERENCES
R
8/3/2019 Pulse 2011 - Effects on Aquatic Life
http://slidepdf.com/reader/full/pulse-2011-effects-on-aquatic-life 100/104
References
FEATURE ARTICLES
WERME
Cloern, J.E. 1982. Does the benthos control phyto-plankton biomass in south San Francisco Bay?Marine Ecology Progress Series 9:191–202.
Cloern, J.E. and R. Dufford. 2005. Phytoplankton
community ecology: principles applied in SanFrancisco Bay. Marine Ecology Progress Series285: 11–28.
Cloern, J.E. and R. Dugdale. 2010. Chapter 5. CaseStudies, 6. San Francisco Bay. In Glibert, P.M., C.J.Madden, W. Boynton, D. Flemer, C. Heil, and J.Sharp, principal editors. Nutrients in estuaries: asummary report of the National Estuarine ExpertsWorkgroup 2005–2007. U.S. EnvironmentalProtection Agency. pages 117–126.
Cloern, J.E., K.A. Hieb, T. Jacobson, B. Sansó, E. DiLorenzo, M.T. Stacy, J.L. Largie, W. Meiring, W.T.Peterson, T.M. Powell, M. Nider, and A.D. J assby.2010, Biological communities in San Francisco Baytrack large-scale climate forcing over the NorthAtlantic. Geophysical Research Letters 37: L216026 pages.
Cloern, J.E., A.D. Jassby, T.S. Schraga, and K.L Dallas.2006. What is causing the phytoplankton increasein San Francisco Bay? The Pulse of the Estuary:Monitoring and Managing Water Quality in theSan Francisco Estuary. SFEI Contribution 517. San
Francisco Estuary Institute, Oakland, CA. Pages62–65.
Cloern, J.E., A.D. Jassby, J.K. Thompson, and K.A.Hieb. 2007. A cold phase of the East Pacific trig-gers new phytoplankton blooms in San FranciscoBay. Proceedings of the National Academy ofSciences USA. 104: 18,561–18,565.
Cohen, A.N. 2005. Guide to the Exotic Species of SanFrancisco Bay. San Francisco Estuary Institute,Oakland, CA. Available at www.exoticsguide.org
Cox, T., T. Maris, K. Soetaert, D. Conley, S. VanDamme, P. Meire, J. Middelburg, M. Vos, and E.Struyf. 2009. A macro-tidal freshwater ecosystemrecovering from hypereutrophication: the Scheldtcase study. Biogeosciences 6:2935–2948.
Dugdale, R.C., F.P. Wilkerson, V.E. Hogue, and A. Mar-chi.2007. The role of ammonium and nitrate inspring bloom development in San Francisco Bay.Estuarine, Coastal and Shelf Science 73: 17–29.
Dugdale, R.., F.P. Wilkerson, A.Parker, A.Marchi, andK. Taberski. Submitted. Decreased anthropogenicammonium enables spring blooms in an urban-
ized estuary.Glibert, P.M. 2010. Long-term changes in nutrient
loading and stoichiometry and their relationshipswith changes in the food web and dominantpelagic fish species in the San Francisco Estuary,California. Reviews in Fisheries Science 18:211–232.
Glibert, P.M., C.J. Madden, E. Dettmann, W. Boynton,C. Heil., W. Nelson, J. Lehrter, J. Latimer, D.Flemer, M. Kennish, C. Brown, and S. Bricker.2010. Chapter 4. A Framework for DevelopingNutrient Criteria. In Glibert, P.M., C.J. Madden, W.Boynton, D. Flemer, C. Heil, and J . Sharp, principaleditors. Nutrients in estuaries: a summary reportof the National Estuarine Experts Workgroup2005–2007. U.S. Environmental Protection Agency.pages 43–71.
Hager, S.W. and L.E. Schemel. 1996. Dissolvedinorganic nitrogen, phosphorus, and silicon inSouth San Francisco Bay. I. Major factors affect-ing distributions. In J.T. Hollibaugh, editor. SanFrancisco Bay: the ecosystem. Pacific Division,
American Association for the Advancement ofScience. pages 189–215.
Hoof, R.C. and S.M. Bollens. 2004. Functional re-sponse and potential predator impact of Tortanusdextribolatus, a carnivorous copepod recentlyintroduced into the San Francisco Estuary. MarineEcology Progress Series 277:167–179.
Jassby, A. 2008. Phytoplankton in the upper SanFrancisco Estuary: recent biomass trends, theircauses, and their trophic significance. San Fran-
cisco Estuary and Watershed Science 6(1) JohnMuir Institute of the Environment. University ofCalifornia, Davis, California. 24 pages
Jassby, A.D., J.E. Cloern, and B.E. Cole. 2002. Annualprimary production: patterns and mechanisms ofchange in a nutrient-rich tidal system. Limnologyand Oceanography 47: 698–712.
Lewicki, M., and L.J. McKee. 2009. Watershed specificand regional scale suspended sediment loads forBay Area small tributaries. A technical report forthe Sources Pathways and Loading Workgroupof the Regional Monitoring Program for WaterQuality: SFEI Contribution #566. San Francisco Es-tuary Institute, Oakland, CA. 28 pp + Appendices.
McKee, L.J., N.K. Ganju, and D.H. Schoellhamer. 2006.Estimates of suspended sediment entering SanFrancisco Bay from the Sacramento and San Joa-quin Delta, San Francisco Bay, California. Journalof Hydrology 323:335-352.
McKee, L., A. Gilbreath, J. Beagle, D. Gluchowski, J.Hunt, M. Sutula, D. Gillett, P. Fong, and J. Kaldy.In preparation. Numeric nutrient endpoint devel-
opment for San Francisco Bay – literature reviewand data gaps analysis. SFEI Contribution xxx. SanFrancisco Estuary Institute, Oakland, CA.
Mialet, B., J. Gouzou, F. Azemar, T. Maris, C. Sossou,N. Toumi, S. Van Damme, P. Meire, and M. Tackx.2011. Response of zooplankton to improvingwater quality in the Scheldt estuary (Belgium).Estuarine, Coastal and Shelf Science doi:10.1016/j.ecss.2011.03.015.
Parker, A.E., R.C. Dugdale, and F.B. Wilkerson. Submit-ted. Elevated ammonium concentrations fromwastewater discharge depress primary productiv-ity in the Sacramento River and noerhern Estuary.
San Francisco Bay Regional Water Quality ControlBoard (SFBRWQB). 1975. Water Quality ControlPlan (Basin Plan)Report. San Francisco Bay WaterQuality Control Board, Oakland, CA.
Schoellhamer, D.H. 2009. Suspended sediment inthe Bay: past a tipping point. The Pulse of theEstuary: Monitoring and Managing Water Qualityin the San Francisco Estuary. 2009 Bay Sediments:Past a Tipping Point. SFEI Contribution 583. San
Francisco Estuary Institute, Oakland, CA. pages56–65.
Smith, S.V. and J.T. Hollibaugh. 2006. Water, salt, andnutrient exchanges in San Francisco Bay. Limnol-ogy and Oceanography 51: 504–517.
Taberski, K., R. Dugdale, A. Parker, and A. Marchi.2010. Monitoring spring phytoplankton bloomprogression in Suisun Bay. SWAMP MonitoringPlan 2011-12.
Wilkerson, F.P., R.C. Dugdale, V.E. Hogue, and A.March. 2006. Phytoplankton blooms and nitrogenproductivity in San Francisco Bay. Estuaries andCoasts 29: 401416.
Yoshiyam, K. and J.H. Sharp. 2006. Phytoplanktonresponse to nutrient enrichment in an urbanizedestuary: apparent inhibition of primary produc-tion by overeutrophication. Limnology andOceanography 51:424–434.
SEDLAK
Baginska, B. 2011. Total Maximum Daily Load Sele-nium in the North San Francisco Bay. PreliminaryProject Report. California Regional WaterQuality Control Board, San Francisco Bay Region.Oakland, CA.
Barton, B.A. 2002. Stress in fishes: a diversity ofresponses with particular reference to changesin circulating corticosteroids. Integrative andComparative Biology. 42:517-525.
Baxter, R. et al. 2010 Source Interagency EcologicalProgram 2010 Pelagic Organism Decline WorkPlan and Synthesis of Results.
Beckon, W. and T. Mauer. 2008. Species at Risk fromSelenium Exposure in San Francisco Estuary. Finalreport to the USEPA. US Department of theInterior, Fish and Wildlife Service.
Brar, N., Waggoner, C., Reyes, J.A., Fairey, R. and K.M.Kelley. 2010. Evidence for thyroid endocrinedisruption in wild fish in San Francisco Bay, Cali-fornia. Relationships to contaminant exposures.Aquatic Toxicology. P.203-215 .
Connon, R.E., Geist, J.P., Pfeiff, J.,Loguinov, A.V.,D'Abronzo, L.S., Wintz, H., Vulpe, C.D., and I.Werner. 2009. Linking mechanistic and behavioralresponses to sublethal esfenvalerate exposurein the endangered delta smelt: (Hypomesustranspacificus (Fam. Osmeridae)) BMC Genomics10(608).
Floyd, E.Y., Geist, J.P., and I. Werner. 2008. Acute, sub-lethal exposure to a pyrethroid insecticide altersbehavior, growth and preadation risk in larvaeof the fathead minnow (Pinnephales promelas).Environmental Toxicology and Chemistry. 27(8)1780-1787.
Incardona, J. , Ylitalo, G., Myers, M., Scholz, N., and T.Collier. 2008. The 2007 Cosco Busan oil spill: As-sessing toxic injury to Pacific herring embryos andlarvae in San Francisco estuary. Draft Report.
Jobling, S., Sheahan, D., Osborne, J.A., Mathiessen, P.and J.P. Sumpter. Inhibition of testicular growthin rainbow trout (Oncorhynchus mykiss) exposedto estrogenic alkylphenolic chemicals.
Jobling, S., Nolan, M., Tyler, C.R., Brighty, G., Sumpter,J.P. 1998. Widespread sexual disruption in wildfish. Environmental Science and Technology, V. 32,p. 2498-2506.
Johnson, L. L., T. K. Collier, and J. E. Stein. 2002. Ananalysis in support of sediment quality thresholdsfor polycyclic aromatic hydrocarbons (PAHs)to protect estuarine fish. Aquat. Conserv.-Mar.
Freshw. Ecosyst. 12:517-538Kidd, K.A., Blanchfield, P.J., Mill, K.H., Palace, V.P.,
Evans, R.E.. Lazorchak, J.M., Flick, R.W. 2007.Collapse of a fish population after exposure to asynthetic estrogen. Proceedings of the NationalAcademy of Sciences, V. 104, p. 8897-8901.
Lavado, R., Loyo-Rosales, J., Floyd, E., Kolodziej,E.P., Snyder, S.A., Sedlak, D.L., and D. Schlenk.Site-Specific Profiles of Estrogenic Activity inAgricultural Areas of California’s Inland Waters.Environ. Sci. Technol. 43. P.9110-9116.
McIntyre, J.K., Baldwin, D.H., Meador, J.P. and N.L.Scholz. 2008. Chemosensory deprivation inJuvenile Coho salmon exposed to dissolved cop-per under varying water chemistry conditions.Environ. Sci. Technol. 42 p. 1352-1358.
Meyer, M.S., Johnson, L.L. and T.K. Collier. Es tablish-ing the causal r elationship between polycyclicaromatic hydrocarbon (PAH)exposure and hepaticneoplasms and neoplasia-related liver lesions inEnglish sole (Pleuronectes vetulus). Human andecological risk assessment. 9. P. 67-94.
Mommsen, T.P., Vijayan, M.M., and Moon, T.W. 1999.Cortisol in teleosts: dynamics, mechanisms ofaction, and metabolic regulation. Rev. Fish Biol.and Fisheries 9:211-268.
Nillos, M.G., Chajkowski, S., Rimoldi, J.M., Gan, J.,Lavado, R. and D. Schlenk. 2010. Stereoselectivebiotransformation of permethrin to estrogenicmetabolites in fish. Chem. Res. Toxicol. 23. p.
1568-1575.Oris J.T. and J.P. Giesy. 1985. The photoenhanced tox-
icity of anthracene to juvenile sunfish (LepomisSPP). Aquatic Toxicology. 6 p. 133-146.
Pacific Fisheries Management Council. 2010. StockAssessment and Fisheries Evaluation (SAFE) 2010Ocean Salmon Fisheries.
Reynaud, S. and P. Deschaux. 2006. The effects ofpolycyclic aromatic hydrocarbons on the immunesystem of fish: A review. Aquatic Toxicology. 77.P. 229-238.
Rodgers-Gray, T.; Jobling, S.; Morris, S.; Kelly, C.;Kirby, S.; Janbakhsh, A.; Harries, J.; Waldock,M.; Sumpter, J.; and C. Tyler. 2000. Long-TermTemporal Changes in the Estrogenic Compositionof Treated Sewage Effluent and Its BiologicalEffects on Fish
Stewart, R.A., Luoma, S., Schlekat, C, Doblin, M. andK. Hieb. 2004. Food Web Pathway DeterminesHow Selenium affects aquatic ecosystems: a SanFrancisco Bay case study. Environ. Sci. Technol.38. 4519-4526.
Van der Kraak, G., Hewitt, M., Lister, A., McMaster,M.E., and K.R. Munkittrick. 2001. Endocrine toxi-cants and reproductive success in fish. Human andEcological Risk Assessment. Vol. 7. p. 1071-1025.
Wang, L., W. Liu, C. Yang, L. Pan, J. Gan, C. Xu, M.Zhao, Y. Ma, and D. Schlenk. 2007. Estrogenicpotential and bioaccumulation of bifenthrinenantiomers. Environ. Sci. Technol. 41: 6124-6128.
Weston, D.P. and M.J. Lydy. 2010. Urban andagricultural sources of pyrethroid insecticides tothe Sacramento-San Joaquin Delta of California.Environ. Sci. Technol. 44. p. 1833-1840.
Xie, L. Thrippleton, K., Irwin, M.A., Siemering, G.S.,Mekebri, A., Crane, D., Berry K. and D. Schlenk.2005. Evaluation of estrogenic activities ofaquatic herbicides and surfactants using arainbow trout vitellogenin assay. ToxicologicalSciences. Vol. 87. P. 391-398.
GRENIER
Ackerman, J., J. Takekawa, C. Eagles-Smith, andS. Iverson. 2008a. Mercury contamination andeffects on survival of American avocet andblack-necked stilt chicks in San Francisco Bay.Ecotoxicology 17:103-116.
Ackerman, J. T., C. A. Eagles-Smith, J. Y. Takekawa,and S. A. Iverson. 2008b. Survival of postfledgingForster's terns in relation to mercury exposure inSan Francisco Bay. Ecotoxicology 17:789-801.
Adelsbach, T. L. and T. Maurer. 2007. Dioxin toxicequivalents, PCBs, and PBDEs in eggs of avianwildlife of San Francisco Bay. Sacramento Fish andWildlife Office, Sacramento, Ca.
Davis, J. A., B. K. Greenfield, J. Ross, D. Crane, G.Ichikawa, J. Negrey, H. Spautz, and N. Nur. 2004.CISNET Technical Report: Pollutant accumulationin eggs of double-crested cormorants and songsparrows in San Pablo Bay. SFEI Contribution#412, San Francisco Estuary Institute (SFEI),Oakland, CA.
Davis, J. A., F. Hetzel, J. J. Oram, and L. J. McKee.2007. Polychlorinated biphenyls (PCBs) in SanFrancisco Bay. Environmental Research 105:67-86.
Eagles-Smith, C., and J. Ackerman. 2008. MercuryBioaccumulation and Effects on Birds in San Fran-cisco Bay. Pages 56-64 in The Pulse of the Estuary:Monitoring and Managing Water Quality in theSan Francisco Estuary. SFEI Contribution #559, SanFrancisco Estuary Institute, Oakland, CA.
Eagles-Smith, C. A., J. T. Ackerman, S. E. W. DeLa Cruz, and J. Y. Takekawa. 2009. Mercurybioaccumulation and risk to three waterbirdforaging guilds is influenced by foraging ecologyand breeding stage. Environmental Pollution157:1993-2002.
Ehrler, C. P., M. L. Elliott, J. E. Roth, J.R. Steinbeck, A.K. Miller, W. J. Sydeman, and A.M. Zoidis. 2006.Oakland Harbor Deepening Project (-50'): LeastTern, Fish, and Plume Monitoring. Project Year2005 and Four-Year Final Monitoring Report.Tetra Tech, Inc., San Francisco, California. July2006.
Evers, D. C., R. P. Mason, N. C. Kamman, C. Y. Chen, A.L. Bogomolni, D. L. Taylor, C. R. Hammerschmidt,S. H. Jones, N. M. Burgess, K. Munney, and K. C.Parsons. 2008. Integrated mercury monitoringprogram for temperate estuarine and marineecosystems on the North American Atlantic coast.Ecohealth 5:426-441.
Fimreite, N. 1971. Effects of methylmercury onring-necked pheasants, with special referenceto reproduction. Canadian Wildlife Service Oc-casional Papers 9:39.
Greenfield, B. K. and A. Jahn. 2010. Mercury in SanFrancisco Bay forage fish. Environmental Pollution158:2716-2724.
Grenier, J. L. 2004. Ecology, behavior, and trophicadaptations of the salt marsh song sparrow Me-lospiza melodia samuelis: the importance of thetidal influence gradient [dissertation]. Universityof California: Berkeley.
Grenier, L., M. Marvin-DiPasquale, D. Drury, J. Hunt,A. Robinson, S. Bezalel, A. Melwani, J. Agee, E.Kakouros, L. Kieu, L. Windham-Myers, and J. Col-lins. 2010. South Baylands Mercury Project. FinalReport prepared for the California State CoastalConservancy by San Francisco Estuary Institute,U.S. Geological Survey, and Santa Clara ValleyWater District. San Francisco Estuary Institute,Oakland, CA.
Hatch, J. J. and D. V. Weseloh. 1999. Double-crestedCormorant (Phalacrocorax auritus). The Birds ofNorth America Online (A. Poole, Ed.). Cornell Labof Ornithology, Ithaca.
99
C
8/3/2019 Pulse 2011 - Effects on Aquatic Life
http://slidepdf.com/reader/full/pulse-2011-effects-on-aquatic-life 101/104
RE F E R E N C E S
T H E
P U L S E
O F
T H E
E S T U A R Y
2
0 1 1
Heinz, G. H. 1979. Methylmercury: reproductiveand behavioral effects on three generations ofmallard ducks. Journal of Wildlife Management43:394-401.
Heinz, G. H., D. J. Hoffman, J. D. Klimstra, K. R. Steb-bins, S. L. Kondrad, and C. A. Erwin. 2009. SpeciesDifferences in the Sensitivity of Avian Embryosto Methylmercury. Archives of EnvironmentalContamination and Toxicology. 56:129-38
Hothem, R.L., and D. Hatch. 2004. Reproductive successof the Black-crowned Night Heron at AlcatrazIsland, San Francisco Bay, California, 1990-2002.
Waterbirds 27:112-125.Jackson, A., A. M. Condon, M. A. Etterson, D. C. Evers,
S. B. Folsom, J. Detweiler, J. Schmerfeld, and D.A. Cristol. In preparation. Modeling the effect ofmercury exposure on the reproductive success of afree-living terrestrial songbird.
Moffitt, J. 1941. Notes on the food of the CaliforniaClapper Rail. Condor 43:270-273.
Robinson, A., L. Grenier, M. Klatt, S. Bezalel, M. Wil-liams, and J. Collins. 2011. The Song Sparrow as aBiosentinel for Methylmercury in Riparian FoodWebs of the San Francisco Bay Area. San FranciscoEstuary Institute, Oakland, California.
Schwarzbach, S. and T. Adelsbach. 2003. Field Assess-ment of avian mercury exposure in the Bay-Deltaecosystem (Subtask 3B). CALFED Bay-Delta MercuryProject, Sacramento, CA.
Schwarzbach, S. E., J. D. Albertson, and C. M. Thomas.2006. Effects of predation, flooding, and con-tamination on reproductive success of CaliforniaClapper Rails (Rallus longirostris obsoletus) in SanFrancisco Bay. Auk 123:45-60.
Shaw, S. D., and K. Kannan. 2009. PolybrominatedDiphenyl Ethers in Marine Ecosystems of theAmerican Continents: Foresight from CurrentKnowledge. Reviews on Environmental Health24:157-229.
She, J. W., A. Holden, T. L. Adelsbach, M. Tanner, S.E. Schwarzbach, J. L. Yee, and K. Hooper. 2008.Concentrations and time trends of polybrominateddiphenyl ethers (PBDEs) and polychlorinatedbiphenyls (PCBs) in aquatic bird eggs from SanFrancisco Bay, CA 2000-2003. Chemosphere73:S201-S209.
She, J. W., A. Holden, M. Tanner, M. Sharp, T. Adels-bach, and K. Hooper. 2004. Highest PBDE levels(max 63 ppm) yet found in biota measured in sea-bird eggs from San Francisco Bay. OrganohalogenCompounds 66:3939-3944.
Takekawa, J.Y., S.E. Wainwright-De La Cruz, R.L.Hothem, and J. Yee. 2002. Relating body conditionto inorganic pollutant concentrations of divingducks wintering in coastal California. Arch. Envi-ron. Contam. Toxicol. 42:60-70.
Tsao, D. C., A. K. Miles, J. Y. Takekawa, and I. Woo.2009. Potential Effects of Mercury on ThreatenedCalifornia Black Rails. Archives of EnvironmentalContamination and Toxicology 56:292–301.
Weseloh, D.V., S. M. Teeple, and M. Gilbertson. 1983.Double-crested cormorants of the Great Lakes:Egg-laying parameters, reproductive failure, andpollutant residues in eggs, Lake Huron 1972-1973.Canadian Journal of Zoology 61:427-436.
Yogui, G.T., and J. L. Sericano. 2009. Polybrominateddiphenyl ether flame retardants in the U.S. marineenvironment: A review. Environment International35:655-666.
WERME
Brookens, T.J., J.T. Harvey, and T.M. O’Hara. 2007. Traceelement concentrations in the Pacific harbor seal(Phoca vitulina richardii) in central and northernCalifornia. Science of the Total Environment 372:676–692.
Brookens, T.J., T.M. O’Hara, R.J. Taylor, G.R. Bratten,and J.T. Harvey. 2008. Total mercury body burdenin Pacific harbor seal, Phoca vitulina richardii, pupsfrom central California. Marine Pollution Bulletin56: 27–41.
Casco Bay Estuary Partnership. 2007. How are seals, astop predators, impacted by toxic contaminants inCasco Bay and the Gulf of Maine. 2007 Toxic Pollu-tion in Casco Bay: Sources and Impacts. Casco BayEstuary Partnership, Portland, Maine. Pages 61–68.
Greig, D.J., G.M. Ylitalo, E.A. Wheeler, D. Boyd, F.M.D.Gulland, G.K. Yanagida, J.T. Harvey, and A.J. Hall.In press. Geography and stage development affectpersistent organic pollutants in stranded and wild-caught harbor seal pups from central California.
Grigg, E.K. 2003. Pacific harbor seals (Phoca vitulinarichardii) in San Francisco Bay, California: a reviewof the literature. Report to the San Francisco Estu-ary Institute. Oakland, California. 109 pages.
Harris, H.S., P. Facemire, D.J. Greig, K.M. Colegrove,G.M. Ylitalo, G.K. Yanagida, F.B. Nutter, M.Fleetwood, and F.M.D. Gulland. 12011. Congenitalneuroglial heterotopia in a neonatal harbor seal(Phoca vitulina richardsi) with evidence of recentexposure to polycyclic aromatic hydrocarbons.Journal of Wildlife Diseases 47: 246–254.
Kopec, D.A. and J.T. Harvey. 1995. Toxic pollutants,health indices, and population dynamics of harborseals in San Francisco Bay, 1989–1992. Moss Land-ing Marine Laboratories Technical Publication 96-4.
Marine Environmental Research Institute. 2006. Seasas sentinels: assessing toxic contaminants innorthwestern Atlantic Coast seals. Final projectreports to the National Oceanographic and At-mospheric Administration. Marine EnvironmentalResearch Institute, Blue Hill, Maine. 11 pages plusappendices.
Neale, J.C.C., F.M.D. Gulland, K.R. Schmelzer, J.T.Harvey, E.A. Berg, S.G. Allen, D.J. Greig, E.K. Grigg,and R.S. Tjeerdema. 2005. Contaminant loads andhematological correlates in the harbor seal (Phocavitulina) of San Francisco Bay, California. Journalof Toxicology and Environmental Health, Part A68: 617–633.
Park, J-S., O.I. Kalantzi, D. Kopec, and M. Petreas.2009. Polychlorinated biphenyls (PCBs) and theirhydroxylated metabolites (OH-PCBs) in livers ofharbor seals (Phoca vitulina) from San FranciscoBay, California and Gulf of Maine. Marine Environ-mental Research 67: 129–135.
Sedlak, M., D. Greig, R. Grace, and P. Riley. MSS inprep. Accepted. J. Environ. Mon.
She, J., M. Petreas, J. Winkler, P. Visita, M. McKinney,and D. Kopec. 2002. PBDEs in the San FranciscoBay Area: measurements in harbor seal blubberand human breast adipose tissue. Chemosphere46:697–707.
Thompson, B., T. Adelsbach, C. Brown, J. Hunt, J.Kuwabara, J. Neale, H. Ohlendorf, S. Schwarzbach,R. Spies, and K. Taberski. 2007. Biological effects ofanthropological contaminants in the San FranciscoEstuary. Environmental Research 105: 156–174.
Zabka, T.S., M. Haulenat, B. Puschner, F.M.D. Gulland,P.A. Conrad, and L.J. Lowenstine. 2006. Acute leadtoxicosis in a harbor seal (Phoca vitulina rischardsi)consequent to ingestion of a lead fishing sinker.Journal of Wildlife Diseases 42: 651–657.
EDITORS
Jay Davis, Christine Werme, Meg Sedlak
ART DIRECTIONAND DESIGN
Linda Wanczyk
CONTRIBUTINGAUTHORS
Chris Werme, Margy Gassel, Andy Cohen, Meg Sedlak,Robin Stewart, Naomi Feger
RMP DATAMANAGEMENT
Cristina Grosso, Sarah Lowe, John Ross, Amy Franz, Don Yee, Adam Wong
INFORMATIONCOMPILATION
Rachel Allen, David Gluchowski,
John Ross, Jim Cloern, Alan Jassby,Dave Schoellhamer, Lester McKee,Nicole David, Alicia Gilbreath,
April Robinson
INFORMATIONGRAPHICS
Linda Wanczyk, Marcus Kla ,Susan Putney
IMAGE ANDINFORMATIONGATHERING
Meg Sedlak, Tara Schraga
THE FOLLOWING
REVIEWERSGREATLY IMPROVEDTHIS DOCUMENTBY PROVIDINGCOMMENTS ONDRAFT VERSIONS:
REVIEWERS
Bridgee DeShields, Joanna York,Chris Sommers, Mike Connor,
Jim Haussener, Harry Ohlendorf,Eric Dunlavey, Francois Rodigari,
Arleen Feng, Naomi Feger,Richard Looker, Karen Taberski,Barbara Baginska,Rachel Allen,Nicole David
Credits
RMP
REGIONAL MONITORING PROGRAMFOR WATER QUALITY IN THESAN FRANCISCO ESTUARY
A program of the San Francisco Estuary Institute4911 Central Avenue, Richmond, CA 94804p: 510-746-SF EI (7334), f: 510-746-7300
rmp committee members
100 CREDITS | RMP COMMITTEE MEMBERS AND PARTICIPANTS

8/3/2019 Pulse 2011 - Effects on Aquatic Life
http://slidepdf.com/reader/full/pulse-2011-effects-on-aquatic-life 102/104
rmp committee membersRMP STEERINGCOMMITTEE
Small POTWs, Karin North, City of PaloAlto
Medium-sized POTWs, Daniel Tafolla,Vallejo Sanitation and Flood Control
DistrictLarge POTWs/BACWA,Kirsten Struve, City of San Jose
Refineries, Peter Carrol, Tesoro GoldenEagle Refinery
Industry, Dave Allen, USS-POSCO
Cooling Water, Steve Bauman,Mirant Delta LLC
Stormwater Agencies, Adam Olivieri,EOA, Inc.
Dredgers, John Coleman,Bay Planning Coalition
San Francisco Bay Regional WaterQuality Control Board, Tom Mumley
Rob Lawrence, U.S. Army Corps of
EngineersRMP Steering Committee Chairin bold print
RMP TECHNICALREVIEW COMMITTEE
POTWs/BACWA, Nirmela Arsem, EastBay Municipal Utility District
Rod Miller, San Francisco Public UtilitiesCommission
South Bay Dischargers, Tom Hall, EOAInc.
Refineries, Bridgette DeShields,ARCADIS BBL
Industry, Dave Allen, USS-POSCO
Stormwater Agencies, Chris Sommers,EOA, Inc.
Dredgers, John Prall, Port of Oakland
San Francisco Bay Regional WaterQuality Control Board, Karen Taberski
U.S. EPA, Luisa Valiela
City of San Jose, Eric Dunlavey
City/County of San Francisco, MichaelKellogg
U.S. Army Corps of Engineers, RobertLawrence
RMP Technical Review Committee
Chair in bold print
RMP SCIENCE ADVISORS
Contaminant Fate Workgroup
Dr. Joel Baker, University of Washington- Tacoma
Dr. Frank Gobas, Simon Fraser University
Dr. Dave Krabbenhoft, US GeologicalSurvey
Dr. Keith Stolzenbach, University of California – Los Angeles
Emerging Contaminants Workgroup
Dr. Lee Ferguson, Duke University
Dr. Jennifer Field, Oregon StateUniversity
Dr. Derek Muir, Environment Canada
Dr. David Sedlak, University of California- Berkeley
Exposure and Effects Workgroup
Dr. Michael Fry, American BirdConservancy
Dr. Harry Ohlendorf, CH2M Hill
Dr. Daniel Schlenk, University of California – Riverside
Dr. Steve Weisberg, Southern CaliforniaCoastal Water Research Project
Dr. Don Weston, University of California– Berkeley
Sources Pathways and LoadingWorkgroup
Dr. Barbara Mahler, US Geological Survey
Dr. Roger Bannerman, WisconsinDepartment of Natural Resources
Dr. Mike Stenstrom, University of California – Los Angeles
RMP PARTICIPANTS
Municipal Dischargers
Burlingame Waste Water Treatment Plant
Central Contra Costa Sanitary District
Central Marin Sanitation Agency
City of BeniciaCity of Calistoga
City of Palo Alto
City of Petaluma
City of Pinole/Hercules
City of Saint Helena
City and County of San Francisco
City of San Jose/Santa Clara
City of San Mateo
City of South San Francisco/San Bruno
City of Sunnyvale
Delta Diablo Sanitation District
East Bay Dischargers Authority
East Bay Municipal Utility DistrictFairfield-Suisun Sewer District
Las Gallinas Valley Sanitation District
Marin County Sanitary District #5,Tiburon
Millbrae Waste Water Treatment Plant
Mountain View Sanitary District
Napa Sanitation District
Novato Sanitation District
Rodeo Sanitary District
San Francisco International Airport
Sausalito/Marin City Sanitation District
Sewerage Agency of Southern Marin
Sonoma County Water Agency
South Bayside System Authority
Town of Yountville
Union Sanitary District
Vallejo Sanitation and Flood ControlDistrict
West County Agency
Industrial Dischargers
C & H Sugar Company
Chevron Products Company
Conoco Phillips (Tosco-Rodeo)
Crockett Cogeneration
Rhodia, Inc.
Shell – Martinez Refining Company
Tesoro Golden Eagle Refinery
USS – POSCO Industries
Tosco, Rodeo
Valero Refining Company
Cooling WaterMirant of California Pittsburg PowerPlant
Mirant of California Potrero Power Plant
Stormwater
Alameda Countywide Clean WaterProgram
Caltrans
City and County of San Francisco
Contra Costa Clean Water Program
Fairfield-Suisun Urban Runoff Management Program
Marin County Stormwater PollutionPrevention Program
San Mateo Countywide Water PollutionPrevention Program
Santa Clara Valley Urban Runoff Pollution Prevention Program
Vallejo Sanitation and Flood ControlDistrict
Dredgers
Alameda Point
BAE Systems
Benicia Port
Chevron Richmond Long Wharf
City of Benicia Marina
City of Emeryville
Conoco Phillips (Tosco-Rodeo)Emeryville Cove Marina
Emeryville Entrance Channel
Emeryville Marina
Paradise Cay Yacht Club
Port of Oakland
Port of San Francisco
San Rafael Yacht Harbor
U.S. Army Corps of Engineers
U.S. Coast Guard - Vallejo
Vallejo Ferry Terminal
Valero Refining Co.
Vallejo Yacht Club
Photograph courtesy of Swim Across America, raisingmoney and awareness for cancer research, prevention andtreatment: www.swimacrossamerica.org
8/3/2019 Pulse 2011 - Effects on Aquatic Life
http://slidepdf.com/reader/full/pulse-2011-effects-on-aquatic-life 103/104
For an electronic copy of this report
and other RMP information, please visit
www.sfei.org

8/3/2019 Pulse 2011 - Effects on Aquatic Life
http://slidepdf.com/reader/full/pulse-2011-effects-on-aquatic-life 104/104
www.sfei.org