
Pull Off Adhesion Testing of Coatings
12
SSPC 2015 Pull-Off Adhesion Testing of Coatings – Improve Your Technique JF Fletcher and DJ Barnes Elcometer Limited Manchester, United Kingdom ABSTRACT Pull-off adhesion testing is widely used to assess the protective coating process. It is also used to determine if a coating is fit for service in new construction and for repairs to existing structures. The result is often critical to the acceptance or rejection of a coating process, as the adhesion value quoted by the paint manufacturer can be adversely affected by aspects of the coating process. Low adhesion values are indicative of premature failure of the coating and are often due to inadequate surface preparation of the substrate. ASTM D4541 and BS EN ISO 4624 describe several different test apparatus; however, the basic approach of gluing a test dolly to the coated surface and then exerting a perpendicular force to the surface in an effort to remove both the dolly and the coating from the substrate is common to all these standards. A measure of the adhesion of the coating system is the force at which the coating fails and the type of failure obtained. Trials have demonstrated that many aspects of the testing method, such as the mixing of the glue, the preparation of the coating surface and the face of the dolly and the temperature of the test, all affect the results. This paper will investigate the effects of any deviation from the proscribed method in every aspect of the test. Each aspect is examined in turn, the results tabulated and the potential effect on a valid adhesion test result is discussed. INTRODUCTION The tensile pull-off method for adhesion testing, as outlined in ASTM D 4541 and similarly in BS EN ISO 4624, involves gluing a test dolly to the coated surface and then pulling the dolly by exerting a force perpendicular to the surface in an effort to remove the dolly with the coating from the substrate. The force at which this occurs and the type of failure obtained is recorded as a measure of the adhesion properties of the coating. Several aspects of the test method were assessed, including the mix of the epoxy glue, different types of glue, surface preparation, the design of the dolly, temperature of the cure and the test, and cutting the coating or not. The difference between manual and automatic pull-off tester operation was also investigated. This paper evaluates the effects of any deviation from the required method in several aspects of the test. Each aspect is examined in turn, the results tabulated and the potential effect on a valid test discussed.
-
Upload
daniel-moyya -
Category
Documents
-
view
235 -
download
0
Transcript of Pull Off Adhesion Testing of Coatings

7/23/2019 Pull Off Adhesion Testing of Coatings
http://slidepdf.com/reader/full/pull-off-adhesion-testing-of-coatings 1/12
SSPC 2015
Pull-Off Adhesion Testing of Coatings – Improve Your Technique
JF Fletcher and DJ BarnesElcometer Limited
Manchester, United Kingdom
ABSTRACT
Pull-off adhesion testing is widely used to assess the protective coating process. It is also
used to determine if a coating is fit for service in new construction and for repairs to existingstructures. The result is often critical to the acceptance or rejection of a coating process, as
the adhesion value quoted by the paint manufacturer can be adversely affected by aspects of
the coating process. Low adhesion values are indicative of premature failure of the coating
and are often due to inadequate surface preparation of the substrate.
ASTM D4541 and BS EN ISO 4624 describe several different test apparatus; however, the
basic approach of gluing a test dolly to the coated surface and then exerting a perpendicular
force to the surface in an effort to remove both the dolly and the coating from the substrate iscommon to all these standards. A measure of the adhesion of the coating system is the force
at which the coating fails and the type of failure obtained.
Trials have demonstrated that many aspects of the testing method, such as the mixing of the
glue, the preparation of the coating surface and the face of the dolly and the temperature of
the test, all affect the results.
This paper will investigate the effects of any deviation from the proscribed method in every
aspect of the test. Each aspect is examined in turn, the results tabulated and the potential
effect on a valid adhesion test result is discussed.
INTRODUCTION
The tensile pull-off method for adhesion testing, as outlined in ASTM D 4541 and similarly
in BS EN ISO 4624, involves gluing a test dolly to the coated surface and then pulling the
dolly by exerting a force perpendicular to the surface in an effort to remove the dolly with the
coating from the substrate. The force at which this occurs and the type of failure obtained is
recorded as a measure of the adhesion properties of the coating.
Several aspects of the test method were assessed, including the mix of the epoxy glue,
different types of glue, surface preparation, the design of the dolly, temperature of the cure
and the test, and cutting the coating or not. The difference between manual and automatic pull-off tester operation was also investigated. This paper evaluates the effects of any
deviation from the required method in several aspects of the test. Each aspect is examined in
turn, the results tabulated and the potential effect on a valid test discussed.

7/23/2019 Pull Off Adhesion Testing of Coatings
http://slidepdf.com/reader/full/pull-off-adhesion-testing-of-coatings 2/12
SSPC 2015
ADHESIVE MIXING
The test dolly should be glued to the surface using a suitable adhesive. Typically a two-pack
epoxy adhesive is supplied with adhesion test units. The instructions for this type of adhesivestate that the two components, resin and hardener, should be mixed in equal parts usually
equal lengths of both parts. In order to achieve a more accurate mix, the amount of each
component was measured by weight using an accurate electronic balance.
A test was carried out to understand the effects of mixing the adhesives incorrectly. 3 samples
of glue were mixed, a 1:1 resin (a) to hardener (b) ratio, a 1:2 hardener to resin ratio and a 2:1
hardener to resin ratio. Unprepared dollies were stuck down on unprepared surfaces such that
the only variable was the glue mix. The adhesive strength was not optimised. The dollieswere then pulled using a manual Type V gauge.
Set Glue Mix
ratio
(a:b)
Pull 1
(MPa)
Pull 2
(MPa)
Pull 3
(MPa)
Pull 4
(MPa)
Pull 5
(MPa)
Average
Pull
Value
%
variation
1 1:1 6.0 6.4 7.6 7.6 4.5 6.67 -
2 1:2 5.8 4.0 3.9 3.6 3.9 3.93 -41
3 2:1 5.8 5.5 6.2 7.9 7.0 6.33 -5
Table 1 – Test Results for different ratios of two-pack epoxy glue
The average value is calculated excluding the maximum and minimum value in each set to
avoid any skewing of the results due to any outliers. This approach was taken with all tests.
In Table 1 the results show an average failure value of 6.67 MPa when the glue is mixedcorrectly. If too much resin is used, then the failure force reduces by 5%, which is quite
small, but is outside the ±1% stated accuracy of the gauge. However when the hardener
quantity exceeded the resin, then a variation of -41% in failure strength was noted. It is
unlikely that a user will mix the glue in such an erroneous way, indicating that an excess ofresin to hardener would have little effect on the results, whereas too much hardener could still
significantly affect any test results.

7/23/2019 Pull Off Adhesion Testing of Coatings
http://slidepdf.com/reader/full/pull-off-adhesion-testing-of-coatings 3/12
SSPC 2015
COMPARISON OF TWO ADHESIVE TYPES
ISO 4624 has guidance on the selection of suitable adhesives. The relevant section is
reproduced as Figure 1 below.
Figure 1 – Extract from ISO 4624
ASTM D 4541 states that the adhesive is for securing the fixture to the coating and that it
does not affect any coating properties. Two component epoxies and acrylic adhesives have
been found to be the most versatile.
Both specifications clearly state that there is no one single glue that can be specified for allcoating pull tests; rather, glue suitable for the conditions of the test should be used. The
correct glue is one that has bond strength greater than the adhesive strength of the coating
being tested.
Different suppliers provide different adhesives with their adhesion test kits. Adhesives from
the same supplier are often made in different parts of the world and the locally available
version may differ from location to location. Indeed, in some cases, certain adhesives may beunavailable in given parts of the world.
The relative strength of both adhesives was compared. These adhesives are both commonlysupplied in adhesion test kits. 10 dollies were stuck down to an uncoated, unprepared steel
substrate, 5 using Adhesive A, and 5 using the Adhesive B. The glue was allowed to cure for
24 hours and the dollies pulled from the surface

7/23/2019 Pull Off Adhesion Testing of Coatings
http://slidepdf.com/reader/full/pull-off-adhesion-testing-of-coatings 4/12
SSPC 2015
Dolly Glue Test Value
(MPa)
Failure Type
1 Adhesive A 5.8 Adhesive Dolly/Glue
2 Adhesive A 7.5 Adhesive Dolly/Glue
3 Adhesive A 8.7 Adhesive Dolly/Glue
4 Adhesive A 10.7 Adhesive Dolly/Glue
5 Adhesive A 8.3 Adhesive Dolly/Glue
6 Adhesive B 12.2 Adhesive/Cohesive 80:20 Dolly/Glue
7 Adhesive B 12.9 Adhesive/Cohesive 50:50 Dolly/Glue
8 Adhesive B 14.6 Adhesive/Cohesive 50:50 Dolly/Glue9 Adhesive B 12.5 Adhesive/Cohesive 30:70 Dolly/Glue
10 Adhesive B 11.0 Adhesive/Cohesive 50:50 Dolly/Glue
Table 2 – Results for tests on a steel plate
As seen in Table 2, the values for the failure strength and the type of failure indicate that the
Adhesive B has stronger adhesive properties than Adhesive A by approximately 4 MPa.
Dolly Glue Test Value (MPa) Failure Type
1 Adhesive A 8.1 Adhesive Glue
2 Adhesive A 10.3 Adhesive/Cohesive 50:50
Glue/Coating
3 Adhesive A 10.9 Adhesive/Cohesive 50:50
Glue/Coating
4 Adhesive A 11.8 Adhesive Coating
5 Adhesive A 9.8 Adhesive/Cohesive 80:20
Glue/Coating
6 Adhesive B 8.2 Adhesive/Cohesive 80:20Glue/Coating
7 Adhesive B 7.6 Adhesive/Cohesive 10:90Glue/Coating
8 Adhesive B 12.0 Adhesive/Cohesive 95:5
Glue/Coating
9 Adhesive B 11.8 Adhesive/Cohesive 60:40
Glue/Coating
10 Adhesive B 11.0 Adhesive/Cohesive 50:50
Glue/Coating
Table 3 – Results for tests on a painted steel panel
7/23/2019 Pull Off Adhesion Testing of Coatings
http://slidepdf.com/reader/full/pull-off-adhesion-testing-of-coatings 5/12
SSPC 2015
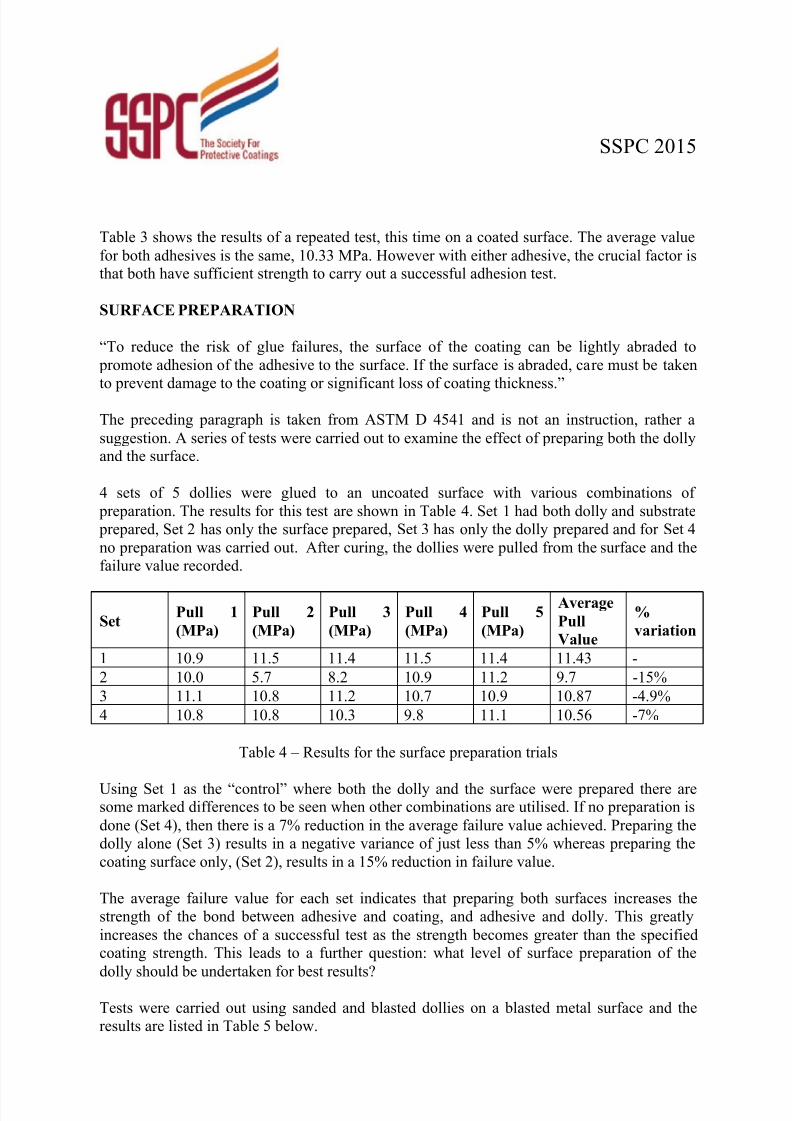
Table 3 shows the results of a repeated test, this time on a coated surface. The average value
for both adhesives is the same, 10.33 MPa. However with either adhesive, the crucial factor isthat both have sufficient strength to carry out a successful adhesion test.
SURFACE PREPARATION
“To reduce the risk of glue failures, the surface of the coating can be lightly abraded to
promote adhesion of the adhesive to the surface. If the surface is abraded, care must be taken
to prevent damage to the coating or significant loss of coating thickness.”
The preceding paragraph is taken from ASTM D 4541 and is not an instruction, rather a
suggestion. A series of tests were carried out to examine the effect of preparing both the dollyand the surface.
4 sets of 5 dollies were glued to an uncoated surface with various combinations of
preparation. The results for this test are shown in Table 4. Set 1 had both dolly and substrate
prepared, Set 2 has only the surface prepared, Set 3 has only the dolly prepared and for Set 4
no preparation was carried out. After curing, the dollies were pulled from the surface and the
failure value recorded.
SetPull 1
(MPa)
Pull 2
(MPa)
Pull 3
(MPa)
Pull 4
(MPa)
Pull 5
(MPa)
Average
Pull
Value
%
variation
1 10.9 11.5 11.4 11.5 11.4 11.43 -
2 10.0 5.7 8.2 10.9 11.2 9.7 -15%
3 11.1 10.8 11.2 10.7 10.9 10.87 -4.9%
4 10.8 10.8 10.3 9.8 11.1 10.56 -7%
Table 4 – Results for the surface preparation trials
Using Set 1 as the “control” where both the dolly and the surface were prepared there aresome marked differences to be seen when other combinations are utilised. If no preparation is
done (Set 4), then there is a 7% reduction in the average failure value achieved. Preparing the
dolly alone (Set 3) results in a negative variance of just less than 5% whereas preparing the
coating surface only, (Set 2), results in a 15% reduction in failure value.
The average failure value for each set indicates that preparing both surfaces increases the
strength of the bond between adhesive and coating, and adhesive and dolly. This greatly
increases the chances of a successful test as the strength becomes greater than the specifiedcoating strength. This leads to a further question: what level of surface preparation of the
dolly should be undertaken for best results?
Tests were carried out using sanded and blasted dollies on a blasted metal surface and the
results are listed in Table 5 below.

7/23/2019 Pull Off Adhesion Testing of Coatings
http://slidepdf.com/reader/full/pull-off-adhesion-testing-of-coatings 6/12
SSPC 2015
Dolly Sanded (MPa) Blasted (MPa)
1 8.7 10.0
2 10.3 14.2
3 11.3 14.4
4 14.8 11.9
5 10.8 13.4
Average Value 10.8 13.17
Table 5 – Test results for sanded and abrasive blasted dollies
These results clearly show that blasted dollies give a higher test value than a sanded dolly, in
this case 22% higher.
In subsequent discussions with adhesive suppliers, it was recommended that both dolly and
coated surface be abraded for their product to be most effective.
VARIATION IN LOADING FIXTURE (DOLLY) DESIGN
Any reference to the dimensions of the dolly, in any of the relevant standards, is only a
recommendation that the length (height) of the dolly be at least half the diameter of the dolly.If this recommendation is taken literally, then most, if not all, commercially available dollies
do not comply with this recommendation because dollies are shaped rather than cylindrical.
However, taking the “spirit” of this recommendation, the thickness of the base should be a
consideration.
Two designs of dolly were used, one having a base thickness of 4.0 mm (A) and the other a
thickness of 2.6mm (B). The two styles of dolly are shown in Figure 2. Test results are givenin Table 6.
Dolly Type A Dolly Type B
Figure 2: Two dolly design types

7/23/2019 Pull Off Adhesion Testing of Coatings
http://slidepdf.com/reader/full/pull-off-adhesion-testing-of-coatings 7/12
SSPC 2015
Pull A (MPa) B (MPa)
1 10.4 9.4
2 10.7 8.2
3 11.3 9.1
4 9.8 8.8
5 10.3 8.5
Average value less outliers 10.46 8.8
Table 6 – Comparison of two dolly designs
Neither the dollies nor the un-coated surface received any surface preparation before the
testing took place; hence any variation in readings can be attributed to the geometry of the
dollies, as this is the only variable.
Results show a 16% higher pull strength is required to remove the thicker based dolly from
the surface than the thinner based dolly. Video examination of tests carried out on glass
showed that, in both cases, the dollies started to lift from the edges, but there was nodiscernible visible difference in the mechanical action of the pull test on each dolly.
TEMPERATURE OF ADHESIVE CURING AND PULL TESTING
Temperature and time of cure coupled with the temperature at the time of the adhesion test
may have an effect on the results obtained. To investigate this, a series of tests were set up.
Dollies were glued to a coated surface, both having been prepared as per the
recommendations contained in ASTM D 4541. Various cure times and temperatures were
used, and the tests were carried out at different temperatures. Table 7 summarises the
conditions and results.
Set Cure time
(hours)
Cure temp (°C) Test temp (°C) Test value
(MPa)
1 24 22 22 11.2
2 8 30 22 9.0
3 24 50 50 7.5
4 24 50 22 10.83
5 8 30 30 8.23
6 24 30 22 10.43
Table 7 – Results for tests at different temperatures
It must be noted that no combination of cure and test temperature gives a higher test valuethan the “control” conditions of set 1. In attempt to speed up the process, set 2 was cured at30°C for 8 hours, a typical shift length, and pulled at room temperature with reduced results.
These results suggest that under whichever conditions the cure occurs, the pull should be
carried out at an ambient temperature of 22 ± 2°C.

7/23/2019 Pull Off Adhesion Testing of Coatings
http://slidepdf.com/reader/full/pull-off-adhesion-testing-of-coatings 8/12
SSPC 2015
TO CUT OR NOT TO CUT
ISO 4624 states “… carefully use the cutting device (5.4) to cut around the circumference of
the dolly through to the substrate, unless otherwise specified or agreed” whereas ASTM D4541 states “Scoring around the fixture violates the fundamental in situ test criterion that an
unaltered coating be tested. If scoring around the test surface is employed, extreme care is
required to prevent micro-cracking in the coating, since such cracks may cause reduced
adhesion values. Scored samples constitute a different test, and this procedure should be
clearly reported with the results.”
The different approaches by the two leading standards institutions as to the cutting of a dolly
underline the uncertainty of whether it is the best thing to do when carrying out an adhesiontest.
10 dollies were stuck down on a coated surface, 5 were left uncut, and the other 5 were cut
once the glue had cured. Results are presented in Table 8.
Dolly Cut or un-cut Test result (MPa) Type of failure
1 Un-cut 10.3 Adhesive
2 Un-cut 8.5 Partial3 Un-cut 10.5 Partial
4 Un-cut 10.5 Adhesive
5 Un-cut 10.6 Adhesive
6 Cut 9.7 Partial
7 Cut 9.6 Partial
8 Cut 9.0 Partial
9 Cut 10.6 Adhesive
10 Cut 9.2 Partial
Table 8 – Test results for cut and un-cut coating
“Partial” failure indicates a failure which is a combination of a partial cohesive failure of the
coating and a partial adhesive failure between the glue and the coating.
Given the distribution of the partial type of failure, there was some thought that the cutting of
the dolly once the glue had cured was affecting the bonding mechanism of the adhesive.Were micro-cracks being initiated by the act of cutting? In order to eliminate this possibility,
5 more dollies were stuck to the coated surface, but this time the cutting took place before thedollies were stuck down.

7/23/2019 Pull Off Adhesion Testing of Coatings
http://slidepdf.com/reader/full/pull-off-adhesion-testing-of-coatings 9/12
SSPC 2015
Dolly Cut or un-cut Test result (MPa) Type of failure
1 Cut 9.8 Adhesive
2 Cut 10.1 Adhesive
3 Cut 9.5 Adhesive
4 Cut 9.9 Adhesive
5 Cut 10.5 Adhesive
Table 9 – Test results for a pre-cut coating
If we discount the highest and lowest value from all three groups of tested dollies, Tables 8
and 9, then take the average, the un-cut test shows an average of 10.43 MPa and the cut
dollies 9.5MPa. This gives an 8.9% variation between cut and un-cut. If we now look in the
same way at the pre-cut set, the average value is 9.93MPa, a variation of 4.3% from the un-cut test.
These results would indicate that cutting the dolly does have an impact on the test results, but
this effect is minimised if the cutting takes place before the dolly is stuck down.
The cutting of the dollies prior to them being stuck down was carried out in a machine shop,
with the test plate fixed and the cutting tool inserted into a drilling machine. These are mostdefinitely not field conditions. Cutting the dollies prior to gluing, by hand, is difficult, if not
impossible. The tool skates across the surface, similar to a needle across an LP record, and it
is difficult to stop this “freehand”. A guide was made using a steel disc 10mm thick with ahole slightly larger than the cutting tool drilled through it. Holding this guide down was
difficult if not impossible, as the act of turning the cutting tool dragged/pushed the disc acrossthe surface. This situation was rectified by using two G-clamps to hold the ring in place
whilst the pre-cuts were made.
Table 10 lists the result obtained for 5 dollies where the coating has been cut after the dollies
have been stuck down (Post) and 5 dollies where the coating was cut by hand as described
above.
Dolly Pre or post cut Test results (MPa) Type of failure
1 Post 8.5 60% Cohesive
2 Post 9.4 100% Cohesive
3 Post 9.8 100% Cohesive
4 Post 10.0 90% Cohesive
5 Post 10.3 100% Cohesive
6 Pre 11.9 100% Cohesive
7 Pre 10.9 100% Cohesive
8 Pre 9.8 100% Cohesive
9 Pre 10.4 100% Cohesive10 Pre 11.9 100% Cohesive
Table 10 – Test results for pre and post cut films

7/23/2019 Pull Off Adhesion Testing of Coatings
http://slidepdf.com/reader/full/pull-off-adhesion-testing-of-coatings 10/12
SSPC 2015
Using the same approach of discarding the highest and lowest values before calculating the
average, the average value of post-cutting the dollies was 9.73 MPa and pre-cutting thedollies 11.1 MPa. This would indicate that pre-cutting the dollies has less effect on the
adhesion than cutting after the glue has cured.
One factor that must be considered when drawing this conclusion, is that if the guide ring
needs 2 G clamps to hold it still, thus withstanding any lateral forces imparted by the act of
dolly cutting, then these forces are being withstood by the dolly itself when cutting after the
dolly has been stuck down. This lateral or shear force must be quite substantial, and must
have an adverse effect on the adhesive strength of the test dolly set up, thus impacting
negatively on the results.
MANUAL VS. AUTOMATIC ADHESION TESTERS
The Type V self-aligning adhesion tester is available as a manual, hand-operated, or
automatic device. There are two known manufacturers of this apparatus. The automatic
versions are similar in operation using a hydraulic pump to generate the pull force; however,
the manual versions differ. One is operated by winding a handle, in a similar fashion to a
fishing reel, the other by pumping a handle, similar to a car jack. The tests reported in this
paper were carried out using the winding method.
A total of twenty dollies were glued to a coated surface using two-pack epoxy glue in theoptimum manner as outlined in Tables 11 and 12.
10 were left uncut and 10 were cut. Half of each group were tested using a manual Type V
adhesion tester (Figure 3) and half using an automatic model (Figure 4).
Figure 3 – Hand-operated adhesion tester (winding method)

7/23/2019 Pull Off Adhesion Testing of Coatings
http://slidepdf.com/reader/full/pull-off-adhesion-testing-of-coatings 11/12
SSPC 2015
Dolly Manual Type V Adhesion Tester Automatic Type V Adhesion Tester
Uncut Attributes Cut Attributes Uncut Attributes Cut Attributes
MPa MPa MPa MPa
1 10.8 100% A/B 9.2 90% A/B 10.68 100% A/B 9.71 100% A/B
2 10.6 100% A/B 7.5 100% A/B 10.44 100% A/B 10.12 100% A/B
3 10.6 100% A/B 9.4 100% A/B 10.91 100% A/B 10.00 100% A/B
4 10.5 100% A/B 9.9 100% A/B 10.80 100% A/B 9.84 100% A/B
5 10.1 100% A/B 10.2 100% A/B 10.33 100% A/B 9.50 100% A/B
Table 11 – Comparison of two adhesion testers, where an A/B failure is at the primer/substrate interface
It can be seen in Table 11 there is very little difference between the values obtained with a
winding manual gauge, where the load is applied smoothly and evenly (1 turn per second,
approximately 1 MPa/s) and an automatic gauge. The tests produce an average value of
10.56 MPa for the manual gauge versus 10.64 MPa for the automatic gauge on uncut dollies
(9.50 MPa versus 9.85 MPa on cut dollies).
The main point derived from these tests is the significant difference (approximately 10% ofthe higher adhesion value) between the results for uncut and cut dollies, whichever gauge is
used. 10.56 MPa for the uncut coating and 9.50 MPa for a coating that has been cut using the
manual gauge. 10.64 MPa for the uncut coating against 9.85 MPa for a coating that had been
cut using the automatic gauge.
This test result supports the results given in Tables 8, 9 and 10 where the tests were carried
using a manual gauge only.
Figure 4 – Automatic Adhesion Tester

7/23/2019 Pull Off Adhesion Testing of Coatings
http://slidepdf.com/reader/full/pull-off-adhesion-testing-of-coatings 12/12
SSPC 2015
CONCLUSION
It is clear from this series of tests that the results can be significantly affected by minor
variations in one or more of the test steps. From the choice of adhesive, through the preparation of the coating surface and the test dolly, to the decision to cut through the coating
or not, the test needs to be precise and consistent. This allows results for the same coating
under different conditions or different coatings under the same conditions to be compared
with confidence.
Different adhesives have different operating constraints. It must be noted that the bond
strength of the cured adhesive must be greater than the bond strength of the coating, either to
the substrate (adhesive failure), to the coating beneath (also adhesive failure) or within asingle layer (cohesive failure).
As with coating processes, the preparation and cleaning of the surface of the coating and the
face of the dolly is crucial to optimising the adhesion of the dolly to the surface and therefore
increasing the probability of a coating adhesion failure rather than a glue failure. It should be
noted that glue failures are invalid adhesion tests unless the specified adhesion strength is
exceeded. Such tests must be repeated until the coating fails or the minimum specification
value for the coating adhesion is exceeded. ASTM D4541 states that when 50% or more ofthe dolly face is covered by adhesive then that result shall be disregarded.
The design of the dolly is significant in the adhesion values obtained but further work is
required to determine why this is the case.
Care and best practice should be employed at all times when carrying out adhesion tests and
if there are any concerns then any or all of the coating, adhesive and test gauge manufacturers
should be consulted for advice.


