Pugacheva et al. COMPLETE GB_16.1_p.161_publ.online_08_14_2015 2
35
RESEARCH Open Access Comparative analyses of CTCF and BORIS occupancies uncover two distinct classes of CTCF binding genomic regions Elena M. Pugacheva 1 , Samuel Rivero-Hinojosa 1 , Celso A. Espinoza 2,3 , Claudia Fabiola Méndez-Catalá 1 , Sungyun Kang 1 , Teruhiko Suzuki 1,5 , Natsuki Kosaka-Suzuki 1 , Susan Robinson 1 , Vijayaraj Nagarajan 4 , Zhen Ye 2 , Abdelhalim Boukaba 6 , John E. J. Rasko 7,8,9 , Alexander V. Strunnikov 6 , Dmitri Loukinov 1 , Bing Ren 2,3*† and Victor V. Lobanenkov 1*† Abstract Background: CTCF and BORIS (CTCFL), two paralogous mammalian proteins sharing nearly identical DNA binding domains, are thought to function in a mutually exclusive manner in DNA binding and transcriptional regulation. Results: Here we show that these two proteins co-occupy a specific subset of regulatory elements consisting of clustered CTCF binding motifs (termed 2xCTSes). BORIS occupancy at 2xCTSes is largely invariant in BORIS-positive cancer cells, with the genomic pattern recapitulating the germline-specific BORIS binding to chromatin. In contrast to the single-motif CTCF target sites (1xCTSes), the 2xCTS elements are preferentially found at active promoters and enhancers, both in cancer and germ cells. 2xCTSes are also enriched in genomic regions that escape histone to protamine replacement in human and mouse sperm. Depletion of the BORIS gene leads to altered transcription of a large number of genes and the differentiation of K562 cells, while the ectopic expression of this CTCF paralog leads to specific changes in transcription in MCF7 cells. Conclusions: We discover two functionally and structurally different classes of CTCF binding regions, 2xCTSes and 1xCTSes, revealed by their predisposition to bind BORIS. We propose that 2xCTSes play key roles in the transcriptional program of cancer and germ cells. Background CTCF, a highly conserved DNA binding protein, serves as a global organizer of chromatin architecture [1]. It is involved in the regulation of transcriptional activation and repression, gene imprinting, control of cell prolifer- ation and apoptosis, chromatin domain insulation, X- chromosome inactivation, prevention of oligonucleotide repeat expansion, and other chromatin resident pro- cesses [2–11]. The multifunctionality of CTCF is based on its ability to bind a wide range of diverse DNA sequences as well as to interact with cofactor proteins through the combinatorial use of 11 C2H2 zinc fingers (ZFs) [12–15]. With the advance of next-generation sequencing techniques, CTCF binding sites have been identified across fly, mouse, and human genomes [14, 16, 17]. The genome-wide studies helped defined the DNA binding specificity of CTCF, known as CTCF target sites (CTSes) [1, 13, 18]. CTSes tend to be conserved in evolution and occupancy is largely invariant across differ- ent cell types. Reflecting the multitude of CTCF functions, CTSes were found to be associated with the genomic regions engaged in long-range chromatin interactions, including enhancers [19], promoters [14], insulators [20] and boundary elements [8]. The capacity of CTCF–DNA complexes to form loops via protein dimerization as originally described for the H19-IFG2 imprinted locus [21] has been confirmed genome-wide by three- dimensional approaches, solidifying the key role of * Correspondence: [email protected]; [email protected] † Equal contributors 2 Ludwig Institute for Cancer Research, 9500 Gilman Drive, La Jolla, CA 92093, USA 1 Molecular Pathology Section, Laboratory of Immunogenetics, National Institute of Allergy and Infectious Diseases, National Institutes of Health, Rockville, MD 20852, USA Full list of author information is available at the end of the article © 2015 Pugacheva et al. Open Access This article is distributed under the terms of the Creative Commons Attribution 4.0 International License (http://creativecommons.org/licenses/by/4.0/), which permits unrestricted use, distribution, and reproduction in any medium, provided you give appropriate credit to the original author(s) and the source, provide a link to the Creative Commons license, and indicate if changes were made. The Creative Commons Public Domain Dedication waiver (http://creativecommons.org/publicdomain/zero/1.0/) applies to the data made available in this article, unless otherwise stated. Pugacheva et al. Genome Biology DOI 10.1186/s13059-015-0736-8
-
Upload
victor-lobanenkov -
Category
Documents
-
view
25 -
download
3
Transcript of Pugacheva et al. COMPLETE GB_16.1_p.161_publ.online_08_14_2015 2

RESEARCH Open Access
Comparative analyses of CTCF and BORISoccupancies uncover two distinct classes ofCTCF binding genomic regionsElena M. Pugacheva1, Samuel Rivero-Hinojosa1, Celso A. Espinoza2,3, Claudia Fabiola Méndez-Catalá1,Sungyun Kang1, Teruhiko Suzuki1,5, Natsuki Kosaka-Suzuki1, Susan Robinson1, Vijayaraj Nagarajan4, Zhen Ye2,Abdelhalim Boukaba6, John E. J. Rasko7,8,9, Alexander V. Strunnikov6, Dmitri Loukinov1, Bing Ren2,3*†
and Victor V. Lobanenkov1*†
Abstract
Background: CTCF and BORIS (CTCFL), two paralogous mammalian proteins sharing nearly identical DNA bindingdomains, are thought to function in a mutually exclusive manner in DNA binding and transcriptional regulation.
Results: Here we show that these two proteins co-occupy a specific subset of regulatory elements consisting ofclustered CTCF binding motifs (termed 2xCTSes). BORIS occupancy at 2xCTSes is largely invariant in BORIS-positivecancer cells, with the genomic pattern recapitulating the germline-specific BORIS binding to chromatin. In contrastto the single-motif CTCF target sites (1xCTSes), the 2xCTS elements are preferentially found at active promotersand enhancers, both in cancer and germ cells. 2xCTSes are also enriched in genomic regions that escape histoneto protamine replacement in human and mouse sperm. Depletion of the BORIS gene leads to altered transcriptionof a large number of genes and the differentiation of K562 cells, while the ectopic expression of this CTCF paralogleads to specific changes in transcription in MCF7 cells.
Conclusions: We discover two functionally and structurally different classes of CTCF binding regions, 2xCTSes and1xCTSes, revealed by their predisposition to bind BORIS. We propose that 2xCTSes play key roles in thetranscriptional program of cancer and germ cells.
BackgroundCTCF, a highly conserved DNA binding protein, servesas a global organizer of chromatin architecture [1]. It isinvolved in the regulation of transcriptional activationand repression, gene imprinting, control of cell prolifer-ation and apoptosis, chromatin domain insulation, X-chromosome inactivation, prevention of oligonucleotiderepeat expansion, and other chromatin resident pro-cesses [2–11]. The multifunctionality of CTCF is basedon its ability to bind a wide range of diverse DNAsequences as well as to interact with cofactor proteins
through the combinatorial use of 11 C2H2 zinc fingers(ZFs) [12–15]. With the advance of next-generationsequencing techniques, CTCF binding sites have beenidentified across fly, mouse, and human genomes[14, 16, 17]. The genome-wide studies helped defined theDNA binding specificity of CTCF, known as CTCF targetsites (CTSes) [1, 13, 18]. CTSes tend to be conserved inevolution and occupancy is largely invariant across differ-ent cell types. Reflecting the multitude of CTCF functions,CTSes were found to be associated with the genomicregions engaged in long-range chromatin interactions,including enhancers [19], promoters [14], insulators [20]and boundary elements [8]. The capacity of CTCF–DNAcomplexes to form loops via protein dimerization asoriginally described for the H19-IFG2 imprinted locus[21] has been confirmed genome-wide by three-dimensional approaches, solidifying the key role of
* Correspondence: [email protected]; [email protected]†Equal contributors2Ludwig Institute for Cancer Research, 9500 Gilman Drive, La Jolla, CA 92093,USA1Molecular Pathology Section, Laboratory of Immunogenetics, NationalInstitute of Allergy and Infectious Diseases, National Institutes of Health,Rockville, MD 20852, USAFull list of author information is available at the end of the article
© 2015 Pugacheva et al. Open Access This article is distributed under the terms of the Creative Commons Attribution 4.0International License (http://creativecommons.org/licenses/by/4.0/), which permits unrestricted use, distribution, andreproduction in any medium, provided you give appropriate credit to the original author(s) and the source, provide a link tothe Creative Commons license, and indicate if changes were made. The Creative Commons Public Domain Dedication waiver(http://creativecommons.org/publicdomain/zero/1.0/) applies to the data made available in this article, unless otherwise stated.
Pugacheva et al. Genome Biology (2015) 16:161 DOI 10.1186/s13059-015-0736-8

CTCF in the organization of chromatin architecture[7, 22]. For example, CTCF-mediated chromatin loopswere shown to connect enhancers with promoters [19], toinsulate promoters from enhancers [23], to mediate im-printing of mammalian genes [24], to control V(D)Jrecombination [25], and to organize the major histocom-patibility complex (MHC) class II genes [26]. It remainsobscure, however, how the DNA sequences of givenCTSes are related to the specific CTCF functions at thesesites.CTCF gene duplication during early evolution of amni-
otes gave rise to Brother Of the Regulator of ImprintingSites (BORIS) [27, 28]. CTCF and BORIS encode proteinsthat share an almost identical DNA binding domain rec-ognizing the same DNA sequences in vivo and in vitro[29–32]. It has long been thought that CTCF and BORISpossess distinct functions and act in a mutually exclusivemanner. Indeed, while CTCF is ubiquitously expressed,BORIS expression is strictly restricted to germ cells innormal development [27]. However, BORIS is aberrantlyexpressed in a wide range of cancers, and its function inthat context has not been characterized [31, 33–36]. Todate, established BORIS functions are limited to the tran-scriptional activation or repression of some germline andcancer-related genes [29, 30, 32]. Due to the completelydistinct amino and carboxyl termini of CTCF and BORISproteins, differences in biological functions between thetwo factors were expected. This was supported by thecontrasting phenotypes of their germline knockouts aswell as by the inability of BORIS to complement CTCFmutations [29, 30, 37]. The homozygous deletion of CTCFin mice showed early embryonic lethality at the peri-implantation stage [37]. In contrast, BORIS knockoutmice showed subfertility and multiple defects in sperm-atogenesis, including a reduction in testis size and delayedproduction of gametes [29, 30].The fact that CTCF and BORIS share a virtually iden-
tical DNA binding domain and are co-expressed in atleast two environments, in germ and cancer cells [13],raises the question of whether they bind competitivelyor cooperatively at a given DNA sequence [13, 27, 38]. Ithas been proposed that CTCF and BORIS compete forDNA binding with the complete replacement of oneprotein by the other at target sequences [27, 30]. Thismodel predicts disruption of CTCF function in cancercells or in germ cells. Given the important function ofCTCF as a genome-organizer, however, the abovemodel would also predict global disruption of genomeorganization and consequently large-scale changes ingene expression patterns. To address this problem, wehave developed and utilized a set of monoclonal andpolyclonal antibodies to map CTCF and BORIS bindingsites in both human and mouse genomes. We reporthere, for the first time, CTCF and BORIS occupancy of
chromatin in germ cells and in several cancer cell types.We found that BORIS, together with CTCF, occupies asmuch as one-third of CTSes and “sidesteps” theremaining two-thirds of CTSes regardless of the originof cancer cells. We demonstrate that the pattern ofBORIS occupancy in cancer cells expressing this pro-tein largely recapitulates its binding in germ cells,suggesting that the ability of a CTCF binding region tobe occupied by BORIS in vivo is encoded in the DNAsequence and the site’s architecture. We further showthat CTCF and BORIS bound regions (CTCF&BORIS)typically contain at least two proximal CTSes (2xCTS)in germ and cancer cells. 2xCTS elements are preferen-tially found at active promoters and enhancers, and areassociated with retained histones in human and mousesperm, in stark contrast to genomic regions harboring asingle CTS (1xCTS). Our results also establish thefunctional significance of 2xCTSes in cell-specific geneexpression.
ResultsBORIS selectively binds to a subset of CTCF bindingregions in cancer cells regardless of tissue originCTCF and BORIS share a conserved 11 ZF DNA bind-ing domain (Fig. 1a) and, as a result, are identical inDNA binding specificity in vitro [27, 32, 39]. In vitroassays on single CTCF binding sites indicate that CTCFand BORIS compete for DNA binding with the completereplacement of one protein by the other at target se-quences (Fig. 1b). It is unclear, though, whether the twoproteins would compete for binding to the same genomicregions in vivo. To better understand the functional inter-play between CTCF and BORIS in human cells, we per-formed ChIP-seq in three cancer cell lines — K562(chronic myelogenous leukemia line), Delta47 (multiplemyeloma line), and OVCAR8 (ovarian cancer line) — allof which express comparable levels of CTCF and BORISproteins in the nucleus (Fig. S1a–c in Additional file 1).For this purpose, we developed a large set of anti-CTCFand anti-BORIS mouse monoclonal antibodies, thor-oughly validated by immunoblotting, electrophoretic mo-bility shift assay (EMSA), and ChIP-seq for both BORIS-positive cancer cells and BORIS-negative normal humandermal fibroblasts (NHDFs) (Fig. 1c–h; Fig. S1b-d inAdditional file 1). The patterns of BORIS and CTCF occu-pancy were very similar among the three cancer cell linesdespite their distinct tissue origins (Fig. 1d–h; Fig. S1e, f inAdditional file 1). Contrary to the expectation of overlap-ping CTCF and BORIS occupancy at all CTCF bindingregions, we observed that only a subset (~29–38 %) ofCTCF binding regions were also occupied by BORIS (des-ignated here as CTCF&BORIS bound regions). Addition-ally, in each tumor cell line we found a small number ofregions occupied by BORIS alone (BORIS-only bound
Pugacheva et al. Genome Biology (2015) 16:161 Page 2 of 24

Fig. 1 (See legend on next page.)
Pugacheva et al. Genome Biology (2015) 16:161 Page 3 of 24

regions), but the same regions were occupied by CTCF inother cell lines (Fig. S1f–h in Additional file 1). Import-antly, the majority of the CTSes were not bound byBORIS in vivo (CTCF-only bound regions).The model of simple competition between CTCF and
BORIS in vitro (Fig. 1b) would predict lower CTCF andBORIS occupancy at CTCF&BORIS bound regions com-pared with CTCF-only and BORIS-only bound regions.Instead, the ChIP-seq peak intensity (tag density) for thecoinciding CTCF and BORIS peaks was significantlyhigher compared with CTCF-only and BORIS-onlypeaks, respectively (Fig. S2a in Additional file 2). ChIP-Re-ChIP assay in K562 and Delta47 cells further con-firmed that these CTCF&BORIS co-occupied regionswere simultaneously bound by both proteins (Fig. 1i; Fig.S2b in Additional file 2), while CTCF-only and BORIS-only bound regions lacked the co-occupancy (Fig. S2b inAdditional file 2). Taken together, the above evidencesuggests that CTCF bound regions detected by the ChIP-seq approach are not homogeneous and can be subdividedinto at least two groups based on their potential to be alsooccupied by BORIS.
The genomic regions co-occupied by CTCF and BORISproteins contain clustered CTCF binding sitesIn order to determine whether DNA sequences per sewere responsible for the selective BORIS co-localizationwith CTCF, we performed EMSA with three classes ofsequences: CTCF&BORIS, CTCF-only and BORIS-onlybound regions. We observed that full-length CTCF andBORIS proteins bind the target sequences with similar af-finity in vitro (Fig. S3 in Additional file 3). Unexpectedly,EMSA with probes corresponding to CTCF&BORIS andBORIS-only bound regions demonstrated a double shiftwith the in vitro translated 11 ZF domain (Fig. S3a, c inAdditional file 3), indicating the presence of two adjacentCTCF binding sites in keeping with the demonstrationthat the same arrangement exists in the promoter of the
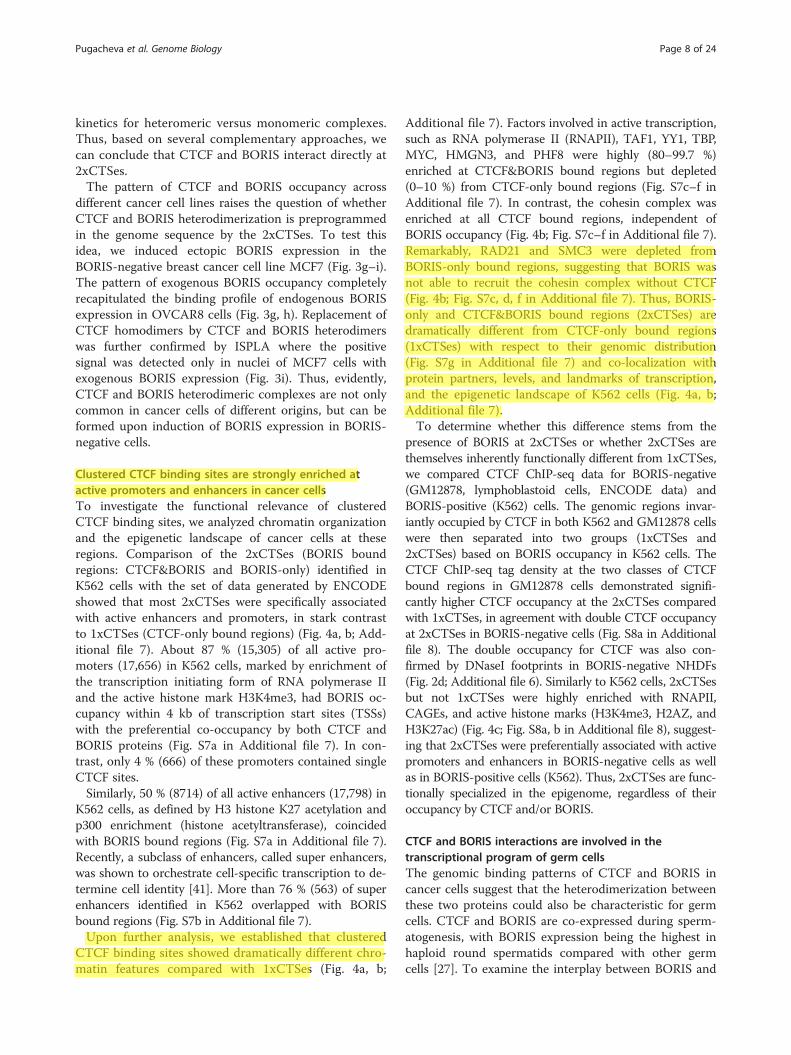
TSP50 (PRSS50) gene [32]. Furthermore, the testis-specific TSP50 promoter is occupied by both CTCF andBORIS proteins in all three human cancer cell lines,thereby representing a bona fide CTCF&BORIS bound re-gion with two conserved individual CTCF sites located 58and 33 base pairs (bp) apart in the human and mousepromoters, respectively (Fig. 2a). The contact guanineresidues, mapped for CTCF and BORIS binding at theTSP50 promoter [32], coincided with two 20-bp CTCFbinding motifs. Moreover, the CTCF motif was found tobe represented at both CTCF and BORIS ChIP-seq peaks(Fig. 2a; Fig. S4a in Additional file 4). Therefore, we exam-ined other CTCF&BORIS bound regions for the hiddenpresence of two CTCF binding sites utilizing the pre-dictive power of the double CTCF motif feature de-tected in the TSP50 promoter (Fig. 2a). Strikingly, 65 %of CTCF&BORIS and 51 % of BORIS-only bound re-gions consist of at least two closely spaced CTCF mo-tifs, while CTCF-only bound regions generally (91 %)have only one CTCF motif under the peak (Fig. 2b; Fig.S4b–f in Additional file 4). To further validate thisobservation, we screened several randomly picked gen-omic loci representing either CTCF&BORIS or CTCF-only bound regions by EMSA (Fig. 2c; Fig. S5a inAdditional file 5). All 12 CTCF&BORIS bound regionsproduced the double shifts with the 11 ZF domain,indicating the presence of two CTCF binding sites(Fig. 2c; Fig. S5a in Additional file 5), while all 11CTCF-only bound regions produced a single bindingshift pointing to a single CTCF binding site inside thesequences (Fig. 2c; Fig. S5a in Additional file 5). Onecould hypothesize that in the cases where a secondmotif for a dual CTCF&BORIS bound region was notidentified, it is most likely still present but deviatesfrom the CTCF motif sequence. Indeed, five suchCTCF&BORIS bound regions produced double shiftswith the 11 ZF domain, confirming the presence of twoCTCF binding sites (Fig. S5a in Additional file 5).
(See figure on previous page.)Fig. 1 Genomic profiling of CTCF and BORIS occupancy in human cancer cells. a Schematic representation of CTCF and BORIS zinc fingers (ZF) showsthe four essential amino acids involved in DNA recognition for each ZF. The amino acids of BORIS that differ from CTCF are highlighted in red. Thenumbers between ZFs show linker length. b Electrophoretic mobility shift assay (EMSA) with increasing amount of full-length BORIS protein (left panel)and unprogrammed TNT (right panel) on the background of a constant level of full-length CTCF protein. The fourth CTCF binding site out of sevenmapped in the H19-IGF2 imprinting control region (ICR) was used as the labeled probe. c, d Gene tracks show the distribution of CTCF (red) and BORIS(blue) bound regions in the K562 cell line (c) and in cell lines K562, Delta47, OVCAR8, and normal human dermal fibroblasts (NHDFs) (d). The moleculesagainst which antibodies were directed and cell lines used in ChIP-seq are shown on the left. The number of tags per one million of mapped reads isindicated. The gray frames and arrows show CTCF-only, CTCF&BORIS and BORIS-only bound regions. e–h Heatmaps depict CTCF (red) and BORIS (blue)occupancy in NHDFs (e), K562 (f), OVCAR8 (g) and Delta47 (h) cells. e Heatmap shows the absence of BORIS occupancy at CTCF bound regionsmapped in BORIS-negative NHDFs. f The genome-wide overlapping of CTCF- and BORIS-bound regions mapped in K562 cells is shown on theleft side of the heatmap. The overlapping of CTCF and BORIS occupancy was done independently for each cell type. The tag density of CTCFand BORIS ChIP-seq data was collected within a 10-kb window around the summit of CTCF (CTCF&BORIS and CTCF-only) and BORIS peaks(BORIS-only). The collected data were subjected to k-means clustering using linear normalization based on similar tag density profiles. Themolecules against which antibodies were directed in ChIP-seq are listed on top of the heat map. i Heatmap shows the enrichment of ChIP-Re-ChIPtag density at CTCF&BORIS-bound regions. ChIP-Re-ChIP occupancy (purple) is presented in comparison with CTCF (red) and BORIS (blue) ChIP-seq datafor Delta47 cells. The tag density was subjected to k-means ranked clustering with two clusters expected
Pugacheva et al. Genome Biology (2015) 16:161 Page 4 of 24

Fig. 2 (See legend on next page.)
Pugacheva et al. Genome Biology (2015) 16:161 Page 5 of 24

Therefore, we classified CTCF binding regions in the gen-ome into clustered CTSes (2xCTSes) and single/individualCTSes (1xCTSes). We further validated the 2xCTS modelby separating the two sub-sites of CTCF&BORIS boundregions and demonstrating their independent binding tothe 11 ZF domain (Fig. S5b in Additional file 5).The above data are consistent with the model of differ-
ential occupancy of CTCF bound regions by BORIS(Fig. 2d). Namely, 1xCTSes and 2xCTSes could not bediscriminated at the resolution of ChIP-seq experimentsand were detected, therefore, as single CTCF binding sitesin both BORIS-positive (K562) and BORIS-negative(NHDF) cells (Fig. 2d). In BORIS-positive cells, the2xCTSes were preferentially occupied by both CTCF andBORIS proteins (CTCF&BORIS), while 1xCTSes werepreferentially occupied only by CTCF (CTCF-only)(Fig. 2d), thus revealing the two classes of CTCF bindingregions. To further test our model, we analyzed DNaseIdigital genomic footprinting and phastCons46 conserva-tion score at 1xCTS and 2xCTS binding regions (Fig. 2d;Fig. S6 in Additional file 6). Upon plotting DNaseI cleav-age density and the conservation score across the twoclasses of CTCF binding regions, we observed either singleor double footprints, respectively, with the correspondingsingle or double conserved peaks, respectively (Fig. 2d;Additional file 6). As 2xCTSes produced double footprintsin BORIS-negative (NHDF) cells as well as in BORIS-positive cells, we could assume that the 2xCTSes were oc-cupied by CTCF homodimers in the absence of BORIS(Fig. 2d; Additional file 6).
Clustered CTCF binding sites facilitate CTCF and BORISinteractions on DNAThe short linear distances between the clustered CTCFmotifs would likely support protein–protein interactionsbetween the bound partners at these regions in vivo. In-deed, the inability to resolve two closely located CTCFbinding sites by ChIP-seq (Fig. 3a) directly supports CTCFand BORIS interaction at 2xCTSes [40]. To test thishypothesis, we performed co-immunoprecipitation experi-ments and showed that CTCF and BORIS were associatedwith each other in K562 cell nuclear extracts in the pres-ence and absence of DNA (Fig. 3b). We also performed anin situ proximity ligation assay (ISPLA) in BORIS-positiveovarian cancer cells (OVCAR8) and human testis tis-sues, confirming that CTCF and BORIS proteins areco-localized in a chromatin context of both cancer andgerm cells where the two proteins are co-expressed(Fig. 3c, d). We also observed increased co-occupancyof DNA by CTCF with the wild-type probe (TP53 pro-moter) compared with a probe of the same length butwith one of the two CTCF sites mutated (Fig. 3e). How-ever, EMSA with increasing amounts of full-lengthCTCF (Fig. 3e) showed not only increased occupancy ofboth sites but also the appearance of a third, slower mi-grating band that likely corresponds to a higher-orderCTCF–DNA complex. Furthermore, EMSAs with K562nuclear extracts demonstrated that the DNA–proteincomplexes were generally completely super-shifted withboth anti-CTCF and anti-BORIS antibodies (Fig. 3f; Fig.S5c in Additional file 5), indicating preferential binding
(See figure on previous page.)Fig. 2 CTCF&BORIS bound regions enclose at least two closely located CTCF binding sites. a Upper panel: gene track represents CTCF (red) andBORIS (blue) binding at the TSP50 (PRSS50) promoter in K562 cells. Lower panel: the alignment of human and mouse sequences under the summitof CTCF (red nucleotide) and BORIS (blue nucleotide) peaks mapped by ChIP-seq at the TSP50 promoter. Two CTCF core motifs (shown on the topof the alignment) coincide with two CTCF binding sites (site1 and site2) previously identified by EMSA and methylation interference assay (MIA)[32] in both mouse and human TSP50 promoters (labeled and underlined at the bottom of the alignment). Asterisks denote the contact guaninesmapped by MIA. The space between the two CTCF binding motifs in human and mouse TSP50 promoters varies from 33 bp to 58 bp (shown bybrackets). The phastCons conservation track shows the high conservation of two CTCF sites in the TSP50 promoter among 100 vertebrates. Theblack arrow shows the beginning of TSP50 transcription. b The percentage of CTCF-only, CTCF&BORIS and BORIS-only peaks with two or moreCTCF motifs. The top 1000 CTCF-only, CTCF&BORIS and BORIS-only binding regions (invariant in three cancer cell lines) were selected for analysis.The presence of a CTCF motif was calculated by FIMO (MEME suite) in the sequence extended 100 bp upstream and downstream of the summitof either CTCF (CTCF-only and CTCF&BORIS) or BORIS (BORIS-only) peaks. Each CTCF motif occurrence has a p value < 0.0001. c Upper panel: EMSAwith five CTCF&BORIS (blue bracket) and four CTCF-only (red bracket) binding regions. The ~200-bp 32P-labeled probes were incubated with eitherin vitro translated luciferase (−) or with the 11 ZF domain of CTCF (+). The slower (shown by arrow with two red dots) and faster (arrow with onered dot) migrating shifted bands correspond to CTCF binding to two CTCF sites at once or to one CTCF site, respectively (double and singleoccupancy). Lower panel: genome browser view of CTCF and BORIS occupancy in K562 and Delta47 cells at nine DNA sequences used in theEMSA. The brackets show the connection between upper and lower panels. ChIP-seq data are shown in combination with ChIP-Re-ChIP-seq datafor K562 and Delta47 cells. ChIP-seq tracks are labeled with the molecule against which antibodies were directed and the cell line used. d Firstrow: individual examples of 1xCTS and 2xCTS, differentially occupied by CTCF and BORIS in BORIS-positive (K562) and BORIS-negative (NHDF) cells.CTCF and BORIS ChIP-seq data are combined with digital genomic footprinting (DGF, ENCODE data) and phastCons46 conservation scores. Thecore 20-bp CTCF motif is marked by a grey box. Second row: heatmaps show DNaseI cleavage density at thousands of 1xCTSes (single CTCF motifon plus strand) and at hundreds of 2xCTSes (two CTCF motifs separated by a 30–40-bp linker, both on the minus strand). The tag density datawere collected within a 300-bp window around the first (left) 20-bp CTCF core motifs (0) under a single CTCF ChIP-seq peak. Third row: averagephastCons46 conservation score at 1xCTSes and 2xCTSes, the same genomic regions as in the second row. Fourth row: model of CTCF and BORISdifferential occupancy in NHDF and K562 cells. 1xCTSes are occupied by CTCF monomer in both BORIS-positive and BORIS-negative cells, while2xCTSes are co-occupied by CTCF and BORIS in BORIS-positive cells or by CTCF homodimer in BORIS-negative cells
Pugacheva et al. Genome Biology (2015) 16:161 Page 6 of 24

Fig. 3 CTCF and BORIS interact at CTCF&BORIS bound regions. a ChIP-seq does not resolve the two closely spaced CTCF binding sites at CTCF&BORISbound regions: no enrichment of reads between two CTCF binding sites (black dots) in the middle panel compared with the right panel with two CTCFbinding regions resolved by ChIP-seq. b Western blot demonstrates co-immunoprecipitation of CTCF and BORIS complexes: K562 nuclear lysates wereimmunoprecipitated with IgG, anti-CTCF and anti-BORIS antibodies. Precipitated complexes were probed with CTCF antibodies. The lysates were eitheruntreated (−) or treated (+) with ethidium bromide (EtBr) before co-immunoprecipitation. c, d In situ proximity ligation assay (ISPLA) shows the close prox-imity between CTCF and BORIS proteins in BORIS-positive cells: ovarian cancer cells (OVCAR8) (c) and human testis tissue (d). e A 200-bp 32P-labeled proberepresenting human TP53 promoter (2xCTS, the palindromic orientation of CTCF motifs shown by arrows) was incubated with increasing concentrations ofthe 11 ZF domain of CTCF (11ZFs, left and middle panels) or Pichia recombinant full-length CTCF (FL CTCF, right panel). The 2xCTS was used in EMSA eitheras wild type with two CTCF binding sites (grey boxes) or as the mutant type with one CTCF mutated site (red cross). The model of 11 ZFs and full-lengthCTCF occupancies are shown by arrows and red dots (CTCF molecules). f A 200-bp 32P-labeled probe representing IRF2BP1 3’ untranslated region (UTR)was incubated with nuclear extracts (n.e.) from either K562 or NHDF cells. All lanes contain the indicated nuclear extract, except the first lane for K562,where only free probe is present. Nuclear extracts and probe were also incubated with either control mouse IgG (−), antibodies against CTCF or BORIS. Thered and blue arrows point to the super-shifted bands corresponding to CTCF–DNA and BORIS–DNA complexes, respectively. NHDF nuclear extract did notproduce a super-shift band with anti-BORIS antibodies. g Gene tracks show that exogenous BORIS expression in MCF7 cells (MCF7 + BORIS) recapitulatesendogenous BORIS occupancy in OVCAR8 cells. The name of the molecules against which antibodies were directed and the cell lines used in ChIP-seq areshown in the tracks. h Heatmap of BORIS (blue) occupancy at 50,000 CTCF peaks invariantly mapped in both OVCAR8 and MCF7 + BORIS cells. The tagdensity was subjected to k-means ranked clustering with two clusters expected. i ISPLA in BORIS-negative MCF7 cells stably transfected with either emptyvector (MCF7+EV) or BORIS (MCF7+BORIS). The specific positive ISPLA signal (red) is present only in MCF7 cells transfected with BORIS-expressing vector
Pugacheva et al. Genome Biology (2015) 16:161 Page 7 of 24
kinetics for heteromeric versus monomeric complexes.Thus, based on several complementary approaches, wecan conclude that CTCF and BORIS interact directly at2xCTSes.The pattern of CTCF and BORIS occupancy across
different cancer cell lines raises the question of whetherCTCF and BORIS heterodimerization is preprogrammedin the genome sequence by the 2xCTSes. To test thisidea, we induced ectopic BORIS expression in theBORIS-negative breast cancer cell line MCF7 (Fig. 3g–i).The pattern of exogenous BORIS occupancy completelyrecapitulated the binding profile of endogenous BORISexpression in OVCAR8 cells (Fig. 3g, h). Replacement ofCTCF homodimers by CTCF and BORIS heterodimerswas further confirmed by ISPLA where the positivesignal was detected only in nuclei of MCF7 cells withexogenous BORIS expression (Fig. 3i). Thus, evidently,CTCF and BORIS heterodimeric complexes are not onlycommon in cancer cells of different origins, but can beformed upon induction of BORIS expression in BORIS-negative cells.
Clustered CTCF binding sites are strongly enriched atactive promoters and enhancers in cancer cellsTo investigate the functional relevance of clusteredCTCF binding sites, we analyzed chromatin organizationand the epigenetic landscape of cancer cells at theseregions. Comparison of the 2xCTSes (BORIS boundregions: CTCF&BORIS and BORIS-only) identified inK562 cells with the set of data generated by ENCODEshowed that most 2xCTSes were specifically associatedwith active enhancers and promoters, in stark contrastto 1xCTSes (CTCF-only bound regions) (Fig. 4a, b; Add-itional file 7). About 87 % (15,305) of all active pro-moters (17,656) in K562 cells, marked by enrichment ofthe transcription initiating form of RNA polymerase IIand the active histone mark H3K4me3, had BORIS oc-cupancy within 4 kb of transcription start sites (TSSs)with the preferential co-occupancy by both CTCF andBORIS proteins (Fig. S7a in Additional file 7). In con-trast, only 4 % (666) of these promoters contained singleCTCF sites.Similarly, 50 % (8714) of all active enhancers (17,798) in
K562 cells, as defined by H3 histone K27 acetylation andp300 enrichment (histone acetyltransferase), coincidedwith BORIS bound regions (Fig. S7a in Additional file 7).Recently, a subclass of enhancers, called super enhancers,was shown to orchestrate cell-specific transcription to de-termine cell identity [41]. More than 76 % (563) of superenhancers identified in K562 overlapped with BORISbound regions (Fig. S7b in Additional file 7).Upon further analysis, we established that clustered
CTCF binding sites showed dramatically different chro-matin features compared with 1xCTSes (Fig. 4a, b;
Additional file 7). Factors involved in active transcription,such as RNA polymerase II (RNAPII), TAF1, YY1, TBP,MYC, HMGN3, and PHF8 were highly (80–99.7 %)enriched at CTCF&BORIS bound regions but depleted(0–10 %) from CTCF-only bound regions (Fig. S7c–f inAdditional file 7). In contrast, the cohesin complex wasenriched at all CTCF bound regions, independent ofBORIS occupancy (Fig. 4b; Fig. S7c–f in Additional file 7).Remarkably, RAD21 and SMC3 were depleted fromBORIS-only bound regions, suggesting that BORIS wasnot able to recruit the cohesin complex without CTCF(Fig. 4b; Fig. S7c, d, f in Additional file 7). Thus, BORIS-only and CTCF&BORIS bound regions (2xCTSes) aredramatically different from CTCF-only bound regions(1xCTSes) with respect to their genomic distribution(Fig. S7g in Additional file 7) and co-localization withprotein partners, levels, and landmarks of transcription,and the epigenetic landscape of K562 cells (Fig. 4a, b;Additional file 7).To determine whether this difference stems from the
presence of BORIS at 2xCTSes or whether 2xCTSes arethemselves inherently functionally different from 1xCTSes,we compared CTCF ChIP-seq data for BORIS-negative(GM12878, lymphoblastoid cells, ENCODE data) andBORIS-positive (K562) cells. The genomic regions invar-iantly occupied by CTCF in both K562 and GM12878 cellswere then separated into two groups (1xCTSes and2xCTSes) based on BORIS occupancy in K562 cells. TheCTCF ChIP-seq tag density at the two classes of CTCFbound regions in GM12878 cells demonstrated signifi-cantly higher CTCF occupancy at the 2xCTSes comparedwith 1xCTSes, in agreement with double CTCF occupancyat 2xCTSes in BORIS-negative cells (Fig. S8a in Additionalfile 8). The double occupancy for CTCF was also con-firmed by DNaseI footprints in BORIS-negative NHDFs(Fig. 2d; Additional file 6). Similarly to K562 cells, 2xCTSesbut not 1xCTSes were highly enriched with RNAPII,CAGEs, and active histone marks (H3K4me3, H2AZ, andH3K27ac) (Fig. 4c; Fig. S8a, b in Additional file 8), suggest-ing that 2xCTSes were preferentially associated with activepromoters and enhancers in BORIS-negative cells as wellas in BORIS-positive cells (K562). Thus, 2xCTSes are func-tionally specialized in the epigenome, regardless of theiroccupancy by CTCF and/or BORIS.
CTCF and BORIS interactions are involved in thetranscriptional program of germ cellsThe genomic binding patterns of CTCF and BORIS incancer cells suggest that the heterodimerization betweenthese two proteins could also be characteristic for germcells. CTCF and BORIS are co-expressed during sperm-atogenesis, with BORIS expression being the highest inhaploid round spermatids compared with other germcells [27]. To examine the interplay between BORIS and
Pugacheva et al. Genome Biology (2015) 16:161 Page 8 of 24
vlobanenkov
Highlight
vlobanenkov
Line
vlobanenkov
Line
vlobanenkov
Line
vlobanenkov
Highlight
vlobanenkov
Highlight

Fig. 4 1xCTSes and 2xCTSes are associated with different epigenetic landscapes in both BORIS-positive (K562) and BORIS-negative (GM12878)cells. a Gene tracks show the association of CTCF and BORIS bound regions in K562 cells with multiple ENCODE ChIP-seq data. The tracks arelabeled with the names of molecules against which antibodies were directed for ChIP-seq. The gray frames highlight CTCF-only, CTCF&BORISand BORIS-only bound regions. b Average tag density (tags/10 million) of multiple factors mapped by ChIP-seq in K562 cells (ENCODE data)across BORIS-only (blue), CTCF-only (red) and CTCF&BORIS (purple) bound regions mapped in K562 cells. The data were normalized to the number ofmapped reads and binding regions. The names of factors used in ChIP-seq are labeled on the top of each plot. RNAPII RNA polymerase II. c Heatmapdemonstrates the difference between 1xCTSes and 2xCTSes with respect to the enrichment of RNAPII, CAGEs, H3K4me3, H2AZ, H3K27ac, ZNF143, andSMC3 ChIP-seq tag density at two types of CTCF binding classes in BORIS-negative cells (GM12878)
Pugacheva et al. Genome Biology (2015) 16:161 Page 9 of 24

CTCF in the native context, we performed ChIP-seq todetermine the occupancy of the two proteins in elutri-ated mouse round spermatids. Similar to cancer cells,25 % of CTCF bound regions were co-occupied byBORIS in round spermatids (Fig. 5a). Importantly, a highlevel of conservation was observed for both CTCF andBORIS bound regions in germ cells (Fig. 5b): 84 %, 76 %and 77 % of CTCF/BORIS, CTCF-only and BORIS-onlybound regions, respectively, could be aligned to the
human genome. Furthermore, these regions were occu-pied in the same manner by CTCF and BORIS in K562,OVCAR8 and Delta47 cells (Fig. 5c; Additional file 9).The fact that similar patterns of CTCF and BORIS occu-pancy were observed for the conserved genomic regionsin both human cancer cell lines and mouse germ cells(Fig. 5c, d; Additional file 9) strongly indicates thatCTCF and BORIS co-occupancy in cancer cells recapitu-lates the features of germline chromatin.
Fig. 5 Genomic profiling of CTCF and BORIS occupancy in mouse germ cells. a Overlapping of CTCF (red) and BORIS (blue) genomic occupancyin mouse round spermatids. b Histogram indicates the percentage of conserved mouse CTCF and BORIS bound regions in the humangenome. c Average tag density of CTCF (red) and BORIS (blue) occupancy in K562 cells across the conserved mouse binding regions from (b).d Gene tracks of CTCF and BORIS occupancy at the Tsp50/TSP50 (Prss50/PRSS50) gene in mouse (round spermatids) and human (K562) cells. e Averagetag density (tags/10 million) of RNAPII, H3K4me3, and H3K27ac mapped by ChIP-seq in mouse testis (ENCODE data) across BORIS-only (blue),CTCF-only (red) and CTCF&BORIS (purple) bound regions mapped in mouse round spermatids. The data were normalized to the number ofmapped reads and binding regions
Pugacheva et al. Genome Biology (2015) 16:161 Page 10 of 24
vlobanenkov
Highlight

As BORIS bound regions (2xCTSes) were highlyenriched at the active promoters and enhancers in hu-man cancer cells (Fig. 4), we analyzed the enrichmentof RNAPII, H3K27ac, and H3K4me3 mapped in mousegerm cells (mouse testis, ENCODE) in correlation withBORIS-bound regions (CTCF&BORIS and BORIS-only)and CTCF-only bound regions mapped in round sperma-tids. Similarly to cancer cells (Fig. 5e), all three marks ofactive transcription were significantly enriched at BORIS-bound regions compared with CTCF-only bound regions,signifying the involvement of 2xCTSes in germline tran-scription regulation.
2xCTSes demonstrate distinct functional properties uponco-binding by CTCF and BORIS or by CTCF homodimersAs 2xCTSes were found more frequently within pro-moters and enhancers in dramatic contrast to 1xCTSes(Figs. 4 and 5), we tested whether binding of both CTCFand BORIS to these regions would have a different im-pact on transcription compared with CTCF bindingalone. We employed two independent experimental sys-tems to modulate the level of BORIS protein withoutchanging the expression of CTCF (Fig. 6a). The intro-duction of zinc finger nuclease (ZFN), targeting the firstcoding exon of the BORIS gene, resulted in high effi-ciency of BORIS knockout 48 h after transfection (Fig. 6a;Fig. S10a, b in Additional file 10). However, K562 cellswith mutations in BORIS were eventually depleted withextended culturing, suggesting a requirement of BORISfor cell viability or proliferation (Fig. 6b; Fig. S10b–d inAdditional file 10). The latter was a distinct possibility,as it is known that the K562 cell line can be differenti-ated into either erythroid or megakaryocytic lineages[42]. Consistent with this model, K562 cells treated withZFN produced significantly fewer colonies comparedwith untreated cells when plated in soft agar (Fig. 6c;Fig. S10e in Additional file 10). Single-cell clones (50clones) recovered from soft agar, upon analysis for theefficiency of mutagenesis by CEL-I assay, immunoblotting,and DNA sequencing, all contained a wild-type BORIS al-lele, with 20 % of the clones also having one allele of theBORIS gene mutated (Fig. S10c, d in Additional file 10). Asecond round of treatment of mutated clones with ZFNproduced a more severe phenotype with indications ofmegakaryocytic differentiation (Fig. 6a), such as the upreg-ulation of megakaryocytic markers in all mutated single-cell clones with heterozygous BORIS deletion (Fig. 6d;data not shown). A full knockout of the BORIS gene inK562 cells had never been obtained despite multiple at-tempts (data not shown), indicating that BORIS knockoutcould be incompatible with the viability of K562 cells.However, we clearly established that BORIS is required forK562 proliferation, as the loss of BORIS led to the differ-entiation of K562 cells into the megakaryocytic lineage
(Fig. 6a, d). Conversely, the differentiation of K562 cellsinto the megakaryocytic lineage by independent means(i.e., upon phorbol 12-myristate 13-acetate (PMA) treat-ment led to the dramatic downregulation of BORIS, signi-fying BORIS involvement in maintenance of K562multipotency (Fig. S10f, g in Additional file 10).To directly gauge the involvement of BORIS in the
transcriptional regulation of K562 cells we performedRNA-seq analysis of K562 upon BORIS depletion.Hundreds of genes functionally linked to cancer, inflam-matory response, and/or cell differentiation changed theirexpression levels upon BORIS downregulation in K562cells (Fig. 6e; Tables S1–S3 in Additional file 11). Inparticular, the depletion of BORIS in K562 cells resultedin significant change in transcription of 1035 genes (351downregulated and 684 upregulated, p < 0.05; Fig. 6e).The majority of the genes (70 %) that changed transcrip-tion had either CTCF&BORIS binding (Fisher’s exact test,p = 0.0095, odds ratio = 1.29) or BORIS-only binding(Fisher’s exact test, p < 0.0001, odds ratio = 1.3) in thepromoter region (±5 kb from TSSs).In the second experimental system, we ectopically
expressed BORIS in the cell line MCF7, which does notnormally express this gene (Fig. 6a). Following stableBORIS expression in two independent clones, we observeda dramatic change toward a stem-like phenotype (Fig. 6a).A similar phenotype was described in MCF7 cells uponloss of WISP2 (Wnt-1-induced signaling protein-2) expres-sion [43]. Indeed, upon RNA-seq analysis of MCF7 cellswith stable BORIS expression we found a dramatic down-regulation of WISP2 in clone 1 and almost completeknockdown of WISP2 in clone 2 (Fig. S10h in Additionalfile 10). The ectopic expression of BORIS in MCF7 cells re-sulted in the deregulation of 2022 (1334 downregulatedand 688 upregulated, p < 0.05) and 2366 (1191 downregu-lated and 1175 upregulated, p < 0.05) genes in clones 1and 2, respectively (Fig. 6f). In line with the direct involve-ment of BORIS in gene regulation in cis, the majority ofgenes (55 % in clone 1, 67 % in clone 2 that changed tran-scription levels upon induced BORIS expression showedeither CTCF&BORIS binding (Fisher’s exact test; clone 1,p < 0.0001, odds ratio = 1.52; clone 2, p < 0.0001, odds ra-tio = 1.69) or BORIS-only binding (Fisher’s exact test;clone 1, p < 0.0001, odds ratio = 1.47; clone 2, p < 0.0001,odds ratio = 1.47) in the promoter region (±5 kb fromTSSs). The main pathways concordantly up- or down-regulated in both independent clones were significantlyassociated with cancer, inflammatory response, and re-productive system disease (Fig. 6f; Tables S4–S6 inAdditional file 11).The detailed comparison of cells with depleted or in-
duced BORIS expression demonstrated the changes intranscriptional outcomes that strongly correlated withBORIS levels in both systems (Fig. 6e–g; Tables S7 and
Pugacheva et al. Genome Biology (2015) 16:161 Page 11 of 24
vlobanenkov
Line
vlobanenkov
Line
vlobanenkov
Highlight

Fig. 6 (See legend on next page.)
Pugacheva et al. Genome Biology (2015) 16:161 Page 12 of 24

S8 in Additional file 11). For example, inflammationpathways were downregulated with induced BORIS ex-pression in MCF7 cells while being upregulated uponBORIS downregulation in K562 (Fig. 6e–g; Fig. S10i inAdditional file 10; Tables S7 and S8 in Additional file 11).Furthermore, the genes involved in megakaryocyticlineage differentiation were highly upregulated in BORIS-depleted K562 cells (Fig. 6a, e), while the genes involvedin the differentiation of cells were downregulated inMCF7 cells upon BORIS expression (Tables S7 and S8 inAdditional file 11).Comparing the cell lines with differential occupancy
at 2xCTSes also implicated the direct involvement ofBORIS at these regions in transcriptional regulation. Asillustrated in Fig. S10k, l in Additional file 10, the geneswith 2xCTSes where CTCF occupancy (NHDF) wasreplaced by CTCF and BORIS co-occupancy (K562,OVCAR8, Delta47) displayed distinct modes of tran-scriptional regulation. For example, the testis-specificpromoter of the GAL3ST1 gene was silenced when oc-cupied by CTCF alone in most BORIS-negative celllines, but it was activated in BORIS-positive cells (germand cancer) when co-occupied by CTCF and BORIS(Fig. S10k, l in Additional file 10). Furthermore, the ex-perimental upregulation or depletion of BORIS led toan increase or decrease of GAL3ST1 expression, re-spectively (Fig. 6h, i). Similarly to GAL3ST1, PRAMEand FOXA3 genes were also silent under CTCF occu-pancy, but were activated upon CTCF and BORIS co-binding in both cancer and germ cells (Fig. S10k, l inAdditional file 10). An opposite occupancy-specific ef-fect was observed for the EGR1 promoter, which washighly active under CTCF homodimer occupancy inMCF7 cells but was dramatically repressed upon ec-topic BORIS expression (Fig. 6h, i). Two more examples,BBC3 and FGFR4, showed dissimilar transcriptional
outcomes depending on 2xCTS occupancy by CTCF andBORIS (Fig. 6h, i). Thus, these analyses showed thatCTCF&BORIS co-regulation of corresponding genes is ofcritical importance for the transcriptional program of bothgerm and cancer cells, and represents a functionally dis-tinct mode of transcription control compared with CTCFhomodimer bound at the same regions.We also found some revealing examples of CTCF&BORIS
controlled genes that changed their expression in thesame way upon both BORIS induction and depletion:BBC3 was upregulated and EGR1 downregulated(Fig. 6h, i). This could be explained either by an indir-ect effect of BORIS balance or by BORIS regulation im-plemented through long-range chromatin interactions.The latter is an intriguing option, as the potential roleof BORIS in three-dimensional folding of chromatinhad never been >possibility we cross-referenced ourChIP-seq data with a published RNAPII ChIA-PETstudy where 30,000 K562-specific loops were mappedin BORIS-positive cells (K562) versus BORIS-negativecells (MCF7) [44]. CTCF&BORIS bound regions werenotably overrepresented (65 %) at the anchors of K562-specific loops (Fig. S11a in Additional file 12). Moreimportantly, the same regions were occupied by CTCFand RNAPII in MCF7 cells, but the long-range interac-tions were different (Fig. S11b, c in Additional file 12).Thus, BORIS may re-wire the long-range chromatin in-teractions mediated by CTCF in BORIS-negative cellsthrough CTCF and BORIS heterodimerization inBORIS-positive cells (the proposed model is presentedin Fig. S11d in Additional file 12).
Clustered CTCF motifs are associated with specificchromatin architecture in human and mouse spermAs shown here, CTCF and BORIS were co-localized invivo in postmeiotic haploid round spermatids (Fig. 5).
(See figure on previous page.)Fig. 6 CTCF and BORIS interactions are essential for transcriptional regulation in cancers. a Two models are used in the study: K562 cells (BORIS+/+) treated with zinc finger nuclease (ZFN) to knockout/downregulate the BORIS gene (BORIS+/−) and MCF7 cells with stably transfected emptyvector (MCF7+EV) or BORIS-expressing vector (MCF7+BORIS). Upon stable change of BORIS expression (western blot) both types of cells showedphenotypic changes. b Western blot analysis of K562 cells (mass culture) upon BORIS depletion by ZFN (before ZFN (wt), 48 h, and two weeksafter ZFN). c Number of K562 single-cell clones growing in soft agar after ZFN transfection (ZFN) compared with untransfected cells (Control). dExpression of megakaryocytic lineage markers in three independent single-cell K562 clones after ZFN treatment compared with wild type (wt). e,f Fold changes (log2) in gene expression in response to BORIS depletion in K562 cells (e) and BORIS induction in MCF7 cells (f). Two independentsingle-cell clones of MCF7 cells with stably expressed BORIS were analyzed (f). Top associated diseases and bio functions (p < 0.0001) are shownfor upregulated (red) and downregulated (green) genes on the right (Ingenuity Pathway Analysis). The genes that change expression in a similarway in both independent MCF7 clones with stably transfected BORIS are shown on the heat map (f). g Heat map showing the comparison ofgenes that changed expression upon BORIS depletion (K562 cells) and BORIS induction (MCF7 cells, clone1) in respect to diseases and biofunctions (activation z-score). h Genome browser view of six CTCF&BORIS target genes. The tracks are labeled with the names of moleculesagainst which antibodies were directed and the cell lines used in ChIP-seq, respectively. The red arrows show the beginning and direction oftranscription. The schematic occupancy of promoters with either CTCF (red) and BORIS (blue) heterodimers or CTCF homodimer is shown on theright. i Expression of six CTCF&BORIS targets from panel (h) was analyzed by quantitative PCR in cells with upregulated (MCF7+BORIS) anddownregulated BORIS (BORIS small interference RNA (si) treatment of K562 cells, mass culture) expression. Asterisk (*) represents p-value <0.05and double-asterisk (**) represents p-value <0.01 between treated and untreated cells (c, i). Error bars represent standard deviation of the averageof triplicate measurements (c, d, i). TSS transcription start site
Pugacheva et al. Genome Biology (2015) 16:161 Page 13 of 24
vlobanenkov
Underline

Round spermatids undergo an extensive chromatin re-modeling process during their final differentiation intomature sperm. During these processes DNA is packagedinto a highly condensed state in which the somatichistones are replaced by protamines. However, a smallproportion of histones remains associated with DNAand there are several reports suggesting CTCF associ-ation with these regions [45–48]. In order to understandthe biological function of 2xCTSes during male germcell development, we compared the two classes of CTCFbinding regions with the genomic loci that escape pro-tamine occupancy in mature human and mouse sperm.For that we used a published data set of MNase foot-prints mapped in human and mouse sperm [49, 50]. Theoverlap between our set of data for CTCF and BORISoccupancy in cancers with the regions of histone retainedin human sperm showed the specific enrichment of his-tones at 2xCTSes, but not at 1xCTSes (Fig. 7a, b). To ex-tend this observation further, we analyzed the enrichmentof histones retained in sperm at two classes of CTCFbinding regions: 2xCTSes (CTCF&BORIS, BORIS-only)and 1xCTSes (CTCF-only). We found that in both humanand mouse sperm, the histones were indeed specificallyretained at BORIS-bound regions (Fig. 7c, d), but not atCTCF-only bound regions. These results suggest that oc-cupancy of BORIS at 2xCTSes may be implicated in chro-matin remodeling during the differentiation of roundspermatids, where BORIS is highly expressed, and maymark the regions where the histones have to be retainedto label genes, promoters, and enhancers destined forearly expression in the developing embryo.
DiscussionChIP-seq analysis of several BORIS-expressing cancercell lines established that the pattern of BORIS bindingis similar across cell lines of independent origin andthus likely reflects an underlying “encoding” of thebinding regions for their propensity to bind BORIS(Fig. 1; Additional file 1). Upon further analysis, we un-covered that this encoding largely reflects the ability ofthese regions to be co-bound by CTCF and BORIS and/or by BORIS or CTCF homodimers. Such regions,mapped by ChIP-seq as single peaks, encompass two ormore closely spaced CTCF binding DNA sequences/motifs (used here interchangeably as 2xCTS or clus-tered CTSs). We further showed that structural proper-ties of 2xCTSes and single CTCF sites (1xCTSes)correlate with functional differences: 2xCTSes are pref-erentially associated with promoters and enhancers,confer differential modes of transcriptional regulationdepending on the occupancy by CTCF and/or BORIS,and correlate with regions that retain histones duringspermatogenesis.
Genome-wide analysis of BORIS distribution reveals theinherent structural dichotomy between clustered CTCFbinding sites and single CTCF binding sitesOur present analysis of BORIS distribution in chromatinof cancer cells (Fig. 1), in addition to providing a wealthof information on the involvement of BORIS in tran-scriptional regulation and chromatin organization, inad-vertently revealed inherent differentiation of CTSes.Approximately one-third of CTCF binding regions iden-tified by ChIP-seq as single peaks encompassed at leasttwo closely spaced CTSes (Fig. 2). The 2xCTSes werepredisposed to bind BORIS in cooperative fashion withCTCF (CTCF&BORIS), as well as comprised the major-ity of BORIS-only sites (Fig. 2; Additional files 1, 2, and3). Notwithstanding that their genome wide-distributionwas revealed by the present BORIS analysis, the emer-gence of 2xCTSes evidently predated the appearance ofBORIS in evolution. The existence of these clustered siteswas demonstrated in our previous work on EMSA map-ping of CTCF binding [32, 51]. With longer (150–200 bp)EMSA probes, we repeatedly detected either one or twoDNA–protein complexes with the 11 ZF DNA bindingdomain of CTCF ([32, 51, 52] and unpublished observa-tion). Further analyses of a subset of CTCF targets uncov-ered the corresponding presence of either one or twoCTSes within the probes [32, 51]. For example, the Fab-8Drosophila chromatin insulator was found to encompasstwo closely spaced CTSes [51], while the testis-specificpromoter of TSP50 was shown to include two adjacentCTSes, conserved between mouse and human [32]. Thepublished examples of two closely spaced CTSes, as wenow know, include alternative BORIS promoters [34],mouse KvDMR1 imprinting locus [52], BAX promoter[53], enhancers of the murine Igh locus [54], and others[55]. The principal biological significance of clusteredCTSes can be seen in their evolutionary conservation. Forexample, the two adjacent CTSes in the PRSS50/TSP50promoter are highly conserved, and the CTCF-bindingmotifs are arranged similarly in human and mouse pro-moters (Fig. 2a). In the TP53/Tsp53 promoter, the twoCTCF sites are arranged in opposite directions, yet in avery similar way in both human and mouse (Fig. S4b inAdditional file 4).The structural difference of clustered CTSes from
1xCTSes is based on the number, i.e., two or more, of ZF-bound DNA motifs. The existence of clustered CTSes isalso likely constrained by the requirement for close spa-cing of DNA motifs, as suggested by their single-peakappearance in ChIP-seq (Fig. 3a). The widespread gen-omic occurrence of clustered sites was not revealed untilthe present work, largely due to the insufficient resolutionof ChIP-seq experiments and the perception in publishedstudies that all CTCF ChIP-seq peaks comprise a singleCTCF motif [56].
Pugacheva et al. Genome Biology (2015) 16:161 Page 14 of 24
vlobanenkov
Highlight
vlobanenkov
Underline
vlobanenkov
Highlight
vlobanenkov
Line
vlobanenkov
Line
vlobanenkov
Line
vlobanenkov
Stamp

In this work, we present evidence that 1xCTSes arepreferentially occupied by CTCF only and contain a singleCTCF binding motif, while clustered CTSes, which en-close two or more CTCF-binding motifs, are preferentiallyoccupied by larger/multimeric complexes, includingCTCF&CTCF, CTCF&BORIS, or BORIS&BORIS (Fig. 2;Additional files 3, 4, and 5). This model is supported bythe demonstration of the presence of at least two CTCFmotifs and at least two DNaseI footprints in the regionswith 2xCTSes (Fig. 2d; Additional file 6), as well as by theconservation of two juxtaposed CTCF motifs according tophastCons score (Additional file 6). Additionally, weshowed that clustered CTSes predispose the physical in-teractions of CTCF and BORIS (Fig. 3). Further, resultsfrom EMSA (Fig. 3f; Fig. S5c in Additional file 5), ChIP-Re-ChIP (Fig. 1i; Fig. S2b in Additional file 2), co-
immunoprecipitation (Fig. 3b), and ISPLA in both cancerand germ cells (Fig. 3c, d, i) support the co-occupancyof 2xCTSes by CTCF and BORIS. The discovery of2xCTSes adds an additional layer of complexity to theversatility of CTCF, and likely BORIS, as multifunctionalchromatin factors. The CTCF, a multifunctional protein it-self [12], employs variable combinations of 11 ZFs to binda wide range of DNA sequences, which form an extensivearray of motifs [13, 56]. In that context, the clusteredCTSes, with variable spacing, orientation, and the numberof binding sites that are bound by several CTCF and/orBORIS molecules, would confer a substantially higher de-gree of versatility to the regulatory potential of CTCF and/or BORIS. These chromatin regions likely have a higherdegree of combinatorial usage of ZFs, stronger binding,more cooperative protein–protein interaction, a wider
Fig. 7 BORIS bound regions correlate with histone retention in human and mouse sperm. a Gene tracks show the distribution of histonesretained in human sperm in association with CTCF and BORIS bound regions, mapped in K562, Delta47 and OVCAR8 cell lines. The name of themolecules against which antibodies were directed and the cell lines used in ChIP-seq are shown on the left. b Heatmap indicates the enrichmentof histones retained in human sperm at 2xCTS regions (invariant BORIS binding in K562, OVCAR8, and Delta47). c, d Average tag density (tags/10million) of histones retained in human (c) and mouse (d) sperm across BORIS-only (blue), CTCF-only (red) and CTCF&BORIS (purple) bound regionsmapped in K562 cells (c) and mouse round spermatids (d). The data were normalized to the number of mapped reads and binding regions
Pugacheva et al. Genome Biology (2015) 16:161 Page 15 of 24
spectrum of protein partners, and likely more selective in-teractions with other anchors of chromatin loops com-pared with single sites.
2xCTSes as a transcriptional platform modulated by BORISThe discovery of clustered CTSes enables us, for the firsttime, to address the long-standing question of howCTCF can serve in the context of the same nucleus as abona fide transcription factor, while maintaining a sub-stantial presence at putative insulator/boundary sitesthat bear no indications of transcriptional activity [1].Indeed, only 10–20 % of all CTCF binding regions arelocated in promoter regions in any given cell type [14,57], while the rest of the CTSes are not associated withTSSs. The obvious candidates for the determinants ofsuch distinct functional roles would be DNA sequencesthemselves and/or differential identity of chromatin atthese two types of sites. Here, we present genome-wideevidence that DNA sequences underlying the two typesof CTSes are structurally different, i.e., that not all CTCFbound regions are equal. It is exemplified by the findingthat only clustered CTSes, but not 1xCTSes, were asso-ciated with active promoters and enhancers in bothcancer and germ cells (Figs. 4 and 5). Thus, one couldhypothesize that the role of CTCF, and likely BORIS, astranscription factors is implemented through 2xCTSes.As with other transcription factors, that role could befurther modulated by the interactions with additionalproteins [58–63]. Furthermore, in case of CTCF and/orBORIS serving in a transcription factor capacity, theirpotential to regulate gene expression may also involve aformation of chromatin loops (Additional file 12).The question that remains open is what mechanism
facilitates BORIS replacement of CTCF at clusteredCTSes to form CTCF&BORIS and BORIS-only boundregions. The originally proposed model for BORIS’ “in-vasion” of CTSes upon its expression in germline andcancers was that BORIS simply outcompetes CTCF forbinding at some sites [27, 30]. However, based on thepresent genome-wide study, it is more likely thatBORIS outcompetes CTCF from one out of two closelyspaced binding sites at the majority of 2xCTSes, there-fore replacing CTCF homodimer with a more stableCTCF&BORIS heterodimer, and that BORIS-onlybound regions represent the next step in the full re-placement of CTCF by BORIS. The outcome of CTCFand BORIS homodimer and heterodimer occupancy at2xCTSes is different with respect to transcriptionalregulation and, possibly, transcriptional loop formation(Fig. 6; Additional files 10 and 12). In contrast to clus-tered CTSes, the 1xCTSes evidently are preferentiallylocated intergenically and associated with genomic re-gions devoid of hallmarks of active transcription (Fig. 4;
Additional files 7 and 8). These characteristics may beconsistent with chromatin barrier/insulator elements.
BORIS binding to DNA and its putative regulatoryfunction in cancer cells is causally related to CTCF&BORISand BORIS-only bound regions in the germlineCTCF is ubiquitously expressed in all types of cells, whileBORIS expression is normally restricted to germ cells andcould be aberrantly activated in cancers [27, 35, 38]. Theaberrant activation of cancer testis genes, especially globalregulators such as BORIS, could be a substantial compo-nent of reprogramming normal somatic cells into malig-nant ones. Here we demonstrate that the core bindingpattern of BORIS distribution in three independent celllines that tolerate high levels of endogenous BORIS isprobably rooted in the normal function of BORIS itselfand its interaction with CTCF in the germline. This con-clusion is primarily based on our finding that the genome-wide occupancy of 1xCTSes and 2xCTSes by CTCF andBORIS in cancer cells largely recapitulates their bindingprofile in germ cells, at least for the subset of bindingregions that are conserved between mice and humans(Fig. 5; Additional file 9).As clustered CTSes were strongly associated with tran-
scription (Fig. 4) and enriched for active enhancer andpromoter epigenetic marks (Figs. 4 and 5e), it was logicalto hypothesize that BORIS binding and/or BORIS het-erodimerization with CTCF at clustered CTSes may ini-tiate or at least predispose cancer cells for the actualexecution of a germline-like transcription program. In-deed, upon examining the actual effect of BORIS dosageon the transcription of genes associated with clusteredCTSes, we found that the substitution of CTCF homodi-mer by CTCF and BORIS heterodimer at the 2xCTSes isrequired for the expression of some testis-specific genes(Fig. 6; Fig. S10k, l in Additional file 10). Furthermore,using two independent systems modulating BORIS levelsin opposing directions, we demonstrated that the tran-scription of genes regulated by BORIS is actuallydependent on BORIS dosage for most cases, suggestingthe direct mode of regulation (Fig. 6). The mechanismof this predisposition of cells aberrantly expressingBORIS to the germline-specific transcriptional config-uration of the epigenome and, to some degree, tran-scriptome (Fig. 6) is likely implemented via chromatinloops specific for BORIS-bound clustered sites (Additionalfile 12). This finding opens a new chapter in our under-standing of CTCF-mediated chromatin loop organizationgenome-wide, as it assigns this crucial CTCF function to aspecific subset of CTSes, namely clustered CTSes. The ac-tual levels of transcriptional activation of germline-specificgenes controlled by clustered CTSes bound by BORIS incancer cells can be, of course, additionally dependent onother factors known to be deregulated in cancers, such as
Pugacheva et al. Genome Biology (2015) 16:161 Page 16 of 24

DNA methylation and the expression of other tissue-specific transcription factors. For example, while theTSP50 gene is controlled by the clustered CTS bound byCTCF and BORIS in both human and mouse germ cells(Figs. 2a and 5d), its activation required the full demethyl-ation of the promoter region [32].
A putative novel function of 2xCTSes in normalpostmeiotic germ cellsUnderstanding the functional role of BORIS in cancer ishardly possible without learning more about its normalfunction. While the role of BORIS as transcriptional acti-vator of spermatogenesis-specific genes has been estab-lished [29, 30, 32], there are additional observations thatrequire more extensive analyses. One such phenomenonis the role of BORIS in postmeiotic cells, where BORIS ex-pression is highest, based on mRNA levels [29]. However,the previous assessment of green fluorescent protein-BORIS protein distribution in transgenic mice indicatedthat, while its level is high in spermatogonia and prelepto-tene spermatocytes, it is below recordable levels in post-meiotic cells [30]. The reliable detection of untagged/native BORIS protein is particularly challenging due to thelack of reliable commercial antibodies, which is exempli-fied by the false positive detection of BORIS expression insomatic tissues [64]. Our results with newly generatedanti-mouse BORIS polyclonal antibodies confirmed theexpression of BORIS in round spermatids (Fig. 5a),where a wave of postmeiotic transcription and chromatinremodeling takes place to produce mature spermatozoa.Concomitantly, chromatin becomes more condensed, andhistones are replaced by protamines, with only 5–10 %of the sperm’s epigenome still packaged with histones[45–50, 65–69]. The regions that retained histones havebeen reported to be essential for the expression ofgenes related to early zygotic activation [47, 48, 50].Moreover, the presence of CTCF protein in mouse andhuman sperm has been reported previously [70]. Inaddition, several reports have shown the presence ofthe CTCF motif and correlation with CTCF boundregions in different cells lines with MNase footprintsreleased by micrococcal nuclease digestion in humanand mouse sperm [45–47]. Although our results concur,we found that not all CTCF binding regions are correlatedwith histone retention in sperm, but 2xCTSes specifically.Those regions are either co-occupied by BORIS only or byboth CTCF and BORIS in round spermatids and, likely, insperm. Those regions also could correlate with testis-specific histones that escape histone-to-protamine re-placement in mature sperm [71]. These results raise theintriguing possibility that BORIS plays a regulatory role insperm genome organization and gene expression duringearly development. However, data produced by us andothers do not show direct binding of CTCF and BORIS to
the sperm genome. Future studies with ChIP-seq dataof BORIS and CTCF in human sperm will be needed toanalyze if the presence of both proteins may play a rolein the regulation of the gene expression on zygotic geneactivation and whether both proteins bound to spermchromatin are important for gene expression duringdevelopment.
ConclusionsOur study provides the first comprehensive analysis ofCTCF and BORIS occupancy in cancer and germ cells,where the two paralogous proteins are co-expressed. Inthis study we found that BORIS binds to approximatelyone-third of CTCF bound regions, representing clus-tered CTCF binding sites, while the remaining two-thirds consist of single CTCF binding sites and are occu-pied by CTCF alone in vivo. Thus, the pattern of BORISbinding uncovered two classes of CTCF binding regionsthat are preprogrammed and evolutionarily conserved inDNA sequence. Our study challenges the perception inthe current literature that all CTCF sites are equal andcharacterized by a single CTCF motif. The clusteredCTCF binding sites constrain CTCF to form homodi-mers in normal somatic cells and heterodimers withBORIS in germ and cancer cells expressing BORIS. Thedrastic enrichment of clustered CTCF binding sites atactive promoters and enhancers confirms their func-tional significance in transcription. In male germ cell de-velopment, clustered CTCF binding sites are associatedwith a unique chromatin composition in sperm, likelypresetting these regions for zygotic gene activation.
Materials and methodsCell cultureK562, Delta47, OVCAR8, NHDF, and MCF7 cell lineswere grown in Dulbecco's modified Eagle medium(DMEM) supplemented with 10 % fetal calf serum andpenicillin-streptomycin. MCF7 cells were transfectedusing the Cell Line Nucleofector® Kit V (program P-020;Lonza Group Ltd) and the vector (pCpGvitro-hygro, Invi-voGen) encoding either LacZ (empty vector) or the openreading frame (ORF) of BORIS. After 3 weeks of hygro-mycin selection (150 mg/l), several single-cell clones stablygrowing under antibiotic selection were selected and ana-lyzed by western blot for the presence of BORIS exogen-ous expression (data not shown). To knockdown BORISexpression, K562 cells were transfected using Cell LineNucleofector® Kit V (program T-016; Lonza Group Ltd)with either small interfering RNA (siRNA) control or withBORIS SMART pool siRNAs (Dharmacon, Inc.) or withZFNs, targeting the first coding exon of the BORIS gene.ZFNs targeting the BORIS gene were designed and vali-dated by CompoZr® Custom ZFN Service (Sigma-AldrichLife Science, St Louis, MO, USA). Capped ZFN mRNAs
Pugacheva et al. Genome Biology (2015) 16:161 Page 17 of 24
were produced from linearized plasmid DNA by in vitrotranscription with MessageMAX™ T7 ARCACapped Mes-sage Transcription Kit and purified by MEGAclear™ Kit(Sigma-Aldrich). The two ZFN mRNAs were combined inequal amounts for gene knockout and delivered to thecells by transfection. As a control we used a single ZFNmRNA. ZFNs were validated for genome editing activityby transient transfection into K562 cells and measurementvia the Surveyor Nuclease Assay for endogenous activity.Round spermatids were purified by centrifugal elutriation[72] followed by flow cytometry sorting of cells stainedwith Vybrant DyeCycle Green (Invitrogen, Carlsbad, CA,USA) to obtain cell fractions with high purity. Briefly,decapsulated testis were treated with collagenase followedby treatment with trypsin, and the dissociated cells wereused for centrifugal elutriation. Partially purified sper-matocytes and round spermatid fractions were incubatedwith 10 μM Vybrant DyeCycle Green for 30 min at 32 °Cfollowed by 4,6-diamidino-2-phenylindole (DAPI) stain-ing. Cells were then sorted on a FACSAria (Becton Dick-inson) to purify spermatocytes and round spermatids.DAPI-positive dead cells were eliminated. The purity ofcells was confirmed by flow cytometry analysis of DNAcontent. All animal experiments were performed at theNIH/Bethesda, in compliance with the guidelines of theInstitutional Animal Care and Use Committee of theNational Institute of Allergy and Infectious Diseases(NIAID).
ChIP sequencingFor ChIP-seq 108 asynchronously growing cells werecrosslinked with 1 % formaldehyde for 10 min at roomtemperature, followed by quenching with 125 mMglycine for 10 min, washed twice with 1× phosphatebuffered saline (PBS), and resuspended in chromatinimmunoprecipitation (ChIP) lysis buffer (150 mMNaCl, 1 % Triton X‐100, 0.1 % SDS, 20 mM Tris–HClpH8.0, 2 mM EDTA). Chromatin was sheared to anaverage length of 200–500 bp using a Bioruptor sonica-tor. After overnight incubation with DiaMag magneticbeads (Diagenode, Inc.) and CTCF or BORIS monoclo-nal or polyclonal antibodies (characterized and de-scribed by us [29, 32, 39]), precipitated chromatin wasthen washed, de-crosslinked, and digested with protein-ase K. The resulting DNA was purified using phenol/chloroform/isoamyl alcohol. DNA concentration wasassessed with a Quant‐it PicoGreen dsDNA kit (Invitro-gen) and 5–10 ng was used to generate sequencinglibraries. ChIP DNA was amplified using a TruSeq ChIPSample Preparation Kit (Illumina, Inc., USA). Briefly,the immunoprecipitated material was end-repaired, A-tailed, ligated to the sequencing adapters, amplified by15 cycles of PCR, and size selected (200–400 bp)
followed by single end sequencing on an IlluminaGenome Analyzer according to the manufacturer’srecommendations.
ChIP-Re-ChIPChromatin was prepared as for ChIP-seq as describedabove. First, chromatin was immunoprecipitated usingBORIS monoclonal antibodies, which were chemicallycrosslinked to magnetic beads using crosslinking buffer(0.2 M triethanolamine pH 8.2, 20 mM DMP), 30 min atroom temperature. After overnight incubation withcrosslinked antibodies, the chromatin was washed andeluted twice using elution buffer (0.1 M glycine-HClpH 2.5). Eluted chromatin was neutralized using 1 MTris (pH 8) and used for the second round of ChIP withCTCF monoclonal antibodies following the standardChIP protocol as described above. The sequencing li-braries were prepared as described above.
Bioinformatic analysis of ChIP-seq dataSequences generated by the Illumina genome analyzer(36 and 50 bp reads) were aligned against either the hu-man (build hg19) or mouse (build mm9) genome usingthe Bowtie program [73]. The alignment was performedwith default parameters except the sequence tags thatmapped to more than one location in the genome wereexcluded from the analysis using the –m1 option. Peakswere called using Model-based Analysis for ChIP-seq(MACS) [74] using default parameters. After MACS, weapplied the Peak Splitter algorithm (part of MACS) tocall sub-peaks and summits of peaks and improve peakresolution. The ChIP-seq data were visualized using theIntegrative Genomics Viewer (IGV) [75]. The peak over-laps between CTCF and BORIS ChIP-seq data sets weredetermined with BedTools Suite [76]. We defined peaksas overlapping if at least 1 bp of reciprocal peaks inter-sect (CTCF&BORIS); the remaining peaks were definedas non-overlapping (CTCF-only and BORIS-only). Thenormalized tag density profiles were generated using theBedTools coverage option from the BedTools Suite, nor-malized to the number of mapped reads, and plotted byMicrosoft Excel. The heatmaps were generated using theseqMINER 1.3.3 platform [77]. We used either k-meansranked or linear method for clustering normalization.The summits of either CTCF or BORIS peaks were ex-tended ±5 kb. seqMINER was also used to generate theaverage profiles of read density for different clusters.Position weight matrices for CTCF and BORIS boundregions were searched using Multiple EM for MotifElicitation (MEME) software [78]. The sequences underthe summit of either CTCF or BORIS peaks extended100 bp upstream and downstream were used for motifdiscovery. We ran MEME with parameters (−mod oops-revcomp -w 20) to identify 20-bp-long motifs considering
Pugacheva et al. Genome Biology (2015) 16:161 Page 18 of 24

both DNA strands. To analyze the occurrence of CTCFmotifs in the sequences occupied by either CTCF orBORIS or both proteins at the same time, we used FIMOsoftware (MEME suite) with default parameters. The pos-ition weight matrices found for CTCF binding regions byMEME were used for FIMO software. Each CTCF motifoccurrence had a p value < 0.0001 in the sequences of200 bp around the summit of either CTCF (CTCF-only,CTCF&BORIS bound regions) or BORIS (BORIS-onlybound regions) peaks. For evolutionary conservation ana-lysis, all pre-computed phastCons scores were obtainedfrom the University of California, Santa Cruz (UCSC) gen-ome browser [79]. Genomic distribution of CTCF andBORIS ChIP-seq peaks relative to reference genes wasperformed using the Cis-regulatory Element AnnotationSystem (CEAS) [80]. All ChIP-seq data have been depos-ited in the Gene Expression Omnibus (GEO) repositorywith the following accession number [GEO:GSE70764].
RNA-seq experimentsTwo platforms were used for RNA-seq: Illumina forMCF7 and Ion Torrent for K562. For Illumina sequen-cing, total RNA was extracted from cells using Trizol(Life Technologies) according to the protocol providedby the manufacturer. The RNA quality was assessedusing the Agilent Bioanalyzer 2100. The RNA sequen-cing library preparation and sequencing procedures werecarried out according to Illumina protocols with minormodifications. Briefly, poly(A)-mRNA was purified from10 μg of RNA with streptavidin-coated magnetic beads.After chemical fragmentation, mRNA fragments werereverse-transcribed and converted into double-strandedcDNA. Following end repair and A-tailing, paired-endadaptors were ligated to the ends of the DNA fragments.The ligated products were purified on 2 % agarose gels,and 200–250-bp fragments were selected for down-stream enrichment by 18 cycles of PCR followed bypurification using a QIAquick PCR purification kit (Qia-gen). The enriched libraries were diluted to a final con-centration of 5 nM. Each sample was subjected to50 cycles of sequencing from a single end in IlluminaHiseq2000 Sequencer. For Ion Torrent sequencing,rRNA-depleted RNA was prepared using the RiboMinusEukaryote System v2 kit (Life Technologies) accordingto the manufacturer's recommendations. rRNA-depletedRNA (500 ng) was used for library preparation using theIon Total RNA-seq v2 kit. The enriched libraries werediluted to a final concentration of 11 pM and subjectedto sequencing from a single end in a Ion ProtonSequencer.
Bioinformatic analysis of RNA-seq dataFor the Illumina libraries, FASTQ files were mapped tothe UCSC Human reference (build hg19) using TopHat2
with the default parameter setting of 20 alignments perread and up to two mismatches per alignment. For IonTorrent sequencing, FASTQ files were mapped to theUCSC Human reference (build hg19) using two-stepalignments. First, the reads were aligned with TopHat2.Second, the unmapped reads from the first step werethen extracted and aligned with Bowtie2 with –localmode and the –very-sensitive-local option. In both cases,Illumina and Ion Torrent, the resulting aligned reads(BAM files) were then analyzed with Cufflinks 2.0.0 toestimate transcript relative abundance using the UCSCreference annotated transcripts (build hg19). The ex-pression of each transcript was quantified as the numberof reads mapping to a transcript divided by the tran-script length in kilobases and the total number ofmapped reads in millions (FPKM). RNA-seq data havebeen deposited in the GEO repository with the followingaccession number [GEO:GSE70764].
Published next-generation experimentsENCODE data for K562 and GM12878 cell lines wereused in the study. The list of genomic coordinates foractive enhancers (17798) in K562 cells was obtainedby overlapping the two sets of ENCODE data[H3K27ac_K562, Bernstein (Broad Institute); p300_K562,Snyder (Stanford)]; overlapping regions that showed thehighest enrichment of ChIP-seq tag density of both datasets compared with input were selected. The list of superenhancers (742) was adopted from [41]. The list of activepromoters (17,656) was obtained by overlapping of TSSs(RefSeq genes, hg19) extended 2 kb upstream anddownstream with the two sets of ENCODE data[H3K4me3_K562, Bernstein (Broad Institute) andRNAPII_K562 Myers (Hudson Alpha)]; the regionspositive for both marks were selected.
Western blotting and immunoprecipitationProtein extracts were prepared by lysing K562 cells inRIPA Lysis buffer (Millipore) containing 50 mM Tris–HCl, pH 7.4, 1 % Nonidet P-40, 0.25 % sodium deoxy-cholate, 500 mM NaCl, 1 mM EDTA, 1× protease in-hibitor cocktail (Roche Applied Science). Forimmunoprecipitation analysis, 1.5 mg of total proteinwas incubated with BORIS monoclonal antibodies,CTCF monoclonal antibodies, or mouse IgG overnightat 4 °C with and without ethidium bromide (100 μg/μl),followed by incubation with 50 μl of Dynabeads M-280sheep anti-mouse IgG (Life Technologies) for 1 h atroom temperature. The immunoprecipitates were col-lected using a magnetic rack and washed five times withPBS and 0.1 % bovine serum albumin and dissolved insample buffer for SDS-PAGE. Immunoprecipitated sam-ples were resolved by SDS-PAGE, transferred to a PVDF
Pugacheva et al. Genome Biology (2015) 16:161 Page 19 of 24

membrane, and incubated with the indicated antibodies.Detections were performed using ECL reagents.
Electrophoretic mobility shift assayDNA fragments encompassing ~200-bp-long sequencesderived from either CTCF or BORIS ChIP-seq peakswere synthesized by PCR. The list of primers used in thestudy is in Additional file 13. In all cases, sequences ofPCR fragments were confirmed by sequencing. EMSAwas performed as previously described [39]. Briefly, PCRfragments were labeled using 32P-γ-ATP with T4 poly-nucleotide kinase (New England, Biolabs). Protein–DNAcomplexes were incubated for 1 h at room temperature inbinding buffer containing 25 mM Tris pH 7.4, 0.1 mMZnSO4, 5 mM MgCl2, 5 % Nonidet P-40 in PBS, 0.25 mMmercaptoethanol, 10 % glycerol and 0.5 μg of poly dI-dC.Protein–DNA complexes were separated from the un-bound probe using 5 % native polyacrylamide gels (PAAG)or 1.2 % agarose gels run in 0.5× Tris-borate-EDTA buffer.Full-length CTCF, full-length BORIS and CTCF 11 ZF do-main were translated in vitro using the TnT QuickCoupled Transcription/Translation System (Promega).Nuclear protein extracts were prepared as described in[81]. Pichia CTCF was obtained from AAVostrov [82].
In situ proximity ligation assayCells seeded on chamber slides (Nunc™ Lab-Tek™ IIChamber Slide™ System), were fixed in 4 % paraformalde-hyde for 10 min at 37 °C. Slides were then blocked in 3 %bovine serum albumin (Sigma) in a humidity chamber for1 h at 37 °C and incubated overnight at 4 °C with mouseand rabbit antibodies: custom monoclonal anti-BORISand rabbit anti-CTCF (D31H2) (Cell Signaling) in block-ing solution. After washing, the slides were incubated withDuolink PLA Rabbit MINUS and PLA Mouse PLUSprobes (Olink Bioscience). Ligation and detection wereperformed using the Duolink reagents kit (Olink Bio-science) according to the manufacturer’s protocol. Fluor-escence was detected using a Zeiss Plan Apochromatmicroscope with a ×63/oil objective. Images were acquiredwith an Axiocam MRm camera and Imaris software (Bit-plane, Co.). The original microscopic images were depos-ited to Zenodo [83] (10.5281/zenodo.21405).
Immunofluorescent cell stainingCells plated onto poly-L lysine coated glass cover slipswere fixed with 4 % paraformaldehyde, then washed withPBS. The cells were permeabilized with 0.1 % Triton X-100/PBS for 10 min and subsequently incubated withprimary antibodies (anti-CTCF rabbit polyclonal andanti-BORIS mouse monoclonal antibodies; Cell signal-ing, Inc., Customized). The cells were further probedwith fluorescein Texas Red and Alexa Fluor 488 taggedsecondary antibodies. DAPI was used for the nuclear
counterstain. The fluorescence was recorded using afluorescence microscope (Zeiss LSM 780). The originalmicroscopic images were deposited to Zenodo [83](10.5281/zenodo.21405).
RT-PCR and quantitative PCRTotal RNA was prepared using an RNeasy minikit (Qia-gen, Valencia, CA, USA). cDNA was prepared using theSuperScript III first-strand synthesis system (Invitro-gen) according to the manufacturer’s protocol. Quanti-tative PCR was performed using SYBR green PCRmaster mix (Applied Biosystems, Foster City, CA, USA)and the 7900HT sequence detection system (AppliedBiosystems). The primers used in the study are listed inAdditional file 13.
Additional files
Additional file 1: Fig. S1. CTCF and BORIS occupancy in human cancercell lines. a CTCF and BORIS expression in different cell types determinedby quantitative PCR. b Western blot depicts the relative levels of CTCFand BORIS proteins in nuclear lysates extracted from different cell types.c K562 and OVCAR8 cells immunostained with antibodies against CTCF(green) and BORIS (red). The merge panel shows co-localization of CTCFand BORIS proteins in the nucleus. d EMSA: either in vitro translatedCTCF (CTCF TNT) or BORIS (BORIS TNT) were incubated with 32P-labeledprobe. The first lane is a negative control, containing no protein (Free-F).The appearance of a shifted band (Super Shift) after adding specificantibodies demonstrated the specificity of DNA–protein interaction and theabsence of cross-reactivity between CTCF and BORIS antibodies. e, f Venndiagrams depict the numbers and percentages of CTCF (e) and BORIS (f)bound regions overlapping in K562, OVCAR8 and Delta47 cells. Heatmapshows BORIS (e) or CTCF (f) occupancy at the invariant CTCF (47,531) orBORIS (17,536) bound regions in three cancer cell types. The tag density wassubjected to k-means ranked clustering with two clusters expected. BORISbinds to roughly 30 % of invariant CTSes, while the remaining 70 % of CTSesbelong to CTCF-only binding regions. e Similar analysis revealed that nearly70 % of BORIS bound regions showed CTCF occupancy in all three cell lines.f Invariant BORIS-only regions mapped in K562 and Delta47 cells weregenerally occupied by CTCF in OVCAR8 cells (f), marked by bracket. g Venndiagram depicts the overlapping CTCF bound regions mapped in 38 humancell lines (ENCODE) with BORIS-only bound regions mapped in K562 cells.h ChIP-seq tracks show the genomic regions occupied by BORIS alonein K562 cells (BORIS-only) and by both CTCF and BORIS in OVCAR8 andDelta47 cells. (PPTX 1854 kb)
Additional file 2: Fig. S2. CTCF and BORIS bind to the same genomicregions simultaneously. a The distribution of peak intensity for CTCF(AllCTCF) and BORIS (AllBORIS) bound regions in the K562 cell line. Thepeak intensity (tag density) is shown for CTCF peaks that coincide withBORIS peaks (CTCF&BORIS), for BORIS peaks that coincide with CTCF peaks(BORIS&CTCF), and for CTCF-only and BORIS-only bound regions. Data areshown in logarithmic scale; ***p < 0.01. b Genome browser view of CTCFand BORIS occupancy in K562 and Delta47 cells in combination withChIP-Re-ChIP-seq data for K562 and Delta47 cells. The gray frames highlightCTCF-only, CTCF&BORIS, and BORIS-only bound regions. Only CTCF&BORISbound regions were detected in ChIP-Re-ChIP data. (PPTX 121 kb)
Additional file 3: Fig. S3. EMSA demonstrates the presence of twoCTCF binding sites inside BORIS bound regions (CTCF&BORIS and BORIS-only). a Top panels: ChIP-seq tracks show CTCF and BORIS occupanciesmapped in K562, Delta47 and NHDF cells. From left to right, TP53promoter represents CTCF&BORIS bound region; seven CTCF sitesresiding in the H19-IGF2 imprinting control region are examples of CTCF-only bound regions; the BMI promoter represents a BORIS-only boundregion; the PROB1 exon illustrates that a BORIS-only bound region
Pugacheva et al. Genome Biology (2015) 16:161 Page 20 of 24

mapped in K562 cells is a CTCF&BORIS bound region in Delta47 cells.Bottom panels: binding of in vitro translated 11 ZF domain of CTCF(11ZF), full-length CTCF (CTCF) and full-length BORIS (BORIS) proteins tothe TP53 promoter, one of seven CTCF sites in the H19-IGF2 imprintingcontrol region (fourth CTCF binding site), BMI promoter, and PROB1 exon.In vitro translated luciferase protein was used as a negative control (Luc).The DNA complexes with 11 ZF domain, CTCF, and BORIS proteins areindicated by black, red and blue arrows, respectively. The single anddouble shifts with 11 ZF domain are shown by single and double blackarrows, respectively. The genomic coordinates (hg19) of DNA probes areindicated at the bottom of the gels. b, c Five examples of CTCF-only (b)and BORIS-only (c) bound regions. Upper panel: ChIP-seq tracks showCTCF and BORIS occupancies at ten genomic regions mapped in K562,OVCAR8, and Delta47 cells. Lower panel: EMSA with the genomic sequencesshown on the upper panel. In vitro translated 11ZF domain of CTCF (11ZF),full-length CTCF (CTCF) and BORIS (BORIS) proteins were incubated with thecorresponding CTCF-only and BORIS-only bound regions. The single anddouble shifts with 11 ZF domain are shown by single and double blackarrows, respectively. (PPTX 353 kb)
Additional file 4: Fig. S4. CTCF&BORIS bound regions enclose at leasttwo CTCF binding motifs. a The motifs identified by MEME for CTCF-only,CTCF&BORIS and BORIS-only bound regions in K562 cells. Additionally,the presence of the CTCF motif was confirmed in 70 % of BORIS-onlybound regions. b, c The alignment of human and mouse sequencesrepresenting five CTCF&BORIS bound regions (b) and two CTCF-onlybound regions (c). The summits of CTCF and BORIS peaks are highlightedby red and blue nucleotides, respectively. The CTCF motif is shown in bolditalics and underlined. The CTCF motif is indicated with black and bluecolors, depending on sense and antisense orientation, respectively. d, eNumber of CTCF motifs in the genomic regions, encircling 100 bp upstreamand downstream of the summit of CTCF peaks at CTCF&BORIS boundregions (d) and from the summit of CTCF-only peaks (e). The histogramshows the percentage of CTCF binding regions (y-axis) containing 0 to 7CTCF motifs (x-axis). f The distribution of distances between two CTCFmotifs at 1-bp resolution (x-axis) at CTCF&BORIS bound regions (y-axis). TheCTCF&BORIS bound regions that have only two CTCF motifs under thepeaks were selected for the analysis. (PPTX 3766 kb)
Additional file 5: Fig. S5. CTCF&BORIS bound regions enclose at leasttwo CTCF binding sites. a Genome browser view of CTCF and BORISoccupancy at seven CTCF&BORIS (blue bracket) and seven CTCF-only (redbracket) bound regions in K562 and Delta47 cells. Top panel: at the top ofthe genome browser view, the names of sequences are highlighted byblack or red colors, which represent at least two or one CTCF motifs underthe peaks, respectively. Lower panel: EMSA with the correspondingCTCF&BORIS and CTCF-only binding regions. The ~200-bp 32P-labeledprobes were incubated with either in vitro translated luciferase (−) orwith 11 ZF CTCF domain (11ZFs). The slower (shown by arrow with twored dots) and faster (arrow with one red dot) migrating shifted bandscorrespond to double and single occupancy, respectively. Of note, theCTCF&BORIS bound regions enclosing one CTCF motif (gene/chromosomename in red) are showed double occupancy, similar to CTCF&BORIS boundregions enclosing two CTCF motifs (black), while all CTCF-only boundregions showed single occupancy. b Three CTCF&BORIS bound regions(TP53, IRF2BP1 and chr17 intergenic regions), each enclosing two CTCFmotifs, were split into two fragments and subjected to EMSA. Theseparation of CTCF motifs resulted in single occupancy of each fragmentwith one CTCF motif, confirming the presence of two CTCF binding sites ineach sequence. c 200-bp 32P-labeled probes representing KDM3B, FOXA3,and TP53 promoters were incubated with nuclear extracts from either K562or NHDF cells. All lanes contained the indicated nuclear extract, except thefirst lane for K562, where only free probe is present (F). Nuclear extracts andprobe were also incubated with either control mouse IgG (−) or antibodiesagainst CTCF or BORIS. The red and blue arrows point to the super-shiftbands corresponding to CTCF–DNA and BORIS–DNA complexes,respectively. (PPTX 215 kb)
Additional file 6: Fig. S6. Comparison of DNaseI digital genomicfootprinting (DGF) and phastConss46 conservation score at 2xCTSes and1xCTSes. a Heatmaps show DNaseI cleavage density mapped in K562 andNHDF cells at 2xCTSes. 2xCTSes (CTCF&BORIS bound regions in K562 cells)
were sorted into 12 different groups (1000 genomic regions in each group)depending on the distance between two CTCF motifs. The distance isshown by double arrows and the number of base pairs between two CTCFmotifs. The same genomic coordinates were used to plot DNaseI cleavagedensity mapped in K562 and NHDF cells and for the analysis of averagephastCons46 conservation score (shown in the middle). The schematicpresentation of 2xCTSes with two CTCF motifs (red boxes) under one ChIP-seq peak and the proposed occupancy of 2xCTSes by CTCF (red circle) andBORIS (blue circle) in K562 and NHDF cells are shown at the top of panels.The two CTCF motifs were not sorted based on plus or minus strand. Thetag density data were collected within a 400-bp window around thefirst (left) 20-bp CTCF core motifs (0) under a single CTCF ChIP-seq peak.b Heatmap shows DNaseI cleavage density mapped in K562 cells at1xCTSes with CTCF motif on minus (upper panel) and plus (lower panel)strands. The average phastCons conservation score at the same regionsas in DNAseI panels is shown below. c, d Heatmaps show DNaseI cleavagedensity mapped in K562 cells at 2xCTSes. 2xCTSes were separated into twogroups with both CTCF motifs located on the plus strand (c) or minusstrand (d). The distance between two CTCF motifs varies from 10 (bottom)to 100 bp (top). (PPTX 1337 kb)
Additional file 7: Fig. S7. Epigenetic profile of two classes of CTCFbinding regions in BORIS-positive cells (K562). a Heatmaps demonstratethe association of CTCF&BORIS bound regions with active promoters(H3K4me3 and RNAPII, ENCODE) and enhancers (H3K27ac, ENCODE)mapped in K562 cells. The tag density was subjected to k-means rankedclustering with five clusters expected. b Genome browser view of twoexamples of Super Enhancers mapped in K562 cells. H3K27ac and p300tracks were adopted from ENCODE. c Scatter plots show the overlappingof CTCF-only and CTCF&BORIS bound regions (left panel) and BORIS-onlyand CTCF&BORIS bound regions (right panel) with ChIP-seq data availablefor K562 cells by ENCODE. The dots represent the percentage of CTCF-only,BORIS-only (x-axis), and CTCF&BORIS (y-axis) bound regions overlapping witheach factor mapped by ChIP-seq in K562 cells. The red dots are labeled withthe name of the factor mapped by ChIP-seq. d The percentage of BORIS-only, CTCF&BORIS and CTCF-only bound regions (y-axis) overlapping witheach factor (x-axis). e Heatmap demonstrates the enrichment of RNAPII,CAGEs, H3K4me3, H2AZ, H3K27ac, ZNF143, and SMC3 ChIP-seq data(ENCODE data) at CTCF&BORIS bound regions in contrast to CTCF-onlybound regions. The tag density of ChIP-seq data was collected within a10-kb window around the summit of CTCF peaks mapped in K562 cells.The collected data were subjected to k-means clustering using linearnormalization. f Average tag density (tags/10 million) of multiple factorsmapped by ChIP-seq in K562 cells (ENCODE data) across BORIS-only(blue), CTCF-only (red) and CTCF&BORIS (purple) bound regions mappedin K562 cells. The names of factors used in ChIP-seq are labeled on thetop of the each plot. g Histogram shows the genomic distribution ofCTCF and BORIS occupancy at promoters plus the 5’ UTR (3 kb up- anddownstream of TSSs), gene bodies, and intergenic regions. (PPTX 680 kb)
Additional file 8: Fig. S8. Epigenetic profile of two classes of CTCFbinding regions in BORIS-negative cells (GM12878). a Average tag density(tags/10 million) of CTCF, RNAPII, DNaseI digestion, H3K4me3, H3K27ac,and RAD21 (mapped by ChIP-seq in GM12878 cells, ENCODE data) at2xCTSes (blue) and 1xCTSes (red). The data were normalized to thenumber of mapped reads and binding regions. b Upper panel: scatterplot shows overlapping of 2xCTSes (y-axis) and 1xCTSes (x-axis) withmultiple ENCODE data available for GM12878. Similar to CTCF&BORIS andCTCF-only bound regions in K562 (Fig. S7c, left panel in Additional file 7),no correlation (R2 = 0.41) was found between 2xCTSes and 1xCTSes withrespect to co-occupancy with the majority of transcription factors, histonemodifications, and chromatin remodeling factors. Middle panel: scatter plotshows an overlapping of 1xCTSes mapped in K562 (y-axis) and in GM12878cells (x-axis) with ENCODE data for K562 and GM12878 cells, respectively.1xCTSes of GM12878 and K562 cells were correlated with each other(R2 = 0.98) with respect to co-occupancy with the majority of ENCODEdata common for the two cell lines. Lower panel: scatter plot shows theoverlapping of 2xCTSes in K562 (y-axis) and in GM12878 (x-axis) with ENCODEdata for K562 and GM12878 cells (R2 = 0.93), respectively. (PPTX 220 kb)
Additional file 9: Fig. S9. BORIS occupancy in cancer cells recapitulatesthe BORIS occupancy in germ cells. a Average tag density of CTCF (red)
Pugacheva et al. Genome Biology (2015) 16:161 Page 21 of 24

and BORIS (blue) occupancies mapped in OVCAR8 and Delta47 cellsacross the conserved mouse binding regions (upper panel). b Gene tracksrepresenting the examples of conserved BORIS-only, CTCF-only andCTCF&BORIS bound regions in germline (round spermatids) and cancercells (K562). (PPTX 104 kb)
Additional file 10: Fig. S10. BORIS is involved in transcriptionalprogram of cancers. a The sequence recognized by ZFN and cleaved byFok I is shown by black and red letters, respectively. b Surveyor assay (CEL-I)for ZFN-induced mutations in the BORIS gene. The proportions of wild-typeand mutant alleles are shown as a table at the bottom of the gel. c Surveyorassay shows ten single-cell clones with the mutated BORIS locus. d Westernblot shows the level of BORIS protein in wild type (wt) and ten mutantclones from panel (c). e K562 cells transfected with ZFN produced at leastten times less colonies in soft agar compared with control. f Westernblot shows the level of BORIS protein in K562 before (0) and afterphorbol 12-myristate 13-acetate (PMA) treatment. Wright–Giemsastaining analysis of K562 transfected with either control vector or ZFNin comparison with K562 treated with PMA for 3 days. Both transfectionof K562 with ZFN and treatment with PMA showed morphologicchanges related to megakaryocytic differentiation. h Upper panel: ChIP-seqand RNA-seq tracks show CTCF and BORIS occupancy at the WISP2 geneand dowregulation of WISP2 expression upon BORIS induction in MCF7 cells.Lower panel: RNA-seq RPKM values for the WISP2 gene expression. iDownregulation of inflammatory response pathway in response tostable BORIS expression in MCF7 cells. k ChIP-seq tracks show CTCFand BORIS occupancy at GAL3ST1, FOXA3, and PRAME loci in NHDF,OVCAR8, Delta47, and K562 cells. The tracks are labeled with themolecules against which antibodies were directed and cell lines usedin ChIP-seq. RNA-Seq tracks demonstrate gene expression in BORIS-positivecells (K562) in contrast to BORIS-negative cells (NHEK and NHDF). lQuantitative PCR analysis of GAL3ST1, FOXA3, and PRAME gene expression inBORIS-positive cells (Testes, K562, OVCAR8, Delta47) and BORIS-negative cells(GM12878, NHDF, NHEK). (PPTX 1328 kb)
Additional file 11: Table S1. Pathways altered with BORISdownregulation in K562 cells. Table S2 Functional annotation of genesthat changed transcription upon BORIS downregulation in K562 cells.Table S3 The top diseases and functions enriched for the genes thatchanged transcription upon BORIS downregulation in K562 cells. TableS4 Pathways altered with BORIS induction in MCF7 cells. Table S5Functional annotation of genes that changed transcription upon BORISinduction in MCF7 cells (Clone1). Table S6 The top diseases andfunctions enriched for the genes that changed transcription upon BORISinduction in MCF7 cells (Clone1). Table S7 Comparison of functionalannotation of genes that changed transcription upon BORIS depletion(K562) and BORIS induction (MCF7, Clone1). Table S8 Comparison ofcanonical pathways that altered upon BORIS depletion (K562) and BORISinduction (MCF7, Clone1). (XLSX 257 kb)
Additional file 12: Fig. S11. CTCF and BORIS bound regions enriched atthe anchors of cell-type specific transcriptional loops in K562 cells comparedwith MCF7 cells. a Heatmap shows the enrichment of BORIS, CTCF, and RNAPIIoccupancy in K562 cells at the left and right anchors of K562-specificloops. b Heatmap shows the enrichment of CTCF and RNAPII occupancyin MCF7 cells at the anchors of K562-specific loops, but the interactionsmediated by CTCF were different in MCF7 cells compared with K562 cells.c Genomic view of K562-specific long-range chromatin interactions atthe COMMD7-DNMT3B-MAPRE1 locus. The tracks are labeled with themolecules against which antibodies were directed in ChIP-seq in bothK562 and MCF7 cells. ChIA-PET data are presented as red lines with boldanchors and summarized by brackets on the top of the gene tracks. d Modelof cluster and single CTCF binding classes and their modulation by BORIS inBORIS-positive cells. The model is based on ChIP-seq and ChIA-PET data forK562 and MCF7 cells at the DNMT3B locus (c), but also observed in TP53,FOXA3, PRAME, KDM3B, MDM2, BBC3 and other loci. (PPTX 209 kb)
Additional file 13: Table S9 The primers used in the study foramplification of EMSA probes and for quantitative PCR. (DOCX 17 kb)
AbbreviationsBORIS: Brother of the regulator of imprinted sites; bp: base pair;ChIP: chromatin immunoprecipitation; CTCF: CCCTC-binding factor; CTS: CTCF
target site; DAPI: 4′,6-diamidino-2-phenylindole; EMSA: electrophoretic mobilityshift assay; GEO: Gene Expression Omnibus; ISPLA: in situ proximity ligationassay; MACS: Model-based Analysis for ChIP-seq; MIA: methylation interferenceassay; NHDF: normal human dermal fibroblast; PBS: phosphate buffered saline;PCR: polymerase chain reaction; RNAPII: RNA polymerase II; TSS: transcriptionstart site; UCSC: University of California, Santa Cruz; UTR: untranslated region;ZF: zinc finger; ZFN: zinc finger nuclease.
Competing interestsThe authors declare that they have no competing interests.
Authors’ contributionsConceived and designed the experiments: EP, SRH, DL, and VL. Performedthe experiments: EP, SRH, CM-C, SK, TS, NK-S, and SR. Analyzed the data: EP,SRH, CM-C, DL, and VL. Contributed reagents/materials/sequencing/analysistools: CE, VN, ZY AB, JEJR, and BR. Wrote the paper: EP, SRH, AS, DL, BR, andVL. All authors read and approved the final manuscript.
AcknowledgementsThis work was supported by the Intramural Research Program of theNational Institute of Allergy and Infectious Diseases, National Institutes ofHealth. Work in the BR lab was supported by funds from the LudwigInstitute for Cancer Research, the California Institute of RegenerativeMedicine (RN2-00905) and US National Institutes of Health (P50 GM085764-03and U01 ES017166). The work of CAE was supported by training grant NIH/NCIT32 CA009523-27S1. The work of AVS was supported by the 1000 TalentsAward from the PRC. JEJR acknowledges generous funding from the CancerCouncil NSW (RG11-12; RG14-05; RG14-09), Tour de Cure and Cure the Future(Cell and Gene Trust). This study used the Office of Cyber Infrastructure andComputational Biology (OCICB) High Performance Computing (HPC) cluster atthe National Institute of Allergy and Infectious Diseases (NIAID), Bethesda, MD.This work utilized the high-performance computational capabilities of theBiowulf Linux cluster at the National Institutes of Health, Bethesda, MD.
Author details1Molecular Pathology Section, Laboratory of Immunogenetics, NationalInstitute of Allergy and Infectious Diseases, National Institutes of Health,Rockville, MD 20852, USA. 2Ludwig Institute for Cancer Research, 9500Gilman Drive, La Jolla, CA 92093, USA. 3Department of Cellular and MolecularMedicine, Institute of Genomic Medicine, Moores Cancer Center, San DiegoSchool of Medicine, University of California, San Diego, La Jolla, CA 92093,USA. 4Bioinformatics and Computational Biosciences Branch, Office of CyberInfrastructure and Computational Biology, National Institute of Allergy andInfectious Diseases, National Institutes of Health, Bethesda, MD 20892, USA.5Stem Cell Project, Tokyo Metropolitan Institute of Medical Science,Kamikitazawa, Setagaya-ku, Tokyo, Japan. 6Guangzhou Institutes ofBiomedicine and Health, Molecular Epigenetics Laboratory, 190 Kai YuanAvenue, Science Park, Guangzhou 510530, China. 7Gene and Stem CellTherapy Program, Centenary Institute, Camperdown, NSW 2050, Australia.8Sydney Medical School, University of Sydney, Sydney, NSW 2006, Australia.9Cell and Molecular Therapies, Royal Prince Alfred Hospital, Camperdown,NSW 2050, Australia.
Received: 1 July 2015 Accepted: 31 July 2015
References1. Phillips JE, Corces VG. CTCF: master weaver of the genome. Cell.
2009;137:1194–211.2. Sanyal A, Lajoie BR, Jain G, Dekker J. The long-range interaction landscape
of gene promoters. Nature. 2012;489:109–13.3. Rasko JE, Klenova EM, Leon J, Filippova GN, Loukinov DI, Vatolin S, et al. Cell
growth inhibition by the multifunctional multivalent zinc-finger factor CTCF.Cancer Res. 2001;61:6002–7.
4. Lobanenkov VV, Nicolas RH, Adler VV, Paterson H, Klenova EM, PolotskajaAV, et al. A novel sequence-specific DNA binding protein which interactswith three regularly spaced direct repeats of the CCCTC-motif in the5’-flanking sequence of the chicken c-myc gene. Oncogene. 1990;5:1743–53.
5. Kanduri C, Pant V, Loukinov D, Pugacheva E, Qi CF, Wolffe A, et al. Functionalassociation of CTCF with the insulator upstream of the H19 gene is parent oforigin-specific and methylation-sensitive. Curr Biol. 2000;10:853–6.
Pugacheva et al. Genome Biology (2015) 16:161 Page 22 of 24

6. Filippova GN, Thienes CP, Penn BH, Cho DH, Hu YJ, Moore JM, et al. CTCF-binding sites flank CTG/CAG repeats and form a methylation-sensitiveinsulator at the DM1 locus. Nat Genet. 2001;28:335–43.
7. Dixon JR, Selvaraj S, Yue F, Kim A, Li Y, Shen Y, et al. Topological domains inmammalian genomes identified by analysis of chromatin interactions.Nature. 2012;485:376–80.
8. Cuddapah S, Jothi R, Schones DE, Roh TY, Cui K, Zhao K. Global analysis ofthe insulator binding protein CTCF in chromatin barrier regions revealsdemarcation of active and repressive domains. Genome Res. 2009;19:24–32.
9. Chao W, Huynh KD, Spencer RJ, Davidow LS, Lee JT. CTCF, a candidatetrans-acting factor for X-inactivation choice. Science. 2002;295:345–7.
10. Bell AC, West AG, Felsenfeld G. The protein CTCF is required for theenhancer blocking activity of vertebrate insulators. Cell. 1999;98:387–96.
11. Baniahmad A, Steiner C, Kohne AC, Renkawitz R. Modular structure of achicken lysozyme silencer: involvement of an unusual thyroid hormonereceptor binding site. Cell. 1990;61:505–14.
12. Ohlsson R, Renkawitz R, Lobanenkov V. CTCF is a uniquely versatiletranscription regulator linked to epigenetics and disease. Trends Genet.2001;17:520–7.
13. Ohlsson R, Lobanenkov V, Klenova E. Does CTCF mediate between nuclearorganization and gene expression? Bioessays. 2010;32:37–50.
14. Kim TH, Abdullaev ZK, Smith AD, Ching KA, Loukinov DI, Green RD, et al.Analysis of the vertebrate insulator protein CTCF-binding sites in the humangenome. Cell. 2007;128:1231–45.
15. Barski A, Cuddapah S, Cui K, Roh TY, Schones DE, Wang Z, et al.High-resolution profiling of histone methylations in the human genome.Cell. 2007;129:823–37.
16. Smith ST, Wickramasinghe P, Olson A, Loukinov D, Lin L, Deng J, et al.Genome wide ChIP-chip analyses reveal important roles for CTCF inDrosophila genome organization. Dev Biol. 2009;328:518–28.
17. Shen Y, Yue F, McCleary DF, Ye Z, Edsall L, Kuan S, et al. A map of thecis-regulatory sequences in the mouse genome. Nature. 2012;488:116–20.
18. Wang H, Maurano MT, Qu H, Varley KE, Gertz J, Pauli F, et al. Widespreadplasticity in CTCF occupancy linked to DNA methylation. Genome Res.2012;22:1680–8.
19. Handoko L, Xu H, Li G, Ngan CY, Chew E, SchnappM, et al. CTCF-mediatedfunctional chromatin interactome in pluripotent cells. Nat Genet. 2011;43:630–8.
20. Hawkins RD, Hon GC, Yang C, Antosiewicz-Bourget JE, Lee LK, Ngo QM, etal. Dynamic chromatin states in human ES cells reveal potential regulatorysequences and genes involved in pluripotency. Cell Res. 2011;21:1393–409.
21. Pant V, Kurukuti S, Pugacheva E, Shamsuddin S, Mariano P, Renkawitz R, etal. Mutation of a single CTCF target site within the H19 imprinting controlregion leads to loss of Igf2 imprinting and complex patterns of de novomethylation upon maternal inheritance. Mol Cell Biol. 2004;24:3497–504.
22. Phillips-Cremins JE, Sauria ME, Sanyal A, Gerasimova TI, Lajoie BR, Bell JS,et al. Architectural protein subclasses shape 3D organization of genomesduring lineage commitment. Cell. 2013;153:1281–95.
23. Dowen JM, Fan ZP, Hnisz D, Ren G, Abraham BJ, Zhang LN, et al. Control ofcell identity genes occurs in insulated neighborhoods in mammalianchromosomes. Cell. 2014;159:374–87.
24. Han L, Lee DH, Szabo PE. CTCF is the master organizer of domain-wideallele-specific chromatin at the H19/Igf2 imprinted region. Mol Cell Biol.2008;28:1124–35.
25. Guo C, Yoon HS, Franklin A, Jain S, Ebert A, Cheng HL, et al. CTCF-bindingelements mediate control of V(D)J recombination. Nature. 2011;477:424–30.
26. Majumder P, Boss JM. CTCF controls expression and chromatin architectureof the human major histocompatibility complex class II locus. Mol Cell Biol.2010;30:4211–23.
27. Loukinov DI, Pugacheva E, Vatolin S, Pack SD, Moon H, Chernukhin I, et al.BORIS, a novel male germ-line-specific protein associated with epigeneticreprogramming events, shares the same 11-zinc-finger domain with CTCF,the insulator protein involved in reading imprinting marks in the soma. ProcNatl Acad Sci U S A. 2002;99:6806–11.
28. Hore TA, Deakin JE, Marshall Graves JA. The evolution of epigenetic regulatorsCTCF and BORIS/CTCFL in amniotes. PLoS Genet. 2008;4, e1000169.
29. Suzuki T, Kosaka-Suzuki N, Pack S, Shin DM, Yoon J, Abdullaev Z, et al.Expression of a testis-specific form of Gal3st1 (CST), a gene essential forspermatogenesis, is regulated by the CTCF paralogous gene BORIS. Mol CellBiol. 2010;30:2473–84.
30. Sleutels F, Soochit W, Bartkuhn M, Heath H, Dienstbach S, Bergmaier P, et al.The male germ cell gene regulator CTCFL is functionally different from
CTCF and binds CTCF-like consensus sites in a nucleosome composition-dependent manner. Epigenetics Chromatin. 2012;5:8.
31. Pugacheva EM, Suzuki T, Pack SD, Kosaka-Suzuki N, Yoon J, Vostrov AA, et al.The structural complexity of the human BORIS gene in gametogenesis andcancer. PLoS One. 2010;5, e13872.
32. Kosaka-Suzuki N, Suzuki T, Pugacheva EM, Vostrov AA, Morse 3rd HC,Loukinov D, et al. Transcription factor BORIS (Brother of the Regulator ofImprinted Sites) directly induces expression of a cancer-testis antigen,TSP50, through regulated binding of BORIS to the promoter. J Biol Chem.2011;286:27378–88.
33. Simpson AJ, Caballero OL, Jungbluth A, Chen YT, Old LJ. Cancer/testisantigens, gametogenesis and cancer. Nat Rev Cancer. 2005;5:615–25.
34. Renaud S, Pugacheva EM, Delgado MD, Braunschweig R, Abdullaev Z,Loukinov D, et al. Expression of the CTCF-paralogous cancer-testis gene,brother of the regulator of imprinted sites (BORIS), is regulated by threealternative promoters modulated by CpG methylation and by CTCF andp53 transcription factors. Nucleic Acids Res. 2007;35:7372–88.
35. Martin-Kleiner I. BORIS inhumancancers– a review. Eur JCancer. 2012;48:929–35.36. de Necochea-Campion R, Ghochikyan A, Josephs SF, Zacharias S, Woods E,
Karimi-Busheri F, et al. Expression of the epigenetic factor BORIS (CTCFL) inthe human genome. J Transl Med. 2011;9:213.
37. Moore JM, Rabaia NA, Smith LE, Fagerlie S, Gurley K, Loukinov D, et al. Lossof maternal CTCF is associated with peri-implantation lethality of Ctcf nullembryos. PLoS One. 2012;7, e34915.
38. Klenova EM, Morse 3rd HC, Ohlsson R, Lobanenkov VV. The novelBORIS + CTCF gene family is uniquely involved in the epigenetics ofnormal biology and cancer. Semin Cancer Biol. 2002;12:399–414.
39. Pugacheva EM, Tiwari VK, Abdullaev Z, Vostrov AA, Flanagan PT, QuitschkeWW, et al. Familial cases of point mutations in the XIST promoter reveal acorrelation between CTCF binding and pre-emptive choices of Xchromosome inactivation. Hum Mol Genet. 2005;14:953–65.
40. Gomes AL, Abeel T, Peterson M, Azizi E, Lyubetskaya A, Carvalho L, et al.Decoding ChIP-seq with a double-binding signal refines binding peaks tosingle-nucleotides and predicts cooperative interaction. Genome Res.2014;24:1686–97.
41. Hnisz D, Abraham BJ, Lee TI, Lau A, Saint-Andre V, Sigova AA, et al. Super-enhancers in the control of cell identity and disease. Cell. 2013;155:934–47.
42. Lozzio BB, Lozzio CB, Bamberger EG, Feliu AS. A multipotential leukemia cellline (K-562) of human origin. Proc Soc Exp Biol Med. 1981;166:546–50.
43. Ferrand N, Gnanapragasam A, Dorothee G, Redeuilh G, Larsen AK, SabbahM. Loss of WISP2/CCN5 in estrogen-dependent MCF7 human breast cancercells promotes a stem-like cell phenotype. PLoS One. 2014;9, e87878.
44. Li G, Ruan X, Auerbach RK, Sandhu KS, Zheng M, Wang P, et al. Extensivepromoter-centered chromatin interactions provide a topological basis fortranscription regulation. Cell. 2012;148:84–98.
45. Saida M, Iles D, Elnefati A, Brinkworth M, Miller D. Key gene regulatorysequences with distinctive ontological signatures associate withdifferentially endonuclease-accessible mouse sperm chromatin.Reproduction. 2011;142:73–86.
46. Carone BR, Hung JH, Hainer SJ, Chou MT, Carone DM, Weng Z, et al.High-resolution mapping of chromatin packaging in mouse embryonicstem cells and sperm. Dev Cell. 2014;30:11–22.
47. Arpanahi A, Brinkworth M, Iles D, Krawetz SA, Paradowska A, Platts AE, et al.Endonuclease-sensitive regions of human spermatozoal chromatin arehighly enriched in promoter and CTCF binding sequences. Genome Res.2009;19:1338–49.
48. Brykczynska U, Hisano M, Erkek S, Ramos L, Oakeley EJ, Roloff TC, et al.Repressive and active histone methylation mark distinct promoters inhuman and mouse spermatozoa. Nat Struct Mol Biol. 2010;17:679–87.
49. Hammoud SS, Nix DA, Zhang H, Purwar J, Carrell DT, Cairns BR. Distinctivechromatin in human sperm packages genes for embryo development.Nature. 2009;460:473–8.
50. Erkek S, Hisano M, Liang CY, Gill M, Murr R, Dieker J, et al. Moleculardeterminants of nucleosome retention at CpG-rich sequences in mousespermatozoa. Nat Struct Mol Biol. 2013;20:868–75.
51. Moon H, Filippova G, Loukinov D, Pugacheva E, Chen Q, Smith ST, et al.CTCF is conserved from Drosophila to humans and confers enhancerblocking of the Fab-8 insulator. EMBO Rep. 2005;6:165–70.
52. Fitzpatrick GV, Pugacheva EM, Shin JY, Abdullaev Z, Yang Y, Khatod K, et al.Allele-specific binding of CTCF to the multipartite imprinting control regionKvDMR1. Mol Cell Biol. 2007;27:2636–47.
Pugacheva et al. Genome Biology (2015) 16:161 Page 23 of 24

53. Mendez-Catala CF, Gretton S, Vostrov A, Pugacheva E, Farrar D, Ito Y, et al.A novel mechanism for CTCF in the epigenetic regulation of Bax in breastcancer cells. Neoplasia. 2013;15:898–912.
54. Garrett FE, Emelyanov AV, Sepulveda MA, Flanagan P, Volpi S, Li F, et al.Chromatin architecture near a potential 3′ end of the igh locus involvesmodular regulation of histone modifications during B-Cell development andin vivo occupancy at CTCF sites. Mol Cell Biol. 2005;25:1511–25.
55. Hong JA, Kang Y, Abdullaev Z, Flanagan PT, Pack SD, Fischette MR, et al.Reciprocal binding of CTCF and BORIS to the NY-ESO-1 promoter coincideswith derepression of this cancer-testis gene in lung cancer cells. Cancer Res.2005;65:7763–74.
56. Nakahashi H, Kwon KR, Resch W, Vian L, Dose M, Stavreva D, et al. Agenome-wide map of CTCF multivalency redefines the CTCF code. Cell Rep.2013;3:1678–89.
57. Lee BK, Bhinge AA, Battenhouse A, McDaniell RM, Liu Z, Song L, et al.Cell-type specific and combinatorial usage of diverse transcription factorsrevealed by genome-wide binding studies in multiple human cells.Genome Res. 2012;22:9–24.
58. Lutz M, Burke LJ, LeFevre P, Myers FA, Thorne AW, Crane-Robinson C, et al.Thyroid hormone-regulated enhancer blocking: cooperation of CTCF andthyroid hormone receptor. EMBO J. 2003;22:1579–87.
59. Defossez PA, Kelly KF, Filion GJ, Perez-Torrado R, Magdinier F, Menoni H,et al. The human enhancer blocker CTC-binding factor interacts with thetranscription factor Kaiso. J Biol Chem. 2005;280:43017–23.
60. Wendt KS, Yoshida K, Itoh T, Bando M, Koch B, Schirghuber E, et al. Cohesinmediates transcriptional insulation by CCCTC-binding factor. Nature.2008;451:796–801.
61. Majumder P, Gomez JA, Chadwick BP, Boss JM. The insulator factor CTCFcontrols MHC class II gene expression and is required for the formation oflong-distance chromatin interactions. J Exp Med. 2008;205:785–98.
62. Chernukhin IV, Shamsuddin S, Robinson AF, Carne AF, Paul A, El-Kady AI, etal. Physical and functional interaction between two pluripotent proteins, theY-box DNA/RNA-binding factor, YB-1, and the multivalent zinc finger factor,CTCF. J Biol Chem. 2000;275:29915–21.
63. Liu Z, Scannell DR, Eisen MB, Tjian R. Control of embryonic stem cell lineagecommitment by core promoter factor, TAF3. Cell. 2011;146:720–31.
64. Jones TA, Ogunkolade BW, Szary J, Aarum J, Mumin MA, Patel S, et al.Widespread Expression of BORIS/CTCFL in Normal and Cancer Cells. PLoSOne. 2011;6, e22399.
65. Wykes SM, Krawetz SA. The structural organization of sperm chromatin.J Biol Chem. 2003;278:29471–7.
66. Pittoggi C, Renzi L, Zaccagnini G, Cimini D, Degrassi F, Giordano R, et al. Afraction of mouse sperm chromatin is organized in nucleosomalhypersensitive domains enriched in retroposon DNA. J Cell Sci.1999;112:3537–48.
67. Gatewood JM, Cook GR, Balhorn R, Bradbury EM, Schmid CW. Sequence-specificpackaging of DNA in human sperm chromatin. Science. 1987;236:962–4.
68. Gardiner-Garden M, Ballesteros M, Gordon M, Tam PP. Histone- andprotamine-DNA association: conservation of different patterns within thebeta-globin domain in human sperm. Mol Cell Biol. 1998;18:3350–6.
69. Balhorn R, Gledhill BL, Wyrobek AJ. Mouse sperm chromatin proteins:quantitative isolation and partial characterization. Biochemistry.1977;16:4074–80.
70. Tang JB, Chen YH. Identification of a tyrosine-phosphorylated CCCTC-binding nuclear factor in capacitated mouse spermatozoa. Proteomics.2006;6:4800–7.
71. Montellier E, Boussouar F, Rousseaux S, Zhang K, Buchou T, Fenaille F, et al.Chromatin-to-nucleoprotamine transition is controlled by the histone H2Bvariant TH2B. Genes Dev. 2013;27:1680–92.
72. Meistrich ML. Separation of spermatogenic cells and nuclei from rodenttestes. Methods Cell Biol. 1977;15:15–54.
73. Langmead B, Trapnell C, Pop M, Salzberg SL. Ultrafast and memory-efficientalignment of short DNA sequences to the human genome. Genome Biol.2009;10:R25.
74. Zhang Y, Liu T, Meyer CA, Eeckhoute J, Johnson DS, Bernstein BE, et al.Model-based analysis of ChIP-seq (MACS). Genome Biol. 2008;9:R137.
75. Robinson JT, Thorvaldsdottir H, Winckler W, Guttman M, Lander ES, Getz G,et al. Integrative genomics viewer. Nat Biotechnol. 2011;29:24–6.
76. Quinlan AR, Hall IM. BEDTools: a flexible suite of utilities for comparinggenomic features. Bioinformatics. 2010;26:841–2.
77. Ye T, Krebs AR, Choukrallah MA, Keime C, Plewniak F, Davidson I, et al.seqMINER: an integrated ChIP-seq data interpretation platform. NucleicAcids Res. 2011;39:e35.
78. Bailey TL, Boden M, Buske FA, Frith M, Grant CE, Clementi L, et al. MEMESUITE: tools for motif discovery and searching. Nucleic Acids Res.2009;37:W202–8.
79. Kent WJ, Sugnet CW, Furey TS, Roskin KM, Pringle TH, Zahler AM, et al. Thehuman genome browser at UCSC. Genome Res. 2002;12:996–1006.
80. Shin H, Liu T, Manrai AK, Liu XS. CEAS: cis-regulatory element annotationsystem. Bioinformatics. 2009;25:2605–6.
81. Lavery DJ, Schibler U. Circadian transcription of the cholesterol 7 alphahydroxylase gene may involve the liver-enriched bZIP protein DBP. GenesDev. 1993;7:1871–84.
82. Quitschke WW, Taheny MJ, Fochtmann LJ, Vostrov AA. Differential effect ofzinc finger deletions on the binding of CTCF to the promoter of theamyloid precursor protein gene. Nucleic Acids Res. 2000;28:3370–8.
83. Zenodo. https://zenodo.org.
Submit your next manuscript to BioMed Centraland take full advantage of:
• Convenient online submission
• Thorough peer review
• No space constraints or color figure charges
• Immediate publication on acceptance
• Inclusion in PubMed, CAS, Scopus and Google Scholar
• Research which is freely available for redistribution
Submit your manuscript at www.biomedcentral.com/submit
Pugacheva et al. Genome Biology (2015) 16:161 Page 24 of 24

GAPDH BORIS CTCF NHDF 16.9 Undetermined 22.5 Tes?s 16.9 22.7 21.4 K562 16.3 19.1 21.8
OVCAR8 15.9 22.7 20.8 Delta47 15.5 20.4 20.9
RoundSperma?ds 15.7 24.7 22.1
CTCF and BORIS expression (qPCR, CT Value) A
C
D B 97kDa
75kDa
NHD
F
K562
Delta
47
OVC
AR8
CTCF MABs
BORIS MABs
Ac.n ABs
43kDa
BORIS MABs + + CTCF MABs + +
CTCF TNT BORIS TNT
CTCF or BORIS
Super ShiT
WT1 promoter (Fr.5)
F
Genes CTCF_K562 CTCF_OVCAR8 CTCF_Delta47 BORIS_K562 BORIS_OVCAR8 BORIS_Delta47
H BORIS-‐only bound regions in K562, CTCF&BORIS bound regions in OVCAR8/Delta47
GAS2L3 EXT1 PMERA NEK4 CSRP1 PEX2 ZNF878 PLGRKT
10577 BORIS-‐only regions mapped in K562 cells
Set of CTCF sites from ENCODE (38 cell lines)
326840
91% overlap
9% do not overlap
K562
Ovcar8
DAPI CTCF BORIS MERGE
DAPI CTCF BORIS MERGE
OVCAR (83456)
47531 57%
47531 invariant CTCF peaks
CTCF binding K562 (83189)
Delta47(65563)
18% 22% 19%
6%
11%
9%
47531 invariant CTC
F peaks
K562 OVCAR8 Delta47 BORIS
~30%
0 -‐5kb +5kb
E F
G
0 -‐5kb +5kb
BORIS binding
K562 (34551) 17536 51%
Delta47 (31193)
OVCAR8 (33555)
21%
16%
14%
28%
10%
17536 invariant BORIS peaks
12%
17536 invariant BORIS peaks
~70%
CTCF occup
ancy in Ovcar8,
but n
ot in K562 and De
lta47
K562 OVCAR8 Delta47 CTCF
1 2 3 10 5 5
Fig.S1

1024 512 256 128 64 32 16 8
Peak Intensity
AllCTC
F
AllBORIS
CTCF&BO
RIS
BORIS&
CTCF
CTCF-‐only
BORIS-‐on
ly
K562 ***
*** A
chr19:42,359,061-‐42,392,015
CTCF_Delta47
CTCF_K562
BORIS_Delta47
BORIS_K562
ChIP-‐ReChIP_Delta47
ChIP-‐ReChIP_K562
chr19:7,967,181-‐8,002,176 (hg19)
Figure S16
BORIS-‐only BORIS-‐only CTCF-‐only CTCF&BORIS CTCF&BORIS
B ChIP-‐Re-‐ChIP
40
40
40
20
10
3
Fig.S2.

A
CTCF_K562 CTCF_Delta47 CTCF_NHDF BORIS_K562 BORIS_Delta47 BORIS_NHDF
CTCF&BORIS CTCF-‐only BORIS-‐only
TP53 H19 BMI
5
5
5
14
30
1
Luc.
11ZF
CTCF
BORIS
20
20
20
2
2
1
PROB1
chr5:138,728,305 -‐138,728,524
chr17:7,591,409 -‐7,591,597
chr11:2,021,926 -‐2,022,099
chr10:22,609,712 -‐22,609,890
11ZF
BORIS CTCF
5
20
15
5
20
1
Luc.
11ZF
CTCF
BORIS
Luc.
11ZF
CTCF
BORIS
Luc.
11ZF
CTCF
BORIS
BORIS-‐only CTCF&BORIS
BORIS CTCF
Genes
CTCF_K562
CTCF_OVCAR8
CTCF_Delta47
BORIS_K562
BORIS_OVCAR8
BORIS_Delta47
Luc.
11ZFs
CTCF
BORIS
ZNF258 BOP1 RNF220 CLN5
chr11:66495423 -‐66495724
chr19:7580821 -‐7581083
chr8:145514892 -‐145515166
B BORIS-‐only bound regions
chr1:45097614 -‐45097886
chr13:77566036 -‐77566434
11ZF
C
Luc.
11ZFs
CTCF
BORIS
Luc.
11ZFs
CTCF
BORIS
Luc.
11ZFs
CTCF
BORIS
Luc.
11ZFs
CTCF
BORIS
CTCF-‐only bound regions
10
10
15
5
5
5
C20orf197
chr20:58632526 -‐58632725
chr3:187397489 -‐187397720
chr19:29370166 -‐29370365
chr11:130304466 -‐130304665
chr5:143204776 -‐143204975
Luc.
11ZFs
CTCF
BORIS
Luc.
11ZFs
CTCF
BORIS
Luc.
11ZFs
CTCF
BORIS
Luc.
11ZFs
CTCF
BORIS
Luc.
11ZFs
CTCF
BORIS
Figure S16
2
2
2
10
3
10
13
13
13
10
10
1
Fig.S3.

BORIS-‐only peaks (p-‐value 2.4e-‐52)
(Present in 70% of BORIS-‐only peaks) CTCF&BORIS peaks (p-‐value 1.6e-‐12816)
CTCF-‐only peaks (p-‐value 8.7e-‐29718)
A
11.2
79.7
7.4 1.6 0.1 0 0 0 0
50
100
0 1 2 3 4 5 6 7
CTCF-‐only
2.5
32.2 30.4 21.6
8.5 3.4 1.2 0.2
0
50
0 1 2 3 4 5 6 7
CTCF/BORIS
Human GACCTGCTGCGCCCTCTGCAGGCGGCGGGGGGGCGGTGCAGGTGCTTTAAGAATTACCGC-GGGACTCGGTAGGGGGAGCGTAGGCGC Mouse GAAATTATGCGCCCTCTGCAGGC—CAGGGAGGA-----TAGGCGCTTTAAGAATTACCCCCAGGGGACGGTAGGGGGCGCTCGTGTAG
TP53 promoter (CTCF&BORIS)
Human CCTGGCGATCCCGCAGGGGGCGCCCCAGTCCGAGCGCGCCGCCCTCGGGGAGGCGGGAGGGGAGCCCGGGGCGGGCGAGGGCGGGGGTGT Mouse TCTTGAGATCCCGCAGGGGGCGCCCCAATCCGAGGGCGCCGCGCTCGGGGAGGCGGGCGGGGAGCCCGGGGCGGGCCCGGGAGGGGGTGT
FOXA3 promoter (CTCF&BORIS)
Human CCGGAATTGGCCGCTAGGTGGCAGCAGCAGGCCCTGTTGCCATCTCCTACGAGGCTTGGCGGGCTCT--GGCGCCCTCTGGTGGCTGCGGG Mouse CTGAAATTGGCCACAAGGTGGCAGCACCATGTTCCTT--CCATCTCCTGA-AGGCTTTGTAGGCTCTCTAGTGCCTCCTGGTGGCTGTGGG
NR_033374 (CTCF&BORIS)
Human CCCGCGCCGCGCCCCCTGCCGGCAGCAGACGGCCCCGCAGCGCAGTGCCGCCCCCTTGGCCCGGCGCCCCCTTTCGACCACCGAGCGCGGGC Mouse GCTGCTCTGAGCCCCCTGCCGGCCGCAGAC-----CACAGTGCCATGTC----CTTCAGCTCAGCGCCCCCTGTCGGTTACCGAGTGGGAGC
HPCA intron (CTCF&BORIS)
Human CTGGGTGCAGGGCGCCACCTGGAGGCTACCGCGCA-ACGTCCTCGCCCTCGCAGGACCAGTTCAGTCCCAAAGGGGGCGCAGCATCTCA-CA Mouse CTGGACAAAAGGCACCACCTAGTGGTCACAACGCAGAAGTCCTCTTGCGCGCAGGACAAGTCCAATCCCGAAGGGGGCGCAGCATCTCATAA
IRF2BP1 3’end (CTCF&BORIS)
Human ACCACCAACGCTAC----CCACCACTTTCTGCTTTCCAATAGTGCCCTCTGGTGGAAGAAATATTAATTGCAGTTAACGGAGCCCGACTC Mouse GCATCCTTGACCACGGAAATACTGCGTTTTGCTTTCCGATAGTGCCCTCGTGTGGCAGAAATCAGAACTGCAAGTTATAGACCGGGACGCA
CTCF-‐only (chr17:28420640-‐28420799, hg19)
B
D E F
Distance between two CTCF mo\fs in 1bp resolu\on
% of C
TCF&
BORIS sites
Number of CTCF mo\fs
% of C
TCF&
BORIS pe
aks CTCF&BORIS CTCF-‐only
% of C
TCF-‐on
ly peaks
Number of CTCF mo\fs
C Human GAATTGGTTGTA---GTTGTGGAATCGGAAGTGGCCGCGCGGCGGCAGTGCAGGCTCACACATCACAGCCCGA-----GCCCGC------ Mouse GAAGCTGTTATGTGCAACAAGGGAACGGATGCTACCGCGCGGTGGCAGCATACTCCTATATATCGTGGCCCAAATGCTGCCAACTTGGGG
H19 ICR -‐ CTCF-‐only (chr11:2,021,167-‐2,021,242, hg19)
0
0.2
0.4
0.6
0.8
1
1 13
25
37
49
61
73
85
97
109
121
133
145
157
169
181
193
CTCF&BORIS
Fig.S4.
Site 1 Site2
Protein: -‐ 11ZFs -‐ 11ZFs -‐ 11ZFs -‐ 11ZFs -‐ 11ZFs -‐ 11ZFs
5’ 3’
TP53 promoter (200bp)
CTCF CTCF 5’ 3’
IRF2BP1 3’UTR(200bp)
CTCF CTCF 5’ 3’
Chr17 Intergenic (200bp)
CTCF CTCF
CTCF&BORIS bound regions
Single
15
15
3
3
1
1
25
25
30
20
2
3
DNMT3B GAL3ST1 MDM2 BIVM EFNA3 Chr13 NUDT15 IQGAP2 OBFC1 INS-‐IGF2 MPEG1 Chr12 Chr18 Chr4
Genes CTCF_K562 CTCF-‐Delta47 BORIS_K562 BORIS_Delta47 ChIP-‐Re-‐ChIP_K562 ChIP-‐Re-‐ChIP_Delta47
CTCF&BORIS bound regions CTCF-‐only bound regions
-‐ 11ZFs -‐ 11ZFs -‐ 11ZFs -‐ 11ZFs -‐ 11ZFs -‐ 11ZFs -‐ 11ZFs -‐ 11ZFs -‐ 11ZFs -‐ 11ZFs -‐ 11ZFs -‐ 11ZFs -‐ 11ZFs -‐ 11ZFs
protein:
A
Double Single
Free probe
Occup
ancy
B
Site 1 Site2
Site 1+2 Site 1+2 Site 1+2
Site 1 Site2 Site 1 Site2
Site 1 Site2 Site 1 Site2
K562 NHDF K562 NHDF K562 NHDF
Abs -‐ -‐ -‐ -‐ -‐ -‐ -‐ -‐ -‐ CTCF
BORIS
CTCF
BORIS
CTCF
BORIS
CTCF
BORIS
F
CTCF
BORIS
CTCF
BORIS
F F
FOXA3 promoter KDM3B promoter TP53 promoter
C
Fig.S5. Pugacheva et.al.
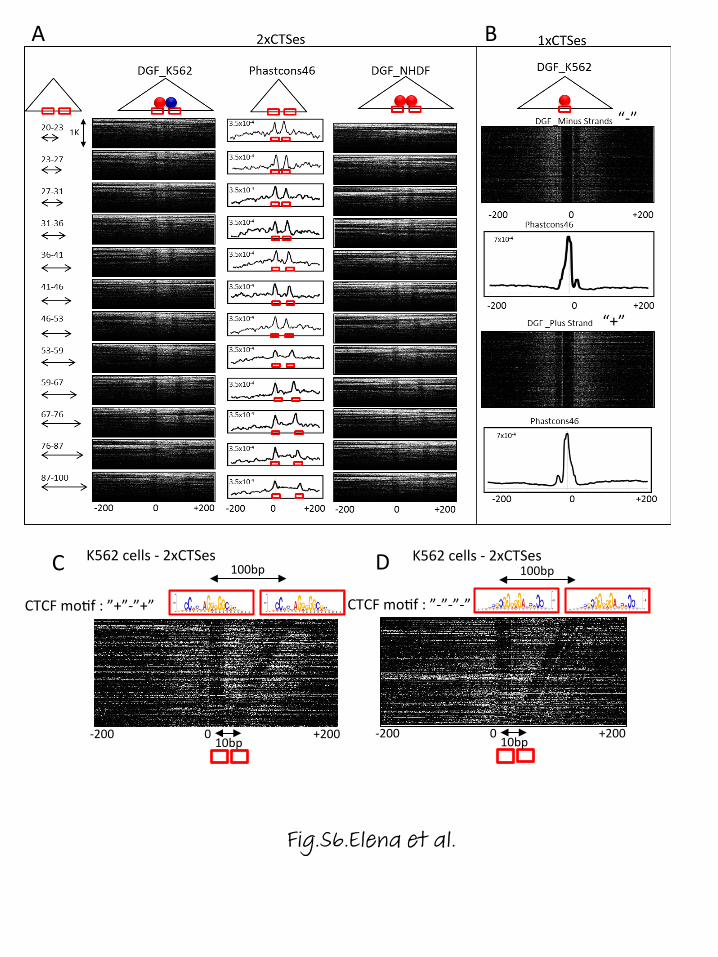
-‐200 0 +200
100bp K562 cells -‐ 2xCTSes
A
C
B
10bp -‐200 0 +200
100bp
CTCF mo9f : ”+”-‐”+”
K562 cells -‐ 2xCTSes D
10bp
CTCF mo9f : ”-‐”-‐”-‐”
Fig.S6.Elena et al.

ChIP-‐seq (K562)
17656 ac4ve prom
oters in K5
62 cells
H3K4me3 RNAPII BORIS CTCF
87% BORIS targets
K-‐means clustering (5 clusters)
A
17798 ac4ve enh
ancers in K562 cells
K-‐means clustering (5 clusters)
50% BORIS targets
H3K27ac BORIS CTCF
ChIP-‐seq (K562)
ZNF143 RAD21
SMC3
y = 0.9407x + 1.8302 R² = 0.88001
0
50
100
0 20 40 60 80 100 CTCF&BO
RIS (n=1000)
BORIS-‐only (n=1000)
DNAseI HMGN3 SMC3
ELF1
RAD21 TBP RNAPII
EZH
CBX3 CBX8
KAP1
y = 0.9242x + 34.922 R² = 0.34007
0
50
100
0 50 100
CTCF&BO
RIS (n=1000)
CTCF-‐only (n=1000)
Genes CTCF BORIS H3K27ac p300
chr1:31,236,343-‐31,258,087(hg19)
BRD2
10 10 60 20
chr6:32,933,901-‐32,944,516 (hg19)
Genes CTCF BORIS H3K27ac p300
30
5
70
140
76% of Super Enhancers are BORIS targets in K562 cells B
0
20
40
60
80
100 BORIS-‐only
CTCF/BORIS
CTCF-‐only
% of o
verla
pping
n=1000
K562
59215 CT
CF -‐o
nly 23974 CT
CF&BO
RIS
E CTCF RNAPII CAGE H3K4me3 H2AZ H3K27ac ZNF143 SMC3
C
D
H2AZ
-‐2000 0 2000
Tag De
nsity
2
CTCF&BORIS BORIS-‐only CTCF-‐only
HCFC1
-‐2000 0 2000
Tag De
nsity
3
CTCF&BORIS BORIS-‐only CTCF-‐only
-‐2000 0 2000
Tag De
nsity
6
CTCF&BORIS BORIS-‐only CTCF-‐only
YY1
K562 cells: CTCF-‐only ~ 50K, CTCF&BORIS~24K, BORIS-‐only-‐10K
-‐2000 0 2000
Tag De
nsity
1
CTCF&BORIS BORIS-‐only CTCF-‐only
SET1B
SMC3
-‐2000 0 2000
Tag De
nsity
4
CTCF&BORIS BORIS-‐only CTCF-‐only
p300
-‐2000 0 2000
Tag De
nsity
4
CTCF&BORIS BORIS-‐only CTCF-‐only
DNaseI
EZH
-‐2000 0 2000
Tag D
ensity
1.4
CTCF&BORIS BORIS-‐only CTCF-‐only
-‐2000 0 2000
Tag De
nsity
1
CTCF&BORIS BORIS-‐only CTCF-‐only
cMYC
-‐2000 0 2000
Tag De
nsity
5
CTCF&BORIS BORIS-‐only CTCF-‐only
CAGEs
-‐2000 0 2000
Tag De
nsity
0.5
CTCF&BORIS BORIS-‐only CTCF-‐only
-‐2000 0 2000
Tag De
nsity
40
CTCF&BORIS BORIS-‐only CTCF-‐only
ZNF143
-‐2000 0 2000
Tag De
nsity
1.6
CTCF&BORIS BORIS-‐only CTCF-‐only
SUZ12
F
0 -‐5kb +5kb
0 -‐5kb +5kb
0 -‐5kb +5kb
Genomic Distribu4on
% binding sites
G 55
41
4
34 40
26
6
45 49
Promoter+5'UTR Gene Body Intergenic
BORIS-‐only CTCF&BORIS CTCF-‐only
Fig.S7. E.Pugacheva et.al.
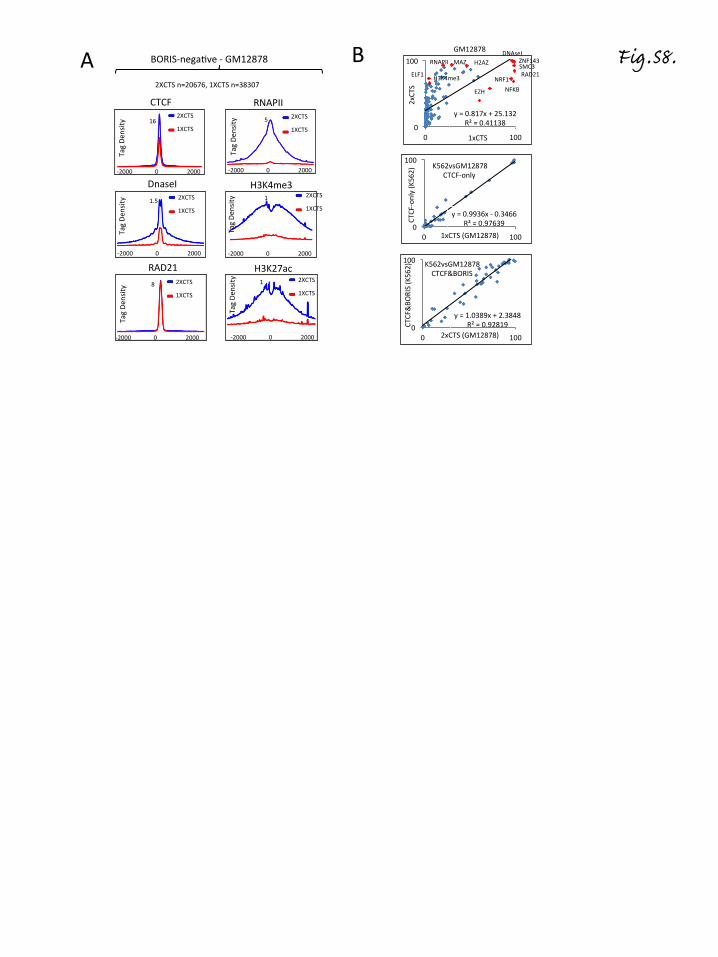
y = 0.9936x -‐ 0.3466 R² = 0.97639 0
100
0 100
y = 0.817x + 25.132 R² = 0.41138 0
100
0 100 1xCTS
2xCT
S
DNAseI ZNF143 SMC3 RAD21
NRF1 NFKB EZH
MAZ H2AZ
H3K4me3
RNAPII
ELF1
GM12878
y = 1.0389x + 2.3848 R² = 0.92819 0
100
0 100
CTCF-‐only (K56
2)
1xCTS (GM12878)
2xCTS (GM12878)
CTCF&BO
RIS (K562) K562vsGM12878
CTCF&BORIS
K562vsGM12878 CTCF-‐only
BORIS-‐negaRve -‐ GM12878
RNAPII
-‐2000 0 2000
Tag De
nsity
5
CTCF
-‐2000 0 2000
Tag De
nsity
16
2XCTS
1XCTS
H3K27ac
-‐2000 0 2000
Tag De
nsity
1
DnaseI
-‐2000 0 2000
Tag De
nsity
1.5
RAD21
-‐2000 0 2000
Tag De
nsity
8
H3K4me3
-‐2000 0 2000
Tag De
nsity
1
2XCTS n=20676, 1XCTS n=38307
2XCTS
1XCTS
2XCTS
1XCTS
2XCTS
1XCTS
2XCTS
1XCTS
2XCTS
1XCTS
A B Fig.S8.

7299CTCF&BORIS 2557 BORIS-‐only 19447 CTCF-‐only
Conserved mouse binding regions
-‐2000 0 2000 Tag De
nsity
0.5
BORIS
CTCF
OVC
AR8
-‐2000 0 2000
Tag De
nsity
1.2 0.6
BORIS
CTCF
Delta
47
-‐2000 0 2000
Tag De
nsity
0.8 0.4
BORIS
CTCF
-‐2000 0 2000
Tag De
nsity
1.2 0.6
BORIS
CTCF
-‐2000 0 2000
Tag De
nsity
0.8 0.4
BORIS
CTCF
-‐2000 0 2000
Tag De
nsity
0.4 0.2
BORIS
CTCF
OVC
AR8
OVC
AR8
Delta
47
Delta
47
A
BORIS-‐only
Gene CTCF BORIS
Mouse
Gene CTCF BORIS
Human RALGDS SMARCA4
30
30
10
30
Gene CTCF BORIS
Mouse
Gene CTCF BORIS
CTCF-‐only
Mouse
Human
Gene CTCF BORIS
Gene CTCF BORIS
2310046K01Rik
RTN2
Rtn2
15
2
15
2
chr20:795,181-‐802,566
Human
12
3
20
30
Kdm3b Vps36
KDM3B VPS36 CTCF&BORIS
RALGDS SMARCA4 B
Fig.S9.

CAGGACAGCGTCCTGgaggaaGAAGTGGAGCTGGTGCTG
0.4kb
0.2kb
0.1kb
M
wt PCR product
Digested PCR products
Wt
48h aA
er ZFN
2weeks aAe
r ZFN
.
CEL-‐I Assay
Wild type allele (%): Mutant allele (%):
100 14 37 0 86 63
A
B
wt + Control wt + ZFN E
BORIS
Tubulin
PMA day: 0 1 2 3 7
K562 differenZaZon into the megakaryocyZc lineage (by PMA)
4 7 M 1 wt 8 11 12 20 23 29 31
ZFNs clones (CEL-‐I Assay)
wt PCR product
Digested PCR products
C D
wt + Control
wt + ZFN
wt +PMA (3day)
F
BORIS
wt M 1 4 7 8 11 12 20 23 29 31
ZFNs clones (Western)
Tubulin
EV Cl.1 Cl.2
MCF7+BORIS
ADAR SLC16A6 MOCS2 MOCS3 POLR3G MAFB SLC2A6 EIF2AK2 TMSB4X AMOTL2 TEAD1 PARP14 IFITM1 IRF7 IFITM3 PARP12 OASL OAS3 MX2 IFI44L IFIT5 IFI6 ISG15 OAS2 IFI44 OAS1 IFIT1
5 0 -‐5
p < 0.003
EV/BORIS (log2)
G
H
0.1
1
10
100
1000
10000
100000
1000000
GAL3ST1
FOXA3
PRAME
RelaZve expressio
n (lo
g2)
CTCF&BORIS targets expression
CTCF(+)/BORIS(-‐) cells CTCF(+)/BORIS(+) cells
L Genes CTCF BORIS CTCF BORIS CTCF BORIS CTCF BORIS RNAPII H3K4me3 K562 NHEK NHDF
NHDF
OVCAR8
Delta47
K562
RNA-‐Seq
GAL3ST1 FOXA3 PRAME
K
TranscripZon No TranscripZon No TranscripZon
10 1 4 4 1 8 4 13 10 10 10 1 1
MCF7+BORIS_CTCF MCF7+BORIS_BORIS MCF7+EV MCF7+BORIS (Cl.1) MCF7+BORIS (Cl.2)
ChIP-‐seq
RN
A-‐seq
10
5
120
120
120
WISP2
0
50
MCF7+EV MCF7+BORIS(Clone1) MCF7+BORIS(Clone2)
RPKM
P<1E-‐30
P=0.000297
WISP2 expression (RNA-‐seq)
I
20x 20x 20x
Fig. S9.
vlobanenkov
Cross-Out
vlobanenkov
Typewritten Text
Fig. S10
vlobanenkov
Underline

K562-‐specific loops
BORIS CTCF RNAPII BORIS CTCF RNAPII
21684 le= anchor
21684 rig
ht ancho
r
~65%
loop
s -‐ BORIS po
siFve
K562 K562
K562-‐specific InteracFons
-‐10kb +10kb -‐10kb +10kb
K562-‐specific loops
CTCF RNAPII CTCF RNAPII
21684 le= anchor
21684 rig
ht ancho
r
MCF7 MCF7
-‐10kb +10kb -‐10kb +10kb
A B
Genes CTCF BORIS H3K27ac RNAPII RNA-‐Seq
ChIA-‐PET
CTCF RNAPII RNA-‐Seq ChIA-‐PET
K562-‐specific loops
COMMD7 DNMT3B MAPRE1 10
5
10
5
30
10
5
30
PET=5, p-‐value 3.45E-‐16
chr20:31,242,444-‐31,420,406
MCF7 K5
62
PET=9, p-‐value 2.12E-‐14
PET=7, p-‐value 2.14E-‐15
PET=5, p-‐value 9.22E-‐14
C
BORIS-‐negaFve somaFc cells
BORIS-‐posiFve germ or cancer cells
CTCF
BORIS
2xCTS 1xCTS
TranscripFonal loops Enh -‐ Enhancer
Change of transcripFon
Enh Enh
Enh Enh
D
InteracFons different from K562
Fig. S10.
vlobanenkov
Cross-Out
vlobanenkov
Typewritten Text
Fig. S11


![COMPLETE f-MOMENT CONVERGENCE FOR EXTENDED ...convergence and complete moment convergence for weighted sums of ˆ-mixing random variables. Recently, Wu et al. [23] introduced the concept](https://static.fdocuments.net/doc/165x107/60f7a01911102d5ecf193ace/complete-f-moment-convergence-for-extended-convergence-and-complete-moment-convergence.jpg)