PUG 2009 ESRI Petroleum User Group Conference€¦ · ESRI Petroleum User Group Conference ... GIS...
48
ESRI Petroleum User Group Conference February 23–25, 2009 • Houston, TX PUG 2009 GIS: Exploring the Geographic Approach for Oil and Gas
Transcript of PUG 2009 ESRI Petroleum User Group Conference€¦ · ESRI Petroleum User Group Conference ... GIS...

ESRI Petroleum User Group ConferenceFebruary 23–25, 2009 • Houston, TX
PUG 2009
GIS: Exploring the
Geographic Approach
for Oil and Gas
February 23, 2009
Dear Colleagues:
I am honored to welcome you to the 19th annual Petroleum User Group (PUG) Conference. This is a place where you can discuss your latest challenges and new trends, collaborate on solutions, and hear success stories from others in the energy industry using geographic information systems (GIS). Thank you for the pioneering work you do as a user community—driving innovation and success through GIS.
Throughout the event, you will be able to explore ESRI® technol-ogy and its applications firsthand. Taking advantage of an agenda designed for petroleum and pipeline professionals at all levels of GIS experience, you will leave here with ideas and tools to increase the business value of GIS for your organization.
The cornerstone of the PUG Conference is the conversations that take place during the breakout sessions, group meetings, and special events. Be sure to attend the user presentations, focusing on how GIS is being used in exploration; oil field operations; pipeline; health, safety, security, and environment (HSSE); and other downstream workflow processes. We thank all the presenters for sharing their valuable knowledge and experiences; their efforts are the heart of the PUG Conference.
ESRI staff will also be on hand to meet with you and talk about your projects, so be sure to take advantage of their expertise. Also, ESRI business partners will be available in the GIS Solutions EXPO, where you can find out how their GIS products and services, built on ESRI technology, can help you extend your success with GIS.
As always, we look forward to learning how we can continue to serve you.
Enjoy the conference.
Jack Dangermond, President
A Letter from Jack Dangermond

1
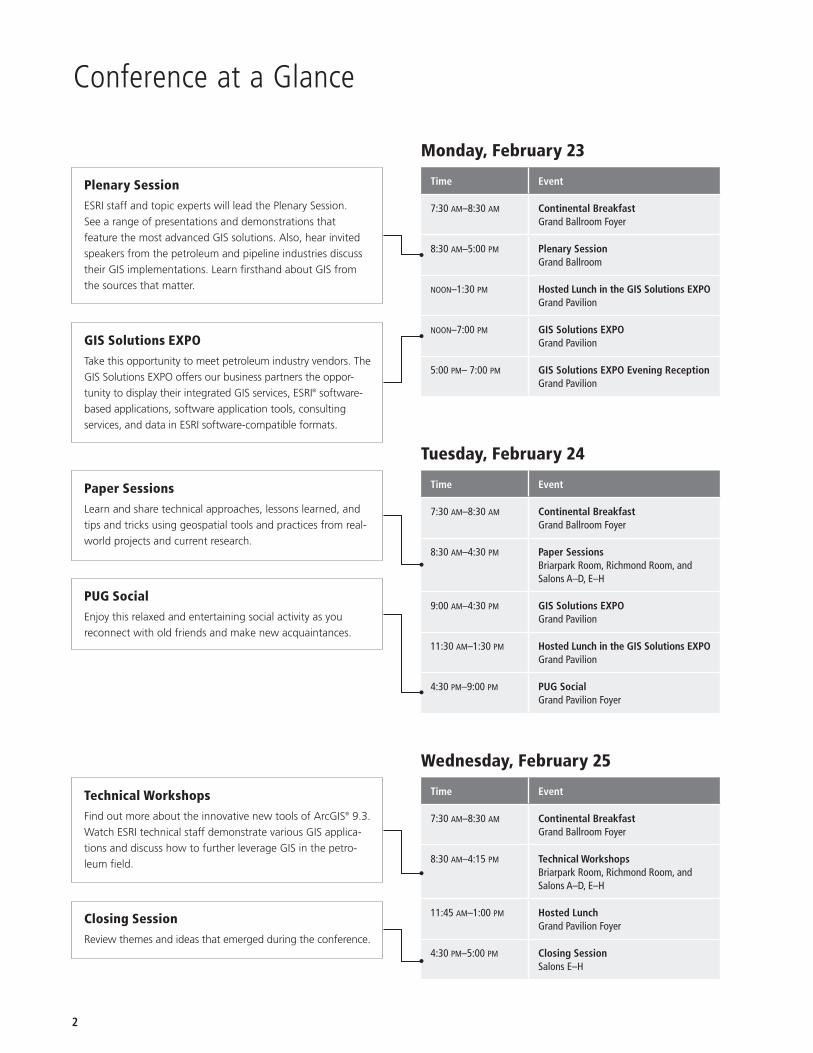
2 Conference at a Glance
3 Plenary Session
4 Session and Workshop Matrices
6 Session Descriptions
25 Workshop Descriptions
31 GIS Solutions EXPO
32 EXPO Floor Plan and Booth Locations
33 Sponsors
34 Exhibitor Descriptions
41 PUG Conference Survey
Table of Contents
Registration and InformationGrand Ballroom Foyer
Sunday, February 223:00 pm–6:00 pm
Monday, February 237:30 am–5:00 pm
Tuesday, February 247:30 am–4:30 pm
Wednesday, February 257:30 am–1:00 pm
Recycle Badges
At the end of the conference, please return your name badge holder to the Registration Desk.
Thank you for your cooperation.
Copyright © 2009 ESRI. All rights reserved. ESRI, ArcGIS, ModelBuilder, ArcIMS, ArcMap, ArcView, ArcSDE, ArcScene, ArcToolbox, ArcPad, ArcLogistics, ADF, JTX, GIS Day, www.esri.com, and @esri.com are trademarks, registered trademarks, or service marks of ESRI in the United States, the European Community, or certain other jurisdictions. Other companies and products mentioned herein may be trademarks or registered trademarks of their respective trademark owners.
G34387 ESRI1.4M2/09dh
PUG 2009
2
Paper SessionsLearn and share technical approaches, lessons learned, and
tips and tricks using geospatial tools and practices from real-
world projects and current research.
PUG SocialEnjoy this relaxed and entertaining social activity as you
reconnect with old friends and make new acquaintances.
Monday, February 23
Time Event
7:30 am–8:30 am Continental BreakfastGrand Ballroom Foyer
8:30 am–5:00 pm Plenary SessionGrand Ballroom
noon–1:30 pm Hosted Lunch in the GIS Solutions EXPO Grand Pavilion
noon–7:00 pm GIS Solutions EXPOGrand Pavilion
5:00 pm– 7:00 pm GIS Solutions EXPO Evening ReceptionGrand Pavilion
Wednesday, February 25
Time Event
7:30 am–8:30 am Continental Breakfast Grand Ballroom Foyer
8:30 am–4:15 pm Technical WorkshopsBriarpark Room, Richmond Room, and Salons A–D, E–H
11:45 am–1:00 pm Hosted LunchGrand Pavilion Foyer
4:30 pm–5:00 pm Closing SessionSalons E–H
Tuesday, February 24
Time Event
7:30 am–8:30 am Continental BreakfastGrand Ballroom Foyer
8:30 am–4:30 pm Paper SessionsBriarpark Room, Richmond Room, and Salons A–D, E–H
9:00 am–4:30 pm GIS Solutions EXPOGrand Pavilion
11:30 am–1:30 pm Hosted Lunch in the GIS Solutions EXPO Grand Pavilion
4:30 pm–9:00 pm PUG SocialGrand Pavilion Foyer
Conference at a Glance
Technical WorkshopsFind out more about the innovative new tools of ArcGIS® 9.3.
Watch ESRI technical staff demonstrate various GIS applica-
tions and discuss how to further leverage GIS in the petro-
leum field.
Plenary SessionESRI staff and topic experts will lead the Plenary Session.
See a range of presentations and demonstrations that
feature the most advanced GIS solutions. Also, hear invited
speakers from the petroleum and pipeline industries discuss
their GIS implementations. Learn firsthand about GIS from
the sources that matter.
GIS Solutions EXPOTake this opportunity to meet petroleum industry vendors. The
GIS Solutions EXPO offers our business partners the oppor-
tunity to display their integrated GIS services, ESRI® software-
based applications, software application tools, consulting
services, and data in ESRI software-compatible formats.
Closing SessionReview themes and ideas that emerged during the conference.

3
Plenary Session • Monday, February 238:30 am–5:00 pm • Grand Ballroom
7:30 am–8:30 am Continental BreakfastGrand Ballroom Foyer
8:30 am–8:45 am Welcome Charles Freid, PUG Chairman, BP, and Geoff Wade, Petroleum Industry Manager, ESRI
8:45 am–10:00 am Keynote Address Clint Brown, Product Director, ESRI
10:00 am–10:30 am Break
10:30 am–noon ESRI Technology Update ESRI Staff
noon–1:30 pm Hosted Lunch in the GIS Solutions EXPOGrand Pavilion
1:30 pm–3:00 pm GIS Leaders Panel DiscussionModerated by Neil McNaughton, Oil IT Journal
3:00 pm–3:30 pm Break
3:30 pm–4:00 pm GIS for Wind Development Site Screening: An Example Sara Tyler, Shell WindEnergy, Inc.
4:00 pm–4:30 pm South and East Kuwait Infrastructure Master PlanMohammad Abdullah, Kuwait Oil Company
4:30 pm–5:00 pm Federal Oil and Gas Accessibility of the United States Richard Watson, Bureau of Land Management
Session Track Codes
DMT Data Management and Technology
EXP Exploration
HSE Health, Safety, and Environment
IFO iField Operations and Production Optimization
LMG Land Management
PIP Pipeline Integrity Management and Risk Assessment
4
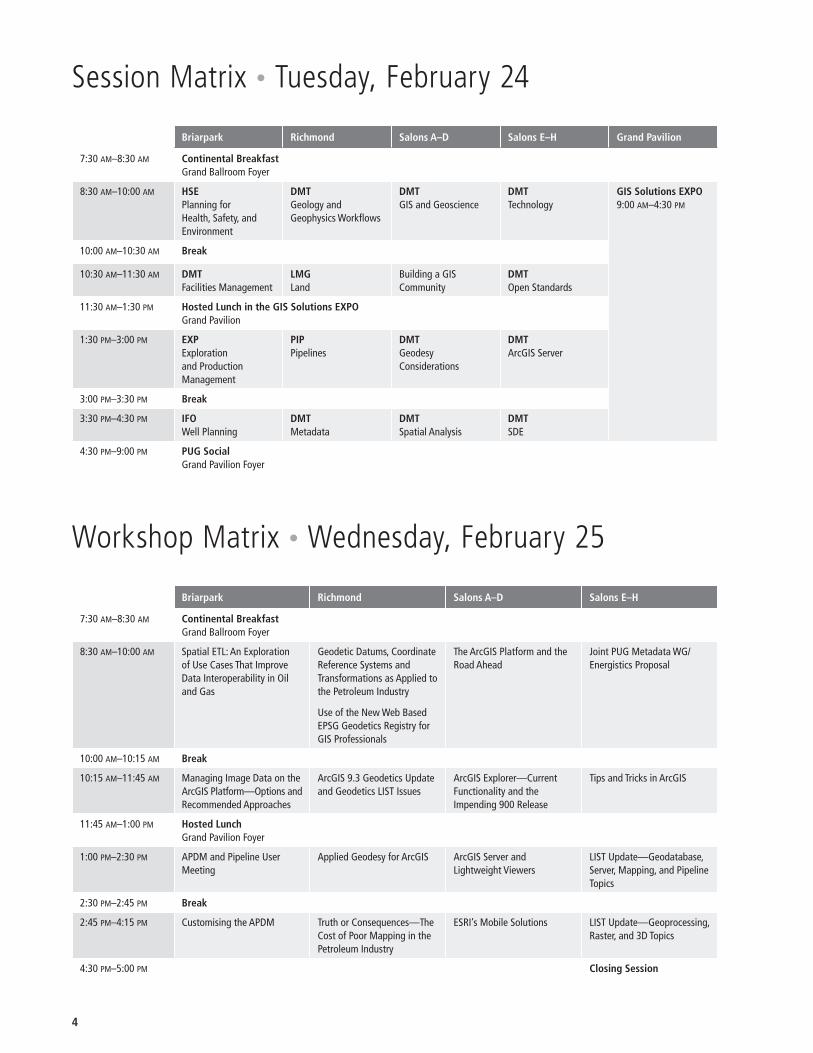
Session Matrix • Tuesday, February 24
Briarpark Richmond Salons A–D Salons E–H Grand Pavilion
7:30 am–8:30 am Continental BreakfastGrand Ballroom Foyer
8:30 am–10:00 am HSEPlanning for Health, Safety, and Environment
DMTGeology and Geophysics Workflows
DMTGIS and Geoscience
DMTTechnology
GIS Solutions EXPO9:00 am–4:30 pm
10:00 am–10:30 am Break
10:30 am–11:30 am DMTFacilities Management
LMGLand
Building a GIS Community
DMTOpen Standards
11:30 am–1:30 pm Hosted Lunch in the GIS Solutions EXPOGrand Pavilion
1:30 pm–3:00 pm EXPExploration and Production Management
PIPPipelines
DMTGeodesy Considerations
DMTArcGIS Server
3:00 pm–3:30 pm Break
3:30 pm–4:30 pm IFOWell Planning
DMTMetadata
DMTSpatial Analysis
DMTSDE
4:30 pm–9:00 pm PUG SocialGrand Pavilion Foyer
Workshop Matrix • Wednesday, February 25
Briarpark Richmond Salons A–D Salons E–H
7:30 am–8:30 am Continental BreakfastGrand Ballroom Foyer
8:30 am–10:00 am Spatial ETL: An Exploration of Use Cases That Improve Data Interoperability in Oil and Gas
Geodetic Datums, Coordinate Reference Systems and Transformations as Applied to the Petroleum Industry
Use of the New Web Based EPSG Geodetics Registry for GIS Professionals
The ArcGIS Platform and the Road Ahead
Joint PUG Metadata WG/Energistics Proposal
10:00 am–10:15 am Break
10:15 am–11:45 am Managing Image Data on the ArcGIS Platform—Options and Recommended Approaches
ArcGIS 9.3 Geodetics Update and Geodetics LIST Issues
ArcGIS Explorer—Current Functionality and the Impending 900 Release
Tips and Tricks in ArcGIS
11:45 am–1:00 pm Hosted LunchGrand Pavilion Foyer
1:00 pm–2:30 pm APDM and Pipeline User Meeting
Applied Geodesy for ArcGIS ArcGIS Server and Lightweight Viewers
LIST Update—Geodatabase, Server, Mapping, and Pipeline Topics
2:30 pm–2:45 pm Break
2:45 pm–4:15 pm Customising the APDM Truth or Consequences—The Cost of Poor Mapping in the Petroleum Industry
ESRI’s Mobile Solutions LIST Update—Geoprocessing, Raster, and 3D Topics
4:30 pm–5:00 pm Closing Session

2627 Redwing Road, Suite 100, Fort Collins, CO 80526(970) 267-2000 � • [email protected]
www.newcenturysoftware.com
RAISING YOUR
In challenging economic times, it’s important to look at the systems, software, and processes that are driving your business.
At New Century Software, our people consistently deliver solutions that help improve pipeline safety and impact your bottom line.
As a client, your data is managed by applications that bring out its full potential through analysis and visualization.
In the end, it comes down to better decisions being made that will effect everything from regulatory compliance to capital planning in the years to come.
Visit us at booth #105 to learn how New Century Software will work to raise your ROI.

6
Session Descriptions • Tuesday, February 24
8:30 am–10:00 am
Briarpark RoomHSE Planning for Health, Safety, and Environment
Hurricane Storm Surge and Facility Risk Assessment
David Gisclair, LOSCO/Office of the Governor Robert Cunningham, LSU—School of the Coast Elaine Evers, LSU—School of the Coast
This presentation will investigate some of the issues associated with risk assessment as it pertains to hurricane storm surge. The purpose of this presentation is to demonstrate how GIS data may be used to assist the petroleum industry in evaluating facil-ity risk and how facility risk assessment, using LIDAR data, may be useful in oil spill prevention.
The presentation will also touch on issues discussed at the second “National LIDAR Initiative (NLI)” meeting held in Reston, VA in May 2008 and how a national LIDAR procurement could benefit the petroleum industry in terms of risk management.
Finally, a brief overview of the preparations in progress for the “Louisiana GIS DVD—May 2010 Compilation” for the Louisiana Oil Spill Coordinator’s Office (LOSCO)/Office of the Governor oil spill emergency response preparedness will be discussed.
The Ecological Footprint of Oil Production and Sustainability
Chris Baynard, University of North Florida
The ecological footprint caused by energy development creates large-scale and permanent changes on the landscape. The size and type of footprint varies on location, energy policy and company dynamics. Energy companies are increasingly con-cerned with minimizing environmental alterations as part of best environmental practices.
The methods described here provide a useful and cost-effective process for measuring the ecological footprint created by explo-ration and production (E&P) operations. It uses GIS and remote sensing techniques to measure the following landscape ecology disturbances: vegetation change, infrastructure density, edge-effect zones, core areas and number of rivers crossed. The study site is Venezuela’s heavy oil belt between 1990 and 2005.
Findings show variations among the operations examined, with the newest concessions exhibiting the smallest footprint. This suggests that implementing lessons learned and adopting newer technology can minimize landscape disturbances related to E&P. It also suggests that the type of company involved, state versus multinational, may also affect the type and size of footprint.
These methods can provide a landscape assessment of E&P operations from the desktop. This information can be used to reduce alterations in subsequent development phases as well as improve planning for new concessions. Finally, these findings lend themselves for the establishment of a sustainability index based on objective measures. This type of transparency can fortify self reporting.
Richmond RoomDMT Geology and Geophysics Workflows
Integrating GIS with G&G Data and Applications
Tim Donovan, Anadarko Brian Boulmay, OpenSpirit
This paper will discuss how new software tools have allowed us to evolve our G&G data workflows to derive more value out of our GIS investment. Streamlining these processes means expending less effort to ensure geoscientists use the most accu-rate data in their subsurface interpretations.
By running automated Scan jobs across all of our G&G projects we keep our ArcSDE database up to date with the changing contents of our diverse G&G projects environment. This allows us to make the most accurate maps possible with much less effort. In addition, using the OpenSpirit ArcGIS Extension, we can use ArcGIS Desktop in interactive workflows with G&G applications such as Geoframe and Openworks. This allows us to use ArcGIS as an interactive map based spatial analysis tool for making objective decisions when populating our corporate well and seismic data stores. We can also send interpreted data back to ArcGIS for incorporation in final map displays.
This paper will provide some examples of these workflows and share the benefits (and issues) we have experienced in using these new tools and procedures.
Data Management Challenge of Merger with Hydro
Leslie Austdal, StatoilHydro
Both Statoil and Hydro have been extensively using GIS tech-nology for many years. After the recent merger, data manage-ment for a growing number of GIS users has been a central issue. This challenge is tackled by providing users with new tools for finding and using a wide range of datasets, sources and geographical extents.

As part of our commitment to openness, we continue to make a massive investment in our Ocean* open architecture—enabling you to leverage and globally deploy your intellectual property—now and for the future.
At Schlumberger Information Solutions, openness is more than a technology foundation— it’s a core value and business approach.
Challenge us with your tough problems.
www.slb.com/opensis
Global Expertise | Innovative Technology | Measurable Impact
At Schlumberger Information Solutions, openness is more than a software architecture.
*Mar
k of
Sch
lum
berg
er.
Mea
sura
ble
Impa
ct is
a m
ark
of S
chlu
mbe
rger
. ©
200
9 Sc
hlum
berg
er.
09
-IS-0
035
for your business
8
Meeting the Challenges of Geospatial Assurance in a Decentralized E&P Business
Jon Stigant, Devon Energy Mark Michell, Devon Energy Mike Jensen, Devon Energy Jason Humber, Integrated Informatics Inc.
In enterprise level implementations for Geographic Information Systems (GIS) it is remarkably common for energies to be highly focused solely on infrastructure and data consolidation while leaving only fringe efforts for concentration on workflow improvements and management.
Devon Energy’s Geodetics Operations Team undertook an initiative to define, document, and deliver a set of improved workflows in support of their normal audit activities for seismic, well, and land. The immediate impacts of this initiative include collection and analysis of systemic issues, commonality in prac-tice, and improved traceability in the audit process.
This presentation will detail the approach taken to capture and consolidate workflows into a manageable and well defined set of processes and will cover the role that GIS plays in realm of survey audit and Geospatial Assurance. Coupled with this is a discussion on how the ESRI Job Tracking for ArcGIS (JTX) exten-sion is being used for improved customer interaction, manage-ment of workload and status, increased consistency in work product, and streamlined automation of non-core tasks.
With the Geodetic Operations Team as the corporate custodians of positional integrity, the outcomes from this initiative have far reaching and positive effects throughout the organization.
Salons A–DDMT GIS and Geoscience
A National Perspective of Carbon Sequestration Using Regional Datasets
Nicholas Callaghan, Kansas Geological Survey Asif Iqbal, Kansas Geological Survey Timothy Carr, West Virginia University
The Department of Energy (DOE) Carbon Sequestration Regional Partnerships have generated a large quantity of information for a “carbon atlas” of key geospatial data (carbon sources, potential sinks, etc.) required for rapid implementation of carbon sequestration on a broad scale. The NATional CARBon Sequestration Database and Geographic Information System (NatCarb) provides web-based, nation-wide data access to disparate data (carbon sources, potential sinks, infrastructure, etc.) and analytical tools (pipeline measurement, carbon storage capacity estimation, cost estimation, etc.) required for address-ing carbon capture and sequestration. Distributed computing solutions link partnerships and other publicly accessible reposi-
tories of geological, geophysical, natural resource, infrastructure, and environmental data. Data are maintained and enhanced locally, but assembled and accessed through a single geoportal. NatCarb, as a first attempt at a national carbon cyberinfrastruc-ture (NCCI), assembles the data required to address technical and policy challenges of carbon capture and storage.
NATCARB is a functional demonstration of distributed data-management systems that cross the boundaries between institutions and geographic areas. It forms the first step toward a functioning carbon sequestration information cyber-infrastruc-ture. NATCARB online access has been modified to address the broad needs of a spectrum of users, and includes not only GIS and database query tools for the high-end technical user, but also simplified displays for the general public employing readily available web tools such as Google Earth and Google Maps.
A Modular, Distributed, Interoperable Geosciences Information Network (GIN)
M Lee Allison, Arizona Geological Survey Linda Gundersen, U.S. Geological Survey Stephen Richard, Arizona Geological Survey Tamara Dickinson, U.S. Geological Survey
A coalition of the state geological surveys (AASG), the U.S. Geological Survey (USGS), and partners are building the Geoscience Information Network (www.geoinformatics.info/gin), a national, distributed, interoperable data network. GIN will develop Web-based services to link existing and developing components using a few standards and protocols, and work with data providers to implement these services.
The key components of this network are 1) catalog system(s) for data discovery; 2) service definitions for interfaces for search-ing catalogs and accessing resources; 3) shared interchange formats to encode information for transmission (e.g. various XML markup languages); 4) data providers that publish informa-tion using standardized (Web) services defined by the network; and 5) client applications adapted to use information resources provided by the network. GIN will integrate and use catalog resources that currently exist or are in development: USGS National Geologic Map Database’s existing map catalog; USGS National Geological & Geophysical Data Preservation Program National Digital Catalog; and GEON catalog. Existing inter-change formats are being used, such as GeoSciML, ChemML, and Open Geospatial Consortium sensor, observation and mea-surement MLs. Client application development is fostered by collaboration with industry and academic partners. GIN focuses on the remaining aspects of the system—service definitions and assistance to data providers to implement the services and bring content online—and on system integration of the modules.
Initial formal collaborators include the OneGeology-Europe consortium of 29 nations that is building a comparable network under the EU INSPIRE initiative, GEON, Earthchem, and ESRI.
Session Descriptions • Tuesday, February 248:30 am–10:00 am (continued)

9
OneGeology-Europe and GIN have agreed to integrate their networks, effectively adopting global standards among geologi-cal surveys. ESRI is creating a Geology Data Model for ArcGIS software to be compatible with GIN, and other companies are expressing interest in adapting their services, applications, and clients to take advantage of the large data resources that are becoming available through GIN.
Development of the Freeman Hurricane Damage Potential Scale Using GIS
Jill Hasling, Weather Research Center
2004, 2005 and 2008 remind us that major hurricanes have returned to the Gulf of Mexico. Anyone old enough can remem-ber the busy decade of the 60’s. When you review the Category 4 hurricanes on the Saffir/Simpson Scale that moved over the oil and gas leases of the Gulf of Mexico, the 60’s were a very busy decade with Hurricane Carla—1961, Hurricane Hilda—1964, Hurricane Betsy—1965, Hurricane Beulah—1967 and Hurricane
Camille—1969. This is compared with Hurricane Ivan—2004, Hurricanes Katrina and Rita—2005 and Hurricanes Gustav and Ike—2008. Hurricane Ike demonstrated that a hurricane does not have to be a Category 4 hurricane to cause devastating waves but that size matters.
Meteorologists at Weather Research Center are using ArcGIS mapping to study past, present and future Gulf of Mexico hur-ricanes. This tool will be used to develop a Damage Potential Scale that could be used to forecast potential damage to offshore facilities in the Gulf of Mexico. Hurricanes come in all sizes, intensities and speeds. Using Weather Research Center’s Hurricane Wind and Wave Model, past hurricanes are mapped with the platforms that could be at risk from high waves.
Weather Research Center is a non-profit educational cen-ter whose mission is to inspire America’s next generation of scientists and engineers. The GIS software is a tool which WRC uses to capture the interest of young scientists and engineers through the graphical depiction of the weather.
TM
10
Salons E–HDMT Technology
Improving Performance of Distributed GIS at Southwestern Energy Using ArcGIS Server
Jason Ramirez, Southwestern Energy Company Hyrum Ernstrom, IT Nexus, Inc. Chad Cooper, Southwestern Energy Company
Southwestern Energy’s GIS configuration provided ArcView users in three different office locations (Fayetteville, Arkansas, Conway, Arkansas and Houston, Texas) access to data stored on a central GIS server in its Houston office. Despite each office’s 1 GB bandwidth and the use of Citrix, performance was paltry to the point of being unacceptable. In late 2008, by migrat-ing to ArcGIS Server and software developed using the ArcGIS Server Application Developer Framework (ADF), Southwestern Energy realized dramatic performance improvements to the rave reviews of its end users. To achieve acceptable performance, Southwestern revamped their enterprise GIS deployment meth-odology. New hardware was installed along with a fine-tuned ArcGIS Server configuration, resulting in performance gains and optimized GIS access in a distributed environment. Due to the upgrade to the ArcGIS Server platform, Southwestern Energy is recognizing new advantages and opportunities to help them add value to their business.
This presentation first reviews Southwestern Energy’s old GIS configuration and the efforts taken to achieve acceptable performance. It then presents in detail the new hardware and ArcGIS Server software configuration and the performance gains achieved along with recommendations for optimizing GIS access speed in a distributed environment. The presentation will also discuss other advantages and opportunities Southwestern Energy is realizing as a result of upgrading to the ArcGIS Server platform.
Using the ArcGIS Server New JavaScript API
Brian Besier, IT Nexus, Inc.
The ArcGIS Server JavaScript API became available with the 9.2 release of the software. It offers an easy to use browser based API to quickly build highly intuitive web mapping applications with the ability to create mashups with Google Maps and Microsoft Virtual Earth.
Because Energy companies often work across large geographic areas, the ability to create easy to use applications that incor-porate nationally available data sets is of high importance. This presentation will discuss the pros and cons of a JavaScript based ArcGIS Server application and review the capabilities and limita-tions of the Google Maps and Microsoft Virtual Earth JavaScript API extensions.
One Size Rarely Fits All: Managing GIS Content and Functionality
Ryan Ross, Quorum Business Solutions
One of the many challenges a company faces when implement-ing an enterprise GIS solution, is ensuring the right people have easy access to the right information. In this session we will dis-cuss different methodologies to approach GIS accessibility and security across both ArcGIS Desktop and ArcGIS Server solutions. By centrally managing maps, layers and GIS functionality with users and roles, users can easily access the data they need to get their job done while maintaining cartographic consistency and representation standards across a large number of GIS consumer groups within a company.
This session will benefit GIS Managers, GIS professionals, Spatial Analysts, Mapping Techs, E&P and Land Managers.
10:30 am–11:30 am
Briarpark RoomDMT Facilities Management
Offshore Field Layout Planning and Development with ArcGIS
Angus Colyer, Chevron Energy Technology Co. James Ellis, Ellis GeoSpatial Tom O’Donnell, Chevron Energy Technology Co. Matt Levey, AOA Geophysics Neil Delfino, Chevron Energy Technology Co.
Chevron is developing a Subsea Field Development and Planning Tool utilizing ArcGIS, 3D Analyst, ArcScene and 3D Simulation. The purpose is to reduce project risk and cost by generating a common 3D visualization tool which can be utilized by typi-cal engineering disciplines ranging from Reservoir Engineering through Seabed Equipment to Onshore Process Facilities.
A common planning tool integrates planning decisions, minimizes field layout design conflicts, supports a centralized database development, provides design verification utilizing ROV-based 3D simulation, promotes training, enables solu-tions to be verified before equipment is ordered, improves understanding between Chevron and contractors, and supplies through-field-life support.
GIS field layout planning is initiated by compiling geophysical assessments, hazard maps, bathymetry, existing infrastructure, reservoirs, and wells. A subsea engineer then position subsea equipment such as pipelines, umbilicals, surface-processing host, mooring lines, and risers. 3D Analyst is used to visualize the field layout. The field layout GIS is passed to the ROV 3D simulation program for mock up and verification.
Session Descriptions • Tuesday, February 248:30 am–10:00 am (continued)

12
Session Descriptions • Tuesday, February 2410:30 am–11:30 am (continued)
ArcGIS employs 3D symbols of equipment with x, y, z refer-ence points and snap-to-points (representing connection points for other equipment). These equipment points are exchanged between ArcGIS and the ROV 3D simulation program. Shapefiles are exported to AutoCAD so engineering drawings can be generated—these are used with front-end engineering and design (FEED) contactors and to generate bids.
The survey of installed manifold foundation piles and wellhead conductors will be integrated into the GIS to provide as-built details of the field layout. The 3D Simulation will utilize the as-built details from the field layout to provide virtual measure-ments for the subsea equipment locations. Virtual measurement of subsea equipment enables jumper spools to be pre-fabricated, thereby reducing the requirement to perform subsea metrology and project costs.
A single, authoritative geodatabase using ArcGIS Server and SQL Server 2008 is being developed to enable project team members to read, update, and edit geodata simultaneously. The ArcGIS solution provides easily understood visual evidence of the inter-faces between subsurface, subsea, and surface equipment and is fulfilling the company’s vision of a seamless, integrated, and standardized field layout planning & development tool.
Richmond RoomLMG Land
Complex GIS Modeling and Analysis to Support Energy Policy
Jeffrey Eppink, Enegis, LLC Richard Watson, Bureau of Land Management Michael Marquis, Enegis, LLC
The Energy Policy and Conservation Act (EPCA) Phase III Inventory, released in May 2008, presents an assessment of the access issues for the development of oil and gas resources on Federal lands. The release is an update of the EPCA Phase II Inventory, released in November 2006, which examined 99.2 million acres of Federal land in 11 basins from Alaska to Florida. In addition to a reevaluation of Phase II basins, Phase III examines an additional 7 basins for a total 279 million acres of Federal land.
Using a complex GIS model that examines over 13 million discrete polygons, the inventory examined the approximately 3,000 different lease stipulations being applied by the land man-aging agencies in the areas analyzed. This analysis of constraints to development centers on two factors that affect access to oil and gas resources on Federal lands: (1) whether the lands are “open” or “closed” to leasing, and (2) the degree of access afforded by lease stipulations and other conditions on “open” lands. The model addresses the issues of overlapping stipulation geometries, exceptions, waivers, and modifications granted to stipulations, the ability of industry to directionally drill under areas
prohibiting surface occupancy, and the application of Conditions of Approval. Modeling techniques and results will be presented.
Utilizing GIS to Manage Oil and Gas Leases
Tijerina Troy, Digital Mapping Services Damion Scholz, Digital Mapping Services
The utilization of GIS to construct a land management system has greatly facilitated the decision making process of oil and gas companies. Throughout the history of Digital Mapping Services, we have assisted several companies in the oil and gas industry in managing their leasehold information. Lease mapping begins by organizing the lease information in a database, then reviewing the lease data individually to establish its position through the employment of proper resources and base data. Collaborating surveying and GIS will result in an interactive, fully functional and completely updateable LIS with minimal errors.
Salons A–D Building a GIS Community
Perspectives on GIS Day Events within an Energy Company
Ellen Hoveland, Hess Corporation Bruce Sanderson, Apache Corporation Lisa Derenthal, Gimmal Group, Inc. David Dignum, ESRI
GIS Day provides an international forum for users of geographic information systems (GIS) technology to demonstrate real-world applications that are making a difference in our society. Recently, GIS leaders in the energy industry have established internal GIS Day programs that seek to expand the understanding of GIS and its application beyond existing systems and users. This session will include success stories and lessons learned from two GIS Day programs within large petroleum companies.
4-H Youth Collaborates with Multi-partners on Historic Map Project
Tyler Leinonen, Student Jeanette Buelt, RMOTC
Rocky Mountain Oilfield Testing Center (RMOTC) has recently collaborated with Casper College, the Natrona County 4-H Program, Anadarko Petroleum Company, and ESRI to create a historic map of the 1920’s campsites (townsites) in the Teapot Dome and Salt Creek oil field areas. Remnants of these sites today include concrete foundations, fireplaces, sidewalks, exca-vations, and old pipes. This interactive map not only locates the historic sites, but also offers links to a brief text history of each site along with a selection of original photos. Since this informa-tion will be presented to visitors at the two oil field locations, a virtual tour of the area will also be offered in a 3D video format.

PIPELINE DATA FROM
HTSI, INC.
THE MOST ACCURATE, COMPREHENSIVE AND
UP-TO-DATE PIPELINE DATA ANYWHERE
3027 Marina Bay Drive, Suite 315 League City, Texas 77565-0232 866-585-0706 Toll Free • 713-893-6193 Phone 713-893-6205 Fax
WWW.PIPELINE-DATA.COM WWW.HTSIDATA.COM
NATURAL GAS Pipelines--OIL-CRUDE Pipelines--PRODUCT Pipelines--LNGPipelines--CO2 Pipelines--ALL OTHER PIPELINE TYPES--WITH FACILITIES
TRANSMISSION PIPELINES--OFFSHORE PIPELINES--GATHERING PIPELINES--DISTRIBUTION PIPELINES
COVERAGE—USA—ALASKA—CANADA--OFFSHORE--MEXICO
YOU CAN PURCHASE: A SINGLE COUNTY, A STATE, OR THE NATIONAL PIPELINE DATASET
1,468,364 SEGMENTS WITH OVER 2100 OPERATORS SHAPEFILE, LL NAD 27
HTSI’S PIPELINE DATABASE CONTAINS THE FOLLOWING FIELDS
PIPE DIAMETER—OWNER—OPERATOR—COMMODITY--COMMODITY DESCRIPTION--SYSTEM TYPE--SYSTEM NAME--SUBSYSTEM NAME--MODIFICATION DATE—INTERSTATE--OR INTRASTATE--QUALITY
CODE—FLOW—DIRECTION--CAPACITY
THE FOLLOWING FACILITIES COME WITH OUR PIPELINES
OIL AND GAS WELLS (34 STATES); RECEIPT AND DELIVERY POINTS; INTERCONNECTS; METERS; OIL PUMPING STATIONS; OIL INTERCONNECTS; GAS STORAGE FACILITIES;
1:24,000 PLSS (ABSTRACTS, SECTIONS TOWNSHIP RANTE, COUNTY CARTER: REFINERIES; ELECTRICAL TRANSMISSION LINES; SUB STATIONS; POWER PLANTS; COMPRESSORS, GAS AND OIL; GAS PROCESSING PLANTS; HUBS; LNG ERRMINALS;
TERMINALS; TANK FARMS; USA HYDRO; RAILROADS; PLACE NAME POINTS;NATIONAL SCHOOL DISTRICTS; LAKES; BAY RESERVOIR CANALS AND SWAMPS;
FEDERAL LANDS; AIRPORTS; USGS BENCHMARKS; STREETS HIGHWAYS INTERSTATES
14
This project utilized Casper College Advanced GIS students to mentor and help 4-H youth develop skills in GPS data collection, ArcGIS mapping and creating ArcScene 3D videos. But, even the Casper College student’s knowledge and skills in 3D was limited. Therefore, an ESRI 3D Specialist was requested to give them a net-meeting crash course on the process of exporting spatial footprints out of ArcMap into Google SketchUp in order to cre-ate campsite replicas using original photos, and then importing the 3D mockups back into ArcScene so that 3D virtual tours could be recorded on video.
Tyler Leinonen, the 13-year old who took on this 4-H proj-ect, began working with the four Casper College students in September 2008. They took Trimble GPS units to the field and collected spatial data on the historic remnants of the old campsites. That data was overlaid on an aerial photographic background, and then the students were assigned specific tasks for completing the project. Two students worked on collecting historic documents and photos from the college library archives, RMOTC and Anadarko. The other two students split the project in half—Teapot Dome and Salt Creek—and began working on ArcMap layouts. Tyler, having the least GIS experience, was assigned the project of creating 3D mockups of the old camp-sites in Google SketchUp and then helped create a variety of fly-through videos in ArcScene.
The final product consisting of interactive historic ArcMap and 3D ArcScene videos of the historic area was presented to RMOTC and Anadarko at the end of the semester, December 2008, in a class presentation.
Salons E–HDMT Open Standards
Leveraging Open Standards with ArcGIS Server 9.3 and Google Earth
Brian Timoney, The Timoney Group
Drowning in both data as well as a mind-numbing quantity of tools and applications, Oil & Gas has been challenged in finding an approach for delivering visual intelligence to its non-technical management: the folks who both make the high-dollar deci-sions and have no time for reading instruction manuals, let alone formal training classes.
By combining the popular and intuitive Google Earth inter-face with OGC web standards such as WMS and KML, GIS/IT departments can serve broad audiences without the painstaking architecting and programming of first generation web map-ping applications. Further, by using open standards, GIS shops can access both relevant 3rd party data streams such as those provided by the USGS and the BLM, as well as harness the capabilities of ArcGIS Server 9.3 to easily publish their in-house data as WMS or KML.
This presentation will discuss how to quickly access government sources of topo maps, land grid, and lease information. Then, in using ArcGIS Server to stream internal datasets, we will do a quick overview of streaming “big” data, customizing the info balloon, and intelligently hyperlinking individual features to other data repositories.
By combining open standards with the Google Earth interface, GIS/IT departments are no longer facing the grim prospect of
“re-inventing the wheel” in creating their own internal web map-ping system from scratch. Rather, by combining freely available 3rd party data streams with the ArcGIS Server new capabilities to publish internal data sets, they give a broad audience of non-technical users easy access to critical information.
Beginning Python
Tracy Rijken, Inner Corridor Technologies
Python is a simple scripting language that can be used to automate tasks. Start a Python script from an existing model, or write the whole script from scratch. With a few simple Python statements, an entire string of geoprocessing tasks can run repeatedly on a list of files. A few more lines of code can keep a log file of the results. Add just a couple of mouse clicks and the script can run as a tool in ArcToolbox—complete with param-eters! See how to start a script, call geoprocessing commands and existing models, run it as a tool in ArcToolbox, and share that tool with others.
1:30 pm–3:00 pm
Briarpark RoomEXP Exploration and Production Management
GIS Cubed Integration
Andy James, Halliburton—Landmark Tore Hoff, StatoilHydro
Integration of ESRI’s Geographic Information Systems with Landmark’s Geoscience Information Systems combines the power of surfaces based GIS analysis with the multi dimensional subsurface visualization, interpretation & earth modeling.
The petroleum industry needs around exploring for new petro-leum based energy sources demands ever higher fusion of data & technology. This presentation will highlight the advances made in this data fusion arena and will demonstrate just how easy it has become to validate and compare the results from a vast array of different technical specialists that allow explora-tionists to radically reduce the uncertainty involved in defining prospect fairways and therefore optimize the likelihood of suc-cessful hydrocarbon discovery.
Session Descriptions • Tuesday, February 2410:30 am–11:30 am (continued)
15
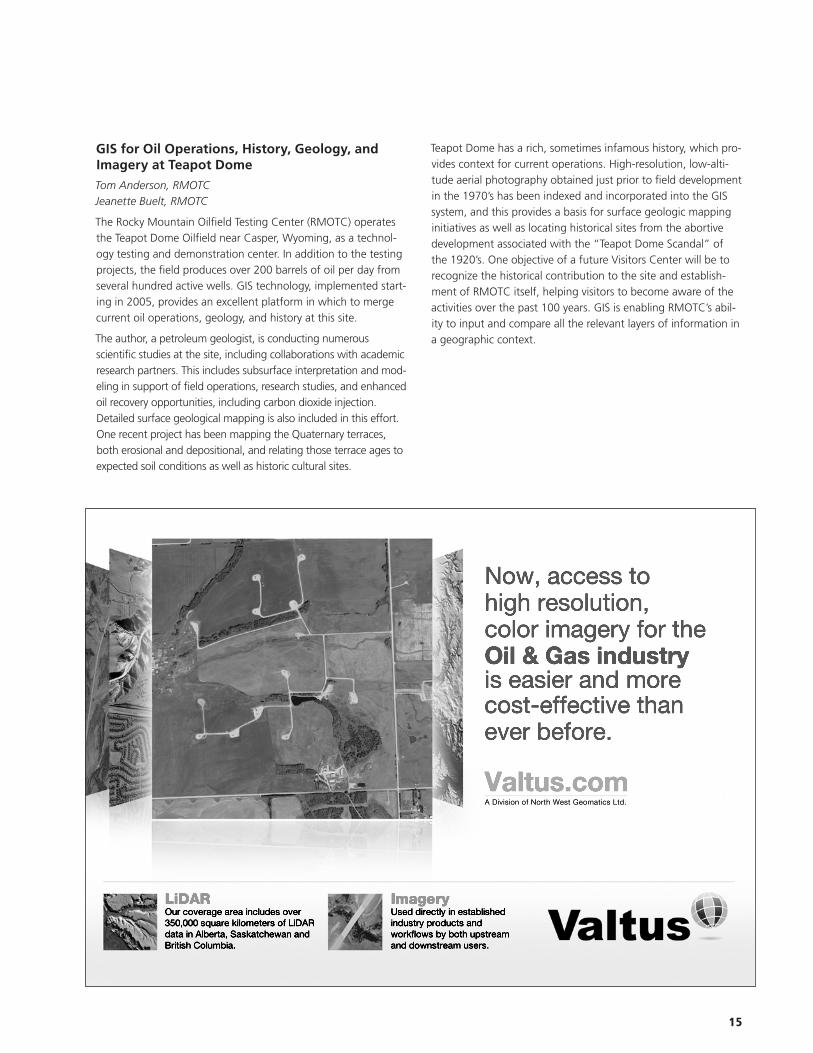
GIS for Oil Operations, History, Geology, and Imagery at Teapot Dome
Tom Anderson, RMOTC Jeanette Buelt, RMOTC
The Rocky Mountain Oilfield Testing Center (RMOTC) operates the Teapot Dome Oilfield near Casper, Wyoming, as a technol-ogy testing and demonstration center. In addition to the testing projects, the field produces over 200 barrels of oil per day from several hundred active wells. GIS technology, implemented start-ing in 2005, provides an excellent platform in which to merge current oil operations, geology, and history at this site.
The author, a petroleum geologist, is conducting numerous scientific studies at the site, including collaborations with academic research partners. This includes subsurface interpretation and mod-eling in support of field operations, research studies, and enhanced oil recovery opportunities, including carbon dioxide injection. Detailed surface geological mapping is also included in this effort. One recent project has been mapping the Quaternary terraces, both erosional and depositional, and relating those terrace ages to expected soil conditions as well as historic cultural sites.
Teapot Dome has a rich, sometimes infamous history, which pro-vides context for current operations. High-resolution, low-alti-tude aerial photography obtained just prior to field development in the 1970’s has been indexed and incorporated into the GIS system, and this provides a basis for surface geologic mapping initiatives as well as locating historical sites from the abortive development associated with the “Teapot Dome Scandal” of the 1920’s. One objective of a future Visitors Center will be to recognize the historical contribution to the site and establish-ment of RMOTC itself, helping visitors to become aware of the activities over the past 100 years. GIS is enabling RMOTC’s abil-ity to input and compare all the relevant layers of information in a geographic context.
ImageryUsed directly in established industry products and workflows by both upstream and downstream users.
LiDAROur coverage area includes over 350,000 square kilometers of LiDAR data in Alberta, Saskatchewan and British Columbia.
A Division of North West Geomatics Ltd.
Valtus.com
Now, access to high resolution, color imagery for the Oil & Gas industry is easier and more cost-effective than eever before.

16
Using GIS to Calculate Reserves from Oil and Gas Lease Ownership
Bramwell, Jerry
A company’s oil and gas reserves are calculated by multiplying the gross reserves by the company’s net revenue ownership interest (NRI) obtained from the oil and gas leases which cover the three dimensional space where those reserves are located. When running economics for both exploration and develop-ment wells, engineers have had to historically estimate an average net revenue interest for the entire prospect or field even though the NRI may vary substantially from tract to tract within a prospect or field. Advances in GIS technology now allow tract-based NRIs to be applied to reserve calculations.
Richmond RoomPIP Pipelines
Field Verification of Gas Pipeline HCAs
John Linehan, GISP; Enbridge Energy Company
Federal regulations require natural gas transmission pipeline operators identify high consequence areas for integrity manage-ment. Once identified, the pipeline must be periodically assessed and mediated if faults are found. Assessments cost money and the main question an operator has is “Do I really need to assess this section of pipe?” The answer lies in the validity of the HCA. This paper will discuss several methods to discover and validate high consequence areas and associated identified sites.
Topics discussed will include:
1. Using online aerial imagery
2. GPS surveys—method, data collected, data dictionary, ArcPad/ArcGIS Mobile tools
3. Line Location methods—In line inspections, construction reports, as-builts
4. Field Surveys—drive-by, local authority consults
5. Photographs and Forms
6. Identifying and digitizing structures
7. Identifying and digitizing high consequence areas
8. Calculating HCAs
9. Annual HCA comparison and reporting
Seamless Data Integration between Enterprise Systems (A Case Study)
Chad Zamarin, Colonial Pipeline Company G. Lamar Crowe, Colonial Pipeline Company
Many companies utilize an Enterprise Asset Management (EAM) system for facilitating maintenance and asset management as well as a Geographical Information System (GIS) for infrastruc-ture data management, mapping and analysis. However, few organizations do so in an integrated manner to create advanced and optimized asset management systems. Much of the poten-tial of these systems is never realized due to the lack of integra-tion, coordination and optimization between the systems.
In this case study we will demonstrate how assets and sched-uled maintenance (e.g., PM, PdM) procedures associated with spatial data can be managed through enterprise integration by field personnel with little or no training. For those teams tasked with maintaining these applications the integrity of the data structure remains secured and the functionality enhanced through leveraging the best that each technology has to offer.
As the need for Service Oriented Architecture (SOA) develops and matures enterprise integration will continue to find its place in the day to day activities of companies that must maintain diverse assets with multiple data structures and applications. It is the intent of this session to generate interest in this subject and work together to further its progress within the oil & gas pipeline sector.
Pipeline Construction Data Management—Establishing Foundations for an Asset Database
Scot Twining, GeoFields, Inc.
Pipeline construction projects involve many activities that can be supported by GIS. These include route selection, ROW Acquisition, cadastral mapping, survey tracking, document man-agement, environmental permit applications, and construction drawing generation. Centralizing data management insures that project activities fulfill requirements on time without re-work, reducing cost. All personnel should access web-based GIS tools for data submittals, retrievals, and tracking surveys. This paper discusses the collection, management, and conversion of project data into an asset database.
Session Descriptions • Tuesday, February 241:30 pm–3:00 pm (continued)
17
Salons A–DDMT Geodesy Considerations
What You Need to Know about Datum Transformations
Samuel Knight, Blue Marble Geographics
Datum Transformation is a key part of any data conversion process, but also one that includes significant danger of intro-ducing inaccuracies if proper care is not taken. Transformations can occur in a number of stages along the data life cycle with repercussions that can affect the integrity of your data perma-nently. Something as seemingly simple as a single datum trans-formation can introduce 50 meters of error or more by using a low quality datum transformation, even if it is technically valid for the area. Selecting the best transformation parameters is key to the process and must be understood to properly execute on them. This talk will explore the specifics of making the choice from a set of parameters using concepts such as geographic envelopes and accuracy statements to make the proper choices.
“Project GIGS”: Is Your Software Maintaining Integrity of Your Spatial Data?
Brian Schostak, Shell Exploration and Production
GIGS (Geospatial Integrity of Geosciences Software) is a joint industry project which is studying the geodetic tools and pro-cesses in a variety of commercial geoscience software packages. An update on the GIGS project and the work completed to date will be presented, including application selection, analysis criteria and project deliverables.
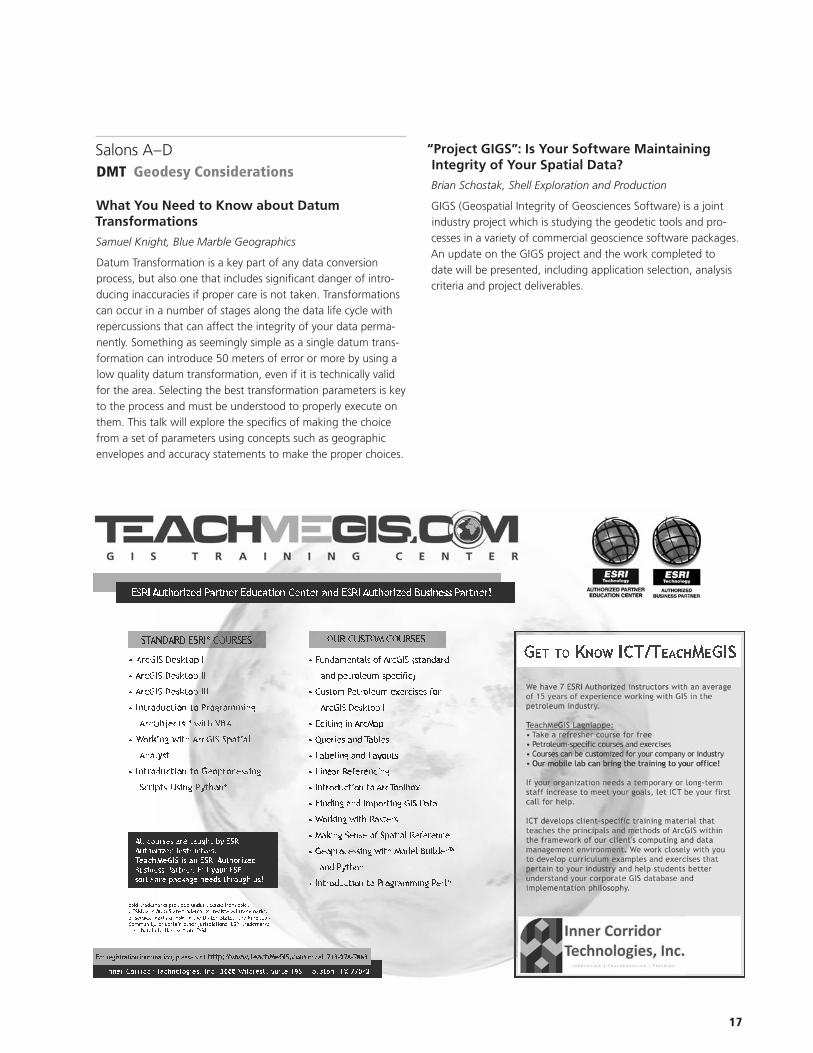
• ArcGIS Desktop I
• ArcGIS Desktop II
• ArcGIS Desktop III
• Introduction to Programming
ArcObjects™ with VBA
• Working with ArcGIS Spatial
Analyst
• Introduction to Geoprocessing
Scripts Using Python®
STANDARD ESRI® COURSES
• Fundamentals of ArcGIS (standard
and petroleum-specific)
• Custom Petroleum exercises for
ArcGIS Desktop I
• Editing in ArcMap
• Queries and Tables
• Labeling and Layouts• Labeling and Layouts
• Linear Referencing
• Introduction to ArcToolbox
• Finding and Importing GIS Data
• Working with Rasters
• Making Sense of Spatial Reference
• Geoprocessing with Model Builder™
and Python
• Introduction to Programming Perl®
OUR CUSTOM COURSESGET TO KNOW ICT/TEACHMEGIS
Inner Corridor Technologies, Inc. 3000 Wilcrest, Suite 195 Houston, TX 77042
For registration information, please visit http://www.TeachMeGIS.com or call 713-278-7883.
ESRI trademarks provided under license from ESRI.®ESRI, and ArcGIS are trademarks, registered trademarks, or service marks of ESRI in the United States, the European Community, or certain other jurisdictions. ESRI trademarks used herein by license from ESRI.
All courses are taught by ESRIAuthorized Instructors.TeachMeGIS is an ESRI AuthorizedBusiness Partner. Fill your ESRIsoftware package needs through us!
ESRI Authorized Partner Education Center and ESRI Authorized Business Partner!
18
Session Descriptions • Tuesday, February 241:30 pm–3:00 pm (continued)
Mapping Sciences: The Pandora’s Box of GIS?
Jack Verouden, Shell Exploration and Production
The mapping sciences are geodesy and cartography. Geodesy defines mathematically the size and shape of the Earth and Cartography is making representations of the Earth on a flat surface. An understanding of both is fundamental to effective collection, processing, analysis, presentation, storage, and reuse of all types of geospatial data. But how many practitioners of GIS have a formal or adequate education in these sciences? We regret to report there are too few! The authors will give a selec-tion of cases where misapplication has led to poor information ruling decisions. Eighty percent of data held in the petroleum industry databases are geospatial, i.e. has coordinate reference system attributes. Meaning that GIS affects the cycle of the petroleum industry: license, explore, appraise, develop, produce and decommission. This is potentially a huge responsibility for GIS to perform well.
Salons E–HDMT ArcGIS Server
Duct Tape and Elbow Grease: Managing ArcGIS Server
Will Ghomi, Clever Vectors Kevin Shows, Anadarko Petroleum Corp.
The demos make it look so easy. Just install ArcGIS Server and all your problems will be solved. Of course in the real world it’s not so simple. There are numerous technical and procedural issues to be overcome to successfully install, configure, and manage ArcGIS Server in a production environment. This technical “tips and tricks” discussion will delve into some of those issues and how we solved them, worked around them, or learned to live with them at Anadarko.
Delivering Business Solutions Utilizing ArcGIS Server 9.3 and Silverlight
Raymond Levey, EGI
The Energy and Geoscience Institute (EGI) is a not-for-profit organization doing research for Corporate Associate Members in all parts of the globe. As part of its activities for the last 30 years EGI has developed a global database of Research Reports, along with associated seismic, log and well data. The Institute realized that it needed to improve the dissemination of the data and information it had collected to its 70 plus member companies in a manner they could easily and conveniently consume.
EGI decided that a GIS based system would be the best method to logically organize and deliver their data and research reports. After a review of potential companies, EGI chose to partner with petroWEB to develop the new system. Based upon petroWEB’s
recommendations, ArcGIS Server 9.3 was chosen as the GIS technology and Microsoft Silverlight 2 was used to provide a richer browser experience. Early reviews of the system have been overwhelmingly positive and provided EGI with new opportunities to serve its clients.
The talk is a case study illustrating how ArcGIS Server 9.3 and Silverlight were leveraged to deliver a compelling user experi-ence to EGI’s Corporate Associate Program members.
Leveraging ESRI’s New Server API to Bring GIS and G&G Application Integration to the Web
Clay Harter, OpenSpirit Corp.
ESRI introduced the ArcGIS JavaScript API with ArcGIS Server 9.3 as a lightweight means of easily embedding GIS maps and tasks into Web applications. This new API offers more flexibility, is easier to use, and is ready to integrate into your existing Web applications. We will demonstrate how the new API can be quickly integrated with your Web-based services and applica-tions to deliver a fully functional Web experience. In addition, we will explain how ESRI’s new tools can integrate with the OpenSpirit Web Server to allow end users to browse the spatial location of all G&G data in the context of a corporate GIS; view well, seismic, and interpretation data (stored in project or corpo-rate databases) in table and graphical views; and, finally, enable you to send selected G&G and GIS data from Web to desktop applications for analysis and interpretation. We will demonstrate these workflows while focusing on the steps necessary to use ArcGIS Server in your Web environment.
3:30 pm–4:30 pm
Briarpark RoomIFO Well Planning
Using GIS in Well and Base Production Management Decisions
Shorouq EL-Khatib, Kuwait Oil Company Hamad Al-Zaabi, Kuwait Oil Company
In an environment where both increasing productivity and improved quality in oil field development deliverables are neces-sary and yet increasing the numbers of staff is difficult, it was imperative for Kuwait Oil Company (KOC) to investigate how to improve its present staff’s productivity. Kuwait Oil Company (KOC) Field Development Groups are implementing, as part of the Process Improvement Project (PIP), customized and standard-ized technical and reporting tools to assist in well and base pro-duction management decision at both the individual team and corporate asset levels. The goal is to work with more data, more effectively and in a more collaborative manner while increasing

What's in our pipeline?
Experience. Knowledge. Solutions.
Enterprise GIS for Pipelines
Coler & Colantonio, Inc. is a leader in supplying the Energy Industry with ESRI based solutions to manage pipeline assets. Our pipeline data management applications allow our clients to manage the full lifecycle of their assets within the
geodatabase. We support various data models including
APDM and PODS.
www.col-col-geospatial.com
R
20
the ability to train staff and enhance cross-asset knowledge transfer. Among the reporting tools to be implemented in 2008 is the utilization of ArcGIS mapping tools to provide a multi-layered, map format to display relevant and inter-related data so that everyone involved in field optimization can quickly and accurately understand the status of activities and develop the same mental model of issues to be managed.
Using ArcGIS maps significantly reduce the time the Petroleum Engineer requires to review and QC the large amount of pertinent data by raising visual “warning flags” on well data that does not “fit” with surrounding well data helping them focus efforts to troubleshooting. The use of ArcGIS also helps both the technical staff and management to interpret patterns within the data and to see how the whole field is performing. The layers are designed to display data that fits certain criteria, such as wells producing in only specified reservoirs. Each Field Development team decides what layers they need to see on a regular basis, including what layers/maps the Field Development leadership should be reviewing regularly. Layers that need to be viewed often are set up so that the map is automatically updated and generated for the user without their intervention. In Kuwait Oil Company, another critical role for the FD staff is to ensure that the data in the corporate database is correct and complete so as to be used for further analysis. By using ArcGIS maps as a quick method to visually check data, this makes data correction a much easier and quicker task for the Field Development staff. This happens when the FD staff use ArcGIS maps as a regular part of their ongoing activities.
Using ArcGIS to Streamline Well Planning
Janyce Jaramillo, Shell Rocky Mountain Production and Exploration Colby Smith, New Century Software
In this session we will explore GIS solutions for on-shore well planning in a high volume, fast paced environment of field development. We will discuss and illustrate how ArcGIS simplifies the complex processes and data involved in the well planning effort.
The well planning cycle is often a collaborative team effort that requires accurate and strategic well placement based on a number of variables, including drainage patterns, anti-collision control, state and federal regulations, competitor locations, and a vast array of environmental stipulations. By incorporating ArcGIS into this workflow, we greatly reduce the well planning life cycle while increasing accuracy and ultimately, profitability.
Custom GIS tools were built to improve efficiency by eliminating multi-step processes, by directly accessing the OpenWorks data store, by organizing data into a centralized spatial database (SDE), and by creating a user-friendly interface to improve decision-making through visualization. We created a flexible environment that allows the well planning team to visualize
current drilling progress in association with established and planned wells and to adjust future plans as current operating conditions change.
Finally, we leveraged the Z component in the data to enable 3D visualization in ArcScene. By taking advantage of existing ArcGIS tools, and customizing those tools where appropriate, we have successfully streamlined the process for the well planning team. What used to take months to plan has now been reduced to days.
Richmond RoomDMT Metadata
Spatial Enabled Documents by Linking GIS with Document Management Systems
Jürgen Mischker, OMV Exploration and Production Jeff Hecht, GIS Technology, Inc.
In the past in OMV Exploration and Production (OMV E&P) GIS and the document management system (eDMS) were separate systems. Questions such as “Do we have exploration studies stored in our eDMS for a specific area of interest? Do scanned paper logs exist for well X in our eDMS? and In order to per-form a lessons learned for drilling a new well can we obtain all drilling reports from surrounding wells?” were not answered immediately. The linkage of these systems finally allows now a two-way analysis. The user can find all documents associated with a specific geographic feature, or alternatively, find where, spatially, within the GIS certain documents are associated. This linkage also allows the user to perform a spatial query to find multiple documents associated with multiple geographic features. The linkage was created by using the unique identi-fiers (e.g., UWI—unique well identifier) and the document_class, which are mandatory metadata fields of the eDMS. The eDMS and GIS can be managed independently of one another, and no changes were required in the work processes used to update either system. Thus, OMV E&P staff is now able to access documents also via a geographic interface, which allows spatial queries on a wide range of documents.
A Parallel Metaverse
Keith Fraley, Shell
Imagine a world where the World Wide Web Consortium (W3C) required web designers to follow rigid metadata standards like ISO and FGDC in order for information to be disseminated on the Internet. A world where instead of leveraging technology to keep up with the petabytes of data on the web they required every web based file to have its own human entered metadata in order to be searchable.
Would information be easier or harder to find? Would you trust the information more or trust it less? Would it stifle innovation or fuel it?
Session Descriptions • Tuesday, February 243:30 pm–4:30 pm (continued)
22
We are reaching a period in our geospatial universe where relying on GIS professionals to hand enter metadata is not only counter productive, it is counter intuitive. At Shell we have begun leveraging technology to harvest metadata that is embedded in our GIS, in turn, injecting new life into our exist-ing metadata workflows.
Salons A–DDMT Spatial Analysis
Exploratory Spatial Data Analysis—Optimizing Interpolation of E&P Datasets
Paola Peroni, Exprodat Consulting Ltd. Gareth Smith, Exprodat Consulting Ltd.
Geoscientists are commonly faced with the problem of selecting the most appropriate interpolation algorithm when generating grids from point data. Often, the geoscientist will select the defaults provided in their E&P mapping tools without under-standing the implications of their choices. GIS provides a rich set of tools for evaluating their data before making these decisions, and increasingly for generating the final interpolated data sets, especially for more regional analysis work, without having to switch to other E&P mapping applications. Choosing a suit-able interpolation method for the type of phenomenon we are trying to model and for the specific distribution of our sampled population is not a matter of luck: we need to understand the spatial behaviour of the phenomenon we are investigating. And we need to answer to some critical questions: Is the variable we are interpolating normally distributed? Are there directional components in our dataset? How much does proximity matter for the specific phenomenon we are modelling? How spatially dependent are values across the study area? Exploratory Spatial Data Analysis (ESDA) is a group of techniques used to describe and visualize spatial distributions, to highlight patterns affect-ing the distribution of sampled values and to identify outliers or any non-typical values. In this paper we focus on the use of ESDA techniques available in ArcGIS Geostatistical Analyst and to guide the user in choosing a suitable interpolation method among the many available. Results of the ESDA are evaluated along with other considerations about the aim of the interpola-tion process itself as well as the distribution of sample locations and the type of phenomenon being studied. Examples used in this paper focus specifically on the type of datasets geoscientists may commonly encounter. A workflow aimed at guiding the user to choose among interpolation algorithms is also presented. Users can greatly benefit from the results of ESDA, particularly when these results are critically used to support the spatial mod-elling approach and to add value to the interpolation process itself, either within GIS or other E&P mapping applications.
Extending Spatial Analyst Geoprocessing with Python NumPy and SciPy
Tracy Thorleifson, Eagle Information Mapping, Inc. Kim Chen, Eagle Information Mapping, Inc.
Many important physical processes can be described using dif-ferential equations. Traditionally, numerical methods have been employed on computers to provide solutions for such equations. While Spatial Analyst provides many powerful tools for analyz-ing raster data, numerical methods functions are lacking. This limits the utility of Spatial Analyst in complex physical modeling. Previous workers have relied on external applications to perform complex modeling, and used ArcMap primarily as a visualization tool for displaying the results of analyses performed elsewhere.
Python is the tool of choice for advanced geoprocessing in the ArcMap environment. The NumPy and SciPy libraries extend Python with structures for defining n-dimensional arrays, linear algebra methods and tools for solving differential equations. Recent improvements in the integration of Python with ArcMap for geoprocessing purposes now make the application of numerical methods within the ArcMap environment feasible.
We present a simplified geoprocessing example utilizing Spatial Analyst and Python to model free-surface gravity flows, with results displayed in ArcMap. Such flows are described by the de St. Venant equations, which in turn are a specialized case of the Navier-Stokes equations for fluid flow. Physically, these equa-tions describe the flow of fluids under the influence of gravity and other body forces; they are based on conservation of mass and momentum. Through appropriate definition of initial and boundary conditions, these equations can be applied to a wide range of physical problems of interest to geoscientists. Potential applications include: hydrocarbon spill trajectory modeling, contaminant plume modeling, hydrocarbon reservoir modeling, flood modeling, and others.
Salons E–HDMT SDE
Adventures with ArcSDE Spatial Views
Miles Phillips, LandWorks, Inc.
Often ArcMap users have the need to view and analyze a subset of an ArcSDE layer, or to reorder and rename columns. ArcSDE spatial views provide an enterprise solution for creating and distributing these subsets without changing the source layer. This session will review the benefits and limitations of spatial views as well as how to create, modify and tune these views. Other related topics include incorporating functions in the spatial views, ordering polygons by area, and resolving DBMS privilege issues.
Session Descriptions • Tuesday, February 243:30 pm–4:30 pm (continued)

23
Near Time Update of SDE for Upstream Data
Christy Hopkins, InnerLogix/Schlumberger
As the number of wells being drilled and logged continues to increase, so does the amount of data generated. The data management challenge to this data influx is not just to provide an enterprise storage solution, but to monitor and catalog the arriving data in as near real time as possible so that it is easy to find and access.
Cataloging corporate data stores into SDE layers is common practice. These SDE layers are increasingly being used as an easy visualization for users to search for available data. If it is not kept up to date in near time, users will not trust that it is current and will either not use it or still go searching in other places.
We will present a new approach for populating the SDE layer that is a part of a broader data quality management initiative. By monitoring new data coming into the system we can use business rules to automatically quality control the data and update flags to identify the types of data available for each well. As a result of this process, SDE layers are updated in near real-time with quality scores, flags and information that is relevant to the end users and allows them to easily locate data for use in their analysis.
By embedding the update of the SDE layers into the data quality management process we increase end user confidence in the overall system. This reduces the time spent having to search for the latest well information, increasing their productivity and allows the company to better manage their investment in the acquisition of this data.
Your Partner for managing plant information
viasecure Deutschland GmbH® Karlstraße 13D- 45739 Oer - Erkenschwick
Tel: +49 23 68 / 699 19 -0Fax: +49 23 68 / 699 19 -29
Tel: +49 23 68 / 699 19 -0Fax: +49 23 68 / 699 19 -29
Do you know your plant?
Do you know where...
… to fi nd fi re fi ghting equipment
in the crude distillation unit?
Do you know who…
… could be affected by
a hazardous incident?
Do you know when...
… the cooling has
to be maintained?
Do you know…
… the benefi ts of the complete
plant information system?

25
Workshop Descriptions • Wednesday, February 25
8:30 am–10:00 am
Briarpark Room
Spatial ETL: An Exploration of Use Cases That Improve Data Interoperability in Oil and Gas
Ryan Cragg, Safe Software Inc.
Spatial ETL (extract, transform, load) is becoming a necessary step for many companies when addressing the diverse chal-lenges associated with accessing, restructuring, migrating, and loading spatial data. This session provides an in-depth explora-tion of different ways organizations in the oil and gas industry, including Chevron Canada Resources, Devon Canada and Talisman Energy, are using spatial ETL today to address a variety of data interoperability challenges. First, we’ll discuss how spa-tial ETL has been used by these organizations to translate and transform data in popular industry formats, including UKOOA, Z-MAP, SEGY, SEGP1, ASCII files, GeoRaster, PPDM-supported formats, as well as ESRI formats with measure support like SDE and Shape. Then, through a series of demonstrations, we will highlight how spatial ETL helps organizations efficiently distribute up-to-date spatial data for on-demand access. We’ll also illustrate how companies are using spatial ETL to spatialize attribute data, for example creating polygons for 3D seismic data from a relational seismic database. Plus, for organizations that need to frequently load data into a centralized warehouse or spatial databases, we’ll examine ways spatial ETL can help. Attendees will leave this session with a deeper understanding of the many ways spatial ETL can address common data interoper-ability challenges.
Richmond Room
Geodetic Datums, Coordinate Reference Systems and Transformations as Applied to the Petroleum Industry
Jim Cain, Cain & Barnes LP
Jim Cain will provide a general overview of Geodetic Datums, Geographic Coordinate Reference Systems (GeogCRS), Projected Coordinate Reference Systems (ProjCRS) and Datum Transformations used in the Petroleum Industry. The presenta-tion examines examples that clearly illustrate how incorrect assumptions about the underlying geodesy or cartography can lead to significant positioning errors for wells and/or subsurface structures. These errors can (and do) cost oil company opera-tors millions of dollars. This foundational presentation will be followed by more detailed presentations around Seismic and Enterprise spatial data integrity issues.
Use of the New Web Based EPSG Geodetics Registry for GIS Professionals
Sam Knight, EPSG Committee and Blue Marble
This presentation will highlight the newly implemented web based EPSG Geodetics Registry. Attendees will gain an apprecia-tion of the risks involved when handling geodetic data incor-rectly. The EPSG geodetics registry can be used as an input to geodetic transformation applications to ensure that any geo-detic data operations are based on sound and industry validated ellipsoids, projections, data definitions and transformations.
Salons A–D
The ArcGIS Platform and the Road Ahead
Clint Brown and Damian Spangrud, ESRI
The session will describe the overall ArcGIS platform build strategy, where the product is now and where it is going in the next iteration. We will try to describe what factors are shaping the 9.4 build such as participating in an increasingly connected world; collaborations tools; search methodologies for finding, organizing, and learning information; changing patterns of usage; and new hardware opportunities. In general, the goals of 9.4 are to update and expand ArcGIS (making it easier, more scalable, more connected); make it innovative (with new work-flow and new science), and make it expansive across the Web. After the presentation, there will be the opportunity for a Q&A.
26
Workshop Descriptions • Wednesday, February 258:30 am–10:00 am (continued)
Salons E–H
Joint PUG Metadata WG/Energistics Proposal
Scott Hills, Sr. Staff Scientist, Chevron Robert Graham, GIS Manager, BHP Billiton Petroleum Alan Doniger, Chief Technology Officer, Energistics Lisa Derenthal, Director, Gimmal Group
This session is less a workshop than a proposal to the PUG com-munity to resume and redirect an effort first begun by the PUG Metadata Working Group in May 2006. That previous effort engaged in its inaugural meeting 29 participants representing 17 companies and three standards organizations. The value proposition of that effort remains—realizing the potential of metadata to significantly improve the effectiveness with which users discover and utilize information resources—as do the two key tasks required to achieve that end:
1) Identify a minimum set of metadata attributes that should be populated for efficient search and discovery and effec-tive evaluation of relevance and suitability.
2) Identify a set of standard metadata keyword “facets” (dimensions, categories) relevant to the industry and associated vocabularies needed to enable discovery.
During this conference session, the development of a petroleum industry profile according to the ISO 19115 process will be proposed as a means to the above objectives. The proposal will be jointly presented with the industry standards organization Energistics. This partnership is expected to broaden the applica-bility and appeal of the industry profile and position Energistics to act as custodian of the profile and any other deliverables requiring long-term maintenance. The session will follow the agenda below:
• OverviewofpreviousPUGMetadataWGobjectives&activities
• AnalysisofpreviousPUGMetadataWGresults
• Proposalofrevisedobjectives
• Energisticspartnershipandproposedcustodialrole
• InvitationtoparticipateinajointPUGMetadataWG/Energistics project
Following the invitation to participate in the proposed project, an open discussion of opportunities and issues will provide attendees with an opportunity to further assess the value of contributing.
10:15 am–11:45 am
Briarpark Room
Managing Image Data on the ArcGIS Platform—Options and Recommended Approaches
Peter Becker, ESRI Steve Kopp, ESRI
This presentation will provide an overview of the strategic new developments on the ESRI platform to provide image manage-ment, processing, and dissemination capabilities. It will describe the workflows to collect, manage, produce, and exploit large collections of images and rasters. The workflow is based on the capability to catalog and then serve rasters as dynamic virtual mosaics with on-the-fly processing, returning not only the imagery as a backdrop but also the pixel values and detailed metadata, enabling their use in a wide variety of interpretation workflows. The solution resolves many of the issues associated with traditional image management approaches used in the petroleum industry and introduces a new era for raster data management on the ESRI platform.
Richmond Room
ArcGIS 9.3 Geodetics Update and Geodetics LIST Issues
Melita Kennedy, ESRI
The presenter will provide an update on new developments in the 9.3 Projection Engine and any changes to PUG LIST issues from a geodetics perspective.
Salons A–D
ArcGIS Explorer—Current Functionality and the Impending 900 Release
Bernie Szukalski, ESRI
ArcGIS Explorer is a geographic information browser offering an easy-to-use way to view, present, and disseminate geographic information. ArcGIS Explorer uses ArcGIS Online maps and lay-ers and can be used with other ArcGIS services (including ArcGIS Server, ArcIMS, and WMS) and locally available data. ArcGIS Online provides search and discovery capabilities that can be used to publish and share content and support a variety of com-munities. ArcGIS Explorer can be tailored to support different users and unique applications, which can be centrally managed and deployed throughout your organization. This session will present a practical overview of ArcGIS Explorer and will focus on
27
and introduce new additions and capabilities in ArcGIS Online as it relates to ArcGIS Explorer and the forthcoming ArcGIS Explorer 900 release.
In this session you will learn
• WhatArcGISExplorerisandhowitcanbeusedbyyourorganization
• WhatArcGISOnlineisandhowyoucanuseit
• UsingArcGISOnlineandArcGISServerwithArcGISExplorer
• HowtosearchandshareusingArcGISOnline
• HowArcGISExplorercanbecustomizedandtailoredtomeet specific user needs
• DifferentwaysthatArcGISExplorercanbedeployedandmanaged within your organization
Salons E–H
Tips and Tricks in ArcGIS
Jennifer Harrison, TeachMeGIS Karen Terry, TeachMeGIS
Have you ever upgraded to a new version of ArcGIS only to ignore the functionality in the new version and do things exactly the same way you did them before? Then come to this session which will feature some of the major changes that were made in version 9.2. This session will also point out some of the dif-ferences between versions 9.2 and 9.3. Learn new “Tips and Tricks” to help your workflow.
1:00 pm–2:30 pm
Briarpark Room
APDM and Pipeline User Meeting
Rob Brook, ESRI
This session will be an informal gathering of APDM and pipeline industry users. It will include a description of the APDM 5.0 model and its recent changes, an update on the current status of the PODS Spatial Geodatabase, and a discussion of common industry problems. The goals are to provide insights into the available pipeline data models and their recent updates and to gain the momentum needed to address current industry issues.
Richmond Room
Applied Geodesy for ArcGIS
Bish Karko, Devon Energy Chuck Lopez, SAIC/BP
Bish and Chuck will present their expert knowledge to demon-strate the correct implementation of a GIS based oil exploration project. The case studies will be based on operational Texas data, however, the principles apply worldwide. Seismic explo-ration and well datasets will be introduced. The audience will learn the following processes: set up project, determine project geodetic parameters, and introduction of raster and vector data based on a variety of Geographic Coordinate Reference Systems (GeogCRS) and Projected Coordinate Reference Systems (ProjCRS). In addition, correct creation of customized ProjCRS will be explained. Demonstrations will be given of the effects of erroneous representation of geodetic parameters for individual datasets. Questions and comments are encouraged to make this an interactive session.
Salons A–D
ArcGIS Server and Lightweight Viewers
Dal Hunter, ESRI Craig Williams, ESRI David Jacob, ESRI
The tools and concepts needed to create your first Web map-ping application with the ArcGIS APIs for JavaScript, Flex, and Silverlight will be presented.
The ArcGIS API for JavaScript is a lightweight way to embed your GIS maps and tasks in Web applications. It’s free to use and deploy applications built with this API. All you need is ArcGIS Server, whose maps and tools you can use in your application.
The ArcGIS APIs for Flex and Silverlight enable developers to cre-ate powerful and interactive applications by taking advantage of the GIS capabilities of ArcGIS Server and the rich capabilities of both the Adobe Flex framework and Microsoft Visual Studio.
In this session you will learn about
• FeaturesandfunctionalityoftheArcGISAPIsforJavaScript,Flex, and Silverlight
• RichInternetapplications(RIA)
• StarterkitsforJavaScriptandFlex
The seminar is designed for developers of both simple and advanced Web mapping applications who would like to com-bine the characteristics of RIAs with powerful ArcGIS Server services. Participants should be familiar with the basic concepts of ArcGIS Server and Web application development.

28
Salons E–H
LIST Update—Geodatabase, Server, Mapping, and Pipeline Topics
Craig Gillgrass, ESRI Craig Williams, ESRI David Watkins, ESRI
Presented to the PUG Enhancement LIST Web site, user representatives will discuss progress in the areas of geodatabase, server, mapping, symbology, and scripting in a moderated open dialog. If time permits, questions will be taken.
2:45 pm–4:15 pm
Briarpark Room
Customising the APDM
John Linehan, GISP, Enbridge Energy Company
Many pipeline companies have opted to use a structured model to contain their corporate information. The ArcGIS Pipeline Data Model (APDM) is a template that is available to all, however as a template, the model has limited structure and content. This limitation may challenge the novice APDM user to expand the model to fit the needs of the company. This paper will discuss the limitations of the downloaded model and how to add new or customize existing features.
The paper will illustrate to the novice user:
1) The overall model architecture
2) The purpose of the CORE structures
3) The utility of the Abstract and Class structures
4) Adding or modifying Domains
5) Adding or modifying the Concrete structures
6) Building relationships
7) Using CASE tools
Workshop Descriptions • Wednesday, February 251:00 pm–2:30 pm (continued)
Richmond Room
Truth or Consequences—The Cost of Poor Mapping in the Petroleum Industry
Jonathan Stigant, Devon Energy
The Petroleum Industry is experiencing an exponential increase in dependence on GIS technology for projects and operations. Routinely, we integrate expensive and sophisticated datasets using layer mapping. However, good coordination and manage-ment of GIS activities as an enterprise-wide activity is proving to be an elusive and difficult target. Inadequate training in geodetic principles, distributed data sources and computer applications and a variety of quality in both, can generate some serious mis-matching of data and potentially misleading map products. The geospatial integrity and quality control process is vital because many major and expensive decisions are made based on these map products. This paper makes a business case for strong corpo-rate policies and guidelines, building on the sciences of geodesy and cartography, management of data loading, proposing and drilling prospects, developing reliable plans for development and production, and encouraging cooperation with data and software vendors in improving the spatial quality of their products.
Salons A–D
ESRI’s Mobile Solutions
Damian Spangrud, ESRI Dal Hunter, ESRI Jian Huang, ESRI
ESRI is moving forward with a range of mobile GIS deploy-ment strategies including the ArcGIS Server Mobile Application Development Framework (ADF), ArcLogistics, Tracking Server, and ArcPad. The rationale for these different development streams, their current functional capabilities, and user case studies will be presented to illustrate their versatility and business value.
Salons E–H
LIST Update—Geoprocessing, Raster, and 3D Topics
Rich Priem, Priemere Geo Technology Steve Kopp, ESRI Peter Becker, ESRI Dale Honeycutt, ESRI
Presented to the PUG Enhancement LIST Web site, user representatives will discuss progress in the areas of geoprocessing, raster, and 3D topics in a moderated open dialog. If time permits, questions will be taken.

Get immediate online access to over 5 million km2 of high precision, accurate imagery of the world’s oil and gas basins with a subscription to the new ImageConnect: Oil & Gas service, only from DigitalGlobe—owner of the world’s most advanced commercial satellite constellation.
We already have on-hand the geographic areas important to upstream oil and gas exploration—oil basins, refineries, pipelines, and high interest geological areas around the world. And more is being added each quarter. Now premium imagery for monitoring and exploring oil fields and facilities is easily within reach, both economically and physically.
1.303.684.4561 1.800.496.1225
Want to learn more? See a demo?
i n s t a n t ly .
ImageConnect is available as an easy to use plug-in for ArcGIS® or Web Map Service (WMS).
Increase visibility into potential expansion areas
Select the best location for infrastructure placementin remote and rugged terrain
Quickly monitor facilities and reclamation areas by reducing the time and operational costs associated with onsite monitoring and surveying
GET REAL-WORLD PERSPECTIVE YOU CAN RELY ON
www.digitalglobe.com/start/oilgasep
With ImageConnect: Oil & Gas, you can:
See the world’s most prolific oil and gas producing regions,
Visit booth #504
to learn more or see a demo!
PETRO-347_ESRI_PUG_K.indd 1 1/21/09 11:50:57 AM
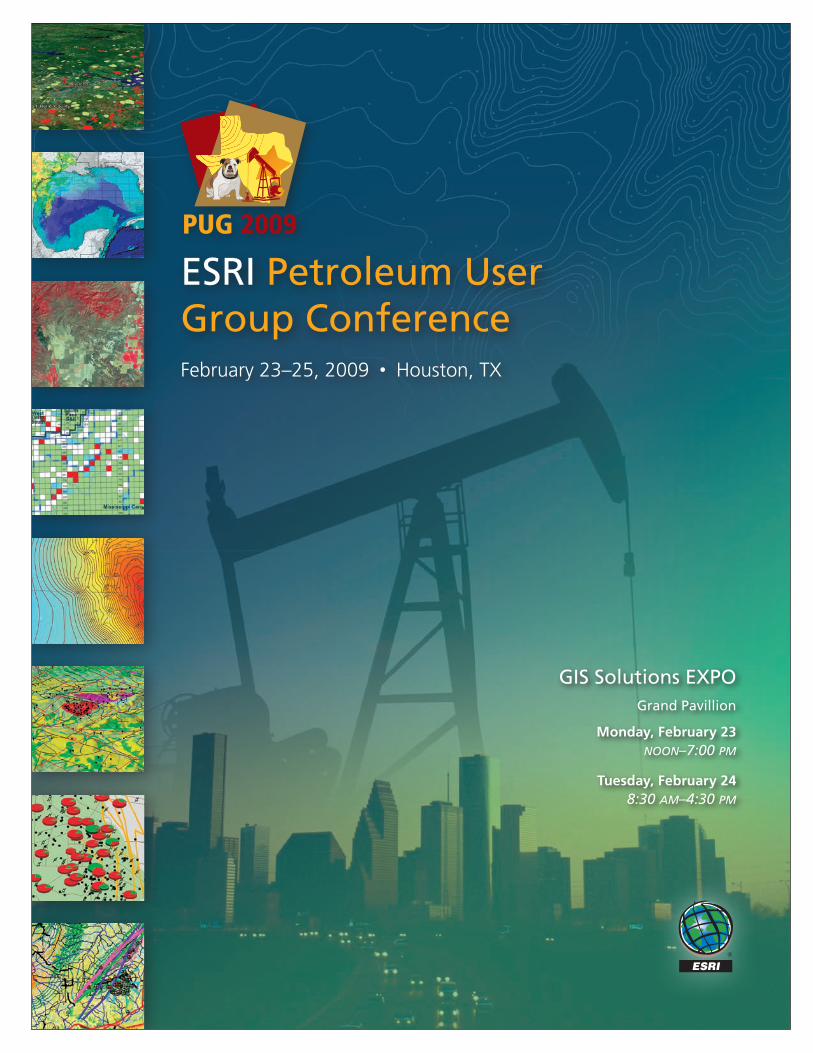
ESRI Petroleum User Group ConferenceFebruary 23–25, 2009 • Houston, TX
GIS Solutions EXPOGrand Pavillion
Monday, February 23noon–7:00 pm
Tuesday, February 248:30 am–4:30 pm
PUG 2009

32
EXPO Floor Plan and Booth Locations
Booth Exhibitor100 IntraSearch DBA MapMart104 viasecure Deutschland GmbH105 New Century Software, Inc.106 Lynx Information Systems Inc.108 IHS109 OpenSpirit110 Global Information Systems114 CGI Technologies and Solutions Inc.115 DeLorme116 CygNet Software118 Wood Mackenzie204 XEOS Imaging Inc.205 Petris206 Western Data Systems207 Photo Science208 Blue Marble Geographics209 P2 Energy Solutions210 PennWell MAPSearch214 Surdex Corporation215 Tessellations Inc.219 APDM221 PODS Association304 Exprodat Consulting Ltd.
9/12/2008 10:40:48 AM
ESRI PUG
HOUSTON MARRIOTT WESTCHASEGRAND PAVILION
FEBRUARY 23-25, 2009
ENTRANCE
SCALE0 5' 10' 20' 30' 40'
DRAWING NUMBER: 090204DRAWN BY: R. O'CONNELLDRAWN DATE: 09-11-08REVISED:
Blaine Convention Services has made every effort to ensure the accuracy of all the information and plans provided however, due to facilities expansions and changes current information is not always available.Blaine Convention Services can make no warranties to the accuracy of floor plans issued pertaining to the exposition. If location of building columns, utilities, or components of the facility are a consideration in the construction of an exhibit, it is the responsibility of the exhibitor or their agent to physically inspect all dimensions and locations.
GRAND FOYER
ME
AD
OW
GLE
N R
OO
M
ALL FIRE EQUIPMENT TOREMANE VISIBLE AND ACCESSABLE
85 - 8'x10' BOOTHS
311
305
309
307
315
319
321
411
405
407
409
415
419
421
511
507
509
513
517
515
519
116
114
106
100
102
104
108
110
118
111
107
109
115
210
204
208
206
214
211
205
209
207
215
219
221
310
304
308
306
314
318
320
410
404
408
406
414
418
420 520
518
514
506
508
504
510
706705704703702701700
105
600 601 602 603 604 605 606 607
9'-10"
707
6310 CABALLERO BLVD. BUENA PARK, CA 90620(714) 522-8270 FAX (714) 522-8271
9'-10" 9'-10" 9'-10" 9'-10"
11'
10'
EXIT EXIT EXIT
EXIT
R
OLL
UP
FR
EIG
HT
DO
OR505
LAST INFIRSTOUT
10'
9'
BCS SERVICE
EXIT
EXIT
511
507
509
513
517
515
519
505LAST INFIRSTOUT
505
Fire
Exit
2009 PUG EXPOHouston Marriott WestchaseGrand Pavilion
105
109
602
209 308
604
309
405
409
504
508
Grand Foyer
Entrance EntranceEntrance
ESRI
Booth Exhibitor305 Gimmal Group306 Energy Graphics307 RDI308 Schlumberger Information Solutions309 GeoFields314 The WhiteStar Corporation315 Data East, LLC318 Safe Software319 Allpoints GIS320 OneMap, Ltd.321 Latitude Geographics Group Ltd.404 Valtus Imagery Services405 Coler & Colantonio Inc.406 Willbros Engineering/EPC408 Applied Field Data Systems Inc.409 petroWEB410 CartoPac Field Solutions414 Idea Integration415 Geomap Company418 Neuralog419 geoLOGIC systems ltd.420 Merrick & Company421 Quorum Business Solutions, Inc.
Booth Exhibitor504 DigitalGlobe505 Fugro508 Petrosys USA, Inc.509 Premier Data Services, Inc.511 TouchTable, Inc.513 Spatial Energy514 GE Oil & Gas, PII Pipeline Solutions515 Geonamic Systems517 ISA Americas, Inc.518 U.S. Geological Survey519 Chevron Energy Technology520 GeoDecisions600 Deloitte601 Blue Sky Development, Inc.602 Landmark Graphics Corp.604 HTSI, Inc.606 GIS Technology, Inc.607 Eagle Information Mapping700 TeachMeGIS701 Circle Twelve Inc.702 Wacom Technology705 ITT Visual Information Solutions706 Hyland Software, Inc.707 LandWorks, Inc.

33
ESRI Would Like to Thank Our Sponsors . . .
Gold Sponsors
Platinum Sponsors
Social Sponsors
34
Allpoints GIS—319 www.allpointsgis.comWe provide ArcGIS training and workshops geared specifically to oil and gas—featuring geoscience, production, land, culture, and corridor data in real-world scenarios, led by instructors with 20+ years in the patch. Getting your people ready [enterprise-wide GIS training]. Getting your data ready [consulting/services]. Specializing in your industry [E&P/PL].
APDM—219 www.apdm.netThe ArcGIS Pipeline Data Model (APDM) is a robust and publicly available geo-relational database model for managing informa-tion pertaining to gas and liquid piping systems. APDM provides the power of a spatially enabled database designed to fully leverage ESRI’s ArcGIS technologies. Version 4.0 and supporting documentation are available at www.apdm.net.
Applied Field Data Systems Inc.—408 www.afds.netAFDS offers GIS and GPS mapping hardware and software including GPS receivers, PDA, Laser range finders, GPS enabled camera, Electronic Locators and markers. In addition, we offer GIS applications, data management and data conversion services.
Blue Marble Geographics—208 www.bluemarblegeo.comBlue Marble Geographics of Gardiner, Maine is a leading devel-oper and provider of geographic software products that provide sensible solutions for users and developers of geographic data. Blue Marble has been writing GIS software tools and solutions for 15 years and currently serves hundreds of thousands of users worldwide.
Blue Sky Development, Inc.—601 www.blueskydev.comBlue Sky Development, Inc. is a software vendor providing desktop and web tools that merge the CAD and GIS worlds via the concept of “transitional GIS.” We are providing innovative solutions for pipeline data management and automated sheet generation utilizing the latest in state of the art technology.
CartoPac Field Solutions—410 www.cartopac.comSince 1999, CartoPac Field Solutions, powered by Spatial Data Technologies, has focused on delivering software and hardware services for customizing and distributing complete mobile map-ping and field data collection solutions. The CartoPac Enterprise suite of mobile technologies manage many of the complexities found in traditional GIS/GPS applications behind the scenes to deliver faster, more productive solutions to a much broader range of field staff.
CGI Technologies and Solutions Inc.—114 www.cgi.com/oilandgasCGI Map brings geographic, land, well and other information to your desktop. The system integrates mapping, retrieval, browse and powerful spatial data analysis tools with the ease-of-use and intuitiveness of a geographic information system. Via ESRI’s ArcView, CGI Map gives you the power to visualize, explore, query and analyze information held in your lease records system.
Chevron—519www.chevron.comChevron is the second largest U.S-based integrated oil company. Chevron is using ArcGIS to develop a “Life of Field Planning Tool” (LOFPT) to support their subsea efforts. Chevron’s subsea engineering, GIS, and ROV-Simulation team seeks feedback on their program from the ESRI Business Partner and User Communities. Come visit us at Booth 519.
Circle Twelve Inc.—701www.circletwelve.comCircle Twelve is the exclusive source for the DiamondTouch table, the world’s first multiuser touch technology—perfect for collaborative activities like GIS. Circle Twelve also offers the DT Collaborate extension for ESRI’s ArcGIS, which enables new multi-touch and multi-user features in ArcMap when operating on the DiamondTouch table.
Platinum Sponsor
Coler & Colantonio Inc.—405 www.col-col-geospatial.comColer & Colantonio, Inc. is a leader in supplying the Energy Industry with ESRI based solutions to manage pipeline assets. Our pipeline data management solution allows our clients to manage the full life cycle of the pipeline assets within the Geodatabase and supports various standard data models includ-ing APDM and PODS.
CygNet Software Inc.—116www.cygnetscada.comCygNet Software leads the O&G industry with a new genera-tion of enterprise operations software. Designed to create an information ecosystem, CygNet’s solutions enable organizations to improve operational efficiency and market responsiveness, while complying with increasing regulatory initiatives. Users are capable of visualizing operations, asset and business data in spatially accurate formats to enhance their effectiveness.
Exhibitor Descriptions
35
Data East, LLC—315 www.dataeast.ruData East is a leading Russian company providing GIS software development and consulting services. We take part in ESRI’s devel-opment projects and provide our own GIS products for ArcGIS users including popular XTools Pro. Provided solutions are based on the full range of ESRI software and powered by highly skilled staff.
Deloitte—600 www.deloitte.com/petroleumservicesDeloitte’s integrated suite of subscription-based Information Solutions allows for the ability to visualize oil and gas informa-tion from spatial, financial and reporting perspectives. Our expertise, extensive databases, economic modeling framework and data management technology is helping companies to gain greater market insight and a competitive advantage in this fast-moving global industry.
DeLorme—115 www.delorme.comDeLorme offers a variety of world-wide and North American vector and raster geo-data sets for use in GIS software plat-forms. DeLorme also provides ESRI extensions for its GPS data collection and navigation tools applied across a variety of Professional mapping applications. DeLorme—cartographic excellence since 1976.
Platinum Sponsor
DigitalGlobe—504 www.digitalglobe.comDigitalGlobe is the leading source for World Imagery Solutions. Sourced from our own advanced satellite constellation (QuickBird, WorldView-1 and, coming Q3-2009, WorldView-2) and aerial network, we deliver real-world perspective you can rely on. We collect nearly 1 million km2 of quality imagery every day, building one of the world’s largest ImageLibraries.
Eagle Information Mapping—607 www.eaglemap.comEagle Information Mapping’s philosophy is simple, honest and from the heart—”We are dedicated to our customers and we continually provide state-of-the-art technology and unsurpassed service through integrity, dedication and ingenuity. Simply put, we are Eagle—the Benchmark in GIS Solution!”
Gold Sponsor
Energy Graphics—306 www.energygraphics.comEnergy Graphics markets comprehensive data reporting, man-agement and mapping tools, plus a suite of proprietary oil and gas exploration databases. We have provided the exploration industry with high quality data, software and services since 1979.
Exprodat Consulting Ltd.—304 www.exprodat.comExprodat Consulting Ltd. is a leading GIS software, training and consultancy company. We make GIS software tailored to specific E&P business processes as well as generic GIS software. Exprodat has developed a number of GIS products, including the Team-GIS product suite for ArcGIS Desktop (comprising acreage analysis and data access tools).
Platinum Sponsor
Fugro—505 www.fugroearthdata.com www.fugro-data.com www.fugro-robertson.comFugro EarthData, a leading provider of mapping and GIS solu-tions, uses airborne mapping technologies to provide clients with high-quality geospatial data. Our acquisition-to-production resources and continual technology investments enable us to effi-ciently deliver state-of-the-art geospatial products and services.
Fugro Data Solutions provides integrated ESRI ArcGIS Data Management software and services specifically for the E&P industry.
Fugro Robertson provides innovative and integrated products, data, and services for new ventures, exploration, appraisal, development and production teams.
GeoDecisions—520 www.geodecisions.comGeoDecisions is an information technology company specializing in geospatial solutions. We deliver strategic geographic informa-tion systems (GIS) and information technology (IT) solutions and applications to empower government, military, transportation, and private/commercial clients to make smarter, more-informed decisions.
Platinum Sponsor
GeoFields—309 www.GeoFields.comGeoFields provides proven data management solutions designed to meet the unique data integration, analysis and regulatory requirements of the oil and gas pipeline industry. Services include asset data management, risk assessment and integrity management, pipeline database development, field operations, reporting support, data and application hosting, project data management and consulting.

36
Gold Sponsor
GE Oil & Gas, PII Pipeline Solutions—514 www.ge.com/piiGE’s PII Pipeline Solutions is a global leader in pipeline integrity management services for the oil and gas industry. The company provides pipeline integrity solutions including pipeline GIS and integrity software as well as GIS and integrity management services.
geoLOGIC systems ltd.—419 www.geologic.comgeoLOGIC systems ltd. provides data and decision support tools for the petroleum industry. geoLOGIC’s data centre, the gDC, is based on the standards from the Professional Petroleum Data Management Association (PPDM) and is the first of its kind in North America. geoLOGIC also offers mapping and other analysis tools.
Geomap Company—415 www.geomap.comGeomap Company provides customers with objective interpreta-tions that save time and money when investigating new areas. Our Geologic Mapping Services give subsurface interpretations which are updated by experienced geologists on a regular basis and includes Library Membership, which allows customers to access well logs, scout tickets production data and reference materials at all 4 Library locations.
Geonamic Systems—515 www.geonamic.comGeonamic Systems, Inc., develops and implements ESRI’s ArcGIS for oil/gas pipeline industry. Geonamic’s pipelineSoft solution is a powerful collection of software for maintaining pipeline facility data and managing integrity program. Geonamic also provides professional services to help clients meet regulatory requirements, including risk assessment, spill modeling, and HCA analysis.
Gimmal Group—305 www.gimmal.comGimmal is a consulting services company focused on content integration. We specialize in GIS and enterprise content man-agement (ECM) solutions, from planning and strategy through system implementation. We work with clients to deliver best-of-breed solutions with customized and off-the-shelf tools from ESRI, Microsoft, and leaders in content and spatial systems.
GIS Technology, Inc.—606 www.gistech.comGIS Technology, Inc. (GTI) links GIS with content management systems via PlaceLynx for ArcGIS. With strategic alliances with both ESRI and Documentum, GTI enables ESRI’s petroleum users to access documents and other content from the GIS through bi-directional integration with ArcGIS Server, ArcIMS, and ArcMap.
Global Information Systems—110 www.globalinformationsystems.comGlobal Information Systems is a customer service focused GIS applications company for the energy industry. We develop highly reliable, user configurable applications that work with the ESRI APDM and PODS data models. Additionally we provide both on-site and project level GIS data and analysis services within the ESRI software domain.
Platinum Sponsor
HTSI, Inc.—604 www.htsidata.comHTSI, Inc. is a provider of GIS Data, GIS Consulting, Computer Hardware for GIS, Maps, and we offer a full range of Scanning Services and Technology Services to a broad range of markets and customers.
Hyland Software, Inc.—706 www.OnBase.comOne of the largest independent software vendors in the world of enterprise content management (ECM), Hyland Software is the developer of OnBase. An award-winning suite of document and process management solutions, OnBase has a proven record of solving problems resulting from time consuming, costly and error plagued manual tasks.
Social Sponsor
Idea Integration—414 www.idea.comAn ESRI Business Partner since 1988, Idea Integration is an IT consulting services firm providing leading-edge enterprise solu-tions, including world-class GIS implementation and customiza-tion projects for over 22 years. Idea’s geospatial services include strategy development, system and database design, application development, neo-geography development, end-user support services, and GIS analysis services.
IHS—108 www.ihs.com/energyIHS Enerdeq® Web Services provides hands-free access to all of your data sources via your ESRI map environments. It’s a way to combine your data and ours in a powerful spatial view. IHS products and people help clients reduce uncertainty and make informed decisions every day.
Exhibitor Descriptions
37
IntraSearch DBA MapMart—100 www.MapMart.comIntraSearch DBA MapMart is a fully integrated aerial photogra-phy and digital topographic mapping company. The company has provided aerial services to energy, mining, and engineering companies for the past 52 years.
ISA Americas, Inc.—517 www.isaamericas.comISAA provides solutions to bridge the gap between interpreta-tion and GIS environments. Used by companies around the globe, ISAA’s software tools help streamline the transfer of data to where geoscientists need it most.
ITT Visual Information Solutions—705 www.ittvis.com/enviITT Visual Information Solutions presents ENVI, the premiere software solution for extracting timely and accurate information from imagery. Visit Booth 705 for demonstrations on feature extraction, change detection, orthorectification, classification and ArcGIS integration. Make your image processing and analy-sis workflow faster and easier with ENVI.
Platinum Sponsor
Landmark Graphics Corp.—602 www.halliburton.com/landmarkLandmark is the leading supplier of software and services for the upstream oil and gas industry. The company’s software solutions span exploration, production, drilling, business-decision analysis and data management. Landmark offers a broad range of consult-ing, services and infrastructure technologies that enable customers to optimize their technical, business and decision processes.
LandWorks, Inc.—707 www.landworks.comwww.geodynamic.comLandWorks, Inc. is a leading software and services provider of Enterprise Land Management solutions fully integrated with ESRI GIS. Its subsidiary Geodynamic Solutions, Inc. specializes in enterprise GIS software products, custom GIS application devel-opment, and GIS consulting services based upon the entire suite of ESRI GIS technology.
Latitude Geographics Group Ltd.—321 www.geocortex.comA division of Latitude Geographics Group Ltd., Geocortex pro-vides a suite of proven products, services and knowledge that organizations can use to deliver effective, successful web-based mapping using ESRI’s ArcGIS Server and ArcIMS. With success stories across North America, we help clients create top-notch web-based GIS implementations.
Gold Sponsor
Lynx Information Systems Inc.—106 www.lynx-info.comLynx Information Systems, Inc. is a global provider of technology based services and software solutions to the oil and gas industry as well as an ESRI business partner. The company’s products include, but are not limited to seismic scanning and vectoriza-tion, software development, GIS data management and non-exclusive GIS Exploration Advisers.
Merrick & Company—420 www.Merrick.comMerrick & Company provides comprehensive, client-focused land information services, including image acquisition (aerial and satellite), GPS Surveying, digital photogrammetry, Light Detection and Ranging (LIDAR), digital imaging, digital orthophotography processing, LiDAR software tools (MARS®), GIS database design and application programming.
Neuralog—418 www.neuralog.comNeuralog introduces NeuraDB, an enterprise data repository especially for well logs, master well data, general well files, well and other structured and unstructured data. Industry-unique data quality improvement workflows are included and customiz-able. NeuraDB is an ESRI plug-in to compliment your existing infrastructure. NeuraDB provides instant data access throughout your organization.
Platinum Sponsor
New Century Software, Inc.—105 www.newcenturysoftware.comNew Century Software is a leading provider of pipeline GIS solutions for the oil and gas industry. The company offers applications and services in the following areas: Enterprise GIS Implementation * Integrity Management * Data Loading & Management * Mapping & Reporting * Custom Applications
OneMap, Ltd.—320 www.onemap.comLeveraging surface ownership data in GIS with timely, up-to-date, cost effective, and flexible solutions for managing land assets and leaseholds, planning and developing infrastructure and pipelines, and overall intelligent and efficient operations.
38
Platinum Sponsor
OpenSpirit—109 www.openspirit.comAsset teams must be able to access, visualize, interpret and model a wide variety of structured and unstructured data coming from diverse sources. OpenSpirit integrates upstream applications and data stores, improving the efficiency and pro-ductivity of geoscientists, geotechnical specialists and database managers and enabling senior managers to make better deci-sions while reducing costs.
Platinum and Social Sponsor
P2 Energy Solutions—209 www.p2es.comWe are the energy industry’s most comprehensive source of business information solutions. Our product lines range from accounting, financial, production and land management applica-tions, to map data and GIS tools, to hosting and outsourcing ser-vices. Our 550 functional experts have many years of oil and gas experience and our products are developed specifically for and used by more than 450 E&P companies. We can provide insight and solutions to upstream business like no other company.
PennWell MAPSearch—210 www.mapsearch.comPennWell MAPSearch publishes GIS data for the Energy Industry. Petroleum sector data includes Natural Gas, Crude, Refined Products, LPG/NGL and Petrochemical pipelines and correspond-ing facilities. MAPSearch petroleum data coverage includes the United States, Canada, Mexico, Gulf of Mexico, and the Middle East. MAPSearch also offers Electric Power geodata.
Petris—205 www.petris.comPetris develops and markets software-based, vendor-neutral solutions that can greatly reduce project cycle times, saving money for all stakeholders in a business process. Our deep knowledge of the energy industry allows us to deliver solutions that match the unique needs of our clients.
Platinum Sponsor
Petrosys USA, Inc.—508 www.petrosys.com.auEvery masterpiece begins with a drawing. Petrosys gives you the creative freedom to explore all possibilities that lead to more valuable conclusions and the dynamic maps it takes to present them. Combine extraordinary mapping, 3D visualization and surface modeling, with all your data sources to unearth a mas-terpiece with Petrosys.
Platinum Sponsor
petroWEB—409 www.petroWEB.competroWEB provides an enterprise scale GIS integration platform for accessing data and applications across the enterprise. This cohesive interface/framework retrieves data from internal and external sources, provides visualization tools to view/analyze the data, and integrates disparate data into geosciences/business workflows. Web pages, web services, smart client applications and 2D/3D GIS are seamlessly integrated.
Photo Science—207 www.photoscience.comPhoto Science is a Geospatial Solutions firm specializing in aerial imaging and data collection, photogrammetry, GIS, remote sensing, and surveying services; providing a full spectrum of services to our clients.
PODS Association—221 www.pods.orgThe PODS Association is a non-profit industry standards orga-nization comprised of volunteers who are worldwide industry experts. Together they bring a round table approach to engineer standards for a business-driven pipeline data model. The PODS (Pipeline Open Data Standard) Association ensures that the model will meet today’s and tomorrow’s needs.
Premier Data Services, Inc.—509 www.premierdata.com/Premier Data Services, a Division of XeDAR Corporation, pro-vides LIS and GIS products/services to oil and gas companies and professionals. Premier’s internet based PDS Studio application, www.pdsstudio.com (an ArcIMS software-powered tool) allows users to quickly and easily view, export, report on, and print Federal and state land data layers and maps for the oil and gas industry.
Quorum Business Solutions, Inc.—421 www.qbsol.comQuorum Business Solutions, Inc., an ESRI authorized business partner, develops, implements, and supports software applica-tions for the oil and gas industry. Quorum’s GIS enabled applica-tions include Quorum Land Suite and Quorum Right-of-Way Suite. Founded in 1998, Quorum has over 350 staff operating out of offices in Houston, Dallas, and Calgary.
RDI—307 www.resdat.comResource Data, Inc. (RDI) is a custom software and GIS develop-ment company with over 20 years experience delivering solu-tions to the oil and gas industry.
Exhibitor Descriptions

39
Safe Software—318 www.safe.comSafe Software is the recognized leader in spatial ETL. Its plat-form, FME, unleashes spatial data to be used where, when, and how it’s needed. It delivers the most extensive format support for data translation and integration, and provides unlimited flex-ibility in data model transformation and data distribution.
Platinum Sponsor
Schlumberger Information Solutions—308 www.slb.com/content/services/index_sis.aspSchlumberger Information Solutions brings open, innova-tive solutions that unlock the potential of our clients’ asset teams. This value is further enhanced through the integration of best-of-breed, market-leading E&P subsurface, Information Management and GIS technologies provided through workflow integration with solutions from ESRI across our key offerings. Come see us at the PUG, booth 308, and explore these exciting directions with us.
Spatial Energy—513 www.spatialenergy.comSpatial Energy is the source for digital imagery, enterprise data management, and analysis services for the energy industry. Spatial Energy acquires, processes, and manages the most exten-sive collection of high resolution satellite and aerial imagery, topographic maps, and DEMs. Our goal is to reduce the cost, time and effort required to acquire imagery for all of your needs.
Surdex Corporation—214 www.surdex.comSurdex has been recognized as a premier geospatial data pro-vider since 1954. Surdex provides orthophotography; planimet-ric and topographic maps; LiDAR; and geographic information solutions to various clients in the oil and gas industry. A distin-guisher for Surdex is our commitment to helping these clients achieve their overall objectives.
Gold Sponsor
TeachMeGIS—700 www.teachmegis.comTeachMeGIS.COM, the training branch of Inner Corridor Technologies, Inc., is a leader in GIS training and consulting. Staffed with GIS professionals who have extensive industry experience, our ESRI Authorized Partner Education Center offers high quality training at a reasonable price.
Tessellations Inc.—215 www.tessellations.usTessellations, established in 1998 to serve the Houston Area with high quality GIS and Remote Sensing services. Services include on-site user support, end-to-end GIS consulting services, application development, raster data management and image processing. Tessellations’ ESRI authorized trainers provide several GIS classes and customized curriculum development. Training can be conducted at your site or at our training center.
TouchTable, Inc.—511 www.touchtable.comTouchTable develops integrated hardware and software systems that enable local and geographically dispersed teams to visual-ize, analyze and efficiently interact with large quantities of information. TouchTable’s solutions are designed to promote dynamic analysis among a broad set of participants, leading to a more complete understanding of the situation.
U.S. Geological Survey—518 www.usgs.govThe U.S. Geological Survey (USGS) conducts research and assessments of hydrocarbon resources worldwide. This infor-mation is used for energy planning and policy. GIS plays an important part in USGS research and in the dissemination of that information. Examples of web and cd publications will be available at the USGS booth.
Gold Sponsor
Valtus Imagery Services—404 www.valtus.comValtus provides end-to-end solutions for the storage, manage-ment and delivery of geospatial information in the form of aerial and satellite imagery and LiDAR data. Customers seamlessly access their own proprietary data and the large Valtus database through OGC web services or as downloadable files from our online store.
Gold Sponsor
viasecure Deutschland GmbH—104 www.viasecure.euSince 1990, viasecure has been very much involved in the whole area of safety. The professionals at viasecure develop a plant information system called complis based on ArcGIS Server technology in line with the requirements of the customer. The information system is dynamically adapted to the particular needs of the customer.
40
Wacom Technology—702 www.wacom.comThe Wacom interactive pen display gives GIS professionals an unprecedented level of control, comfort, and productivity. By using a Wacom pen directly on the screen, geologists find they can easily edit maps as well as manage, analyze, and dissemi-nate geographic information individually or in a group setting.
Western Data Systems—206 www.westerndatasystems.comWDS is an authorized Trimble dealer specializing in the sales, rentals, training and technical support of Trimble Mapping, Surveying, Marine and Machine Control Products.
The WhiteStar Corporation—314 www.whitestar.comA leading provider of base map information to the Petroleum Industry, WhiteStar provides accurate, topological data layers for the United States and Canada including public land survey, government lots and tracts, well and production information, pipeline data, orthophotos (DOQQs), elevation data (NED), scanned topos (DRGs); Web services and more.
Exhibitor Descriptions
Willbros Engineering/EPC—406 www.willbros.comFor 100 years, Willbros Group, Inc. has served the oil, gas and power industries. We provide construction and engineering services worldwide, specializing in pipelines and associated facilities. As an extension of our construction and engineering services, we are actively involved in asset development, owner-ship, operations, integrity management, and GIS development.
Wood Mackenzie—118 www.woodmac.comWood Mackenzie has been providing its unique range of consulting services and research products to the Energy, Metals, & Mining industries for over 30 years. Our market proposition is based on our ability to provide forward-looking commercial insight that enables our clients to make better business decisions.
XEOS Imaging Inc.—204 www.xeosimaging.comXEOS Imaging Inc. is the North-American leader in high-resolution digital imagery offering solutions to simplify the management of linear infrastructures and territories. Building its experience since 1988, our team never stopped innovating since that period of time.
Lynx Information Systems, Inc.
Data Management and Integration Products and Services
● World Wide Non-Exclusive GIS Based Digital Data Packages ●Comprehensive studies integrating a wide range of geological and
geophysical data within a powerful ESRI® ArcGIS® environment
● GIS Consulting & Data Management Services ●Custom GIS products enabling companies the ability to
quickly access and use their data
● Seismic Scanning & Vectorizing ●Base and Contour Map Digitizing
Well Log Digitizing Digitizing, vectorizing and georectifiying of hard copy or raster data
www.lynx-info.comVisit our website to explore the world!
16420 Park Ten Place, Suite 150Houston, TX 77084 USA
Tel: (281) 599-7226Fax: (281) 599-7790
We invite you to booth #106 for a demoESRI trademarks provided under license from ESRI
Houston - London
AUTHORIZEDBUSINESS PARTNER

41
2009 PUG Conference Survey
Rate the overall content of the Plenary Session.1. oVery Valuable oNot Very Valuable
oValuable oOf No Value
oOf Some Value oDid Not Attend
What was most valuable to you in the Plenary 2. Session?
What topics or speakers would you like to 3. suggest for future plenary sessions?
Rate the meetings/activities you attended.4.
Very
Val
uabl
e
Valu
able
Of S
ome
Valu
e
Not
Ver
y Va
luab
le
Of N
o Va
lue
No
Opi
nion
Plenary SessionKeynote Speaker
Plenary SessionESRI Technical Demonstrations
Plenary SessionGIS Leaders Panel Discussion
Plenary SessionUser Presentations
MondayGIS Solutions EXPO and Evening Reception
TuesdayPaper Sessions
TuesdayGIS Solutions EXPO
TuesdayPUG Social
WednesdayTechnical Workshops
WednesdayClosing Session
What did you find most valuable in the sessions 5. that you attended?
What session topics would you recommend be 6. offered at future events?
Did the PUG Conference fulfill your reasons for 7. attending?oYes, absolutely.
oYes, but not to the full extent.
oNo.
How likely are you to recommend this conference 8. to a colleague?oDefinitely Would oProbably Not
oProbably Would oDefinitely Not
oMight or Might Not oNo Opinion
What would you tell colleagues who are 9. considering attending this conference?
What comments or suggestions, if any, do you 10. have to improve future conferences?
May we include your comments as testimonials in 11. future ESRI promotional materials? If so, we will contact you to obtain permission before publication.oYes
oNo
Name:
Title:
E-mail Address:
Organization:
Thank you for your feedback.
Thank you for attending. Help us plan future conferences by answering the questions below. Every survey is read and used to make improvements for future events. The survey is also available at www/esri.com/pug.

Your way. Today.
© 2009 Halliburton. All rights reserved.
HALLIBURTON
R5000 is a comprehensive release of
Landmark software for DecisionSpace®,
which enables more efficient E&P workflows
through the integration of your preferred
applications and data.
Use the applications you want.
Access the data you need.
Optimize the workflows you create.
www.halliburton.com/decisionspace
DecisionSpace: Open for Innovation.
H005-09 PUG Agenda.qxd:H005-09 PUG Agenda.qxd 2/10/09 10:08 AM Page 1
43
Important Contacts
Name ____________________________________________ Company ____________________________________________
Address __________________________________________ City _________________________ State/ZIP _______________
Phone ____________________________________________ E-mail _______________________________________________
• • • • • • • • • • • • • • • • • • • • • • • • • • • • • • • • • • • • • • • •
Name ____________________________________________ Company ____________________________________________
Address __________________________________________ City _________________________ State/ZIP _______________
Phone ____________________________________________ E-mail _______________________________________________

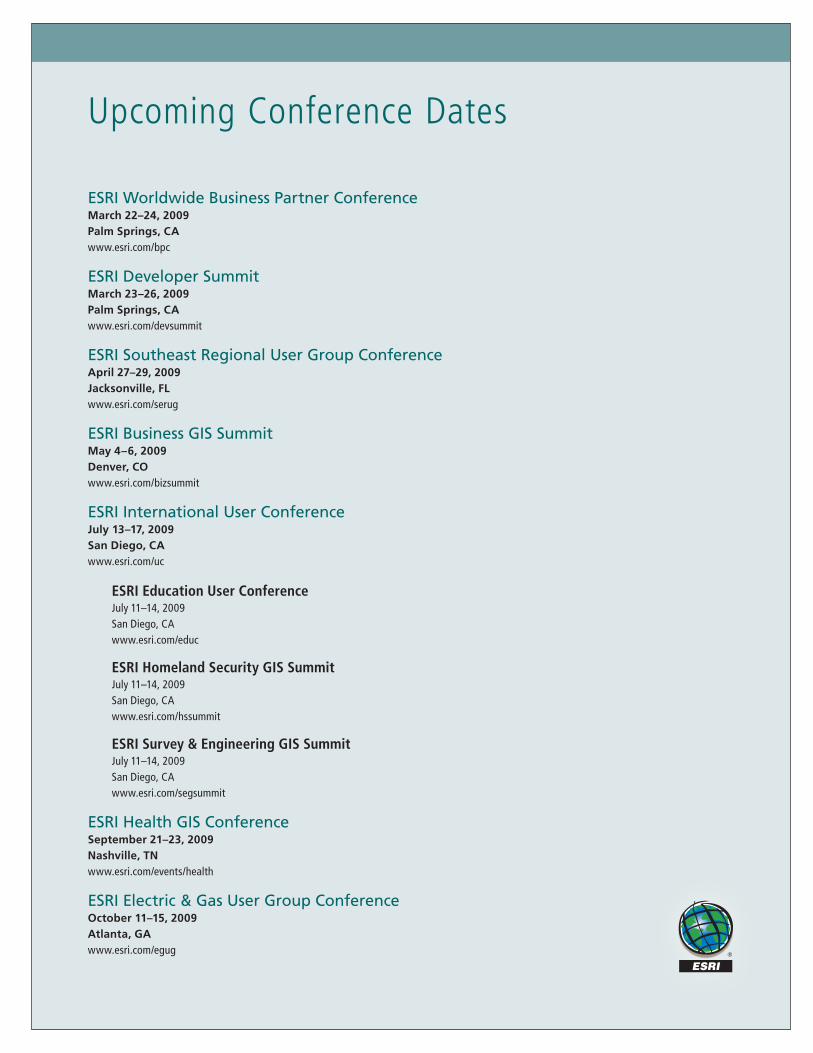
Upcoming Conference Dates
ESRI Worldwide Business Partner ConferenceMarch 22–24, 2009 Palm Springs, CAwww.esri.com/bpc
ESRI Developer SummitMarch 23–26, 2009 Palm Springs, CAwww.esri.com/devsummit
ESRI Southeast Regional User Group ConferenceApril 27–29, 2009 Jacksonville, FLwww.esri.com/serug
ESRI Business GIS SummitMay 4–6, 2009 Denver, COwww.esri.com/bizsummit
ESRI International User ConferenceJuly 13–17, 2009 San Diego, CAwww.esri.com/uc
ESRI Education User Conference July 11–14, 2009 San Diego, CA www.esri.com/educ
ESRI Homeland Security GIS Summit July 11–14, 2009 San Diego, CA www.esri.com/hssummit
ESRI Survey & Engineering GIS Summit July 11–14, 2009 San Diego, CA www.esri.com/segsummit
ESRI Health GIS Conference September 21–23, 2009 Nashville, TNwww.esri.com/events/health
ESRI Electric & Gas User Group Conference October 11–15, 2009 Atlanta, GA www.esri.com/egug
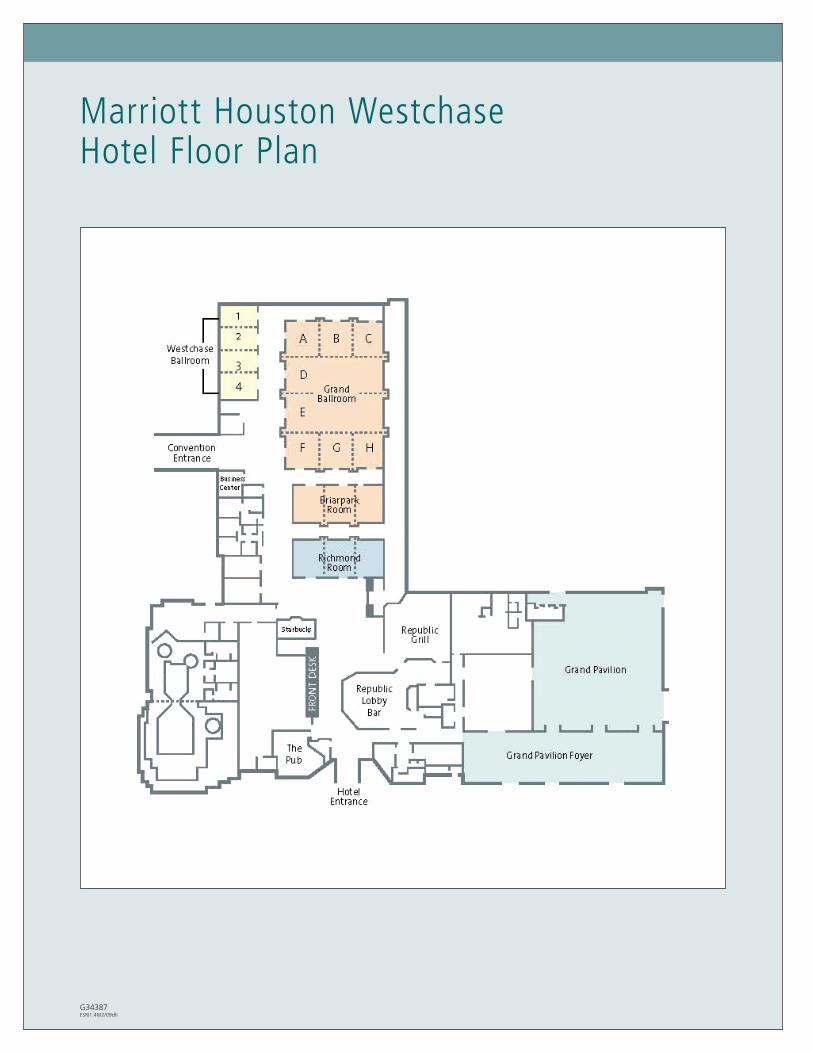
G34387 ESRI1.4M2/09dh
Marriott Houston Westchase Hotel Floor Plan