Publication semestrielle - marsamaroc.co.ma · Safi Agadir Laayoune Tanger Med Nador ... • OCP...
17
Communication financière Publication semestrielle Octobre 2016 Investor Presentation
Transcript of Publication semestrielle - marsamaroc.co.ma · Safi Agadir Laayoune Tanger Med Nador ... • OCP...

Communication financière
Publication semestrielle
Octobre 2016
Investor Presentation

36,3 millions
of tons
Traffic (2016)
60% Moroccan state
30% free float
10% pool of 3 investors
Shareholder structure
Mad 2 567 mn
USD 254 mn
Consolidated turnover
(2016)
> 2 100
Employees (2016)
Mad 580 mn
USD 57 mn
Consolidated Net Income
(2016)
Mad 1 155 mn
USD 114 mn
Consolidated EBITDA
(2016)
Company at a glance : the leading port operator in Morocco
2

Morocco: a Growing Gateway Market
Company overview : the leading port operator in Morocco
Sound Financials
Growth opportunities
3

23 25 25 28
18 22 23
26 9
8 10 13
12 11 8
6 5
6 6 6
4 4 4
5
3 3 2
3
2 3 3
3 76.6
84.2 81.3
90.3
2013 2014 2015 2016
Morocco: a Growing Gateway Market
Evolution of traffic per port(1)
Evolution of port operators(1) market shares
Source : ANP Marsa Maroc
74 % of national traffic
Casablanca
Jorf Lasfar
Mohammedia Safi
Agadir Laayoune
Tanger Med
Nador
• The traffic generated by maritime trade has seen an average growth of 5.6% p.a. since 2013, reaching 90.3 MT in 2016;
• In 2015, the traffic decreased by 3.4% following the shutdown of of Moroccan refinery activities in August 2015;
• The traffic has know a growth of 11% in 2016.
Marsa Maroc
OCP
Tanger Med
Somaport
Taqa Morocco
Mass Céréales Sosipo
Hydrocarb Jorf
• Marsa Maroc had a market share of 42% by the end of 2016 . This fall is explained by the liquid bulk traffic decreased following the shutdown of SAMIR’s activity in August 2015.
• OCP operates close to a third of the traffic, mainly in the ports of Casablanca and Jorf Lasfar;
• The Tanger Med operators have close to 10% of the national market share;
• Operators in the grains sector (Sosipo and Mass Céréales) had 5% market share by the end of 2016;
• OCP, Taqa Morocco, (industrial companies) etc. handle their own traffic on dedicated terminals without resorting to port operators .
(1) Excluding transhipment
In million of tons
4
49% 46% 44% 42%
28% 27% 27% 27%
7% 8% 10% 11%
5% 7% 7% 6%
6% 5% 6% 5%
3% 4% 3% 4% 2% 3% 2% 3% 1% 1%
2013 2014 2015 2016

Morocco: a Growing Gateway Market
Company overview : the leading port operator in Morocco
Sound Financials
Growth opportunities
5

Business model of Marsa Maroc
Ships Dock Storage Truck unloading /
loading
Entry /
exit of the port
Import flows
Export flows
Maritime services (towing,
steering, boatage, etc.)
1
2
Handling (loading/unloading vessels and transfer of cargo
to storage area.)
Storage and Truck loading/
unloading
Other services : services to ships, weighing, etc.
3
90% of
turnover *
3% of
turnover *
7% of
turnover *
GATEWAY
Concession
agreements
Clients / suppliers
Third parties
Financing
contracts,
subcontracts, etc.
Business
contracts
• 9 ports via the concession contract with the ANP
• 1 terminal (TC3 Casablanca) conceded by the ANP
• 1 terminal (TC3 Tanger Med) conceded by TMPA
• 1 terminal (Quai Nord Agadir) conceded by ANP to a subsidiary controlled by Marsa Maroc (51%)
Port authorities
(*) 2016
6
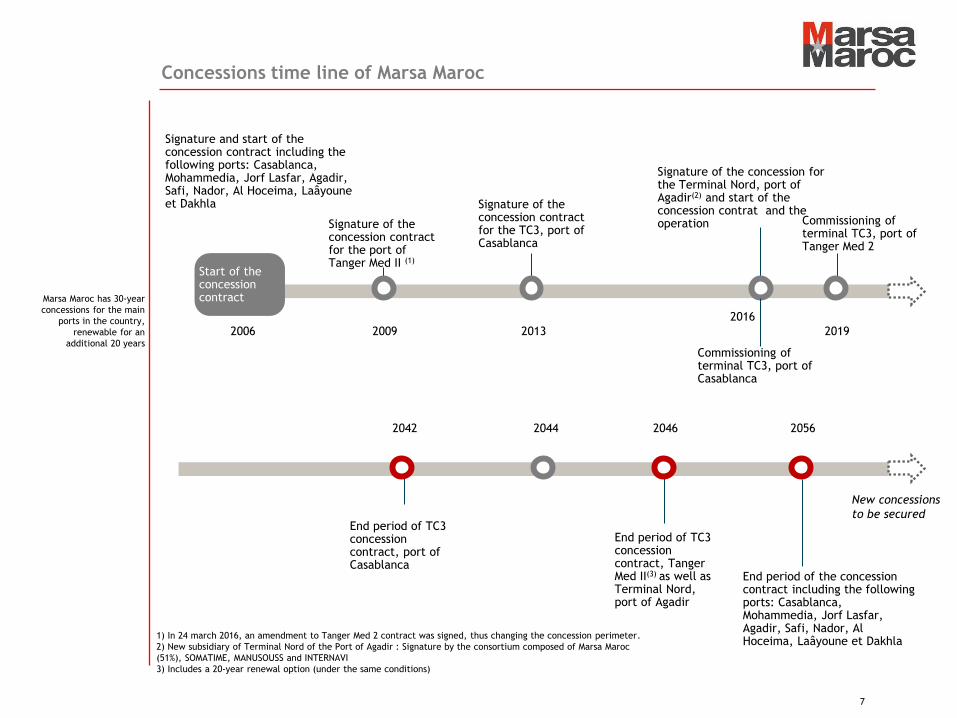
Marsa Maroc has 30-year
concessions for the main
ports in the country,
renewable for an
additional 20 years
2009 2006
Signature and start of the concession contract including the following ports: Casablanca, Mohammedia, Jorf Lasfar, Agadir, Safi, Nador, Al Hoceima, Laâyoune et Dakhla
2013 2019
Start of the concession contract
Commissioning of terminal TC3, port of Tanger Med 2
2016
Signature of the concession for the Terminal Nord, port of Agadir(2) and start of the concession contrat and the operation
1) In 24 march 2016, an amendment to Tanger Med 2 contract was signed, thus changing the concession perimeter.
2) New subsidiary of Terminal Nord of the Port of Agadir : Signature by the consortium composed of Marsa Maroc
(51%), SOMATIME, MANUSOUSS and INTERNAVI
3) Includes a 20-year renewal option (under the same conditions)
Signature of the concession contract for the TC3, port of Casablanca
End period of the concession contract including the following ports: Casablanca, Mohammedia, Jorf Lasfar, Agadir, Safi, Nador, Al Hoceima, Laâyoune et Dakhla
2044 2042 2046
End period of TC3 concession contract, port of Casablanca
2056
New concessions
to be secured
Signature of the concession contract for the port of Tanger Med II (1)
Commissioning of terminal TC3, port of Casablanca
End period of TC3 concession contract, Tanger Med II(3) as well as Terminal Nord, port of Agadir
Concessions time line of Marsa Maroc
7
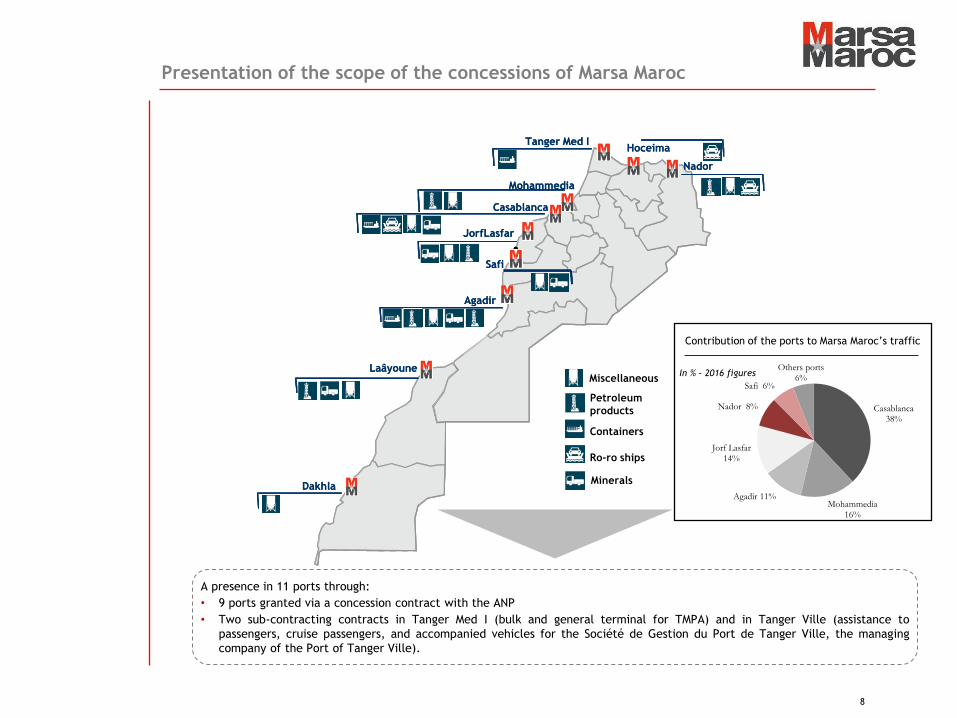
A presence in 11 ports through:
• 9 ports granted via a concession contract with the ANP
• Two sub-contracting contracts in Tanger Med I (bulk and general terminal for TMPA) and in Tanger Ville (assistance to
passengers, cruise passengers, and accompanied vehicles for the Société de Gestion du Port de Tanger Ville, the managing
company of the Port of Tanger Ville).
In % - 2016 figures
Contribution of the ports to Marsa Maroc’s traffic
Casablanca
Agadir
Tanger Med I
Dakhla
Mohammedia
Jorf Lasfar
Safi
Nador
Laâyoune
Minerals
Miscellaneous
Petroleum
products
Containers
Ro-ro ships
Hoceima
Casablanca
Agadir
Tanger Med I
Dakhla
Mohammedia
Jorf Lasfar
Safi
Nador
Laâyoune
Hoceima
Presentation of the scope of the concessions of Marsa Maroc
8
Casablanca 38%
Mohammedia 16%
Agadir 11%
Jorf Lasfar 14%
Nador 8%
Safi 6%
Others ports 6%

95 90
116 125
8 7
7
7
2013 2014 2015 2016
Vehicles and trucks TIR
505 533 537 624
143 160 170
192
62% 62% 62% 67%
0%
20%
40%
60%
80%
100%
120%
0
100
200
300
400
500
600
700
800
900
2013 2014 2015 2016
Casablanca Agadir Mkt share MM
15 487 15 186 11 742 10 235
11 120 13 780
13 057 14 497
3 040 2 835
3 287 3 350
2013 2014 2015 2016
Liquid bulk Dry bulk Conventional
Evolution of the overall traffic handled by Marsa Maroc Evolution of container traffic handled by Marsa Maroc
Evolution of bulk traffic Evolution of TIR and vehicle traffic
In thousand tons
650 694 707
29 647 31 801
28 086
In thousand tons
102 96
123
65
-13%
+11%
+2%
In thousand TEUs
In number of units 2013-2016 dry bulk CAGR : +9.2%
2013-2016 liquid bulk CAGR: -12.9%
2013-2016 conventional CAGR: +3.3%
2013-2016 CAGR: +0.5% 2013-2016 CAGR: 7.9%
A leader position in Morocco
2013-2016 CAGR: 9.1%
In 2015, liquid bulk
traffic decreased by
23% following the
shutdown of SAMIR’s
activity in August
2015, which also
explains the 8.4%
decline in the overall
traffic handled by
Marsa Maroc in 2015.
9
35 770 38 366
35 159 36 306
0
5 000
10 000
15 000
20 000
25 000
30 000
35 000
40 000
45 000
2013 2014 2015 2016
28 082
816

Impact of the national port development project on estimated Marsa Maroc’s traffics
Tanger ville
Casablanca
Nador
Jorf Lasfar LPG
Safi
Nador West Med
Mohammedia
Kenitra Atlantique
Jorf Lasfar
Tanger Med II
Agadir
Safi Grand
Vrac
Dakhla
Casablanca
Agadir
Tanger Med I & II
Mohammedia
Jorf LasfarSafi
Nador
Laâyoune
TanTan
Al Hoceima
Refined oil products
Refined oil products
Cereals
Cattle Feed
Cars (Peugeot Citroën)
Sulfur ;
Conventional Bulks
Coal
Coal
Oil products
Existing port
Port extension
New port
The port Capacities
reconfiguration as it is planned
by the 2030 national port
strategy adopted by the
Ministry of Equipment,
Transport and logistics should
involve the construction of new
terminals and port complexes.
Hence, these new additional
capacities could impact
partially or totally by handling
the Marsa Maroc historical
traffic in the new facilities
(new LPG and chemical
terminal at the port of
Mohammedia, new ports of
Safi, Nador West Med and
Kenitra, etc.).
The opening of new port infrastructures will lead to a new distribution of import/export traffics between the ports and
will involve a risk of migration of some traffics currently handled in Marsa Maroc terminals, towards new infrastructure.
10

A new governance structure
3 Core investors
(institutional)
President of the
Supervisory Board
The initial public offering in july 2016 has allow Marsa Maroc to strengthen its governance whilst providing a strong signal to the market
regarding the Moroccan State’s will to strengthen the Company’s governance. Hence, the new structure of the Supervisory Board include 12
board members :
Ministry of Equipment,
Transport and Logistics
Ministry of Economy
and Finance
Ministry of Equipment,
Transport and Logistics
A shareholders’
agreement has been
concluded between
the Government
and the 3 leading
institutional
investors.
Independent Board
Members *
• Pension funds ;
• MAD 111 bn assets
under
management**
• Pension funds ;
• MAD 98 bn assets
under
management**
• ≠1 Insurance company
in morocco ;
• MAD 31 assets under
management **
• USD 1.3 bn market
Capitalization (7th
october 2016)
(*) not apppointed yet at this stage
(**) end of June 2016
11

Morocco: a Growing Gateway Market
Company overview : the leading port operator in Morocco
Sound Financials
Growth opportunities

1 750 1 822 1 981 2 314
153 158 151
182
37 42 38
70
2013 2014 2015 2016
Handling services Services to vessels Others services
Turnover EBITDA
Operating income
Net income
Sound Financials
2013-2016 CAGR: +9.8%
+18%
2013-2016 CAGR: +20% 2013-2016 CAGR: +31%
2013-2016 CAGR: +11% 2016 was characterized by a
significant improvement in the
company’s performance,
thanks to a growth in turnover
driven by containers and
cereals trafics.
In MAD mn
In MAD mn
In MAD mn In MAD mn
13
1 939 2 023
2 171
2 567
844 886
1 010
1 155
44% 44%
47% 45%
30%
35%
40%
45%
50%
55%
60%
0
200
400
600
800
1000
1200
1400
2013 2014 2015 2016
EBITDA Margin (%)
481 499
622
830
25% 25%
29% 32%
15%
20%
25%
30%
35%
40%
45%
50%
55%
60%
0
100
200
300
400
500
600
700
800
900
2013 2014 2015 2016
Operating income Margin (%)
256
329
375
580
13% 16% 17%
23%
5%
10%
15%
20%
25%
30%
35%
40%
45%
50%
55%
0
100
200
300
400
500
600
700
2013 2014 2015 2016
Net Income Margin (%)

Financial structure Breakdown of net debt
Sound Financials
Dividends
In MAD mn
In MAD mn
14
2 812
2 235
1 347
744
2015 2016
Total shareholder equity Net debt (excess of cash)
113 207
1 415
1 171
-181
-633
2015 2016
Cash Investment securities Corporate debt
272
398
488
740
235 294
882
587
87% 74%
181%
79%
0%
50%
100%
150%
200%
250%
300%
350%
400%
0
100
200
300
400
500
600
700
800
900
1 000
2013 2014 2015 2016
Net Income Dividend Pay out ratio
Morocco: a Growing Gateway Market
Company overview : the leading port operator in Morocco
Sound Financials
Growth opportunities

A growth strategic plan
Conditions for success and change management
• Concessions currently
under development
• Secure new concessions
and authorizations
• Concessions and
authorizations in Africa
• Hinterland logistics and
related activities
Leading port operator in
Morocco
Contribution to
enhancement of logistics in
Morocco
Performance and agility
Sales approach • Operational Performance
• Strategic management
• Communication and change
management
• Organizational effectiveness and HR
• Institutional governance
1
2
3 4
5 6
7 9
8 10
Strong international
presence, particularly in
Africa
The business plan does not take
into account the
implementation of the
Company's development
strategy including securing new
port concessions in Morocco
and in the African continent.
16

Q & A
19