Publication Report Quality and Outcomes Framework - Information
33
A National Statistics Publication for Scotland Information Services Division Publication Report Quality and Outcomes Framework Prevalence, achievement, payment and exceptions data for Scotland, 2012/2013 Publication date – 24 September 2013
Transcript of Publication Report Quality and Outcomes Framework - Information
A National Statistics Publication for Scotland
Information Services Division
Publication Report
Quality and Outcomes Framework Prevalence, achievement, payment and exceptions data for Scotland, 2012/2013
Publication date – 24 September 2013
1
Information Services Division
Contents
Contents ............................................................................................................................ 1
Introduction ....................................................................................................................... 2
Key points ......................................................................................................................... 3
Types of General Practice and QOF Participation ............................................................ 4
Results and Commentary .................................................................................................. 5
Prevalence .................................................................................................................... 5
Achievement .................................................................................................................. 8
Achievement within indicator groups ........................................................................... 11
Payments .................................................................................................................... 15
Exception reporting...................................................................................................... 16
Glossary .......................................................................................................................... 17
List of Tables ................................................................................................................... 19
Contact ............................................................................................................................ 20
Further Information .......................................................................................................... 20
Rate this publication ........................................................................................................ 20
A1 – General Practice types and their participation in QOF ........................................ 21
A2 – Data completeness ............................................................................................. 23
A3 – Reliability of QOF prevalence data by condition.................................................. 24
A4 – QOF payment calculation .................................................................................... 27
A5 – Publication metadata (including revisions details) ............................................... 28
A5 – Early Access details (including Pre-Release Access) ......................................... 31
A6 – ISD and Official Statistics .................................................................................... 32

2
Information Services Division
Introduction The Quality & Outcomes Framework (QOF) measures a General Practice's achievement against a set of evidence-based indicators designed to promote good practice. Payments are made to each General Practice on the basis of their level of achievement against those indicators. This QOF publication contains information on General Practices with a registered population in Scotland. These represent 95% of all practices in Scotland, and do not include various specialist practices such as practices offering only Out of Hours services and practices for patients with challenging behaviour. The publication includes details of practices’ participation in QOF, prevalence of selected health conditions, practices’ achievements against their selected indicators and the payments that are made to practices as a result of those achievements. The information contained in this publication will be of interest to individuals, organisations and groups with an interest in workload, quality improvement, epidemiology and other aspects of general practice. Here are some examples of how the information on the QOF has been used.
It has allowed General Practitioners, their patients and practice staff to compare their results with those for other practices.
NHS Boards and Community Health Partnerships teams use the results to see how the practices in their areas compared to others and use this information to support quality improvement work with practices.
Government Health Departments and the British Medical Association (BMA) use this data to negotiate future changes to QOF indicators and payment calculations.
Academic researchers for research projects.
Charities representing specific health conditions use QOF to raise awareness of the conditions.
The data in this publication was released on 24 September 2013.
Data included in this publication
Published here are Scotland’s 2012/13 QOF data including: the percentage of the Scottish population with selected health conditions, drawn from
QOF registers; the points achieved by participating practices, overall and for individual QOF indicators
and indicator groups; total QOF payments.
Further data tables are available on the QOF pages of ISD’s website.

3
Information Services Division
Key points
In 2012/13, 988 of the 996 GP practices with a registered population in Scotland took part in QOF.
The average number of points achieved by GMS practices was 979 out of a maximum of 1000. This was a decrease from 981 in 2011/12.
The largest increase in achievement for a group of clinical indicators between 2011/12 and 2012/13 was in the depression indicator group. This increased from 91.7% to 92.8%, a difference of 1.2 percentage points.
The largest decrease in achievement for a group of clinical indicators between 2011/12 and 2012/13 was in the smoking indicator group. This decreased from 99.4% to 96.0%, a difference of 3.4 percentage points.
The average QOF payment to a GMS practice for 2012/13 was £142,000. This was up from £138,900 in 2011/12.
4
Information Services Division
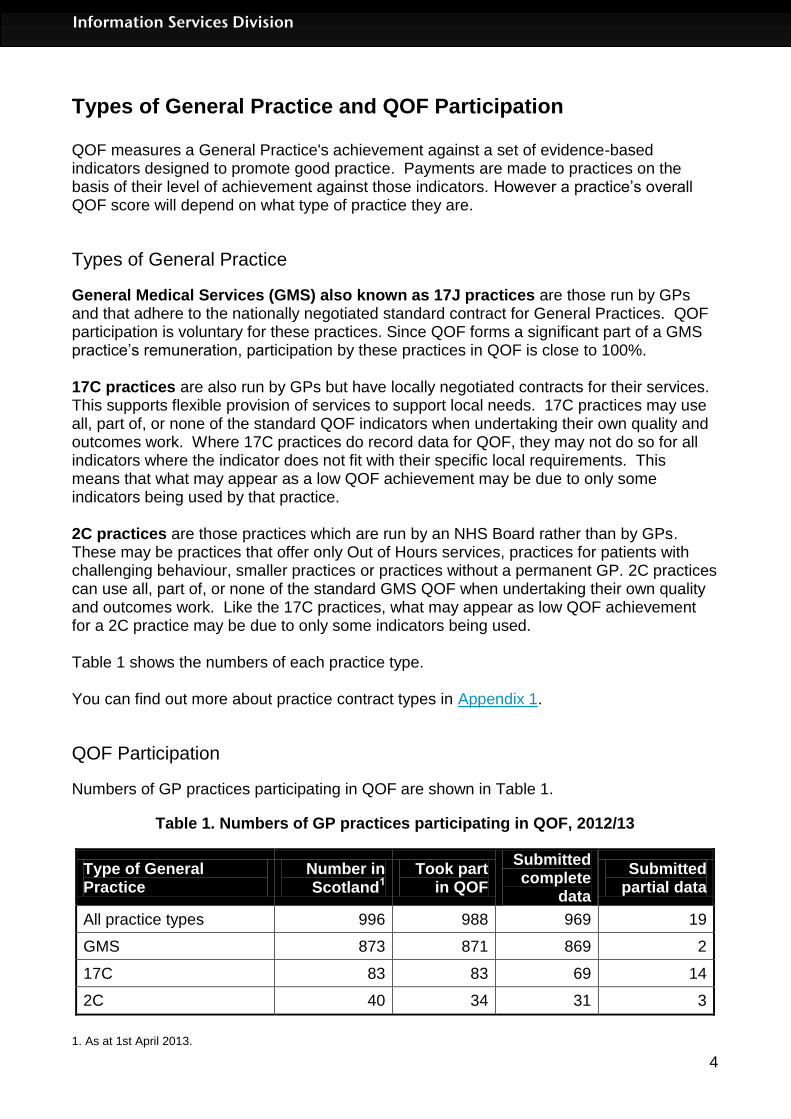
Types of General Practice and QOF Participation QOF measures a General Practice's achievement against a set of evidence-based indicators designed to promote good practice. Payments are made to practices on the basis of their level of achievement against those indicators. However a practice’s overall QOF score will depend on what type of practice they are.
Types of General Practice
General Medical Services (GMS) also known as 17J practices are those run by GPs and that adhere to the nationally negotiated standard contract for General Practices. QOF participation is voluntary for these practices. Since QOF forms a significant part of a GMS practice’s remuneration, participation by these practices in QOF is close to 100%. 17C practices are also run by GPs but have locally negotiated contracts for their services. This supports flexible provision of services to support local needs. 17C practices may use all, part of, or none of the standard QOF indicators when undertaking their own quality and outcomes work. Where 17C practices do record data for QOF, they may not do so for all indicators where the indicator does not fit with their specific local requirements. This means that what may appear as a low QOF achievement may be due to only some indicators being used by that practice. 2C practices are those practices which are run by an NHS Board rather than by GPs. These may be practices that offer only Out of Hours services, practices for patients with challenging behaviour, smaller practices or practices without a permanent GP. 2C practices can use all, part of, or none of the standard GMS QOF when undertaking their own quality and outcomes work. Like the 17C practices, what may appear as low QOF achievement for a 2C practice may be due to only some indicators being used. Table 1 shows the numbers of each practice type. You can find out more about practice contract types in Appendix 1.
QOF Participation
Numbers of GP practices participating in QOF are shown in Table 1.
Table 1. Numbers of GP practices participating in QOF, 2012/13
Type of General Practice
Number in Scotland1
Took part in QOF
Submitted complete
data
Submitted partial data
All practice types 996 988 969 19
GMS 873 871 869 2
17C 83 83 69 14
2C 40 34 31 3
1. As at 1st April 2013.
5
Information Services Division
Results and Commentary
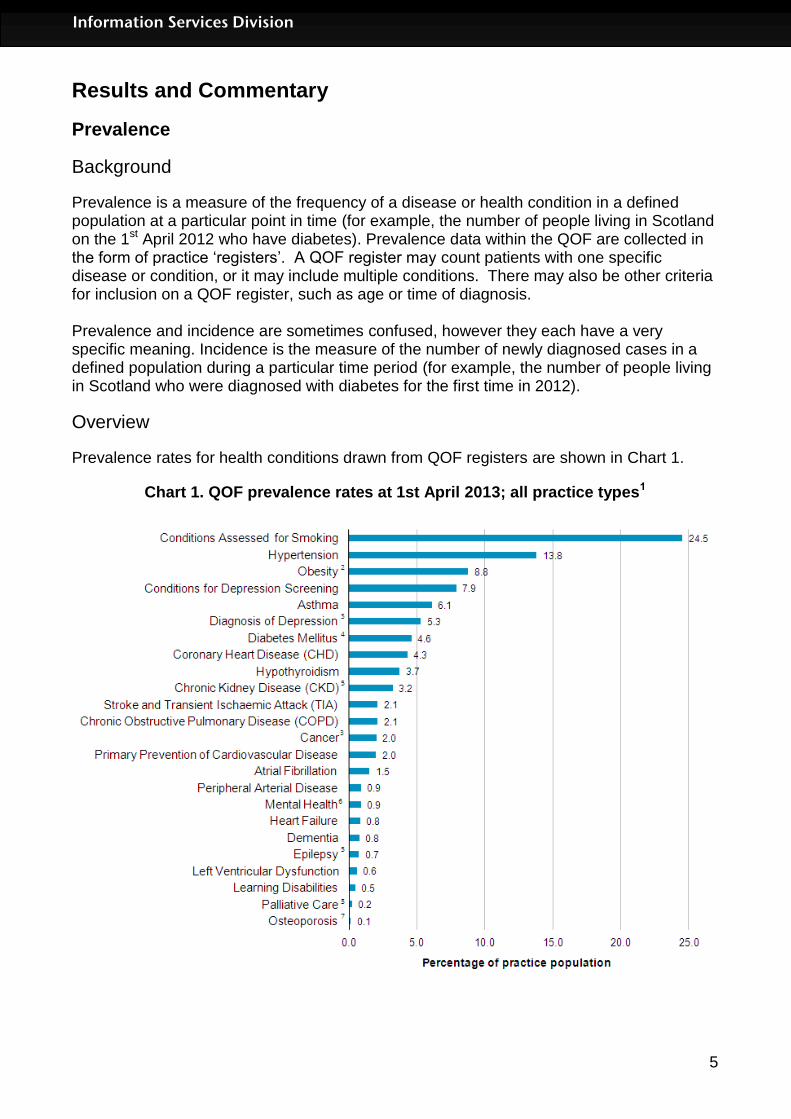
Prevalence
Background
Prevalence is a measure of the frequency of a disease or health condition in a defined population at a particular point in time (for example, the number of people living in Scotland on the 1st April 2012 who have diabetes). Prevalence data within the QOF are collected in the form of practice ‘registers’. A QOF register may count patients with one specific disease or condition, or it may include multiple conditions. There may also be other criteria for inclusion on a QOF register, such as age or time of diagnosis. Prevalence and incidence are sometimes confused, however they each have a very specific meaning. Incidence is the measure of the number of newly diagnosed cases in a defined population during a particular time period (for example, the number of people living in Scotland who were diagnosed with diabetes for the first time in 2012).
Overview
Prevalence rates for health conditions drawn from QOF registers are shown in Chart 1.
Chart 1. QOF prevalence rates at 1st April 2013; all practice types1

6
Information Services Division
Notes for chart 1: 1. Data not available for some practices. See Appendix 2. 2. Registers are of patients aged 16 and over. 3. Registers are cumulative and include all patients with the condition since a given date, as opposed to those currently being treated for the condition. 4. Registers are of patients aged 17 and over. 5. Registers are of patients aged 18 and over. 6. Mental Health includes the following conditions: schizophrenia, bipolar affective disorder and other psychoses. 7. Registers are of patients aged 50 and over.
Please note there has been a change in the definition used to identify a new diagnosis of depression, which now excludes patients identified before 1 April 2006. This means that it is now not possible to compare the 2012/13 data to previous years and explains why the rate of 5.31 per 100 patients, is far lower than in recent years. Further information on prevalence at NHS Board, CHP and practice level can be found on the QOF pages on the ISD website.
Reliability of QOF prevalence estimates
QOF registers are collected for several reasons:
to enable payments to practices to reflect the workload for particular conditions;
to encourage GPs to assess and monitor particular conditions.
Registers are not primarily collected to collate statistics on how many people have a particular condition, but they do provide a useful source for estimates. New registers should be treated with caution in the first few years of reporting as they are still being established and validated. In 2012/13 there are two new registers Osteoporosis and Peripheral Arterial Disease (PAD). QOF registers do give reliable estimates of prevalence for conditions which are managed mainly by the GP or practice nurse, for example, asthma, atrial fibrillation, CKD, CHD and hypertension. QOF registers do not give reliable prevalence estimates for depression, learning disabilities and obesity. QOF registers are likely to underestimate prevalence for conditions where people do not always consult their doctor. These include COPD, dementia, osteoporosis and hypothyroidism. For further information about the reliability of prevalence estimates for specific conditions see Appendix 3.
7
Information Services Division
Comparability with other prevalence data
Scotland has a number of other data sources which are used to create estimates on the prevalence of health conditions.
Data collected from a sample of GP practices on the reason why people consult their doctor.
Data from the Scottish Health Survey in which adults and children are asked about their health.
Surveys of specific diseases, for example, the annual Scottish Diabetes Survey which is extracted from the national diabetes IT system.
There are links to each of these sources within our web page containing Information for users of QOF register and prevalence data.

8
Information Services Division
Achievement
Background
The QOF measures a General Practice's achievement against a scorecard of evidence-based indicators. These indicators span four domains: clinical, organisational, patient experience and additional services. In 2012/13, practices could score up to a maximum of 1,000 points across 148 indicators. The four QOF domains cover the following areas:
Clinical (96 indicators): this domain is the largest element of the QOF. Within it are a series of indicators relating to processes and outcomes in relation to a range of health conditions such as diabetes, COPD and Coronary Heart Disease.
Organisational (42 indicators): this domain comprises indicators on records and information, patient communication, education and training, practice management, Quality in Practice and medicines management.
Patient experience (1 indicator): this domain has one indicator on consultation length.
Additional services (9 indicators): this domain comprises indicators on cervical screening, child health surveillance, maternity services and sexual health.
Most health conditions or services are monitored using a combination of indicators, and together these indicators form an ‘indicator group’. A full description of the QOF indicators for 2012/13 can be found in the QOF Guidance for GMS contract 2012/13 or in the List of individual QOF indicator descriptions Excel spreadsheet.
9
Information Services Division
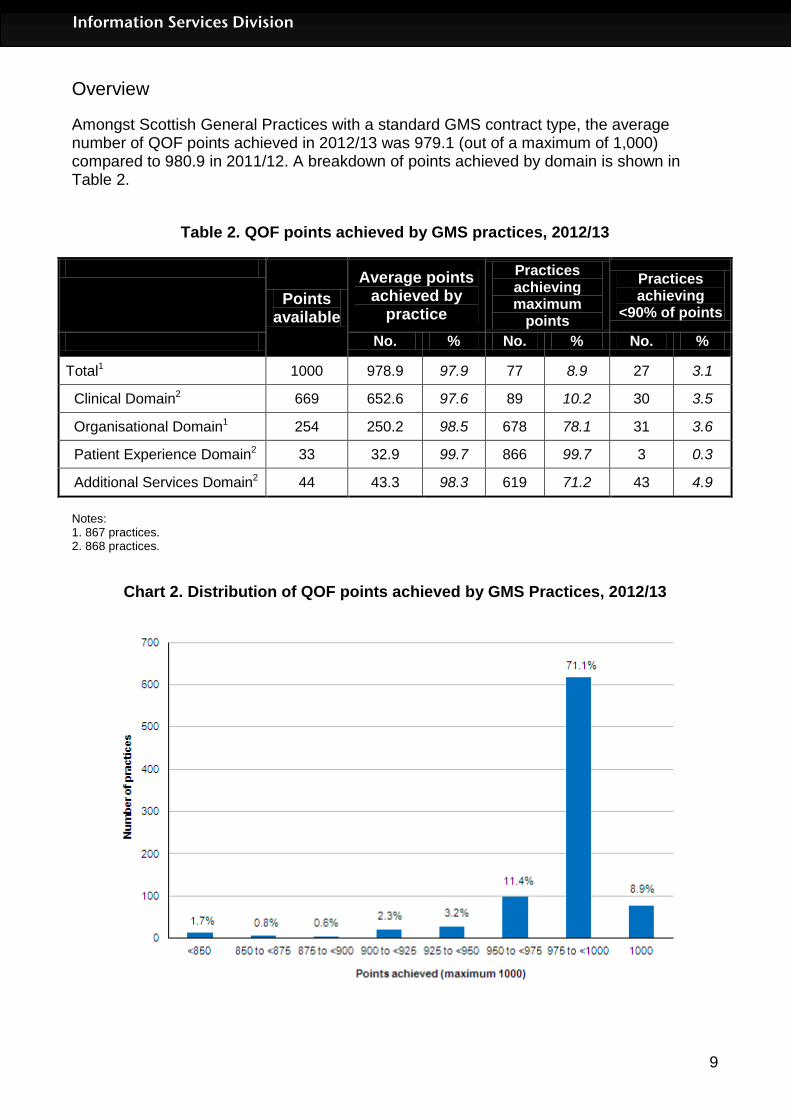
Overview
Amongst Scottish General Practices with a standard GMS contract type, the average number of QOF points achieved in 2012/13 was 979.1 (out of a maximum of 1,000) compared to 980.9 in 2011/12. A breakdown of points achieved by domain is shown in Table 2.
Table 2. QOF points achieved by GMS practices, 2012/13
Points available
Average points achieved by
practice
Practices achieving maximum
points
Practices achieving
<90% of points
No. % No. % No. %
Total1 1000 978.9 97.9 77 8.9 27 3.1
Clinical Domain2 669 652.6 97.6 89 10.2 30 3.5
Organisational Domain1 254 250.2 98.5 678 78.1 31 3.6
Patient Experience Domain2 33 32.9 99.7 866 99.7 3 0.3
Additional Services Domain2 44 43.3 98.3 619 71.2 43 4.9
Notes: 1. 867 practices. 2. 868 practices.
Chart 2. Distribution of QOF points achieved by GMS Practices, 2012/13

10
Information Services Division
Further information on achievement at NHS Board, CHP and practice level can be found on the QOF pages on the ISD website.
Comparability of data between years
QOF achievement data is not strictly comparable from one year to the next due to changes in the list of indicators, changes in the points available and changes in the list of practices whose data are included in the QOF publication each year. If you wish to compare the data we advise you to first check information about these changes on the revisions to QOF pages on the ISD website.
Comparability of data across individual practices
Whilst individual practices may not achieve full points for every QOF indicator because they have not been able to meet some or all of the requirements for that indicator, practices with lower points than others cannot automatically be regarded as being “worse". There may be other reasons for apparently lower levels of achievement against the QOF. These include the following:
Whilst most Scottish General Practices with GMS contracts have participated fully in the QOF, it is important to note that for some of them it may be impossible to achieve all of the points available in the framework. For example, some of the clinical indicators relate to very specific subgroups of patients, and if the practice does not have any patients in that particular subgroup, they cannot score any points against that indicator. This is more likely to happen in very small practices.
Participation in the QOF is voluntary. Some practices that do not have a standard GMS contract may only record QOF data for selected indicators and have separate, locally tailored quality frameworks to cover other aspects of the care that they provide
Comparability of data between the 4 UK nations
It is not possible to directly compare the QOF performance of the four nations of the United Kingdom. The only measure of QOF performance which is available across all four nations is the overall achievement for all practice types, but practice types score very differently due to differences in their contracts; 2C and 17C practices tend to score less than GMS practices. The ratio of practice types is not consistent across the UK and the different ratio in each of the home nations affects their overall average. Further data are available at these links:
England
Northern Ireland
Wales

11
Information Services Division
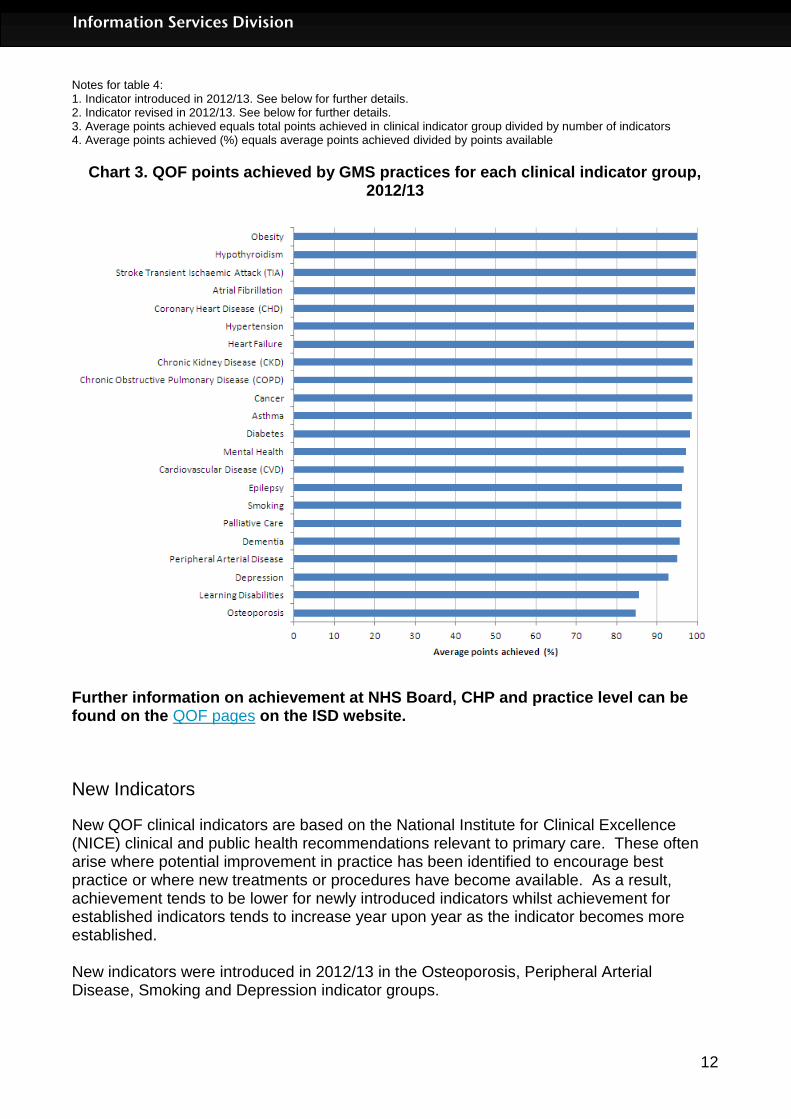
Achievement within indicator groups
Most health conditions or services are monitored using a combination of indicators, and together these indicators form an indicator group. In total there are 33 indicator groups of which 22 are clinical. For practices with a GMS contract, 30 out of 33 indicator groups had an overall achievement against available points of over 95%. For the clinical indicator groups, 19 out of 22 had an overall achievement of over 95% (see Table 4).
Table 4. QOF points achieved by GMS practices for each clinical indicator group, 2012/13
Clinical indicator group Number
of indicators
Points available
Average points
achieved3
Average points
achieved (%)4
Asthma2 4 45 44.4 98.6
Atrial Fibrillation 4 27 26.8 99.4
Cancer 2 11 10.9 98.7
Cardiovascular Disease (CVD) 2 13 12.5 96.5
Chronic Kidney Disease (CKD) 5 36 35.6 98.8
Chronic Obstructive Pulmonary Disease (COPD)
5 30 29.6 98.7
Coronary Heart Disease (CHD) 7 69 68.5 99.2
Dementia 3 26 24.9 95.6
Depression1,2 3 31 28.8 92.8
Diabetes 15 88 86.3 98.1
Epilepsy 4 14 13.5 96.2
Heart Failure 4 29 28.8 99.1
Hypertension 3 69 68.4 99.1
Hypothyroidism 2 7 7 99.8
Learning Disabilities 2 7 6 85.4
Mental Health2 10 40 38.9 97.2
Obesity 1 8 8 100
Osteoporosis1 3 9 7.6 84.7
Palliative Care 2 6 5.8 96
Peripheral Arterial Disease1 4 9 8.6 95.1
Smoking1,2 4 73 70.1 96
Stroke Transient Ischaemic Attack (TIA) 7 22 21.9 99.6
Total 96 669 653.3 97.5
12
Information Services Division
Notes for table 4: 1. Indicator introduced in 2012/13. See below for further details. 2. Indicator revised in 2012/13. See below for further details. 3. Average points achieved equals total points achieved in clinical indicator group divided by number of indicators 4. Average points achieved (%) equals average points achieved divided by points available
Chart 3. QOF points achieved by GMS practices for each clinical indicator group, 2012/13
Further information on achievement at NHS Board, CHP and practice level can be found on the QOF pages on the ISD website.
New Indicators
New QOF clinical indicators are based on the National Institute for Clinical Excellence (NICE) clinical and public health recommendations relevant to primary care. These often arise where potential improvement in practice has been identified to encourage best practice or where new treatments or procedures have become available. As a result, achievement tends to be lower for newly introduced indicators whilst achievement for established indicators tends to increase year upon year as the indicator becomes more established. New indicators were introduced in 2012/13 in the Osteoporosis, Peripheral Arterial Disease, Smoking and Depression indicator groups.
13
Information Services Division
Osteoporosis: New indicator group for 2012/13 and is one of the three indicator groups with an achievement of below 95% for GMS practices. Overall the indicator group achievement of 84.8%, which has impacted the total achievement reported in 2012/13. The group includes the following three indicators;
OST01 - The practice can produce a register of patients: 1. Aged 50-74 years with a record of a fragility fracture after 1 April 2012 and a diagnosis of osteoporosis confirmed on DXA scan; and 2. Aged 75 years and over with a record of a fragility fracture after 1 April 2012 OST02 - The percentage of patients aged between 50 and 74 years; with a fragility fracture; in whom osteoporosis is confirmed on DXA scan; who are currently treated with an appropriate bone-sparing agent OST03 - The percentage of patients aged 75 years and over with a fragility fracture; who are currently treated with an appropriate bone-sparing agent
Peripheral Arterial Disease (PAD): New indicator group for 2012/13, had an overall achievement of 95.1%. Includes the following four indicators;
PAD01 - The practice can produce a register of people with peripheral arterial disease PAD02 - The percentage of patients with peripheral arterial disease with a record in the preceding 15 months that aspirin or an alternative anti-platelet is being taken PAD03 - The percentage of patients with peripheral arterial disease in whom the last blood pressure reading (measured in the preceding 15 months) is 150/90 or less PAD04 - The percentage of patients with peripheral arterial disease in whom the last measured total cholesterol (measured in preceding 15 months) is 5.0mmol/l or less
Smoking: The new smoking indicator (SMOKING08) is designed to reward practices offering support and treatment to smokers age 15 and over, who are recorded as current smokers. The smoking indicator group has an achievement of 96.0%, and this new indicator has an achievement of 86.4%. The low level of achievement for SMOKING08 can be attributed to it being a new indicator. Atrial Fibrillation: The new Atrial Fibrillation (AF05) is designed to reward practices assessing patients with atrial fibrillation for stroke risk using CHADS2 risk stratification scoring system. Percentage achievement for this new indicator was 97.9%, which hasn’t impact the overall score for this indicator group. Depression: A new depression indicator (DEP07) was introduced in 2012/13 to replace indicator DEP05, which was itself introduced in 2011/12. Both are designed to reward practices for good practice in reducing the early cessation of treatment for depression with only a slight change in the definition between years. DEP07 was the lowest scoring indicator in the depression group in 2012/13 with an achievement level of 86.7%. In 2011/12 DEP05 had an achievement level of 86.1%. Depression is one of the three indicator groups with an achievement of below 95% for GMS practices. However the achievement level of 92.8% is higher than in 2011/12 when the achievement level was 91.6%.
Indicators discontinued in 2011/12
Organisational: Five indicators relating to improvement in prescribing were dropped from the Organisational indicator group in 2011/12.
14
Information Services Division
This has resulted in a rise in the achievement between 2011/12 and 2012/13 for the Organisational indicator group from 97.4% in 2011/12 to 98.5% in 2012/13. There have been other indicators discontinued in 2012/13 but these have resulted in only minimal changes to the achievement levels in their indicator groups. A list of the individual indicators discontinued is available on the NHS Employers website.
Further information on indicators
Information on the potential achievement for each individual indicator as well as its definition can be found in the List of individual QOF indicator descriptions Excel spreadsheet. Information on the changes to clinical indicator groups since 2004 and the numbers of points available within each group can be found on our web page Summary of available clinical domain points, by year. Further information on the changes to the clinical domain and other parts of the QOF for previous years are summarised on our web page Revisions to the QOF, by year.

15
Information Services Division
Payments
QOF payments for each practice are calculated based on the number of points achieved by the practice, the number of people registered at the practice and the prevalence of each condition in the practice as a proportion of the overall prevalence for Scotland. To put this in context, in 2011/12 QOF payments accounted for approximately £134 million of the £740 million spent on Primary Medical Services in Scotland. The average QOF payment to a GMS practice for 2012/13 was £142,000. This is up from £138,900 in 2011/12. This increase was due to a number of reasons. These include:
an increase in the average points achieved by practices;
an increase in the pounds paid per point achieved; and
a reduction in the number of GMS practices in Scotland, from 878 at 1st January 2012 to 870 at 1st January 2013, resulting in an increase in the average practice population.
Table 5. QOF payments to practices, from 2010/11
2010/11 2011/12 2012/13
Total QOF funding to all QOF practices
£130million £134million £137million
Average payment per GMS practice £132,600 £138,900 £142,000
More information about how QOF payments are calculated is in Appendix 4.

16
Information Services Division
Exception reporting
There are occasions when General Practices are not able to treat or monitor patients in ways specified by the QOF indicators. The most common reason for this is that the patient has been diagnosed very recently and the treatment is not yet fully underway. Other reasons include a patient not attending their appointments or having only recently moved to the practice. These patients are excluded from the QOF reporting using a system called ‘exception reporting’ so that General Practices are not penalised for patient characteristics beyond their reasonable control. When patients are ‘exception reported’ from an indicator they are not included in the calculation of a practice’s achievement against that indicator. Further information on the numbers of patients excluded for 2012/2013 is available on the 2012/13 Exception Reporting webpage. The webpage also includes a Questions & Answers document which details the criteria for excluding patients, technical information on how the exclusions are calculated and commentary on observed exception reporting rates.
17
Information Services Division
Glossary 17C practice A practice run by GPs but has locally negotiated contracts for its services. This supports flexible provision of services to support local needs. You can read more about the different practice types and their participation in QOF on Page 4 and Appendix 1. 17J practice See GMS practice. 2C practice A practice which is run by an NHS Board rather than by GPs. These may be practices that offer only Out of Hours services, practices for patients with challenging behaviour, smaller practices or practices without a permanent GP. You can read more about the different practice types and their participation in QOF on Page 4 and Appendix 1. Average The average used throughout this publication is the arithmetic mean. CHD Coronary Heart Disease. CHP A Community Health Partnership (CHP) is a committee of the Health Board which develops local community health services, in partnership with their local authority partners. There are 34 Community Health Partnerships (CHPs) in Scotland, covering 14 Health Boards and 32 local councils. CKD Chronic Kidney Disease. COPD Chronic Obstructive Pulmonary Disease . CVD Cardiovascular Disease. Domain There are four domains within the QOF: clinical, organisational, patient experience and additional services. Each domain consists of a set of indicators, against which practices score points according to their level of achievement. GMS practice (also known as a 17C practice) A practice run by GPs that adheres to the nationally negotiated standard contract for General Practices. You can read more about the different practice types and their participation in QOF on Page 4 and Appendix 1. Indicator The QOF measures a General Practice's achievement against 142 evidence-based indicators. Most health conditions or services are monitored using several indicators, and these indicators together form an indicator group. For example, the indicator group

18
Information Services Division
“hypertension” (high blood pressure) has three indicators: keeping a register of patients with hypertension; regular blood pressure monitoring of those patients; and successful regulation of their blood pressure. LVD Left Ventricular Dysfunction. Prevalence Prevalence is a measure of the frequency of a disease or health condition in a defined population at a particular point in time. When reported through QOF, prevalence is calculated as the total number of patients on the disease register, expressed as a proportion or percentage of the total number of patients registered with the practice. Prevalence and incidence are sometimes used interchangeably however these terms do have specific meanings. Incidence is the measure of the number of newly diagnosed cases in a defined population during a particular time period. QOF The Quality & Outcomes Framework (QOF) measures a General Practice's achievement against a set of evidence-based indicators. Payments are made to each General Practice on the basis of their achievements against those indicators. QOF Calculator The national QOF calculation database. Register A QOF register is a list of patients registered with a practice. It may count patients with one specific disease or condition, or it may include multiple conditions. There may also be other criteria for inclusion on a QOF register, such as age or time of diagnosis.

19
Information Services Division
List of Tables Over 100 individual QOF files are available for 2012/13 containing data and supplementary reference information. These in Excel and PDF files have been grouped into data table pages which you can access from the links below. Clicking on each link you will take you to page where you can access the individual files. The only exception to this is the link to the Scotland level prevalence trend which links to a single file.
Data table page Number of data files
Time period File type & size(s)
Achievements data tables at Scotland and NHS Board Level*
6 Year ending March 2013*
Excel [37kb – 376kb]
Achievements data at Community Health Partnership (CHP) level*
5 Year ending March 2013*
Excel [35kb - 804kb]
Achievements data at practice level – summaries*
3 Year ending March 2013*
Excel [246kb - 288kb]
Achievements data practice level - individual indicators*
39 Year ending March 2013*
Excel [0.2mb – 5.7mb]
Register and prevalence data at Scotland, NHS Board and CHP level*
5 Year ending March 2013*
Excel [0.2mb – 1.3mb]
Scotland level prevalence trends 2004/05 – 2012/13
1 2004/05 to 2012/13
Excel [29kb]
Scotland Performs – Dementia data for HEAT standard
1 Year ending March 2013
Excel [41kb]
Exception reporting in clinical indicators*
39 Year ending March 2013*
Excel [0.2mb – 4.3mb]
Please note: When opening data files in Excel, you may need to select the option ‘enable macro’ in order for the files to open and work correctly. *Where data table page names and time periods are marked with an asterisk (*), this indicates that equivalent tables for earlier years are also available on the QOF area of ISD’s website. To access these earlier data tables and other information related to the QOF, go to http://www.isdscotland.org/Health-Topics/General-Practice/Quality-And-Outcomes-Framework/

20
Information Services Division
Contact Euan Patterson Senior Information Analyst [email protected] 0131 275 7705 Richard Hunter Principal Information Analyst [email protected] 0131 275 6957.
Further Information Further information can be found on the ISD website
Rate this publication Click here to provide feedback and rate this publication.

21
Information Services Division
Appendix
A1 – General Practice types and their participation in QOF
Primary Medical Services
With effect from 1st April 2004, The Primary Medical Services (Scotland) Act 2004 amended The National Health Service (Scotland) Act 1978 by placing a duty on NHS Boards to provide or secure 'primary medical services' for their populations. NHS Boards can do so by providing services directly (this is known as 'direct provision’ - Section 2C of the 1978 Act) or by making arrangements (by 'contract' or 'agreement') with a range of 'providers' through:
a 'GMS' (General Medical Services - Section 17J of the 1978 Act) contract - nationally negotiated with some local flexibility for GPs to 'opt out' of certain services or 'opt in' to the provision of other services
a 'Section 17C' (formerly known as 'Personal Medical Services' or 'PMS') agreement - locally negotiated agreements which are more flexible in accordance with local circumstances
a 'Health Board Primary Medical Services' contract (Section 2C of the 1978 Act) - the NHS Board can, in certain circumstances, make arrangements with either a NHS organisation or a non-NHS organisation for the provision of NHS services. In practice, these Section 2C practices are run by the Boards themselves.
The majority (approximately 88%) of General Practices in Scotland have a new GMS contract. The largest proportion of the remainder is made up of Section 17C (8%) Schemes, with a smaller number of services provided under section 2C (4%).
The new GMS contract
The new GMS contract, implemented throughout the United Kingdom since 1st April 2004, was the product of negotiations between the British Medical Association's (BMA's) General Practitioners Committee and the NHS Confederation. The new contract was introduced to support the ongoing development of primary care, and to give greater flexibility in how General Practices deliver patient care, and are paid. A fundamental component of the new GMS contract is a system of financial incentives for delivering clinical and organisational quality - the Quality & Outcomes Framework (QOF). Further information on the QOF and the new GMS contract is available via the Primary Care Contracting pages of the NHS Employers website.
The Quality & Outcomes Framework for practices with new GMS contracts
The QOF, although fundamental to the new GMS contract, is nonetheless a voluntary part of it; General Practices can aspire to achieve all, part, or none of the points available in QOF. Whilst, to date, most GMS practices in Scotland have participated fully in the QOF, it is important to note that for some practices it may be impossible to achieve all the points available in the framework. For example, some of the clinical indicators relate to very specific subgroups of patients, and if the practice does not have any patients in that particular subgroup, they cannot score any points against the relevant indicator(s). This

22
Information Services Division
means that it is not necessarily possible for all practices to achieve a full 'score' against the QOF. Additionally, practices with section 2C or 17C agreements may choose whether or not to participate in the QOF (see below).
The Quality & Outcomes Framework for practices with 17C or 2C agreements
Section 17C or 2C schemes include quality and outcomes as part of their locally negotiated agreements, and in many cases, they opt to use part or all of the new GMS QOF as a measurement tool. However, it is possible to tailor the quality and outcomes requirements of a Section 17C or 2C agreement in accordance with local circumstances - such as the needs of a particular group of patients - and, again, subject to local agreement. Such practices might use quality measures that, although rigorous and appropriate, are not identical to those used in the GMS QOF. Therefore, although 17C/2C practices may record full QOF data if they wish, they may deliberately use only part of the QOF, or may not use it at all. This means that practices with contract types 17C and 2C may sometimes not appear to achieve as many points as other practices who use all of the QOF indicators. It is essential that published QOF results are interpreted carefully in the context of the contracting arrangements of individual practices. In particular, practices with contract types 17C and 2C may only use some of the QOF indicators and thus may not appear to achieve as many points as other practices who use all of the QOF indicators.

23
Information Services Division
A2 – Data completeness
Prevalence
The following Boards submitted incomplete prevalence data: NHS Forth Valley, NHS Highland and NHS Lothian. In NHS Forth Valley there is no prevalence data published for one practices. In NHS Highland there is no prevalence data published for two practices, one Surgery is vacant and the other is a salaried GP practice. In NHS Lothian there is no prevalence data published for three practices.
Achievement and Payment
The following Boards submitted incomplete achievement and payment data: NHS Grampian, NHS Highland and NHS Lothian There are 3 practices in NHS Lothian that have participated in a 17c redesign project in 2012/13 and received a QOF payment based on an achievement of 1,000 points. Another three NHS Lothian practices have bespoke quality frameworks that are tailored to the needs of their registered patient population. For one practice no data has been published. In NHS Highland there is no achievement or payment data published for two practices, one Surgery is vacant and the other is a salaried GP practice. The status of these practices could affect the level of QOF achievement so achievement will appear low against other practices. No achievement or payment data published for any of the 8 practices with a 17C contract in NHS Grampian as these practices use only a subset of the GMS QOF indicators in their own quality work so achievement will appear low against practices that measure achievement against all QOF indicators.
Further information on data completeness and the number of practices submitting QOF data in each board since 2009 is available on the QOF data completeness page of the ISD website
24
Information Services Division
A3 – Reliability of QOF prevalence data by condition
The reliability for QOF register and prevalence data for each condition is discussed below. Asthma – These data are reliable. However QOF registers only include patients who have received treatment during the previous 12 months so prevalence will differ from measures of how many people have ever been treated or who have minor symptoms that don't require medication. Atrial Fibrillation – These data are reliable. Prevalence will depend on how thoroughly doctors search for the condition, as it may not be apparent to patients that they have it. Also, the condition is much more common in older age so practices with older populations will have higher prevalence. Cancer – This is a register of everyone who has had a cancer diagnosis since 1 April 2003 (excluding skin cancer) and is still alive therefore it rises every year. CHD – These data are reliable. The QOF prevalence represents the proportion of people who have ever had a diagnosis of CHD. CKD - These data are reliable though it should be noted that, as prevalence of CKD rises with age and QOF prevalence is not adjusted for age profile of practice, practices with older populations will have higher prevalence. COPD – The QOF prevalence for COPD is an underestimate of the true figure. The QOF prevalence is somewhat arbitrary as there are people with poor lung function who don't consult their doctor even though they would meet diagnostic criteria for COPD. Dementia - The prevalence figure may be an underestimate as the diagnosis is not always recorded if it is not the principal reason for consultation. Depression - This measure is not seen as reliable because it is partly cumulative and will therefore rise each year. Individuals with resolved depression will only be taken off the register if this is recorded by the practice and this isn’t done in all cases. Conditions for Depression Screening - This is not a measure of the prevalence of depression but a measure of the prevalence of patients who have diabetes and/or heart disease. Screening for depression for individuals with these conditions is recommended. Diabetes – This register is limited to those aged 17 and over with the diagnosis specified as type 1 or type 2, and excludes the very small number with other types and the larger number with type not recorded. The prevalence is calculated on the total practice population regardless of age, so will therefore be an underestimate. Epilepsy – This register relates only to those aged 18 and over and on drug treatment so excludes the smallish number who have been able to discontinue drug treatment. Also, the prevalence is calculated on the total practice population regardless of age, so will therefore be an underestimate.
25
Information Services Division
Heart Failure – QOF prevalence is thought to be a slight underestimate of the true figure. A diagnosis of heart failure requires specialist confirmation and GPs may be reluctant to refer people who are housebound, suffering from other serious conditions, or in whom the heart failure is thought to be mild. Hypertension – These data are reliable. Hypothyroidism – The QOF register only records those patients currently on treatment so the prevalence reported will be a slight underestimate. Learning Disabilities – This register is limited to those aged 18 and over with learning disabilities. Also, the definition includes a wide range of disability, many of which are open to some interpretation by the GP. The QOF prevalence for this is therefore not seen as a reliable measure of those with learning disabilities. LVD - QOF prevalence is thought to be a slight underestimate of the true figure. A diagnosis of LVD requires specialist confirmation and GPs may be reluctant to refer people who are housebound, suffering from other serious conditions, or in whom the heart failure is thought to be mild. Mental Health – The mental health QOF register specifically counts people with schizophrenia, bipolar disorder and other psychoses. These data are reliable but may not compare with other measures of mental health prevalence due to differences in conditions included. Obesity - These data are limited to people aged 16 and over with BMI of 30 or more. The QOF prevalence rates for obesity are far lower than rates reported elsewhere (for example the Scottish Health Survey reported in 2010 that 27.4% of men and 28.9% of women aged over 16 years were obese). Many of those who are obese are not recorded on practice registers as obesity is only reliably recorded when it becomes a contributing factor to another disease. Osteoporosis – New register for 2012/13. The QOF prevalence for Osteoporosis is likely to be an underestimate of the true figure. The register is limited to those aged over 50 and patients may not consult their doctor even though they would meet diagnostic criteria for Osteoporosis. Palliative Care – This QOF prevalence of palliative care is unreliable as the judgement about who needs palliative care is subjective. Numbers are low as patients only receive palliative care for a short length of time. Peripheral Arterial Disease (PAD) - New register for 2012/13 should be treated with caution in the first few years of reporting as they are still being established and validated. Primary Prevention of Cardio-vascular Disease – This is not a measure of the prevalence of CVD. The QOF prevalence figure for this relates to patients with a new diagnosis of hypertension and excludes those with certain other conditions (pre-existing CHD, diabetes, stroke and/or TIA). Smoking – This is not a measure of the prevalence of smoking but a measure of the prevalence of patients who have one or more of a range of conditions who smoke. These conditions are coronary heart disease, stroke or TIA, hypertension, diabetes, COPD, CKD, asthma, schizophrenia, bipolar affective disorder or other psychoses.

26
Information Services Division
Stroke or TIA – This register includes all those who have ever had one of these conditions. As diagnosis of TIA may in practice be slightly subjective the QOF prevalence for this is seen as a slight underestimate. For further information about the reliability of QOF prevalence estimates for specific conditions see our web page containing Information for users of QOF register and prevalence data. This page also contains links to more reliable prevalence data when these are available.
27
Information Services Division
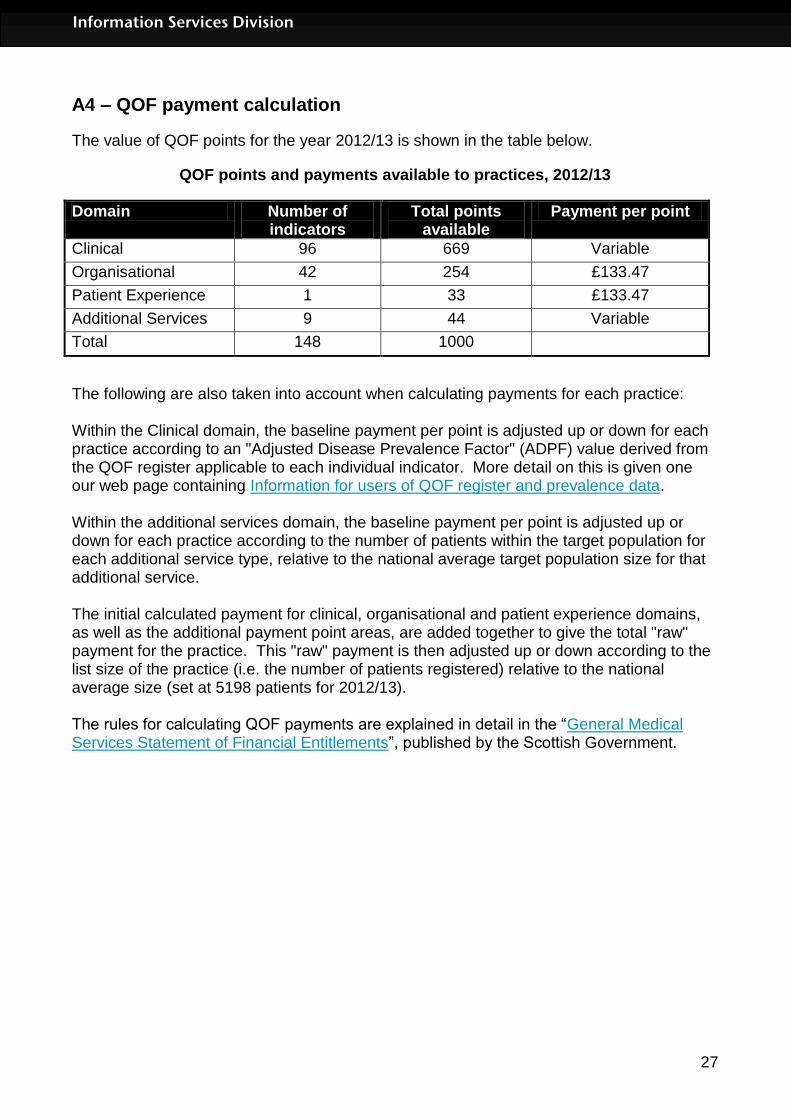
A4 – QOF payment calculation
The value of QOF points for the year 2012/13 is shown in the table below.
QOF points and payments available to practices, 2012/13
Domain Number of indicators
Total points available
Payment per point
Clinical 96 669 Variable
Organisational 42 254 £133.47
Patient Experience 1 33 £133.47
Additional Services 9 44 Variable
Total 148 1000
The following are also taken into account when calculating payments for each practice: Within the Clinical domain, the baseline payment per point is adjusted up or down for each practice according to an "Adjusted Disease Prevalence Factor" (ADPF) value derived from the QOF register applicable to each individual indicator. More detail on this is given one our web page containing Information for users of QOF register and prevalence data. Within the additional services domain, the baseline payment per point is adjusted up or down for each practice according to the number of patients within the target population for each additional service type, relative to the national average target population size for that additional service. The initial calculated payment for clinical, organisational and patient experience domains, as well as the additional payment point areas, are added together to give the total "raw" payment for the practice. This "raw" payment is then adjusted up or down according to the list size of the practice (i.e. the number of patients registered) relative to the national average size (set at 5198 patients for 2012/13). The rules for calculating QOF payments are explained in detail in the “General Medical Services Statement of Financial Entitlements”, published by the Scottish Government.

28
Information Services Division
A5 – Publication metadata (including revisions details)
Metadata Indicator
Description
Publication title
Quality and Outcomes Framework: Prevalence, achievement, payment and exceptions data for Scotland, 2012/2013
Description Information on QOF points achieved, total QOF payments, QOF register and prevalence information, and exception reporting data.
Theme Health and Social Care
Topic General Practice
Format Excel workbooks, PDF files, one Word file.
Data source(s) QOF Calculator, plus notifications from NHS Boards of local adjustments to data
Date that data are acquired
Data extract taken on July 18th 2013. This was then validated and amended to reflect local adjustments, as notified by NHS Boards. Finalised data file available late August 2013.
Release date Data first published 24th September 2013
Frequency Annual
Timeframe of data and timeliness
Data for the year ending March 2012. Normal timeliness for this publication. Practices and NHS Boards sign off the QOF data for payment during the period April to June each year therefore a final national dataset is not available prior to July. Further work to validate the data for publication is done during July and August.
Continuity of data
Continues directly on from earlier publications of data from 2004/05 onwards
Revisions statement
All QOF data is finalised as part of the Payment Verification process prior to publication. There are no planned revisions to the data and the data are considered to be final. Any unplanned revisions or corrections will be managed in accordance with ISD’s Statistical Revisions Policy.
Revisions relevant to this publication
N/A
Concepts and definitions
These are explained further in this document, in the Glossary and Appendix A1. Additional detail is given in footnotes to individual Excel workbooks
Relevance and key uses of the statistics
These statistics report on general practices’ achievement towards a set of evidence based indicators designed towards improvements in patient care in primary care. The information contained in this publication will be of interest to individuals, organisations and groups with an interest in workload, quality improvement, epidemiology and other aspects of general practice. Here are some examples of how the information on the QOF has been used.
General Practitioners, their patients and practice staff to compare their results with those for other practices.
NHS Boards and Community Health Partnerships teams use the results to see how the practices in their areas compared to others and use this information to support quality improvement work with practices.
Government Health Departments and the British Medical Association (BMA) use this data to negotiate future changes to QOF indicators and
29
Information Services Division
payment calculations.
Academic researchers for research projects.
Accuracy QOF data are collected as part of practices’ contractual agreements and are subject to payment verification processes, carried out by the respective NHS Board for each practice, both prior to and after payment. Therefore, the data presented will have an excellent degree of accuracy since they represent figures corresponding to verified practice payment. Any non-verified data are removed from analysis and it is up to the individual boards to inform ISD of these. More details on the QOF payment verification process can be found in the relevant section of the payment verification document - http://www.sehd.scot.nhs.uk/publications/DC20111020payverif.pdf Occasionally there may be technical or other problems with individual practice data submissions which can mean that the finely detailed data here may undercount or over-count the numbers of patients falling into a particular category. This may in turn have an impact on the accuracy of the aggregate information presented, although typically the impact will be small at Board or Scotland level. Any erroneous data will be removed from analysis wherever possible, after either notification of a known problem from the NHS Board or through cross-checks on the data carried out by ISD, but it may be that a small amount are missed.
Completeness Virtually all General Practices in Scotland collect at least some QOF data. Summary tables such as those showing total payments and achievements include data from around 99% of Scottish practices. As in previous years, individual practices (particularly those that do not operate under a standard GMS contract) vary in the extent to which they collect data for all of the individual QOF indicators. Furthermore, issues with the accuracy of data submissions for a small number of practices in each year can mean that the data for these practices are excluded from the publication (for example if there were technical problems with the data submission process). This means that there are variations in the numbers of practices included in individual data tables. Information on the numbers of practices included in each analysis is given in the data tables. Details of practices omitted from the analysis are included in the footnotes where relevant. As individual data tables are based on data from varying numbers of practices (and variations may exist from year to year as well as between individual tables for the same year) direct comparisons of counts of patients in particular groups may not always be possible. However, direct comparisons of percentages or rates can be made for equivalent registers, indicators or indicator groups. For more details on completeness please refer to – http://www.isdscotland.org/Health-Topics/General-Practice/Quality-And-Outcomes-Framework/Data-Completeness.asp
Comparability The clinical information in the Scottish QOF is for the most part closely comparable with QOF clinical information for the other UK nations. Any variation between the nations is generally to be found in the fine details of definitions of indicators and rules. For example, the age range of women
30
Information Services Division
covered by the cervical screening indicators is not exactly the same for each nation. However, though the QOF data collected is essentially equivalent across the nations, a number of other factors would need to be considered before any comparisons are made such as differences in the demographics of General Practices, the ratio of practice contract types and QOF remuneration between the nations. Links to QOF data for the other UK nations can be found in the ISD QOF pages. The QOF is specific to the UK and therefore the information shown here is not directly comparable with any apparent equivalents for other countries. QOF prevalence data for General Practices differs from those published by Practice Team Information (PTI). PTI is based on data collected from patient consultations within a small sample of Scottish practices (approximately 6%). More information can be found on the comparability of QOF and PTI here.
Accessibility It is the policy of ISD Scotland to make its web sites and products accessible according to published guidelines.
Coherence and clarity
Tables and charts are accessible via the ISD website at: http://www.isdscotland.org/Health-Topics/General-Practice/Quality-And-Outcomes-Framework/
Value type and unit of measurement
Numbers and percentages. Shown for individual practices, Community Health Partnerships, NHS Boards and Scotland
Disclosure The ISD protocol on Statistical Disclosure Protocol is followed.
Official Statistics designation
National Statistics
UK Statistics Authority Assessment
Assessment has taken place and the subsequent report was published in June 2012 at http://www.statisticsauthority.gov.uk/assessment/assessment/assessment-reports/assessment-report-209---statistics-on-dental-and-ophthalmic-services-and-general-practice-in-scotland.pdf
Last published 25th September 2012
Next published
30th September 2014
Date of first publication
2005 (QOF data are published back to 2004/05, the first year for which the QOF existed)
Help email [email protected]
Date form completed
04th September 2013

31
Information Services Division
A5 – Early Access details (including Pre-Release Access)
Pre-Release Access Under terms of the "Pre-Release Access to Official Statistics (Scotland) Order 2008", ISD are obliged to publish information on those receiving Pre-Release Access ("Pre-Release Access" refers to statistics in their final form prior to publication). The standard maximum Pre-Release Access is five working days. Shown below are details of those receiving standard Pre-Release Access and, separately, those receiving extended Pre-Release Access. Standard Pre-Release Access:
Scottish Government Health Department NHS Board Chief Executives NHS Board Communication leads
Extended Pre-Release Access Extended Pre-Release Access of 8 working days is given to a small number of named individuals in the Scottish Government Health Department (Analytical Services Division). This Pre-Release Access is for the sole purpose of enabling that department to gain an understanding of the statistics prior to briefing others in Scottish Government (during the period of standard Pre-Release Access).
Scottish Government Health Department (Analytical Services Division)

32
Information Services Division
A6 – ISD and Official Statistics
About ISD Scotland has some of the best health service data in the world combining high quality, consistency, national coverage and the ability to link data to allow patient based analysis and follow up. Information Services Division (ISD) is a business operating unit of NHS National Services Scotland and has been in existence for over 40 years. We are an essential support service to NHSScotland and the Scottish Government and others, responsive to the needs of NHSScotland as the delivery of health and social care evolves. Purpose: To deliver effective national and specialist intelligence services to improve the health and wellbeing of people in Scotland. Mission: Better Information, Better Decisions, Better Health Vision: To be a valued partner in improving health and wellbeing in Scotland by providing a world class intelligence service. Official Statistics Information Services Division (ISD) is the principal and authoritative source of statistics on health and care services in Scotland. ISD is designated by legislation as a producer of ‘Official Statistics’. Our official statistics publications are produced to a high professional standard and comply with the Code of Practice for Official Statistics. The Code of Practice is produced and monitored by the UK Statistics Authority which is independent of Government. Under the Code of Practice, the format, content and timing of statistics publications are the responsibility of professional staff working within ISD. ISD’s statistical publications are currently classified as one of the following:
National Statistics (ie assessed by the UK Statistics Authority as complying with the Code of Practice)
National Statistics (ie legacy, still to be assessed by the UK Statistics Authority)
Official Statistics (ie still to be assessed by the UK Statistics Authority)
other (not Official Statistics) Further information on ISD’s statistics, including compliance with the Code of Practice for Official Statistics, and on the UK Statistics Authority, is available on the ISD website. The United Kingdom Statistics Authority has designated these statistics as National Statistics, in accordance with the Statistics and Registration Service Act 2007 and signifying compliance with the Code of Practice for Official Statistics. Designation can be broadly interpreted to mean that the statistics:
meet identified user needs;
are well explained and readily accessible;
are produced according to sound methods, and
are managed impartially and objectively in the public interest. Once statistics have been designated as National Statistics it is a statutory requirement that the Code of Practice shall continue to be observed.