Public Transport Asset Management
36
World Bank Workshop and Training on Urban Transport Planning and Reform. Baku, April 14-16, 2009 Public Transport Asset Management 17 maintenance shops 885 miles of track
Transcript of Public Transport Asset Management

WorldBank Workshop and Training on Urban Transport Planning
and Reform. Baku, April 14-16, 2009
Public Transport Asset Management
17 maintenance shops
885 miles of track

WorldBank 2
Key Public Transport Activities
Service Planning
Daily Service
Transportation
Maintenance
Capital Planning
New Equipment
New Facilities
Construction
Asset Management
Often given minimal attention

WorldBank 3
PT Assets Often Are Complex
Over 2000 revenue vehicles 275 stations
Visible to Public Visible to Public
885 miles of track
Invisible to Public
478 bridgesInvisible to Public
20 miles of tunnelsInvisible to Public
17 maintenance shopsInvisible to Public

WorldBank 4
Asset Management
Control of assets
Assignment of responsibility
Maintenance of inventory
Disposition
Maintenance in a State-of-Good Repair (SGR)
Ensure that assets used economically throughout their useful life
WorldBank 5
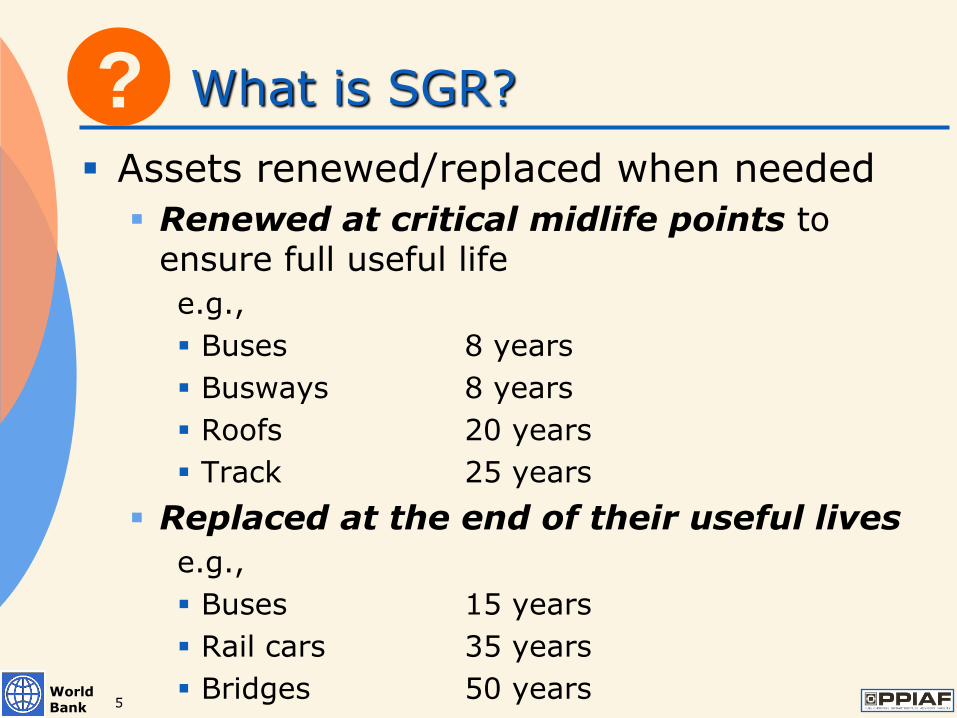
What is SGR?
Assets renewed/replaced when needed
Renewed at critical midlife points to ensure full useful life
e.g.,
Buses 8 years
Busways 8 years
Roofs 20 years
Track 25 years
Replaced at the end of their useful lives
e.g.,
Buses 15 years
Rail cars 35 years
Bridges 50 years
?

WorldBank 6
Importance of Renewal
Preventive Maintenance
Deterioration Curve
Reactive Maintenance
Deterioration Curve

WorldBank 7
SGR Database Is Needed
Identify renewal/replacement activities Important for often-forgotten renewals
Demonstrate ongoing funding needs and consequences Engineering assessment of current assets
Support long-range capital planning Project programming under constrained
funding

WorldBank 8
Boston MBTA Case Study
Multi-modal
Ages of assets range up to 100 years
Service expansion continues
BRT Commuter Rail
WorldBank 9
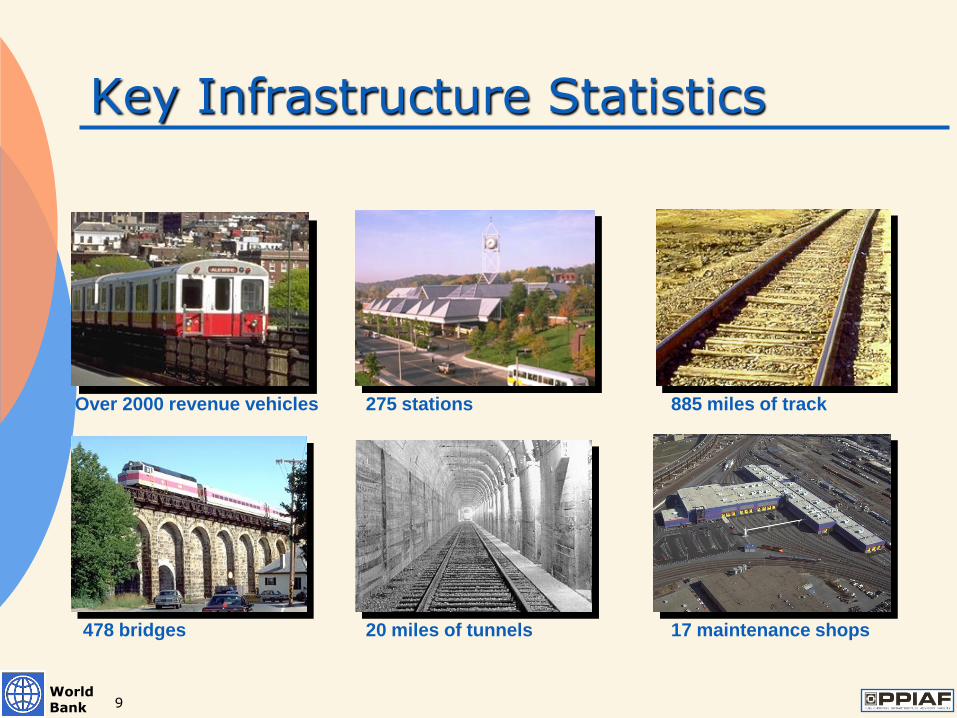
478 bridges 20 miles of tunnels 17 maintenance shops
885 miles of track
Key Infrastructure Statistics
Over 2000 revenue vehicles 275 stations
WorldBank 10
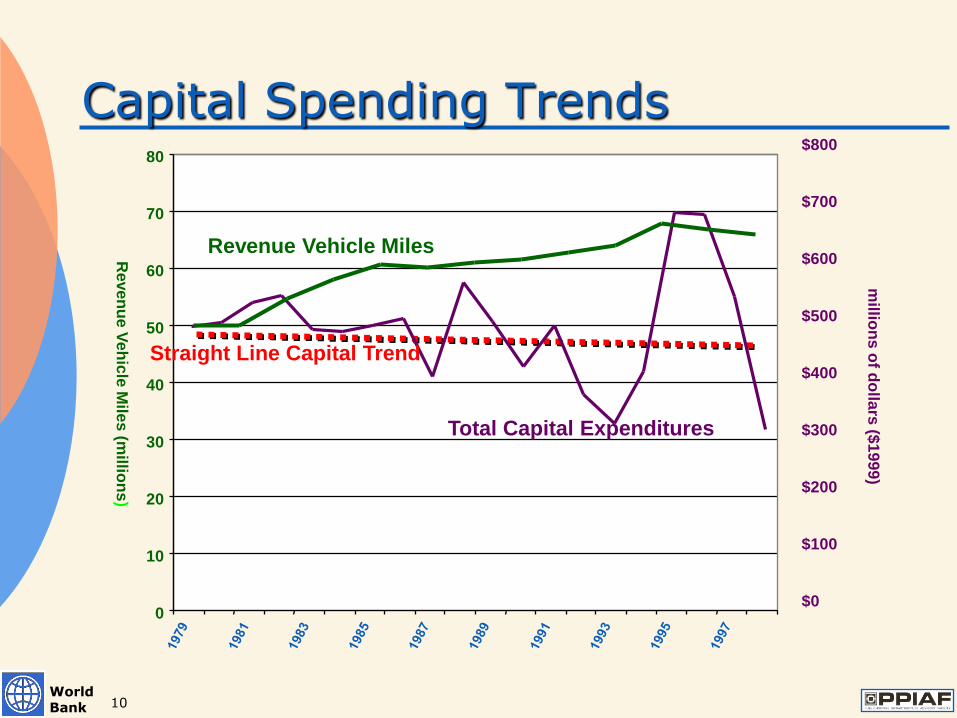
Straight Line Trend
Capital Spending Trendsm
illion
s o
f do
llars
($1
99
9)
$0
$100
$200
$300
$400
$500
$600
$700
$800
Total Capital Expenditures
0
10
20
30
40
Reve
nu
e V
eh
icle
Mile
s (m
illion
s)
60
70
80
50
Revenue Vehicle Miles
Straight Line Capital Trend
WorldBank 11
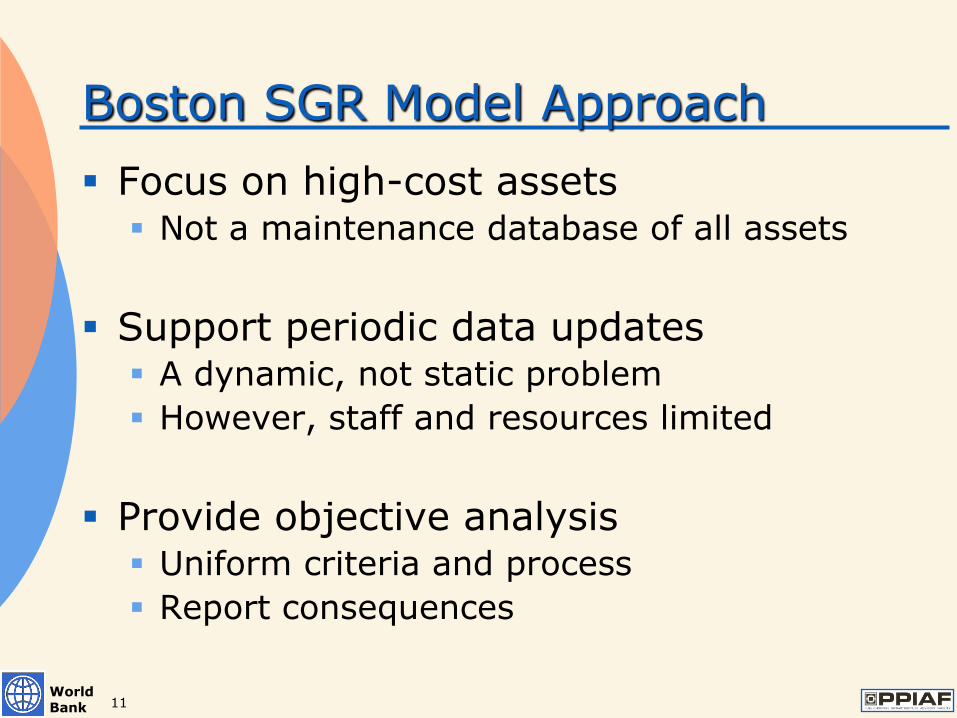
Boston SGR Model Approach
Focus on high-cost assets Not a maintenance database of all assets
Support periodic data updates A dynamic, not static problem
However, staff and resources limited
Provide objective analysis Uniform criteria and process
Report consequences

WorldBank 12
Assets Table
Annual Budgets
Prioritization Weights
SGR Model Inputs

WorldBank 13
SGR Database — Assets Table
Stores information about all key MBTA assets
Vehicles
Facilities
Systems
WorldBank 14
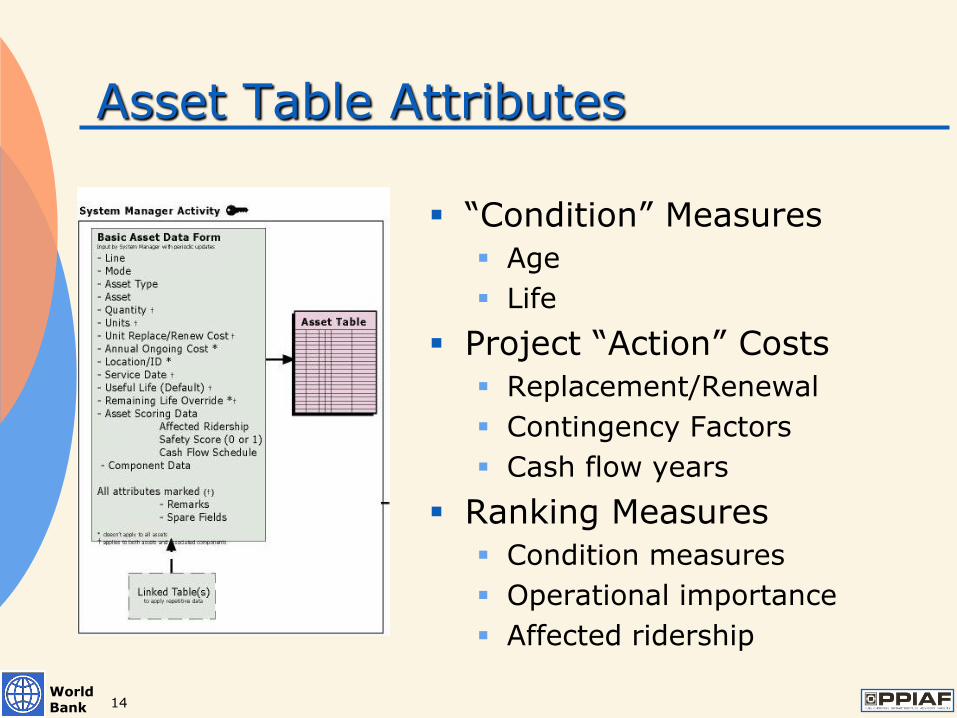
Asset Table Attributes
“Condition” Measures
Age
Life
Project “Action” Costs
Replacement/Renewal
Contingency Factors
Cash flow years
Ranking Measures
Condition measures
Operational importance
Affected ridership

WorldBank 15
Scoring Candidate Actions
Default Weighting
Age
60%
Cost
Effectiveness
20%
Operational
Impact
20%
Age Age as % of Service Life
Operational Impact Yes/No
Selected assets are essential to system operations
Cost-Effectiveness Cost of Action/Ridership
Reflects impact on users
WorldBank 16
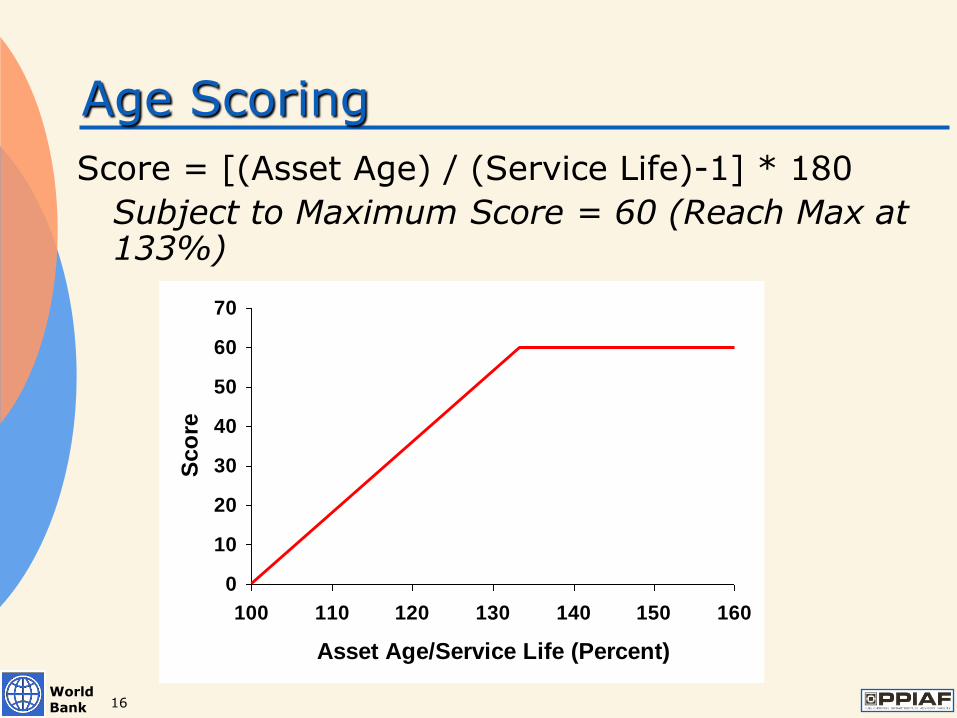
Age Scoring
0
10
20
30
40
50
60
70
100 110 120 130 140 150 160
Asset Age/Service Life (Percent)
Sco
reScore = [(Asset Age) / (Service Life)-1] * 180
Subject to Maximum Score = 60 (Reach Max at 133%)

WorldBank 17
Age Scoring Examples
Asset Age Service Life Percent Score
Bus 15 15 100 0
Bus 18 15 120 36
Bridge 55 50 110 18
WorldBank 18
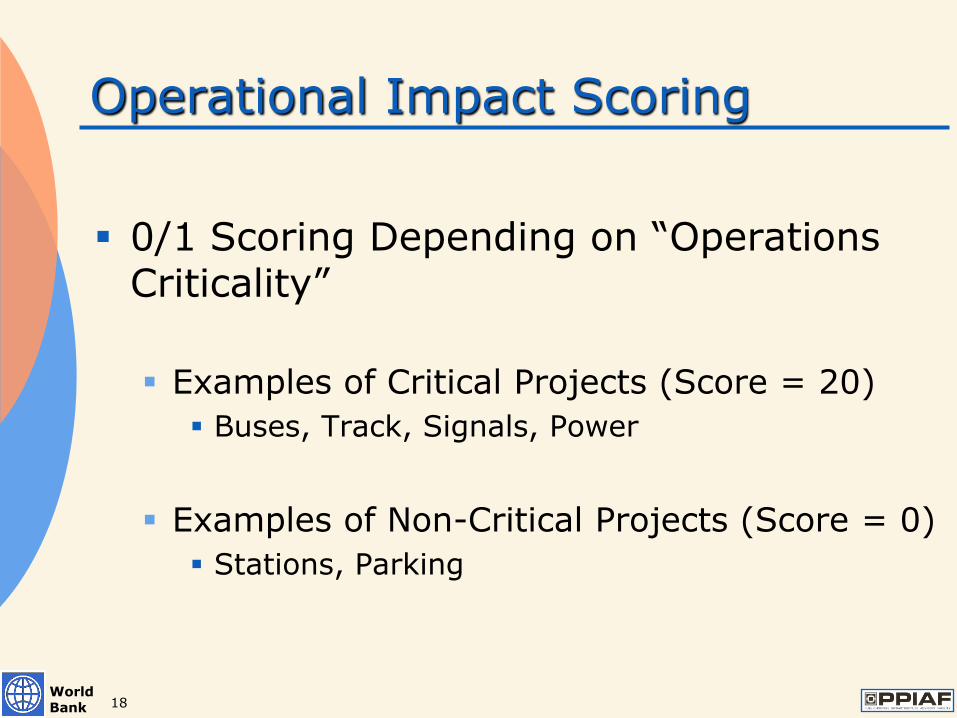
Operational Impact Scoring
0/1 Scoring Depending on “Operations Criticality”
Examples of Critical Projects (Score = 20)
Buses, Track, Signals, Power
Examples of Non-Critical Projects (Score = 0)
Stations, Parking

WorldBank 19
Cost-Effectiveness Scoring
Cost-Effectiveness (CE) = Daily Riders/Project Cost
Project Cost = Remaining Cost for Multiple-Year Funded Projects
Project Score = (Project CE / Ave CE (All Projects)
* 10
Subject to Maximum Score = 20

WorldBank 20
Sequential Programming Process
Identify candidate projects Actions come due
Delayed projects from prior years
Score and rank projects
Fund projects in rank order until:Cost (project i) > Funds remaining
Mark unfunded projects as candidates for next year
Carryover remaining funds to next year

WorldBank 21
Analysis Questions
What is the funding needed to bring and maintain system at SGR?
Lives of all assets < services lives
All renewals performed on-time
What are the consequences of providing less than required SGR funding?
Replacements/Renewals performed on-time
Replacements/Renewals delayed
Replacements/Renewals not performed
WorldBank 22
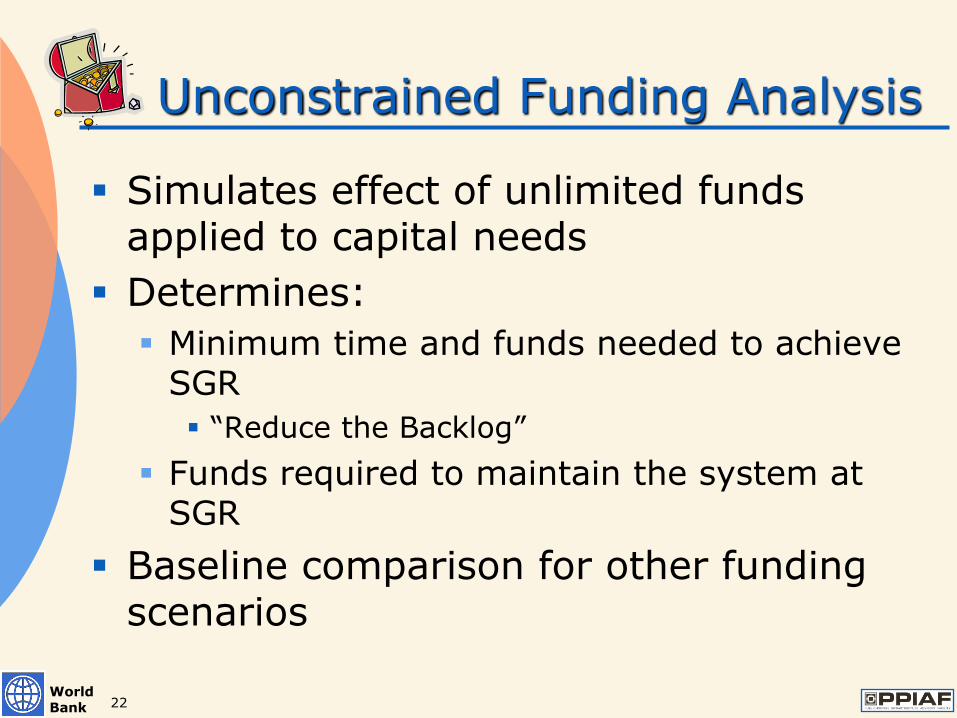
Unconstrained Funding Analysis
Simulates effect of unlimited funds applied to capital needs
Determines:
Minimum time and funds needed to achieve SGR
“Reduce the Backlog”
Funds required to maintain the system at SGR
Baseline comparison for other funding scenarios
WorldBank 23
$0.00
$500,000,000.00
$1,000,000,000.00
$1,500,000,000.00
$2,000,000,000.00
$2,500,000,000.00
2002 2004 2006 2008 2010 2012 2014 2016 2018 2020 2022
Unconstrained
Year
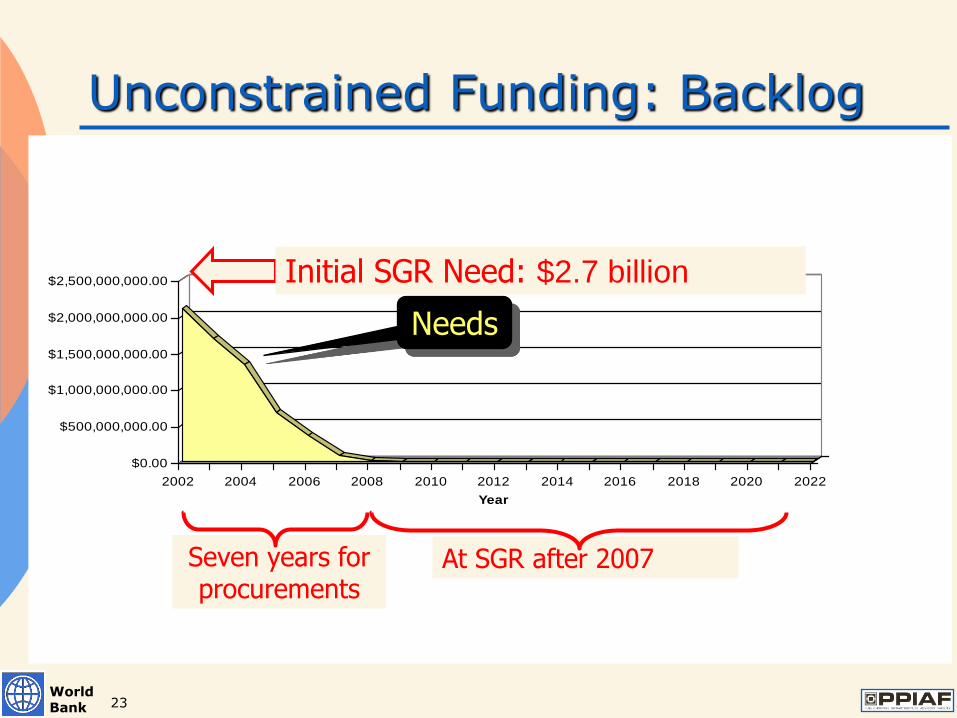
Unconstrained Funding: Backlog
Needs
Seven years for procurements
At SGR after 2007
Initial SGR Need: $2.7 billion

WorldBank 24
$0.00
$500,000,000.00
$1,000,000,000.00
$1,500,000,000.00
$2,000,000,000.00
$2,500,000,000.00
2002 2004 2006 2008 2010 2012 2014 2016 2018 2020 2022
Unconstrained
Year
Unconstrained Funding: Backlog
Spending
Seven years for procurements
At SGR after 2007

WorldBank 25
Constrained Funding Analysis
Simulates effect of limited funds applied to capital needs
Limited funds < Funds needed to achieve SGR
Determines:
Beginning/Ending Period Comparisons
Changes in Backlog
Percent of Assets > Service Life by Asset Type
20-Year Totals
SGR Needs Funded On-time, Late, Not at All
Spending by Asset Type

WorldBank 26
$0.00
$500,000,000.00
$1,000,000,000.00
$1,500,000,000.00
$2,000,000,000.00
$2,500,000,000.00
$3,000,000,000.00
$3,500,000,000.00
$4,000,000,000.00
$4,500,000,000.00
2002 2004 2006 2008 2010 2012 2014 2016 2018 2020 2022
Unconstrained
Year
Unconstrained
$350M
Current Annual Funding: $350M
$350
$0 $200 $400 $600 $800
Backlog

WorldBank 27
Funding by Asset
Ad
min
istr
ati
on
Bri
dg
es
Co
mm
un
icati
on
sE
levato
rs &
Escala
tors
Facilit
ies
Fare
Equ
ipm
ent
No
n-R
even
ue V
eh
icle
s
Park
ing
Po
wer
Reven
ue V
eh
icle
s
Sig
nals
Sta
tio
ns
Tra
ck
Tun
nels
Yard
& S
ho
p
$-
$500,000,000
$1,000,000,000
$1,500,000,000
$2,000,000,000
$2,500,000,000
$3,000,000,000
$3,500,000,000
$4,000,000,000
$4,500,000,000
$5,000,000,000
Asset Spending
$350M Annual Funding
2003-2022
Unconstrained
$350M
WorldBank 28
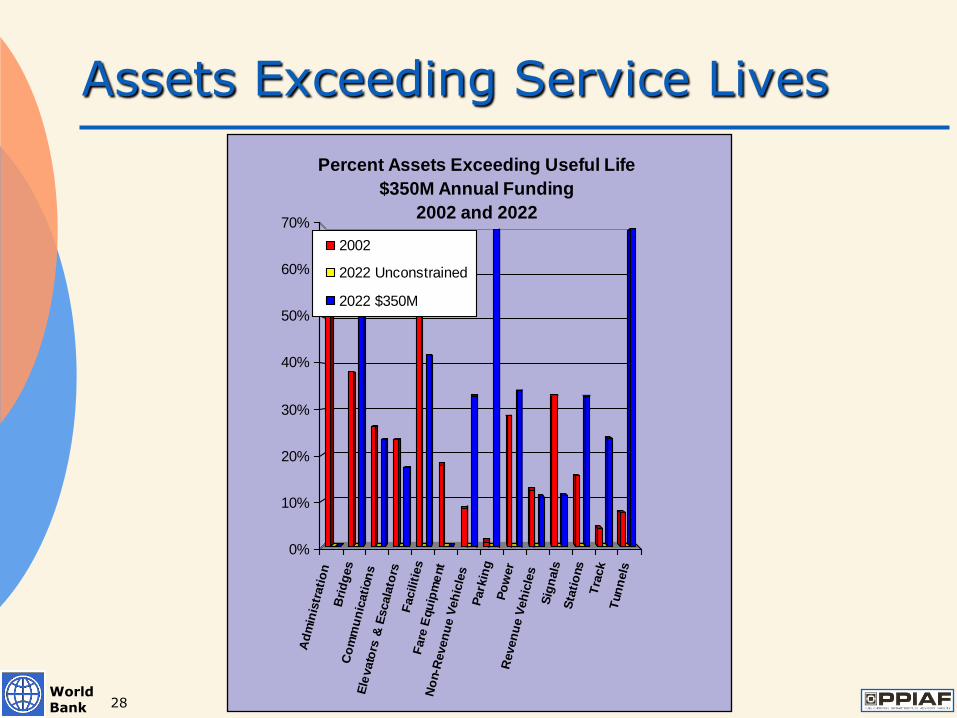
Assets Exceeding Service Lives
Ad
min
istr
ati
on
Bri
dg
es
Co
mm
un
icati
on
sE
levato
rs &
Escala
tors
Facilit
ies
Fare
Equ
ipm
ent
No
n-R
even
ue V
eh
icle
s
Park
ing
Po
wer
Reven
ue V
eh
icle
s
Sig
nals
Sta
tio
ns
Tra
ck
Tun
nels
0%
10%
20%
30%
40%
50%
60%
70%
Percent Assets Exceeding Useful Life
$350M Annual Funding
2002 and 2022
2002
2022 Unconstrained
2022 $350M

WorldBank 29
On-Time Funding Impact
SGR Needs Funded
On Time
SGR Needs Funded
Late
SGR Needs Unfunded
$0
$1,000,000,000
$2,000,000,000
$3,000,000,000
$4,000,000,000
$5,000,000,000
$6,000,000,000
$7,000,000,000
$8,000,000,000
$9,000,000,000
20-Year Funding Impact
$350M Annual Funding
2003-2022
Unconstrained
$350M

WorldBank 30
$0.00
$500,000,000.00
$1,000,000,000.00
$1,500,000,000.00
$2,000,000,000.00
$2,500,000,000.00
$3,000,000,000.00
2002 2003 2004 2005 2006 2007 2008 2009 2010 2011 2012 2013 2014 2015 2016 2017 2018 2019 2020 2021 2022
Unconstrained
Year
Unconstrained
$450M
Maintain Current Backlog: $450M
$450
$0 $200 $400 $600 $800

WorldBank 31
$0.00
$500,000,000.00
$1,000,000,000.00
$1,500,000,000.00
$2,000,000,000.00
$2,500,000,000.00
2002 2004 2006 2008 2010 2012 2014 2016 2018 2020 2022
Unconstrained
Year
Unconstrained
$570M
Eliminate Backlog (20 yrs): $570M
$570
$0 $200 $400 $600 $800

WorldBank 32
Time for a Reality Check!
Show me the money!!
WorldBank 33
The SGR Database Has Been Used in Several Ways
Discussions with Policy Makers
Internal Management

WorldBank 34
Discussions with Policy Makers
Briefing the Board of Directors on SGR
Convincing the Chairman to pursue SGR
Persuading the Legislature of need for SGR capital funding
WorldBank 35
Internal Management Uses
Implications of Current Investment Patterns
Where are we headed ?
MBTA SGR Goal Setting
Where would we like to go?
Yard Stick to Measure Progress Towards SGR
Are we getting closer to our goals?

WorldBank 36
Conclusions
Most transport systems have not addressed long-term asset management issues
The SGR approach can help make the funding case to policy makers.
It also can help managers:
Make more effective decisions
Optimize Public Transport investments