Public TransiT in Florida - Florida Department of … Fl o rdi a de pa r T m e n T o F T r a n s p o...
49
1 FLORIDA TRANSIT HANDBOOK 2011 PUBLIC TRANSIT IN FLORIDA T his Handbook offers a general overview of public transit in the State of Florida. The information in the following pages provides insight into transit’s contribution to meeting the statewide transportation objectives and mission of the Florida Department of Transportation (FDOT). Public transit plays an important role in maintaining the livability of Florida’s growing com- munities. Transit not only helps alleviate traffic congestion and improve air quality, but also provides mobility for many of Florida’s citizens, as well as visitors and tourists to the Sunshine State. Transit also plays a critical role in meeting the mobility and accessibility needs of transit-dependent Floridians and visitors who, due to physical handicap, age, or economic disadvantage, cannot drive or own an automobile. By providing mobility and accessibility to millions of Florida’s residents and visitors, transit helps to improve the overall quality of life in Florida’s communities. This Handbook provides a synopsis of FDOT’s transit resources, a profile of Florida’s transit systems, and a snapshot of their performance in 2010. Although there are rural and urban transit systems in Florida, the focus of this handbook is on Florida’s urban fixed-route transit systems. Information about Florida’s demand response transit systems and rural fixed-route systems can be obtained from the Annual Operations Report published by Florida’s Com- mission for the Transportation Disadvantaged. In 2010, 28 of Florida’s 35 fixed-route transit systems (including bus, rail, and vanpool modes) provided transportation for more than 245 million trips.* FDOT Mission Supporting and improving public transportation in Florida is an integral part of FDOT’s mission, which is “to provide a safe transportation system that ensures the mobility of people and goods, enhances economic prosperity and preserves the quality of our environment and communities.” For more information on FDOT and public transit in Florida, please visit the FDOT web- site: www.dot.state.fl.us, or call (850) 414-4500. *SunTran in Ocala is an urban fixed-route system that receives a reporting waiver for NTD. Citrus County Transit, JTrans, Key West Transit, Putnam Transit, Sumter County Transit and Big Bend Transit also operate fixed-routes, but are classified as rural systems and do not report to NTD.
Transcript of Public TransiT in Florida - Florida Department of … Fl o rdi a de pa r T m e n T o F T r a n s p o...

1Florida TransiT Handbook 2011
Public TransiTin Florida
This Handbook offers a general overview of public transit in the State of Florida. The information in the following pages provides insight into transit’s contribution to
meeting the statewide transportation objectives and mission of the Florida Department of Transportation (FDOT).
Public transit plays an important role in maintaining the livability of Florida’s growing com-munities. Transit not only helps alleviate traffic congestion and improve air quality, but also provides mobility for many of Florida’s citizens, as well as visitors and tourists to the Sunshine State. Transit also plays a critical role in meeting the mobility and accessibility needs of transit-dependent Floridians and visitors who, due to physical handicap, age, or economic disadvantage, cannot drive or own an automobile. By providing mobility and accessibility to millions of Florida’s residents and visitors, transit helps to improve the overall quality of life in Florida’s communities.
This Handbook provides a synopsis of FDOT’s transit resources, a profile of Florida’s transit systems, and a snapshot of their performance in 2010. Although there are rural and urban transit systems in Florida, the focus of this handbook is on Florida’s urban fixed-route transit systems. Information about Florida’s demand response transit systems and rural fixed-route systems can be obtained from the Annual Operations Report published by Florida’s Com-mission for the Transportation Disadvantaged. In 2010, 28 of Florida’s 35 fixed-route transit systems (including bus, rail, and vanpool modes) provided transportation for more than 245 million trips.*
FDOT Mission
Supporting and improving public transportation in Florida is an integral part of FDOT’s mission, which is “to provide a safe transportation system that ensures the mobility of people and goods, enhances economic prosperity and preserves the quality of our environment and communities.”
For more information on FDOT and public transit in Florida, please visit the FDOT web-site: www.dot.state.fl.us, or call (850) 414-4500.
*SunTraninOcalaisanurbanfixed-routesystemthatreceivesareportingwaiverforNTD.CitrusCountyTransit,JTrans,KeyWestTransit,PutnamTransit,SumterCountyTransitandBigBendTransitalsooperatefixed-routes,butareclassifiedasruralsystemsanddonotreporttoNTD.


3Florida TransiT Handbook 2011
Florida TransiT HandbooK
contents
FDOT Public Transit Office .............................................................................. 5
FDOT District Public Transportation Offices ............................................. 7
Florida’s Transit Systems ..................................................................................... 9
TransitSystemProfiles .................................................................................10
Transit System Summary ......................................................................................39
Transit Fares ..................................................................................................45
Glossary of Terms .............................................................................................46


5Florida TransiT Handbook 2011
FdoT Public Transit office
Transit Mission—The mission of the FDOT Transit Office is to “identify, support, advance, and manage cost-effective, efficient, and safe transportation systems and alterna-tives to maximize the passenger-carrying capacity of surface transportation facilities.”
The FDOT Transit Office consists of three sections (Transit Planning; Grants Administra-tion; Transit Operations and Safety), each of which has specific areas of responsibility.
Transit PlanningThe transit planning unit is responsible for statewide transit planning, legislative, and policy analysis, developing and monitoring the implementation of state transit development plan-ning (TDP) rules and guidelines, performance monitoring, TDP reviews, transit information systems, transit facilities planning, transit oriented development, technical assistance, and training. Some of the programs and activities implemented and managed by the planning unit in fulfillment of these responsibilities are:
Development of Florida’s transit strategic plan; preparation of transportation development plan (TDP) policy guidance and training; development and support of the Florida Transit Information System (FTIS), Transit Boardings Estimation and Simulation Tool (TBEST), Florida Transit Planning Network (FTPN), and FDOT’s transit grant management program, TransCIP; integration of transit in intelligent transportation systems (ITS) and travel de-mand modeling; sponsorship of transit planning and operations research; promotion of transit’s role in enhancing the environment, including air quality, energy and greenhouse gas reduction; and development of transit performance measures and transit capacity and quality of service measures.
Grants Administration and Commuter AssistanceThe Grants Administration and Commuter Assistance unit provides financial and technical assistance to Florida’s transit agencies and commuter assistance services. Staff also coor-dinates with and provides technical assistance to the Commission for the Transportation Disadvantaged. This unit’s responsibilities fall into eight areas: Federal Transit Adminis-tration coordination; grant management; financial management; rural transit technical assistance; urban transit technical assistance; innovative finance; commuter assistance; and legislative analysis.

6 Florida deparTmenT oF TransporTaTion
Transit Operations and SafetyThe Transit Operations and Safety unit is responsible for developing and implementing transit programs that provide services and technical assistance to support transit op-erational and maintenance functions and activities. This unit also develops standards and oversees compliance with State and Federal regulations.
Some of the programs administered by the Transit Operations and Safety unit include the Florida Operations Network, the Transit-Research-Inspection-Procurement Services, and the Transit Maintenance Analysis & Resource Center.
Additional information about FDOT transit programs can be found at the following web addresses:
FDOTWebpage www.dot.state.fl.us/transit
FloridaTransitPlanningNetwork http://planfortransit.com
Transit 2020: Florida’s Strategic Plan for Transit www.dot.state.fl.us/transit/pages/transit2020plan.shtm
Florida Transit Forum http://cutrlist.eng.usf.edu/read/?forum=ft-forum
Transit-Research-Inspection-ProcurementServices(TRIPS)—The TRIPS program provides Florida’s public transportation providers with the opportunity to purchase vehicles as a consortium. For more information, please visit: www.tripsflorida.org
TransitMaintenanceAnalysisandResourceCenter(TMAARC) www.tmaarc.org
StateBusFleetProgram—The purpose of this program is to establish the requirements for the lease and management of State Public Transportation Fleet Equipment. For more information, please visit: www.dot.state.fl.us/transit/pages/statebusfleetprogram.shtm
SubstanceAbuseReview www.dot.state.fl.us/transit/pages/SubstanceAbuseReview.doc
TransitBusSafetyResourceGuide www3.cutr.usf.edu/bussafety
Transit Safety Programs www.dot.state.fl.us/transit/pages/transitsafetyprograms.shtm
CommuterAssistanceProgram www.commuterservices.com

7Florida TransiT Handbook 2011
The
Flo
rida
Dep
artm
ent
of T
rans
port
atio
n is
dec
entr
aliz
ed i
n ac
cord
ance
with
leg
isla
tive
man
date
s. E
ach
of t
he s
even
dis
tric
ts i
s m
anag
ed b
y a
Dis
tric
t Se
cret
ary.
The
dis
tric
ts v
ary
in o
rgan
izat
iona
l str
uctu
re; h
owev
er, e
ach
dist
rict
, exc
ept
for
the
Turn
pike
, Dis
tric
t 8,
has
an
Offi
ce o
f Pub
lic T
rans
port
atio
n O
pera
tions
(PT
O),
man
aged
by
a D
istr
ict
Publ
ic T
rans
port
atio
n M
anag
er.
PTO
org
aniz
atio
nal s
truc
ture
s al
so v
ary
from
dis
tric
t to
dis
tric
t, b
ut e
ach
dist
rict
PTO
is r
espo
nsib
le fo
r tr
ansi
t, a
viat
ion,
rai
l and
sea
port
func
tions
with
in
thei
r di
stri
cts.
Dis
tric
t PTO
Offi
ces c
oord
inat
e w
ith th
e FD
OT
Cen
tral
Offi
ce in
pol
icy,
pla
nnin
g an
d te
chni
cal i
ssue
s, b
ut th
ey a
re m
ore
invo
lved
in th
e da
y-to
-day
adm
inis
tra-
tion
of F
DO
T’s
tran
sit p
rogr
ams
at t
he lo
cal l
evel
. The
y w
ork
mor
e di
rect
ly w
ith lo
cal g
over
nmen
ts, t
rans
it ag
enci
es a
nd M
etro
polit
an P
lann
ing
Org
aniz
atio
ns
(MPO
s) t
o ad
dres
s tr
ansi
t is
sues
and
pro
gram
s sp
ecifi
c to
the
ir d
istr
icts
. Dis
tric
t PT
O s
taff
ofte
n re
pres
ent
the
FDO
T a
t lo
cal t
rans
it m
eetin
gs a
nd s
erve
on
loca
l pro
ject
com
mit
tees
. For
info
rmat
ion
on F
DO
T t
rans
it ac
tiviti
es in
you
r di
stri
ct p
leas
e co
ntac
t yo
ur d
istr
ict
PTO
at
the
follo
win
g ad
dres
ses
and
phon
e nu
mbe
rs:
D
istr
ict
Dis
tric
t Add
ress
and
Pho
ne N
umbe
r Tr
ansi
t Age
ncie
s
1
801
N. B
road
way
, Bar
tow
, FL
3383
0 C
ollie
r Are
a Tra
nsit;
Lak
elan
d A
rea
Mas
s Tr
ansit
Dist
rict (
Citr
us
Phon
e: (8
63) 5
19-2
300
Con
nect
ion)
; Lee
Cou
ntyT
rans
it (L
eeTr
an);
Man
atee
Cou
nty
Are
a Tr
ansit
1-
800-
292-
3368
(M
CA
T); S
aras
ota C
ount
y Are
a Tra
nsit
(SC
AT)
; Pol
k C
ount
y Tra
nsit
Serv
ices
;
Win
ter H
aven
Are
a Tr
ansit
(WH
AT)
2 21
98 E
diso
n A
ve.,
Jack
sonv
ille,
FL
3220
4-27
30
Jack
sonv
ille
Tran
spor
tatio
n A
utho
rity
(JT
A);
Reg
iona
l Tra
nsit
Syst
em
Phon
e: (9
04)
360-
5457
, 1-8
00-2
07-8
236
(RT
S, G
aine
svill
e); S
t. Jo
hns
Cou
nty
(Sun
shin
e Bu
s)
3
1074
Hig
hway
90
East
, Chi
pley
, FL
3242
8-06
07
Esca
mbi
a C
ount
y A
rea T
rans
it (E
CAT
); O
kalo
osa
Cou
nty
(The
Wav
e),
Phon
e: (8
50)
638-
0250
, 1-8
88-6
38-0
250
Pana
ma
City
MPO
-Bay
Tow
n Tr
olle
y; C
ity o
f Tal
laha
ssee
(Sta
rMet
ro)
4
3400
W. C
omm
erci
al B
lvd.
Br
owar
d C
ount
y Tra
nsit
(BC
T);
Palm
Bea
ch C
ount
y (P
alm
Tra
n);
Ft. L
aude
rdal
e, F
L 33
309-
3421
St
. Luc
ie C
ounc
il on
Agi
ng; I
ndia
n Ri
ver
Cou
nty;
Mar
tin C
ount
y C
ounc
il
Ph
one:
(954
) 77
7-41
10, 1
-866
-336
-843
5 on
Agi
ng; S
outh
Flo
rida
Reg
iona
l Tra
nspo
rtat
ion
Aut
hori
ty (
Tri-R
ail)
5
719
Sout
h W
oodl
and
Blvd
., D
eLan
d, F
L 32
720
Cen
tral
Flo
rida
RTA
(Lyn
x); S
pace
Coa
st A
rea T
rans
it; V
olus
ia C
ount
y
Phon
e: (3
86)
943-
5475
, 1-8
00-7
80-7
102
dba V
OTR
AN
; Oca
la/M
ario
n M
PO (S
unTr
an);
Lake
Cou
nty
(Lak
eXpr
ess)
6
1000
NW
111
th A
ve.,
Mia
mi,
FL 3
3172
M
iam
i-Dad
e Tr
ansi
t (M
DT
); So
uth
Flor
ida
Reg
iona
l Tra
nspo
rtat
ion
Ph
one:
(305
) 47
0-53
49, 1
-800
-435
-236
8 A
utho
rity
(Tr
i-Rai
l); K
ey W
est T
rans
it.
7
1120
1 N
. McK
inle
y D
rive
, Tam
pa, F
L 33
612-
6403
H
illsb
orou
gh A
rea
Reg
iona
l Tra
nsit
Aut
hori
ty (
HA
RT);
Pine
llas
Ph
one:
(813
) 97
5-60
60, 1
-800
-226
-722
0 Su
ncoa
st T
rans
it A
utho
rity
(PST
A);
Pasc
o C
ount
y Pu
blic
Tra
nspo
rtat
ion;
Tran
sHer
nand
o (T
HE
Bus)
FDO
T D
istr
ict
Pub
lic T
rans
port
atio
n O
ffice
s

8 Florida deparTmenT oF TransporTaTion
L Y N X
Key
Wes
t
grea
ter
than
200
veh
icle
s
50-2
00 v
ehic
les
10-4
9 ve
hicl
es
1-9
vehi
cles
Oca
la
Her
nand
o
Col
lierSt
. Joh
nsot
her
syst
ems*
Lake
Cit
rus
Sum
ter
Bay
Bay T
own
Trol
ley
Brev
ard
Spac
e C
oast
Are
a Tra
nsit
Brow
ard
Brow
ard
Cou
nty T
rans
itC
itrus
C
itrus
Cou
nty T
rans
itC
ollie
r C
ollie
r Are
a Tra
nsit
Esca
mbi
a Es
cam
bia
Cou
nty
Are
a Tra
nsit
Gai
nesv
ille
Gai
nesv
ille
Reg
iona
l Tra
nsit
Syst
emH
erna
ndo
Tran
sHer
nand
o Ex
pres
sH
illsb
orou
gh
Hill
sbor
ough
Are
a R
egio
nal T
rans
itIn
dian
Riv
er
Seni
or R
esou
rce
Ass
ocia
tion/
GoL
ine
Jack
son
JTra
nsJa
ckso
nvill
e Ja
ckso
nvill
e Tr
ansp
orta
tion
Aut
hori
tyKe
y Wes
t Ke
y Wes
t Tra
nsit
Lake
La
ke C
ty P
ublic
Tra
nspo
rtat
ion/
Lake
Xpr
ess
Lake
land
La
kela
nd A
rea
Mas
s Tra
nsit
Dis
tric
tLe
e Le
e C
ount
y Tra
nsit
Man
atee
M
anat
ee C
ount
y A
rea T
rans
itM
artin
C
ounc
il on
Agi
ng o
f Mar
tin C
ount
y, In
cM
iam
i M
iam
i-Dad
e Tr
ansi
tO
cala
/Mar
ion
SunT
ran
Oka
loos
a O
kalo
osa
Cou
nty T
rans
itO
rlan
do
LYN
X T
rans
itPa
lm B
each
Pa
lm B
each
Cou
nty T
rans
port
atio
n A
genc
yPa
sco
Pasc
o C
ount
y Pu
blic
Tra
nspo
rtat
ion
Pine
llas
Pine
llas
Sunc
oast
Tra
nsit
Aut
hori
tyPo
lk
Polk
Cou
nty T
rans
it Sv
cs. D
iv. &
WH
ATPu
tnam
Pu
tnam
Tra
nsit
St. J
ohns
Su
nshi
ne B
us C
ompa
nySt
. Luc
ie
St. L
ucie
Cou
ncil
On
Agi
ng, I
nc.
Sara
sota
Sa
raso
ta C
ount
y A
rea T
rans
itSu
mte
r Su
mte
r C
ount
y Tra
nsit
Talla
hass
ee
Star
Met
roTa
ylor
Bi
g Be
nd T
rans
itTr
i-Rai
l S.
FL R
egio
nal T
rans
port
atio
n A
utho
rity
Volu
sia
Volu
sia
Cou
nty
dba V
OT
RA
N
Win
ter
Hav
en
Polk
Cou
nty T
rans
it Se
rvic
es D
ivis
ion
* SunTraninOcalareceivedareportingwaiverfromNTD
in2010.CitrusCountyTransit,JTrans,KeyWestTransit,PutnamTransit,Sum
terCountyTransitandBig
BendTransitareclassifiedasruralsystemsanddonotreporttoNTD
.
Flor
ida
Fixe
d-R
oute
Sys
tem
s

9Florida TransiT Handbook 2011
FDOT Public Transit Central Office n (850) 414-4500 605 Suwannee Street, Mail Station 26, Tallahassee, FL 32399-0450
Florida’s Transit systems
In 2010, there were 35 fixed-route transit systems operating in Florida and 28 of those reported to the National Transit Database (NTD). Four of these systems operated some form of fixed guideway mode. The South Florida Regional Transportation Authority
provides regional rail service (Tri-Rail) between Palm Beach, Broward, and Miami-Dade Counties. Miami-Dade Transit operates a heavy rail system (Metrorail) and an automated guideway system (Metromover). Jacksonville Transportation Authority operates an auto-mated guideway system (Skyway Express). Hillsborough Area Regional Transit Authority operates a light rail (TECO Line Streetcar) system.
There are seven additional fixed-route transit systems in Florida that did not report NTD data in 2010. SunTran provides service on six routes in Ocala, but has received a report-ing waiver from NTD. Citrus County Transit, JTrans, Key West Transit, Putnam Transit, Sumter County Transit and Big Bend Transit operate fixed routes, but are not classified by the Federal Transit Administration as urban systems and therefore are not required to report to the NTD.
To meet their service objectives, transit agencies across the United States and Florida sometimes find it necessary to contract the operation of portions of their services to private operators. In 2010, 11 of Florida’s transit systems, Bay Town Trolley, Broward County Transit, Collier Area Transit, Hernando (TransHernando Express), Jacksonville Transportation Authority, Pinellas Suncoast Transit Authority, the South Florida Regional Transportation Authority, Palm Beach County Transportation Agency, Okaloosa County, Lake County, and St. Johns County (Sunshine Bus) contracted for all or part of their regular fixed-route motorbus service.
During 2010, Florida’s transit agencies ranged in size from the three-vehicle system in Hernando County to the 1,131-vehicle system operating in Miami-Dade County. The systems included in this edition of the Handbook represent only those that reported to the National Transit Database in 2010. The map on the previous page shows the location and size of the transit agencies included in this edition of the Handbook, and the following pages contain brief profiles of each of the agencies.
Each profile provides contact information and summarizes NTD information. System total data (for bus, rail, and vanpool modes) are shown except where noted. The first profile represents Florida’s fixed-route total information.
Following the profiles is a page summarizing all of the system’s fare structures as of August 2011. After the fare information, data summarizing trends from 2009 to 2010 for each system are presented. More information on public transit in Florida can be found at the following website: www.dot.state.fl.us/transit.
* SunTraninOcalareceivedareportingwaiverfromNTD
in2010.CitrusCountyTransit,JTrans,KeyWestTransit,PutnamTransit,Sum
terCountyTransitandBig
BendTransitareclassifiedasruralsystemsanddonotreporttoNTD
.

10 Florida deparTmenT oF TransporTaTion
Florida’s Transit Systems—2009 and 2010 Statewide Totals
FDOT Public Transit Office605 Suwannee Street, Mail Station 26, Tallahassee, FL 32399-0450(850) 414-4500www.dot.state.fl.us/Transit
In 2011, 28 fixed-route transit systems in Florida reported ridership and other data. In addi-tion, four systems operate at least one rail mode. The data shown below and on the following pages represent fixed-route bus, rail services, and vanpool services only (excludes demand-response service) for 2009 and 2010 from the National Transit Database. The data shown below represent closed-out, validated numbers as of August 2011. However, it is possible that some figures may be updated in the subsequent reporting year. Please see pages 6 and 7 of this Handbook for more information on Florida’s transit systems.
General Information 2009 2010Service Area Population 14,308,931 14,445,334Service Area Population Density 1,209.85 1,217.99Operating Expense $1,015,050,830 $985,647,670Operating Revenue $233,922,989 $254,316,041 Service Supplied Total Annual Revenue Miles 136,368,969 135,812,378Total Annual Revenue Hours 9,424,031 9,314,916Total Revenue Vehicles 3,612 3,776Peak Vehicles 2,915 2,987Route Miles 13,503.3 14,505.1 Service Usage Annual Passenger Trips 248,771,366 245,192,620Annual Passenger Miles 1,369,739,281 1,357,046,407Average Trip Length 5.5 5.5 Quality of Service Average Headway (minutes) 19.21 19.98Weekday Span of Service (hours) 16.8 16.6 Cost Efficiency Operating Expense per Revenue Mile $7.44 $7.26Operating Expense per Revenue Hour $107.71 $105.81Operating Revenue per Operating Expense 23.05% 25.80%Passenger Trips per Employee FTE 27,400 27,287 Cost Effectiveness Operating Expense per Passenger Trip $4.08 $4.02Operating Expense per Passenger Mile $0.74 $0.73Operating Expense per Capita $70.94 $68.23Farebox Recovery Ratio 21.02% 22.46%Average Fare $0.86 $0.90 Service Effectiveness Passenger Trips per Revenue Mile 1.82 1.81Passenger Trips per Revenue Hour 26.40 26.32Passenger Trips per Capita 17.39 16.97Revenue Miles Between Safety Incidents 160,246 170,191Revenue Miles Between Failures 4,627 5,302

11Florida TransiT Handbook 2011
Bay Town Trolley/Bay Area Transportation
Mr. Greg Meeks, General Manager1116 Frankford Avenue, Panama City, FL 32401(850) 769-0557www.baytowntrolley.org
Bay Town Trolley provides deviated fixed route service in the Panama City Urbanized area and Bay Area Transportation provides demand response service throughout Bay County. The Bay County Transportation Planning Organization (TPO) governs both services, contracting with Santa Ynez Valley Transportation Services, LLC for the operation of Bay Town Trolley and Tri County Community Council for the operation of Bay Area Transportation. Data representing the Bay Town Trolley’s motorbus service for 2009 and 2010 are shown below.
General Information 2009 2010Service Area Population 85,458 85,458Service Area Population Density 1,780.4 1,780.4Operating Expense $1,841,988 $2,198,463Operating Revenue $356,842 $461,349 Service Supplied Total Annual Revenue Miles 597,275 625,828Total Annual Revenue Hours 36,967 39,123Total Revenue Vehicles 19 22Peak Vehicles 13 13Route Miles 150.0 150.0 Service Usage Annual Passenger Trips 670,573 724,613Annual Passenger Miles 3,315,512 3,579,588Average Trip Length 4.9 4.9 Quality of Service Average Headway (minutes) 42.85 43.28Weekday Span of Service (hours) 14.5 14.5 Cost Efficiency Operating Expense per Revenue Mile $3.08 $3.51Operating Expense per Revenue Hour $49.83 $56.19Operating Revenue per Operating Expense 19.37% 20.99%Passenger Trips per Employee FTE n/a n/a Cost Effectiveness Operating Expense per Passenger Trip $2.75 $3.03Operating Expense per Passenger Mile $0.56 $0.61Operating Expense per Capita $21.55 $25.73Farebox Recovery Ratio 17.76% 20.53%Average Fare $0.49 $0.62 Service Effectiveness Passenger Trips per Revenue Mile 1.12 1.16Passenger Trips per Revenue Hour 18.14 18.52Passenger Trips per Capita 7.85 8.48Revenue Miles Between Safety Incidents n/a n/aRevenue Miles Between Failures 6,711 6,954

12 Florida deparTmenT oF TransporTaTion
Broward County Transit (BCT)
Mr. Timothy Garling, DirectorOne University Drive, Plantation, FL 33324(954) 357-8361www.broward.org/bct
Broward County Transit is an agency of Broward County government responsible for op-erating a fixed-route motorbus service with several routes connecting with Palm Tran (in Palm Beach County), Miami-Dade Transit, and Tri-Rail (commuter rail service). In addition to fixed route bus service, BCT also partners with many municipalities within the county to provide Community Bus service and offers contracted paratransit service. BCT and Broward Community Bus data for the years 2009 and 2010 are provided below.
General Information 2009 2010Service Area Population 1,751,234 1,766,476Service Area Population Density 4,271.3 4,308.5Operating Expense $100,807,838 $105,025,195Operating Revenue $24,949,603 $30,612,800 Service Supplied Total Annual Revenue Miles 16,333,518 16,372,108Total Annual Revenue Hours 1,189,097 1,188,302Total Revenue Vehicles 362 379Peak Vehicles 303 307Route Miles 1,603.7 1,629.9 Service Usage Annual Passenger Trips 38,960,217 38,670,324Annual Passenger Miles 174,056,441 179,624,107Average Trip Length 4.5 4.6 Quality of Service Average Headway (minutes) 23.12 23.12Weekday Span of Service (hours) 20.0 20.0 Cost Efficiency Operating Expense per Revenue Mile $6.17 $6.41Operating Expense per Revenue Hour $84.78 $88.38Operating Revenue per Operating Expense 24.75% 29.15%Passenger Trips per Employee FTE 41,187 37,308 Cost Effectiveness Operating Expense per Passenger Trip $2.59 $2.72Operating Expense per Passenger Mile $0.58 $0.58Operating Expense per Capita $57.56 $59.45Farebox Recovery Ratio 23.34% 25.38%Average Fare $0.60 $0.69 Service Effectiveness Passenger Trips per Revenue Mile 2.39 2.36Passenger Trips per Revenue Hour 32.76 32.54Passenger Trips per Capita 22.25 21.89Revenue Miles Between Safety Incidents 122,328 130,977Revenue Miles Between Failures 25,763 25,621

13Florida TransiT Handbook 2011
Collier Area Transit (CAT)
Mr. Thomas Stringer, General Manager8300 Radio Road, Naples, FL 34104(239) 252-7777www.colliergov.net
Collier Area Transit began operating service in February 2001. The General Manager of CAT reports to the Director of the Alternative Transportation Modes Department of Collier County Transportation, which is governed by the Collier County Board of County Commis-sioners. CAT provides fixed-route service in Collier County. Demand-response services are provided by Collier Area Paratransit. The data below represent CAT’s 2009 and 2010 fixed route purchased motorbus services.
General Information 2009 2010Service Area Population 333,032 333,032Service Area Population Density 220.1 220.1Operating Expense $5,048,082 $5,490,980Operating Revenue $988,710 $1,020,300 Service Supplied Total Annual Revenue Miles 1,244,756 1,230,055Total Annual Revenue Hours 67,043 66,475Total Revenue Vehicles 23 23Peak Vehicles 16 16Route Miles 363.5 376.0 Service Usage Annual Passenger Trips 1,109,710 1,064,910Annual Passenger Miles 8,968,616 8,604,473Average Trip Length 8.1 8.1 Quality of Service Average Headway (minutes) 73.42 76.20Weekday Span of Service (hours) 16.5 16.5 Cost Efficiency Operating Expense per Revenue Mile $4.06 $4.46Operating Expense per Revenue Hour $75.30 $82.60Operating Revenue per Operating Expense 19.59% 18.58%Passenger Trips per Employee FTE n/a n/a Cost Effectiveness Operating Expense per Passenger Trip $4.55 $5.16Operating Expense per Passenger Mile $0.56 $0.64Operating Expense per Capita $15.16 $16.49Farebox Recovery Ratio 19.11% 18.58%Average Fare $0.87 $0.96 Service Effectiveness Passenger Trips per Revenue Mile 0.89 0.87Passenger Trips per Revenue Hour 16.55 16.02Passenger Trips per Capita 3.33 3.20Revenue Miles Between Safety Incidents 51,865 55,912Revenue Miles Between Failures 8,766 9,762

14 Florida deparTmenT oF TransporTaTion
Escambia County Area Transit (ECAT)
Mr. Ken Gordon, General Manager1515 West Fairfield Drive, Pensacola, FL 32501(850) 595-3228www.goecat.com
Escambia County Area Transit is a department of the county government. A five-member elected Board of County Commissioners governs the department. In addition to providing fixed-route motorbus service, ECAT contracts to provide demand-response transportation services. 2009 and 2010 motorbus data for ECAT are shown below.
General Information 2009 2010Service Area Population 307,220 307,220Service Area Population Density 1,920.1 1,920.1Operating Expense $6,805,860 $6,755,135Operating Revenue $1,176,008 $1,358,322 Service Supplied Total Annual Revenue Miles 1,362,523 1,388,505Total Annual Revenue Hours 104,396 97,371Total Revenue Vehicles 39 46Peak Vehicles 32 32Route Miles 311.0 312.0 Service Usage Annual Passenger Trips 1,131,853 1,152,375Annual Passenger Miles 5,489,487 5,588,563Average Trip Length 4.8 4.8 Quality of Service Average Headway (minutes) 44.68 41.02Weekday Span of Service (hours) 15.0 13.5 Cost Efficiency Operating Expense per Revenue Mile $5.00 $4.87Operating Expense per Revenue Hour $65.19 $69.38Operating Revenue per Operating Expense 17.28% 20.11%Passenger Trips per Employee FTE 12,904 13,324 Cost Effectiveness Operating Expense per Passenger Trip $6.01 $5.86Operating Expense per Passenger Mile $1.24 $1.21Operating Expense per Capita $22.15 $21.99Farebox Recovery Ratio 16.09% 18.01%Average Fare $0.97 $1.06 Service Effectiveness Passenger Trips per Revenue Mile 0.83 0.83Passenger Trips per Revenue Hour 10.84 11.83Passenger Trips per Capita 3.68 3.75Revenue Miles Between Safety Incidents n/a 462,835Revenue Miles Between Failures 9,595 9,382

15Florida TransiT Handbook 2011
Gainesville Regional Transit System
Mr. Jesus Gomez, Director 100 S.E. 10th Avenue, Gainesville, FL 32601(352) 334-2600www.go-rts.com
The Regional Transit System (RTS) is a department of the City of Gainesville. An elected seven-member Commission governs the RTS. The Commission receives input from an advi-sory board comprised of citizens from the community. The RTS serves the City of Gainesville and parts of Alachua County with fixed-route motorbus service and contracts to provide demand-response transportation services throughout the City of Gainesville and up to three-quarters of a mile beyond its fixed-route network. The data shown below represent fixed-route motorbus data for RTS in 2009 and 2010.
General Information 2009 2010Service Area Population 151,294 151,294Service Area Population Density 1990.7 1990.7Operating Expense $16,578,691 $16,673,905Operating Revenue $10,157,183 $10,722,646 Service Supplied Total Annual Revenue Miles 2,821,703 2,808,703Total Annual Revenue Hours 248,819 255,786Total Revenue Vehicles 105 105Peak Vehicles 88 88Route Miles 205.6 208.3 Service Usage Annual Passenger Trips 8,939,980 9,373,060Annual Passenger Miles 25,031,944 26,244,568Average Trip Length 2.8 2.8 Quality of Service Average Headway (minutes) 12.36 12.93Weekday Span of Service (hours) 20.2 21.2 Cost Efficiency Operating Expense per Revenue Mile $5.88 $5.94Operating Expense per Revenue Hour $66.63 $65.19Operating Revenue per Operating Expense 61.27% 64.31%Passenger Trips per Employee FTE 41,171 40,574 Cost Effectiveness Operating Expense per Passenger Trip $1.85 $1.78Operating Expense per Passenger Mile $0.66 $0.64Operating Expense per Capita $109.58 $110.21Farebox Recovery Ratio 58.65% 61.52%Average Fare $1.09 $1.09 Service Effectiveness Passenger Trips per Revenue Mile 3.17 3.34Passenger Trips per Revenue Hour 35.93 36.64Passenger Trips per Capita 59.09 61.95Revenue Miles Between Safety Incidents 705,426 936,234Revenue Miles Between Failures 4,180 5,475

16 Florida deparTmenT oF TransporTaTion
General Information 2009 2010Service Area Population 164,907 165,843Service Area Population Density 345.0 347.0Operating Expense $1,463,297 $747,022Operating Revenue $94,507 $104,279 Service Supplied Total Annual Revenue Miles 304,991 147,415Total Annual Revenue Hours 17,491 8,360Total Revenue Vehicles 10 5Peak Vehicles 6 3Route Miles 60.2 60.2 Service Usage Annual Passenger Trips 129,197 69,945Annual Passenger Miles 605,030 440,070Average Trip Length 4.7 6.3 Quality of Service Average Headway (minutes) 34.52 68.28Weekday Span of Service (hours) 14.0 12.5 Cost Efficiency Operating Expense per Revenue Mile $4.80 $5.07Operating Expense per Revenue Hour $83.66 $89.36Operating Revenue per Operating Expense 6.46% 13.96%Passenger Trips per Employee FTE n/a n/a Cost Effectiveness Operating Expense per Passenger Trip $11.33 $10.68Operating Expense per Passenger Mile $2.42 $1.70Operating Expense per Capita $8.87 $4.50Farebox Recovery Ratio 5.58% 6.95%Average Fare $0.63 $0.74 Service Effectiveness Passenger Trips per Revenue Mile 0.42 0.47Passenger Trips per Revenue Hour 7.39 8.37Passenger Trips per Capita 0.78 0.42Revenue Miles Between Safety Incidents n/a n/aRevenue Miles Between Failures 3,961 2,680
Hernando Express Bus (TransHernando Express)
Mr. Richard Cook, Director1122 Ponce De Leon Blvd., Brooksville, FL 34601(352) 799-1510www.hernandobus.com
The County contracts with Trans-Hernando, a division of Mid Florida Community Services, Inc., to operate THE Bus, Hernando County’s fixed-route transportation service. Trans-Hernando reports to the Metropolitan Planning Organization and a five-member Board of County Commissioners. The transit system provides fixed-route transit service to the cit-ies of Brooksville and Spring Hill, with a shuttle connecting the two areas. Trans-Hernando Para-Transit also provides demand-response service throughout Hernando County. 2009 and 2010 data representing THE Bus’s fixed-route motorbus service are shown below.

17Florida TransiT Handbook 2011
Hillsborough Area Regional Transit Authority (HART)
Mr. Phillip Hale, Interim Executive Director4305 E. 21st Avenue, Tampa, FL 33605(813) 623-5835www.gohart.org
The Hillsborough Area Regional Transit Authority (HART) operates motor bus service, as well as a streetcar connecting downtown with the Ybor City Historic District. Paratransit service is provided for the City of Tampa, the City of Temple Terrace, and unincorporated Hillsborough County. Contracted vanpool services are also provided. The authority is governed by a Board of Directors comprised of twelve representatives appointed by the governing bodies of its members and the Governor of the State of Florida. 2009 and 2010 data for HART’s fixed-route and vanpool services are shown below.
General Information 2009 2010Service Area Population 821,306 821,306Service Area Population Density 3,379.9 3,379.9Operating Expense $61,598,943 $61,473,492Operating Revenue $13,184,576 $13,790,252 Service Supplied Total Annual Revenue Miles 8,140,805 8,280,099Total Annual Revenue Hours 612,449 631,880Total Revenue Vehicles 238 245Peak Vehicles 197 195Route Miles 978.2 1,021.3 Service Usage Annual Passenger Trips 13,714,254 13,233,764Annual Passenger Miles 67,687,285 63,367,321Average Trip Length 4.9 4.8 Quality of Service Average Headway (minutes) 22.41 23.98Weekday Span of Service (hours) 21.5 21.3 Cost Efficiency Operating Expense per Revenue Mile $7.57 $7.42Operating Expense per Revenue Hour $100.58 $97.29Operating Revenue per Operating Expense 21.40% 22.43%Passenger Trips per Employee FTE 21,799 21,671 Cost Effectiveness Operating Expense per Passenger Trip $4.49 $4.65Operating Expense per Passenger Mile $0.91 $0.97Operating Expense per Capita $75.00 $74.85Farebox Recovery Ratio 19.83% 20.12%Average Fare $0.89 $0.93 Service Effectiveness Passenger Trips per Revenue Mile 1.68 1.60Passenger Trips per Revenue Hour 22.39 20.94Passenger Trips per Capita 16.70 16.11Revenue Miles Between Safety Incidents 142,821 107,534Revenue Miles Between Failures 5,745 4,356

18 Florida deparTmenT oF TransporTaTion
Jacksonville Transportation Authority (JTA)
Mr. Michael Blaylock, Executive Director100 N. Myrtle Avenue, Jacksonville, FL 32204(904) 630-3181www.jtafla.com
Jacksonville Transportation Authority is an independent authority that is governed by a seven-member, appointed Board of Directors. The Jacksonville system provides its services within Duval County and northern Clay County (Orange Park). JTA transportation services include fixed-route motorbus, automated guideway (Skyway Express), and demand-response. The data below represent JTA’s 2009 and 2010 fixed-route services (motorbus and automated guideway).
General Information 2009 2010Service Area Population 827,453 853,300Service Area Population Density 3,419.2 3,080.5Operating Expense $59,699,687 $60,925,241Operating Revenue $10,285,482 $9,801,838 Service Supplied Total Annual Revenue Miles 9,098,872 9,384,591Total Annual Revenue Hours 605,315 626,177Total Revenue Vehicles 192 193Peak Vehicles 169 162Route Miles 645.4 1,037.0 Service Usage Annual Passenger Trips 10,703,555 11,227,845Annual Passenger Miles 54,873,285 62,393,143Average Trip Length 5.1 5.6 Quality of Service Average Headway (minutes) 15.24 25.63Weekday Span of Service (hours) 21.7 21.8 Cost Efficiency Operating Expense per Revenue Mile $6.56 $6.49Operating Expense per Revenue Hour $98.63 $97.30Operating Revenue per Operating Expense 17.23% 16.09%Passenger Trips per Employee FTE 17,214 17,388 Cost Effectiveness Operating Expense per Passenger Trip $5.58 $5.43Operating Expense per Passenger Mile $1.09 $0.98Operating Expense per Capita $72.15 $71.40Farebox Recovery Ratio 14.37% 14.42%Average Fare $0.80 $0.78 Service Effectiveness Passenger Trips per Revenue Mile 1.18 1.20Passenger Trips per Revenue Hour 17.68 17.93Passenger Trips per Capita 12.94 13.16Revenue Miles Between Safety Incidents 197,802 260,683Revenue Miles Between Failures 8,010 8,730

19Florida TransiT Handbook 2011
Lake County Public Transportation/LakeXpress
Mr. Kenneth Harley, DirectorLake County Public Transportation Division1300 S. Duncan Drive, Building E, Tavares, FL 32778(352) 742-6580www.ridelakexpress.com
LakeXpress is a newer Florida transit agency under the Lake County Board of County Com-missioners. The County contracts with MV Transportation to operate the service. Services provided include fixed-route LakeXpress and the Lake County Connection for demand response service. LakeXpress was started in May 2007 and the County has served as the Community Transportation Coordinator since 2001. Data for 2009 and 2010 are shown below.
General Information 2009 2010Service Area Population 97,497 97,497Service Area Population Density 1,373.2 1,373.2Operating Expense $1,784,224 $1,620,604Operating Revenue $214,202 $244,121 Service Supplied Total Annual Revenue Miles 331,978 384,653Total Annual Revenue Hours 20,828 23,249Total Revenue Vehicles 10 12Peak Vehicles 7 7Route Miles 147.3 148.0 Service Usage Annual Passenger Trips 156,972 232,794Annual Passenger Miles 1,059,688 1,198,889Average Trip Length 6.8 5.1 Quality of Service Average Headway (minutes) 79.21 76.67Weekday Span of Service (hours) 13.8 13.8 Cost Efficiency Operating Expense per Revenue Mile $5.37 $4.21Operating Expense per Revenue Hour $85.66 $69.71Operating Revenue per Operating Expense 12.01% 15.06%Passenger Trips per Employee FTE n/a n/a Cost Effectiveness Operating Expense per Passenger Trip $11.37 $6.96Operating Expense per Passenger Mile $1.68 $1.35Operating Expense per Capita $18.30 $16.62Farebox Recovery Ratio 5.02% 6.43%Average Fare $0.57 $0.45 Service Effectiveness Passenger Trips per Revenue Mile 0.47 0.61Passenger Trips per Revenue Hour 7.54 10.01Passenger Trips per Capita 1.61 2.39Revenue Miles Between Safety Incidents n/a n/aRevenue Miles Between Failures 13,279 4,869

20 Florida deparTmenT oF TransporTaTion
Lakeland Area Mass Transit District (Citrus Connection)
Mr. Tom Phillips, Executive Director1248 George Jenkins Blvd., Lakeland, FL 33815(863) 688-7433www.ridecitrus.com
Lakeland Area Mass Transit District is an independent district governed by a five member Board of Directors. The District serves the greater Lakeland area via fixed route motorbus services (Citrus Connection) and demand response services. The data below represent 2009 and 2010 motorbus data.
General Information 2009 2010Service Area Population 110,000 110,000Service Area Population Density 1,428.6 1,428.6Operating Expense $7,064,440 $7,709,659Operating Revenue $1,307,128 $1,226,367 Service Supplied Total Annual Revenue Miles 1,266,448 1,274,537Total Annual Revenue Hours 79,235 79,625Total Revenue Vehicles 41 41Peak Vehicles 24 23Route Miles 219.9 255.1 Service Usage Annual Passenger Trips 1,450,988 1,459,429Annual Passenger Miles 7,291,873 7,336,287Average Trip Length 5.0 5.0 Quality of Service Average Headway (minutes) 34.39 41.57Weekday Span of Service (hours) 13.8 13.9 Cost Efficiency Operating Expense per Revenue Mile $5.58 $6.05Operating Expense per Revenue Hour $89.16 $96.82Operating Revenue per Operating Expense 18.50% 15.91%Passenger Trips per Employee FTE 16,199 15,794 Cost Effectiveness Operating Expense per Passenger Trip $4.87 $5.28Operating Expense per Passenger Mile $0.97 $1.05Operating Expense per Capita $64.22 $70.09Farebox Recovery Ratio 16.67% 14.86%Average Fare $0.81 $0.79 Service Effectiveness Passenger Trips per Revenue Mile 1.15 1.15Passenger Trips per Revenue Hour 18.31 18.33Passenger Trips per Capita 13.19 13.27Revenue Miles Between Safety Incidents 115,132 127,454Revenue Miles Between Failures 7,722 5,956

21Florida TransiT Handbook 2011
Lee County Transit (LeeTran)
Mr. Steve Myers, Transit Director 6035 Landing View Road, Fort Myers, FL 33907(239) 533-8726www.rideleetran.com
Lee County Transit is an independent division of the Lee County Government. The Lee County Board of County Commissioners, a five-member public policy body, governs the division. LeeTran provides public transportation services to Lee County via fixed-route motorbus services and demand-response services.In addition, LeeTran contractually provides vanpool service. LeeTran’s fixed-route motorbus and vanpool data for 2009 and 2010 are shown below.
General Information 2009 2010Service Area Population 444,837 443,696Service Area Population Density 3,676.3 3,666.9Operating Expense $14,946,864 $14,745,092Operating Revenue $2,953,633 $3,050,856 Service Supplied Total Annual Revenue Miles 3,158,087 3,241,809Total Annual Revenue Hours 188,282 185,442Total Revenue Vehicles 68 67Peak Vehicles 54 53Route Miles 416.4 412.1 Service Usage Annual Passenger Trips 3,064,820 3,035,272Annual Passenger Miles 16,597,504 16,302,712Average Trip Length 5.4 5.4 Quality of Service Average Headway (minutes) 31.75 30.67Weekday Span of Service (hours) 17.1 17.0 Cost Efficiency Operating Expense per Revenue Mile $4.73 $4.55Operating Expense per Revenue Hour $79.39 $79.51Operating Revenue per Operating Expense 19.76% 20.69%Passenger Trips per Employee FTE 18,506 18,223 Cost Effectiveness Operating Expense per Passenger Trip $4.88 $4.86Operating Expense per Passenger Mile $0.90 $0.90Operating Expense per Capita $33.60 $33.23Farebox Recovery Ratio 14.87% 15.34%Average Fare $0.73 $0.75 Service Effectiveness Passenger Trips per Revenue Mile 0.97 0.94Passenger Trips per Revenue Hour 16.28 16.37Passenger Trips per Capita 6.89 6.84Revenue Miles Between Safety Incidents 150,910 239,046Revenue Miles Between Failures 10,928 12,421

22 Florida deparTmenT oF TransporTaTion
LYNX Transit (Central Florida Regional Transit Authority)
Mr. John Lewis, Jr., Chief Executive Officer455 North Garland Avenue, Orlando, FL 32801(407) 841-2279www.golynx.com
LYNX is an independent authority that is governed by a Board of Directors. The authority provides service to Orange County (including Orlando, Winter Park, Maitland, and others), Seminole County (including Altamonte Springs, Casselberry, and Sanford), and Osceola County (including Kissimmee and St. Cloud). LYNX provides fixed-route motorbus service, paratransit service, transportation-disadvantaged coordination, a five-county regional ride-sharing assistance program, and vanpool service. 2009 and 2010 fixed-route motorbus and vanpool data for LYNX are provided below.
General Information 2009 2010Service Area Population 1,811,366 1,805,921Service Area Population Density 713.7 711.6Operating Expense $85,317,886 $83,275,858Operating Revenue $23,663,272 $25,817,266 Service Supplied Total Annual Revenue Miles 15,339,677 15,776,292Total Annual Revenue Hours 1,055,387 1,057,718Total Revenue Vehicles 375 346Peak Vehicles 298 290Route Miles 1,295.8 1,492.5 Service Usage Annual Passenger Trips 23,930,156 24,970,296Annual Passenger Miles 142,718,751 139,469,224Average Trip Length 6.0 5.6 Quality of Service Average Headway (minutes) 17.95 20.70Weekday Span of Service (hours) 23.0 23.0 Cost Efficiency Operating Expense per Revenue Mile $5.56 $5.28Operating Expense per Revenue Hour $80.84 $78.73Operating Revenue per Operating Expense 27.74% 31.00%Passenger Trips per Employee FTE 26,788 27,835 Cost Effectiveness Operating Expense per Passenger Trip $3.57 $3.33Operating Expense per Passenger Mile $0.60 $0.60Operating Expense per Capita $47.10 $46.11Farebox Recovery Ratio 24.02% 25.61%Average Fare $0.86 $0.85 Service Effectiveness Passenger Trips per Revenue Mile 1.56 1.58Passenger Trips per Revenue Hour 22.67 23.61Passenger Trips per Capita 13.21 13.83Revenue Miles Between Safety Incidents 159,788 138,389Revenue Miles Between Failures 9,492 10,366

23Florida TransiT Handbook 2011
Manatee County Area Transit (MCAT)
Mr. Chad Butzow, Interim Transit Manager1108 26th Avenue East, Bradenton, FL 34208(941) 747-8621www.mymanatee.org
Manatee County Area Transit is a division within the Community Services Department of Manatee County. The Board of County Commissioners governs the division. MCAT provides service to the urbanized parts of Manatee County via fixed-route motorbus services and demand-response services. 2009 and 2010 data for MCAT’s fixed-route motorbus services are provided on this page.
General Information 2009 2010Service Area Population 103,000 103,000Service Area Population Density 1,144.4 1,144.4Operating Expense $6,650,649 $6,844,330Operating Revenue $989,450 $1,051,284 Service Supplied Total Annual Revenue Miles 1,309,485 1,328,753Total Annual Revenue Hours 86,978 86,981Total Revenue Vehicles 31 27Peak Vehicles 19 19Route Miles 252.0 252.0 Service Usage Annual Passenger Trips 1,403,104 1,441,558Annual Passenger Miles 6,621,251 6,705,272Average Trip Length 4.7 4.7 Quality of Service Average Headway (minutes) 52.86 52.09Weekday Span of Service (hours) 16.5 16.5 Cost Efficiency Operating Expense per Revenue Mile $5.08 $5.15Operating Expense per Revenue Hour $76.46 $78.69Operating Revenue per Operating Expense 14.88% 15.36%Passenger Trips per Employee FTE 19,132 21,172 Cost Effectiveness Operating Expense per Passenger Trip $4.74 $4.75Operating Expense per Passenger Mile $1.00 $1.02Operating Expense per Capita $64.57 $66.45Farebox Recovery Ratio 9.89% 10.83%Average Fare $0.47 $0.51 Service Effectiveness Passenger Trips per Revenue Mile 1.07 1.08Passenger Trips per Revenue Hour 16.13 16.57Passenger Trips per Capita 13.62 14.00Revenue Miles Between Safety Incidents n/a 664,377Revenue Miles Between Failures 1,502 1,649

24 Florida deparTmenT oF TransporTaTion
The Council on Aging of Martin County, Inc.
Ms. Barbara A. Kauffman, President/CEO900 SE Salerno Road, Stuart, FL 34997 (772) 223-7800www.coamc.org
Community Coach, a service of the Council on Aging of Martin County, is the public trans-portation service for Martin County as designated by the Martin County Board of County Commissioners. Community Coach provides a curb-to-curb, advance reservation, shared ride transportation service and also operates deviated fixed-route services in Indiantown and Stuart. 2009 and 2010 motorbus data are displayed below.
General Information 2009 2010Service Area Population 137,956 137,956Service Area Population Density 248.6 248.6Operating Expense $202,053 $235,525Operating Revenue $5,031 $3,213 Service Supplied Total Annual Revenue Miles 30,861 67,278Total Annual Revenue Hours 2,473 3,656Total Revenue Vehicles 3 7Peak Vehicles 2 4Route Miles 26.8 181.4 Service Usage Annual Passenger Trips 11,361 4,626Annual Passenger Miles 83,425 36,813Average Trip Length 7.3 8.0 Quality of Service Average Headway (minutes) 64.43 147.86Weekday Span of Service (hours) 9.8 9.8 Cost Efficiency Operating Expense per Revenue Mile $6.55 $3.50Operating Expense per Revenue Hour $81.70 $64.42Operating Revenue per Operating Expense 2.49% 1.36%Passenger Trips per Employee FTE 3,011 1,436 Cost Effectiveness Operating Expense per Passenger Trip $17.78 $50.91Operating Expense per Passenger Mile $2.42 $6.40Operating Expense per Capita $1.46 $1.71Farebox Recovery Ratio 2.43% 1.15%Average Fare $0.43 $0.59 Service Effectiveness Passenger Trips per Revenue Mile 0.37 0.07Passenger Trips per Revenue Hour 4.59 1.27Passenger Trips per Capita 0.08 0.03Revenue Miles Between Safety Incidents n/a n/aRevenue Miles Between Failures n/a 13,456

25Florida TransiT Handbook 2011
Miami-Dade Transit (MDT)
Ms. Ysela Llort, Interim DirectorOvertown Transit Village 701 NW 1st Court, Suite 1700, Miami, FL 33136(786) 469-5675www.miamidade.gov/TRANSIT
Miami-Dade Transit is the largest transit agency in Florida, operating throughout Miami-Dade County, southern Broward County, and northern Monroe County. MDT is governed by Miami-Dade County, and is responsible for the management, construction, and operation of its services and facilities. Passengers have access to Metrobus, Metrorail (a 22-station heavy rail system), and Metromover (an automated people-mover system that serves the downtown Miami, Brickell and Omni areas). Paratransit is available through MDT’s Special Transporta-tion Service. Vanpool service is provided by Miami Lakes—VPSI, Inc. The data shown below represent all of MDT’s fixed-route services and area vanpool services (excluding paratransit operations) for 2009 and 2010.
General Information 2009 2010Service Area Population 2,402,208 2,500,625Service Area Population Density 7,850.4 8,172.0Operating Expense $437,906,325 $406,540,509Operating Revenue $103,032,863 $114,604,809 Service Supplied Total Annual Revenue Miles 42,487,660 40,255,102Total Annual Revenue Hours 3,104,860 2,921,790Total Revenue Vehicles 1,241 1,373Peak Vehicles 1,023 1,131Route Miles 1,900.6 1,939.2 Service Usage Annual Passenger Trips 102,573,888 96,285,797Annual Passenger Miles 545,980,507 531,009,637Average Trip Length 5.3 5.5 Quality of Service Average Headway (minutes) 8.15 7.47Weekday Span of Service (hours) 24.0 24.0 Cost Efficiency Operating Expense per Revenue Mile $10.31 $10.10Operating Expense per Revenue Hour $141.04 $139.14Operating Revenue per Operating Expense 23.53% 28.19%Passenger Trips per Employee FTE 29,528 29,162 Cost Effectiveness Operating Expense per Passenger Trip $4.27 $4.22Operating Expense per Passenger Mile $0.80 $0.77Operating Expense per Capita $182.29 $162.58Farebox Recovery Ratio 21.69% 23.91%Average Fare $0.93 $1.01 Service Effectiveness Passenger Trips per Revenue Mile 2.41 2.39Passenger Trips per Revenue Hour 33.04 32.95Passenger Trips per Capita 42.70 38.50Revenue Miles Between Safety Incidents 132,360 131,553Revenue Miles Between Failures 2,442 2,983

26 Florida deparTmenT oF TransporTaTion
Okaloosa County Transit (The Wave)
Mr. Barry Peterson, Program Manager600 Transit Way, Fort Walton Beach, FL 32547(850) 833-9168www.rideoct.org
The Okaloosa County Board of County Commissioners contracts to operate The Wave, a fixed-route bus system providing service in Fort Walton Beach and Crestview that began operating in 2001. In addition, demand-response services are provided (Okaloosa County Transit). 2009 and 2010 data representing The Wave’s fixed-route motorbus service are presented below.
General Information 2009 2010Service Area Population 170,498 170,498Service Area Population Density 852.5 852.5Operating Expense $1,099,672 $1,209,075Operating Revenue $118,605 $130,929 Service Supplied Total Annual Revenue Miles 445,586 407,695Total Annual Revenue Hours 36,643 34,734Total Revenue Vehicles 17 17Peak Vehicles 14 14Route Miles 162.9 167.2 Service Usage Annual Passenger Trips 172,122 162,820Annual Passenger Miles 825,175 796,190Average Trip Length 4.8 4.9 Quality of Service Average Headway (minutes) 57.41 61.05Weekday Span of Service (hours) 13.0 13.0 Cost Efficiency Operating Expense per Revenue Mile $2.47 $2.97Operating Expense per Revenue Hour $30.01 $34.81Operating Revenue per Operating Expense 10.79% 10.83%Passenger Trips per Employee FTE n/a n/a Cost Effectiveness Operating Expense per Passenger Trip $6.39 $7.43Operating Expense per Passenger Mile $1.33 $1.52Operating Expense per Capita $6.45 $7.09Farebox Recovery Ratio 9.38% 8.73%Average Fare $0.60 $0.65 Service Effectiveness Passenger Trips per Revenue Mile 0.39 0.40Passenger Trips per Revenue Hour 4.70 4.69Passenger Trips per Capita 1.01 0.95Revenue Miles Between Safety Incidents n/a n/aRevenue Miles Between Failures 29,706 33,975

27Florida TransiT Handbook 2011
Palm Beach County Transportation Agency (Palm Tran)
Mr. Charles D. Cohen, Executive Director3201 Electronics Way, West Palm Beach, FL 33407(561) 841-4200 www.palmtran.org
Palm Tran is a not-for-profit corporation owned by Palm Beach County that is governed by the seven-member Board of County Commissioners. The corporation provides transit ser-vices throughout Palm Beach County. Palm Tran operates fixed-route motorbus services and feeder bus services to the Tri-Rail system. In addition, Palm Tran offers route deviation service through the LINK and demand-response services through its paratransit operation, Palm Tran CONNECTION. 2009 and 2010 motorbus data for Palm Tran are provided below.
General Information 2009 2010Service Area Population 982,900 982,900Service Area Population Density 2,692.9 2,692.9Operating Expense $47,915,349 $47,225,045Operating Revenue $8,116,040 $7,445,623 Service Supplied Total Annual Revenue Miles 6,899,573 6,954,202Total Annual Revenue Hours 408,777 404,478Total Revenue Vehicles 160 157Peak Vehicles 125 123Route Miles 1,074.0 1,182.1 Service Usage Annual Passenger Trips 10,045,345 10,343,531Annual Passenger Miles 50,715,280 56,742,413Average Trip Length 5.0 5.5 Quality of Service Average Headway (minutes) 30.54 33.54Weekday Span of Service (hours) 16.6 17.8 Cost Efficiency Operating Expense per Revenue Mile $6.94 $6.79Operating Expense per Revenue Hour $117.22 $116.76Operating Revenue per Operating Expense 16.94% 15.77%Passenger Trips per Employee FTE 23,587 24,202 Cost Effectiveness Operating Expense per Passenger Trip $4.77 $4.57Operating Expense per Passenger Mile $0.94 $0.83Operating Expense per Capita $48.75 $48.05Farebox Recovery Ratio 14.24% 13.66%Average Fare $0.68 $0.62 Service Effectiveness Passenger Trips per Revenue Mile 1.46 1.49Passenger Trips per Revenue Hour 24.88 25.65Passenger Trips per Capita 10.22 10.52Revenue Miles Between Safety Incidents 265,368 204,535Revenue Miles Between Failures 6,804 6,095

28 Florida deparTmenT oF TransporTaTion
Pasco County Public Transportation (PCPT)
Mr. Michael Carroll, Public Transportation Manager 8620 Galen Wilson Boulevard, Port Richey, FL 34668(727) 834-3322www.ridepcpt.com
Pasco County Public Transportation is a division of Pasco County Government, governed by the five-member Pasco County Commission. Fixed-route bus service is provided in urbanized West Pasco County and the municipalities of East Pasco County. Demand-response (advance reservation) service is available throughout Pasco County. The data provided below represent PCPT’s fixed-route motorbus data for 2009 and 2010.
General Information 2009 2010Service Area Population 462,715 471,709Service Area Population Density 621.1 633.2Operating Expense $4,087,859 $3,876,444Operating Revenue $655,968 $814,021 Service Supplied Total Annual Revenue Miles 1,112,571 1,088,923Total Annual Revenue Hours 66,508 64,956Total Revenue Vehicles 29 29Peak Vehicles 16 16Route Miles 235.0 236.0 Service Usage Annual Passenger Trips 926,076 779,606Annual Passenger Miles 5,860,895 5,112,293Average Trip Length 6.3 6.6 Quality of Service Average Headway (minutes) 52.68 52.79Weekday Span of Service (hours) 15.6 15.6 Cost Efficiency Operating Expense per Revenue Mile $3.67 $3.56Operating Expense per Revenue Hour $61.46 $59.68Operating Revenue per Operating Expense 16.05% 21.00%Passenger Trips per Employee FTE 17,350 15,561 Cost Effectiveness Operating Expense per Passenger Trip $4.41 $4.97Operating Expense per Passenger Mile $0.70 $0.76Operating Expense per Capita $8.83 $8.22Farebox Recovery Ratio 16.05% 21.00%Average Fare $0.71 $1.04 Service Effectiveness Passenger Trips per Revenue Mile 0.83 0.72Passenger Trips per Revenue Hour 13.92 12.00Passenger Trips per Capita 2.00 1.65Revenue Miles Between Safety Incidents 139,071 136,115Revenue Miles Between Failures 4,346 3,457

29Florida TransiT Handbook 2011
Pinellas Suncoast Transit Authority (PSTA)
Mr. Brad Miller, Executive Director3201 Scherer Drive, St. Petersburg, FL 33716(727) 540-1800www.psta.net
The Pinellas Suncoast Transit Authority (PSTA) is the public transit provider for Pinellas County. In addition, two express routes travel between Pinellas County and Tampa, located in neighboring Hillsborough County. PSTA is an independent agency governed by an eleven-member Board of Directors comprised of elected officials and private citizen appointees. PSTA provides fixed-route motorbus service and demand-response service. PSTA’s fixed-route motorbus data for 2009 and 2010 are shown below.
General Information 2009 2010Service Area Population 883,631 871,480Service Area Population Density 3,681.8 3,661.7Operating Expense $51,392,031 $50,341,339Operating Revenue $12,153,794 $11,625,802 Service Supplied Total Annual Revenue Miles 8,762,280 9,000,501Total Annual Revenue Hours 611,629 628,430Total Revenue Vehicles 210 233Peak Vehicles 172 167Route Miles 917.0 914.1 Service Usage Annual Passenger Trips 11,953,082 12,811,835Annual Passenger Miles 61,725,595 66,590,897Average Trip Length 5.2 5.2 Quality of Service Average Headway (minutes) 22.33 22.93Weekday Span of Service (hours) 21.0 21.0 Cost Efficiency Operating Expense per Revenue Mile $5.87 $5.59Operating Expense per Revenue Hour $84.02 $80.11Operating Revenue per Operating Expense 23.65% 23.09%Passenger Trips per Employee FTE 22,509 23,588 Cost Effectiveness Operating Expense per Passenger Trip $4.30 $3.93Operating Expense per Passenger Mile $0.83 $0.76Operating Expense per Capita $58.16 $57.77Farebox Recovery Ratio 22.41% 21.86%Average Fare $0.96 $0.86 Service Effectiveness Passenger Trips per Revenue Mile 1.36 1.42Passenger Trips per Revenue Hour 19.54 20.39Passenger Trips per Capita 13.53 14.70Revenue Miles Between Safety Incidents 105,570 409,114Revenue Miles Between Failures 4,510 5,921

30 Florida deparTmenT oF TransporTaTion
Polk County Transit Services Division/ Winter Haven Area TransitMr. Paul Simmons, Division Director1290 Golfview Avenue, Drawer HS09, P.O. Box 9005, Bartow, FL 33831(863) 534-5500www.polk-county.net
Winter Haven Area Transit (WHAT) began operating in 1999 with Polk County Transit Services as the Administrative Agent and Project Manager. Polk County Transit Services operates two-fixed routes and also contracts with Citrus Connection (Lakeland) to jointly provide fixed-route motorbus services in the City of Winter Haven. The WHAT system is governed by a Policy Board. Demand-response services are also provided. 2009 and 2010 motorbus data for Polk County and WHAT are presented below.
General Information 2009 2010Service Area Population 153,924 153,924Service Area Population Density 3,206.8 3,206.8Operating Expense $2,469,600 $2,399,478Operating Revenue $249,112 $252,057 Service Supplied Total Annual Revenue Miles 738,793 725,738Total Annual Revenue Hours 34,984 34,829Total Revenue Vehicles 26 14Peak Vehicles 21 10Route Miles 223.1 216.3 Service Usage Annual Passenger Trips 466,008 473,353Annual Passenger Miles 2,333,760 2,370,543Average Trip Length 5.0 5.0 Quality of Service Average Headway (minutes) 30.18 62.28Weekday Span of Service (hours) 13.3 13.3 Cost Efficiency Operating Expense per Revenue Mile $3.34 $3.31Operating Expense per Revenue Hour $70.59 $68.89Operating Revenue per Operating Expense 10.09% 10.50%Passenger Trips per Employee FTE 9,975 11,282 Cost Effectiveness Operating Expense per Passenger Trip $5.30 $5.07Operating Expense per Passenger Mile $1.06 $1.01Operating Expense per Capita $16.04 $15.59Farebox Recovery Ratio 10.09% 10.50%Average Fare $0.53 $0.53 Service Effectiveness Passenger Trips per Revenue Mile 0.63 0.65Passenger Trips per Revenue Hour 13.32 13.59Passenger Trips per Capita 3.03 3.08Revenue Miles Between Safety Incidents n/a n/aRevenue Miles Between Failures 18,943 22,679

31Florida TransiT Handbook 2011
St. Johns County Council on Aging, Inc. (Sunshine Bus) Mr. George Hesson, Manager180 Marine Street, St. Augustine, FL 32084(904) 209-3716www.sunshinebus.net
The Sunshine Bus Company is a newer Florida transit agency operated under contract by St. Johns County Council on Aging, Inc. Services provided include fixed-route motorbus and demand-response operations. 2007 was the first year that St. Johns County reported information to the National Transit Database; 2009 and 2010 data for the motorbus mode are shown below.
General Information 2009 2010Service Area Population 149,300 149,300Service Area Population Density 248.8 248.8Operating Expense $535,923 $870,494Operating Revenue $76,705 $90,620 Service Supplied Total Annual Revenue Miles 347,987 457,381Total Annual Revenue Hours 17,678 21,846Total Revenue Vehicles 11 11Peak Vehicles 7 7Route Miles 66.0 106.0 Service Usage Annual Passenger Trips 137,928 185,863Annual Passenger Miles 1,011,012 1,362,376Average Trip Length 7.3 7.3 Quality of Service Average Headway (minutes) 28.74 43.40Weekday Span of Service (hours) 12.0 12.0 Cost Efficiency Operating Expense per Revenue Mile $1.54 $1.90Operating Expense per Revenue Hour $30.32 $39.85Operating Revenue per Operating Expense 14.31% 10.41%Passenger Trips per Employee FTE n/a n/a Cost Effectiveness Operating Expense per Passenger Trip $3.89 $4.68Operating Expense per Passenger Mile $0.53 $0.64Operating Expense per Capita $3.59 $5.83Farebox Recovery Ratio 14.31% 10.41%Average Fare $0.56 $0.49 Service Effectiveness Passenger Trips per Revenue Mile 0.40 0.41Passenger Trips per Revenue Hour 7.80 8.51Passenger Trips per Capita 0.92 1.24Revenue Miles Between Safety Incidents n/a n/aRevenue Miles Between Failures 49,712 114,345

32 Florida deparTmenT oF TransporTaTion
St. Lucie Council on Aging, Inc.
Ms. Marianne Arbore, Director1505 Orange Avenue, Fort Pierce, FL 34950(772) 464-7433 www.treasurecoastconnector.com
Council on Aging of St. Lucie, Inc. operates Community Transit, a demand response system, and the Treasure Coast Connector, a regional fixed route system connecting St. Lucie and Martin Counties. The data shown below represent the fixed-route services for 2009 and 2010.
General Information 2009 2010Service Area Population 265,108 266,502Service Area Population Density 463.5 465.9Operating Expense $1,194,717 $1,551,171Operating Revenue $72,134 $92,984 Service Supplied Total Annual Revenue Miles 255,721 336,477Total Annual Revenue Hours 19,011 24,869Total Revenue Vehicles 14 14Peak Vehicles 9 9Route Miles 94.0 88.0 Service Usage Annual Passenger Trips 118,637 173,250Annual Passenger Miles 977,003 1,378,944Average Trip Length 8.2 8.0 Quality of Service Average Headway (minutes) 46.59 43.36Weekday Span of Service (hours) 11.0 11.0 Cost Efficiency Operating Expense per Revenue Mile $4.67 $4.61Operating Expense per Revenue Hour $62.84 $62.37Operating Revenue per Operating Expense 6.04% 5.99%Passenger Trips per Employee FTE 6,414 7,793 Cost Effectiveness Operating Expense per Passenger Trip $10.07 $8.95Operating Expense per Passenger Mile $1.22 $1.12Operating Expense per Capita $4.51 $5.82Farebox Recovery Ratio 5.72% 5.99%Average Fare $0.58 $0.54 Service Effectiveness Passenger Trips per Revenue Mile 0.46 0.51Passenger Trips per Revenue Hour 6.24 6.97Passenger Trips per Capita 0.45 0.65Revenue Miles Between Safety Incidents n/a n/aRevenue Miles Between Failures 7,306 9,614
33Florida TransiT Handbook 2011
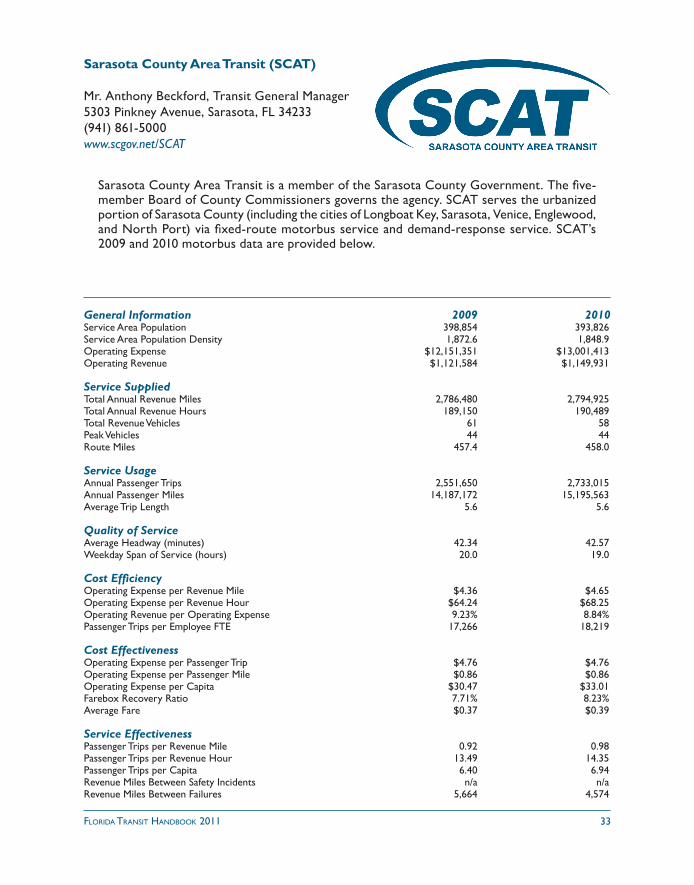
Sarasota County Area Transit (SCAT)
Mr. Anthony Beckford, Transit General Manager5303 Pinkney Avenue, Sarasota, FL 34233(941) 861-5000www.scgov.net/SCAT
Sarasota County Area Transit is a member of the Sarasota County Government. The five-member Board of County Commissioners governs the agency. SCAT serves the urbanized portion of Sarasota County (including the cities of Longboat Key, Sarasota, Venice, Englewood, and North Port) via fixed-route motorbus service and demand-response service. SCAT’s 2009 and 2010 motorbus data are provided below.
General Information 2009 2010Service Area Population 398,854 393,826Service Area Population Density 1,872.6 1,848.9Operating Expense $12,151,351 $13,001,413Operating Revenue $1,121,584 $1,149,931 Service Supplied Total Annual Revenue Miles 2,786,480 2,794,925Total Annual Revenue Hours 189,150 190,489Total Revenue Vehicles 61 58Peak Vehicles 44 44Route Miles 457.4 458.0 Service Usage Annual Passenger Trips 2,551,650 2,733,015Annual Passenger Miles 14,187,172 15,195,563Average Trip Length 5.6 5.6 Quality of Service Average Headway (minutes) 42.34 42.57Weekday Span of Service (hours) 20.0 19.0 Cost Efficiency Operating Expense per Revenue Mile $4.36 $4.65Operating Expense per Revenue Hour $64.24 $68.25Operating Revenue per Operating Expense 9.23% 8.84%Passenger Trips per Employee FTE 17,266 18,219 Cost Effectiveness Operating Expense per Passenger Trip $4.76 $4.76Operating Expense per Passenger Mile $0.86 $0.86Operating Expense per Capita $30.47 $33.01Farebox Recovery Ratio 7.71% 8.23%Average Fare $0.37 $0.39 Service Effectiveness Passenger Trips per Revenue Mile 0.92 0.98Passenger Trips per Revenue Hour 13.49 14.35Passenger Trips per Capita 6.40 6.94Revenue Miles Between Safety Incidents n/a n/aRevenue Miles Between Failures 5,664 4,574

34 Florida deparTmenT oF TransporTaTion
Senior Resource Association (Indian River County) (IndianRiverTransit/GoLine)
Ms. Karen Deigl, CEO694 14th Street, Vero Beach, FL 32960(772) 569-0903www.GoLineIRT.com
Senior Resource Association operates as the Transit Element of Indian River County, in a quasi-governmental status under the five-member elected Board of County Commissioners. It is governed by a volunteer Board of Directors. Community Coach serves the rural and urbanized portions of Indian River County. The system provides point deviation motorbus services, and demand-response van, wheelchair, and stretcher services. The data shown below represent 2010 and 2010 motorbus services.
General Information 2009 2010Service Area Population 107,555 117,237Service Area Population Density 614.6 669.9Operating Expense $1,153,897 $1,282,979Operating Revenue $8,191 $82,637 Service Supplied Total Annual Revenue Miles 365,966 564,322Total Annual Revenue Hours 32,474 38,672Total Revenue Vehicles 18 21Peak Vehicles 11 14Route Miles 248.0 251.0 Service Usage Annual Passenger Trips 594,128 707,402Annual Passenger Miles 2,715,136 2,899,504Average Trip Length 4.6 4.1 Quality of Service Average Headway (minutes) 120.03 73.72Weekday Span of Service (hours) 11.0 11.0 Cost Efficiency Operating Expense per Revenue Mile $3.15 $2.27Operating Expense per Revenue Hour $35.53 $33.18Operating Revenue per Operating Expense 0.71% 6.44%Passenger Trips per Employee FTE 29,952 27,063 Cost Effectiveness Operating Expense per Passenger Trip $1.94 $1.81Operating Expense per Passenger Mile $0.42 $0.44Operating Expense per Capita $10.73 $10.94Farebox Recovery Ratio n/a n/aAverage Fare $0.00 $0.00 Service Effectiveness Passenger Trips per Revenue Mile 1.62 1.25Passenger Trips per Revenue Hour 18.30 18.29Passenger Trips per Capita 5.52 6.03Revenue Miles Between Safety Incidents n/a n/aRevenue Miles Between Failures 18,298 29,701

35Florida TransiT Handbook 2011
South Florida Regional Transportation Authority (Tri-Rail)
Mr. Joseph Giulietti, Executive Director800 NW 33rd Street, Pompano Beach, FL 33064(954) 942-7245www.tri-rail.com
The South Florida Regional Transportation Authority is an independent authority established by the Florida Legislature. A nine-member appointed Board of Directors governs the SFRTA. The SFRTA operates and manages the commuter rail system, Tri-Rail, as well as select mo-torbus services throughout Broward, Miami-Dade and Palm Beach counties. This page shows 2009 and 2010 data for these services.
General Information 2009 2010Service Area Population 5,448,962 5,448,962Service Area Population Density 1,062.6 1,062.6Operating Expense $57,222,454 $54,513,796Operating Revenue $10,563,006 $10,674,542 Service Supplied Total Annual Revenue Miles 3,389,697 3,368,257Total Annual Revenue Hours 135,490 140,992Total Revenue Vehicles 67 67Peak Vehicles 52 52Route Miles 279.5 247.4 Service Usage Annual Passenger Trips 4,711,486 4,050,353Annual Passenger Miles 124,144,539 106,099,537Average Trip Length 26.3 26.2 Quality of Service Average Headway (minutes) 12.89 11.95Weekday Span of Service (hours) 19.1 19.6 Cost Efficiency Operating Expense per Revenue Mile $16.88 $16.18Operating Expense per Revenue Hour $422.34 $386.64Operating Revenue per Operating Expense 18.46% 19.58%Passenger Trips per Employee FTE n/a n/a Cost Effectiveness Operating Expense per Passenger Trip $12.15 $13.46Operating Expense per Passenger Mile $0.46 $0.51Operating Expense per Capita $10.50 $10.00Farebox Recovery Ratio 17.03% 18.88%Average Fare $2.07 $2.54 Service Effectiveness Passenger Trips per Revenue Mile 1.39 1.20Passenger Trips per Revenue Hour 34.77 28.73Passenger Trips per Capita 0.86 0.74Revenue Miles Between Safety Incidents 1,129,899 1,122,752Revenue Miles Between Failures 56,495 177,277
36 Florida deparTmenT oF TransporTaTion
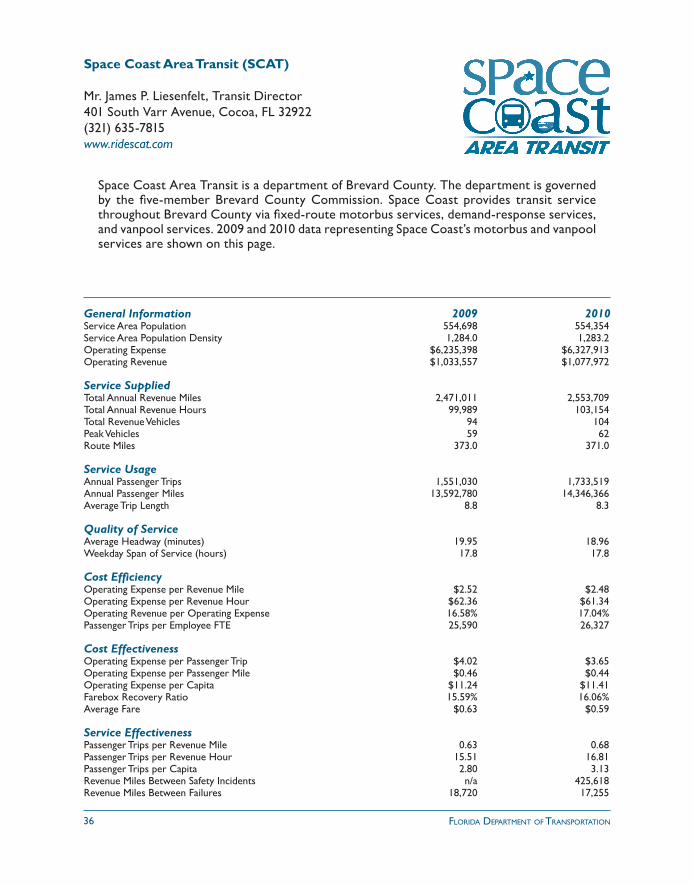
Space Coast Area Transit (SCAT)
Mr. James P. Liesenfelt, Transit Director401 South Varr Avenue, Cocoa, FL 32922(321) 635-7815www.ridescat.com
Space Coast Area Transit is a department of Brevard County. The department is governed by the five-member Brevard County Commission. Space Coast provides transit service throughout Brevard County via fixed-route motorbus services, demand-response services, and vanpool services. 2009 and 2010 data representing Space Coast’s motorbus and vanpool services are shown on this page.
General Information 2009 2010Service Area Population 554,698 554,354Service Area Population Density 1,284.0 1,283.2Operating Expense $6,235,398 $6,327,913Operating Revenue $1,033,557 $1,077,972 Service Supplied Total Annual Revenue Miles 2,471,011 2,553,709Total Annual Revenue Hours 99,989 103,154Total Revenue Vehicles 94 104Peak Vehicles 59 62Route Miles 373.0 371.0 Service Usage Annual Passenger Trips 1,551,030 1,733,519Annual Passenger Miles 13,592,780 14,346,366Average Trip Length 8.8 8.3 Quality of Service Average Headway (minutes) 19.95 18.96Weekday Span of Service (hours) 17.8 17.8 Cost Efficiency Operating Expense per Revenue Mile $2.52 $2.48Operating Expense per Revenue Hour $62.36 $61.34Operating Revenue per Operating Expense 16.58% 17.04%Passenger Trips per Employee FTE 25,590 26,327 Cost Effectiveness Operating Expense per Passenger Trip $4.02 $3.65Operating Expense per Passenger Mile $0.46 $0.44Operating Expense per Capita $11.24 $11.41Farebox Recovery Ratio 15.59% 16.06%Average Fare $0.63 $0.59 Service Effectiveness Passenger Trips per Revenue Mile 0.63 0.68Passenger Trips per Revenue Hour 15.51 16.81Passenger Trips per Capita 2.80 3.13Revenue Miles Between Safety Incidents n/a 425,618Revenue Miles Between Failures 18,720 17,255

37Florida TransiT Handbook 2011
StarMetro (Tallahassee)
Mr. Ron Garrison, Executive Director555 Appleyard Drive, Tallahassee, FL 32304(850) 891-5200www.talgov.com/starmetro
StarMetro is a department of the City of Tallahassee government. It is governed by a Board of Directors that is comprised of four elected commissioners and one elected mayor. StarMetro serves the City of Tallahassee by providing fixed-route motorbus service and demand-response service to its community. Evening, weekend, and holiday demand-response services are pro-vided via contract. StarMetro’s 2009 and 2010 motorbus data are provided below.
General Information 2009 2010Service Area Population 162,310 162,310Service Area Population Density 1,591.3 1,591.3Operating Expense $10,500,430 $11,110,040Operating Revenue $3,853,094 $4,126,209 Service Supplied Total Annual Revenue Miles 1,966,766 1,979,694Total Annual Revenue Hours 181,869 185,982Total Revenue Vehicles 66 73Peak Vehicles 63 56Route Miles 233.0 232.0 Service Usage Annual Passenger Trips 4,409,041 4,762,233Annual Passenger Miles 12,916,425 13,568,341Average Trip Length 2.9 2.9 Quality of Service Average Headway (minutes) 20.52 23.35Weekday Span of Service (hours) 21.8 17.3 Cost Efficiency Operating Expense per Revenue Mile $5.34 $5.61Operating Expense per Revenue Hour $57.74 $59.74Operating Revenue per Operating Expense 36.69% 37.14%Passenger Trips per Employee FTE 29,386 31,117 Cost Effectiveness Operating Expense per Passenger Trip $2.38 $2.33Operating Expense per Passenger Mile $0.81 $0.82Operating Expense per Capita $64.69 $68.45Farebox Recovery Ratio 36.13% 36.48%Average Fare $0.86 $0.85 Service Effectiveness Passenger Trips per Revenue Mile 2.24 2.41Passenger Trips per Revenue Hour 24.24 25.61Passenger Trips per Capita 27.16 29.34Revenue Miles Between Safety Incidents 218,530 n/aRevenue Miles Between Failures 16,810 17,676

38 Florida deparTmenT oF TransporTaTion
County of Volusia dba VOTRAN
Mr. Kenneth Fischer, General Manager950 Big Tree Road, South Daytona, FL 32119(386) 756-7496www.votran.org
VOTRAN is a part of Volusia County’s General Fund. It is governed by a Board of Directors that is comprised of seven County Council members. VOTRAN provides public transpor-tation services throughout Volusia County via fixed-route motorbus services, paratransit services, and vanpool services. 2009 and 2010 data for VOTRAN’s motorbus and vanpool services are shown below.
General Information 2009 2010Service Area Population 468,670 468,670Service Area Population Density 388.3 388.3Operating Expense $11,375,322 $11,677,473Operating Revenue $2,612,709 $2,883,012 Service Supplied Total Annual Revenue Miles 2,997,899 3,014,826Total Annual Revenue Hours 170,209 169,550Total Revenue Vehicles 82 87Peak Vehicles 71 70Route Miles 564.0 561.0 Service Usage Annual Passenger Trips 3,184,205 3,329,232Annual Passenger Miles 18,353,910 18,682,773Average Trip Length 5.8 5.6 Quality of Service Average Headway (minutes) 27.06 27.04Weekday Span of Service (hours) 18.0 18.0 Cost Efficiency Operating Expense per Revenue Mile $3.79 $3.87Operating Expense per Revenue Hour $66.83 $68.87Operating Revenue per Operating Expense 22.97% 24.69%Passenger Trips per Employee FTE 23,968 24,170 Cost Effectiveness Operating Expense per Passenger Trip $3.57 $3.51Operating Expense per Passenger Mile $0.62 $0.63Operating Expense per Capita $24.27 $24.92Farebox Recovery Ratio 19.92% 21.49%Average Fare $0.71 $0.75 Service Effectiveness Passenger Trips per Revenue Mile 1.06 1.10Passenger Trips per Revenue Hour 18.71 19.64Passenger Trips per Capita 6.79 7.10Revenue Miles Between Safety Incidents 199,860 251,236Revenue Miles Between Failures 4,535 4,187

39Florida TransiT Handbook 2011
Se
rvic
e A
rea
Serv
ice
Are
a Sy
stem
Po
pula
tion
Po
pula
tion
Den
sity
O
pera
ting
Exp
ense
O
pera
ting
Rev
enue
20
09
2010
20
09
2010
20
09
2010
20
09
2010
Bay T
own
Trol
ley
85,4
58
85,4
58
1,78
0.4
1,78
0.4
$1,8
41,9
88
$2,1
98,4
63
$356
,842
$4
61,3
49Br
owar
d C
ount
y Tra
nsit
1,75
1,23
4 1,
766,
476
4,27
1.3
4,30
8.5
$100
,807
,838
$1
05,0
25,1
95
$24,
949,
603
$30,
612,
800
Col
lier A
rea T
rans
it
333,
032
333,
032
220.
1 22
0.1
$5,0
48,0
82
$5,4
90,9
80
$988
,710
$1
,020
,300
Esca
mbi
a C
ount
y A
rea T
rans
it 30
7,22
0 30
7,22
0 1,
920.
1 1,
920.
1 $6
,805
,860
$6
,755
,135
$1
,176
,008
$1
,358
,322
Gai
nesv
ille
Reg
iona
l Tra
nsit
Syst
em
151,
294
151,
294
1,99
0.7
1,99
0.7
$16,
578,
691
$16,
673,
905
$10,
157,
183
$10,
722,
646
Her
nand
o C
ount
y (T
rans
Her
nand
o Ex
pres
s)
164,
907
165,
843
345.
0 34
7.0
$1,4
63,2
97
$747
,022
$9
4,50
7 $1
04,2
79H
illsb
orou
gh A
rea
Reg
iona
l Tra
nsit
821,
306
821,
306
3,37
9.9
3,37
9.9
$61,
598,
943
$61,
473,
492
$13,
184,
576
$13,
790,
252
Jack
sonv
ille
Tran
spor
tatio
n A
utho
rity
82
7,45
3 85
3,30
0 3,
419.
2 3,
080.
5 $5
9,69
9,68
7 $6
0,92
5,24
1 $1
0,28
5,48
2 $9
,801
,838
Lake
Cou
nty
Publ
ic T
rans
p. (L
akeX
pres
s)
97,4
97
97,4
97
1,37
3 1,
373.
2 $1
,784
,224
$1
,620
,604
$2
14,2
02
$244
,121
Lake
land
Are
a M
ass T
rans
it D
istr
ict
110,
000
110,
000
1,42
8.6
1,42
8.6
$7,0
64,4
40
$7,7
09,6
59
$1,3
07,1
28
$1,2
26,3
67Le
e C
ount
y Tra
nsit
44
4,83
7 44
3,69
6 3,
676.
3 3,
666.
9 $1
4,94
6,86
4 $1
4,74
5,09
2 $2
,953
,633
$3
,050
,856
LYN
X T
rans
it 1,
811,
366
1,80
5,92
1 71
3.7
711.
6 $8
5,31
7,88
6 $8
3,27
5,85
8 $2
3,66
3,27
2 $2
5,81
7,26
6M
anat
ee C
ount
y A
rea T
rans
it 10
3,00
0 10
3,00
0 1,
144.
4 1,
144.
4 $6
,650
,649
$6
,844
,330
$9
89,4
50
$1,0
51,2
84C
ounc
il on
Agi
ng o
f Mar
tin C
ount
y, In
c. 13
7,95
6 13
7,95
6 24
8.6
248.
6 $2
02,0
53
$235
,525
$5
,031
$3
,213
Mia
mi-D
ade
Tran
sit
2,40
2,20
8 2,
500,
625
7,85
0.4
8,17
2.0
$437
,906
,325
$4
06,5
40,5
09
$103
,032
,863
$1
14,6
04,8
09O
kalo
osa
Cou
nty T
rans
it (T
he W
AVE)
17
0,49
8 17
0,49
8 85
2.5
852.
5 $1
,099
,672
$1
,209
,075
$1
18,6
05
$130
,929
Palm
Bea
ch C
ount
y Tra
nspo
rtat
ion
Age
ncy
982,
900
982,
900
2,69
2.9
2,69
2.9
$47,
915,
349
$47,
225,
045
$8,1
16,0
40
$7,4
45,6
23Pa
sco
Cou
nty
Publ
ic T
rans
port
atio
n 46
2,71
5 47
1,70
9 62
1.1
633.
2 $4
,087
,859
$3
,876
,444
$6
55,9
68
$814
,021
Pine
llas
Sunc
oast
Tra
nsit
Aut
hori
ty
883,
631
871,
480
3,68
1.8
3,66
1.7
$51,
392,
031
$50,
341,
339
$12,
153,
794
$11,
625,
802
Polk
Cou
nty T
rans
it Sv
cs. D
iv. &
WH
AT
153,
924
153,
924
3,20
6.8
3,20
6.8
$2,4
69,6
00
$2,3
99,4
78
$249
,112
$2
52,0
57Sa
raso
ta C
ount
y A
rea T
rans
it 39
8,85
4 39
3,82
6 1,
872.
6 1,
848.
9 $1
2,15
1,35
1 $1
3,00
1,41
3 $1
,121
,584
$1
,149
,931
Seni
or R
esou
rce
Ass
ocia
tion
(Indi
an R
iver
) 10
7,55
5 11
7,23
7 61
4.6
669.
9 $1
,153
,897
$1
,282
,979
$8
,191
$8
2,63
7S.
Flor
ida
Reg
iona
l Tra
nspo
rtat
ion
Aut
hori
ty
5,44
8,96
2 5,
448,
962
1,06
2.6
1,06
2.6
$57,
222,
454
$54,
513,
796
$10,
563,
006
$10,
674,
542
Spac
e C
oast
Are
a Tra
nsit
554,
698
554,
354
1,28
4.0
1,28
3.2
$6,2
35,3
98
$6,3
27,9
13
$1,0
33,5
57
$1,0
77,9
72St
. Luc
ie C
ount
y C
ounc
il on
Agi
ng, I
nc.
265,
108
266,
502
463.
5 46
5.9
$1,1
94,7
17
$1,5
51,1
71
$72,
134
$92,
984
St. J
ohns
Cou
nty
(Sun
shin
e Bu
s)
149,
300
149,
300
248.
8 24
8.8
$535
,923
$8
70,4
94
$76,
705
$90,
620
Star
Met
ro (
Talla
hass
ee)
162,
310
162,
310
1,59
1.3
1,59
1.3
$10,
500,
430
$11,
110,
040
$3,8
53,0
94
$4,1
26,2
09Vo
lusi
a C
ount
y db
a VO
TR
AN
46
8,67
0 46
8,67
0 38
8.3
388.
3 $1
1,37
5,32
2 $1
1,67
7,47
3 $2
,612
,709
$2
,883
,012
Flor
ida
Tran
sit
Syst
em S
umm
ary
– 20
09 &
201
0
The
dat
a sh
own
in t
his
tabl
e re
pres
ent
clos
ed-o
ut, v
alid
ated
num
bers
as
of S
epte
mbe
r 20
11. H
owev
er, i
t is
pos
sibl
e th
at s
ome
figur
es m
ay b
e up
date
d in
th
e su
bseq
uent
rep
ortin
g ye
ar.

40 Florida deparTmenT oF TransporTaTion
To
tal A
nnua
l To
tal A
nnua
l To
tal R
even
ue
Peak
R
oute
Syst
em
Rev
enue
Mile
s R
even
ue H
ours
Ve
hicl
es
Vehi
cles
M
iles
20
09
2010
20
09
2010
20
09
2010
20
09
2010
20
09
2010
Bay T
own
Trol
ley
597,
275
625,
828
36,9
67
39,1
23
19
22
13
13
150.
0 15
0.0
Brow
ard
Cou
nty T
rans
it 16
,333
,518
16
,372
,108
1,
189,
097
1,18
8,30
2 36
2 37
9 30
3 30
7 1,
603.
7 1,
629.
9C
ollie
r Are
a Tra
nsit
1,
244,
756
1,23
0,05
5 67
,043
66
,475
23
23
16
16
36
3.5
376.
0Es
cam
bia
Cou
nty
Are
a Tra
nsit
1,36
2,52
3 1,
388,
505
104,
396
97,3
71
39
46
32
32
311.
0 31
2.0
Gai
nesv
ille
Reg
iona
l Tra
nsit
Syst
em
2,82
1,70
3 2,
808,
703
248,
819
255,
786
105
105
88
88
205.
6 20
8.3
Her
nand
o C
ount
y (T
rans
Her
nand
o Ex
pres
s)
304,
991
147,
415
17,4
91
8,36
0 10
5
6 3
60.2
60
.2H
illsb
orou
gh A
rea
Reg
iona
l Tra
nsit
8,14
0,80
5 8,
280,
099
612,
449
631,
880
238
245
197
195
978.
2 1,
021.
3Ja
ckso
nvill
e Tr
ansp
orta
tion
Aut
hori
ty
9,09
8,87
2 9,
384,
591
605,
315
626,
177
192
193
169
162
645.
4 1,
037.
0La
ke C
ount
y Pu
blic
Tra
nsp.
(Lak
eXpr
ess)
33
1,97
8 38
4,65
3 20
,828
23
,249
10
12
7
7 14
7.3
148.
0La
kela
nd A
rea
Mas
s Tra
nsit
Dis
tric
t 1,
266,
448
1,27
4,53
7 79
,235
79
,625
41
41
24
23
21
9.9
255.
1Le
e C
ount
y Tra
nsit
3,
158,
087
3,24
1,80
9 18
8,28
2 18
5,44
2 68
67
54
53
41
6.4
412.
1LY
NX
Tra
nsit
15,3
39,6
77
15,7
76,2
92
1,05
5,38
7 1,
057,
718
375
346
298
290
1,29
5.8
1,49
2.5
Man
atee
Cou
nty
Are
a Tra
nsit
1,30
9,48
5 1,
328,
753
86,9
78
86,9
81
31
27
19
19
252.
0 25
2.0
Cou
ncil
on A
ging
of M
artin
Cou
nty,
Inc.
30,8
61
67,2
78
2,47
3 3,
656
3 7
2 4
26.8
18
1.4
Mia
mi-D
ade
Tran
sit
42,4
87,6
60
40,2
55,1
02
3,10
4,86
0 2,
921,
790
1,24
1 1,
373
1,02
3 1,
131
1,90
0.6
1,93
9.2
Oka
loos
a C
ount
y Tra
nsit
(The
WAV
E)
445,
586
407,
695
36,6
43
34,7
34
17
17
14
14
162.
9 16
7.2
Palm
Bea
ch C
ount
y Tra
nspo
rtat
ion
Age
ncy
6,89
9,57
3 6,
954,
202
408,
777
404,
478
160
157
125
123
1,07
4.0
1,18
2.1
Pasc
o C
ount
y Pu
blic
Tra
nspo
rtat
ion
1,11
2,57
1 1,
088,
923
66,5
08
64,9
56
29
29
16
16
235.
0 23
6.0
Pine
llas
Sunc
oast
Tra
nsit
Aut
hori
ty
8,76
2,28
0 9,
000,
501
611,
629
628,
430
210
233
172
167
917.
0 91
4.1
Polk
Cou
nty T
rans
it Sv
cs. D
iv. &
WH
AT
738,
793
725,
738
34,9
84
34,8
29
26
14
21
10
223.
1 21
6.3
Sara
sota
Cou
nty
Are
a Tra
nsit
2,78
6,48
0 2,
794,
925
189,
150
190,
489
61
58
44
44
457.
4 45
8.0
Seni
or R
esou
rce
Ass
ocia
tion
(Indi
an R
iver
) 36
5,96
6 56
4,32
2 32
,474
38
,672
18
21
11
14
24
8.0
251.
0S.
Flor
ida
Reg
iona
l Tra
nspo
rtat
ion
Aut
hori
ty
3,38
9,69
7 3,
368,
257
135,
490
140,
992
67
67
52
52
279.
5 24
7.4
Spac
e C
oast
Are
a Tra
nsit
2,47
1,01
1 2,
553,
709
99,9
89
103,
154
94
104
59
62
373.
0 37
1.0
St. L
ucie
Cou
nty
Cou
ncil
on A
ging
, Inc
. 25
5,72
1 33
6,47
7 19
,011
24
,869
14
14
9
9 94
.0
88.0
St. J
ohns
Cou
nty
(Sun
shin
e Bu
s)
347,
987
457,
381
17,6
78
21,8
46
11
11
7 7
66.0
10
6.0
Star
Met
ro (
Talla
hass
ee)
1,96
6,76
6 1,
979,
694
181,
869
185,
982
66
73
63
56
233.
0 23
2.0
Volu
sia
Cou
nty
dba V
OT
RA
N
2,99
7,89
9 3,
014,
826
170,
209
169,
550
82
87
71
70
564.
0 56
1.0
Flor
ida
Tran
sit
Syst
em S
umm
ary
– 20
09 &
201
0 (c
onti
nued
)
The
dat
a sh
own
in t
his
tabl
e re
pres
ent
clos
ed-o
ut, v
alid
ated
num
bers
as
of S
epte
mbe
r 20
11. H
owev
er, i
t is
pos
sibl
e th
at s
ome
figur
es m
ay b
e up
date
d in
th
e su
bseq
uent
rep
ortin
g ye
ar.

41Florida TransiT Handbook 2011
A
nnua
l Pas
seng
er
Ann
ual P
asse
nger
A
vg. T
rip
A
vg. H
eadw
ay
Wee
kday
Spa
nSy
stem
Tr
ips
Mile
s (m
iles)
(m
inut
es)
of S
ervi
ce (
hrs)
20
09
2010
20
09
2010
20
09
2010
20
09
2010
20
09
2010
Bay T
own
Trol
ley
670,
573
724,
613
3,31
5,51
2 3,
579,
588
4.9
4.9
42.8
5 43
.28
14.5
14
.5Br
owar
d C
ount
y Tra
nsit
38,9
60,2
17
38,6
70,3
24
174,
056,
441
179,
624,
107
4.5
4.6
23.1
2 23
.12
20.0
20
.0C
ollie
r Are
a Tra
nsit
1,
109,
710
1,06
4,91
0 8,
968,
616
8,60
4,47
3 8.
1 8.
1 73
.42
76.2
0 16
.5
16.5
Esca
mbi
a C
ount
y A
rea T
rans
it 1,
131,
853
1,15
2,37
5 5,
489,
487
5,58
8,56
3 4.
8 4.
8 44
.68
41.0
2 15
.0
13.5
Gai
nesv
ille
Reg
iona
l Tra
nsit
Syst
em
8,93
9,98
0 9,
373,
060
25,0
31,9
44
26,2
44,5
68
2.8
2.8
12.3
6 12
.93
20.2
21
.2H
erna
ndo
Cou
nty
(Tra
nsH
erna
ndo
Expr
ess)
12
9,19
7 69
,945
60
5,03
0 44
0,07
0 4.
7 6.
3 34
.52
68.2
8 14
.0
12.5
Hill
sbor
ough
Are
a R
egio
nal T
rans
it 13
,714
,254
13
,233
,764
67
,687
,285
63
,367
,321
4.
9 4.
8 22
.41
23.9
8 21
.5
21.3
Jack
sonv
ille
Tran
spor
tatio
n A
utho
rity
10
,703
,555
11
,227
,845
54
,873
,285
62
,393
,143
5.
1 5.
6 15
.24
25.6
3 21
.7
21.8
Lake
Cou
nty
Publ
ic T
rans
p. (L
akeX
pres
s)
156,
972
232,
794
1,05
9,68
8 1,
198,
889
6.8
5.1
79.2
1 76
.67
13.8
13
.8La
kela
nd A
rea
Mas
s Tra
nsit
Dis
tric
t 1,
450,
988
1,45
9,42
9 7,
291,
873
7,33
6,28
7 5.
0 5.
0 34
.39
41.5
7 13
.8
13.9
Lee
Cou
nty T
rans
it
3,06
4,82
0 3,
035,
272
16,5
97,5
04
16,3
02,7
12
5.4
5.4
31.7
5 30
.67
17.1
17
.0LY
NX
Tra
nsit
23,9
30,1
56
24,9
70,2
96
142,
718,
751
139,
469,
224
6.0
5.6
17.9
5 20
.70
23.0
23
.0M
anat
ee C
ount
y A
rea T
rans
it 1,
403,
104
1,44
1,55
8 6,
621,
251
6,70
5,27
2 4.
7 4.
7 52
.86
52.0
9 16
.5
16.5
Cou
ncil
on A
ging
of M
artin
Cou
nty,
Inc.
11,3
61
4,62
6 83
,425
36
,813
7.
3 8.
0 64
.43
147.
86
9.8
9.8
Mia
mi-D
ade
Tran
sit
102,
573,
888
96,2
85,7
97
545,
980,
507
531,
009,
637
5.3
5.5
8.15
7.
47
24.0
24
.0O
kalo
osa
Cou
nty T
rans
it (T
he W
AVE)
17
2,12
2 16
2,82
0 82
5,17
5 79
6,19
0 4.
8 4.
9 57
.41
61.0
5 13
.0
13.0
Palm
Bea
ch C
ount
y Tra
nspo
rtat
ion
Age
ncy
10,0
45,3
45
10,3
43,5
31
50,7
15,2
80
56,7
42,4
13
5.0
5.5
30.5
4 33
.54
16.6
17
.8Pa
sco
Cou
nty
Publ
ic T
rans
port
atio
n 92
6,07
6 77
9,60
6 5,
860,
895
5,11
2,29
3 6.
3 6.
6 52
.68
52.7
9 15
.6
15.6
Pine
llas
Sunc
oast
Tra
nsit
Aut
hori
ty
11,9
53,0
82
12,8
11,8
35
61,7
25,5
95
66,5
90,8
97
5.2
5.2
22.3
3 22
.93
21.0
21
.0Po
lk C
ount
y Tra
nsit
Svcs
. Div.
& W
HAT
46
6,00
8 47
3,35
3 2,
333,
760
2,37
0,54
3 5.
0 5.
0 30
.18
62.2
8 13
.3
13.3
Sara
sota
Cou
nty
Are
a Tra
nsit
2,55
1,65
0 2,
733,
015
14,1
87,1
72
15,1
95,5
63
5.6
5.6
42.3
4 42
.57
20.0
19
.0Se
nior
Res
ourc
e A
ssoc
iatio
n (In
dian
Riv
er)
594,
128
707,
402
2,71
5,13
6 2,
899,
504
4.6
4.1
120.
03
73.7
2 11
.0
11.0
S. Fl
orid
a R
egio
nal T
rans
port
atio
n A
utho
rity
4,
711,
486
4,05
0,35
3 12
4,14
4,53
9 10
6,09
9,53
7 26
.3
26.2
12
.89
11.9
5 19
.1
19.6
Spac
e C
oast
Are
a Tra
nsit
1,55
1,03
0 1,
733,
519
13,5
92,7
80
14,3
46,3
66
8.8
8.3
19.9
5 18
.96
17.8
17
.8St
. Luc
ie C
ount
y C
ounc
il on
Agi
ng, I
nc.
118,
637
173,
250
977,
003
1,37
8,94
4 8.
2 8.
0 46
.59
43.3
6 11
.0
11.0
St. J
ohns
Cou
nty
(Sun
shin
e Bu
s)
137,
928
185,
863
1,01
1,01
2 1,
362,
376
7.3
7.3
28.7
4 43
.40
12.0
12
.0St
arM
etro
(Ta
llaha
ssee
) 4,
409,
041
4,76
2,23
3 12
,916
,425
13
,568
,341
2.
9 2.
9 20
.52
23.3
5 21
.8
17.3
Volu
sia
Cou
nty
dba V
OT
RA
N
3,18
4,20
5 3,
329,
232
18,3
53,9
10
18,6
82,7
73
5.8
5.6
27.0
6 27
.04
18.0
18
.0
Flor
ida
Tran
sit
Syst
em S
umm
ary
– 20
09 &
201
0 (c
onti
nued
)
The
dat
a sh
own
in t
his
tabl
e re
pres
ent
clos
ed-o
ut, v
alid
ated
num
bers
as
of S
epte
mbe
r 20
11. H
owev
er, i
t is
pos
sibl
e th
at s
ome
figur
es m
ay b
e up
date
d in
th
e su
bseq
uent
rep
ortin
g ye
ar.

42 Florida deparTmenT oF TransporTaTion
Syst
em
Ope
rati
ng E
xpen
se
Ope
rati
ng E
xpen
se
Ope
rati
ng R
even
ue
Pass
enge
r Tri
ps
per
Rev
enue
Mile
pe
r R
even
ue H
our
per
Ope
rati
ng E
xpen
se
per
Em
ploy
ee F
TE
*
20
09
2010
20
09
2010
20
09
2010
20
09
2010
Bay T
own
Trol
ley
$3.0
8 $3
.51
$49.
83
$56.
19
19.3
7%
20.9
9%
n/a
n/a
Brow
ard
Cou
nty T
rans
it $6
.17
$6.4
1 $8
4.78
$8
8.38
24
.75%
29
.15%
41
,187
37
,308
Col
lier A
rea T
rans
it
$4.0
6 $4
.46
$75.
30
$82.
60
19.5
9%
18.5
8%
n/a
n/a
Esca
mbi
a C
ount
y A
rea T
rans
it $5
.00
$4.8
7 $6
5.19
$6
9.38
17
.28%
20
.11%
12
,904
13
,324
Gai
nesv
ille
Reg
iona
l Tra
nsit
Syst
em
$5.8
8 $5
.94
$66.
63
$65.
19
61.2
7%
64.3
1%
41,1
71
40,5
74H
erna
ndo
Cou
nty
(Tra
nsH
erna
ndo
Expr
ess)
$4
.80
$5.0
7 $8
3.66
$8
9.36
6.
46%
13
.96%
n/
a n/
aH
illsb
orou
gh A
rea
Reg
iona
l Tra
nsit
$7.5
7 $7
.42
$100
.58
$97.
29
21.4
0%
22.4
3%
21,7
99
21,6
71Ja
ckso
nvill
e Tr
ansp
orta
tion
Aut
hori
ty
$6.5
6 $6
.49
$98.
63
$97.
30
17.2
3%
16.0
9%
17,2
14
17,3
88La
ke C
ount
y Pu
blic
Tra
nsp.
(Lak
eXpr
ess)
$5
.37
$4.2
1 $8
5.66
$6
9.71
12
.01%
15
.06%
n/
a n/
aLa
kela
nd A
rea
Mas
s Tra
nsit
Dis
tric
t $5
.58
$6.0
5 $8
9.16
$9
6.82
18
.50%
15
.91%
16
,199
15
,794
Lee
Cou
nty T
rans
it
$4.7
3 $4
.55
$79.
39
$79.
51
19.7
6%
20.6
9%
18,5
06
18,2
23LY
NX
Tra
nsit
$5.5
6 $5
.28
$80.
84
$78.
73
27.7
4%
31.0
0%
26,7
88
27,8
35M
anat
ee C
ount
y A
rea T
rans
it $5
.08
$5.1
5 $7
6.46
$7
8.69
14
.88%
15
.36%
19
,132
21
,172
Cou
ncil
on A
ging
of M
artin
Cou
nty,
Inc.
$6.5
5 $3
.50
$81.
70
$64.
42
2.49
%
1.36
%
3,01
1 1,
436
Mia
mi-D
ade
Tran
sit
$10.
31
$10.
10
$141
.04
$139
.14
23.5
3%
28.1
9%
29,5
28
29,1
62O
kalo
osa
Cou
nty T
rans
it (T
he W
AVE)
$2
.47
$2.9
7 $3
0.01
$3
4.81
10
.79%
10
.83%
n/
a n/
aPa
lm B
each
Cou
nty T
rans
port
atio
n A
genc
y $6
.94
$6.7
9 $1
17.2
2 $1
16.7
6 16
.94%
15
.77%
23
,587
24
,202
Pasc
o C
ount
y Pu
blic
Tra
nspo
rtat
ion
$3.6
7 $3
.56
$61.
46
$59.
68
16.0
5%
21.0
0%
17,3
50
15,5
61Pi
nella
s Su
ncoa
st T
rans
it A
utho
rity
$5
.87
$5.5
9 $8
4.02
$8
0.11
23
.65%
23
.09%
22
,509
23
,588
Polk
Cou
nty T
rans
it Sv
cs. D
iv. &
WH
AT
$3.3
4 $3
.31
$70.
59
$68.
89
10.0
9%
10.5
0%
9,97
5 11
,282
Sara
sota
Cou
nty
Are
a Tra
nsit
$4.3
6 $4
.65
$64.
24
$68.
25
9.23
%
8.84
%
17,2
66
18,2
19Se
nior
Res
ourc
e A
ssoc
iatio
n (In
dian
Riv
er)
$3.1
5 $2
.27
$35.
53
$33.
18
0.71
%
6.44
%
29,9
52
27,0
63S.
Flor
ida
Reg
iona
l Tra
nspo
rtat
ion
Aut
hori
ty
$16.
88
$16.
18
$422
.34
$386
.64
18.4
6%
19.5
8%
n/a
n/
a Sp
ace
Coa
st A
rea T
rans
it $2
.52
$2.4
8 $6
2.36
$6
1.34
16
.58%
17
.04%
25
,590
26
,327
St. L
ucie
Cou
nty
Cou
ncil
on A
ging
, Inc
. $4
.67
$4.6
1 $6
2.84
$6
2.37
6.
04%
5.
99%
6,
414
7,79
3St
. Joh
ns C
ount
y (S
unsh
ine
Bus)
$1
.54
$1.9
0 $3
0.32
$3
9.85
14
.31%
10
.41%
n/
a n/
aSt
arM
etro
(Ta
llaha
ssee
) $5
.34
$5.6
1 $5
7.74
$5
9.74
36
.69%
37
.14%
29
,386
31
,117
Volu
sia
Cou
nty
dba V
OT
RA
N
$3.7
9 $3
.87
$66.
83
$68.
87
22.9
7%
24.6
9%
23,9
68
24,1
70
*exc
lude
s pu
rcha
sed
tran
spor
tatio
n in
form
atio
n
Flor
ida
Tran
sit
Syst
em S
umm
ary
– 20
09 &
201
0 (c
onti
nued
)
The
dat
a sh
own
in t
his
tabl
e re
pres
ent
clos
ed-o
ut, v
alid
ated
num
bers
as
of S
epte
mbe
r 20
11. H
owev
er, i
t is
pos
sibl
e th
at s
ome
figur
es m
ay b
e up
date
d in
th
e su
bseq
uent
rep
ortin
g ye
ar.

43Florida TransiT Handbook 2011
O
pera
ting
Exp
ense
O
pera
ting
Exp
ense
O
pera
ting
Exp
ense
Fa
rebo
x R
ecov
ery
Ave
rage
Syst
em
per
Pass
enge
r Tri
p pe
r Pa
ssen
ger
Mile
pe
r C
apit
a R
atio
Fa
re
20
09
2010
20
09
2010
20
09
2010
20
09
2010
20
09
2010
Bay T
own
Trol
ley
$2.7
5 $3
.03
$0.5
6 $0
.61
$21.
55
$25.
73
17.7
6%
20.5
3%
$0.4
9 $0
.62
Brow
ard
Cou
nty T
rans
it $2
.59
$2.7
2 $0
.58
$0.5
8 $5
7.56
$5
9.45
23
.34%
25
.38%
$0
.60
$0.6
9C
ollie
r Are
a Tra
nsit
$4
.55
$5.1
6 $0
.56
$0.6
4 $1
5.16
$1
6.49
19
.11%
18
.58%
$0
.87
$0.9
6Es
cam
bia
Cou
nty
Are
a Tra
nsit
$6.0
1 $5
.86
$1.2
4 $1
.21
$22.
15
$21.
99
16.0
9%
18.0
1%
$0.9
7 $1
.06
Gai
nesv
ille
Reg
iona
l Tra
nsit
Syst
em
$1.8
5 $1
.78
$0.6
6 $0
.64
$109
.58
$110
.21
58.6
5%
61.5
2%
$1.0
9 $1
.09
Her
nand
o C
ount
y (T
rans
Her
nand
o Ex
pres
s)
$11.
33
$10.
68
$2.4
2 $1
.70
$8.8
7 $4
.50
5.58
%
6.95
%
$0.6
3 $0
.74
Hill
sbor
ough
Are
a R
egio
nal T
rans
it $4
.49
$4.6
5 $0
.91
$0.9
7 $7
5.00
$7
4.85
19
.83%
20
.12%
$0
.89
$0.9
3Ja
ckso
nvill
e Tr
ansp
orta
tion
Aut
hori
ty
$5.5
8 $5
.43
$1.0
9 $0
.98
$72.
15
$71.
40
14.3
7%
14.4
2%
$0.8
0 $0
.78
Lake
Cou
nty
Publ
ic T
rans
p. (L
akeX
pres
s)
$11.
37
$6.9
6 $1
.68
$1.3
5 $1
8.30
$1
6.62
5.
02%
6.
43%
$0
.57
$0.4
5La
kela
nd A
rea
Mas
s Tra
nsit
Dis
tric
t $4
.87
$5.2
8 $0
.97
$1.0
5 $6
4.22
$7
0.09
16
.67%
14
.86%
$0
.81
$0.7
9Le
e C
ount
y Tra
nsit
$4
.88
$4.8
6 $0
.90
$0.9
0 $3
3.60
$3
3.23
14
.87%
15
.34%
$0
.73
$0.7
5LY
NX
Tra
nsit
$3.5
7 $3
.33
$0.6
0 $0
.60
$47.
10
$46.
11
24.0
2%
25.6
1%
$0.8
6 $0
.85
Man
atee
Cou
nty
Are
a Tra
nsit
$4.7
4 $4
.75
$1.0
0 $1
.02
$64.
57
$66.
45
9.89
%
10.8
3%
$0.4
7 $0
.51
Cou
ncil
on A
ging
of M
artin
Cou
nty,
Inc.
$17.
78
$50.
91
$2.4
2 $6
.40
$1.4
6 $1
.71
2.43
%
1.15
%
$0.4
3 $0
.59
Mia
mi-D
ade
Tran
sit
$4.2
7 $4
.22
$0.8
0 $0
.77
$182
.29
$162
.58
21.6
9%
23.9
1%
$0.9
3 $1
.01
Oka
loos
a C
ount
y Tra
nsit
(The
WAV
E)
$6.3
9 $7
.43
$1.3
3 $1
.52
$6.4
5 $7
.09
9.38
%
8.73
%
$0.6
0 $0
.65
Palm
Bea
ch C
ount
y Tra
nspo
rtat
ion
Age
ncy
$4.7
7 $4
.57
$0.9
4 $0
.83
$48.
75
$48.
05
14.2
4%
13.6
6%
$0.6
8 $0
.62
Pasc
o C
ount
y Pu
blic
Tra
nspo
rtat
ion
$4.4
1 $4
.97
$0.7
0 $0
.76
$8.8
3 $8
.22
16.0
5%
21.0
0%
$0.7
1 $1
.04
Pine
llas
Sunc
oast
Tra
nsit
Aut
hori
ty
$4.3
0 $3
.93
$0.8
3 $0
.76
$58.
16
$57.
77
22.4
1%
21.8
6%
$0.9
6 $0
.86
Polk
Cou
nty T
rans
it Sv
cs. D
iv. &
WH
AT
$5.3
0 $5
.07
$1.0
6 $1
.01
$16.
04
$15.
59
10.0
9%
10.5
0%
$0.5
3 $0
.53
Sara
sota
Cou
nty
Are
a Tra
nsit
$4.7
6 $4
.76
$0.8
6 $0
.86
$30.
47
$33.
01
7.71
%
8.23
%
$0.3
7 $0
.39
Seni
or R
esou
rce
Ass
ocia
tion
(Indi
an R
iver
) $1
.94
$1.8
1 $0
.42
$0.4
4 $1
0.73
$1
0.94
n/
a n/
a $0
.00
$0.0
0S.
Flor
ida
Reg
iona
l Tra
nspo
rtat
ion
Aut
hori
ty
$12.
15
$13.
46
$0.4
6 $0
.51
$10.
50
$10.
00
17.0
3%
18.8
8%
$2.0
7 $2
.54
Spac
e C
oast
Are
a Tra
nsit
$4.0
2 $3
.65
$0.4
6 $0
.44
$11.
24
$11.
41
15.5
9%
16.0
6%
$0.6
3 $0
.59
St. L
ucie
Cou
nty
Cou
ncil
on A
ging
, Inc
. $1
0.07
$8
.95
$1.2
2 $1
.12
$4.5
1 $5
.82
5.72
%
5.99
%
$0.5
8 $0
.54
St. J
ohns
Cou
nty
(Sun
shin
e Bu
s)
$3.8
9 $4
.68
$0.5
3 $0
.64
$3.5
9 $5
.83
14.3
1%
10.4
1%
$0.5
6 $0
.49
Star
Met
ro (
Talla
hass
ee)
$2.3
8 $2
.33
$0.8
1 $0
.80
$64.
69
$68.
45
36.1
3%
36.4
8%
$0.8
6 $0
.85
Volu
sia
Cou
nty
dba V
OT
RA
N
$3.5
7 $3
.51
$0.6
2 $0
.63
$24.
27
$24.
92
19.9
2%
21.4
9%
$0.7
1 $0
.75
Flor
ida
Tran
sit
Syst
em S
umm
ary
– 20
09 &
201
0 (c
onti
nued
)
The
dat
a sh
own
in t
his
tabl
e re
pres
ent
clos
ed-o
ut, v
alid
ated
num
bers
as
of S
epte
mbe
r 20
11. H
owev
er, i
t is
pos
sibl
e th
at s
ome
figur
es m
ay b
e up
date
d in
th
e su
bseq
uent
rep
ortin
g ye
ar.
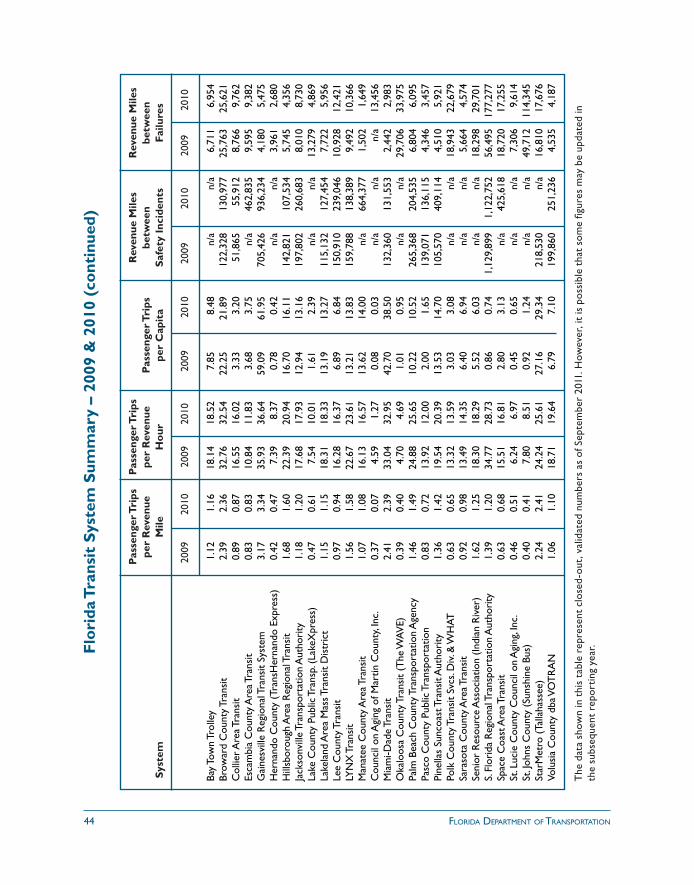
44 Florida deparTmenT oF TransporTaTion
Pa
ssen
ger T
rips
Pa
ssen
ger T
rips
Rev
enue
Mile
s R
even
ue M
iles
pe
r R
even
ue
per
Rev
enue
Pa
ssen
ger T
rips
be
twee
n be
twee
n Sy
stem
M
ile
Hou
r pe
r C
apit
a Sa
fety
Inci
dent
s Fa
ilure
s
20
09
2010
20
09
2010
20
09
2010
20
09
2010
20
09
2010
Bay T
own
Trol
ley
1.12
1.
16
18.1
4 18
.52
7.85
8.
48
n/a
n/a
6,71
1 6,
954
Brow
ard
Cou
nty T
rans
it 2.
39
2.36
32
.76
32.5
4 22
.25
21.8
9 12
2,32
8 13
0,97
7 25
,763
25
,621
Col
lier A
rea T
rans
it
0.89
0.
87
16.5
5 16
.02
3.33
3.
20
51,8
65
55,9
12
8,76
6 9,
762
Esca
mbi
a C
ount
y A
rea T
rans
it 0.
83
0.83
10
.84
11.8
3 3.
68
3.75
n/
a 46
2,83
5 9,
595
9,38
2G
aine
svill
e R
egio
nal T
rans
it Sy
stem
3.
17
3.34
35
.93
36.6
4 59
.09
61.9
5 70
5,42
6 93
6,23
4 4,
180
5,47
5H
erna
ndo
Cou
nty
(Tra
nsH
erna
ndo
Expr
ess)
0.
42
0.47
7.
39
8.37
0.
78
0.42
n/
a n/
a 3,
961
2,68
0H
illsb
orou
gh A
rea
Reg
iona
l Tra
nsit
1.68
1.
60
22.3
9 20
.94
16.7
0 16
.11
142,
821
107,
534
5,74
5 4,
356
Jack
sonv
ille
Tran
spor
tatio
n A
utho
rity
1.
18
1.20
17
.68
17.9
3 12
.94
13.1
6 19
7,80
2 26
0,68
3 8,
010
8,73
0La
ke C
ount
y Pu
blic
Tra
nsp.
(Lak
eXpr
ess)
0.
47
0.61
7.
54
10.0
1 1.
61
2.39
n/
a n/
a 13
,279
4,
869
Lake
land
Are
a M
ass T
rans
it D
istr
ict
1.15
1.
15
18.3
1 18
.33
13.1
9 13
.27
115,
132
127,
454
7,72
2 5,
956
Lee
Cou
nty T
rans
it
0.97
0.
94
16.2
8 16
.37
6.89
6.
84
150,
910
239,
046
10,9
28
12,4
21LY
NX
Tra
nsit
1.56
1.
58
22.6
7 23
.61
13.2
1 13
.83
159,
788
138,
389
9,49
2 10
,366
Man
atee
Cou
nty
Are
a Tra
nsit
1.07
1.
08
16.1
3 16
.57
13.6
2 14
.00
n/a
664,
377
1,50
2 1,
649
Cou
ncil
on A
ging
of M
artin
Cou
nty,
Inc.
0.37
0.
07
4.59
1.
27
0.08
0.
03
n/a
n/a
n/a
13,4
56M
iam
i-Dad
e Tr
ansi
t 2.
41
2.39
33
.04
32.9
5 42
.70
38.5
0 13
2,36
0 13
1,55
3 2,
442
2,98
3O
kalo
osa
Cou
nty T
rans
it (T
he W
AVE)
0.
39
0.40
4.
70
4.69
1.
01
0.95
n/
a n/
a 29
,706
33
,975
Palm
Bea
ch C
ount
y Tra
nspo
rtat
ion
Age
ncy
1.46
1.
49
24.8
8 25
.65
10.2
2 10
.52
265,
368
204,
535
6,80
4 6,
095
Pasc
o C
ount
y Pu
blic
Tra
nspo
rtat
ion
0.83
0.
72
13.9
2 12
.00
2.00
1.
65
139,
071
136,
115
4,34
6 3,
457
Pine
llas
Sunc
oast
Tra
nsit
Aut
hori
ty
1.36
1.
42
19.5
4 20
.39
13.5
3 14
.70
105,
570
409,
114
4,51
0 5,
921
Polk
Cou
nty T
rans
it Sv
cs. D
iv. &
WH
AT
0.63
0.
65
13.3
2 13
.59
3.03
3.
08
n/a
n/a
18,9
43
22,6
79Sa
raso
ta C
ount
y A
rea T
rans
it 0.
92
0.98
13
.49
14.3
5 6.
40
6.94
n/
a n/
a 5,
664
4,57
4Se
nior
Res
ourc
e A
ssoc
iatio
n (In
dian
Riv
er)
1.62
1.
25
18.3
0 18
.29
5.52
6.
03
n/a
n/a
18,2
98
29,7
01S.
Flor
ida
Reg
iona
l Tra
nspo
rtat
ion
Aut
hori
ty
1.39
1.
20
34.7
7 28
.73
0.86
0.
74
1,12
9,89
9 1,
122,
752
56,4
95
177,
277
Spac
e C
oast
Are
a Tra
nsit
0.63
0.
68
15.5
1 16
.81
2.80
3.
13
n/a
425,
618
18,7
20
17,2
55St
. Luc
ie C
ount
y C
ounc
il on
Agi
ng, I
nc.
0.46
0.
51
6.24
6.
97
0.45
0.
65
n/a
n/a
7,30
6 9,
614
St. J
ohns
Cou
nty
(Sun
shin
e Bu
s)
0.40
0.
41
7.80
8.
51
0.92
1.
24
n/a
n/a
49,7
12
114,
345
Star
Met
ro (
Talla
hass
ee)
2.24
2.
41
24.2
4 25
.61
27.1
6 29
.34
218,
530
n/a
16,8
10
17,6
76Vo
lusi
a C
ount
y db
a VO
TR
AN
1.
06
1.10
18
.71
19.6
4 6.
79
7.10
19
9,86
0 25
1,23
6 4,
535
4,18
7
Flor
ida
Tran
sit
Syst
em S
umm
ary
– 20
09 &
201
0 (c
onti
nued
)
The
dat
a sh
own
in t
his
tabl
e re
pres
ent
clos
ed-o
ut, v
alid
ated
num
bers
as
of S
epte
mbe
r 20
11. H
owev
er, i
t is
pos
sibl
e th
at s
ome
figur
es m
ay b
e up
date
d in
th
e su
bseq
uent
rep
ortin
g ye
ar.

45Florida TransiT Handbook 2011
Syst
em
Cas
h Fa
re
Exp
ress
Far
e Tr
ansf
er F
are
Dai
ly F
are
Wee
kly
Pass
M
onth
ly P
ass
R
egul
ar
Dis
coun
t R
egul
ar
Dis
coun
t R
egul
ar
Dis
coun
t R
egul
ar
Dis
coun
t R
egul
ar
Dis
coun
t R
egul
ar
Dis
coun
t
Bay T
own
Trol
ley
$1.5
0
$0.7
5
n/a
n/a
FREE
FR
EE
$3.0
0
n/a
n/a
n/a
$25.
00
n/a
Brow
ard
Cou
nty T
rans
it $1
.75
$0
.85
$2
.35
$1
.15
va
ries
n/
a $4
.00
$3
.00
$1
6.00
n/
a $5
8.00
$2
9.00
C
ollie
r Are
a Tra
nsit
$1.5
0
$0.7
5
$2.5
0
$1.2
5
$0.7
5
$0.3
5
$4.0
0
$2.0
0
$15.
00
$7.5
0
$35.
00
$17.
50
Esca
mbi
a C
ount
y A
rea T
rans
it $1
.75
$0
.85
n/
a n/
a FR
EE
n/a
$5.2
5
n/a
$14.
50
n/a
$47.
00
$35.
00
Gai
nesv
ille
Reg
iona
l Tra
nsit
Syst
em
$1.5
0
$0.7
5
n/a
n/a
n/a
n/a
$3.0
0
n/a
n/a
n/a
$35.
00
$17.
50
Her
nand
o C
ount
y (T
rans
Her
nand
o Ex
pres
s)
$1.2
5
$0.6
0
n/a
n/a
$0.5
0
n/a
n/a
n/a
n/a
n/a
$25.
00
$12.
50
Hill
sbor
ough
Are
a R
egio
nal T
rans
it $1
.75
$0
.85
$2
.75
$1
.35
n/
a n/
a $3
.75
$1
.85
n/
a n/
a $6
0.00
$3
0.00
Se
nior
Res
ourc
e A
ssoc
iatio
n n/
a n/
a n/
a n/
a n/
a n/
a n/
a n/
a n/
a n/
a n/
a n/
aJa
ckso
nvill
e Tr
ansp
orta
tion
Aut
hori
ty
$1.0
0
$0.2
5*
$1.5
0
n/a
n/a
n/a
n/a
n/a
$12.
00
n/a
$40.
00
n/a
Lake
Cou
nty T
rans
it $1
.00
$0
.50
n/
a n/
a FR
EE
n/a
n/a
n/a
$15.
00
n/a
$35.
00
n/a
Lake
land
Are
a M
ass T
rans
it D
istr
ict
$1.5
0
$0.8
0
n/a
n/a
FREE
n/
a n/
a n/
a $1
2.00
n/
a $4
7.00
n/
aLe
e C
ount
y Tra
nsit
$1.2
5
$0.6
0
n/a
n/a
n/a
n/a
$3.5
0
n/a
$12.
50
$10.
00
$35.
00
$20.
00
LYN
X T
rans
it $2
.00
$1
.00
$3
.50
$1
.75
FR
EE
n/a
$4.5
0
$2.2
5
$16.
00
$8.0
0
$50.
00
$25.
00
Man
atee
Cou
nty
Are
a Tra
nsit
$1.2
5
$0.6
0
n/a
n/a
$0.2
5
n/a
$3.0
0
$1.5
0
$15.
00
$7.5
0
$30.
00
$15.
00
Cou
ncil
on A
ging
of M
artin
Cou
nty,
Inc.
FREE
n/
a n/
a n/
a n/
a n/
a n/
a n/
a n/
a n/
a n/
a n/
aM
iam
i-Dad
e Tr
ansi
t $2
.00
$1
.00*
$2
.35
$1
.15
va
ries
va
ries
$5
.00
$2
.50
$2
6.00
$1
3.00
$1
00.0
0
$50.
00
Oka
loos
a C
ount
y Tra
nsit
(The
WAV
E)
$1.0
0
$0.2
5
$1.5
0
$0.7
5
$0.2
5
n/a
n/a
n/a
n/a
n/a
$26.
00
$7.5
0 Pa
lm B
each
Cou
nty T
rans
port
atio
n A
genc
y $1
.50
$0
.75
$2
.00
n/
a $0
.50
n/
a $4
.00
$2
.75
n/
a n/
a $6
0.00
$4
5.00
Pa
sco
Cou
nty
Publ
ic T
rans
port
atio
n $1
.50
$0
.75
n/
a n/
a n/
a n/
a $3
.75
$1
.85
n/
a n/
a $3
7.50
$1
8.75
Pi
nella
s Su
ncoa
st T
rans
it A
utho
rity
$2
.00
$1
.00
$3
.00
$1
.50
n/
a n/
a $4
.50
$2
.25
$2
0.00
n/
a $6
5.00
$3
5.00
Po
lk C
ount
y Tra
nsit
Serv
s. D
iv. &
WH
AT
$1.5
0 $0
.80
n/
a n/
a n/
a n/
a n/
a n/
a n/
a n/
a n/
a n/
aSt
. Joh
ns C
ount
y (S
unsh
ine
Bus)
$1
.00
$0.5
0
n/a
n/a
n/a
n/a
$3.0
0
$1.5
0
n/a
n/a
$25.
00
$12.
50
St. L
ucie
Cou
ncil
on A
ging
, Inc
. $2
.00
$1.0
0
n/a
n/a
n/a
n/a
$5.0
0
$2.5
0
n/a
n/a
$50.
00
$25.
00
Sara
sota
Cou
nty
Are
a Tra
nsit
$0.7
5 $0
.35
n/
a n/
a n/
a n/
a $3
.00
n/
a $1
5.00
$7
.50
$40.
00
$20.
00
Spac
e C
oast
Are
a Tra
nsit
$1.2
5 $0
.60
n/
a n/
a n/
a n/
a n/
a n/
a n/
a n/
a $3
5.00
$1
7.00
St
arM
etro
(Ta
llaha
ssee
) $1
.25
$0.6
0
n/a
n/a
FREE
n/
a $3
.00
n/
a $1
0.00
$7
.50
$4
1.00
n/
aSu
nTra
n (O
cala
/Mar
ion
MPO
) $1
.50
$0.7
5
n/a
n/a
n/a
n/a
n/a
n/a
n/a
n/a
$45.
00
$23.
00
Volu
sia
Cou
nty
dba V
OT
RA
N
$1.2
5 $0
.60
$3
.50
$1
.75
n/
a n/
a $3
.00
$1
.50
$1
2.00
$6
.00
$4
0.00
$2
0.00
S. Fl
orid
a R
egio
nal T
rans
port
atio
n A
utho
rity
Tieredfaresystemrangingfrom$2.50-$6.90forone-waytrips,dependingonnum
berofzonestraveled.
$100
.00
$50.
00 *
In M
iam
i, th
ose
age
65 a
nd o
ver
can
ride
free
with
a G
olde
n Pa
sspo
rt. A
lso,
in Ja
ckso
nvill
e, s
enio
rs a
ge 6
0 an
d ov
er r
ide
free
.
Flor
ida
Tran
sit
Syst
ems’
Mot
orbu
s Fa
res
(as
of A
ugus
t 20
11)

46 Florida deparTmenT oF TransporTaTion
Glossary of TermsAutomated Guideway - A fixed-guideway transit system that operates with automated (driverless) individual vehicles or multi-car trains. Service may be on a fixed schedule or in response to a passenger-activated call button.
Commuter Rail - Short-haul rail passenger service operating in metropolitan and suburban areas, whether within or across the geographical boundaries of a state, usually characterized by reduced fare, multiple ride, and commutation tickets and by morning and evening peak period operations.
Demand-Response Service - Any system of transporting individuals, including the provision of designated transportation service by public or private entities, which is not a fixed-route system. This type of service is also known as “paratransit.”
Fixed Guideway - Any public transportation facility that utilizes and occupies a separate right-of-way or rails for the exclusive use of public transportation service including, but not limited to, fixed rail, automated guideway transit, and exclusive facilities for buses and other high-occupancy vehicles.
Heavy Rail - Transit service using rail cars with motive capability, driven by electric power usually drawn from a third rail, configured for passenger traffic, and usually operated on exclusive rights-of-way.
Motorbus - Mode of service involving passenger revenue vehicles operating on fixed routes and schedules on roadways.
Park-and-Ride - Parking garages and/or pavement used for parking passengers’ automobiles, either free or for a fee, while they use transit system facilities. The garages/lots are generally used as collector sites for rail or bus service. They may also serve as collector sites for vanpools or carpools, and may sometimes serve as transit centers.
Purchased Transportation - Transportation service provided to a public agency from a public or private transportation provider based on a written contract. It does not include franchising, licensing operations, management services, or private conventional bus service.
Vanpool - A transit mode comprised of vans, small buses and other vehicles operating as a ride sharing ar-rangement, providing transportation to a group of individuals traveling directly between their homes and a regular destination within the same geographical area. The vehicles have a minimum seating capacity of seven persons, including the driver.
GENERALINFORMATIONOperating Expense - Reported total spending on operations, including administration, maintenance, and operation of service vehicles.
Operating Revenue - All revenues generated through the operation of the transit agency. Includes passenger fares, special transit fares, school bus service revenues, freight tariffs, charter service revenues, auxiliary transportation revenues, subsidy from other sectors of operations, and non-transportation revenues.
Service Area Population - This indicator provides a suitable approximation of overall market size for com-parison of relative spending and service levels among communities in the absence of actual service area population.
Service Area Population Density - Represents persons per square mile based on the service area population and service area size reported in the National Transit Database.
SERVICESUPPLIEDPeak Vehicles - This refers to the number of vehicles operated in maximum (peak) service. It represents the number of revenue vehicles operated to meet the annual maximum service requirement, i.e., the revenue

47Florida TransiT Handbook 2011
vehicle count during the peak hours of the peak days/weeks of the peak season (typically the rush period). Vehicles operated in maximum service exclude atypical days or one-time special events.
Route Miles - Number of directional route miles as reported in NTD data; defined as the mileage that service operates in each direction over routes traveled by public transportation vehicles in revenue service.
Total Annual Revenue Hours - Total hours of operation by revenue service vehicles in active revenue ser-vice.
Total Annual Revenue Miles - Number of annual miles of vehicle operation while in active service (avail-able to pick up revenue passengers). This number is smaller than vehicle miles because of the exclusion of deadhead miles such as vehicle miles from the garage to the start of service, vehicle miles from the end of service to the garage, driver training, and other miscellaneous miles that are not considered to be in direct revenue service.
Total Revenue Vehicles - Number of vehicles available for use by the transit agency to meet the annual maximum service requirement. Total revenue vehicles includes spares, out-of-service vehicles, and vehicles in or awaiting maintenance, but excludes vehicles awaiting sale and emergency contingency vehicles.
SERVICEUSAGEAnnual Passenger Miles - Number of annual passenger trips multiplied by the system’s average trip length (in miles). This number provides a measure of the total number of passenger miles of transportation service consumed, and is typically derived based on sampling.
Annual Passenger Trips - Annual number of passenger boardings on the transit vehicles. A trip is counted each time a passenger boards a transit vehicle. Thus, if a passenger has to transfer between buses to reach a destination, he/she is counted as making two passenger trips.
Average Trip Length - Annual passenger miles divided by annual passenger trips.
QUALITYOFSERVICEAverage Headway - This measure is computed in minutes for the system as a whole using the following data: directional route miles, revenue miles, revenue hours, and the number of vehicles operated in maxi-mum service (peak vehicles). The route mileage figure is divided by the system’s calculated average speed (revenue miles per revenue hour) to produce an estimate of the time it would take, in hours, to traverse all the system’s total route miles. Finally, this time figure is divided by the system’s number of peak vehicles (then multiplied by 60 to convert time in hours to minutes) to determine the number of minutes it takes for a vehicle to complete its portion of the total route miles one time.
Weekday Span of Service - The number of hours that transit service is provided on a representative weekday in the operation of the transit agency. This indicator is determined by computing the number of hours between the values reported in the NTD for average weekday time service begins and time service ends. For transit agen-cies with more than one mode, the system total span of service takes into account the hours of operation for all modes and reports the span of hours that any transit service is provided on a typical weekday.
COSTEFFICIENCYOperating Expense Per Revenue Hour - Operating expense divided by total annual revenue hours; a key comparative measure which factors out vehicle speed. This is often important because vehicle speed is strongly influenced by local traffic conditions.
Operating Expense Per Revenue Mile - Operating expense divided by total annual revenue miles; a measure of the efficiency with which service is delivered and is another key comparative indicator.
Operating Revenue Per Operating Expense - Ratio of revenue generated through operation of the transit agency with respect to total operating expense.

48 Florida deparTmenT oF TransporTaTion
Passenger Trips Per Employee FTE - Ratio of total passenger trips to system total full-time equivalents. Another measure of overall labor productivity.
Total Employee FTEs - Total number of payroll employees of the transit agency in terms of full-time equiva-lents (FTEs). All employees classified as capital are not included in this Handbook.
COSTEFFECTIVENESSAverage Fare - Passenger fare revenues divided by the total number of passenger trips.
Farebox Recovery Ratio - Ratio of passenger fares to total operating expenses; an indicator of the share of total operating costs that is covered by the passengers’ fares.
Operating Expense Per Capita - Annual operating budget divided by the service area population; a measure of the resource commitment to transit by the community.
Operating Expense Per Passenger Mile - Operating expense divided by the number of passenger miles; takes into account the impact of trip length on performance because some operators provide lengthy trips while others provide mainly shorter trips.
Operating Expense Per Passenger Trip - Operating expenditures divided by the total annual ridership; a measure of the efficiency of transporting riders; one of the key indicators of comparative performance of transit properties since it reflects both the efficiency with which service is delivered and the market demands for the service.
Passenger Fare Revenue - Revenue generated annually from carrying passengers in regularly scheduled service.
SERVICEEFFECTIVENESSPassenger Trips Per Capita - Average number of transit boardings per person per year. This number is larger in areas where public transportation is emphasized and in areas where there are more transit dependent persons, and is a measure of the extent to which the public utilizes transit in a given service area.
Passenger Trips Per Revenue Hour - The ratio of annual passenger trips to total annual revenue hours of operation; reports on the effectiveness of the service because hours are generally a better representation of the resources consumed in providing service.
Passenger Trips Per Revenue Mile - The ratio of annual passenger trips to total annual revenue miles of service; a key indicator of service effectiveness that is influenced by the levels of demand and the supply of service provided.
Revenue Miles Between Failures - Number of total annual revenue miles divided by the number of revenue vehicle system failures; an indicator of the average frequency of delays because of a problem with the equipment.
Revenue Miles Between Safety Incidents - Number of total annual revenue miles divided by the number of incidents; reports the average interval, in miles, between incidents.
Revenue Vehicle System Failures - Total number of failures that occur during revenue service, deadheading, and layovers. A failure is classified as the breakdown of either a major or minor element of the revenue vehicle’s mechanical system. Failures are tabulated regardless of whether they result in a vehicle completing or not completing its trip.
Center for Urban Transportation ResearchCollege of Engineering, University of South Florida
4202 East Fowler Avenue, CUT100, Tampa, FL 33620-5375(813) 974-3120 l Fax (813) 974-5168 l www.cutr.usf.edu