Public Service Commission of West Virginia Service Commission of West Virginia ... Public Service...
49
Public Service Commission of West Virginia Supply-Demand Forecast For Electric Utilities 2012-2021 Chairman Michael A. Albert Commissioner Jon W. McKinney Commissioner Ryan B. Palmer Submitted January 2012 201 Brooks Street P.O. Box 812 Charleston, WV 25323 1-800-344-5113 www.psc.state.wv.us Governor Earl Ray Tomblin
Transcript of Public Service Commission of West Virginia Service Commission of West Virginia ... Public Service...

Public Service Commission
of West Virginia
Supply-Demand Forecast For Electric Utilities
2012-2021
Chairman Michael A. Albert Commissioner Jon W. McKinney
Commissioner Ryan B. Palmer
Submitted
January 2012
201 Brooks Street P.O. Box 812
Charleston, WV 25323
1-800-344-5113
www.psc.state.wv.us
Governor
Earl Ray Tomblin
Supply – Demand Forecast for Electric Utilities in West Virginia
2012 – 2021
Table of Contents
Executive Summary ..................................................................................................... 1
Forecast Procedure ...................................................................................................... 4
Regional Projections .................................................................................................... 5
Reliability First Corporation ..................................................................................... 6
Companies .................................................................................................................... 9
American Electric Power Company ......................................................................... 9
Appalachian Power Company ....................................................................... 9
Wheeling Power Company ......................................................................... 10
FirstEnergy Corporation ......................................................................................... 10
Monongahela Power Company ................................................................... 10
Potomac Edison Company .......................................................................... 11
Forecasting ............................................................................................................. 12
AEP Forecasting ........................................................................................ 12
AEP Projected Summer Peak Demand ....................................................... 13
APCo Projected Winter Peak Demand ....................................................... 13
FE Forecasting ............................................................................................ 14
Mon Power and PE Projected Winter Peak Demand ................................. 15
Mon Power Projected Winter Peak Demand ............................................. 16
PE Projected Winter Peak Demand ............................................................ 16
Reserve Margins Planning and Projections .......................................................... 17
AEP Capacity Planning .............................................................................. 17
APCo Reserve Margin ............................................................................... 17
AEP Capacity Plan ...................................................................................... 18
AEP East Reserve Margin Projections ...................................................... 19
FE Capacity Planning ................................................................................ 20
FE Planning Philosophy .............................................................................. 20
FE Projected Supply Side Resources .......................................................... 21
FE Projected Demand Side Resources ....................................................... 21
FE Reserve Margin Projections ................................................................... 23

ii
Table of Contents - Continued
Comments Received from AEP and FE Regarding
Potential Threats to Reliability .......................................................................... 23
AEP Restructuring of the Electric Industry ................................................ 23
AEP Environmental Issues ......................................................................... 23
AEP Aging Generation Units ..................................................................... 26
AEP Loss of Interruptible Load .................................................................. 26
AEP Transmission Issues ............................................................................ 26
FE Environmental Issues ............................................................................ 27
FE Global Climate Change .......................................................................... 27
FE Clean Air Act Compliance .................................................................... 27
FE Aging Generation Units ........................................................................ 28
Appendixes ................................................................................................................. 36
Appendix A: List of Maps, Tables and Charts ..................................................... 36
Appendix B: Existing Plants and Summaries of Interchanges .............................. 36
Public Service Commission – Supply-Demand Forecast for Electric Utilities 2012-2021
Executive Summary
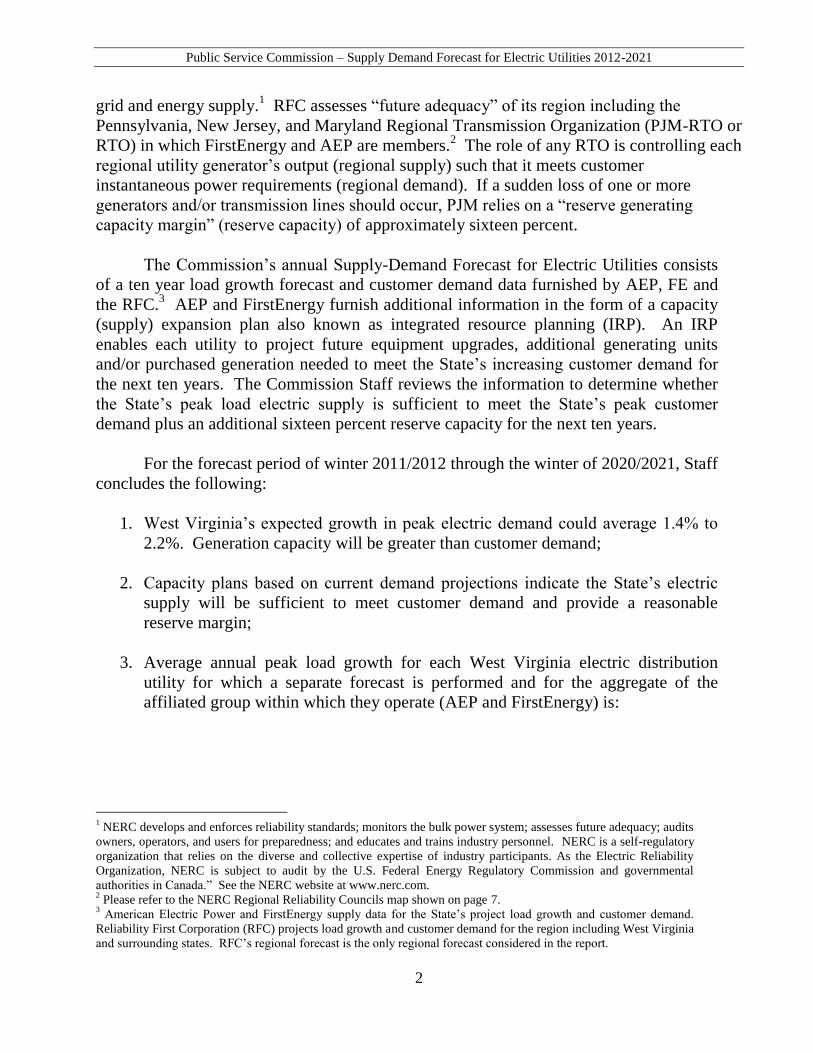
The sixty-fourth Legislature (1979) directed the Public Service Commission of
West Virginia (Commission) to make an annual report to the Legislature on the status of
the supply and demand balance for the next ten years for the electric utilities in West
Virginia (W. Va. Code § 24-1-1(d)(3)). Pursuant to that requirement, the Commission
Staff conducts a yearly examination of major forecasting methodologies presently in use
by each of the major electric utilities in West Virginia.
The four largest regulated electric utilities in West Virginia are: Appalachian
Power Company (APCo), Monongahela Power Company (Mon Power), The Potomac
Edison Company (PE), and Wheeling Power Company (WPCo). APCo and WPCo are
sister companies in American Electric Power (AEP). Mon Power and the PE Company
are sister companies in FirstEnergy (FE). APCo and Mon Power are the State’s only
regulated electric distribution utilities that generate power. These four utilities account
for approximately 96% of total West Virginia residential sales and 98% of total West
Virginia commercial and industrial sales. Although WPCo and PE do not generate
electricity, they are combined with their respective sister companies, APCo and Mon
Power, for West Virginia ratemaking purposes. Thus, for purposes of this report,
APCo/WPCo are paired and treated as generation companies, as are Mon Power/PE.
Currently, there are five independent non-generation electric utilities purchasing
power at wholesale that distribute purchased power to local residential, commercial and
industrial customers at retail rates subject to Commission jurisdiction. Those are:
1. Harrison Rural Electrification Association
2. Black Diamond Power Company
3. Craig-Botetourt Electric Cooperative
4. New Martinsville Municipal Utilities
5. Philippi Municipal Electric
The net demand of each reselling company is reflected in the demand projection of
its wholesale power provider.
In addition to the major utilities’ supply and demand forecasts, the Commission Staff
also considers the regional utility forecasts conducted by Reliability First Corporation (RFC).
RFC is a member of the North American Electric Reliability Corporation (NERC). One of
NERC’s many responsibilities is assessing future adequacy of North America’s transmission
Public Service Commission – Supply Demand Forecast for Electric Utilities 2012-2021
2
grid and energy supply.1 RFC assesses “future adequacy” of its region including the
Pennsylvania, New Jersey, and Maryland Regional Transmission Organization (PJM-RTO or
RTO) in which FirstEnergy and AEP are members.2 The role of any RTO is controlling each
regional utility generator’s output (regional supply) such that it meets customer
instantaneous power requirements (regional demand). If a sudden loss of one or more
generators and/or transmission lines should occur, PJM relies on a “reserve generating
capacity margin” (reserve capacity) of approximately sixteen percent.
The Commission’s annual Supply-Demand Forecast for Electric Utilities consists
of a ten year load growth forecast and customer demand data furnished by AEP, FE and
the RFC.3 AEP and FirstEnergy furnish additional information in the form of a capacity
(supply) expansion plan also known as integrated resource planning (IRP). An IRP
enables each utility to project future equipment upgrades, additional generating units
and/or purchased generation needed to meet the State’s increasing customer demand for
the next ten years. The Commission Staff reviews the information to determine whether
the State’s peak load electric supply is sufficient to meet the State’s peak customer
demand plus an additional sixteen percent reserve capacity for the next ten years.
For the forecast period of winter 2011/2012 through the winter of 2020/2021, Staff
concludes the following:
1. West Virginia’s expected growth in peak electric demand could average 1.4% to
2.2%. Generation capacity will be greater than customer demand;
2. Capacity plans based on current demand projections indicate the State’s electric
supply will be sufficient to meet customer demand and provide a reasonable
reserve margin;
3. Average annual peak load growth for each West Virginia electric distribution
utility for which a separate forecast is performed and for the aggregate of the
affiliated group within which they operate (AEP and FirstEnergy) is:
1 NERC develops and enforces reliability standards; monitors the bulk power system; assesses future adequacy; audits
owners, operators, and users for preparedness; and educates and trains industry personnel. NERC is a self-regulatory
organization that relies on the diverse and collective expertise of industry participants. As the Electric Reliability
Organization, NERC is subject to audit by the U.S. Federal Energy Regulatory Commission and governmental
authorities in Canada.” See the NERC website at www.nerc.com. 2 Please refer to the NERC Regional Reliability Councils map shown on page 7.
3 American Electric Power and FirstEnergy supply data for the State’s project load growth and customer demand.
Reliability First Corporation (RFC) projects load growth and customer demand for the region including West Virginia
and surrounding states. RFC’s regional forecast is the only regional forecast considered in the report.

Public Service Commission – Supply Demand Forecast for Electric Utilities 2012-2021
3
Utility
Appalachian Power Company 0.5%
Wheeling Power Company 0.3%
American Electric Power - aggregate 0.2%
Monongahela Power 1.7%
The Potomac Edison Company 2.2%
FirstEnergy – aggregate 1.5%
4. AEP developed a generation expansion plan consisting of new generation sources
added within the forecast period. Additional new generation resources up to 1,419
MW may be possible for 2012 through 2021. Current projections indicate AEP’s
expansion plan will assist in maintaining PJM’s reserve capacity margin;
5. Mon Power’s capacity purchases continue to increase substantially during the
forecast period. This is due to the anticipated reliance on the deregulated power
market to maintain sufficient Reserve Margins as well as being a participating
member of the RTO. Continued reliance on power markets to provide firm
capacity assumes that capacity will be available from a market source;
6. APCo has made significant investments in emission control equipment responding
to requirements under the Clean Air Act (CAA), CAA Amendments, the United
States Environmental Protection Agency’s Nitrogen Oxides State Implementation
Plan (NOx SIP Call) and the Clean Air Interstate Rule (CAIR). Newly established
and proposed environmental regulations continue to expand the scope and increase
the stringency of applicable requirements. These programs will require
AEP/APCo to make additional capital investments and operational changes to
comply with more stringent air emissions, ash disposal, cooling water intake, and
wastewater discharge requirements. The development and implementation of a
comprehensive compliance plan is an iterative process that is driven by the
stringency and implementation schedule of new regulatory programs, as well as by
consideration of available compliance strategies such as the addition of emission
controls, fuel-switching, and unit retirement options. Site-specific variables, such
as the age, location, and type of unit, are also important factors considered in
compliance planning. The impact of the emission control requirements on APCo’s
supply and demand balance has been, and will continue to be, significant.

Public Service Commission – Supply Demand Forecast for Electric Utilities 2012-2021
4
Forecast Procedure
The procedure for determining a ten-year supply and demand forecast is
comprised of two basic steps. Step one is collecting data on historical electric peaks,
economic conditions and weather conditions. Additionally, utilities provide forecasts of
future electrical requirements and recommendations for the narrative parts of this report.
Since all four companies use econometric forecasting models requiring explicit economic
and demographic assumptions, an evaluation of the appropriateness of some of the
models’ assumed values is also made. However, data provided by private forecasting
services precluded independent verification of some input variables.
Step two of the forecast procedure involves examination of the supply side
resource plans of the utilities. These plans are developed to ensure that an adequate
amount of resources exist to meet the forecasted peak demands and contingencies.
Since the reliability of an electric system, assuming an adequate supply of fuel, is
a function of megawatts of demand rather than megawatt hours of energy, no energy
supply data is incorporated in this study.4
Utility forecasts, aggregated by RFC, are included in this report (Report). The
RFC study is regional in scope and provides an important overview of the area in which
electric utilities in West Virginia and other participants might buy and sell electrical
power. This Report provides average annual growth rates to permit comparisons to
previous Reports. Use of compound growth rates sensitive to starting and ending dates
requires caution.
Projections and conclusions of this Report are specific to a particular point in time.
The analyses are subject to some level of uncertainty that may influence the need for
capacity by West Virginia electric utilities during the forecast period. FERC’s attempt to
restructure the electric utility industry to provide greater competition introduces new
uncertainties affecting peak supply and demand reliability. Therefore, the annual supply
and demand report of the Commission does not preclude a determination of different
capacity requirements in future proceedings or any other case related basis.
4"Demand" is the average electrical energy required in any given interval of time (usually one hour) by a utility's customers,
measured in megawatts. "Energy," on the other hand, is the total amount of electricity used, measured in megawatt hours.
Public Service Commission – Supply Demand Forecast for Electric Utilities 2012-2021
5
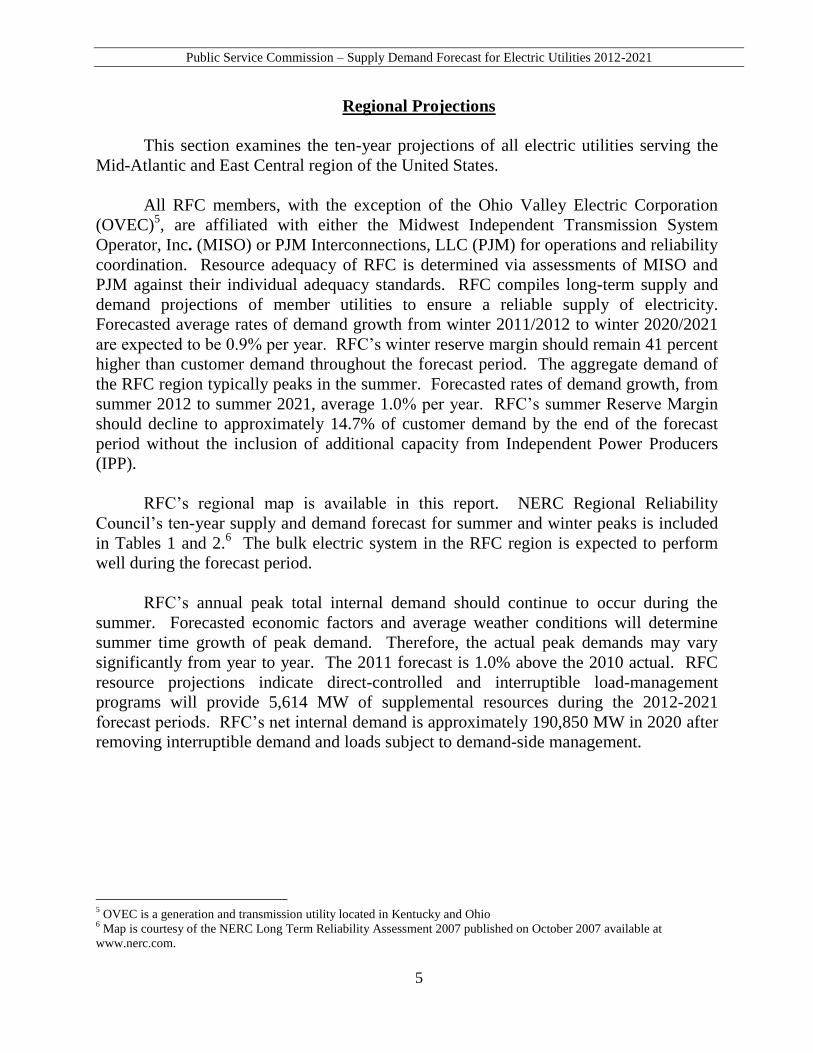
Regional Projections
This section examines the ten-year projections of all electric utilities serving the
Mid-Atlantic and East Central region of the United States.
All RFC members, with the exception of the Ohio Valley Electric Corporation
(OVEC)5, are affiliated with either the Midwest Independent Transmission System
Operator, Inc. (MISO) or PJM Interconnections, LLC (PJM) for operations and reliability
coordination. Resource adequacy of RFC is determined via assessments of MISO and
PJM against their individual adequacy standards. RFC compiles long-term supply and
demand projections of member utilities to ensure a reliable supply of electricity.
Forecasted average rates of demand growth from winter 2011/2012 to winter 2020/2021
are expected to be 0.9% per year. RFC’s winter reserve margin should remain 41 percent
higher than customer demand throughout the forecast period. The aggregate demand of
the RFC region typically peaks in the summer. Forecasted rates of demand growth, from
summer 2012 to summer 2021, average 1.0% per year. RFC’s summer Reserve Margin
should decline to approximately 14.7% of customer demand by the end of the forecast
period without the inclusion of additional capacity from Independent Power Producers
(IPP).
RFC’s regional map is available in this report. NERC Regional Reliability
Council’s ten-year supply and demand forecast for summer and winter peaks is included
in Tables 1 and 2.6 The bulk electric system in the RFC region is expected to perform
well during the forecast period.
RFC’s annual peak total internal demand should continue to occur during the
summer. Forecasted economic factors and average weather conditions will determine
summer time growth of peak demand. Therefore, the actual peak demands may vary
significantly from year to year. The 2011 forecast is 1.0% above the 2010 actual. RFC
resource projections indicate direct-controlled and interruptible load-management
programs will provide 5,614 MW of supplemental resources during the 2012-2021
forecast periods. RFC’s net internal demand is approximately 190,850 MW in 2020 after
removing interruptible demand and loads subject to demand-side management.
5 OVEC is a generation and transmission utility located in Kentucky and Ohio
6 Map is courtesy of the NERC Long Term Reliability Assessment 2007 published on October 2007 available at
www.nerc.com.
Public Service Commission – Supply Demand Forecast for Electric Utilities 2012-2021
6
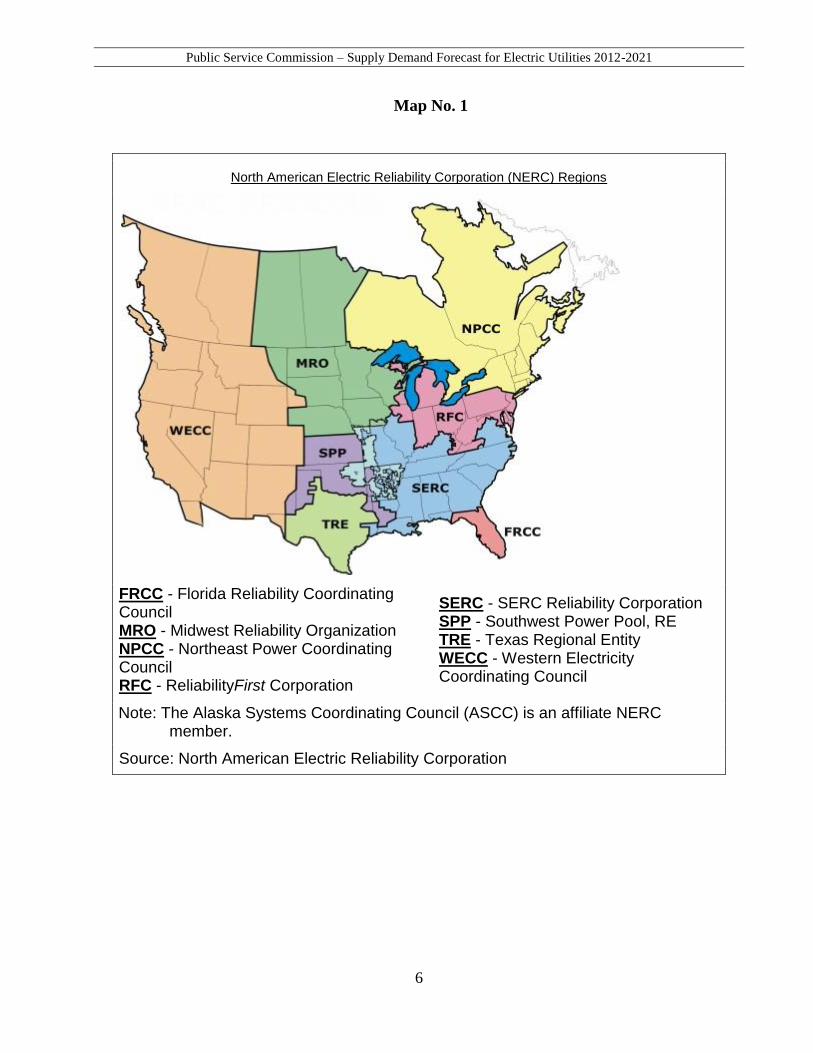
Map No. 1
North American Electric Reliability Corporation (NERC) Regions
FRCC - Florida Reliability Coordinating Council MRO - Midwest Reliability Organization NPCC - Northeast Power Coordinating Council RFC - ReliabilityFirst Corporation
SERC - SERC Reliability Corporation SPP - Southwest Power Pool, RE TRE - Texas Regional Entity WECC - Western Electricity Coordinating Council
Note: The Alaska Systems Coordinating Council (ASCC) is an affiliate NERC member.
Source: North American Electric Reliability Corporation
Public Service Commission – Supply Demand Forecast for Electric Utilities 2012-2021
7
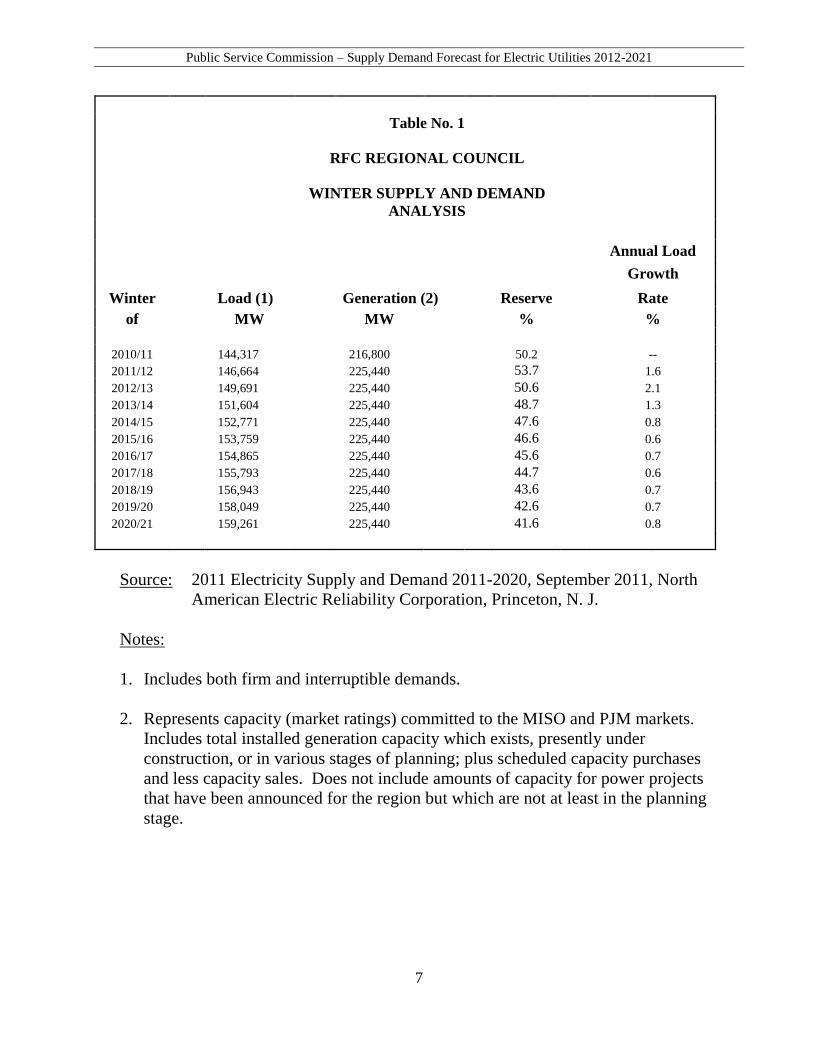
Table No. 1
RFC REGIONAL COUNCIL
WINTER SUPPLY AND DEMAND
ANALYSIS
Annual Load
Growth
Winter
Load (1)
Generation (2) Reserve Rate
of
MW
MW
%
%
2010/11
144,317
216,800
50.2
--
2011/12
146,664
225,440
53.7
1.6
2012/13
149,691
225,440
50.6
2.1
2013/14
151,604
225,440
48.7
1.3
2014/15
152,771
225,440
47.6
0.8
2015/16
153,759
225,440
46.6
0.6
2016/17
154,865
225,440
45.6
0.7
2017/18
155,793
225,440
44.7
0.6
2018/19
156,943
225,440
43.6
0.7
2019/20
158,049
225,440
42.6
0.7
2020/21
159,261
225,440
41.6
0.8
Source: 2011 Electricity Supply and Demand 2011-2020, September 2011, North
American Electric Reliability Corporation, Princeton, N. J.
Notes:
1. Includes both firm and interruptible demands.
2. Represents capacity (market ratings) committed to the MISO and PJM markets.
Includes total installed generation capacity which exists, presently under
construction, or in various stages of planning; plus scheduled capacity purchases
and less capacity sales. Does not include amounts of capacity for power projects
that have been announced for the region but which are not at least in the planning
stage.
Public Service Commission – Supply Demand Forecast for Electric Utilities 2012-2021
8
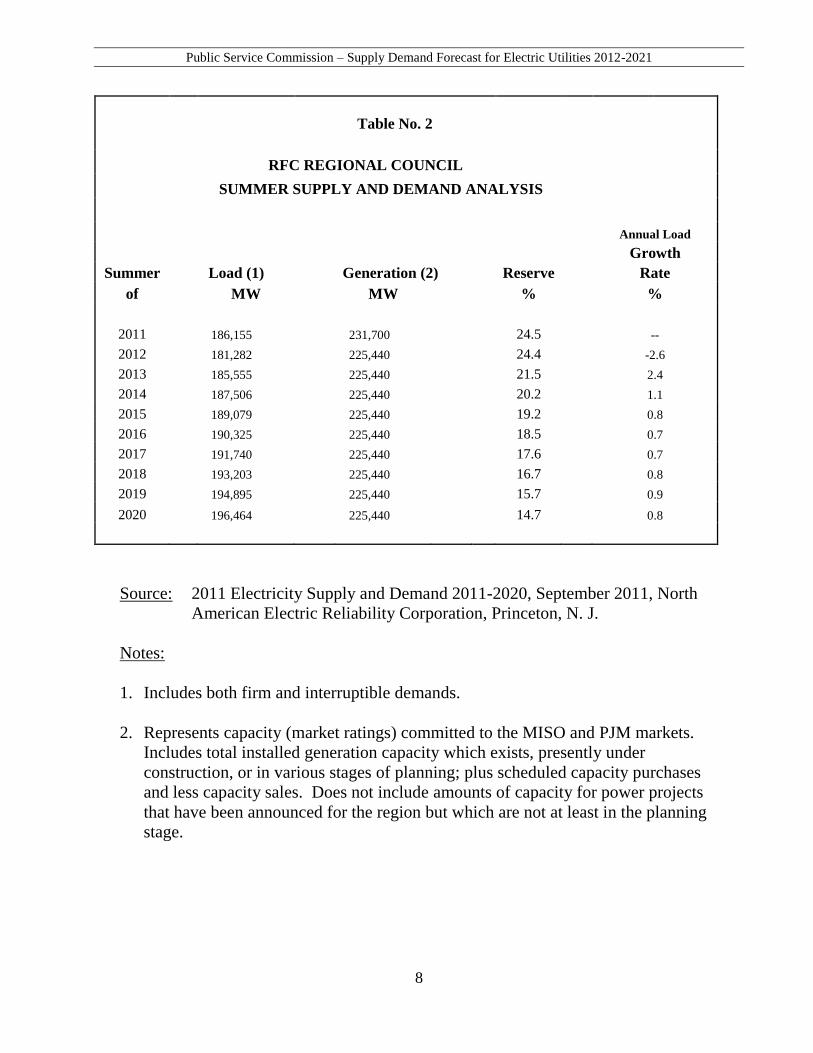
Table No. 2
RFC REGIONAL COUNCIL
SUMMER SUPPLY AND DEMAND ANALYSIS
Annual Load
Growth
Summer
Load (1)
Generation (2) Reserve Rate
of
MW
MW
%
%
2011
186,155
231,700
24.5
--
2012
181,282
225,440
24.4
-2.6
2013
185,555
225,440
21.5
2.4
2014
187,506
225,440
20.2
1.1
2015
189,079
225,440
19.2
0.8
2016
190,325
225,440
18.5
0.7
2017
191,740
225,440
17.6
0.7
2018
193,203
225,440
16.7
0.8
2019
194,895
225,440
15.7
0.9
2020 196,464 225,440 14.7 0.8
Source: 2011 Electricity Supply and Demand 2011-2020, September 2011, North
American Electric Reliability Corporation, Princeton, N. J.
Notes:
1. Includes both firm and interruptible demands.
2. Represents capacity (market ratings) committed to the MISO and PJM markets.
Includes total installed generation capacity which exists, presently under
construction, or in various stages of planning; plus scheduled capacity purchases
and less capacity sales. Does not include amounts of capacity for power projects
that have been announced for the region but which are not at least in the planning
stage.
Public Service Commission – Supply Demand Forecast for Electric Utilities 2012-2021
9
Companies
American Electric Power Company
Generating companies of the American Electric Power (AEP) East System (AEP
East) continue to be parties to the AEP Interconnection Agreement (IA). AEP’s
interconnection “pool agreement” includes five other AEP System operating companies.
Each member of the pool is responsible for a proportionate share of the aggregate AEP
System pool generating capacity. Four AEP System (West Zone) operating companies are
parties to a separate interconnection agreement. System integration agreements tie the
eastern and western AEP zones together. However, AEP indicates there is relatively little
effect on the AEP East companies’ reserve outlook from the system integration agreement.
Appalachian Power Company (APCo) is one of the generating companies of the AEP
East. Wheeling Power (WPCo) is a non-generating AEP Company. While each company
remains a separate entity, they are combined for West Virginia regulatory purposes, such as
for establishing rates.
The focus of this report is the balance of electric supply and demand within West
Virginia. Therefore, the Commission Staff undertook an examination of APCo's and
WPCo's West Virginia jurisdictional peak demand and supply. Because APCo’s and
WPCo’s forecasted demand and supply resources were modeled as part of the AEP East,
Staff's examination necessarily extends to that system's capacity capabilities and planning.
Appalachian Power Company
Appalachian Power Company is the largest AEP subsidiary in terms of population
served, number of customers and area of service territory of the operating companies that
comprise the AEP East. In 2010, APCo provided electric service to approximately 961,000
customers in the States of Virginia and West Virginia, with approximately 440,000 of those
customers located in the southern 21 counties of West Virginia.
APCo's generation mix includes coal-fired steam plants and hydroelectric facilities
and one natural gas-fired combustion turbine plant (detailed on Chart No. 1 in Appendix B).
Additionally, APCo purchases wind power under various contracts and is constructing the
Dresden natural gas plant that is scheduled for completion during the first quarter of 2012.
APCo has interconnections with other utilities (detailed on Chart No. 2 in the Appendix).
These interconnections provide for reliability across a broad interconnected electrical
network and allow economic sales and purchases of power among the interconnected
companies.
Public Service Commission – Supply Demand Forecast for Electric Utilities 2012-2021
10
Wheeling Power Company
Wheeling Power Company provides electric service to approximately 41,000
customers (at year-end 2010) primarily in Ohio and Marshall Counties of West Virginia's
northern panhandle. Currently, WPCo is solely a transmission and distribution company.
WPCo has a purchased power contract with Ohio Power Company (OPCo). For rate and
regulation purposes in West Virginia, the overall power supply costs of APCo and the WPCo
purchased power contract are combined and shared among APCo and WPCo customers.
FirstEnergy Corporation
Monongahela Power Company (Mon Power) and Potomac Edison Company (PE)
comprise the regulated operating companies of FirstEnergy Corp. (FE) in West Virginia.
Each company remains a separate legal entity.
The FE projections include some estimated impact of the 1990 Clean Air Act
Amendments (CAAA). The CAAA will affect both future demand and capacity. There is a
flue gas desulfurization scrubber facility at the Harrison Power Station7 in Harrison County,
West Virginia (in compliance with Phase I of the CAAA, this facility was placed in service
on January 1, 1995) and Mon Power also installed scrubbers at its Fort Marin generation
facilities during 2009.
Monongahela Power Company
In 2011, Monongahela Power provided electric service to approximately 387,000
customers in West Virginia. Mon Power's present generation is largely coal-fired steam
plants as detailed on Chart No. 4 in Appendix B, but includes some pumped storage and
PURPA capacity. As of April 2009, Mon Power has approximately 41% equity ownership
in the Allegheny Generating Company (AGC). AGC is a subsidiary of Mon Power and
Allegheny Energy Supply Co., LLC. AGC owns 40% of the Bath County (2,773 MW as of
March 2009) pumped storage facility located in Bath County, VA. The Bath County facility
was placed in service in 1985. Mon Power also has three PURPA contracts for a total of
approximately 160MW. Mon Power is a member of PJM, giving it access to liquid
competitive wholesale energy and capacity markets.
7 The Harrison Power Station is jointly owned by Monongahela Power and AE Supply, Inc.
Public Service Commission – Supply Demand Forecast for Electric Utilities 2012-2021
11
Potomac Edison Company
Potomac Edison Company provided electric service to approximately 389,000
customers in 2011 in the States of West Virginia and Maryland, with approximately 136,000
of those customers located in the Eastern counties of West Virginia.8 On December 31,
2010, PE purchased the Shenandoah Valley Electric Cooperative territory in West Virginia.
PE transferred approximately 2,100 MW of its Maryland, Virginia, and West Virginia
jurisdictional generating assets to Allegheny Energy Supply on August 1, 2000. To serve
PE’s retail load responsibilities in West Virginia, PE previously entered into a power supply
arrangement with its affiliate Allegheny Energy Supply. This supply arrangement
terminated with implementation of generation transfers between Mon Power and Allegheny
Energy Supply. This process transferred generation capacity to Mon Power so that PE could
serve its West Virginia retail load responsibilities through generation assets owned by Mon
Power.
8 PE sold its Virginia jurisdictional service territory to Rappahannock Electric Cooperative and Shenandoah Valley Electric
Cooperative effective June 1, 2010. The sale resulted in about 102,000 less distribution customers in the Potomac Edison
Company operating company service territory. The transmission assets were retained.
Public Service Commission – Supply Demand Forecast for Electric Utilities 2012-2021
12
Forecasting
AEP Forecasting
The AEP System is comprised of two fully integrated zones. These are referred to as
AEP East and AEP West. APCo is located in the AEP East zone, along with generating
affiliates OPCo, Columbus and Southern Power Company (CSPC), Kentucky Power
Company (KPCo), and Indiana and Michigan Power Company (I & M). Two non-
generating distribution AEP Companies in the East zone are WPCo and Kingsport Power
Company (KP). Much of the engineering, accounting, purchasing and other functions for
both zones is accomplished using a professional staff located at the system offices in
Columbus, Ohio and Tulsa, Oklahoma. The Service Corporation (AEPSC) in Columbus and
Tulsa, in consultation with each of the AEP System operating companies, do all of the
forecasting for APCo as well as other affiliated companies. To evaluate APCo, then, one has
to review the technique employed by AEPSC.
Generally, AEPSC reviews, prepares and revises all forecasts as necessary. In the
third or fourth quarter of each year, short-term (up to two years) and long-term (two to
twenty years) projections of the peak demand and energy requirements of each of the AEP
East operating companies, as well as the aggregate AEP System zones, are usually issued.
AEPSC reviews each short-term forecast, in detail, during the year. If necessary, each
forecast is revised reflecting recent experiences and changes in short-term outlook.
1. AEP East peak demand forecast is calculated by summing the forecast for its
operating companies, taking into account diversity effects. The following
provides an overview of more important considerations in developing the current
AEP Base Case forecast.
2. Growth will continue in the number of residential customers served by AEP East
at the rate of 0.4% per year.
3. Electricity prices for AEP East operating companies incorporate expectations
concerning the need for new generation, compliance with environmental laws,
fuel costs and other factors that may affect price during the 2012-2021 period.
4. The forecast of peak internal demand for each individual operating company is
determined by developing a monthly peak electric demand forecast model that
simulates typical peak loads by jurisdiction. This model, in conjunction with
monthly energy forecasts, produces a preliminary weather-normalized peak load
forecast for each month and season. Forecasted peak demands are evaluated for
reasonableness of both projected load factor and growth rate.
Public Service Commission – Supply Demand Forecast for Electric Utilities 2012-2021
13
5. The projected seasonal peak demand requirements of AEP System utilize
aggregate projected hourly peak demands of System's operating companies.9
Currently, the AEP East annual load factor forecast is between 66% and 67%
over the forecast period.
6. In addition to system records, the AEP forecast uses a large array of data from
national, state and local sources, and consulting services. In particular, historical
and projected data relating to factors such as weather, demographics, economic
activity, industrial production, appliance saturation characteristics and future
technological outlook are sources of interest.
AEP Projected Summer Peak Demand
This report focuses on AEP East summer peak demand since AEP East is forecasting
a summer peaking system over the forecast period. For example, AEP East projected
summer peak demand for 2012 is 1.8% greater than the winter 2011/2012 projected system
peak, and by summer 2021 the projected summer peak is 3.2% greater than the 2020/2021
winter peak. The projected winter peak demands for AEP East and most of its member
companies are shown on Table 3(a). Average annual growth rates (AGR) are provided on
this table and throughout this report. These growth rates are compound growth rates and are
sensitive to the choice of starting and ending dates and should be used with care. For AEP
East as a whole, the ten-year average annual growth rate in the summer peak internal demand
is forecasted to be 0.4%. AEP predicts that over the forecast period, summer 2012 through
summer 2021, demand will rise from a level of 21,264 MW to 21,949 MW. This represents
a 685 MW increase in peak load. In terms of megawatt hours of electrical energy the long
term growth rate of AEP East requirements over the same ten-year period is approximately
0.2% per year.
APCo Projected Winter Peak Demand
AEP's projection of the APCo winter peak demand is shown on Table 3(a), Column
(2). Further, the West Virginia jurisdictional projection, coincident with the APCo peak
demand, is shown in column (1) as APWV. The major assumptions of the APCo forecast
are:
1. Growth in the number of West Virginia residential customers is expected to be 0.2%
per year. Energy conservation will continue to play a role in reducing the rate of
9The internal demand reported for each of the operating companies in subsequent tables is a non-coincident peak. This means
that not all operating companies experience their peaks on the same hour and, accordingly, the sum of the individual
companies' peaks will exceed the reported peak AEP System internal demand.
Public Service Commission – Supply Demand Forecast for Electric Utilities 2012-2021
14
growth in electrical demand from historical levels. The non-mining industrial load
will continue to increase, but at a rate that will lag economic advances by the nation
as a whole.
2. Since the 1980's, coal mining employment continues to decline primarily because of
significant increases in productivity resulting from changes in mining techniques.
Mining employment should continue to decline, during the forecast period, but at a
much slower pace. The forecast also assumes increased output with continued
productivity increasing.
In summary, APCo's annual load factor in 2010 was 58% and is expected to be near
58% through 2021, based on normal weather. During the forecast period it is projected that
APCo's West Virginia jurisdictional winter demand, APWV, will grow at an annual rate of
0.5%.
FirstEnergy Forecasting
Mon Power and PE are part of a fully integrated electrical system within the
Allegheny Power subsidiary of FirstEnergy (FE). Much of the engineering, accounting,
purchasing and other functions are accomplished through the use of a consolidated
professional staff located at the corporate offices in West Virginia (Fairmont), Ohio (Akron)
and Pennsylvania (Greensburg). A discussion of the load forecasting techniques of Mon
Power and PE involves a discussion of the techniques used by FE.
1. A comprehensive load forecast report is prepared annually for Mon Power and
PE. In that report, peak loads, kilowatt-hour energy use and load factors are
projected for a 20-year period. Actual data relative to the forecast is monitored
on a monthly basis. New forecasts are prepared periodically, and an update to
the forecast might be done at any time if economic events indicate a significant
variation in the long run.
2. The Mon Power and PE forecasting methodology employs both econometric and
end-use models. The residential kilowatt-hour use per customer model is a
statistically adjusted end-use model that blends econometric methodology driven
by weather, price of electricity, and economic conditions with end-use
methodology to capture equipment efficiency trends and saturations. The
number of residential customers’ model uses econometric techniques based on
the projected service area state population. Residential energy sales are the
product of the forecast of use per customer and total residential customers. The
commercial energy sales forecast also blends both econometric and end-use
modeling methodologies. The commercial statistically adjusted end use model
combines econometric techniques driven by weather, price of electricity, number
Public Service Commission – Supply Demand Forecast for Electric Utilities 2012-2021
15
of customers, and service area state non-manufacturing employment along with
the end-use structure that captures equipment efficiency trends and saturations
over time.
3. The industrial energy sales sector is separated into major two-digit Standard
Industrial Classification (SIC) groups. Econometric models, driven by
employment, production and industrial electric prices, are used to estimate the
forecasting equation for each SIC group. Total industrial energy sales are the
sum of all forecasted SIC groups. Adjustments to the forecast are made for large
load additions or losses.
4. Peak load forecasts are based on a model that considers end-use estimates and
class load diversity based on projected residential, commercial and industrial
sales. These are derived from the energy sales models.10
5. The principal sources of demographic data for Mon Power and PE analyses and
forecasts are company records, state agencies and local agencies. National
economic data and service area economic data are supplied to Mon Power and
PE by Moody’s Economy.com. These data are employed in the various models
used to make the Mon Power and PE forecasts.
Mon Power and PE Projected Winter Peak Demand
Table 5 shows the Mon Power and PE winter peak demand for the forecast period of
the Winter of 2011/12 through the Winter of 2020/21. Table 5 also reflects the projected
Winter peak demands of each of the West Virginia Mon Power and PE operating companies.
Table 5 represents the Allegheny Power zone Control Area (AP zone Control Area) load as
well as the demand for West Virginia Power (WVP).
The average annual growth rate in the winter peak demand for the entire AP zone
Control Area is projected to be 1.0% over the forecast period of Winter 2011/12 to Winter
2020/21. Mon Power and PE project an 800 MW increase over the forecast period from
8,393 MW to 9,193 MW. These forecasts are based upon the Mon Power and PE September
2011 Load Forecast.
Table 5 results from an RFC requirement to provide forecasts of the connected load
delivered by each operating company without regard to the actual generation supplier.
10
Major economic features of WV forecast in the interval 2012 through 2021 are: West Virginia population growth will occur
at an average rate of 0.13% per year. West Virginia personal income is expected to increase by 3.8% per year from 2012 to
2013 and increase by 1.9% between 2012 and 2021. West Virginia non-farm employment will increase at 1.1% per year from
2012 through 2021. The real (inflation adjusted) price of electricity, in general, declines.
Public Service Commission – Supply Demand Forecast for Electric Utilities 2012-2021
16
Mon Power Projected Winter Peak Demand
Projection of Mon Power’s winter peak demand is shown on Table 5, Column (2).
The West Virginia jurisdictional projection is shown in Column (1) as MPWV.
Two of the principle assumptions regarding Mon Power's service territory embedded
in these September 2011 demand forecasts are:
1. Mon Power residential customers are projected to increase at an annual 0.5% rate.
2. The residential electric heat saturation is expected to increase from 23.2% in 2011 to
about 29.7% in 2021.
Reference to Table 5, Column (2) projects that Mon Power's peak winter demand will
increase from 1,853 MW to 2,037 MW at an annual growth rate of 1.1% over the Winter
2011/12 to Winter 2020/21 period. While West Virginia Power (WVP) is now a division of
Mon Power, WVP’s service territory is not part of AP’s Control Area. Therefore, Mon
Power has not included WVP peak demand forecasts in the forecasts for Mon Power or
MPWV on Table 5. West Virginia Power’s peak demand is expected to increase from 131
MW to 141 MW, at an annual growth of 0.9% over the forecast period as shown in Column
(9) on Table 5.
PE Projected Winter Peak
Projections of PE winter peak demands are shown on Table 5, Column (4). The West
Virginia jurisdictional demand projections for PE are shown on Table 5, Column (3) as
PEWV. Some of the assumptions regarding PE's service territory embedded in these
September 2011 demand forecasts are:
1. PE residential customers are projected to increase at an annual 1.2% rate.
2. Residential electric heat saturation is expected to increase from 57.1% in 2011 to
62.2% in 2021.
3. The costs associated with the AES Warrior Run project will not be reflected in the
rates of PE customers in West Virginia.
Table 5, Column (4) projects the gross winter peaks for PE increasing from 3,084
MW in Winter 2011/12 to 3,317 MW in Winter 2020/21, at an annual growth rate of 0.8%.
PEWV, the PE West Virginia jurisdictional demand, is forecast to grow at an average annual
rate of 1.2% over the same period.
Public Service Commission – Supply Demand Forecast for Electric Utilities 2012-2021
17
Reserve Margins Planning and Projections
AEP Capacity Planning
To adequately serve the needs of its customers, an electric utility must plan to have
generating resources greater than its forecasted peak load. This margin above peak is
necessary to allow for maintenance, forced outages, severe weather and other contingencies.
The size of this planning margin will vary among utilities and is often a point of contention.
Perhaps the two most widely-used measures of adequate capacity are Reserve Margin
and Loss of Load Expectation (LOLE). Reserve Margin (R.M.) is described as:
R.M. % = Capacity - Load x 100
Load
LOLE can be defined in terms of the number of days when available generating
capacity, including the effect of interconnections, is not sufficient to meet the load demand
during the peak hour. During such days it may be necessary to shed load. A typical LOLE
criterion is one day in ten years.
Reserve Margin is that portion of the generation resources which exceeds peak
demand. Continuity of supply cannot be assured unless the utility has sufficient generating
resources to supply peak summer and winter demands, but also an additional Reserve Margin
to provide for contingencies. On October 1, 2004, AEP joined PJM a Regional Transmission
Organization (RTO). PJM determines the amount of Reserve Margin each of its member
utilities is to provide to meet a LOLE of one day in ten years, considering load diversity
among load serving entities in PJM and PJM and load serving entity forced outage rates.
PJM reserve requirements, established for no more than four years into the future, generally
are about 15% to 16% for PJM as a whole. Considering peak load diversity, the
corresponding AEP reserve requirement is expected to be about 12%.
APCo Reserve Margin
APCo is projected to remain winter peaking over the next ten years, but APCo is part
of the integrated AEP East. In order to assess the adequacy of APCo's Reserve Margin, it is
necessary to examine the Reserve Margins of AEP East. Because the system experiences a
summer peak, the summer supply and demand projections for APCo are important
considerations.
Public Service Commission – Supply Demand Forecast for Electric Utilities 2012-2021
18
AEP Capacity Plan
The AEP East operating companies jointly plan to meet their combined coincident
peak. The five generating companies, APCo, Columbus Southern Power, Indiana-Michigan
Power, Kentucky Power, and OPCo participate in a power supply pool agreement. Under
this agreement, these companies share in their combined capacity resources.
The capacity changes, either upward or downward, are comprised of efficiency
improvements, generating unit additions, purchased solar or wind generation additions,
auxiliary power increases and generating unit retirements. The efficiency improvements
increase the megawatt availability of a generating unit by improvements of operating
equipment such as turbine blades, steam valves, control equipment, etc. Auxiliary power
increases are actually decreases in available capacity because of additional emission control
equipment consuming power that would otherwise be available for market sales. During the
years 2012 to 2016, AEP is planning to retire several generating units. However, generation
unit retirements are subject to an ongoing review based, in part, on environmental
considerations, and therefore, retirement dates will vary from one forecast to another.
Generating capacity is planned to be supplemented via firm purchase of solar and wind
energy generation for the entire forecast period of 2012 through 2021. In addition, one new
gas fired combined cycle generation unit is included in the forecasted generating capacity
additions.
On August 31, 2011, APCo completed the purchase of a natural gas-fired power plant
under construction near Dresden, Ohio, from AEGCo, a subsidiary of AEP. When
completed during the first quarter of 2012, Dresden will be a nominal 580 MW natural gas-
fired combined-cycle plant.
Four AEP companies (APCo, Columbus Southern Power, Indiana-Michigan Power,
and OPCo) are among the fifteen investor-owned electric utilities in the Ohio Valley region
which sponsored the formation in 1952 of the Ohio Valley Electric Corporation (OVEC) and
its subsidiary, Indiana-Kentucky Electric Corporation (IKEC), for the purpose of supplying
the electrical power for the Federal Government’s Portsmouth Area Project, that was
originally under the responsibility of the Atomic Energy Commission, and later the
Department of Energy (DOE). Effective April 2003, the Sponsoring Companies are entitled
to purchase from OVEC their participation share of any available power from the eleven
OVEC units. As of February 2011, the sponsors have agreed to extend the OVEC operating
agreement through June 2040.
OPCo owns Unit 1 of the three-unit Cardinal Plant, located in Brilliant, Ohio.
Buckeye Power, Inc. owns Units 2 and 3. Buckeye Power supplies the power requirements
of Ohio’s rural electric cooperatives under terms of an agreement with Ohio’s investor-
owned electric utilities, whereby power is transmitted over investor-owned transmission
systems to each cooperative. OPCo provides Buckeye Power with an alternate source of
Public Service Commission – Supply Demand Forecast for Electric Utilities 2012-2021
19
power when Cardinal Units 2 and 3 are out of service. OPCo is entitled to utilize generating
capacity from either Cardinal unit not needed for Buckeye Power’s load. OPCo has an
agreement with Buckeye Power entitling OPCo to 20% of Buckeye Power’s Robert P. Mone
Plant (three 182 MW combustion turbines) generating capacity.
Currently, AEP East operating companies are receiving energy from nine wind
contracts and one solar project, with total nameplate capacity ratings of 636 MW. Of that
total, APCo receives wind power related to five long-term purchase agreements for 376 MW
(nameplate capacity). Also, CSP and OPCo are purchasing all of the output from the Public
Service Electric and Gas Wyandot Solar project (10 MW, nameplate capacity), which went
into commercial operation in May 2010.
AEP East Reserve Margin Projections
The forecasted summer and winter Reserve Margins for AEP East based on AEP
supply and demand projections are shown on line 11 of Tables 4(a) and 4(b). In the
calculations of Reserve Margins, the interruptible loads are subtracted from the projected
peak; however, these interruptible customers are expected to be served during the peak if
possible.
AEP East expects to maintain a minimum Reserve Margin of about 12 percent. AEP
East is projecting that it will need additional supply resources to maintain reliability.
No capacity deficiency is projected for AEP East. Therefore, even though APCo
might be capacity deficient on a stand-alone basis during the forecast period, its capacity
requirements could be met by capacity available from the other AEP East operating
companies in accordance with the provisions of the AEP Interconnection Agreement.
On December 17, 2010, pursuant to Article 13 of the FERC-approved AEP
Interconnection Agreement (IA, Interconnection Agreement or AEP Pool), each of the AEP
Pool members gave written notice to the other members, and to American Electric Power
Service Corporation (AEPSC), the AEP Pool’s agent, of its intent to terminate the
Interconnection Agreement, effective January 1, 2014 or such other date as approved by
FERC. Because the IA is a rate schedule on file at FERC, its termination will not be
effective until accepted for filing by FERC.
The Interim Allowance Agreement among the AEP companies (IAA), which was
most recently modified in 1996 and deals with sulfur dioxide (SO2) emissions and
allowances, would also likely be terminated by the FERC during that time frame.
Environmental regulations have expanded beyond those covered by the IAA. For example,
the IAA does not cover the allowance program established for emissions of nitrogen oxides
(NOx). In addition, evolving environmental regulations will likely require unit-specific,
rather than system-wide, solutions.
Public Service Commission – Supply Demand Forecast for Electric Utilities 2012-2021
20
Termination of the Interconnection Agreement will have a significant impact on the
sources of capacity and energy available to APCo. It is expected that alternative sources and
the impact of the termination of the Interconnection Agreement will be the subject of
discussions among the parties prior to and during FERC consideration of a formal filing to
terminate the agreement.
This FERC process will provide interested stakeholders an opportunity to participate
in the determination of how the AEP East operating companies should operate prospectively.
Because the Interconnection Agreement is still in effect, and it is not known how the AEP
East operating companies, including APCo, will operate prospectively, this report assumes
the existence of the AEP Pool through the forecast period.
FE Capacity Planning
The FE November 2009 Integrated Resource Plan (IRP) reflects generation and load
projections as they were expected to occur at the time of preparation of the IRP and load
forecast, including consideration of supplemental capacity needed to meet the reliability
standards of PJM and Reliability First over the forecast period and Interruptible Load
Resources (ILR). FE Pennsylvania and Maryland affiliates (West Penn and PE) operate in
competitive retail markets. As a result, this IRP represents one of many possible scenarios
that might be impacted by customer choice in power suppliers.
FE Planning Philosophy
Mon Power and PE are wholly within the PJM Regional Transmission Operation
footprint. Numerous system planning benefits are realized as a member and participant of
PJM. These benefits include cost savings and efficiencies gained through coordinated
regionalized markets and system planning for reliability. The PJM regional transmission
organization operates and monitors the markets to effectuate market based solutions for
reliability including the Regional Transmission Expansion Planning (RTEP) process with
system planning solutions being effectuated through the energy market and the Reliability
Pricing Model (RPM) capacity market.
The Reserve Requirement Study, which is performed on an annual basis by PJM to
support an average loss of load expectation of once every ten years, is the criteria used to
determine the planning parameters for the RPM capacity market. This study provides a ten-
year projection consistent with RFC and NERC standards for resource planning reserve
requirements for all PJM shared reserve group members. PJM’s study currently
recommends an RTO average installed Reserve Margin of 15.5% for the 2012 / 2013
delivery year and 15.3% for the 2013 / 2014 and 2014 / 2015 delivery years. Further, PJM’s
Public Service Commission – Supply Demand Forecast for Electric Utilities 2012-2021
21
study currently estimates an RTO average forecasted 11-year Reserve Margin of 20.6% for
the period 2010 through 2020.11
The annual RPM capacity auction provides market signals to participants three years
from the auction date. The prices are determined on a regional basis taking into
consideration transmission limitations of the various PJM regions. The forward capacity
prices developed from these capacity auctions provide a basis for build or buy decisions.
FE Projected Supply Side Resources
Table 6 assumes no planned retirements of generating units in the next ten years.
Currently, Mon Power plans to meet its RPM capacity obligations using its owned assets and
through participation in the PJM RPM capacity market. Currently, Mon Power has a total of
332 customers with interruptible loads under the PJM and the Interruptible Load Resource
(ILR) program.12
FE Projected Demand Side Resources
Current PJM programs, which are described below, are reviewed each year in order to
determine if a material and predictable amount of load impact is expected in the future from
these programs. The most recent load forecast for the West Virginia service territory does
not contain any specific estimates of future peak demand or energy impacts from current
demand side management (DSM) programs. For the present time, Mon Power and PE have
determined that because the load reductions from current programs are either voluntary or
have not yet been material and predictable, it is not prudent to include any load and energy
reduction assumptions based on those programs. Any actual impacts from DSM programs
will be reflected in the projections as they are included in the historical load data used to
develop the load forecast models.
All Mon Power and PE commercial and industrial customers have the opportunity to
participate in PJM demand response programs. Mon Power and PE commercial and
industrial customers currently have the opportunity to participate in two demand response
programs through PJM: the Economic Load Response Program (ELRP) and the ILR
program, as described below. The purpose of these programs is to provide customers options
to aid in reducing their electricity costs through flexibility in their operations while
benefiting the PJM generation market with additional resources to reduce peak demand.
11
2010 PJM Reserve Requirement Study with an 11-year Planning Horizon: 2010-2020.
http://www.pjm.com/~/media/committees-groups/committees/pc/20101006/20101006-item-08-2010-pjm-reserve-
requirement-study.ashx 12
Mon Power and PE act as the Curtailment Service Provider for 4 of the customers.
Public Service Commission – Supply Demand Forecast for Electric Utilities 2012-2021
22
The PJM Economic Load Response Program (ELRP) is a voluntary peak load
reduction plan that offers financial compensation to customers who can reduce their power
consumption during periods of high electrical demand or prices. Participating businesses are
paid a percentage of the wholesale cost of power in return for reducing energy consumption,
which will lower their overall energy costs. To qualify, customers must have the ability to
reduce their electric demand by a minimum of 100 kilowatts (kW) per hour. Enrolled
customers may choose to not participate during each event, making participation and the
impact on the load forecast, unpredictable. Because of the voluntary nature of the program,
PJM does not include any load reductions from the ELRP program in its load forecast.
Similarly, for the present time, Mon Power and PE have determined that because the load
reductions from this program are voluntary, it is not prudent to include any load and energy
reduction assumptions based on the ELRP program.
The PJM Interruptible Load Resource (ILR) Program pays participating customers if
they are called upon to reduce electrical usage during system emergencies. To participate,
customers must agree to be available for up to 10 reductions per year and have the ability to
reduce demand by a minimum of 100 kW per hour. These customers must have the ability to
reduce metered load when an emergency event is called by PJM. To date, the ILR program
has been used twice in the AP zone on September 23 and 24, 2010. The impact on Mon
Power and PE’s load demand, from each emergency event, has not been quantified. For the
present time, Mon Power and PE determined that load reductions from this program are
currently not material or predictable. Therefore, it is not prudent to include load and energy
reduction assumptions based on the ILR program. Additionally, the ILR program is being
sunset by PJM as of May 31, 2012.
On March 31, 2011, Mon Power and PE filed a Phase I Energy Efficiency and
Conservation Plan for Commission approval (Case No. 11-0452-E-P-T) in accordance with
commitments made in Cases No. 09-0352-E-42T and 10-0713-E-PC. The Plan is designed
to reduce both energy and peak demands by at least 0.5%. The Plan includes home energy
audits and appliance replacement programs for low income residential users and rebates for
non-residential users who install high efficiency lighting. The Plan is estimated to result in
64,437 megawatt-hours of net energy savings and 13.8 megawatts of demand reduction over
the initial five year period. The Companies requested a surcharge be implemented to pay for
the cost of these programs. The impact of the surcharge to customers would vary given
usage, but under the Companies’ proposal, a residential customer that uses 1,000 Kwh of
electricity each month would see a $.10 increase in the monthly bill.
The Commission held a hearing on this matter on December 1, 2011. On December
30, 2011, the Commission approved the first phase of the Energy Efficiency and
Conservation programs, authorizing the Companies to recover the estimated annual program
costs of $1.7 million.
Public Service Commission – Supply Demand Forecast for Electric Utilities 2012-2021
23
FE Reserve Margin Projections
Mon Power and PE expect to purchase any needed supplemental capacity from the
wholesale market to meet the required PJM RPM capacity requirement. The required PJM
Installed Reserve Margin requirement for the 2010/2011 planning period is 15.6%.
Comments Received from AEP and FE Regarding Potential Threats to Reliability
AEP Restructuring of the Electric Industry
The movement to a competitive electric market, as well as other reliability issues, will
have a profound impact on the electric supply and demand balance throughout the country.
Power station maintenance staff is being reduced across the country. The general industry
trend is to provide these services through contractors. The impact on the reliability of the
plants as a result of staffing reductions is uncertain. Utilities have historically provided
neighboring utilities with much cooperation in sharing equipment, manpower, information
and other types of emergency assistance. Because neighboring utilities are now competitors,
that cooperation is diminishing. Transmission line loadings may increase as a result of more
transactions between distant buyers and sellers. Higher loading levels could result in more
voltage drops or outage events.
Utilities may stockpile less fuel than historical levels. Lower stockpiles increase the
risk of fuel shortages if a disruption in fuel supply occurs.
Competition may increase local opposition to transmission line construction. Many
residents may view new transmission line construction as a way to accommodate sales
between distant buyers and sellers, and not as necessary to support their local distribution
company.
AEP Environmental Issues
Newly established and proposed environmental regulations continue to expand the
scope and increase the stringency of applicable requirements. These programs will require
AEP to make additional capital investments and operational changes to comply with more
stringent air emissions, ash disposal, cooling water intake, and wastewater discharge
requirements. The development and implementation of a comprehensive compliance plan is
an iterative process that is driven by the stringency and implementation schedule of new
regulatory programs, as well as by consideration of available compliance strategies such as
the addition of emission controls, fuel-switching, and unit retirement options. Site-specific
variables, such as the age, location, and type of unit, are also important factors considered in
Public Service Commission – Supply Demand Forecast for Electric Utilities 2012-2021
24
compliance planning. Key environmental programs impacting the decision-making
regarding the disposition of the APCO and AEP generation fleet are summarized below.
On July 6, 2011, the EPA finalized the Cross-State Air Pollution Rule (CSAPR),
which is designed to reduce the impacts from interstate transport of NOx and SO2 emissions
across the eastern United States. CSAPR is a replacement to the Clean Air Interstate Rule
(CAIR) and the previously proposed Transport Rule. The Final Rule applies to facilities in
all AEP states and will be implemented in two phases: Phase I in 2012 and Phase II in 2014.
The Final Rule is more stringent than proposed resulting in increased and accelerated SO2
and NOx reductions across the AEP fleet. Compliance options include installing flue gas
desulfurization (FGD) and selective catalytic reduction (SCR) emission controls, fuel-
switching, and unit retirements. The time frames and stringency of the required emission
reductions, coupled with the lack of robust interstate trading and the elimination of historic
allowance banks, pose significant concerns. The more stringent requirements included in the
CSAPR could cause unit curtailments, increased capital requirements, constrained operations
and decreased reliability.
On March 16, 2011, the EPA issued a Proposed Rule to reduce the emissions of
hazardous air pollutants (HAPs) from coal-and oil-fired electric generating units. The
proposal, which is referred to as the Utility MACT (Maximum Achievable Control
Technology) Rule, will require additional emission controls to be constructed, will force the
premature retirement of some units, and will impair the potential for future new coal
generation development. The Rule was finalized in December 2011 and will have a three to
four year implementation schedule. Compliance options include installation of additional
emission controls, fuel-switching, or unit retirements. The short implementation timeline
coupled with the scope of unit outages and retirements required to implement compliance
strategies across the U.S. coal-based generation fleet will create challenges with respect to
grid reliability and compliance costs.
The Clean Air Act requires the EPA to periodically review national ambient air
quality standards (NAAQS). On July 12, 2011, the EPA proposed secondary NOx and SO2
standards. AEP is currently evaluating the potential impacts of this proposal. Revised ozone
standards had been expected in 2011, but on September 2, 2011, it was announced that
reconsideration of the ozone standards would not occur until 2013 in order to coincide with
the EPA’s current review of the science. After NAAQS are revised, States are required to
designate areas that do not meet those standards (non-attainment areas) and must implement
plans to bring those non-attainment areas into compliance. Because of the expected
stringency of each of the revised standards, additional NOx and SO2 reductions are likely to
be required for the AEP coal-fleet.
Although federal greenhouse gas regulation (GHG) legislation is unlikely in the near
future, the EPA has initiated and intends to broaden the regulation of GHG emissions by
expanding the applicability of existing Clean Air Act programs. For example, in 2010, the
Public Service Commission – Supply Demand Forecast for Electric Utilities 2012-2021
25
EPA finalized the GHG Tailoring Rule, which establishes thresholds for when new emission
sources or modifications to existing sources are required to obtain permits that regulate GHG
emissions. The EPA is also currently developing New Source Performance Standards
(NSPS) for GHG emissions from power plants, which at the earliest are expected to be
proposed in 2012. Given that cost-effective post combustion control technologies for power
plants have yet to be commercialized, the compliance will likely focus on generation
efficiency and alternative fuel.
In June 2010, the EPA published a Proposed Rule to regulate the disposal and
beneficial reuse of coal combustion residuals, including fly ash and bottom ash from coal-
fired electric generating units. The Rule contains two alternative proposals: one would
impose federal hazardous waste disposal and management standards on these materials; and
the other would allow States to retain primary authority to regulate the beneficial re-use and
disposal of these materials under state solid waste management standards, including
minimum federal standards for disposal and management. Both proposals would impose
stringent requirements for the construction of new coal ash landfills. In either case, the EPA
is either requiring or strongly encouraging phase-out of wet disposal of these materials by
requiring existing unlined surface impoundments to upgrade to the new standards or stop
receiving coal ash and initiate closure within five years of the issuance of a final Rule. The
proposed schedule for implementation is short, within five years of final adoption of the
program. Regulation of these materials as hazardous wastes would significantly increase
costs of coal-fired generation. A Final Rule is expected in 2013.
In April 2011, the EPA issued a Proposed Rule under Section 316(b) of the Clean
Water Act that would establish standards for existing power plants that reduce impacts to
aquatic organisms related to cooling water intake processes. The Proposed Rule establishes
both impingement and entrainment standards. Impingement refers to impacts from being
pinned against the cooling water intake screen, while entrainment refers to impacts when
small fish, eggs or larvae are drawn into the cooling water system. The proposed rule would
drive additional capital investments that could require upgrades to the existing cooling water
intake structures or installation of cooling towers. A Final Rule is expected in July 2012.
The EPA is moving forward to update guidelines that will result in more stringent
limits for water discharges from power plants. More stringent limits would drive additional
capital investments to upgrade or install new wastewater treatment systems. The EPA is
expected to issue a Proposed Rule in July 2012 with a Final Rule is expected in January
2014.

Public Service Commission – Supply Demand Forecast for Electric Utilities 2012-2021
26
AEP Aging Generating Units
Currently, there are 45 coal-fired units on the AEP East System that are 30 or more
years old. These units represent 17,026 MW, or 65 percent of AEP East total capability.
Assuming no retirements, by 2021 the number of coal-fired units more than 30 years old
would increase to 48 units representing 19,976 MW, or 76 percent of total existing system
capability. Depending upon new and proposed environmental regulations, it is possible that
a number of AEP East coal-fired plants will be retired prior to 2021. The availability of units
may also deteriorate as a result of the aging process unless appropriate measures are taken.
AEP Loss of Interruptible Load
In 2011, the AEP East System served a significant amount of interruptible load (1,071
MW based on contract demands). However, after reflecting diversity of the various
customer loads plus an allowance for customer curtailments because of economic price
signals, the estimated load available for interruption is 565 MW at summer peak and 579
MW at winter peak. It should be noted that this interruptible load does not reflect customers
participating in PJM’s demand response programs. As AEP East Reserve Margins decline,
the threat of increased interruptions may lead some interruptible customers to seek to
become firm customers.
AEP Transmission Issues
On June 22, 2007, the PJM Board approved a transmission project, known as the
Potomac-Appalachian Transmission Highline (PATH) Project, for inclusion in PJM's
Regional Transmission Expansion Plan. The PATH Project, which was approved by the
PJM Board for the purpose of maintaining the reliability of the PJM transmission system,
was a joint venture of subsidiaries of AEP and Allegheny Energy, Inc., now FirstEnergy, Inc.
(FE).
In February 2011, PJM announced its decision to hold the PATH Project in abeyance
in its 2011 Regional Transmission Expansion Plan (RTEP). PJM directed AEP and FE to
suspend current development efforts on the PATH Project, subject to those activities
necessary to maintain the project in its current state, while PJM conducts more rigorous
analysis of the potential need for the PATH Project as part of its continuing RTEP process.
PJM’s announcement specifically indicated that PJM was not directing AEP and FE to
cancel or abandon the PATH Project.
In February 2011, PATH-WV filed a motion to withdraw its pending certificate of
public convenience and necessity application in West Virginia based on PJM’s directive and
the motion was granted by the Commission in March 2011. Applications for certificate and
siting of PATH in Maryland and Virginia have also been withdrawn.
Public Service Commission – Supply Demand Forecast for Electric Utilities 2012-2021
27
FE Environmental Issues
The operations of FE’s owned facilities, including its generation facilities, are subject
to various federal, state and local laws, regulations and uncertainties as to air and water
quality, hazardous and solid waste disposal and other environmental matters. Compliance
may require Mon Power and PE to incur substantial additional costs to modify or replace
existing and proposed equipment and facilities. These costs may adversely affect the cost of
Mon Power and PE’s future operations.
FE Global Climate Change
In response to a potentially carbon constrained future, Mon Power is running its
generation assets as efficiently as possible to reduce carbon emissions. Mon Power and PE
are educating customers to consume less and to be conservation minded with respect to
energy use. To promote the lowest possible cost to customers, the cost of carbon would be
reflected in future dispatch costs to assure that the lowest carbon emitting generation
facilities would run first. Finally, Mon Power would actively engage in various ways to
reduce carbon emissions from its generation assets including new additive controls, carbon
sequestration technologies, and the development and implementation of alternative, non-
carbon based generation.
Mon Power and PE’s current strategy in response to carbon-constraining regulatory or
legislative initiatives focuses on six tasks:
Maintaining an accurate carbon dioxide emissions inventory;
Improving the efficiency of the existing coal-burning fleet;
Following developing technologies for clean-coal energy and for carbon dioxide
emission controls, including carbon sequestration;
Participatory in carbon dioxide offset projects (e.g. reforestation projects) both
domestically and abroad;
Analyzing options for future energy investments (e.g. renewable energy, clean-coal,
etc.); and,
Improving demand-side efficiency programs through various customer energy
conservation outreach programs.
FE Clean Air Act Compliance
Mon Power’s generation complies with the Clean Air Act Amendments of 1990
(CAAA) through the use of various emission controls installed at its stations and/or
operational constraints in accordance with all applicable state and federal regulations to
primarily control emission of particulate matter (PM), nitrogen oxides (NOx) and sulfur
Public Service Commission – Supply Demand Forecast for Electric Utilities 2012-2021
28
dioxide (SO2). Currently, Mon Power has requirements for compliance under the Acid Rain
Program (ARP), Title V permit program and Clean Air Interstate Rule (CAIR) relative to the
Clean Air Act Amendments of 1990. The CAIR rule will be replaced by the Cross State Air
Pollution Rule (CSAPR), beginning on January 1, 2012.
Mon Power’s generation assets meet the existing APR, CAIR and Title V
requirements by utilizing Electrostatic Precipitators (ESP), Flue Gas Desulfurization (FGD)
scrubbers, low-sulfur coal, low- NOx burners, Selective Catalytic Reduction (SCR), Selective
Non-Selective Catalytic Reduction (SNCR-trim), over-fired air and optimization software.
The same equipment will be utilized to meet the requirements of the CSPAR rule in 2012.
Compliance with the NOx and SO2 trading programs (APR, CAIR, CSPAR) is
achieved by surrender of allowances to the USEPA equivalent to the emissions (SO2 & NOx)
for each ozone season and each calendar year. A combination of SO2 & NOx allocations
received from USEPA and SO2 & NOx allowances traded and/or purchased are used for
allowance surrenders for each compliance period. Additional ARP NOx requirements are
met by a NOx averaging plan that has been filed with both the West Virginia Department of
Environmental Protection (WVDEP) and the United States Environmental Protection
Agency (USEPA).
Mon Power is currently evaluating options for compliance with a new Rule under the
CAAA that has been proposed for Maximum Achievable Control Technology (MACT) for
Electric Generating Units. The final MACT Rule was issued in late December 2011 and
compliance with this rule will be required within 3-4 years.
FE Aging Generation Units
By the end of 2011 all of the active steam units will be over 30 years of age.

Public Service Commission – Supply Demand Forecast for Electric Utilities 2012-2021
29
Table No. 3 (a)
AEP SYSTEM - EAST ZONE
PROJECTED WINTER PEAK INTERNAL DEMANDS
(MW)
AFTER DSM ADJUSTMENTS
SUM OF
INTERNAL AEP SYSTEM
COINCIDENT TOTAL COINCIDENT PEAK (EAST ZONE)
WINTER APWV(B) APCo CSP I&M KPCo OPCo(C) WPCo(D) WPCo (E) DEMANDS PEAK DIVERSITY
(1) (2) (3) (4) (5) (6) (7) (8) (9)=(2)+(3)+ (10) (11)=(9)-(10)
(4)+(5)+(6)
10/11 (A) 3,195 7,623 3,564 3,785 1,596 4,666 308 356 - 20,605 -
11/12 3,105 7,404 3,556 3,932 1,550 4,933 416 451 21,375 20,895 479
12/13 3,116 7,457 3,627 4,007 1,563 5,014 420 457 21,667 21,172 495
13/14 3,130 7,503 3,625 3,988 1,564 4,985 422 458 21,665 21,172 492
14/15 3,154 7,548 3,616 3,963 1,563 4,953 424 460 21,642 21,151 492
15/16 3,168 7,563 3,603 3,930 1,557 4,926 426 461 21,579 21,083 496
16/17 3,171 7,578 3,598 3,915 1,554 4,930 428 462 21,575 21,065 509
17/18 3,179 7,611 3,604 3,894 1,556 4,935 428 460 21,599 21,096 503
18/19 3,194 7,656 3,604 3,878 1,560 4,927 428 460 21,625 21,136 489
19/20 3,200 7,682 3,587 3,856 1,561 4,900 427 459 21,585 21,082 503
20/21 3,237 7,777 3,607 3,874 1,575 4,923 431 462 21,756 21,275 481
AGR 11/21 0.1 0.2 0.1 0.2 -0.1 0.5 3.4 2.6 - 0.3 -
AGR 12/21 0.5 0.5 0.2 -0.2 0.2 0.0 0.4 0.3 - 0.2 -
NOTES: (A) ACTUAL.
(B) WEST VIRGINIA'S PORTION OF APCo'S PEAK INTERNAL DEMAND.
(C) INCLUDES OPCo'S SALE TO WPCo.
(D) AMOUNT OF SALE TO WPCo INCLUDED IN OPCo'S PEAK INTERNAL DEMAND.
(E) WPCo'S NON-COINCIDENTAL PEAK INTERNAL DEMAND.
1. Appalachian Pow er West Virginia (APWV)
2. Appalachian Pow er Company (APCo)
3. Columbus Southern Pow er Company (CSP)
4. Indiana Michigan Pow er (I&M)
5. Kentucky Pow er Company (KPCo)
6. Ohio Pow er Company (OPCo)
7. Wheeling Pow er Company (WPCo)
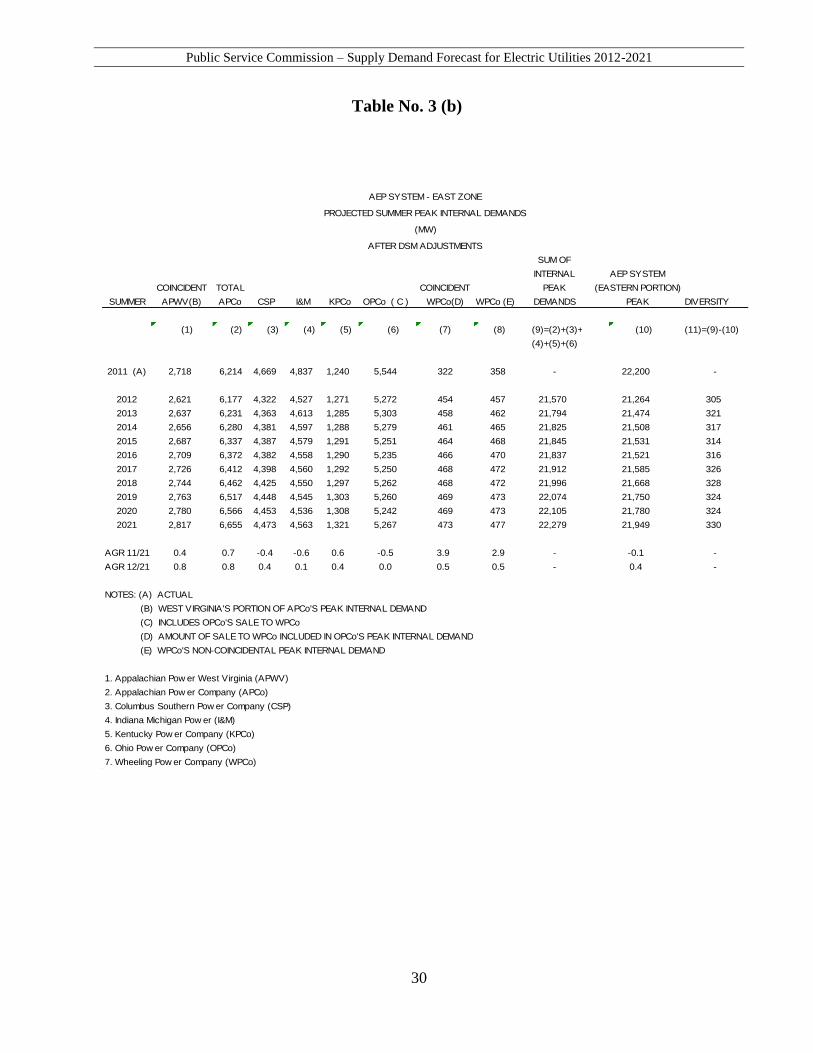
Public Service Commission – Supply Demand Forecast for Electric Utilities 2012-2021
30
Table No. 3 (b)
AEP SYSTEM - EAST ZONE
PROJECTED SUMMER PEAK INTERNAL DEMANDS
(MW)
AFTER DSM ADJUSTMENTS
SUM OF
INTERNAL AEP SYSTEM
COINCIDENT TOTAL COINCIDENT PEAK (EASTERN PORTION)
SUMMER APWV(B) APCo CSP I&M KPCo OPCo ( C ) WPCo(D) WPCo (E) DEMANDS PEAK DIVERSITY
(1) (2) (3) (4) (5) (6) (7) (8) (9)=(2)+(3)+ (10) (11)=(9)-(10)
(4)+(5)+(6)
2011 (A) 2,718 6,214 4,669 4,837 1,240 5,544 322 358 - 22,200 -
2012 2,621 6,177 4,322 4,527 1,271 5,272 454 457 21,570 21,264 305
2013 2,637 6,231 4,363 4,613 1,285 5,303 458 462 21,794 21,474 321
2014 2,656 6,280 4,381 4,597 1,288 5,279 461 465 21,825 21,508 317
2015 2,687 6,337 4,387 4,579 1,291 5,251 464 468 21,845 21,531 314
2016 2,709 6,372 4,382 4,558 1,290 5,235 466 470 21,837 21,521 316
2017 2,726 6,412 4,398 4,560 1,292 5,250 468 472 21,912 21,585 326
2018 2,744 6,462 4,425 4,550 1,297 5,262 468 472 21,996 21,668 328
2019 2,763 6,517 4,448 4,545 1,303 5,260 469 473 22,074 21,750 324
2020 2,780 6,566 4,453 4,536 1,308 5,242 469 473 22,105 21,780 324
2021 2,817 6,655 4,473 4,563 1,321 5,267 473 477 22,279 21,949 330
AGR 11/21 0.4 0.7 -0.4 -0.6 0.6 -0.5 3.9 2.9 - -0.1 -
AGR 12/21 0.8 0.8 0.4 0.1 0.4 0.0 0.5 0.5 - 0.4 -
NOTES: (A) ACTUAL
(B) WEST VIRGINIA'S PORTION OF APCo'S PEAK INTERNAL DEMAND
(C) INCLUDES OPCo'S SALE TO WPCo
(D) AMOUNT OF SALE TO WPCo INCLUDED IN OPCo'S PEAK INTERNAL DEMAND
(E) WPCo'S NON-COINCIDENTAL PEAK INTERNAL DEMAND
1. Appalachian Pow er West Virginia (APWV)
2. Appalachian Pow er Company (APCo)
3. Columbus Southern Pow er Company (CSP)
4. Indiana Michigan Pow er (I&M)
5. Kentucky Pow er Company (KPCo)
6. Ohio Pow er Company (OPCo)
7. Wheeling Pow er Company (WPCo)
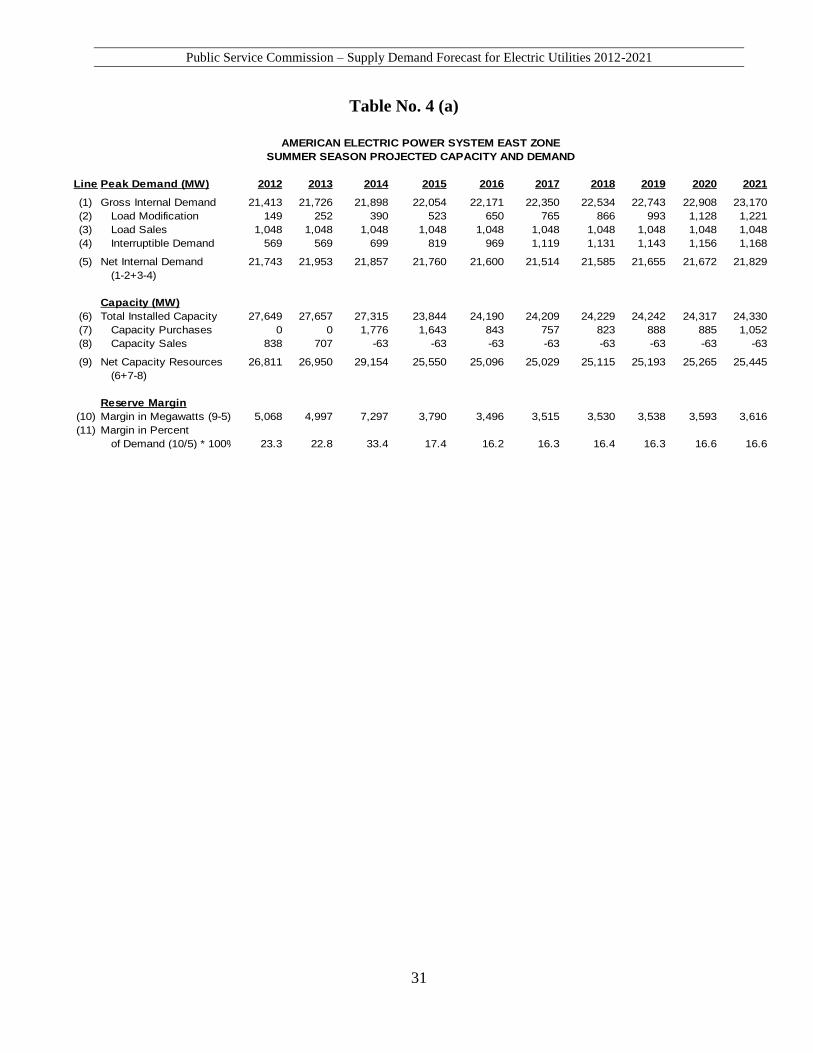
Public Service Commission – Supply Demand Forecast for Electric Utilities 2012-2021
31
Table No. 4 (a)
AMERICAN ELECTRIC POWER SYSTEM EAST ZONE
SUMMER SEASON PROJECTED CAPACITY AND DEMAND
Line Peak Demand (MW) 2012 2013 2014 2015 2016 2017 2018 2019 2020 2021
(1) Gross Internal Demand 21,413 21,726 21,898 22,054 22,171 22,350 22,534 22,743 22,908 23,170
(2) Load Modification 149 252 390 523 650 765 866 993 1,128 1,221
(3) Load Sales 1,048 1,048 1,048 1,048 1,048 1,048 1,048 1,048 1,048 1,048
(4) Interruptible Demand 569 569 699 819 969 1,119 1,131 1,143 1,156 1,168
(5) Net Internal Demand 21,743 21,953 21,857 21,760 21,600 21,514 21,585 21,655 21,672 21,829
(1-2+3-4)
Capacity (MW)
(6) Total Installed Capacity 27,649 27,657 27,315 23,844 24,190 24,209 24,229 24,242 24,317 24,330
(7) Capacity Purchases 0 0 1,776 1,643 843 757 823 888 885 1,052
(8) Capacity Sales 838 707 -63 -63 -63 -63 -63 -63 -63 -63
(9) Net Capacity Resources 26,811 26,950 29,154 25,550 25,096 25,029 25,115 25,193 25,265 25,445
(6+7-8)
Reserve Margin
(10) Margin in Megawatts (9-5) 5,068 4,997 7,297 3,790 3,496 3,515 3,530 3,538 3,593 3,616
(11) Margin in Percent
of Demand (10/5) * 100% 23.3 22.8 33.4 17.4 16.2 16.3 16.4 16.3 16.6 16.6
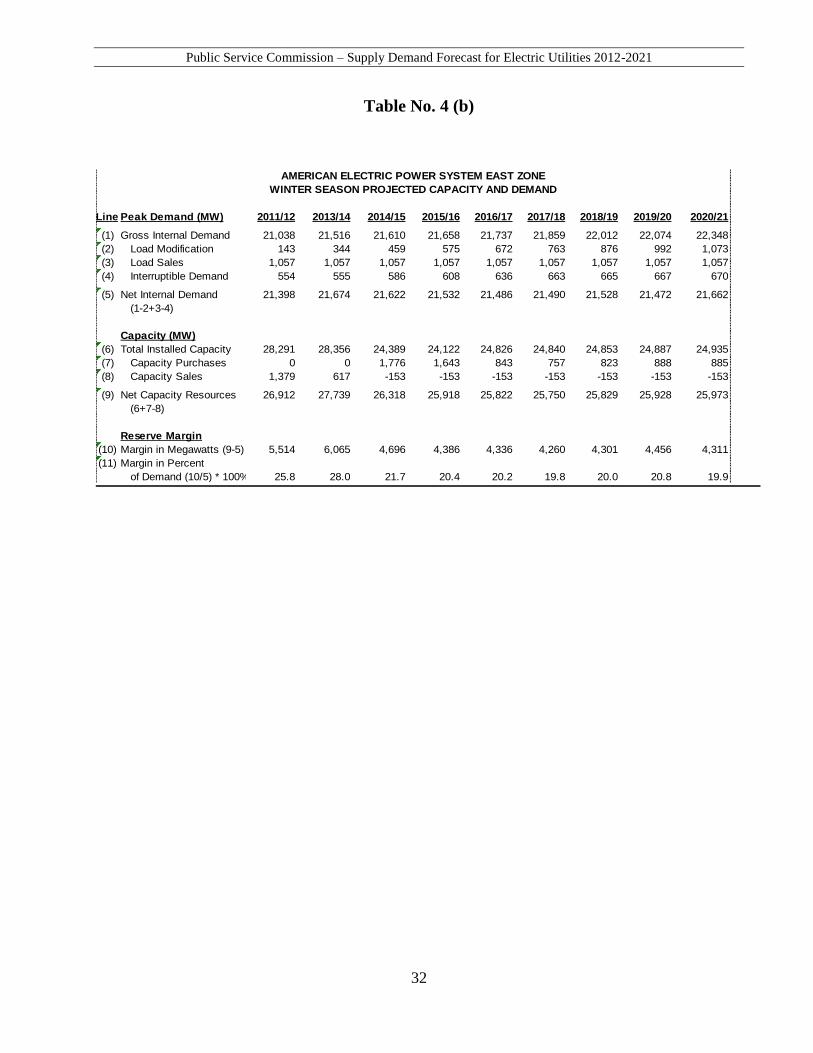
Public Service Commission – Supply Demand Forecast for Electric Utilities 2012-2021
32
Table No. 4 (b)
AMERICAN ELECTRIC POWER SYSTEM EAST ZONE
WINTER SEASON PROJECTED CAPACITY AND DEMAND
Line Peak Demand (MW) 2011/12 2013/14 2014/15 2015/16 2016/17 2017/18 2018/19 2019/20 2020/21
(1) Gross Internal Demand 21,038 21,516 21,610 21,658 21,737 21,859 22,012 22,074 22,348
(2) Load Modification 143 344 459 575 672 763 876 992 1,073
(3) Load Sales 1,057 1,057 1,057 1,057 1,057 1,057 1,057 1,057 1,057
(4) Interruptible Demand 554 555 586 608 636 663 665 667 670
(5) Net Internal Demand 21,398 21,674 21,622 21,532 21,486 21,490 21,528 21,472 21,662
(1-2+3-4)
Capacity (MW)
(6) Total Installed Capacity 28,291 28,356 24,389 24,122 24,826 24,840 24,853 24,887 24,935
(7) Capacity Purchases 0 0 1,776 1,643 843 757 823 888 885
(8) Capacity Sales 1,379 617 -153 -153 -153 -153 -153 -153 -153
(9) Net Capacity Resources 26,912 27,739 26,318 25,918 25,822 25,750 25,829 25,928 25,973
(6+7-8)
Reserve Margin
(10) Margin in Megawatts (9-5) 5,514 6,065 4,696 4,386 4,336 4,260 4,301 4,456 4,311
(11) Margin in Percent
of Demand (10/5) * 100% 25.8 28.0 21.7 20.4 20.2 19.8 20.0 20.8 19.9
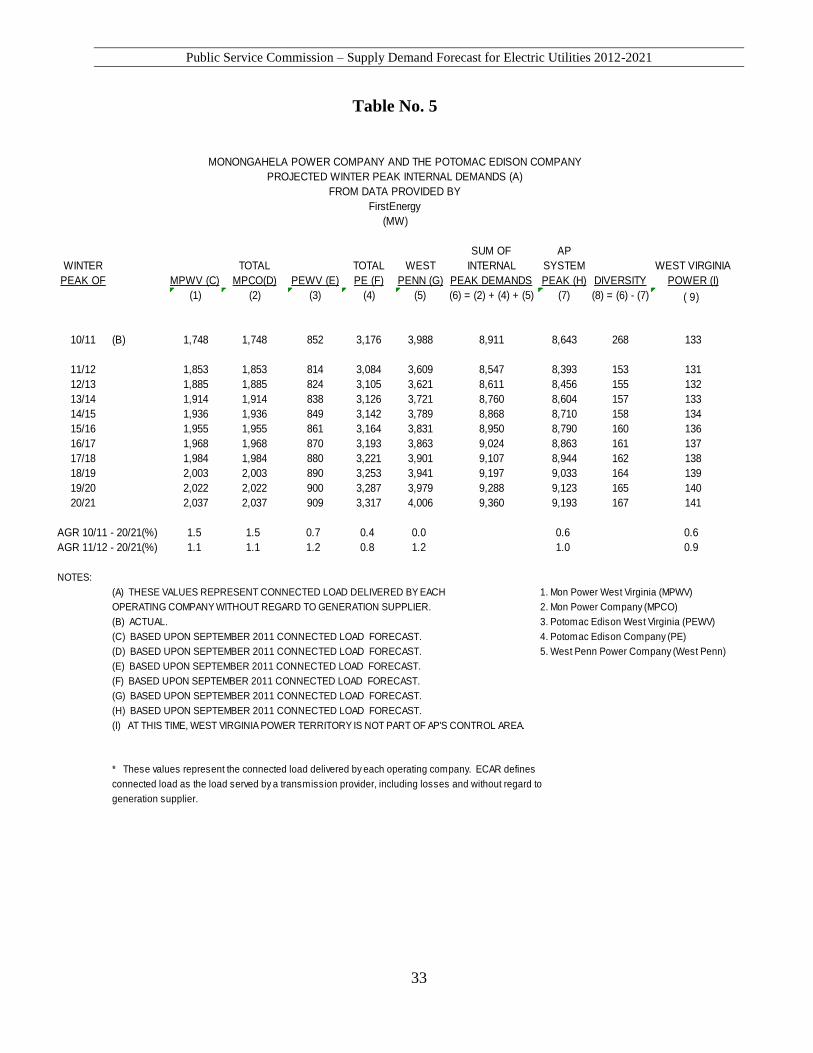
Public Service Commission – Supply Demand Forecast for Electric Utilities 2012-2021
33
Table No. 5
MONONGAHELA POWER COMPANY AND THE POTOMAC EDISON COMPANY
PROJECTED WINTER PEAK INTERNAL DEMANDS (A)
FROM DATA PROVIDED BY
FirstEnergy
(MW)
SUM OF AP
WINTER TOTAL TOTAL WEST INTERNAL SYSTEM WEST VIRGINIA
PEAK OF MPWV (C) MPCO(D) PEWV (E) PE (F) PENN (G) PEAK DEMANDS PEAK (H) DIVERSITY POWER (I)
(1) (2) (3) (4) (5) (6) = (2) + (4) + (5) (7) (8) = (6) - (7) ( 9)
10/11 (B) 1,748 1,748 852 3,176 3,988 8,911 8,643 268 133
11/12 1,853 1,853 814 3,084 3,609 8,547 8,393 153 131
12/13 1,885 1,885 824 3,105 3,621 8,611 8,456 155 132
13/14 1,914 1,914 838 3,126 3,721 8,760 8,604 157 133
14/15 1,936 1,936 849 3,142 3,789 8,868 8,710 158 134
15/16 1,955 1,955 861 3,164 3,831 8,950 8,790 160 136
16/17 1,968 1,968 870 3,193 3,863 9,024 8,863 161 137
17/18 1,984 1,984 880 3,221 3,901 9,107 8,944 162 138
18/19 2,003 2,003 890 3,253 3,941 9,197 9,033 164 139
19/20 2,022 2,022 900 3,287 3,979 9,288 9,123 165 140
20/21 2,037 2,037 909 3,317 4,006 9,360 9,193 167 141
AGR 10/11 - 20/21(%) 1.5 1.5 0.7 0.4 0.0 0.6 0.6
AGR 11/12 - 20/21(%) 1.1 1.1 1.2 0.8 1.2 1.0 0.9
NOTES:
(A) THESE VALUES REPRESENT CONNECTED LOAD DELIVERED BY EACH 1. Mon Power West Virginia (MPWV)
OPERATING COMPANY WITHOUT REGARD TO GENERATION SUPPLIER. 2. Mon Power Company (MPCO)
(B) ACTUAL. 3. Potomac Edison West Virginia (PEWV)
(C) BASED UPON SEPTEMBER 2011 CONNECTED LOAD FORECAST. 4. Potomac Edison Company (PE)
(D) BASED UPON SEPTEMBER 2011 CONNECTED LOAD FORECAST. 5. West Penn Power Company (West Penn)
(E) BASED UPON SEPTEMBER 2011 CONNECTED LOAD FORECAST.
(F) BASED UPON SEPTEMBER 2011 CONNECTED LOAD FORECAST.
(G) BASED UPON SEPTEMBER 2011 CONNECTED LOAD FORECAST.
(H) BASED UPON SEPTEMBER 2011 CONNECTED LOAD FORECAST.
(I) AT THIS TIME, WEST VIRGINIA POWER TERRITORY IS NOT PART OF AP'S CONTROL AREA.
* These values represent the connected load delivered by each operating company. ECAR defines
connected load as the load served by a transmission provider, including losses and without regard to
generation supplier.
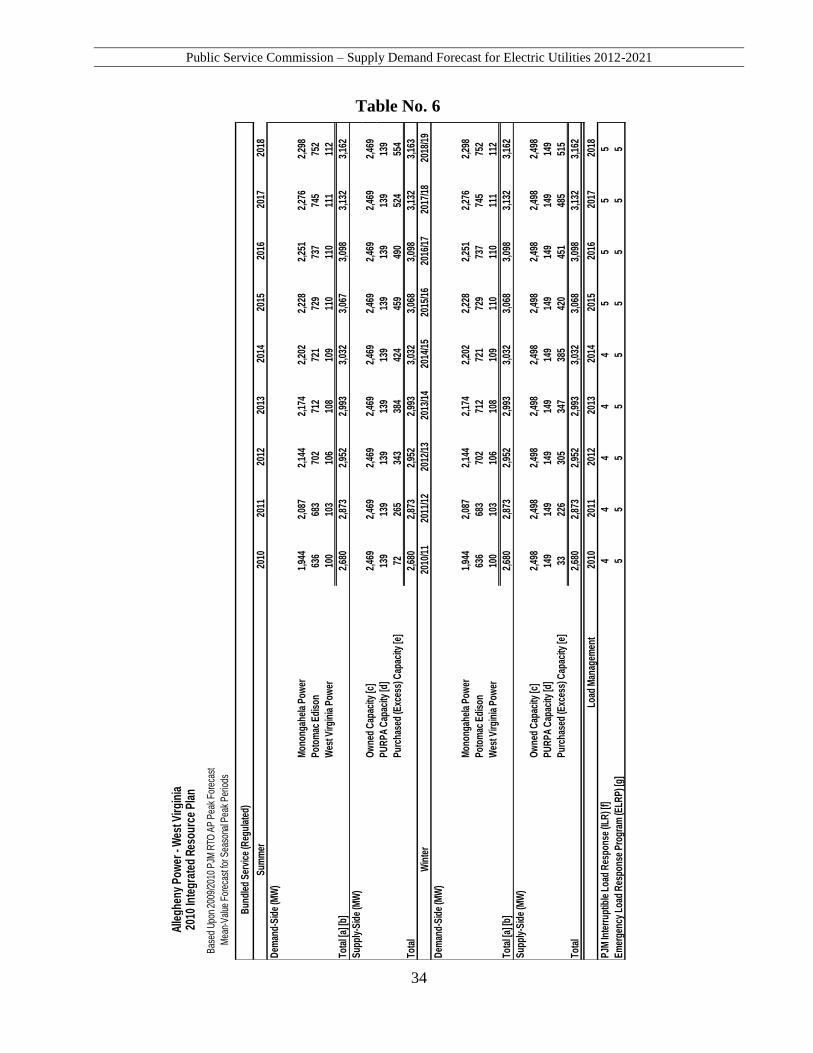
Public Service Commission – Supply Demand Forecast for Electric Utilities 2012-2021
34
Table No. 6
Alle
ghen
y P
ower
- W
est V
irgi
nia
2010
Inte
grat
ed R
esou
rce
Pla
n
Bas
ed U
pon
2009
/201
0 P
JM R
TO A
P P
eak
Fore
cast
Mea
n-V
alue
For
ecas
t for
Sea
sona
l Pea
k P
erio
ds
Bun
dled
Ser
vice
(Reg
ulat
ed)
Sum
mer
2010
2011
2012
2013
2014
2015
2016
2017
2018
Dem
and-
Sid
e (M
W)
Mon
onga
hela
Pow
er1,
944
2,08
72,
144
2,17
42,
202
2,22
82,
251
2,27
62,
298
Pot
omac
Edi
son
636
683
702
712
721
729
737
745
752
Wes
t Virg
inia
Pow
er10
010
310
610
810
911
011
011
111
2
Tota
l [a]
[b]
2,68
02,
873
2,95
22,
993
3,03
23,
067
3,09
83,
132
3,16
2
Sup
ply-
Sid
e (M
W)
Ow
ned
Cap
acity
[c]
2,46
92,
469
2,46
92,
469
2,46
92,
469
2,46
92,
469
2,46
9
PU
RP
A C
apac
ity [d
]13
913
913
913
913
913
913
913
913
9
Pur
chas
ed (E
xces
s) C
apac
ity [e
]72
265
343
384
424
459
490
524
554
Tota
l2,
680
2,87
32,
952
2,99
33,
032
3,06
83,
098
3,13
23,
163
Win
ter
2010
/11
2011
/12
2012
/13
2013
/14
2014
/15
2015
/16
2016
/17
2017
/18
2018
/19
Dem
and-
Sid
e (M
W)
Mon
onga
hela
Pow
er1,
944
2,08
72,
144
2,17
42,
202
2,22
82,
251
2,27
62,
298
Pot
omac
Edi
son
636
683
702
712
721
729
737
745
752
Wes
t Virg
inia
Pow
er10
010
310
610
810
911
011
011
111
2
Tota
l [a]
[b]
2,68
02,
873
2,95
22,
993
3,03
23,
068
3,09
83,
132
3,16
2
Sup
ply-
Sid
e (M
W)
Ow
ned
Cap
acity
[c]
2,49
82,
498
2,49
82,
498
2,49
82,
498
2,49
82,
498
2,49
8
PU
RP
A C
apac
ity [d
]14
914
914
914
914
914
914
914
914
9
Pur
chas
ed (E
xces
s) C
apac
ity [e
]33
226
305
347
385
420
451
485
515
Tota
l2,
680
2,87
32,
952
2,99
33,
032
3,06
83,
098
3,13
23,
162
Load
Man
agem
ent
2010
2011
2012
2013
2014
2015
2016
2017
2018
PJM
Inte
rrup
tible
Loa
d R
espo
nse
(ILR
) [f]
44
44
45
55
5
Em
erge
ncy
Load
Res
pons
e P
rogr
am (E
LRP
) [g]
55
55
55
55
5

Public Service Commission – Supply Demand Forecast for Electric Utilities 2012-2021
35
Notes for Table No. 6
a.
and FPRs from ERPM.
Bundled Service load consists of WV electric customers who do not have retail choice.
b.
c.
d.
e.
f.
g.
h.
i.
j.
k. All EFORd values are as of 11/30/2009. There is no degradation planned in the above generation capacity data. It is assumed outage rates will not change.
Owned Capacity is generation owned by Allegheny Power and used to serve WV bundled service load. The summer capacity is based on the latest available and official PJM RPM
UCAP (Unforced Capacity) values. The winter capacity is based on the latest available winter PJM UCAP values and is only shown as reference.
Some values may not sum exactly due to rounding.
Emergency Load Response Program (ELRP) is a PJM voluntary peak load reduction program that AP started participating in April 2008. The program offers financial rewards to
customers who can reduce their power consumption during periods of high demand or prices. In return for reducing load, the customer is paid a percentage of the wholesale market
price for their reductions. Due to this program being voluntary, these values are shown as reference only and are not used in calculating PJM IRM requirements.
Fort Martin scrubbers will reduce the ICAP for each unit by 20 MWs and are anticipated to be online by December 1, 2009.
Demands are based on AP's share of the 2009/20010 PJM RTO peak (summer) forecast and latest available AP state PLC data and multiplying the PLC by forecasted and actual zonal
Purchased capacity is capacity purchases made by AP for bundled service load requirements, including the PJM Installed Reserve Margin (IRM) requirement of 15%.
This plan represents one of many possible futures based on current legal requirements. While the plan is shown for an extended period of time because of filing requirements, any
projection beyond the near term has a very low probability of occurrence due to uncertainties in the load forecast and in the regulatory environment.
Total loads include the PJM Forecast Pool Requirement (FPR) and Base Residual Auction (BRA) Scaling Factor. These load values, in conjunction with PJM UCAP values for capacity,
comprise the PJM Installed Reserve Margin (IRM) requirement of 15%.
Actual peak hour demands have an equal probability of being over or under the forecast values due to weather variations.
PURPA Capacity is generation purchased from small power production and cogeneration qualifying facilities pursuant to the Public Utility Regulatory Policies Act of 1978 (PURPA).
PURPA generation is currently used by MP to serve bundled service load. Summer capacity is based on official PJM RPM UCAP values and winter capacity is based on the latest
available winter PJM UCAP values and is only shown as reference.
Interruptible Load Response (ILR) program is a PJM reliability program that AP started participating in February 2008. The program pays customers to be ready to reduce load if called
by PJM during system emergencies. The customer must be available for up to 10 reductions per year and have the ability to reduce a minimum of 100 kW per hour. Due to this program
being voluntary, these values are shown as reference only and are not used in calculating PJM IRM requirements. This program expires effective May 31, 2012 and is replace by the
Demand Response Program.

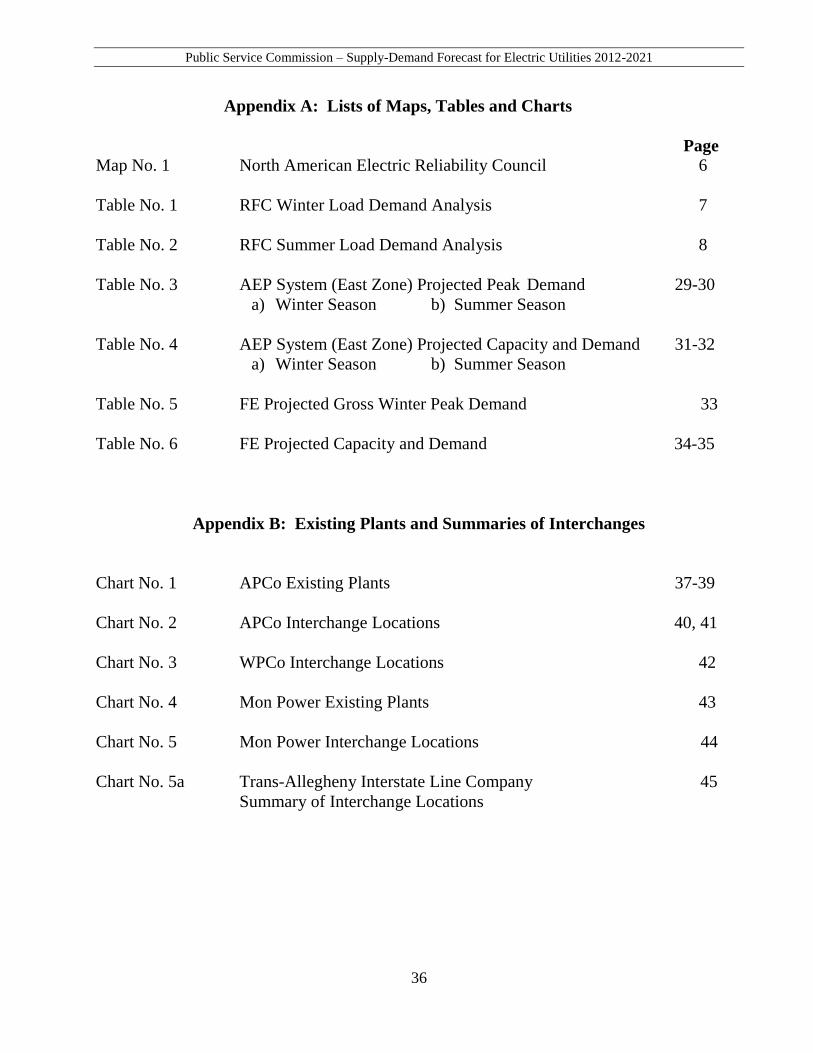
Public Service Commission – Supply-Demand Forecast for Electric Utilities 2012-2021
36
Appendix A: Lists of Maps, Tables and Charts
Page
Map No. 1 North American Electric Reliability Council 6
Table No. 1 RFC Winter Load Demand Analysis 7
Table No. 2 RFC Summer Load Demand Analysis 8
Table No. 3 AEP System (East Zone) Projected Peak Demand 29-30
a) Winter Season b) Summer Season
Table No. 4 AEP System (East Zone) Projected Capacity and Demand 31-32
a) Winter Season b) Summer Season
Table No. 5 FE Projected Gross Winter Peak Demand 33
Table No. 6 FE Projected Capacity and Demand 34-35
Appendix B: Existing Plants and Summaries of Interchanges
Chart No. 1 APCo Existing Plants 37-39
Chart No. 2 APCo Interchange Locations 40, 41
Chart No. 3 WPCo Interchange Locations 42
Chart No. 4 Mon Power Existing Plants 43
Chart No. 5 Mon Power Interchange Locations 44
Chart No. 5a Trans-Allegheny Interstate Line Company 45
Summary of Interchange Locations

Public Service Commission – Supply-Demand Forecast for Electric Utilities 2012-2021
37
Chart 1 (Page 1 of 3) Appalachian Power Company
Existing Plants
Plant Name
Location
Unit No.
Year in Service
Kind
Fuel
APCo %
Ownership
APCo Share Unit Nameplate
Capacity (kW)
APCo Share Unit
Capability (kW)
Kanawha River
Glasgow, WV
1 1953 Steam Coal 100 219,688 200,000
Kanawha River
Glasgow, WV
2
1953
Steam
Coal
100
219,688
200,000
John E. Amos
St. Albans, WV
1
1971
Steam
Coal
100
816,300
790,000
John E. Amos
St. Albans, WV
2
1972
Steam
Coal
100
816,300
790,000
John E. Amos
St. Albans, WV
3
1973
Steam
Coal
33.33*
433,000
433,000
Glen Lyn
Glen Lyn, WV
5
1944
Steam
Coal
100
100,000
95,000
Glen Lyn Glen Lyn, WV
6 1957 Steam Coal 100 237,500 240,000
Philip Sporn
Graham Station, WV
1
1950
Steam
Coal
100
152,500
150,000
Philip Sporn
Graham Station, WV
3
1951
Steam
Coal
100
152,500
150,000
Clinch River
Carbo, VA
1
1958
Steam
Coal
100
237,500
235,000
Clinch River
Carbo, VA
2
1958
Steam
Coal
100
237,500
235,000
Clinch River
Carbo, VA
3
1961
Steam
Coal
100
237,500
235,000
Mountaineer
New Haven, WV
1
1980
Steam
Coal
100
1,300,000
1,320,000
Ceredo
Ceredo, WV
1-6
2001
Comb. Turbine
Nat. Gas
100
519,000
516,000
Totals 5,678,976 5,589,000 *Ohio Power Company owns 66.67% of the 1,300,000kW unit.
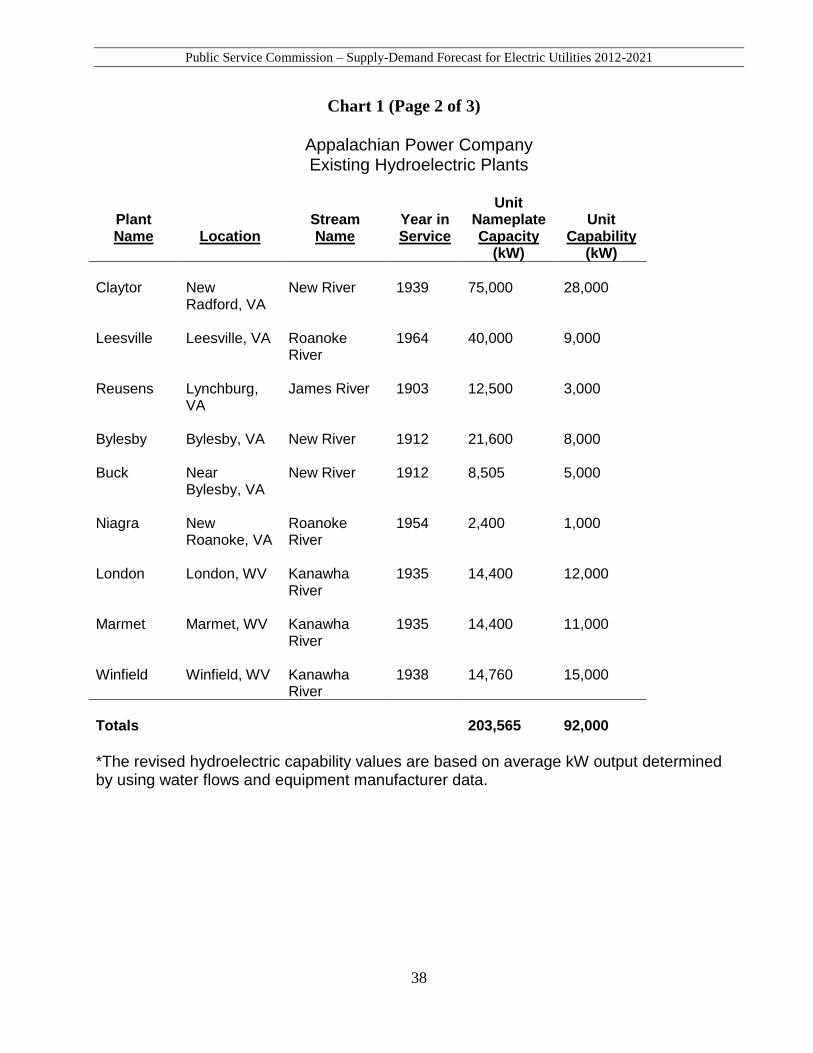
Public Service Commission – Supply-Demand Forecast for Electric Utilities 2012-2021
38
Chart 1 (Page 2 of 3)
Appalachian Power Company Existing Hydroelectric Plants
Plant Name
Location
Stream Name
Year in Service
Unit Nameplate Capacity
(kW)
Unit
Capability (kW)
Claytor
New Radford, VA
New River
1939
75,000
28,000
Leesville
Leesville, VA
Roanoke River
1964
40,000
9,000
Reusens
Lynchburg, VA
James River
1903
12,500
3,000
Bylesby
Bylesby, VA
New River
1912
21,600
8,000
Buck
Near Bylesby, VA
New River
1912
8,505
5,000
Niagra
New Roanoke, VA
Roanoke River
1954
2,400
1,000
London
London, WV
Kanawha River
1935
14,400
12,000
Marmet
Marmet, WV
Kanawha River
1935
14,400
11,000
Winfield
Winfield, WV
Kanawha River
1938
14,760
15,000
Totals
203,565
92,000
*The revised hydroelectric capability values are based on average kW output determined by using water flows and equipment manufacturer data.
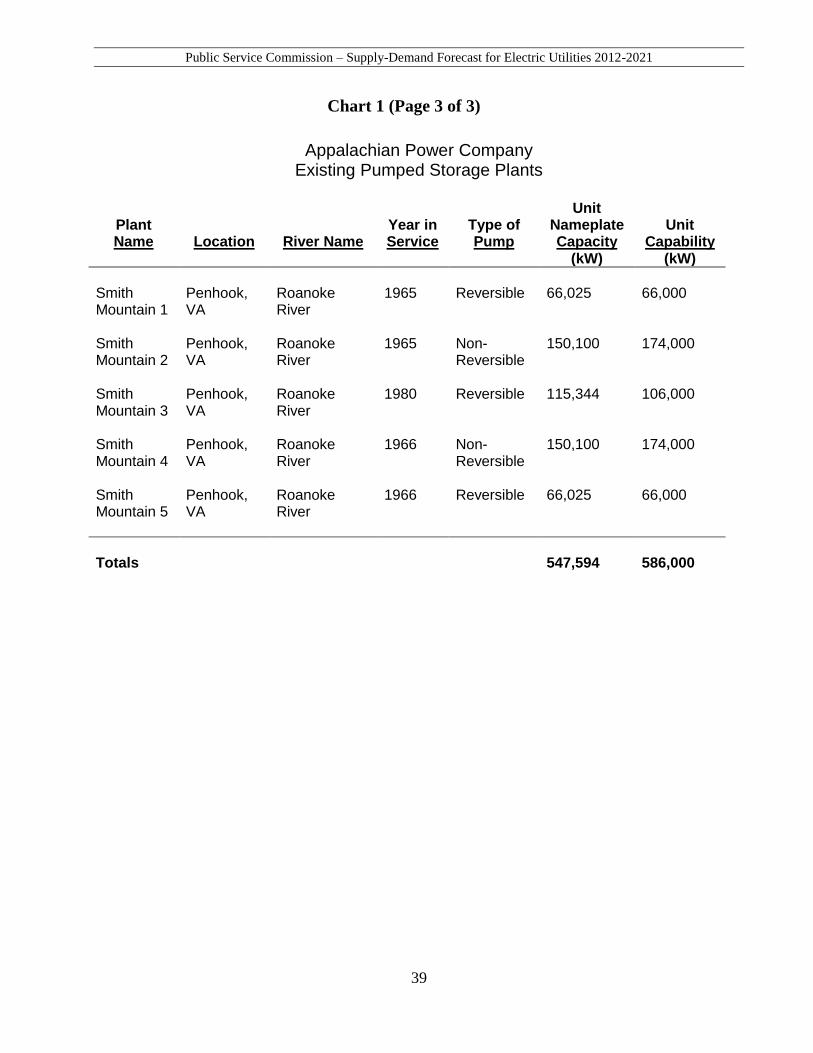
Public Service Commission – Supply-Demand Forecast for Electric Utilities 2012-2021
39
Chart 1 (Page 3 of 3)
Appalachian Power Company Existing Pumped Storage Plants
Plant Name
Location
River Name
Year in Service
Type of Pump
Unit Nameplate Capacity
(kW)
Unit
Capability (kW)
Smith Mountain 1
Penhook, VA
Roanoke River
1965
Reversible
66,025
66,000
Smith Mountain 2
Penhook, VA
Roanoke River
1965
Non-Reversible
150,100
174,000
Smith Mountain 3
Penhook, VA
Roanoke River
1980
Reversible
115,344
106,000
Smith Mountain 4
Penhook, VA
Roanoke River
1966
Non-Reversible
150,100
174,000
Smith Mountain 5
Penhook, VA
Roanoke River
1966
Reversible
66,025
66,000
Totals
547,594
586,000

Public Service Commission – Supply-Demand Forecast for Electric Utilities 2012-2021
40
Chart 2 (Page 1 of 2)
Appalachian Power Company
Summary of Interchange Locations Name of Company Points of Interchange Voltage of
Interchange
Associated Utilities Ohio Power Company Under Terms of the
Interconnection Agreement (7/6/1951)
Various Major Interconnection is at 765kV
Indiana Michigan Power Company Kentucky Power Company
Columbus Southern Power Company
Non-Associated Utilities Carolina Power & Light Company (Progress Energy)
Danville, VA 230kV
Kingsport, TN 138kV
Kingsport, TN 230kV
Duke Power Company (Duke Energy)
Ridgeway, VA
138kV
Austinville, VA 500kV Monongahela Power Company (First Energy)
Bentree, WV
138kV
Quinwood, WV 138kV
Belmont, WV 500kV
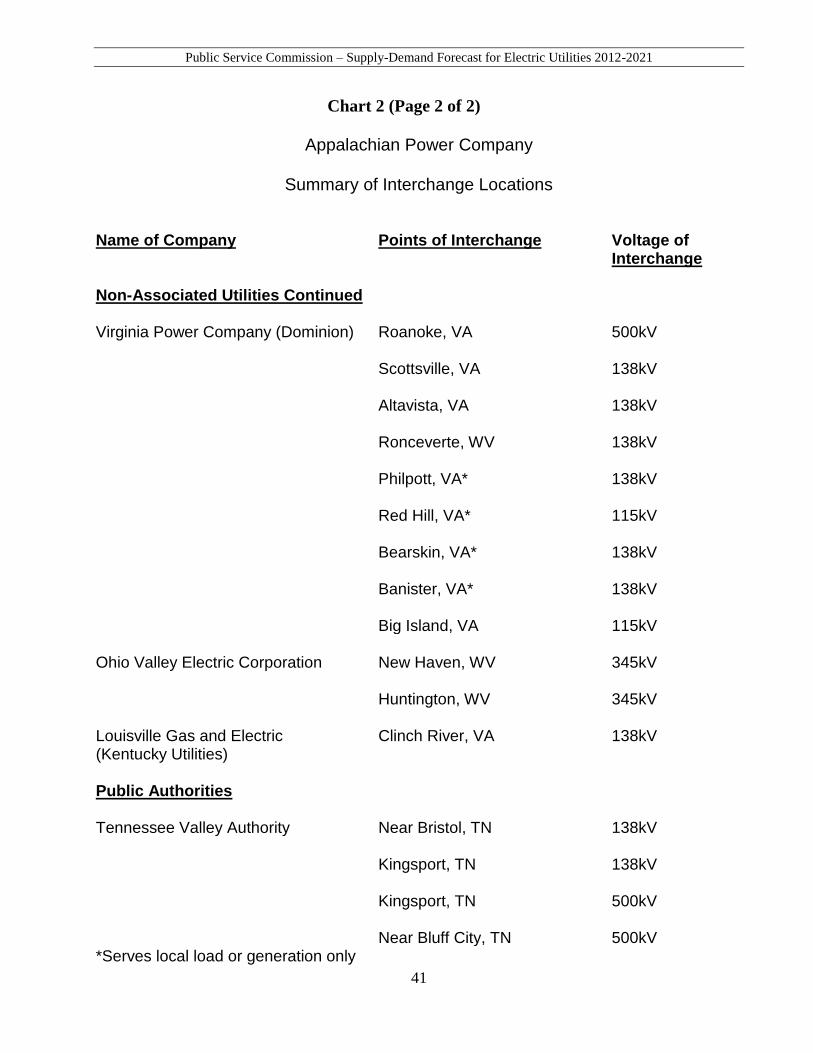
Public Service Commission – Supply-Demand Forecast for Electric Utilities 2012-2021
41
Chart 2 (Page 2 of 2)
Appalachian Power Company
Summary of Interchange Locations Name of Company Points of Interchange Voltage of
Interchange
Non-Associated Utilities Continued Virginia Power Company (Dominion) Roanoke, VA 500kV
Scottsville, VA 138kV
Altavista, VA
138kV
Ronceverte, WV
138kV
Philpott, VA*
138kV
Red Hill, VA*
115kV
Bearskin, VA*
138kV
Banister, VA*
138kV
Big Island, VA
115kV
Ohio Valley Electric Corporation New Haven, WV 345kV
Huntington, WV 345kV
Louisville Gas and Electric (Kentucky Utilities)
Clinch River, VA 138kV
Public Authorities
Tennessee Valley Authority Near Bristol, TN 138kV
Kingsport, TN 138kV
Kingsport, TN
500kV
Near Bluff City, TN
500kV
*Serves local load or generation only
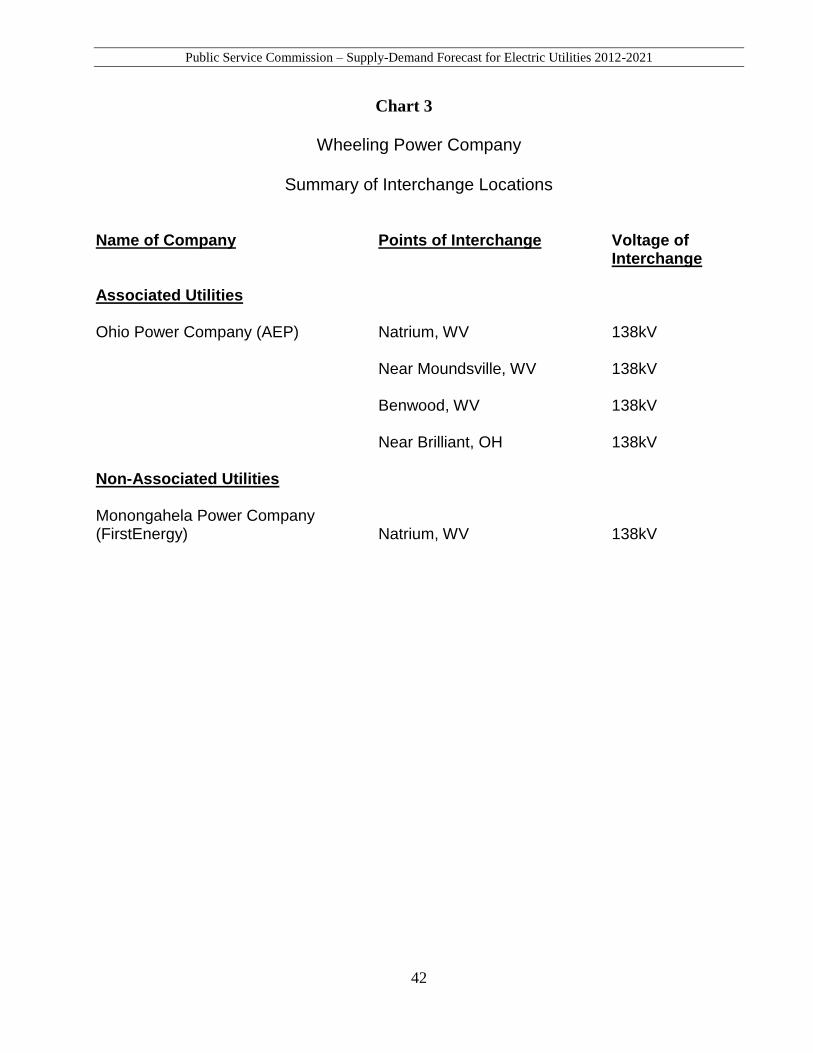
Public Service Commission – Supply-Demand Forecast for Electric Utilities 2012-2021
42
Chart 3
Wheeling Power Company
Summary of Interchange Locations Name of Company Points of Interchange Voltage of
Interchange
Associated Utilities Ohio Power Company (AEP) Natrium, WV 138kV
Near Moundsville, WV 138kV
Benwood, WV
138kV
Near Brilliant, OH
138kV
Non-Associated Utilities
Monongahela Power Company (FirstEnergy)
Natrium, WV
138kV
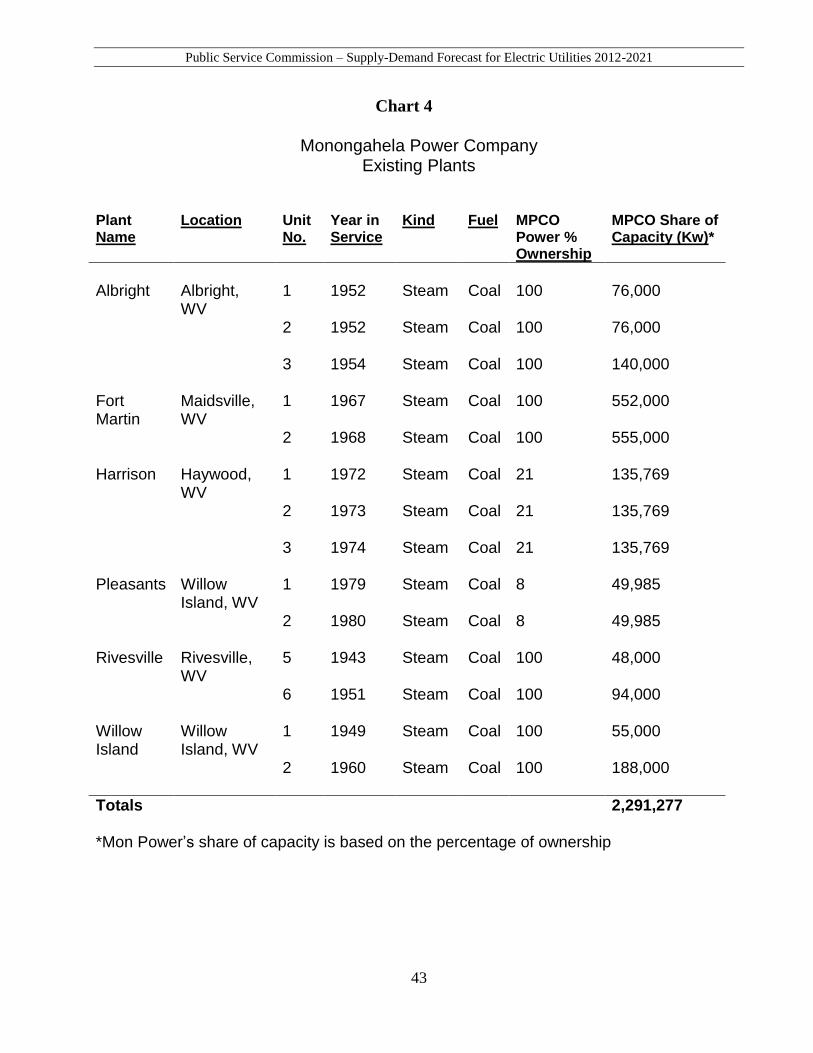
Public Service Commission – Supply-Demand Forecast for Electric Utilities 2012-2021
43
Chart 4
Monongahela Power Company Existing Plants
Plant Name
Location
Unit No.
Year in Service
Kind
Fuel
MPCO Power % Ownership
MPCO Share of Capacity (Kw)*
Albright
Albright, WV
1
1952
Steam
Coal
100
76,000
2 1952 Steam Coal 100 76,000
3 1954
Steam
Coal
100
140,000
Fort Martin
Maidsville, WV
1
1967
Steam
Coal
100
552,000
2 1968 Steam Coal 100 555,000 Harrison
Haywood, WV
1
1972
Steam
Coal
21
135,769
2 1973 Steam Coal 21 135,769
3 1974
Steam
Coal
21
135,769
Pleasants
Willow Island, WV
1
1979
Steam
Coal
8
49,985
2 1980 Steam Coal 8 49,985 Rivesville
Rivesville, WV
5
1943
Steam
Coal
100
48,000
6 1951 Steam Coal 100 94,000 Willow Island
Willow Island, WV
1
1949
Steam
Coal
100
55,000
2 1960 Steam Coal 100 188,000
Totals 2,291,277 *Mon Power’s share of capacity is based on the percentage of ownership
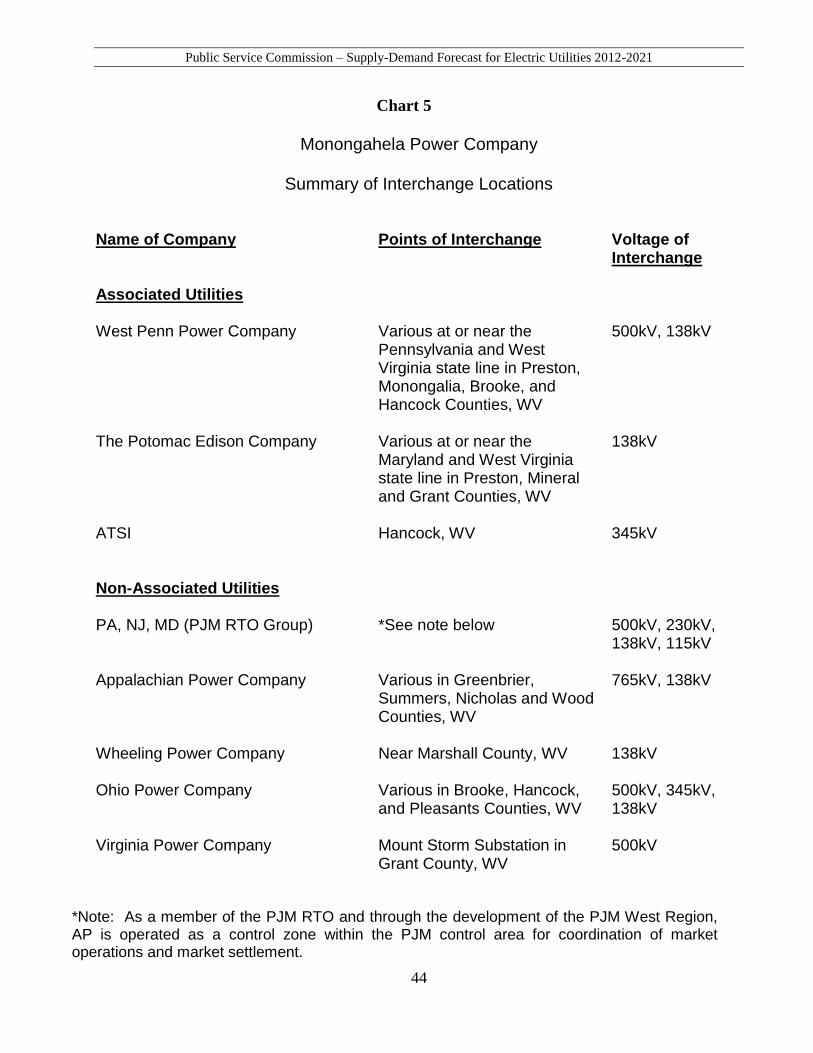
Public Service Commission – Supply-Demand Forecast for Electric Utilities 2012-2021
44
Chart 5
Monongahela Power Company
Summary of Interchange Locations Name of Company Points of Interchange Voltage of
Interchange
Associated Utilities West Penn Power Company Various at or near the
Pennsylvania and West Virginia state line in Preston, Monongalia, Brooke, and Hancock Counties, WV
500kV, 138kV
The Potomac Edison Company
Various at or near the Maryland and West Virginia state line in Preston, Mineral and Grant Counties, WV
138kV
ATSI
Hancock, WV
345kV
Non-Associated Utilities
PA, NJ, MD (PJM RTO Group) *See note below 500kV, 230kV,
138kV, 115kV Appalachian Power Company
Various in Greenbrier, Summers, Nicholas and Wood Counties, WV
765kV, 138kV
Wheeling Power Company
Near Marshall County, WV
138kV
Ohio Power Company
Various in Brooke, Hancock, and Pleasants Counties, WV
500kV, 345kV, 138kV
Virginia Power Company
Mount Storm Substation in Grant County, WV
500kV
*Note: As a member of the PJM RTO and through the development of the PJM West Region, AP is operated as a control zone within the PJM control area for coordination of market operations and market settlement.
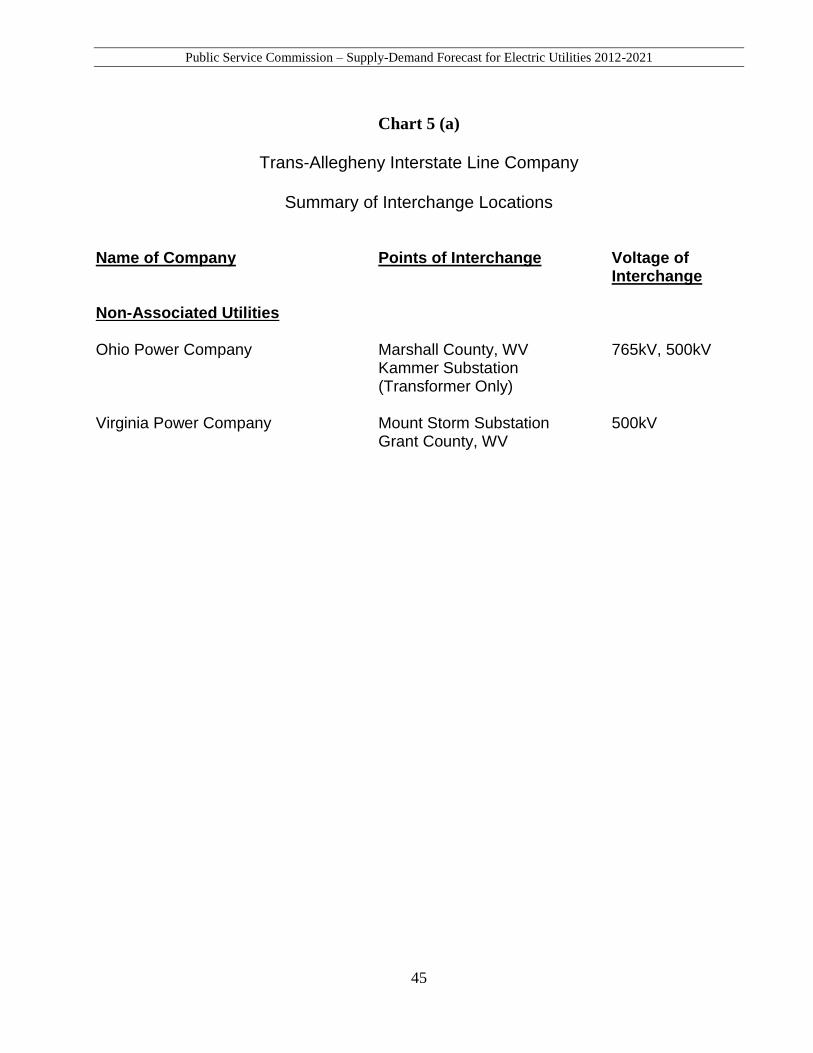
Public Service Commission – Supply-Demand Forecast for Electric Utilities 2012-2021
45
Chart 5 (a)
Trans-Allegheny Interstate Line Company
Summary of Interchange Locations Name of Company Points of Interchange Voltage of
Interchange
Non-Associated Utilities Ohio Power Company
Marshall County, WV Kammer Substation (Transformer Only)
765kV, 500kV
Virginia Power Company
Mount Storm Substation Grant County, WV
500kV