Public Health Performance Indicators
49
PUBLIC HEALTH PERFORMANCE INDICATORS 2013 YEAR-END RESULTS August 2014
Transcript of Public Health Performance Indicators

PUBLIC HEALTH PERFORMANCE INDICATORS
2013 YEAR-END RESULTS
August 2014

Table of Contents
Introduction ........................................................................................................................................................................... 1
Considerations for Interpretation ................................................................................................................................................................................... 2
Health Protection Indicators ................................................................................................................................................... 5
Indicator # 1. % of high-risk food premises inspected once every 4 months while in operation................................................................................... 6
Indicator # 2. % of Class A pools inspected while in operation ...................................................................................................................................... 9
Indicator # 3. % of high-risk Small Drinking Water Systems (SDWS) inspections completed for those that are due for inspection ........................... 12
Indicator # 4. % of confirmed gonorrhea cases where initiation of follow-up occurred within 2 business days ........................................................ 16
Indicator # 5. % of confirmed Invasive Group A Streptococcal Disease (iGAS) cases where initiation of follow-up occurred on the same day as receipt of lab confirmation of a positive case ............................................................................................................................................................... 19
Indicator # 7a. % of vaccine wasted by vaccine type that are stored/administered by the public health unit (HPV) ................................................. 22
Indicator # 7b. % of vaccine wasted by vaccine type that are stored/administered by the public health unit (Influenza) ......................................... 25
Indicators # 9a. & 9b. % of school-aged children who have completed immunizations for Hepatitis B, HPV ............................................................. 28
Indicator # 9c. % of school-aged children who have completed immunizations for Meningococcus ......................................................................... 29
Strategies for Achieving Health Protection Performance Targets ................................................................................................................................ 32
Health Promotion Indicators ................................................................................................................................................. 33
Indicator # 11. % of tobacco vendors in compliance with youth access legislation at the time of last inspection ...................................................... 34
Indicator # 14. Baby-Friendly Initiative (BFI) Status ...................................................................................................................................................... 37
Strategies for Achieving Health Promotion Performance Targets ................................................................................................................................ 41
Summary .............................................................................................................................................................................. 43
Appendices ........................................................................................................................................................................... 44
Appendix 1: Health Unit Names and Abbreviations...................................................................................................................................................... 45
Appendix 2: Indicator Names and Abbreviations .......................................................................................................................................................... 46
1 | P a g e
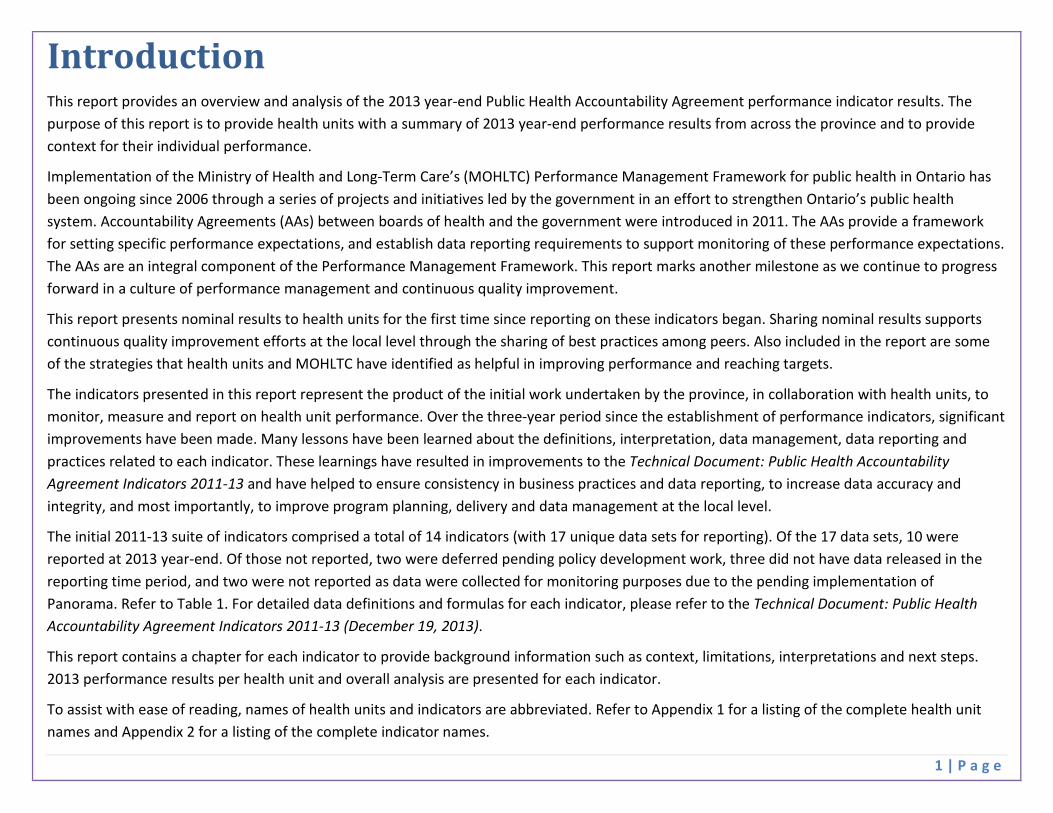
Introduction This report provides an overview and analysis of the 2013 year-end Public Health Accountability Agreement performance indicator results. The purpose of this report is to provide health units with a summary of 2013 year-end performance results from across the province and to provide context for their individual performance.
Implementation of the Ministry of Health and Long-Term Care’s (MOHLTC) Performance Management Framework for public health in Ontario has been ongoing since 2006 through a series of projects and initiatives led by the government in an effort to strengthen Ontario’s public health system. Accountability Agreements (AAs) between boards of health and the government were introduced in 2011. The AAs provide a framework for setting specific performance expectations, and establish data reporting requirements to support monitoring of these performance expectations. The AAs are an integral component of the Performance Management Framework. This report marks another milestone as we continue to progress forward in a culture of performance management and continuous quality improvement.
This report presents nominal results to health units for the first time since reporting on these indicators began. Sharing nominal results supports continuous quality improvement efforts at the local level through the sharing of best practices among peers. Also included in the report are some of the strategies that health units and MOHLTC have identified as helpful in improving performance and reaching targets.
The indicators presented in this report represent the product of the initial work undertaken by the province, in collaboration with health units, to monitor, measure and report on health unit performance. Over the three-year period since the establishment of performance indicators, significant improvements have been made. Many lessons have been learned about the definitions, interpretation, data management, data reporting and practices related to each indicator. These learnings have resulted in improvements to the Technical Document: Public Health Accountability Agreement Indicators 2011-13 and have helped to ensure consistency in business practices and data reporting, to increase data accuracy and integrity, and most importantly, to improve program planning, delivery and data management at the local level.
The initial 2011-13 suite of indicators comprised a total of 14 indicators (with 17 unique data sets for reporting). Of the 17 data sets, 10 were reported at 2013 year-end. Of those not reported, two were deferred pending policy development work, three did not have data released in the reporting time period, and two were not reported as data were collected for monitoring purposes due to the pending implementation of Panorama. Refer to Table 1. For detailed data definitions and formulas for each indicator, please refer to the Technical Document: Public Health Accountability Agreement Indicators 2011-13 (December 19, 2013).
This report contains a chapter for each indicator to provide background information such as context, limitations, interpretations and next steps. 2013 performance results per health unit and overall analysis are presented for each indicator.
To assist with ease of reading, names of health units and indicators are abbreviated. Refer to Appendix 1 for a listing of the complete health unit names and Appendix 2 for a listing of the complete indicator names.

2 | P a g e
Considerations for Interpretation
The following points provide important context for the interpretation of the data in this report.
• The indicators presented are incomplete in that they represent a selection of indicators available at this time, but only begin to describe a subsection of the work that is undertaken by health units to protect and promote the health of Ontarians.
• These specific indicators were chosen through a collaborative process, considering the following criteria: o Reflect a government priority; o Reflect the core business of public health; o Measure at the board of health outcome level as per the Ontario Public Health Standards, 2008 (where possible); o Responsive to change by actions of boards of health; o Opportunity for performance improvement; o Available data source, or data could be collected directly from all boards of health; and o Sensitive; timely; feasible; valid; reliable; understandable; and comparable.
• Many of the indicators have evolved since their inception. Over time, changes have been made to formulas, reporting periods, reporting methods or data sources to address measurement challenges or more accurately reflect the work being measured. For this reason, year over year comparisons of performance may be misleading and are therefore not included.
• There is significant variation between health units in volumes of premises, cases etc., as shown in the health protection indicator chapters. No correlation was found between volumes and performance upon analysis. For example, a performance result of 90% may represent either 90/100 inspections completed or 9/10 inspections completed. Although there is significant variation in volumes across health units for most indicators, the performance results reflect the relative ability of each health unit to complete all required activities within its jurisdiction.
• Each health unit operates under unique local factors and there is variability across health units in terms of demographics, geographic size, human resources, etc. Caution is advised when comparing health unit performance results due to these local attributes, which impact each health unit differently.
• Performance targets were set for all indicators to encourage performance improvement or to maintain the high level of performance already achieved. Targets may vary by health unit depending on the degree of performance improvement the health unit is working to achieve. With the exception of indicator 11 (% of tobacco vendors in compliance with youth access legislation at the time of last inspection), targets have not been included in the report.
• Analysis was conducted to compare overall target achievement across indicators. Because each indicator has a unique history, evolution and interpretation it was felt that such a comparison may be misleading and is therefore not included.

3 | P a g e
• Together with data collection, negative performance variant reports are used as part of the performance management system to encourage health units to reflect on shortfalls and identify mitigation strategies to increase future performance. Positive performance variant reports are used to identify successes and best practices.
Performance indicators are one piece of the larger Performance Management Framework for public health. The MOHLTC continues to partner with health units, Public Health Ontario, health promotion resource centres and other public health organizations to develop, improve and implement additional components of the framework to build a better public health system in Ontario.

4 | P a g e
Table 1: 2011-13 Accountability Agreement indicators with 2013 year-end reporting status
# Indicator 2013 Year-end Reporting Status
1 % of high-risk food premises inspected once every 4 months while in operation Reported
2 % of Class A pools inspected while in operation Reported
3 % of high-risk Small Drinking Water Systems (SDWS) inspections completed for those that are due for inspection Reported
4 % of confirmed gonorrhea cases where initiation of follow-up occurred within 2 business days Reported
5 % of confirmed Invasive Group A Streptococcal Disease (iGAS) cases where initiation of follow-up occurred on the same day as receipt of lab confirmation of a positive case Reported
6 % of known high risk personal services settings inspected annually Not reported; indicator deferred
7a,b % of vaccine wasted by vaccine type that are stored/administered by the public health unit (HPV, Influenza) Reported
8 % completion of reports related to vaccine wastage by vaccine type that are stored/administered by other health care providers
Not reported; indicator deferred
9a,b % of school-aged children who have completed immunizations for Hepatitis B, HPV Not reported; data collected for monitoring purposes
9c % of school-aged children who have completed immunizations for Meningococcus Reported
10 % of youth (ages 12 - 18) who have never smoked a whole cigarette Data not available until Fall 2014*
11 % of tobacco vendors in compliance with youth access legislation at the time of last inspection Reported
12 Fall-related emergency visits in older adults aged 65 + Data not available until Fall 2014*
13 % of population (19+) that exceeds the Low-Risk Drinking Guidelines Data not available until Fall 2014*
14 Baby-Friendly Initiative (BFI) Status Reported
* Data not available for the 2013 year-end reporting period and will be available later in 2014.

5 | P a g e
Health Protection Indicators

6 | P a g e
Indicator # 1. % of high-risk food premises inspected once every 4 months while in operation
Context
The Food Safety Protocol, 2008 (or as current), of the Ontario Public Health Standards, 2008 requires that boards of health conduct inspections of all fixed high-risk food premises “not less than once every four months”.
This indicator monitors the proportion of fixed high-risk food premises that received a routine inspection at least once in each three month period.
This indicator is considered important because high-risk food premises prepare and handle foods where the risk of food-borne illness is high. Frequent inspections ensure adequate monitoring for possible risks of food-borne illness to the population. This is an important public health activity to reduce the incidence of food-borne illnesses.
The numerator and denominator include premises which are open and high-risk for at least one full three month period during the year.
Limitations
This indicator uses self-reported data from health units. There is no separate data source with which to confirm the results.
Data quality and accuracy are dependent on the quality of the food premises inventory and inspection tracking systems used at health units.
There is currently no standardized risk categorization model and the risk categorization of food premises may vary across health units.
Interpretation
Each high-risk food premises must receive three inspections in a year, each within the appropriate timeframe, to be counted towards the performance result for this indicator. Once a premise misses one required inspection, for example in the first three month period, that premise will never be able to meet the required inspection frequency, and target achievement is affected.
Because of the lack of standardization of risk categorization, the results should not be compared across health units, but should be used to assess change against each health unit’s previous performance.
Next Steps
MOHLTC has retained this indicator in the 2014 Public Health Funding and Accountability Agreement. Targets are being established for all health units, and data reporting on performance will take place for 2014 year-end.
7 | P a g e
2013 Performance Results and Analysis
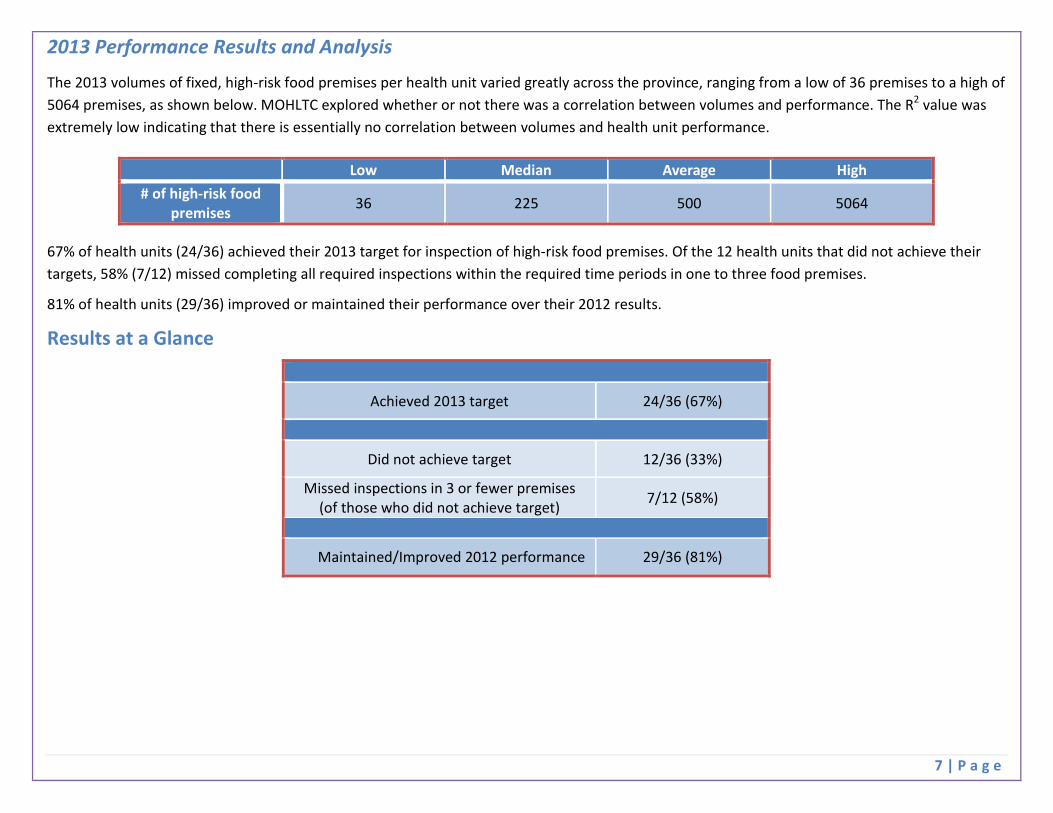
The 2013 volumes of fixed, high-risk food premises per health unit varied greatly across the province, ranging from a low of 36 premises to a high of 5064 premises, as shown below. MOHLTC explored whether or not there was a correlation between volumes and performance. The R2 value was extremely low indicating that there is essentially no correlation between volumes and health unit performance.
67% of health units (24/36) achieved their 2013 target for inspection of high-risk food premises. Of the 12 health units that did not achieve their targets, 58% (7/12) missed completing all required inspections within the required time periods in one to three food premises.
81% of health units (29/36) improved or maintained their performance over their 2012 results.
Results at a Glance
Low Median Average High # of high-risk food
premises 36 225 500 5064
Achieved 2013 target 24/36 (67%)
Did not achieve target 12/36 (33%)
Missed inspections in 3 or fewer premises (of those who did not achieve target) 7/12 (58%)
Maintained/Improved 2012 performance 29/36 (81%)

8 | P a g e
Figure 1: Food inspections health unit 2013 performance (n=36)
The number in brackets following the abbreviated health unit name indicates the # of high-risk food premises in that health unit.
0.0%
10.0%
20.0%
30.0%
40.0%
50.0%
60.0%
70.0%
80.0%
90.0%
100.0%
Perf
orm
ance
Res
ult
Low Median Average Health Unit Performance High 82.1% 100.0% 98.4% 100.0%

9 | P a g e
Indicator # 2. % of Class A pools inspected while in operation
Context
The Recreational Water Protocol, 2008 (or as current), of the Ontario Public Health Standards, 2008 requires that boards of health inspect regulated public pools and public spas at least two times per year and no less than once every three months while in operation.
Regular inspections provide an opportunity to educate owners/operators on up-to-date methods of ensuring recreational water safety. Therefore, monitoring inspection rates is a way of assessing the reach of health units’ activities to educate pool and spa operators and inspect for compliance, both of which are believed to lead to reduced public exposure to recreational water safety risks.
This indicator tracks the proportion of year-round Class A pools (including municipal pools) inspected once in every three month quarter, and Class A seasonal pools inspected at least twice a year while in operation, in accordance with O. Reg. 565 and the Recreational Water Protocol, 2008 (or as current).
The numerator and denominator include year-round pools which are open for at least one full quarter during the year and seasonal pools which were open for any length of time.
Limitations
This indicator uses self-reported data from health units and therefore, there is no separate data source with which to confirm the results.
Data quality and accuracy are dependent on the quality of the pools inventory and inspection tracking systems at the health unit.
Interpretation
Year-round pools must receive four inspections, each within the specified three month period, in a year to be included in the performance result for this indicator. Once a pool misses one required inspection, for example in the first or second quarter of the year, that pool will never be able to meet the required inspection frequency, and target achievement is affected.
Next Steps
MOHLTC has retained this indicator in the 2014 Public Health Funding and Accountability Agreement. Targets are being established for all health units, and data reporting on performance will take place for 2014 year-end.

10 | P a g e
2013 Performance Results and Analysis
The 2013 volumes of year-round Class A pools per health unit ranged across the province from a low of 4 pools to a high of 198 pools, as shown below. MOHLTC explored whether or not there was a correlation between volumes and performance. The R2 value was extremely low indicating that there is essentially no correlation between volumes and health unit performance.
69% of health units (25/36) achieved their 2013 target for inspection of Class A pools. Of the 11 health units that did not achieve their targets, 73% (8/11) missed completing all required inspections within the required time periods for one or two pools.
75% of health units (27/36) improved or maintained their performance over their 2012 results.
Results at a Glance
Low Median Average High # of class A pools 4 13 26 198
Achieved 2013 target 25/36 (69%)
Did not achieve target 11/36 (31%)
Missed inspections in 1 or 2 pools (of those who did not achieve target) 8/11 (73%)
Maintained/Improved 2012 performance 27/36 (75%)

11 | P a g e
Figure 2: Pools inspections health unit 2013 performance (n=36)
The number in brackets following the abbreviated health unit name indicates the # of class A pools in that health unit.
0.0%
10.0%
20.0%
30.0%
40.0%
50.0%
60.0%
70.0%
80.0%
90.0%
100.0%
Perf
orm
ance
Res
ult
Low Median Average Health Unit Performance High 76.9% 100.0% 96.5% 100.0%

12 | P a g e
Indicator # 3. % of high-risk Small Drinking Water Systems (SDWS) inspections completed for those that are due for inspection
Context
The Drinking Water Protocol, 2008 (or as current), of the Ontario Public Health Standards, 2008 requires high-risk SDWS to have routine risk inspections not less than once every two years.
SDWS inspections are conducted by public health inspectors to determine the level of operator compliance with the applicable regulation, to assess the safety of the drinking water supply, and to reduce the incidence of water-borne illness.
This indicator tracks the proportion of SDWS with completed inspections of those that have been assessed as high-risk and are due for inspection in the identified year.
Health units had the option to provide data from local health unit data systems for this indicator in 2013 due to challenges with Risk Categorization and Assessment Tool (RCat) that affected the 2013 data. Health units are still required to use RCat to calculate risk categorizations and to record completed assessments.
All health units that had high-risk SDWS that were due for re-inspection had a 100% target for 2013.
Limitations
The date the risk category was finalized in RCat is used to determine whether a system will be included in this indicator. Where there is a significant lag in time between the date of the risk assessment and the date of the information entry into RCat, a system may be captured as assessed in a different time period from its actual inspection date. It is the responsibility of health unit staff to ensure maintenance of records to ensure data accuracy.
There were some IT issues related to the integrity of data migration from local systems to RCat, which affected health units’ ability to use RCat records for reporting. This was resolved by allowing health units to confirm the data reported for this indicator using records in local data systems.
Interpretation
A high-risk SDWS is considered to be eligible for inclusion when it has received an inspection at any time in the two years since its previous risk assessment. This allows for the inclusion of all SDWS that are inspected earlier than on a strict two-year inspection cycle within this indicator, as this is a fair reflection of health units’ practice of spreading inspections out over the inspection cycle time period.
Health units that do not have any SDWS or do not have any ‘active’ high-risk SDWS for a given year will not have a result for this indicator.

13 | P a g e
The indicator measures routine inspections and does not include non-routine inspections (owner/operator requested, complaint or incident generated).
Next Steps
MOHLTC will continue to reinforce to health units the need to ensure RCat records are maintained, as required by the Drinking Water Protocol, 2008 (or as current).
This indicator has been maintained as a performance indicator in the 2014 Public Health Funding and Accountability Agreement for those health units where additional performance improvement is possible based on 2013 results. For all other health units, this has become a monitoring indicator in 2014; that is no target will be set, but performance will be assessed.

14 | P a g e
2013 Performance Results and Analysis
The volumes of high-risk SDWS due for inspection in 2013 per health unit ranged across the province from a low of 1 to a high of 105, as shown below. MOHLTC explored whether or not there was a correlation between volumes and performance. The R2 value was extremely low indicating that there is essentially no correlation between volumes and health unit performance.
79% of health units (23/29) achieved their 2013 target for this indicator. Of the six health units that did not achieve their target, 67% (4/6) missed one SDWS inspection.
Of the 20 health units that had SDWS due for inspection in both 2012 and 2013, 80% (16/20) improved or maintained their performance over their 2012 results.
Results at a Glance
Low Median Average High # SDWS 1 9 25 105
Achieved 2013 target 23/29 (79%)
Did not achieve target 6/29 (21%)
Missed inspection of 1 SDWS (of those who did not achieve target) 4/6 (67%)
Maintained/Improved 2012 performance 16/20 (80%)

15 | P a g e
Figure 3: SDWS inspections health unit 2013 performance (n=29)
Number in brackets following the abbreviated health unit name indicates # of high-risk SDWS due for inspection in the health unit in 2013.
0.0%
10.0%
20.0%
30.0%
40.0%
50.0%
60.0%
70.0%
80.0%
90.0%
100.0%
Perf
orm
ance
Res
ult
Low Median Average Health Unit Performance High 50.0% 100.0% 96.3% 100.0%

16 | P a g e
Indicator # 4. % of confirmed gonorrhea cases where initiation of follow-up occurred within 2 business days
Context
Appropriate public health case management and timely case management are described in the Infectious Diseases Prevention and Control Standard and the Infectious Diseases Protocol, 2008 (or as current) including the disease-specific chapter for gonorrhea, of the Ontario Public Health Standards, 2008.
Timeliness is a critical aspect of effective health unit case management to ensure cases and contacts receive prompt treatment to reduce the secondary spread of infections.
This indicator monitors the timeliness of health unit follow-up of confirmed cases of gonorrhea.
Next Steps
This indicator has been maintained as a performance indicator in the 2014 Public Health Funding and Accountability Agreement for those health units where additional performance improvement is possible based on 2013 results. For all other health units, this has become a monitoring indicator in 2014; that is no target will be set, but performance will be assessed.

17 | P a g e
2013 Performance Results and Analysis
The 2013 volumes of confirmed gonorrhea cases varied greatly across health units in the province, ranging from a low of 3 confirmed cases to a high of 2189, as shown below. MOHLTC explored whether or not there was a correlation between volumes and performance. There appeared to be a notable negative correlation between performance and confirmed case count. However, as Toronto has roughly the same number of cases as the rest of the health units combined, it was identified as an outlier that was possibly influencing the observed result. The analysis was re-run without Toronto. Once Toronto was removed, the correlation between case count and health unit performance disappeared.
75% of health units (27/36) achieved their 2013 target for cases of gonorrhea followed-up within two business days. Of the nine health units that did not achieve their targets, 56% (5/9) did not follow-up within two business days for one case.
83% of health units (29/35) improved or maintained their performance over their 2012 results. Note, one health unit did not have any confirmed cases of gonorrhea in 2012; therefore, results are based on 35 health units.
Results at a Glance
Low Median Average High # gonorrhea cases 3 26 124 2189
Achieved 2013 target 27/36 (75%)
Did not achieve target 9/36 (25%)
Missed follow-up within 2 business days on 1 case (of those who did not achieve target) 5/9 (56%)
Maintained/Improved 2012 performance 29/35 (83%)

18 | P a g e
Figure 4: Gonorrhea follow-up health unit 2013 performance (n=36)
The number in brackets following the abbreviated health unit name indicates the # of confirmed gonorrhea cases in that health unit.
0.0%
10.0%
20.0%
30.0%
40.0%
50.0%
60.0%
70.0%
80.0%
90.0%
100.0%
Perf
orm
ance
Res
ult
Low Median Average Health Unit Performance High 89.4% 100.0% 98.6% 100.0%

19 | P a g e
Indicator # 5. % of confirmed Invasive Group A Streptococcal Disease (iGAS) cases where initiation of follow-up occurred on the same day as receipt of lab confirmation of a positive case
Context
Appropriate public health case management is described in the Infectious Diseases Prevention and Control Standard and the Infectious Diseases Protocol, 2008 (or as current), including the disease-specific chapter on iGAS of the Ontario Public Health Standards, 2008.
Investigation of confirmed cases should begin as soon as possible after receiving a report.
Monitoring timeliness of health unit response to lab confirmed cases of iGAS is important because iGAS poses a significant burden of disease and timeliness of response is important in efforts to reduce the spread of illness.
In 2013, all health units had a 100% target.
Next Steps
This indicator has been maintained as a performance indicator in the 2014 Public Health Funding and Accountability Agreement for those health units where additional performance improvement is possible. For all other health units, this has become a monitoring indicator in 2014; that is no target will be set, but performance will be assessed.

20 | P a g e
2013 Performance Results and Analysis
The 2013 volumes of confirmed iGAS cases varied across health units in the province from a low of 0 confirmed cases to a high of 118 cases, as shown below. MOHLTC explored whether or not there was a correlation between volumes and performance. The R2 value was extremely low indicating that there is essentially no correlation between volumes and health unit performance.
94% of health units (33/35) achieved their 100% target in 2013 (one health unit did not have any iGAS cases in 2013). Of the two health units that did not achieve their target, both did not follow-up on the same day for one case.
94% of health units (32/34) improved or maintained their performance over their 2012 results. Note this denominator is 34 as it is limited to those health units that had iGAS cases in both 2012 and 2013.
Results at a Glance
Low Median Average High # iGAS cases 0 10 18 118
Achieved 2013 target 33/35 (94%)
Did not achieve target 2/35 (6%)
Missed follow-up on the same day for 1 case (of those who did not achieve target) 2/2 (100%)
Maintained/Improved 2012 performance 32/34 (94%)

21 | P a g e
Figure 5: iGAS follow-up health unit 2013 performance (n=35)
The number in brackets following the abbreviated health unit name indicates the # of confirmed iGAS cases in that health unit.
0.0%
10.0%
20.0%
30.0%
40.0%
50.0%
60.0%
70.0%
80.0%
90.0%
100.0%
Perf
orm
ance
Res
ult
Low Median Average Health Unit Performance High 66.7% 100.0% 99.0% 100.0%

22 | P a g e
Indicator # 7a. % of vaccine wasted by vaccine type that are stored/administered by the public health unit (HPV)
Context
The Vaccine Storage and Handling Protocol, 2008 (or as current) of the Ontario Public Health Standards, 2008 requires that vaccine wastage should not exceed five percent for any one product.
It is believed there are opportunities for further efficiencies by implementing efforts to reduce vaccine wastage, and this is a priority for the MOHLTC.
This indicator relates to the effectiveness of local health unit vaccine storage, handling and management practices. This indicator monitors the percentage of HPV vaccine wasted that is stored, transported, or administered by the health units.
The Ontario Public Health Standards, 2008 states that wastage rates should not exceed 5%. Since vaccine wastage of other health care providers is excluded for the indicators, targets lower than 5% have been negotiated for many health units.
Limitations
Data quality and accuracy are dependent on the inventory management practices at the health unit.
Health units have indicated that calculating HPV vaccine wastage on the calendar year is challenging since ordering and administration is based on the school year.
Interpretation
The data source for this indicator has changed since the baselines were established. To establish the baselines, data were extracted using an existing data source.
In 2012 and 2013, health units were asked to report on a variety of data elements to calculate the indicator.
The formula to calculate HPV vaccine wastage was revised in 2012 and once again in 2013 to improve alignment with the World Health Organization methodology.
In 2013, health units reported on all vaccine doses received, distributed, returned, and administered. All doses not accounted for were considered wasted.
For health units that experienced large amounts of vaccine wastage, this was mostly due to vaccine expiry and cold chain failures.
Next Steps MOHLTC has retained this indicator in the 2014 Public Health Funding and Accountability Agreement. Calculation for HPV vaccine wastage will be based on the school year. The first measurement period will be the 2014/2015 school year.

23 | P a g e
2013 Performance Results and Analysis
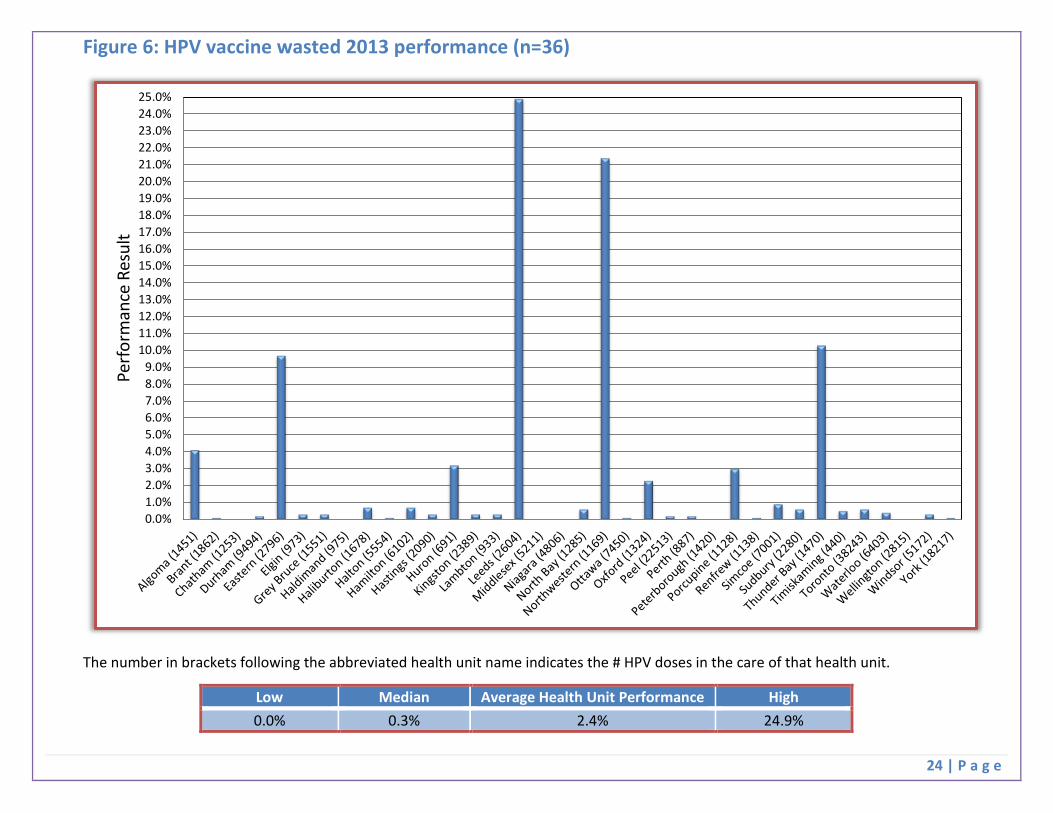
The 2013 volumes of HPV doses in the care and control of a health unit varied greatly across the province, ranging from a low of 440 doses to a high of 38243 doses, as shown below. MOHLTC explored whether or not there was a correlation between volumes and performance. The R2 value was extremely low indicating that there is essentially no correlation between volumes and health unit performance.
44% of health units (16/36) achieved their 2013 target for HPV vaccine wastage. 78% of health units (28/36) had wastage below 1%; 11% of health units (4/36) had wastage between 1% and 5%; and 11% of health units (4/36) had wastage greater than 5%.
Results at a Glance
Low Median Average High # doses in care of
health unit 440 1976 4799 38243
Achieved 2013 target 16/36 (44%)
Did not achieve target 20/36 (56%)
Had <1% wastage 28/36 (78%)
Had between 1% and 5% wastage 4/36 (11%)
Had >5% wastage 4/36 (11%)
24 | P a g e
Figure 6: HPV vaccine wasted 2013 performance (n=36)
The number in brackets following the abbreviated health unit name indicates the # HPV doses in the care of that health unit.
0.0%1.0%2.0%3.0%4.0%5.0%6.0%7.0%8.0%9.0%
10.0%11.0%12.0%13.0%14.0%15.0%16.0%17.0%18.0%19.0%20.0%21.0%22.0%23.0%24.0%25.0%
Perf
orm
ance
Res
ult
Low Median Average Health Unit Performance High 0.0% 0.3% 2.4% 24.9%

25 | P a g e
Indicator # 7b. % of vaccine wasted by vaccine type that are stored/administered by the public health unit (Influenza)
Context
The Vaccine Storage and Handling Protocol, 2008 (or as current), of the Ontario Public Health Standards, 2008 requires that vaccine wastage should not exceed five percent for any one product.
It is believed there are opportunities for further efficiencies by implementing efforts to reduce vaccine wastage, and this is a priority for the MOHLTC.
This indicator relates to the effectiveness of local health unit vaccine storage, handling and management practices. This indicator monitors the percentage of influenza vaccine wasted that is stored, transported, or administered by the health units.
The Ontario Public Health Standards, 2008 states that wastage rates should not exceed 5%. Since vaccine wastage of other health care providers is excluded for the indicators, targets lower than 5% have been negotiated for many health units.
Limitations
Data quality and accuracy are dependent on the inventory management practices at the health unit.
As this indicator is calculated based on the calendar year, the indicator measures the wastage and distribution of a portion of two influenza seasons rather than one complete influenza season.
Interpretation
The data source for this indicator has changed since the baselines were established. To establish the baselines, an existing data source was used as an input to the calculation of the indicator.
In 2012 and 2013 health units were asked to report on a variety of data elements to calculate the indicator.
The formula to calculate influenza vaccine wastage was revised in 2012 and once again in 2013 to improve alignment with the World Health Organization methodology.
In 2013, health units reported on all vaccine doses received, distributed, returned, and administered. All doses not accounted for were considered wasted.
Next Steps
MOHLTC has retained this indicator in the 2014 Public Health Funding and Accountability Agreement. Calculation for influenza vaccine wastage will be based on the flu season. The first measurement period will be the 2014/2015 flu season.
26 | P a g e
2013 Performance Results and Analysis
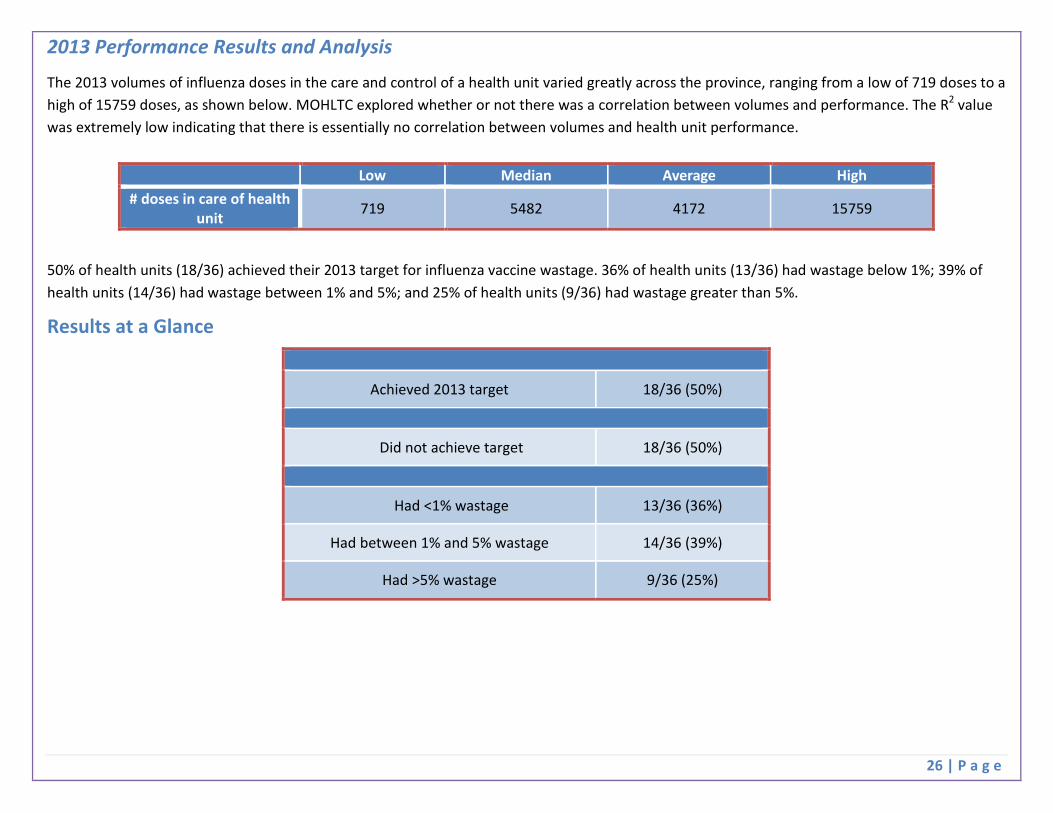
The 2013 volumes of influenza doses in the care and control of a health unit varied greatly across the province, ranging from a low of 719 doses to a high of 15759 doses, as shown below. MOHLTC explored whether or not there was a correlation between volumes and performance. The R2 value was extremely low indicating that there is essentially no correlation between volumes and health unit performance.
50% of health units (18/36) achieved their 2013 target for influenza vaccine wastage. 36% of health units (13/36) had wastage below 1%; 39% of health units (14/36) had wastage between 1% and 5%; and 25% of health units (9/36) had wastage greater than 5%.
Results at a Glance
Low Median Average High # doses in care of health
unit 719 5482 4172 15759
Achieved 2013 target 18/36 (50%)
Did not achieve target 18/36 (50%)
Had <1% wastage 13/36 (36%)
Had between 1% and 5% wastage 14/36 (39%)
Had >5% wastage 9/36 (25%)

27 | P a g e
Figure 7: Influenza vaccine wasted 2013 performance (n=36)
The number in brackets following the abbreviated health unit name indicates the # influenza doses in the care of that health unit.
0.0%1.0%2.0%3.0%4.0%5.0%6.0%7.0%8.0%9.0%
10.0%11.0%12.0%13.0%14.0%15.0%16.0%17.0%18.0%19.0%20.0%21.0%22.0%23.0%24.0%25.0%26.0%27.0%28.0%29.0%30.0%31.0%32.0%33.0%34.0%35.0%36.0%37.0%
Perf
orm
ance
Res
ult
Low Median Average Health Unit Performance High 0.0% 2.6% 4.6% 36.1%

28 | P a g e
Indicators # 9a. & 9b. % of school-aged children who have completed immunizations for Hepatitis B, HPV
Context
These indicators monitor the percentage of:
• Grade 7 students who have completed their immunization series with the Hepatitis B vaccine by the end of the school year; and • Grade 8 female students who have completed their immunization series with the Human Papillomavirus (HPV) vaccine by the end of the
school year.
These indicators reflect the effectiveness of local school based immunization programs. Immunization coverage assessment establishes immunization trends over time, facilitates the identification of sub-populations with inadequate coverage, and contributes to the evaluation of immunization promotion initiatives.
Under the Ontario Public Health Standards, 2008 the board of health is required to promote and provide provincially-funded immunization programs to any eligible person in the health unit. A board of health outcome identified in the Ontario Public Health Standards, 2008 is that “children have up-to-date immunizations according to the current Publicly Funded Immunization Schedule for Ontario and in accordance with the Immunization of School Pupils Act and the Day Nurseries Act (where applicable)”.
The data for the 2012/2013 school year for indicators 9a (completed immunizations for Hepatitis B) and 9b (completed immunizations for HPV) are currently not being reported but were collected by MOHLTC for monitoring purposes. For the 2011/2012 school year, the results were not reported as they appeared to show higher than expected results. MOHLTC worked with Public Health Ontario to review the data and try to determine if there was an issue with the Immunization Records Information System (IRIS) application. Ultimately, the analysis demonstrated that the IRIS application, including changes in IRIS logic parameters, likely had little impact on the observed provincial vaccine coverage rates. As a precautionary measure, however, MOHLTC continued collection of these data for monitoring purposes for the 2012/2013 school year. With the anticipated implementation of Panorama and ongoing transition efforts, MOHLTC will continue to monitor the results for Hepatitis B and HPV coverage but performance achievement will not be reported at this time.
Next Steps
Performance targets were not established for these indicators in 2014 as health units are in the process of being transitioned to Panorama.
MOHLTC will continue to collect data on completed immunizations for Hepatitis B and HPV for monitoring purposes.

29 | P a g e
Indicator # 9c. % of school-aged children who have completed immunizations for Meningococcus
Context
Under the Ontario Public Health Standards, 2008, the board of health is required to promote and provide provincially-funded immunization programs to any eligible person in the health unit.
A board of health outcome identified in the Ontario Public Health Standards, 2008 is that “children have up-to-date immunizations according to the current Publicly Funded Immunization Schedules for Ontario and in accordance with the Immunization of School Pupils Act and the Day Nurseries Act (where applicable)”.
Immunization coverage assessment establishes immunization trends over time, facilitates the identification of sub-populations with inadequate coverage, and contributes to the evaluation of immunization promotion initiatives.
This indicator monitors the percentage of Grade 7 students who have completed their immunization series with the meningococcal conjugate C (Men-C-C) or quadrivalent meningococcal conjugate (Men-C-ACYW135) vaccine by the end of the school year.
This indicator reflects the effectiveness of local school based immunization programs.
Interpretation
The data source for this indicator is currently the Immunization Records Information System (IRIS).
For the 2011/2012 school year, IRIS coverage reports for the above vaccine were requested as of August 31, 2012.
For the 2012/2013 school year, IRIS coverage reports for the above vaccine were requested as of June 30, 2013 and August 31, 2013.
Results from the June 30, 2013 reports are being reported for performance purposes. Since baselines were established from reports as of June 15, 2010, this is more consistent with how baselines were established.
Next Steps
Performance targets were not established for this indicator in 2014 as health units are in the process of being transitioned to Panorama.
MOHLTC will continue to collect data on completed immunizations for Meningococcus for monitoring purposes.

30 | P a g e
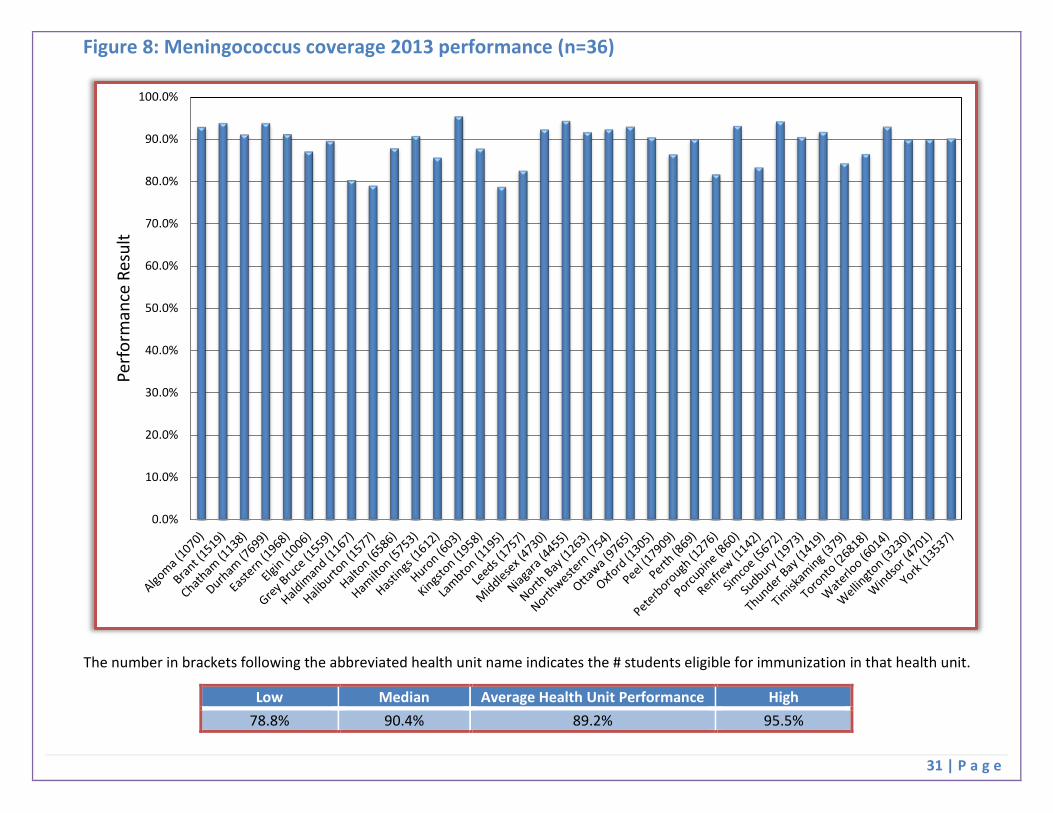
2013 Performance Results and Analysis
The Grade 7 student cohort eligible to receive publicly funded Meningococcus vaccine varied across each health unit in the province, ranging from a low of 379 students to a high of 26818, as shown below. MOHLTC explored whether or not there was a correlation between volumes and performance. The R2 value was extremely low indicating that there is essentially no correlation between volumes and health unit performance.
Note that an analysis of meningococcus target achievement is not included because the indicator measures outcomes at a population level, and due to the nature of the indicator, a technical variance in the data is to be expected.
Low Median Average High # students eligible for
immunization 379 1595 4062 26818
31 | P a g e
Figure 8: Meningococcus coverage 2013 performance (n=36)
The number in brackets following the abbreviated health unit name indicates the # students eligible for immunization in that health unit.
0.0%
10.0%
20.0%
30.0%
40.0%
50.0%
60.0%
70.0%
80.0%
90.0%
100.0%
Perf
orm
ance
Res
ult
Low Median Average Health Unit Performance High 78.8% 90.4% 89.2% 95.5%

32 | P a g e
Strategies for Achieving Health Protection Performance Targets
The following information was extracted from positive performance variant reports (PPVRs) that health units voluntarily submitted as part of the 2012 public health performance indicators year-end reporting. These strategies were implemented following 2012 year-end, resulting in performance improvements in 2013. It should be noted that submission of PPVRs to MOHLTC was a voluntary process in the 2011-13 Accountability Agreement, available to health units that wanted to share their successes. Highlights of some strategies used to improve performance at health units are being shared so that they may be adopted or adapted by other health units, where applicable, to support continuous quality improvement efforts.
Examples of strategies implemented by the field to improve performance include:
• Creating a dashboard that is linked to the Hedgehog Inspection Program. The dashboard allowed staff to view scheduled tasks or inspections that were pending or overdue. Additionally, the manager was able to use the dashboard for oversight and ongoing monitoring of inspection activities to ensure accountability. (Niagara)
• Collaborating with a group of health units also using Hedgehog and with Hedgehog programmers and developers to make system improvements. These improvements have led to successful extraction of data from the Hedgehog system. (Simcoe)
• Developing a plan with inspection staff to be able to deal with potential challenges or delays that can arise in the field. This included having a Food Safety Supervisor available for rapid response in order to avoid delays and having a system in place to deploy backup tablets and printers in the event of equipment breakdown. (Simcoe)
• Formalizing ongoing and routine reporting processes to increase the likelihood that targets are achieved. This included holding consistent team meetings for updates, conducting monthly individual Public Health Inspector reviews, and using Microsoft SharePoint to track workflow. (Waterloo; Leeds; and, Northwestern)
• Quantifying process map timeliness to identify inefficiencies and areas for improvement in program area operations. Data were collected by staff members and used to examine the efficiency of the team’s response time and the total time for file completion. (Simcoe)
• Improving integration with community partners, including nurse practitioners and liaisons at the hospital and family health teams. This was done to enhance knowledge and support the fax-back system in the community. (Simcoe)
• Implementing an improvement plan to enhance performance. Key features included: reallocating resources to ensure timely data entry, increasing staff awareness of the Public Health Accountability Agreement, engaging staff for input on performance improvement, reviewing charts of cases not followed up within a certain timeframe, and conducting monthly reviews of follow-up times by the case-management team. (Ottawa)

33 | P a g e
Health Promotion Indicators

34 | P a g e
Indicator # 11. % of tobacco vendors in compliance with youth access legislation at the time of last inspection
Context
This indicator measures compliance with sections 3(1) and 3(2) of the Smoke-Free Ontario Act (SFOA), which prohibit the sale of tobacco products to persons under the age of 19 years.
Tobacco vendor behaviour is an important aspect in monitoring youth access to tobacco products. Therefore, tracking vendor compliance rates will allow boards of health to assess the effectiveness of their education and enforcement efforts.
Under the Ontario Public Health Standards, 2008, boards of health are required to implement and enforce the Smoke Free Ontario Act in accordance with provincial protocols, including but not limited to the Tobacco Compliance Protocol, 2008 (or as current).
Board of health outcomes include:
• Priority populations adopt tobacco free living; • Tobacco vendors are in compliance with the Smoke Free Ontario Act; • Youth have reduced access to tobacco products.
Interpretation
The data source for this indicator is the MOHLTC Tobacco Information System (TIS).
TIS vendor compliance rates are established at mid-year (June) and at year-end (December).
Compliance rates for mid-year are reported for information purposes; year-end compliance rates are reported for performance purposes.
Next Steps
MOHLTC will continue with mid-year and year-end reporting for this indicator.

35 | P a g e
2013 Performance Results and Analysis
91.7% (33/36) health units achieved their 2013 target.
Results at a Glance
Achieved 2013 target 33/36 (92%)
Did not achieve target 3/36 (8%)
Mean performance 96.7%
Median performance 98.1%
Performance range 86.8% - 100.0%
Average performance increase 1.5%

36 | P a g e
Figure 9: Tobacco Vendor Compliance 2013 performance (n=36)
0%
10%
20%
30%
40%
50%
60%
70%
80%
90%
100%Co
mpl
ianc
e
Health Unit
Target: 90%
37 | P a g e
Indicator # 14. Baby-Friendly Initiative (BFI) Status
Context
The Baby-Friendly Initiative (BFI) is evidenced based and recognized globally and by the World Health Organization as a best practice, designed to improve breastfeeding outcomes for mothers and babies by improving the quality of their care and establishing breastfeeding as the cultural norm.
The BFI Status indicator monitors public health performance related to the implementation of a number of BFI requirements to promote, support and protect breastfeeding. Breastfeeding requirements are identified in the Reproductive Health and Child Health Standards of the Ontario Public Health Standards, 2008.
This indicator monitors the Baby-Friendly Initiative (BFI) implementation status of all Ontario health units using the Public Health Unit BFI Status Report. BFI status categories are:
• Preliminary work towards BFI (primarily the planning phase); • Intermediate work towards BFI (implementation of the BFI 10 Steps) ; • Advanced work towards BFI (verification of BFI 10 Steps implementation by BFI Ontario/Breastfeeding Committee for Canada (BCC)); • BFI designation (includes Re-designation); and • BFI maintenance/preparation for Re-designation.
Interpretation
Ontario’s health units self-report using the BFI Status Report and the Reference Guide definitions. When a health unit is in the Advanced Category, the length of time to complete each requirement depends on the quality of the work completed in the Intermediate Category as well as the recommendations provided by BCC. Thus, some targets may not have been met within the anticipated time frame identified, although steady progress is being maintained.
Next Steps
MOHLTC will continue mid-year and year-end reporting for this indicator. MOHLTC to clarify reporting requirements for BFI maintenance/planning for BFI re-designation to support continuous quality improvement. MOHLTC to require all health units to maintain BFI designation through BCCs BFI re-designation process every five years.
38 | P a g e
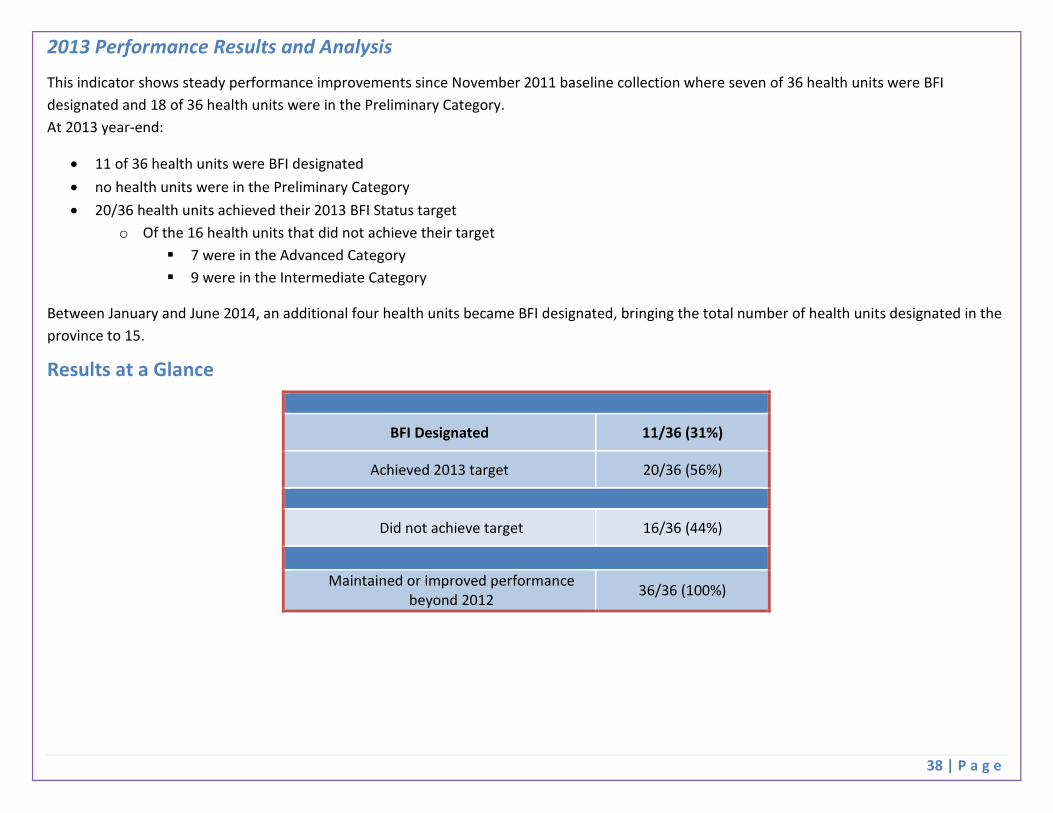
2013 Performance Results and Analysis
This indicator shows steady performance improvements since November 2011 baseline collection where seven of 36 health units were BFI designated and 18 of 36 health units were in the Preliminary Category. At 2013 year-end:
• 11 of 36 health units were BFI designated • no health units were in the Preliminary Category • 20/36 health units achieved their 2013 BFI Status target
o Of the 16 health units that did not achieve their target 7 were in the Advanced Category 9 were in the Intermediate Category
Between January and June 2014, an additional four health units became BFI designated, bringing the total number of health units designated in the province to 15.
Results at a Glance
BFI Designated 11/36 (31%)
Achieved 2013 target 20/36 (56%)
Did not achieve target 16/36 (44%)
Maintained or improved performance
beyond 2012 36/36 (100%)
39 | P a g e
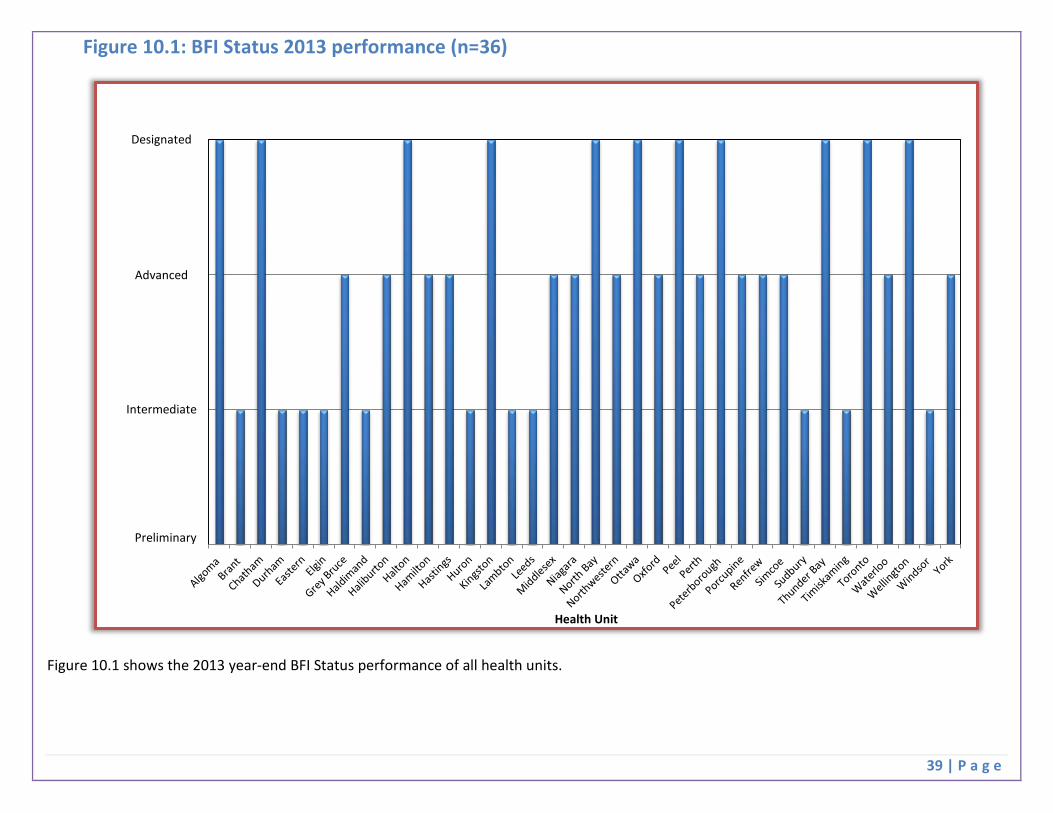
Figure 10.1: BFI Status 2013 performance (n=36)
Figure 10.1 shows the 2013 year-end BFI Status performance of all health units.
Health Unit
Designated
Advanced
Intermediate
Preliminary

40 | P a g e
Figure 10.2: BFI Status 2013 Performance Results Mapped by Health Unit

41 | P a g e
Strategies for Achieving Health Promotion Performance Targets
The following strategies have been identified based on MOHLTC review, as well as the positive performance variant reports (PPVRs) submitted by health units who achieved or made significant progress with a health promotion indicator in either the 2012 or 2013 reporting periods.
Indicator #11: Tobacco Vendor Compliance:
What is working well: 1. Tobacco Information System (TIS)
• Ongoing improvements in data collection and management methods (e.g. health unit data entry as per program guidelines, standardized approach to data entry)
• MOHLTC owned data system vs. other data sources (e.g. CCHS) gives control over data availability; real-time; high quality • Health units are inputting data more frequently to ensure data is more reliable and timely
2. Improved linkages between Tobacco Program Guidelines and Public Health Accountability Agreements
• Reinforces program level requirements for vendor compliance • Identifies specific local issues so MOHLTC can work with the health units to address them (e.g. issues related to test shoppers, capacity,
program implementation)
3. Health unit reporting twice per year provides opportunity to identify and address issues
Indicator #14: Baby-Friendly Initiative (BFI) Status:
Positive Performance Attributes: 1. Utilization of resource supports:
• Linked to BFI supporting organizations (e.g. BFI Ontario, Breastfeeding Committee for Canada, BFI designated health units) • Leverage benefits as an RNAO Spotlight Organization through implementation of best practices and developing a culture focussed on
quality
2. Organizational supports:
• Senior management leadership support • Dedicated BFI coordinator – health unit lead for keeping the BFI designation process on track • Local breastfeeding/BFI committee – multidisciplinary collaboration within and beyond health unit supports sustainability and shared
ownership • BFI champions – facilitate BFI progress; may be senior management or program staff

42 | P a g e
3. Effective planning and implementation strategies:
• Utilized workplans to identify key steps and processes for implementation of best practices • Planned surveillance and data collection (e.g. regular infant feeding surveys) • Addressed local needs • Collaborating with and supporting other agencies in their BFI Journey • Documented work and progress
4. Continuous Quality Improvement:
• Health units begin planning for BFI redesignation following BFI designation • Policies and processes related to knowledge transfer, education, training, ensure maintenance of BFI designation
5. Sharing of BFI lessons learned:
• Positive Performance Variant Reports were submitted by the following health units with agreement to share with others: Niagara Region; Oxford County; Porcupine; City of Toronto; Wellington-Dufferin-Guelph; Kingston, Frontenac, Lennox and Addington; City of Ottawa
• BFI designated health units have provided updates at the MOHLTC Health Promotion Division, Ontario Family Health Management in Public Health Network teleconferences and have invited others to connect with them as needed
• BFI Ontario provides a teleconference quarterly for all community health agencies (e.g. health units, community health centres, family health teams, etc.) who are interested in, working towards, or BFI designated. Learnings are shared in this community of practice
43 | P a g e
Summary The Public Health Performance Indicators 2013 Year-end Results report provides health units’ performance indicator results based on indicators in the 2011-13 Accountability Agreement, together with lessons learned related to the indicators.
Overall the report shows high levels of achievement for most health units across the indicators. The implementation of performance indicators has provided opportunities for health units to review their existing performance and business practices in order to improve or maintain strong performance in key areas of public health importance.
Several health units voluntarily provided positive performance variant reports to MOHLTC following successful achievement of their target for an indicator. MOHLTC has summarized this information to further enable peer to peer support and knowledge exchange related to best practices. Health units are encouraged to use this report to reach out to others to better support performance across all indicators. Valuable insights were also provided in the negative performance variant reports required by MOHLTC in instances where achievements of targets were not obtained.
While considerable progress has been achieved since baselines were established, there remain opportunities for continued improvement for each health unit. Where health units have achieved high levels of performance, it is expected that processes will remain in place to continue achieving these high levels.
Sharing health unit progress and accomplishments to date supports a culture of performance management. This report represents another step forward in strengthening the public health system in Ontario through continuous quality improvement, transparency and accountability.

44 | P a g e
Appendices

45 | P a g e
Appendix 1: Health Unit Names and Abbreviations Names of health units have been abbreviated in this document. Refer to the table below for the full legal name of Ontario’s 36 boards of health, as per the HPPA, regulation 553.
# Health Unit Name as per the HPPA Abbreviated Name 1 The District of Algoma Health Unit Algoma 2 Brant County Health Unit Brant 3 Chatham-Kent Health Unit Chatham 4 Durham Regional Health Unit Durham 5 The Eastern Ontario Health Unit Eastern 6 Elgin-St. Thomas Health Unit Elgin 7 Grey Bruce Health Unit Grey Bruce 8 Haldimand-Norfolk Health Unit Haldimand 9 Haliburton, Kawartha, Pine Ridge District Health Unit Haliburton
10 Halton Regional Health Unit Halton 11 City of Hamilton Health Unit Hamilton 12 Hastings and Prince Edward Counties Health Unit Hastings 13 Huron County Health Unit Huron 14 Kingston, Frontenac and Lennox and Addington Health Unit Kingston 15 Lambton Health Unit Lambton 16 Leeds, Grenville and Lanark District Health Unit Leeds 17 Middlesex-London Health Unit Middlesex 18 Niagara Regional Area Health Unit Niagara 19 North Bay Parry Sound District Health Unit North Bay 20 Northwestern Health Unit Northwestern 21 City of Ottawa Health Unit Ottawa 22 Oxford County Health Unit Oxford 23 Peel Regional Health Unit Peel 24 Perth District Health Unit Perth 25 Peterborough County-City Health Unit Peterborough 26 Porcupine Health Unit Porcupine 27 Renfrew County and District Health Unit Renfrew 28 Simcoe Muskoka District Health Unit Simcoe 29 Sudbury and District Health Unit Sudbury 30 Thunder Bay District Health Unit Thunder Bay 31 Timiskaming Health Unit Timiskaming 32 City of Toronto Health Unit Toronto 33 Waterloo Health Unit Waterloo 34 Wellington-Dufferin-Guelph Health Unit Wellington 35 Windsor-Essex County Health Unit Windsor 36 York Regional Health Unit York

46 | P a g e
Appendix 2: Indicator Names and Abbreviations
Names of indicators have been abbreviated in this document. Refer to the table below for the full indicator name.
# Complete Indicator Name Abbreviated Name
1 % of high-risk food premises inspected once every 4 months while in operation Food Inspections
2 % of Class A pools inspected while in operation Pools Inspections
3 % of high-risk Small Drinking Water Systems (SDWS) inspections completed for those that are due for inspection SDWS Inspections
4 % of confirmed gonorrhea cases where initiation of follow-up occurred within 2 business days gonorrhea Follow-up
5 % of confirmed Invasive Group A Streptococcal Disease (iGAS) cases where initiation of follow-up occurred on the same day as receipt of lab confirmation of a positive case iGAS Follow-up
6 % of known high risk personal services settings inspected annually --
7a,b % of vaccine wasted by vaccine type that are stored/administered by the public health unit (HPV, Influenza)
HPV Wastage Influenza Wastage
8 % completion of reports related to vaccine wastage by vaccine type that are stored/administered by other health care providers --
9a, b % of school-aged children who have completed immunizations for Hepatitis B, HPV --
9c % of school-aged children who have completed immunizations for Meningococcus Meningococcus
10 % of youth (ages 12 - 18) who have never smoked a whole cigarette --
11 % of tobacco vendors in compliance with youth access legislation at the time of last inspection Tobacco Vendor Compliance
12 Fall-related emergency visits in older adults aged 65 + --
13 % of population (19+) that exceeds the Low-Risk Drinking Guidelines --
14 Baby-Friendly Initiative (BFI) Status BFI Status