Public Health Class By Georges Metellus, M.D., M.P.H American University of Antigua 5 th Semester...
81
Public Health Class By Georges Metellus, M.D., M.P.H American University of Antigua 5 th Semester Program Director Miami Site
-
Upload
isaac-reeves -
Category
Documents
-
view
214 -
download
0
Transcript of Public Health Class By Georges Metellus, M.D., M.P.H American University of Antigua 5 th Semester...

Public Health Class
By Georges Metellus, M.D., M.P.H American University of Antigua 5th Semester Program Director Miami Site
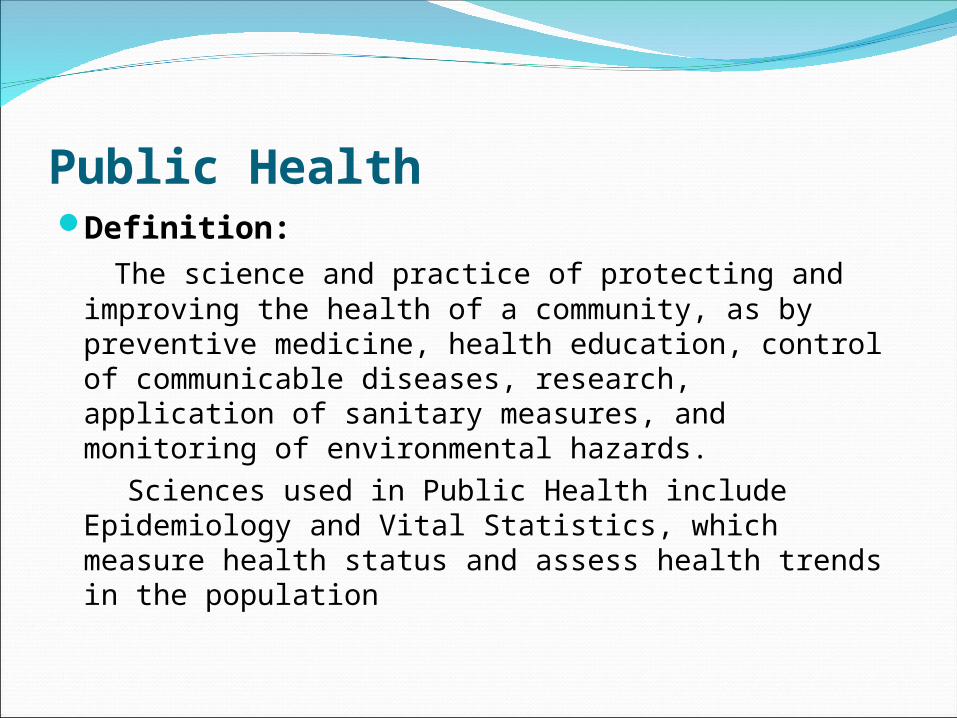
Public HealthDefinition: The science and practice of protecting and
improving the health of a community, as by preventive medicine, health education, control of communicable diseases, research, application of sanitary measures, and monitoring of environmental hazards.
Sciences used in Public Health include Epidemiology and Vital Statistics, which measure health status and assess health trends in the population
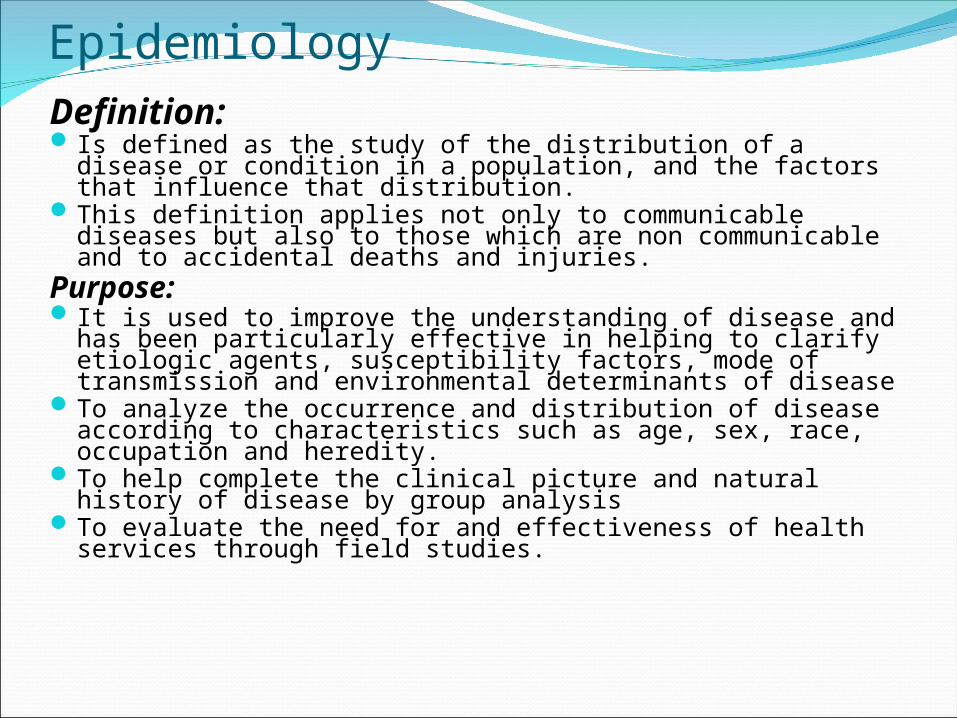
EpidemiologyDefinition: Is defined as the study of the distribution of a disease or
condition in a population, and the factors that influence that distribution.
This definition applies not only to communicable diseases but also to those which are non communicable and to accidental deaths and injuries.
Purpose: It is used to improve the understanding of disease and has
been particularly effective in helping to clarify etiologic agents, susceptibility factors, mode of transmission and environmental determinants of disease
To analyze the occurrence and distribution of disease according to characteristics such as age, sex, race, occupation and heredity.
To help complete the clinical picture and natural history of disease by group analysis
To evaluate the need for and effectiveness of health services through field studies.
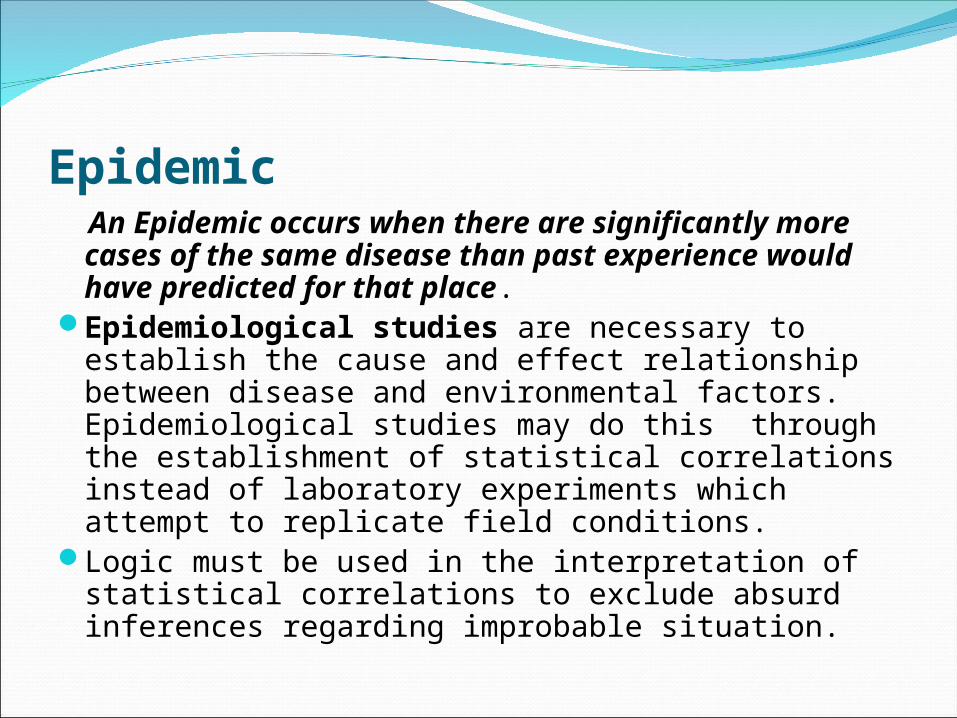
Epidemic An Epidemic occurs when there are
significantly more cases of the same disease than past experience would have predicted for that place.
Epidemiological studies are necessary to establish the cause and effect relationship between disease and environmental factors. Epidemiological studies may do this through the establishment of statistical correlations instead of laboratory experiments which attempt to replicate field conditions.
Logic must be used in the interpretation of statistical correlations to exclude absurd inferences regarding improbable situation.
ExerciseQuestion: It was learned during an investigation
in Michigan, that between April 30 and May 16, 1968, approximately 32 cases of infectious hepatitis had been reported to the County Health Department in North Trail, Michigan. Could one conclude that this is a problem of epidemic proportion? Why?
Answer: One cannot determine whether or not 32
cases of jaundice constitute an epidemic unless one knows how many cases to expect in that place during that time, In other words, be sure these cases are in excess of what may be expected. One could also apply a statistical test.
Disease
Disease in the individual may be considered the outcome of the interaction of three factors: AGENT, HOST, and ENVIRONMENT.
Scrutiny of the results of such interaction enables one to recognize characteristics common among the sick and rare among the well. SPECTRUM of DISEASE: is defined as the sequence of events that occurs in the human organism from the time of exposure to the etiological agent to death. It is composed of 2 components: a) a sub clinical b) clinical illness INCUBATION PERIOD: This is the interval between the time of contact and/or entry of the agent and onset of illness.
CARRIERS: are persons who harbor specific infectious agents without discernible clinical disease but who can be reservoir or sources of infection.

ExerciseQuestion: A male patient was exposed to an
infected sex worker on December 10, 2007. He was tested for HIV on December 13, 2007. His test result then, was negative. On the 2nd of April 2008 he tested again and found to be HIV (+). Should this period between the day of exposure and the day he became positive, be called “period of incubation”? Was this person a carrier during this period?
Answer: This period between the exposure to the virus to the time HIV become positive is called “Window Period”. During this time the person may be infectious (carrier)
Disease (cont’)
FOMITES: Inanimate objects that have come in contact with a sick person. Not all fomites are equally dangerous books, coins). The transmission of disease through fomites may be considered an indirect-contact transmission.
ZOONOSIS: diseases transmitted through animals(Brucellosis, Anthrax, Leptospirosis)
ARTHROPOD-BORNE diseases (insects and arachnids), Malaria, yellow fever, dengue, filariasis.
ORNITHOSIS (Psittacosis): diseases transmitted to man through direct contact with infected birds, including some of our domestic fowl-chicken, ducks, and turkeys
HealthHealth is a state of complete physical,
mental, and social well-being and not merely the absence of disease or infirmity.
According to WHO any impairment of physiological and mental functioning or physical and mental growth and development would be considered to be ill-health or disease.
HERD IMMUNITY: decreases the probability that an individual will develop a particular disease when exposed to an infectious agent.
Health Outcome and Clinical EventsDissatisfaction: emotional and mental states
such as agitation, sadness, or anger.Discomfort: uncomfortable symptoms such as
pain, nausea, vertigo, vomiting, fatigue.Disease: a combination of symptoms, physical
signs and laboratory test results. Disability: the functional status of patients in
terms of ability to live independently and go about their daily lives at home, work or recreation.
Death: A universal health outcome, the timeliness of the event being the issue.
EnvironmentEnvironmental health refers to
characteristics of environmental conditions which affect the quality of health. This is that aspect of public health that is concerned with those forms of life, substances, forces, and conditions in the surroundings of man that may exert an influence on human health and well-being.
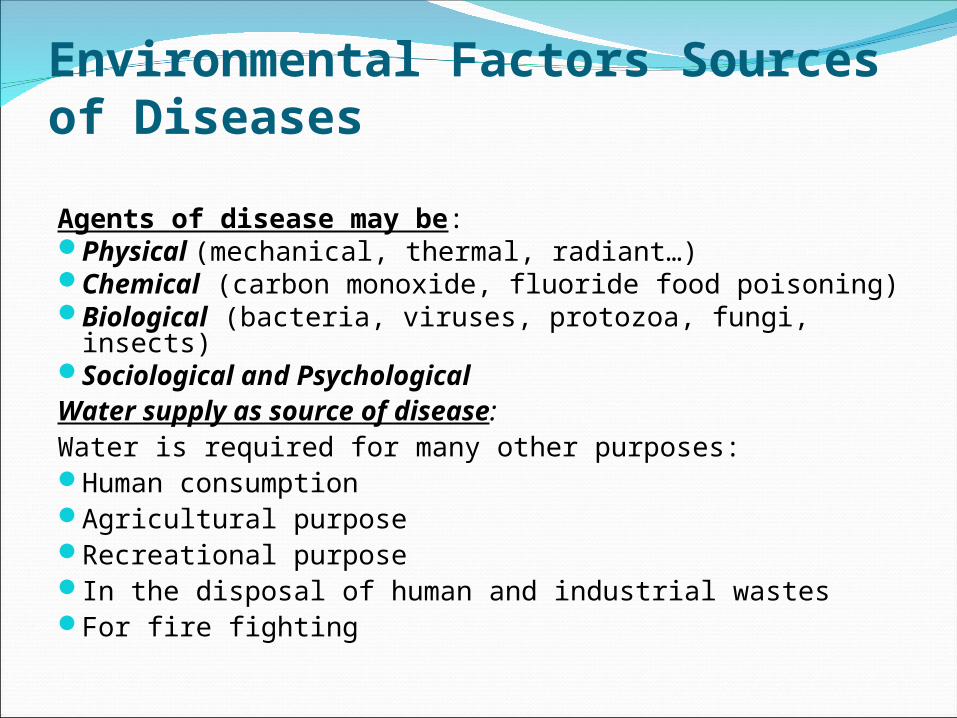
Environmental Factors Sources of Diseases
Agents of disease may be:Physical (mechanical, thermal, radiant…)Chemical (carbon monoxide, fluoride food poisoning)Biological (bacteria, viruses, protozoa, fungi, insects)Sociological and Psychological Water supply as source of disease:Water is required for many other purposes:Human consumptionAgricultural purposeRecreational purposeIn the disposal of human and industrial wastesFor fire fighting
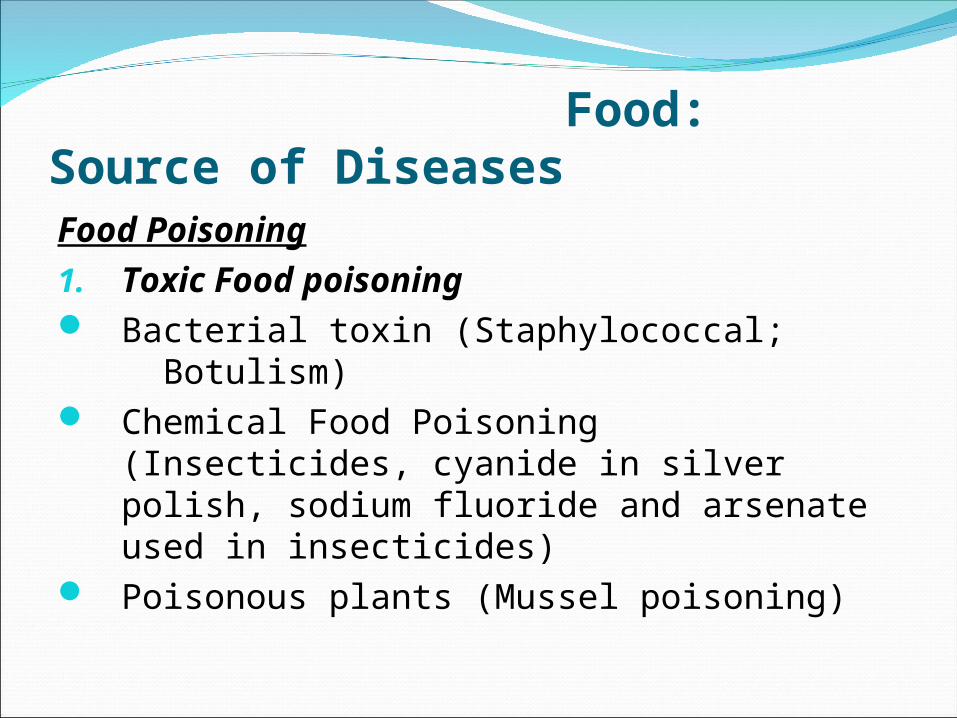
Food: Source of DiseasesFood Poisoning1. Toxic Food poisoning Bacterial toxin (Staphylococcal;
Botulism) Chemical Food Poisoning (Insecticides,
cyanide in silver polish, sodium fluoride and arsenate used in insecticides)
Poisonous plants (Mussel poisoning)
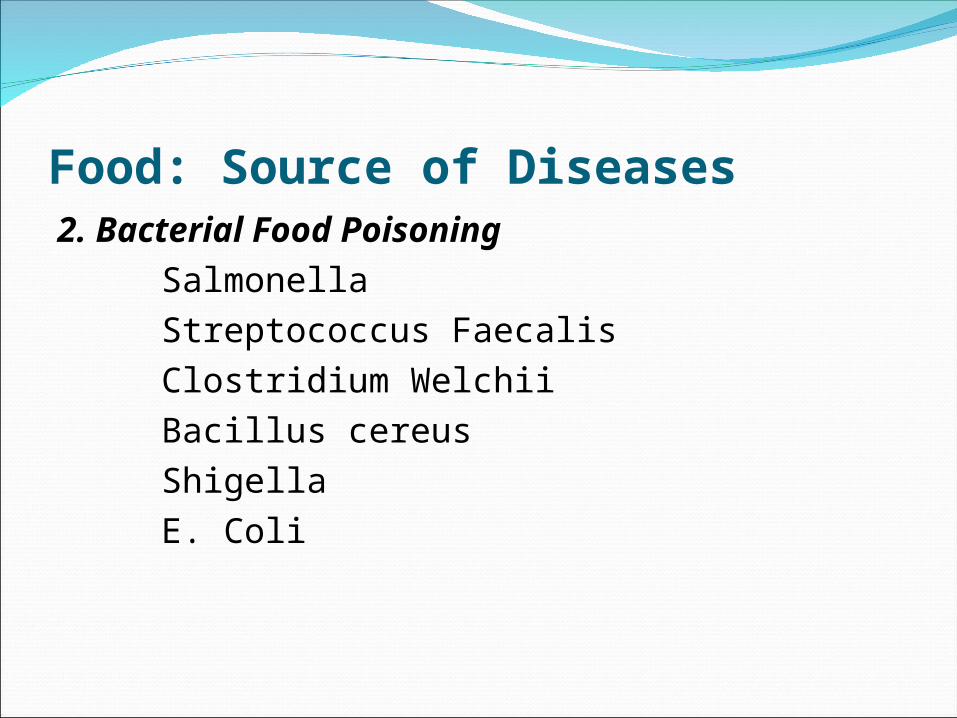
Food: Source of Diseases2. Bacterial Food Poisoning Salmonella Streptococcus Faecalis Clostridium Welchii Bacillus cereus Shigella E. Coli
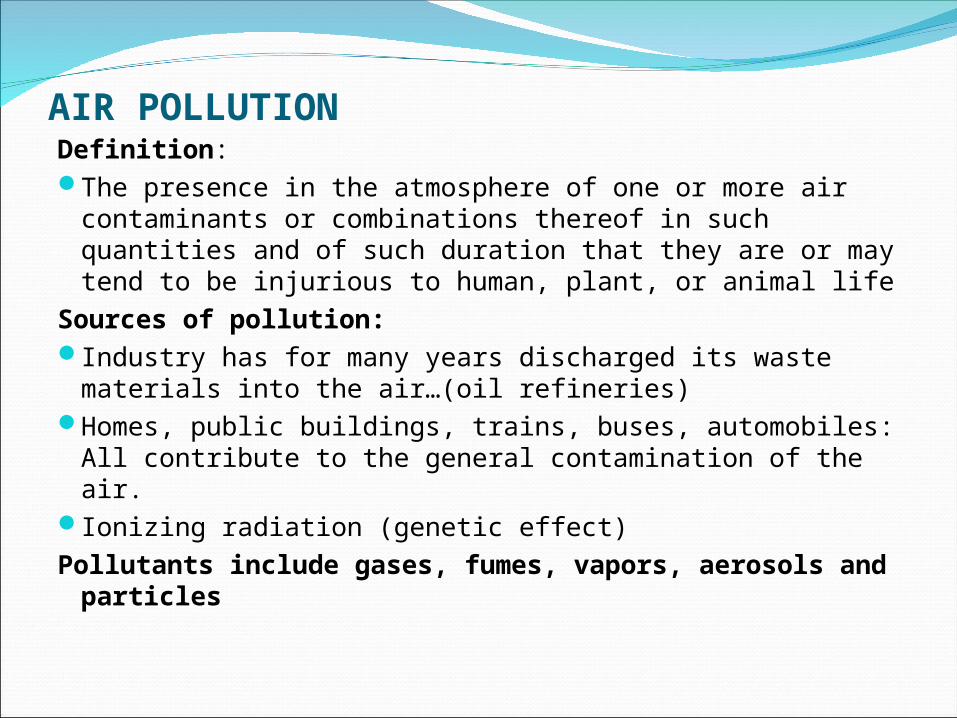
AIR POLLUTIONDefinition:The presence in the atmosphere of one or more air
contaminants or combinations thereof in such quantities and of such duration that they are or may tend to be injurious to human, plant, or animal life
Sources of pollution:Industry has for many years discharged its waste
materials into the air…(oil refineries)Homes, public buildings, trains, buses, automobiles:
All contribute to the general contamination of the air.Ionizing radiation (genetic effect)Pollutants include gases, fumes, vapors, aerosols
and particles
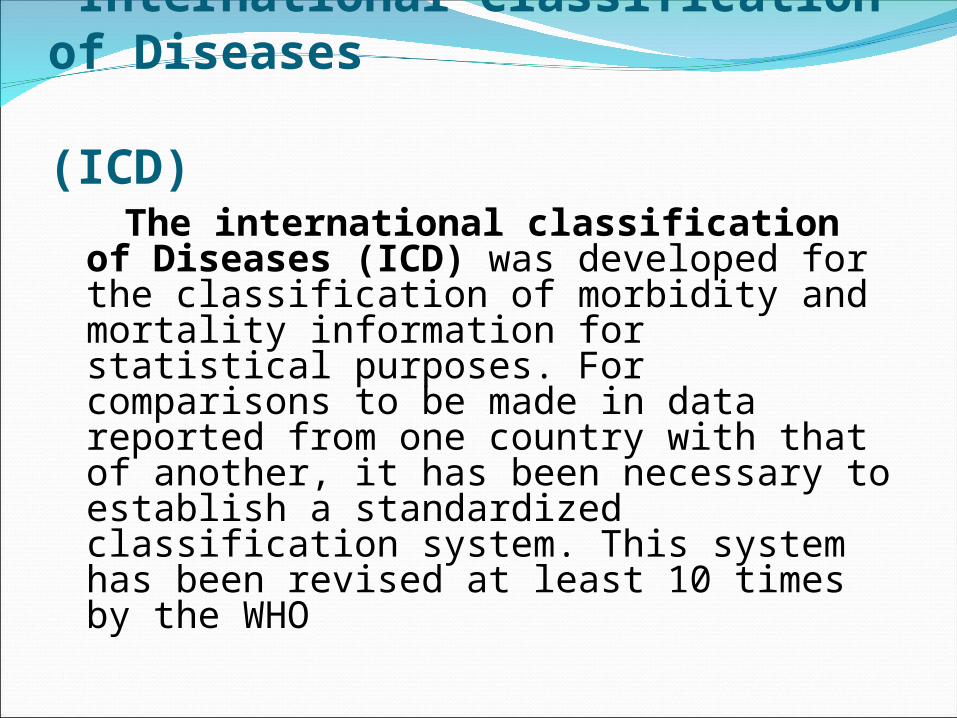
International Classification of Diseases (ICD) The international classification of
Diseases (ICD) was developed for the classification of morbidity and mortality information for statistical purposes. For comparisons to be made in data reported from one country with that of another, it has been necessary to establish a standardized classification system. This system has been revised at least 10 times by the WHO
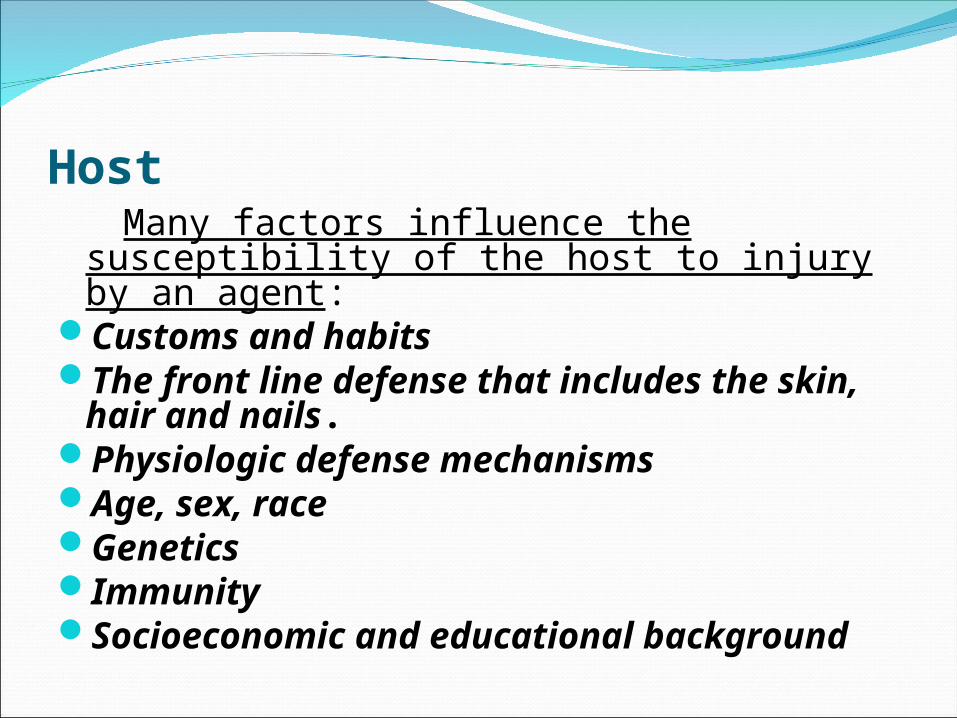
Host Many factors influence the susceptibility
of the host to injury by an agent:Customs and habitsThe front line defense that includes
the skin, hair and nails.Physiologic defense mechanismsAge, sex, raceGeneticsImmunitySocioeconomic and educational
background
Epidemiology cont’Epidemiology draws on: Biology Sociology Mathematics Statistics Anthropology Psychology Economics and Policy
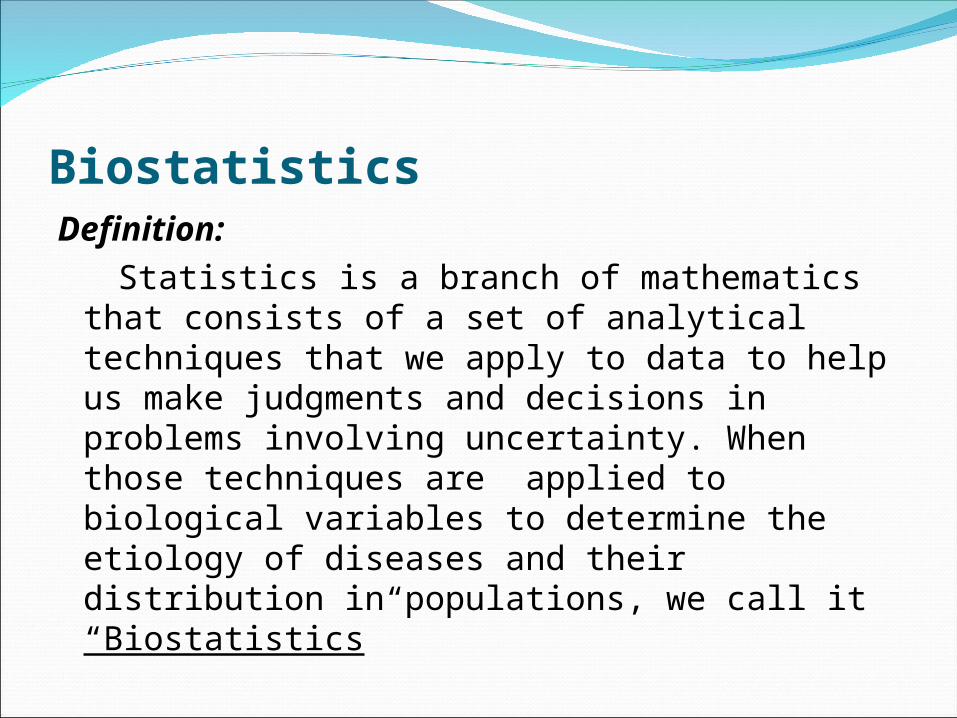
BiostatisticsDefinition: Statistics is a branch of mathematics that
consists of a set of analytical techniques that we apply to data to help us make judgments and decisions in problems involving uncertainty. When those techniques are applied to biological variables to determine the etiology of diseases and their distribution in populations, we call it “Biostatistics”
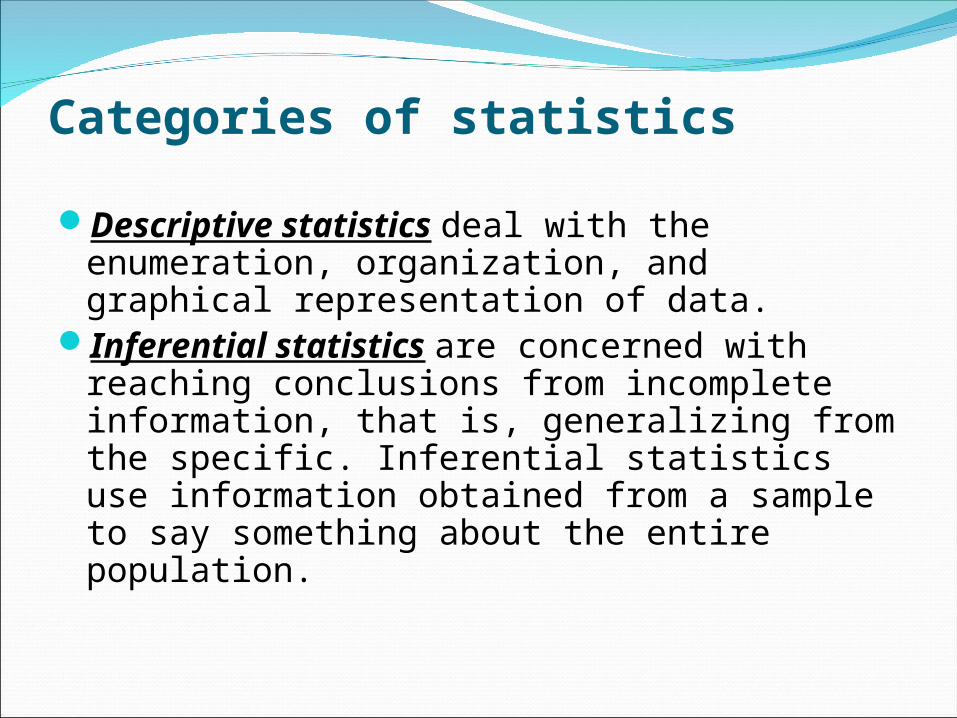
Categories of statistics
Descriptive statistics deal with the enumeration, organization, and graphical representation of data.
Inferential statistics are concerned with reaching conclusions from incomplete information, that is, generalizing from the specific. Inferential statistics use information obtained from a sample to say something about the entire population.
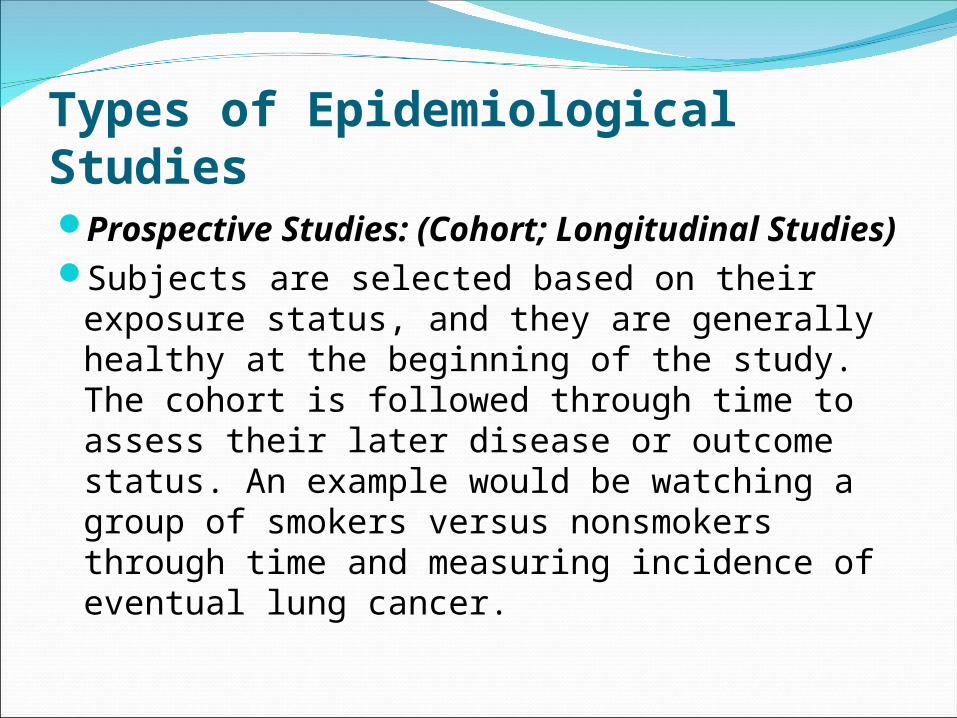
Types of Epidemiological StudiesProspective Studies: (Cohort;
Longitudinal Studies)Subjects are selected based on their exposure
status, and they are generally healthy at the beginning of the study. The cohort is followed through time to assess their later disease or outcome status. An example would be watching a group of smokers versus nonsmokers through time and measuring incidence of eventual lung cancer.
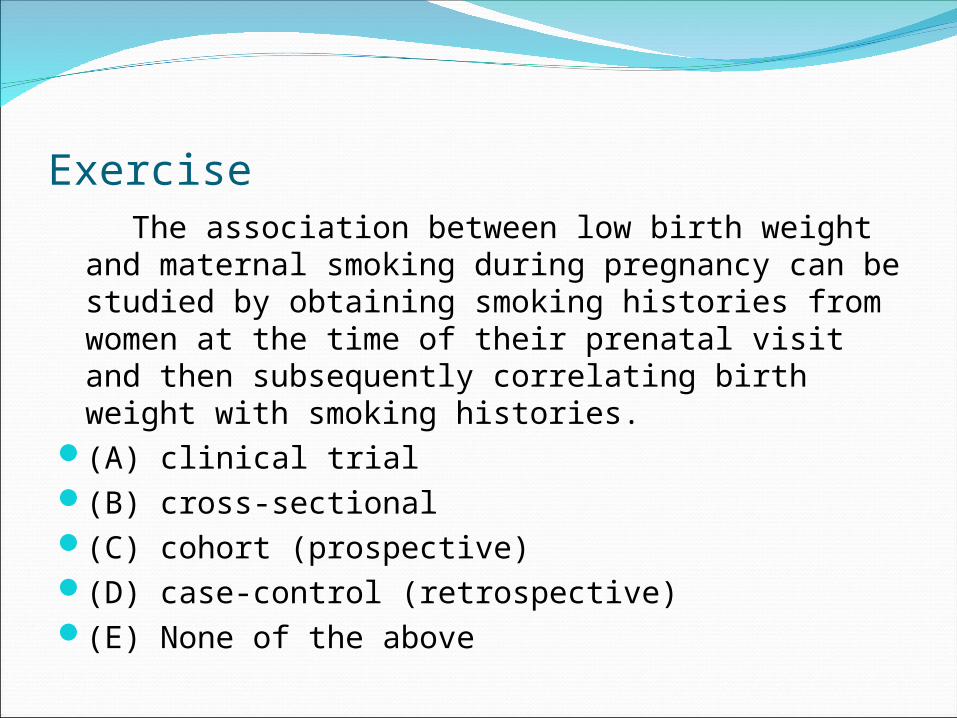
Exercise The association between low birth weight and
maternal smoking during pregnancy can be studied by obtaining smoking histories from women at the time of their prenatal visit and then subsequently correlating birth weight with smoking histories.
(A) clinical trial(B) cross-sectional(C) cohort (prospective)(D) case-control (retrospective)(E) None of the above
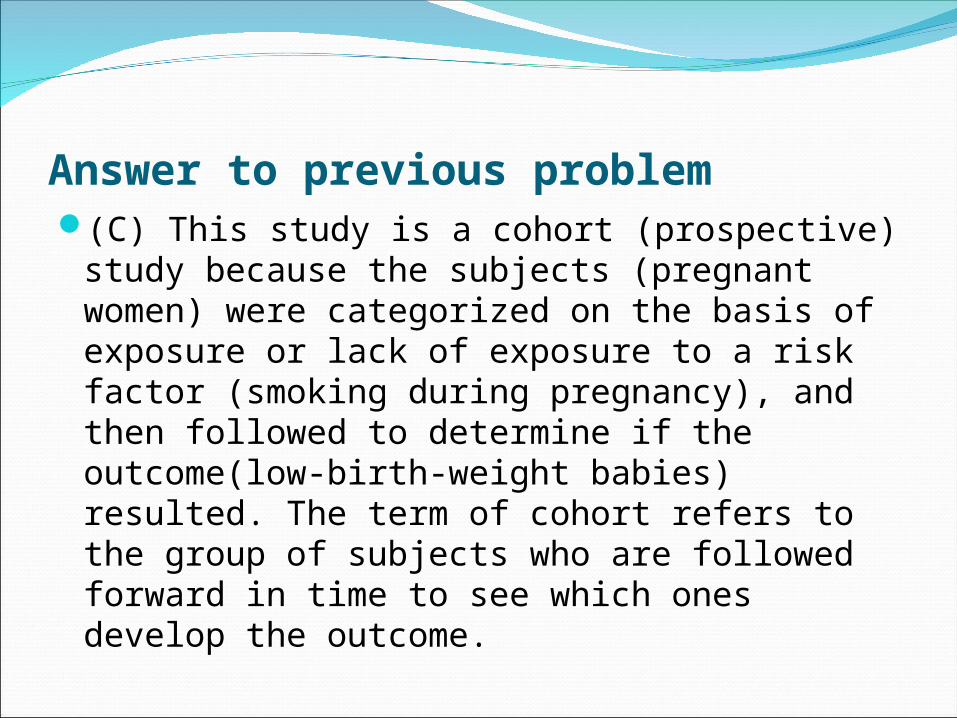
Answer to previous problem(C) This study is a cohort (prospective)
study because the subjects (pregnant women) were categorized on the basis of exposure or lack of exposure to a risk factor (smoking during pregnancy), and then followed to determine if the outcome(low-birth-weight babies) resulted. The term of cohort refers to the group of subjects who are followed forward in time to see which ones develop the outcome.
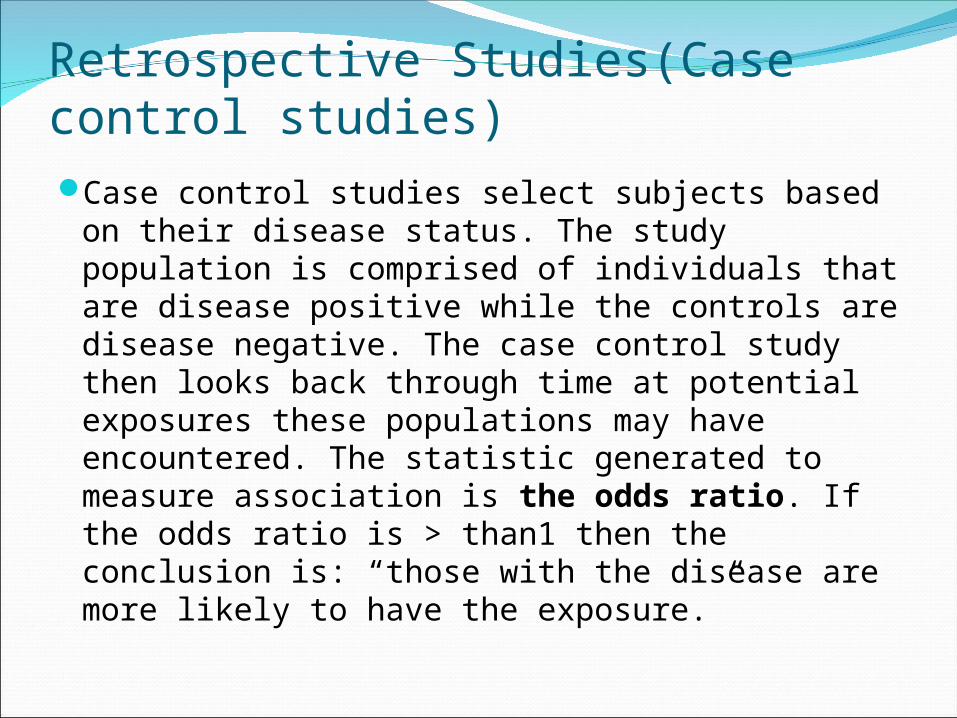
Retrospective Studies(Case control studies)Case control studies select subjects based on
their disease status. The study population is comprised of individuals that are disease positive while the controls are disease negative. The case control study then looks back through time at potential exposures these populations may have encountered. The statistic generated to measure association is the odds ratio. If the odds ratio is > than1 then the conclusion is: “those with the disease are more likely to have the exposure.”
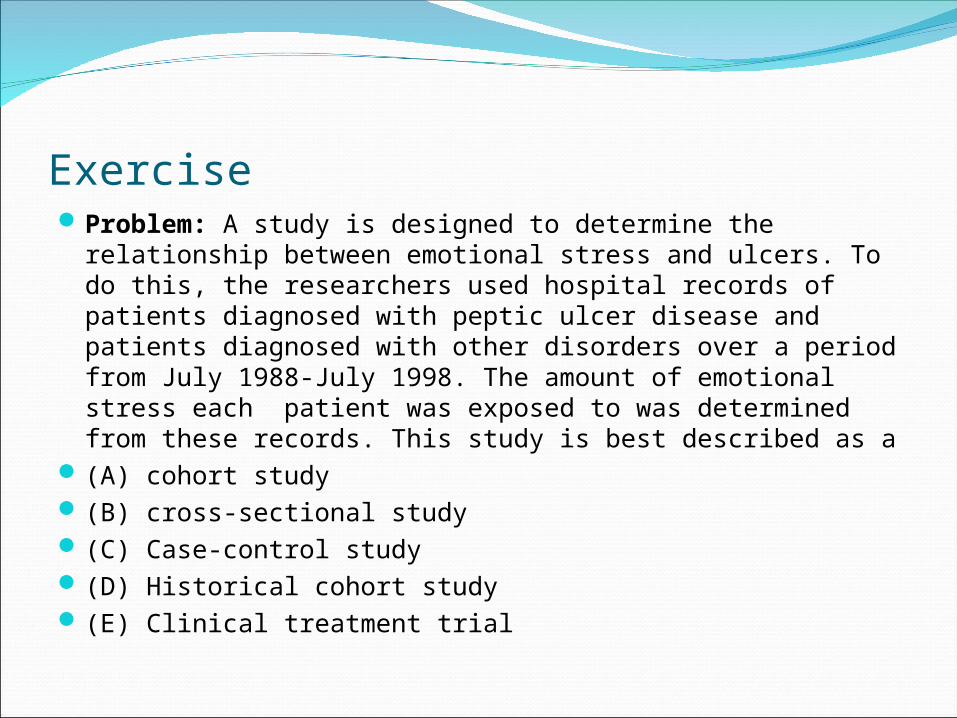
ExerciseProblem: A study is designed to determine the relationship
between emotional stress and ulcers. To do this, the researchers used hospital records of patients diagnosed with peptic ulcer disease and patients diagnosed with other disorders over a period from July 1988-July 1998. The amount of emotional stress each patient was exposed to was determined from these records. This study is best described as a
(A) cohort study (B) cross-sectional study (C) Case-control study (D) Historical cohort study (E) Clinical treatment trial
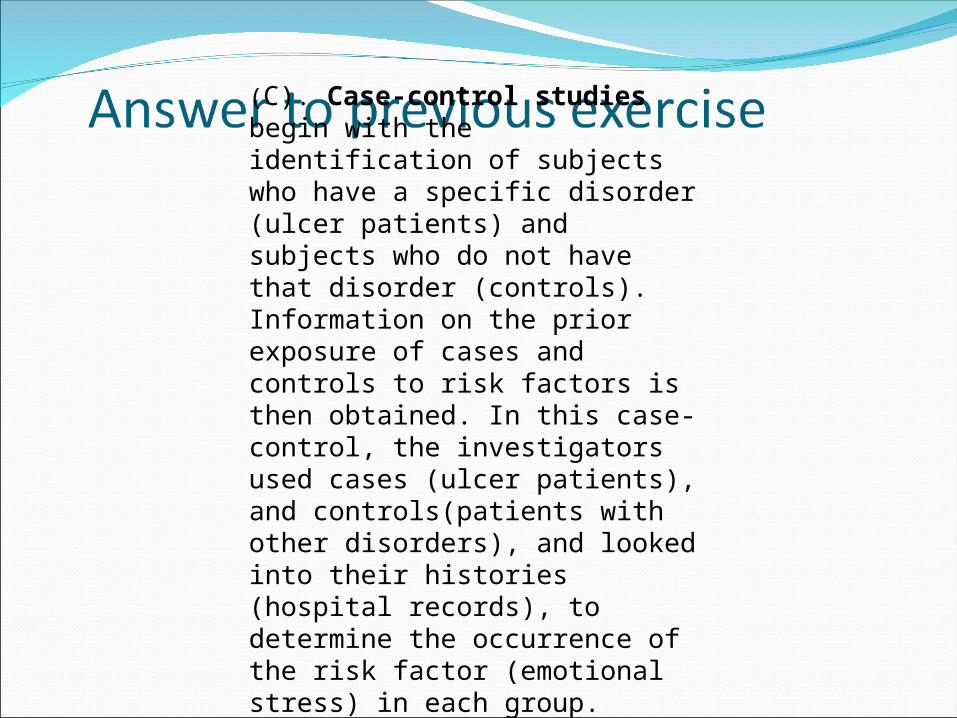
(C). Case-control studies begin with the identification of subjects who have a specific disorder (ulcer patients) and subjects who do not have that disorder (controls). Information on the prior exposure of cases and controls to risk factors is then obtained. In this case-control, the investigators used cases (ulcer patients), and controls(patients with other disorders), and looked into their histories (hospital records), to determine the occurrence of the risk factor (emotional stress) in each group.
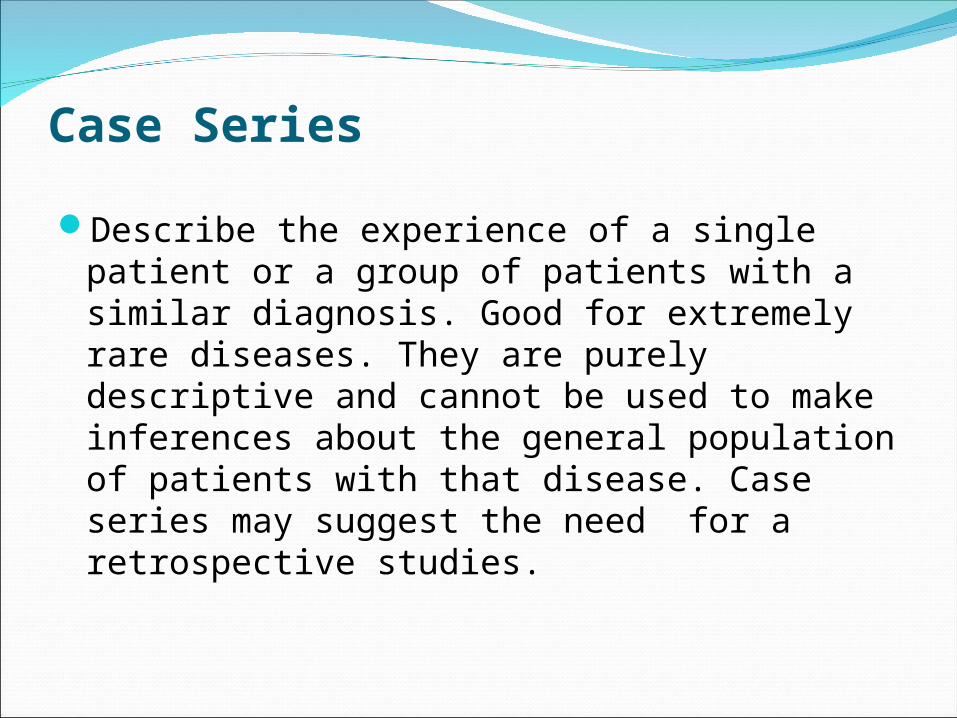
Case Series
Describe the experience of a single patient or a group of patients with a similar diagnosis. Good for extremely rare diseases. They are purely descriptive and cannot be used to make inferences about the general population of patients with that disease. Case series may suggest the need for a retrospective studies.
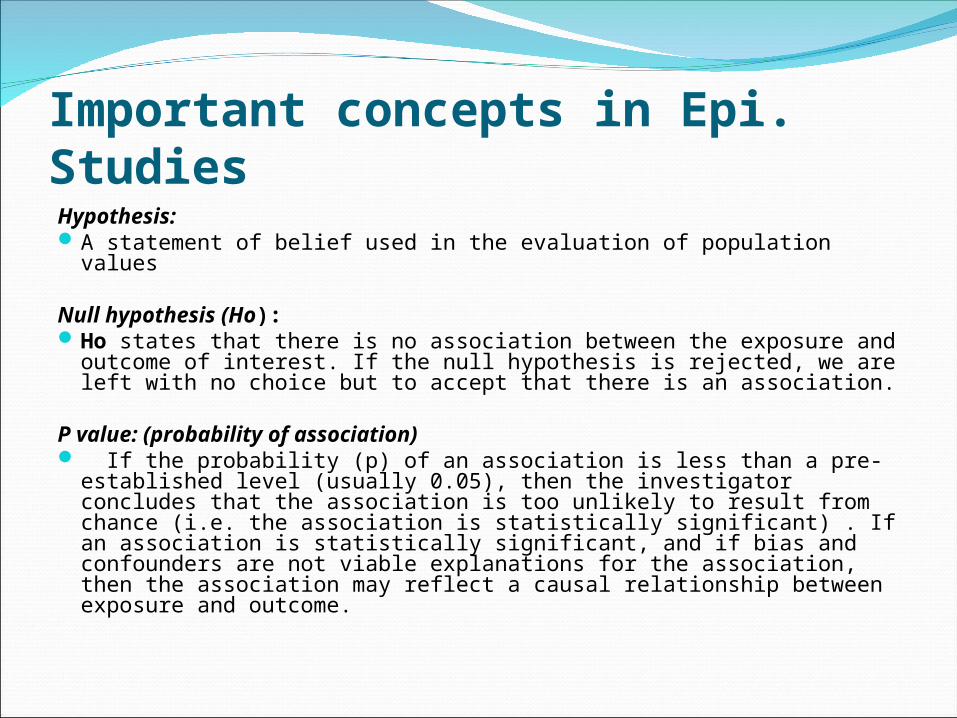
Important concepts in Epi. StudiesHypothesis: A statement of belief used in the evaluation of population values
Null hypothesis (Ho):Ho states that there is no association between the exposure and
outcome of interest. If the null hypothesis is rejected, we are left with no choice but to accept that there is an association.
P value: (probability of association) If the probability (p) of an association is less than a pre-
established level (usually 0.05), then the investigator concludes that the association is too unlikely to result from chance (i.e. the association is statistically significant) . If an association is statistically significant, and if bias and confounders are not viable explanations for the association, then the association may reflect a causal relationship between exposure and outcome.
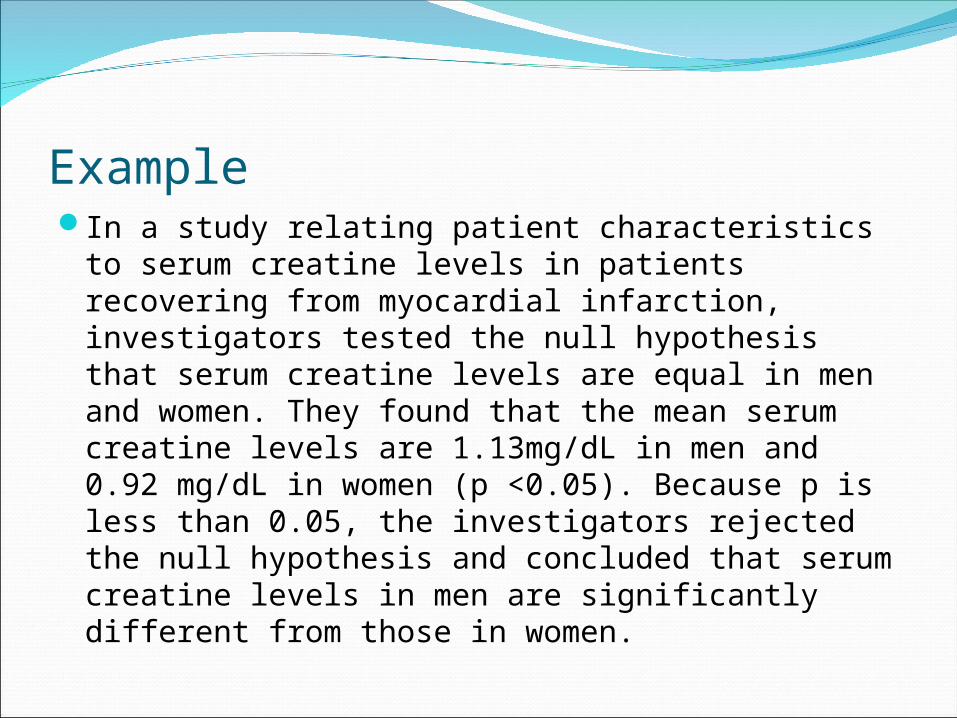
ExampleIn a study relating patient characteristics to
serum creatine levels in patients recovering from myocardial infarction, investigators tested the null hypothesis that serum creatine levels are equal in men and women. They found that the mean serum creatine levels are 1.13mg/dL in men and 0.92 mg/dL in women (p <0.05). Because p is less than 0.05, the investigators rejected the null hypothesis and concluded that serum creatine levels in men are significantly different from those in women.
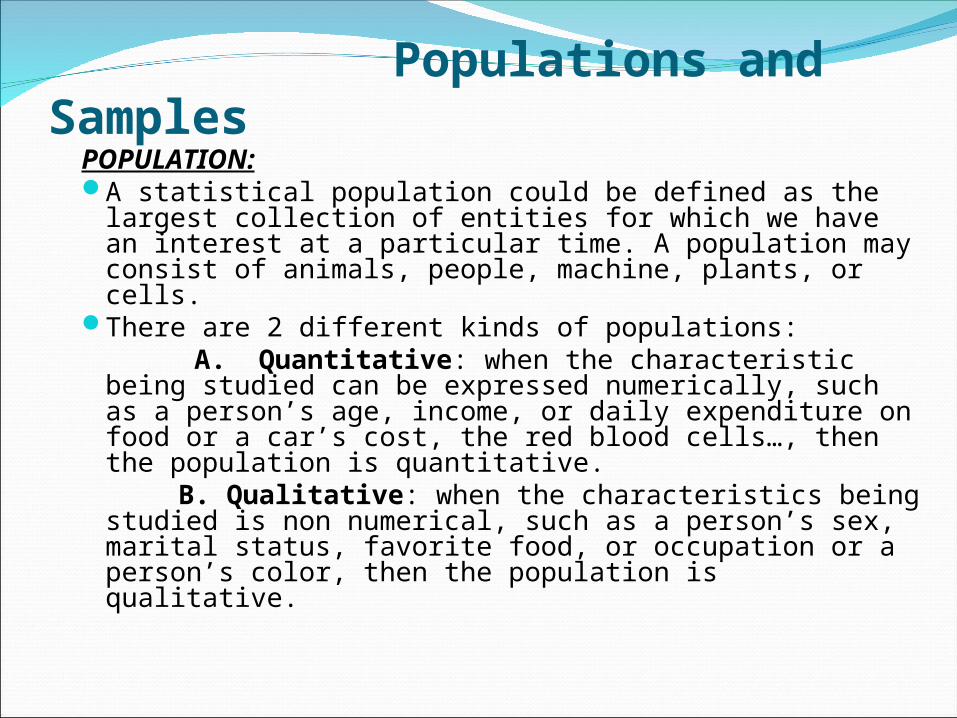
Populations and SamplesPOPULATION:A statistical population could be defined as the
largest collection of entities for which we have an interest at a particular time. A population may consist of animals, people, machine, plants, or cells.
There are 2 different kinds of populations: A. Quantitative: when the characteristic being
studied can be expressed numerically, such as a person’s age, income, or daily expenditure on food or a car’s cost, the red blood cells…, then the population is quantitative.
B. Qualitative: when the characteristics being studied is non numerical, such as a person’s sex, marital status, favorite food, or occupation or a person’s color, then the population is qualitative.
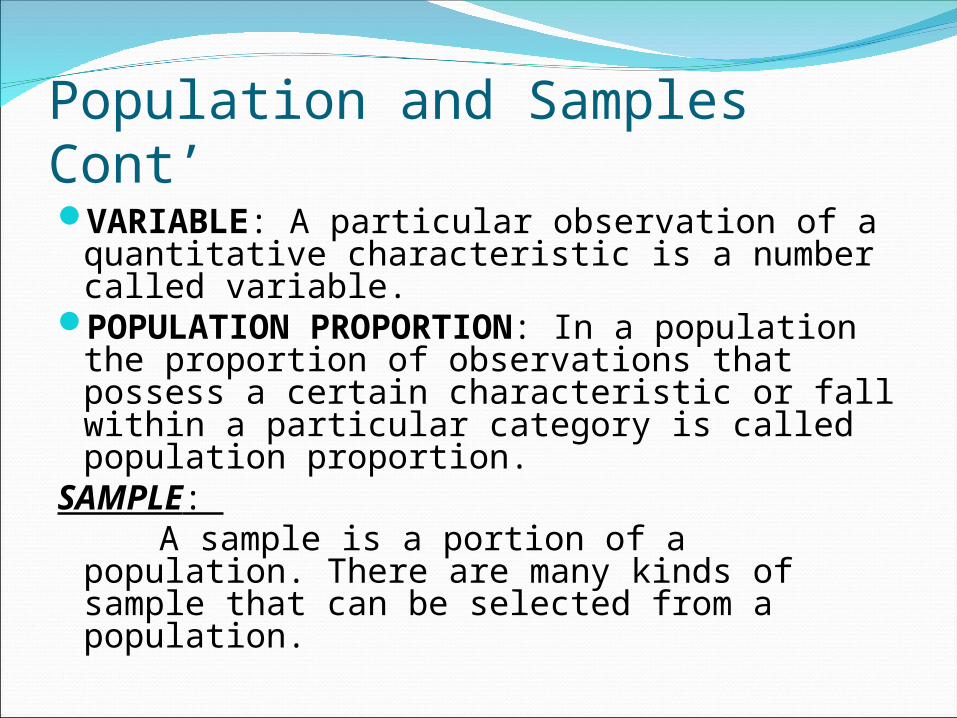
Population and Samples Cont’VARIABLE: A particular observation of a
quantitative characteristic is a number called variable.
POPULATION PROPORTION: In a population the proportion of observations that possess a certain characteristic or fall within a particular category is called population proportion.
SAMPLE: A sample is a portion of a population.
There are many kinds of sample that can be selected from a population.
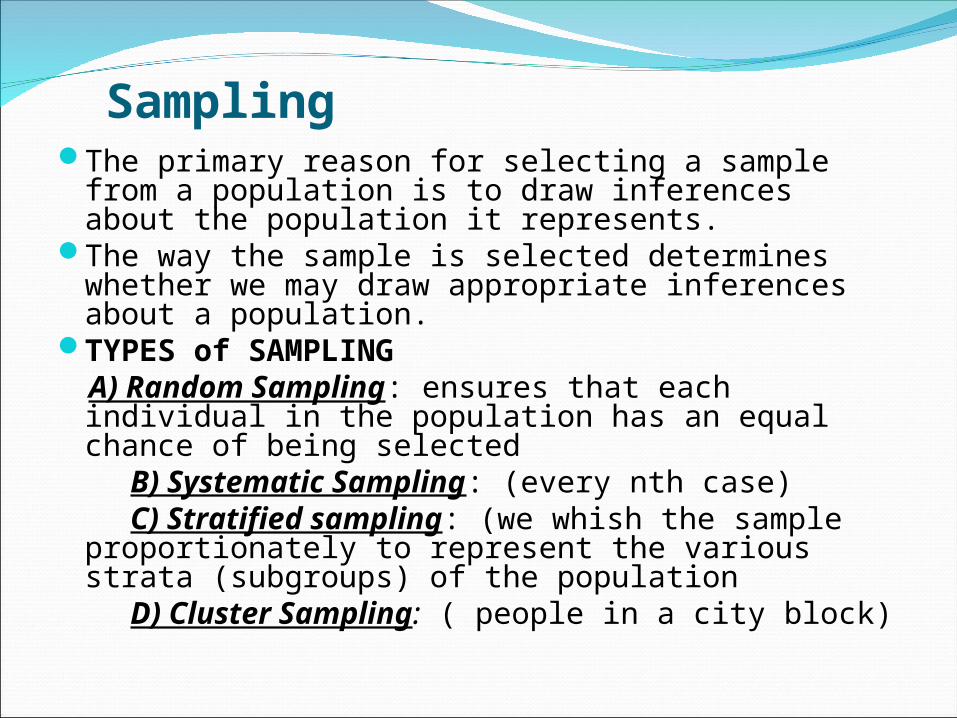
SamplingThe primary reason for selecting a sample from a
population is to draw inferences about the population it represents.
The way the sample is selected determines whether we may draw appropriate inferences about a population.
TYPES of SAMPLING A) Random Sampling: ensures that each
individual in the population has an equal chance of being selected
B) Systematic Sampling: (every nth case) C) Stratified sampling: (we whish the sample
proportionately to represent the various strata (subgroups) of the population
D) Cluster Sampling: ( people in a city block)
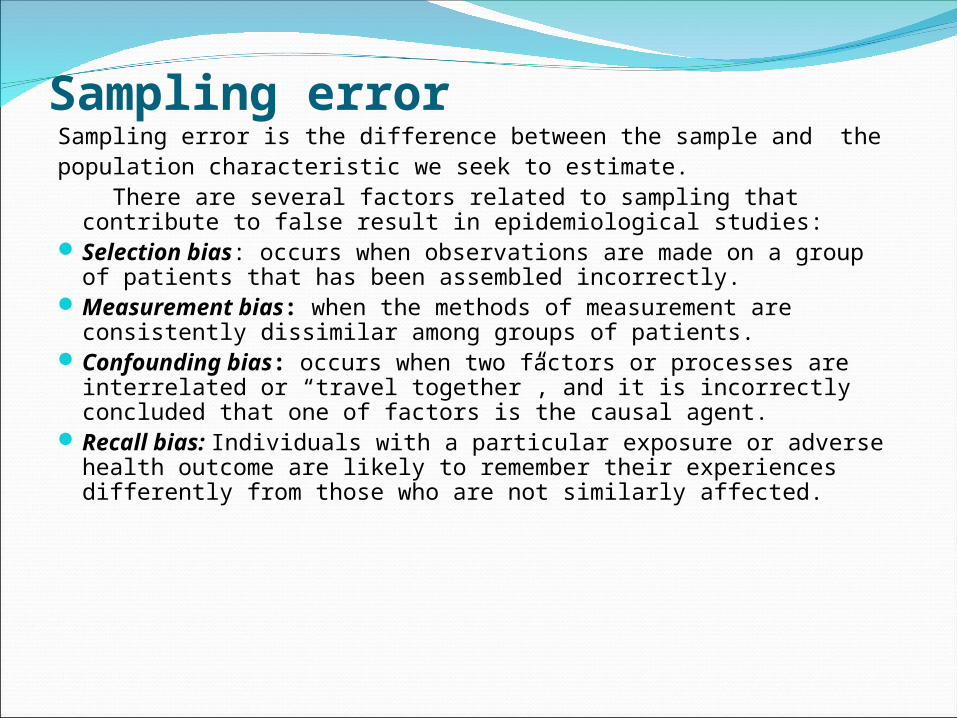
Sampling errorSampling error is the difference between the sample and the population characteristic we seek to estimate. There are several factors related to sampling that
contribute to false result in epidemiological studies:Selection bias: occurs when observations are made on a
group of patients that has been assembled incorrectly.Measurement bias: when the methods of measurement
are consistently dissimilar among groups of patients.Confounding bias: occurs when two factors or processes
are interrelated or “travel together”, and it is incorrectly concluded that one of factors is the causal agent.
Recall bias: Individuals with a particular exposure or adverse health outcome are likely to remember their experiences differently from those who are not similarly affected.
Exercise
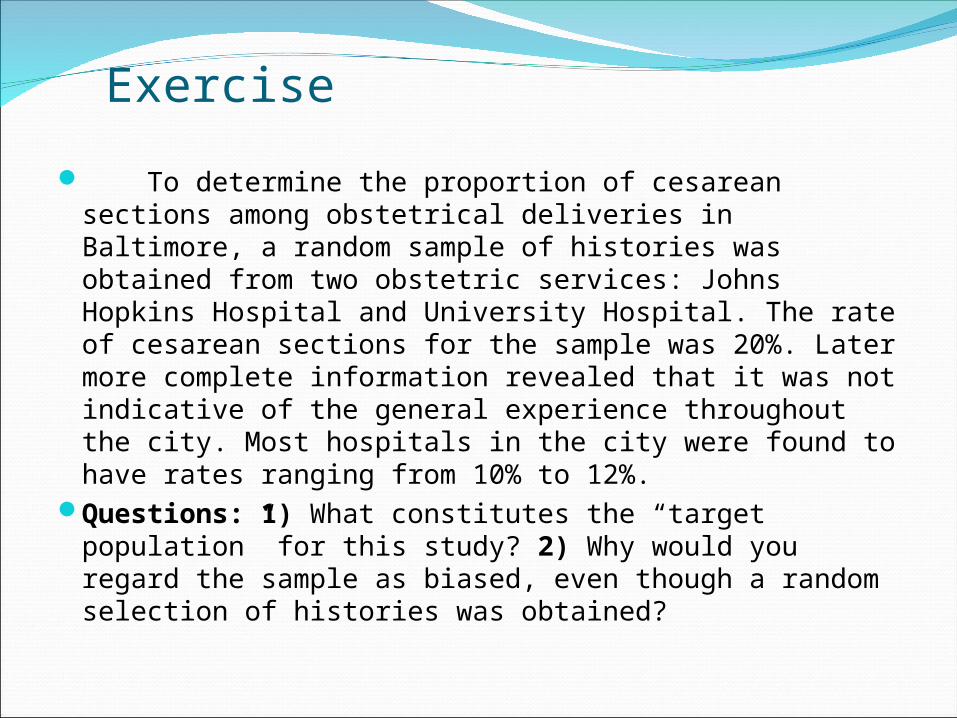
To determine the proportion of cesarean sections among obstetrical deliveries in Baltimore, a random sample of histories was obtained from two obstetric services: Johns Hopkins Hospital and University Hospital. The rate of cesarean sections for the sample was 20%. Later more complete information revealed that it was not indicative of the general experience throughout the city. Most hospitals in the city were found to have rates ranging from 10% to 12%.
Questions: 1) What constitutes the “target population” for this study? 2) Why would you regard the sample as biased, even though a random selection of histories was obtained?
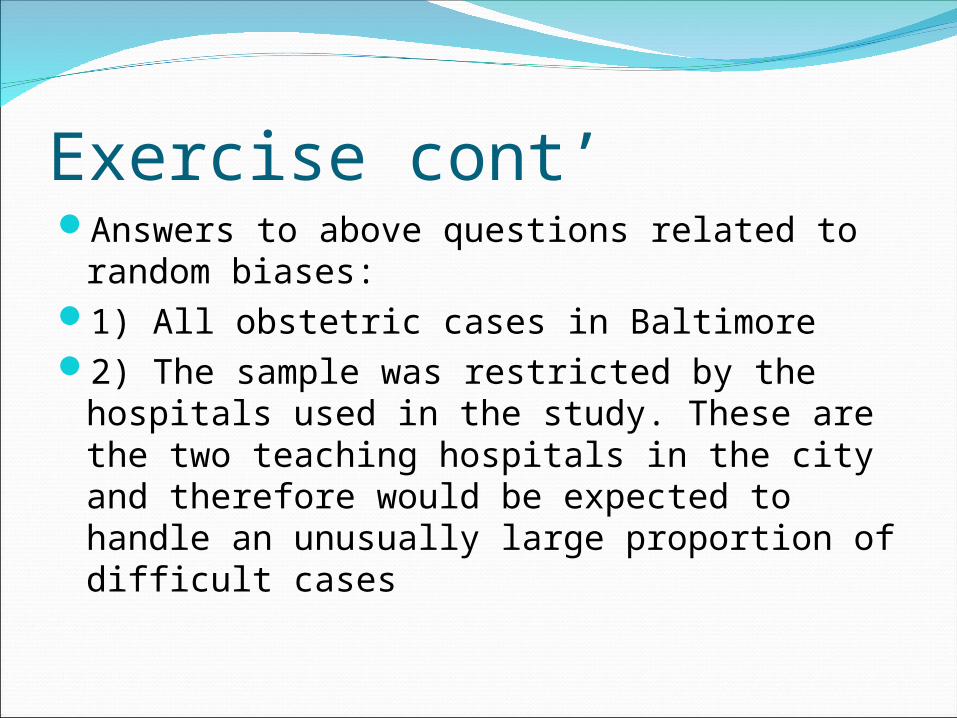
Exercise cont’Answers to above questions related to
random biases:1) All obstetric cases in Baltimore2) The sample was restricted by the hospitals
used in the study. These are the two teaching hospitals in the city and therefore would be expected to handle an unusually large proportion of difficult cases
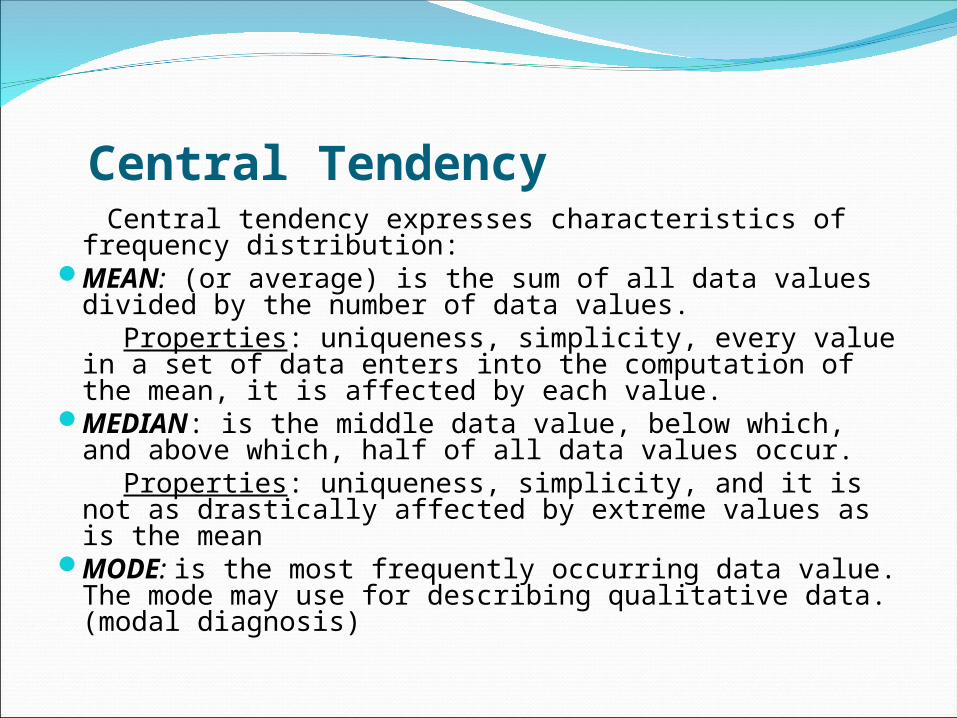
Central Tendency Central tendency expresses characteristics of
frequency distribution:MEAN: (or average) is the sum of all data values
divided by the number of data values. Properties: uniqueness, simplicity, every value in a
set of data enters into the computation of the mean, it is affected by each value.
MEDIAN: is the middle data value, below which, and above which, half of all data values occur.
Properties: uniqueness, simplicity, and it is not as drastically affected by extreme values as is the mean
MODE: is the most frequently occurring data value. The mode may use for describing qualitative data. (modal diagnosis)
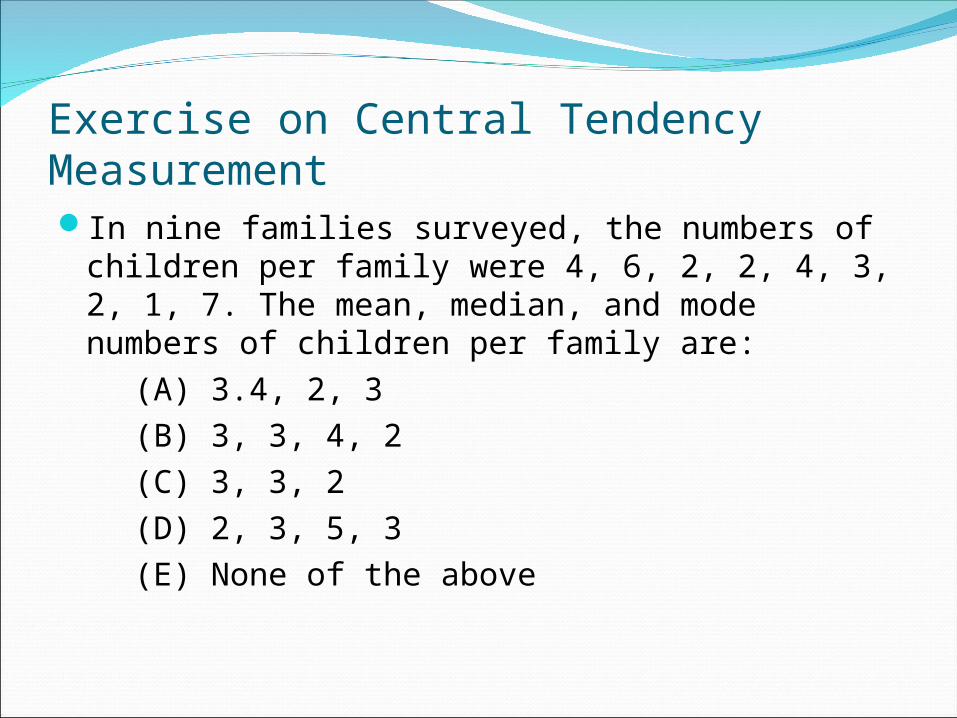
Exercise on Central Tendency MeasurementIn nine families surveyed, the numbers of
children per family were 4, 6, 2, 2, 4, 3, 2, 1, 7. The mean, median, and mode numbers of children per family are:
(A) 3.4, 2, 3 (B) 3, 3, 4, 2 (C) 3, 3, 2 (D) 2, 3, 5, 3 (E) None of the above
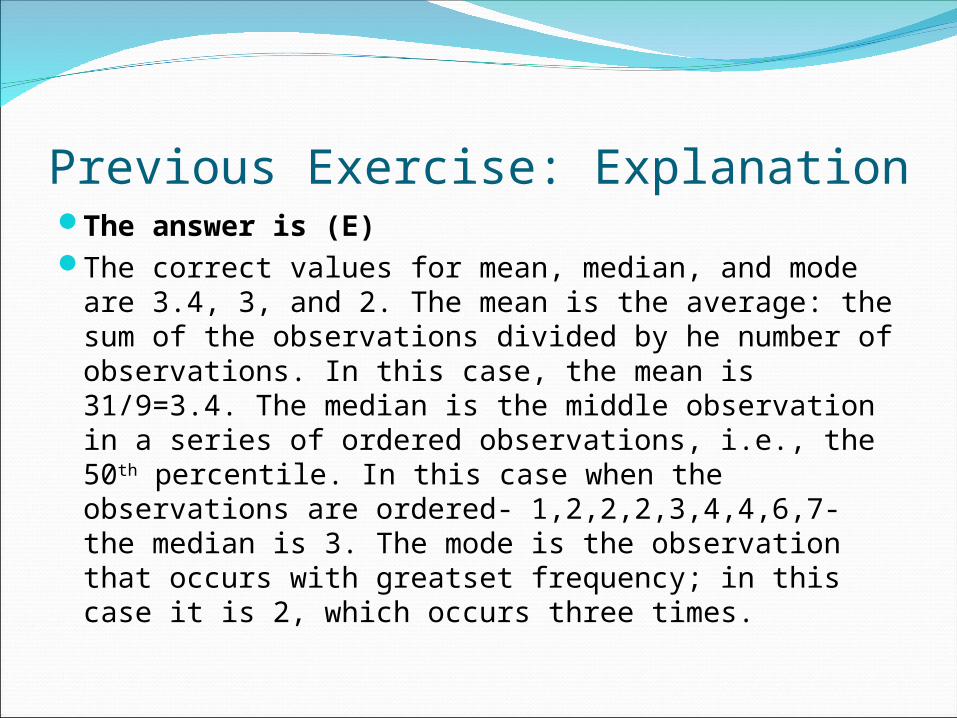
Previous Exercise: ExplanationThe answer is (E)The correct values for mean, median, and mode
are 3.4, 3, and 2. The mean is the average: the sum of the observations divided by he number of observations. In this case, the mean is 31/9=3.4. The median is the middle observation in a series of ordered observations, i.e., the 50th percentile. In this case when the observations are ordered- 1,2,2,2,3,4,4,6,7- the median is 3. The mode is the observation that occurs with greatset frequency; in this case it is 2, which occurs three times.
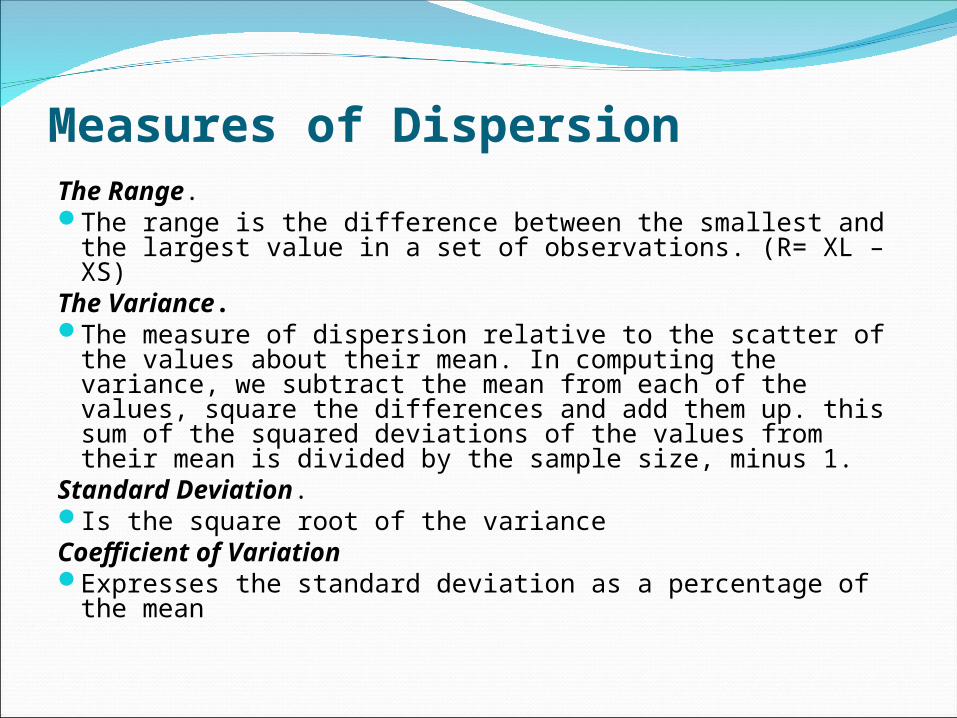
Measures of DispersionThe Range.The range is the difference between the smallest and
the largest value in a set of observations. (R= XL – XS)The Variance.The measure of dispersion relative to the scatter of the
values about their mean. In computing the variance, we subtract the mean from each of the values, square the differences and add them up. this sum of the squared deviations of the values from their mean is divided by the sample size, minus 1.
Standard Deviation.Is the square root of the varianceCoefficient of VariationExpresses the standard deviation as a percentage of
the mean
Frequency Distribution
Frequency distributions represent the frequency ofoccurrence of all values of a variable in a data setDifferent frequency distributions have different shapes.In a symmetrical distribution, one side of the
distribution is the mirror image of the other.In a skewed distribution, the peak of the distribution is
closer to one side. The mean and the median are not equal.
If the mean is greater than the median, the distribution is skewed to the right (positive)
If the mean is less than the median, the distribution is skewed to the left (negative)
Normal distribution Also known as Gaussian or bell-shaped distribution.A normal distribution is a theoretical model that has
been found to fit many naturally occurring phenomena.The normal distribution curve has a bell- shaped
appearance, symmetric about the mean.In a normal distribution, the mean, the median and the
mode are equal.All normal curves have an area equal to 1.0In a normal distribution, approximately 68% of data
values fall within +/- one SD of the mean, approximately 95% of data values fall within +/- two SDs of the mean, and 99.7% of data values fall within +/- 3 Sods.
Skewed Distribution
Positive Skewed: is asymmetry with an excess of high values (tail on right: mean > median>mode)
Negative Skewed: is asymmetry with an excess of low values (tail on left, mean < median<mode).
These skewed curves are not normal distribution
Organizing and Displaying of DataFrequency table: The most convenient way of summarizing data is
by mean of “frequency table”1St step is to list all observations from the smallest
to the largest.The next step is to divide this observations into
equal and non overlapping called “class intervals” the number of intervals depends on the number of observations but in general should range from 5 to 15.
Frequency tables should include an appropriate descriptive title, specify the units of measurement, and cite the source of data.
Relative FrequencyRelative frequencyRepresents the relative percentage to the
total cases of any class interval. It is obtained by dividing the number of cases in the class interval by the total number of cases and multiplying by 100.
The use of relative frequency is helpful in making comparison between two set of data that have a different number of observations, like 63 nonsmokers and 37 smokers
Graphing Data Graphs are designed to help the user obtain an
intuitive feeling for the data at a glance. So it is essential that each graph be self-explanatory.
Histogram: is nothing more than a pictorial representation of the frequency table. It consists of an abscissa which depicts the class intervals and a perpendicular ordinate which depicts the frequency of observations. A vertical bar is constructed above each class interval equal in height to its class frequency.
Frequency polygon: is constructed by plotting the individual values at the mid-point of their respective class interval (of the Histogram. Never show the Histogram)
Graph (cont’)Arithmetic Line Graph:It is obtained by plotting frequencies of
occurrence and the independent variable. Variation arises because of differences of occurrences. From this process a line is drawn outlining trends, similarities and differences in data, identification of patterns.
A slope of the line indicates either an increase or a decrease in the frequency of cases.
A broken line indicates variations in the values assigned to the independent variable.
Graph (cont’)Maps:Maps are the graphic representation of data
using location and geographic coordinates.Pie ChartsPie charts represent the different percentage
of categories of variables by proportionally sized pieces of pie
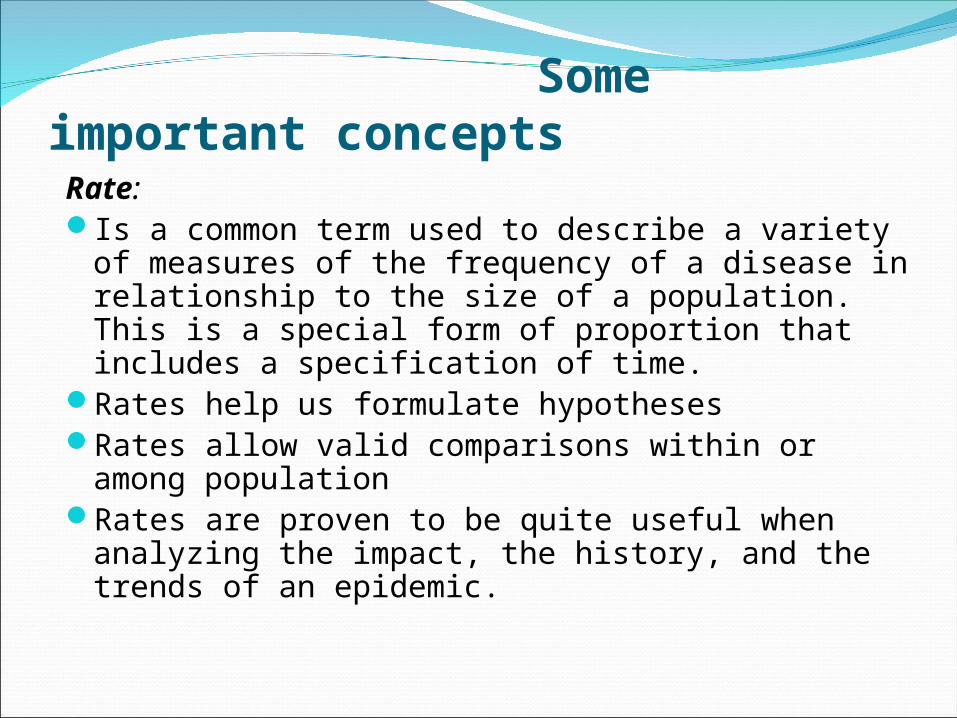
Some important conceptsRate:Is a common term used to describe a variety of
measures of the frequency of a disease in relationship to the size of a population. This is a special form of proportion that includes a specification of time.
Rates help us formulate hypothesesRates allow valid comparisons within or among
populationRates are proven to be quite useful when
analyzing the impact, the history, and the trends of an epidemic.
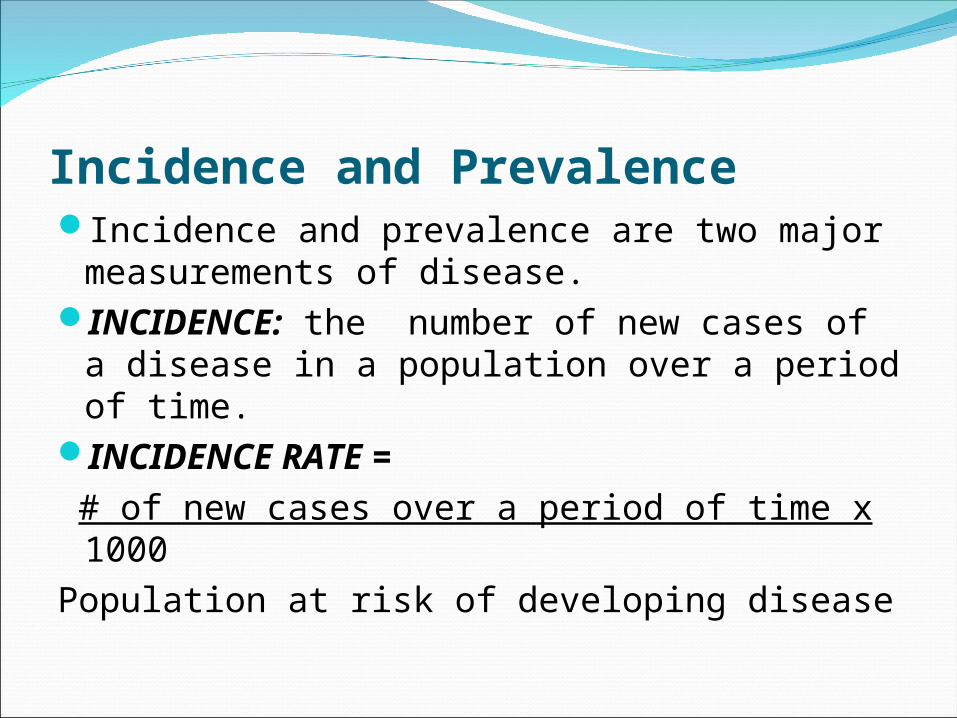
Incidence and PrevalenceIncidence and prevalence are two major
measurements of disease.INCIDENCE: the number of new cases
of a disease in a population over a period of time.
INCIDENCE RATE = # of new cases over a period of time x 1000Population at risk of developing disease
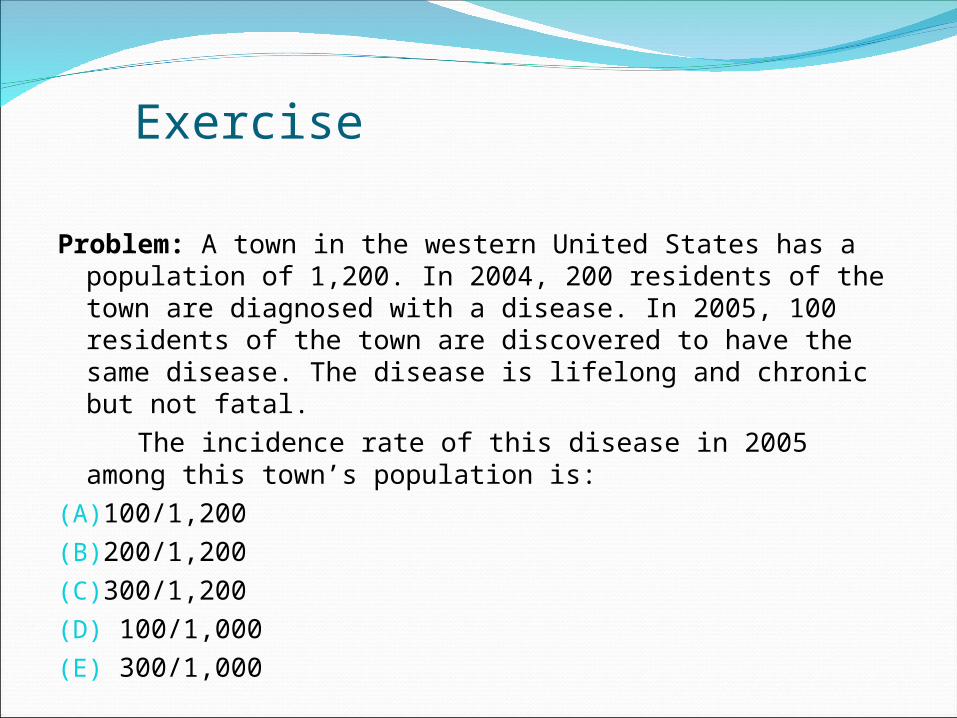
Exercise
Problem: A town in the western United States has a population of 1,200. In 2004, 200 residents of the town are diagnosed with a disease. In 2005, 100 residents of the town are discovered to have the same disease. The disease is lifelong and chronic but not fatal.
The incidence rate of this disease in 2005 among this town’s population is:
(A)100/1,200(B)200/1,200(C)300/1,200(D) 100/1,000(E) 300/1,000
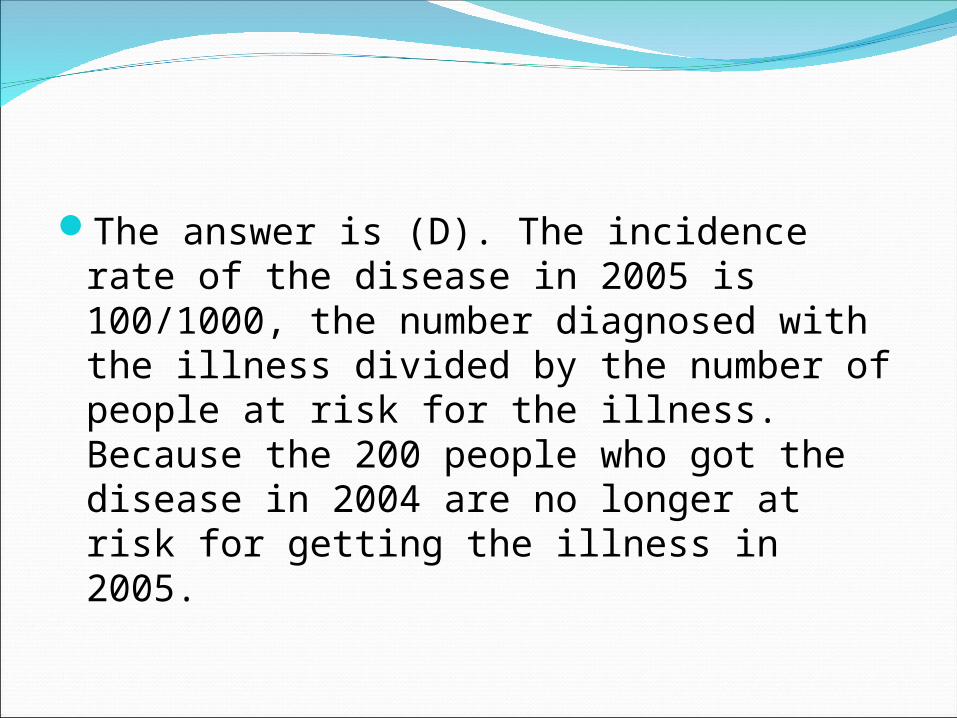
The answer is (D). The incidence rate of the disease in 2005 is 100/1000, the number diagnosed with the illness divided by the number of people at risk for the illness. Because the 200 people who got the disease in 2004 are no longer at risk for getting the illness in 2005.
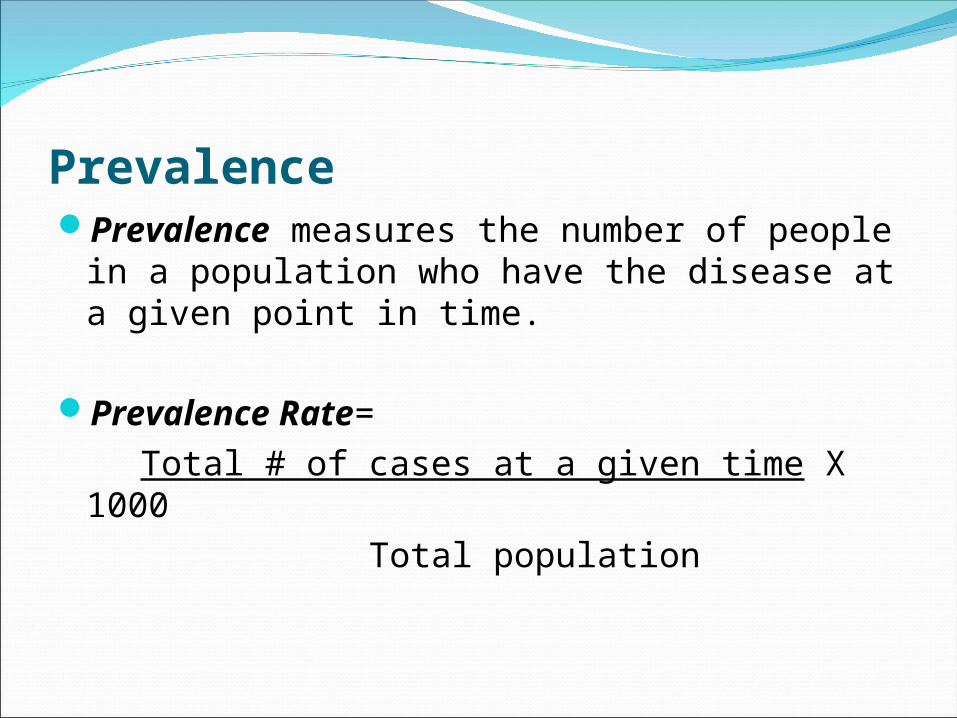
PrevalencePrevalence measures the number of people
in a population who have the disease at a given point in time.
Prevalence Rate= Total # of cases at a given time X 1000 Total population
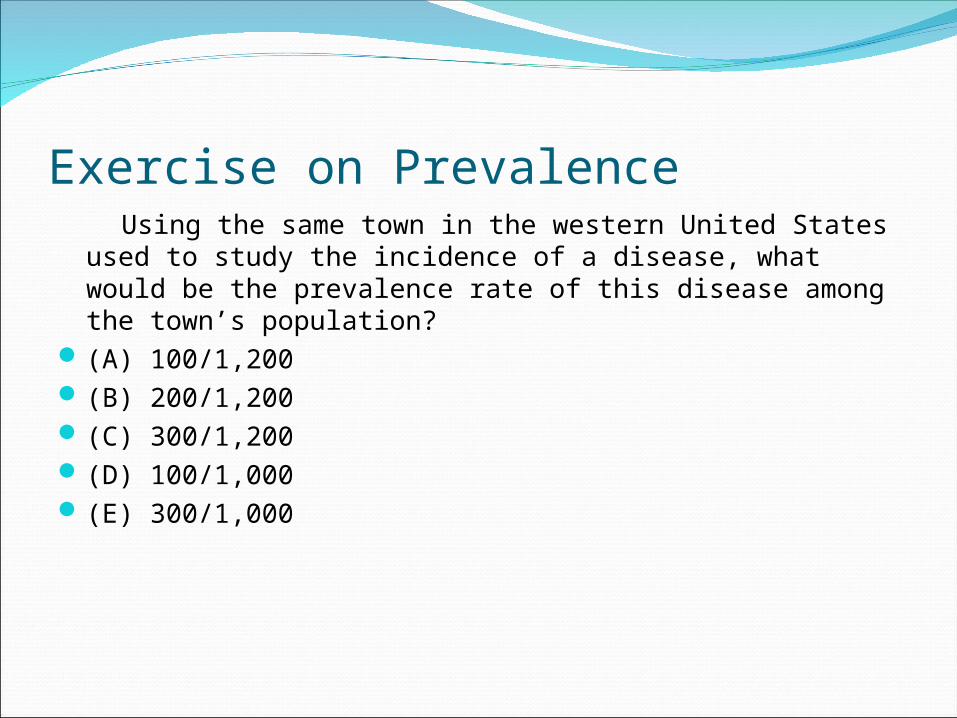
Exercise on Prevalence Using the same town in the western United States used to
study the incidence of a disease, what would be the prevalence rate of this disease among the town’s population?
(A) 100/1,200 (B) 200/1,200 (C) 300/1,200 (D) 100/1,000 (E) 300/1,000
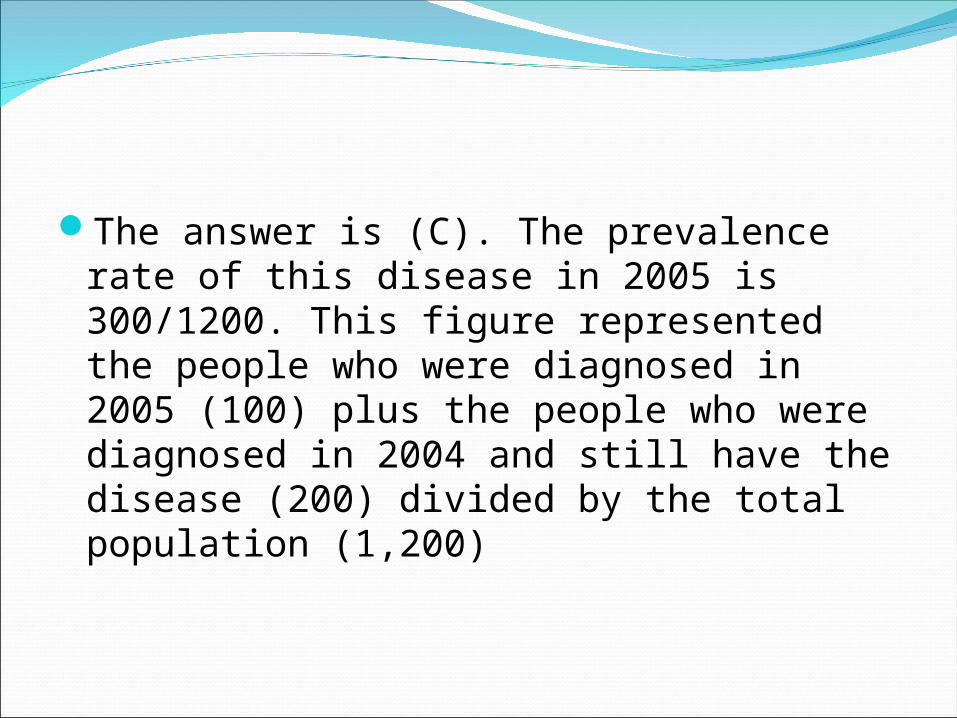
The answer is (C). The prevalence rate of this disease in 2005 is 300/1200. This figure represented the people who were diagnosed in 2005 (100) plus the people who were diagnosed in 2004 and still have the disease (200) divided by the total population (1,200)
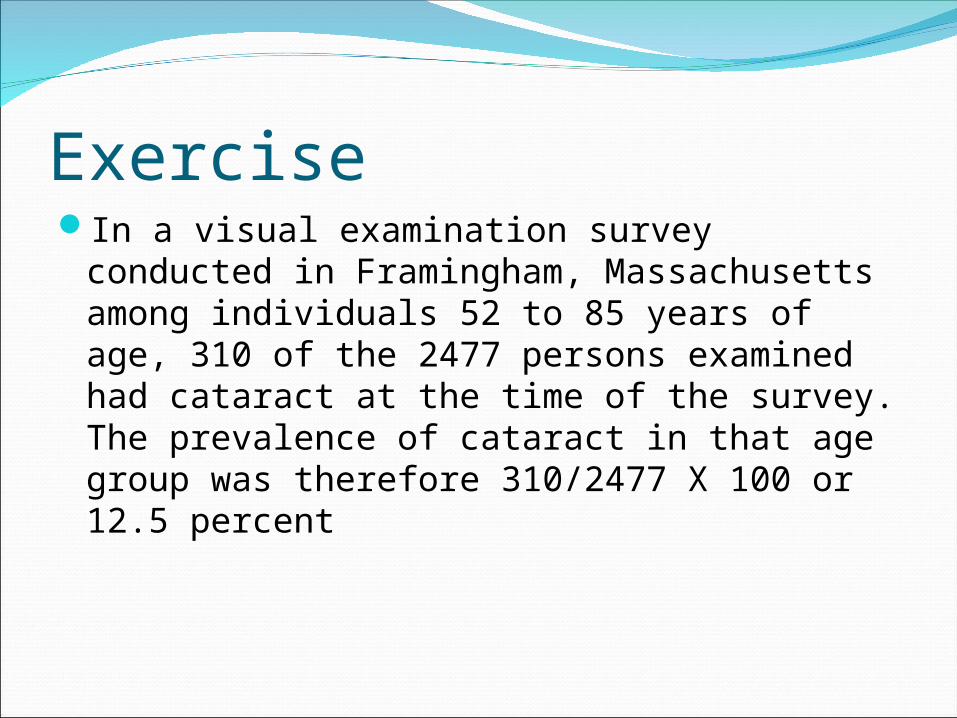
ExerciseIn a visual examination survey conducted in
Framingham, Massachusetts among individuals 52 to 85 years of age, 310 of the 2477 persons examined had cataract at the time of the survey. The prevalence of cataract in that age group was therefore 310/2477 X 100 or 12.5 percent
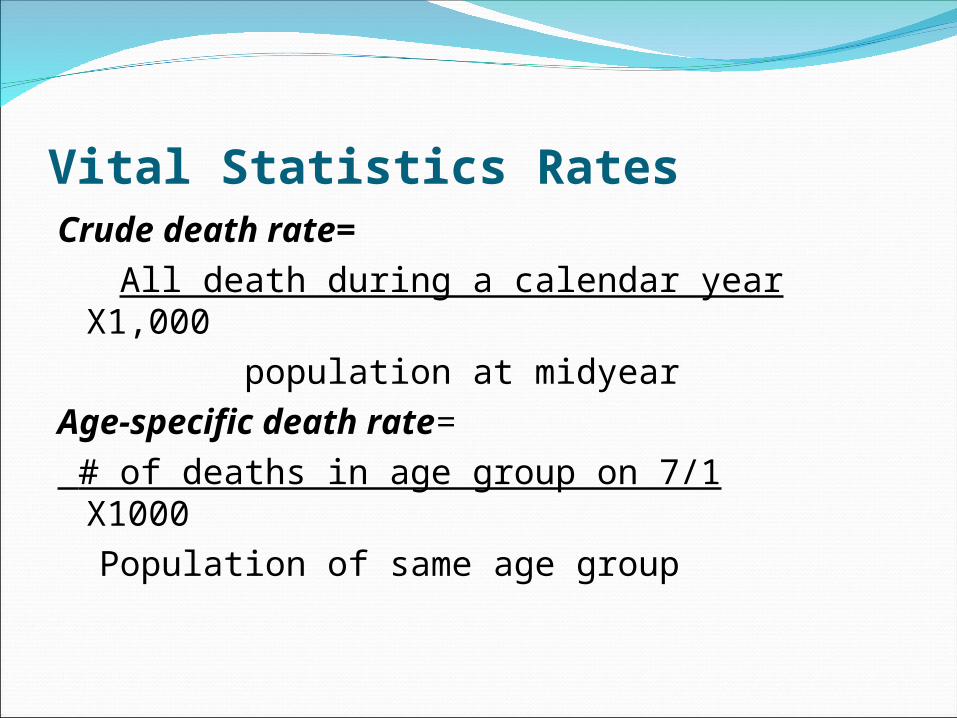
Vital Statistics RatesCrude death rate= All death during a calendar year X1,000 population at midyearAge-specific death rate= # of deaths in age group on 7/1 X1000 Population of same age group
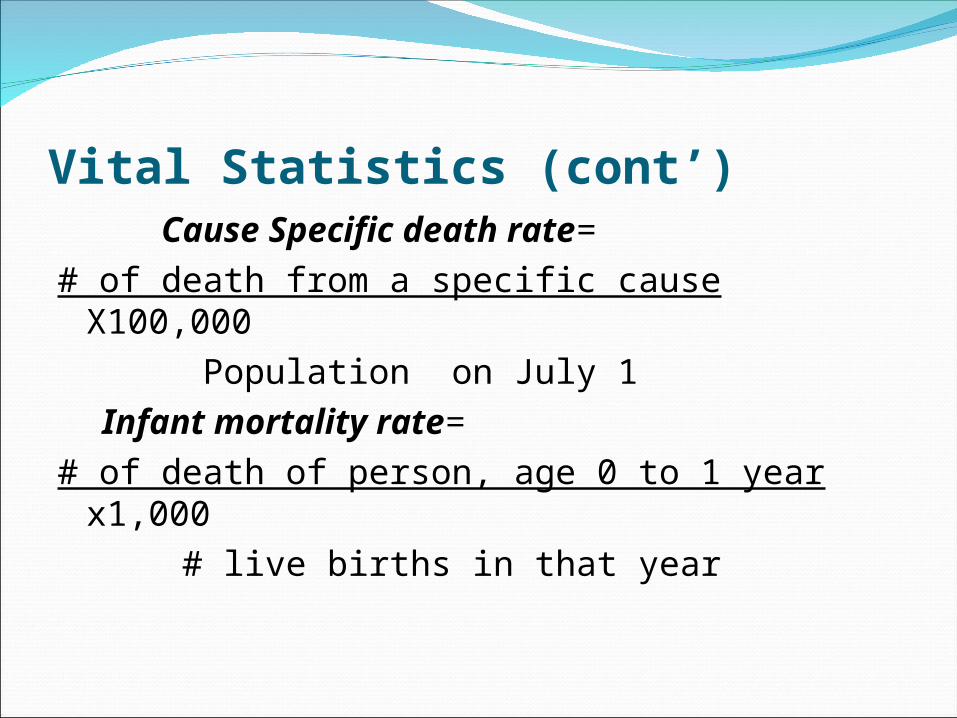
Vital Statistics (cont’) Cause Specific death rate=# of death from a specific cause X100,000 Population on July 1 Infant mortality rate=# of death of person, age 0 to 1 year x1,000 # live births in that year
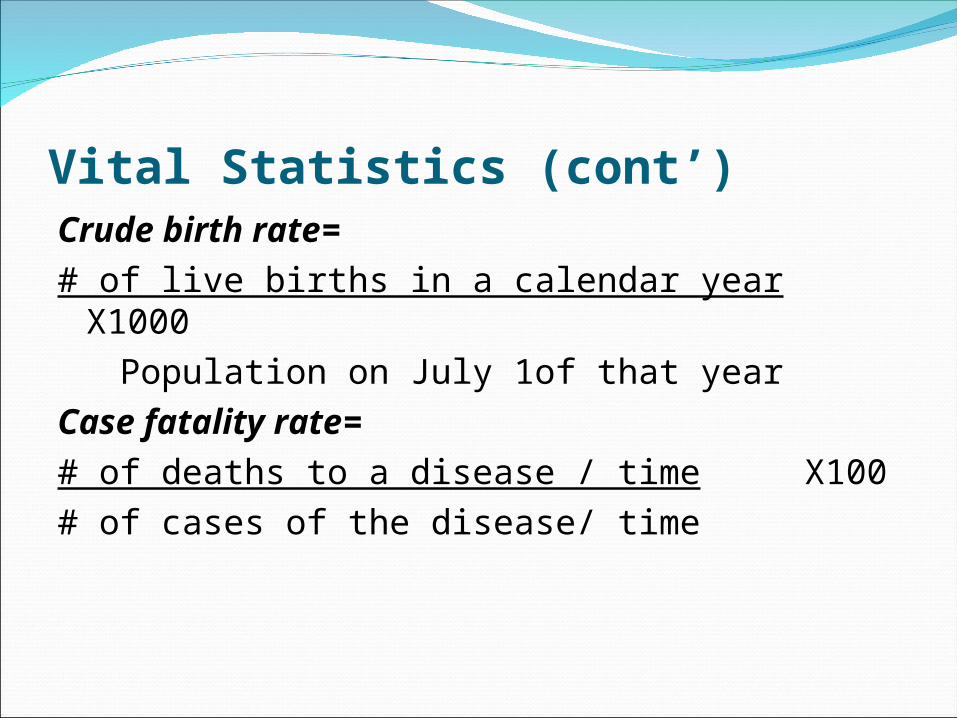
Vital Statistics (cont’)Crude birth rate=# of live births in a calendar year X1000 Population on July 1of that yearCase fatality rate=# of deaths to a disease / time X100# of cases of the disease/ time
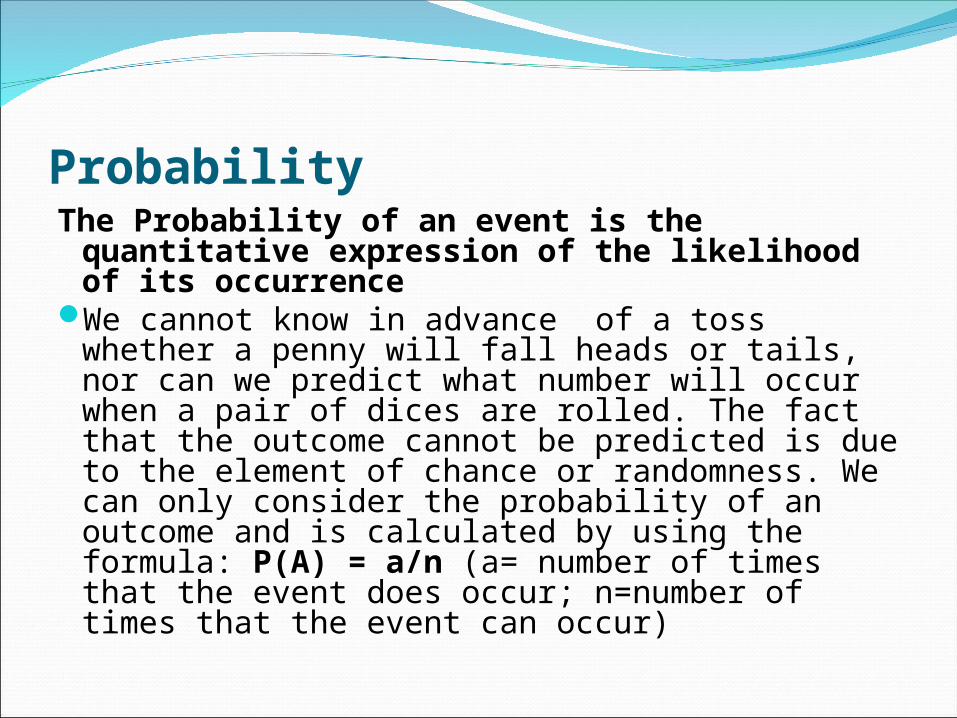
ProbabilityThe Probability of an event is the
quantitative expression of the likelihood of its occurrence
We cannot know in advance of a toss whether a penny will fall heads or tails, nor can we predict what number will occur when a pair of dices are rolled. The fact that the outcome cannot be predicted is due to the element of chance or randomness. We can only consider the probability of an outcome and is calculated by using the formula: P(A) = a/n (a= number of times that the event does occur; n=number of times that the event can occur)
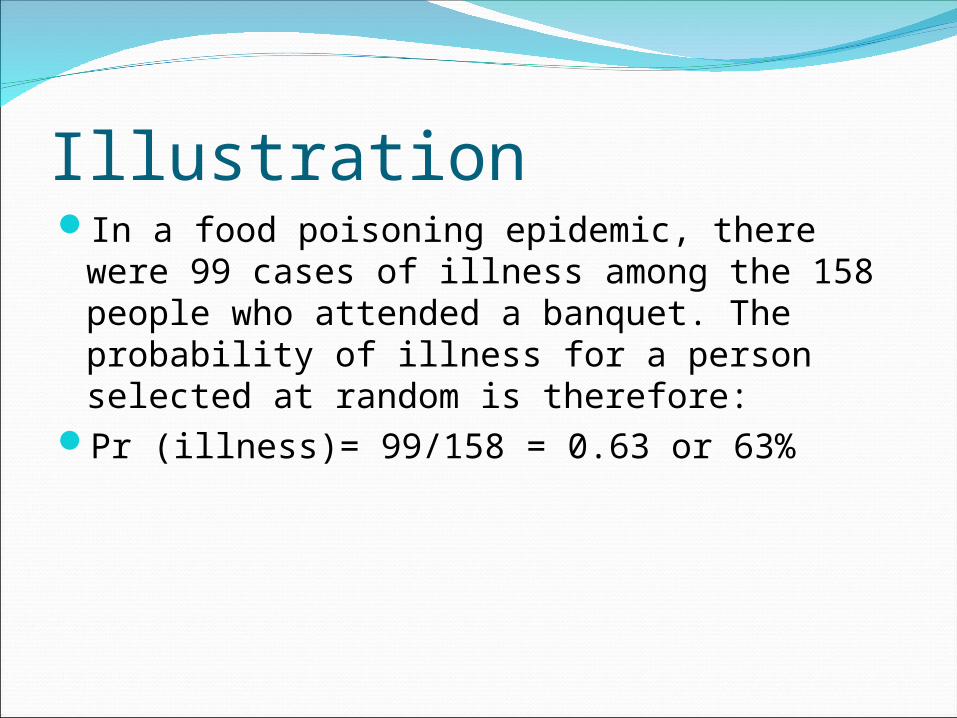
IllustrationIn a food poisoning epidemic, there were 99
cases of illness among the 158 people who attended a banquet. The probability of illness for a person selected at random is therefore:
Pr (illness)= 99/158 = 0.63 or 63%
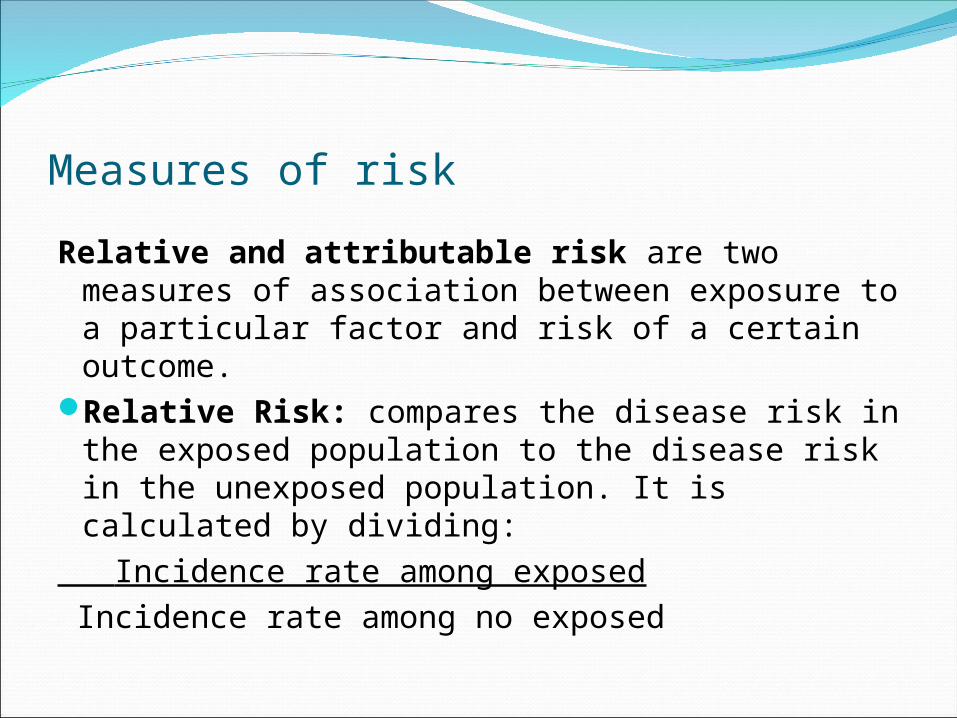
Measures of risk
Relative and attributable risk are two measures of association between exposure to a particular factor and risk of a certain outcome.
Relative Risk: compares the disease risk in the exposed population to the disease risk in the unexposed population. It is calculated by dividing:
Incidence rate among exposed Incidence rate among no exposed
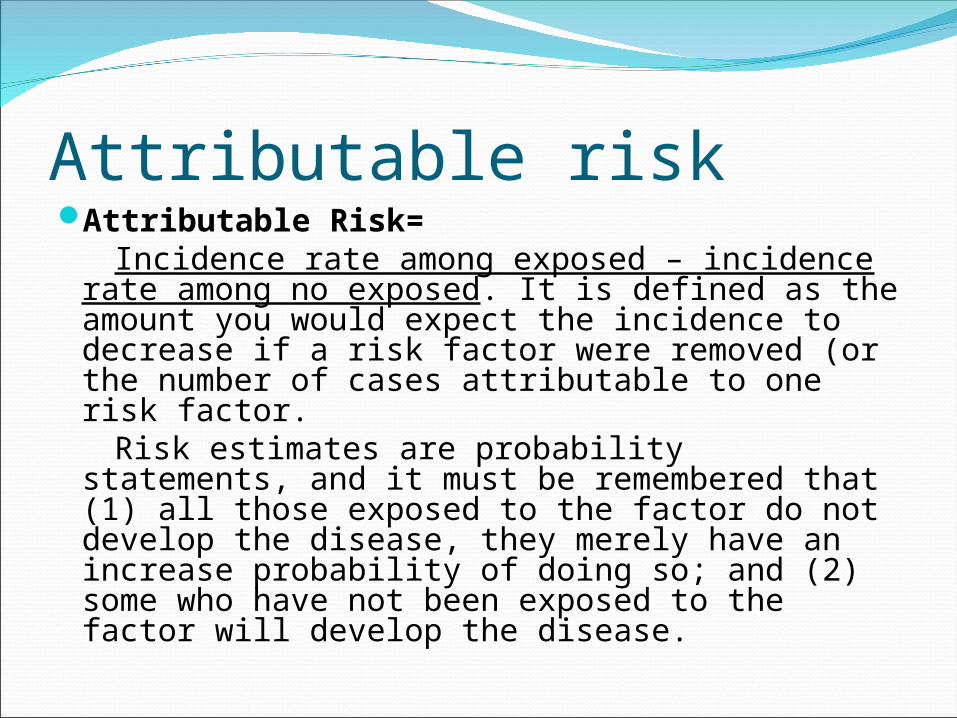
Attributable riskAttributable Risk= Incidence rate among exposed – incidence rate
among no exposed. It is defined as the amount you would expect the incidence to decrease if a risk factor were removed (or the number of cases attributable to one risk factor.
Risk estimates are probability statements, and it must be remembered that (1) all those exposed to the factor do not develop the disease, they merely have an increase probability of doing so; and (2) some who have not been exposed to the factor will develop the disease.
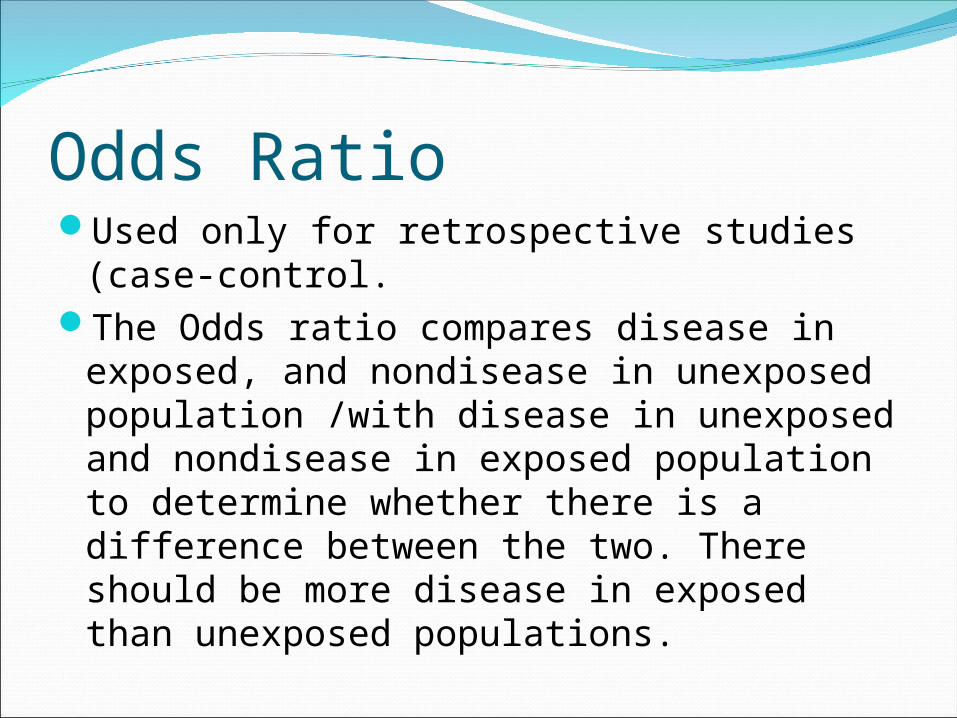
Odds RatioUsed only for retrospective studies (case-
control.The Odds ratio compares disease in
exposed, and nondisease in unexposed population /with disease in unexposed and nondisease in exposed population to determine whether there is a difference between the two. There should be more disease in exposed than unexposed populations.
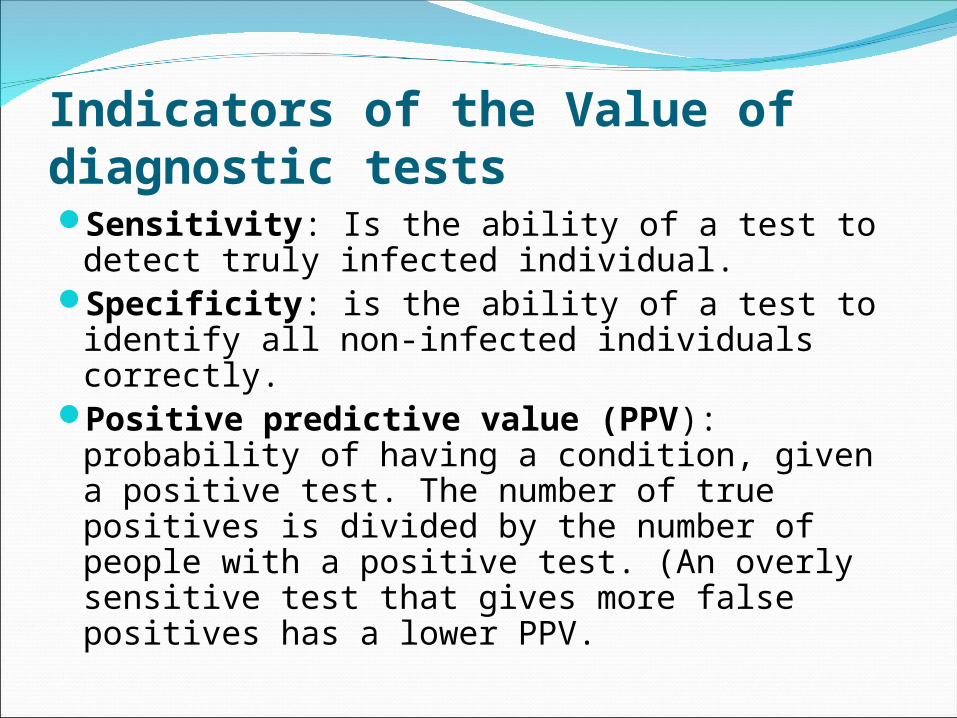
Indicators of the Value of diagnostic testsSensitivity: Is the ability of a test to detect
truly infected individual.Specificity: is the ability of a test to identify
all non-infected individuals correctly.Positive predictive value (PPV):
probability of having a condition, given a positive test. The number of true positives is divided by the number of people with a positive test. (An overly sensitive test that gives more false positives has a lower PPV.
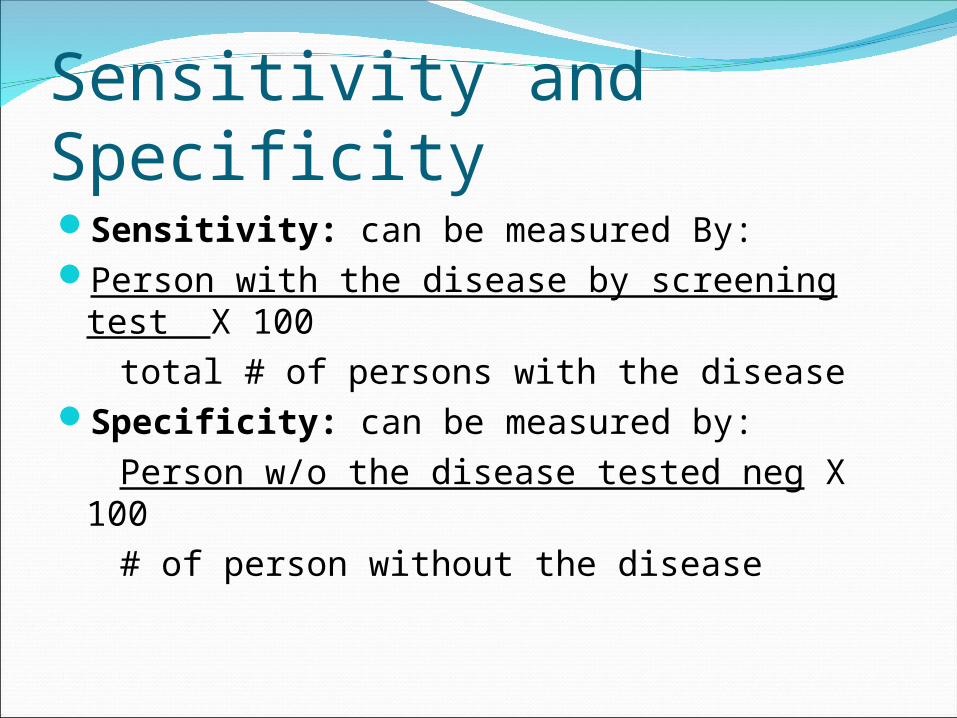
Sensitivity and SpecificitySensitivity: can be measured By:Person with the disease by screening test X
100 total # of persons with the diseaseSpecificity: can be measured by: Person w/o the disease tested neg X 100 # of person without the disease
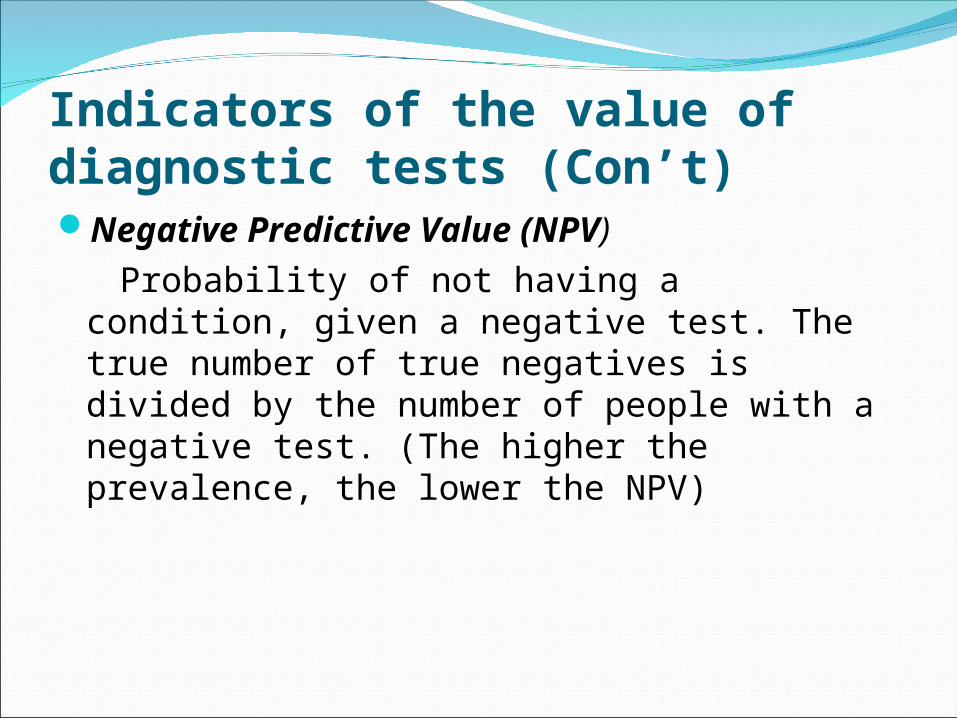
Indicators of the value of diagnostic tests (Con’t)Negative Predictive Value (NPV) Probability of not having a condition, given a
negative test. The true number of true negatives is divided by the number of people with a negative test. (The higher the prevalence, the lower the NPV)
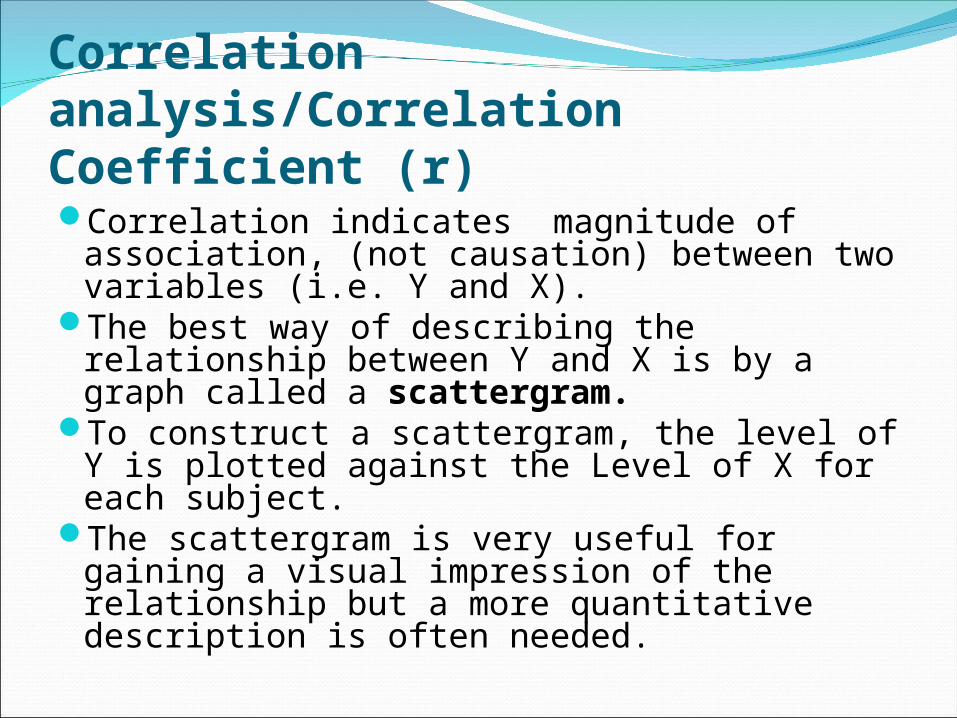
Correlation analysis/Correlation Coefficient (r)Correlation indicates magnitude of
association, (not causation) between two variables (i.e. Y and X).
The best way of describing the relationship between Y and X is by a graph called a scattergram.
To construct a scattergram, the level of Y is plotted against the Level of X for each subject.
The scattergram is very useful for gaining a visual impression of the relationship but a more quantitative description is often needed.
Correlation Coefficient (r)Correlation coefficient (r) is an index of
the extent to which two variables are associated.
It can take values between +1.0 and -1.0 depending on the strength of the association and whether a positive change in X produces a positive or negative change in Y.
A correlation coefficient of “0” indicates the two variables are not related.
Disease SurveillanceDefinition: Disease surveillance is the
systematic collection, organization, and analysis of the morbidity and mortality data related to a pathological condition.
Surveillance StepsCollection of casesOrganization of information from cases
collectedAnalysis of the organized dataDissemination of information
Collection of information
Collection of information is done through reported cases.
Identify reporting sourcesEstablish liaison with reporting sources
(Physicians, Hospital, other institutions dealing with patients)
Access records to generate case reports when necessary.
Review and file case reports on a timely basis
Maitain and complete an accurate surveillance database.

Surveillance ToolsA case definition needs to be established.Case report form.Guarantied confidentialityAdequate resourcesComputer program
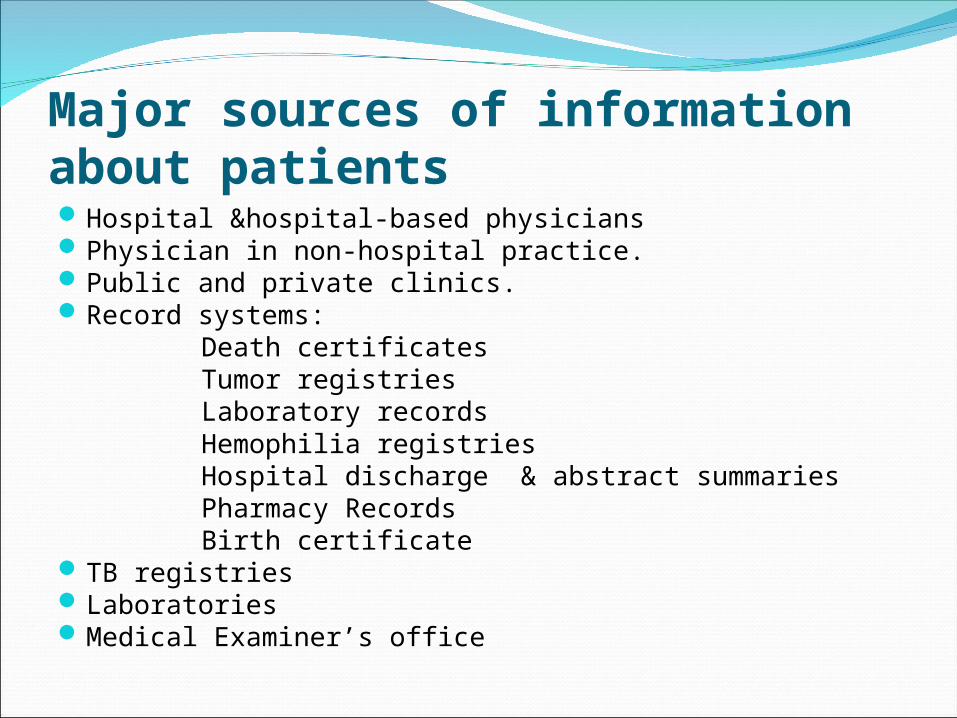
Major sources of information about patientsHospital &hospital-based physiciansPhysician in non-hospital practice.Public and private clinics.Record systems: Death certificates Tumor registries Laboratory records Hemophilia registries Hospital discharge & abstract summaries Pharmacy Records Birth certificateTB registriesLaboratoriesMedical Examiner’s office
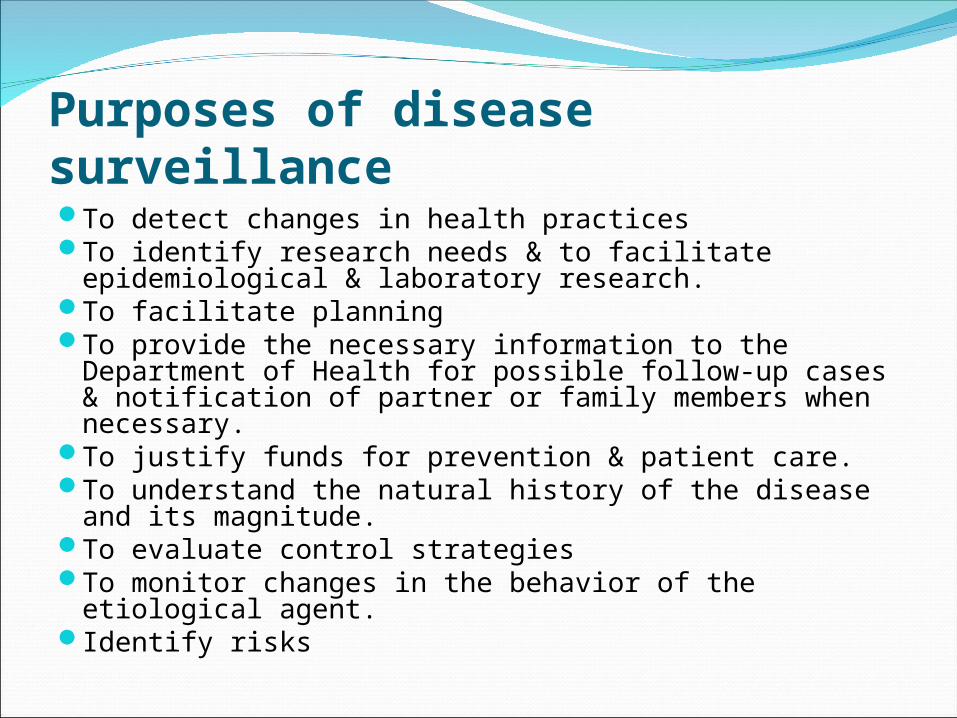
Purposes of disease surveillanceTo detect changes in health practicesTo identify research needs & to facilitate
epidemiological & laboratory research.To facilitate planningTo provide the necessary information to the
Department of Health for possible follow-up cases & notification of partner or family members when necessary.
To justify funds for prevention & patient care.To understand the natural history of the disease and its
magnitude.To evaluate control strategiesTo monitor changes in the behavior of the etiological
agent.Identify risks
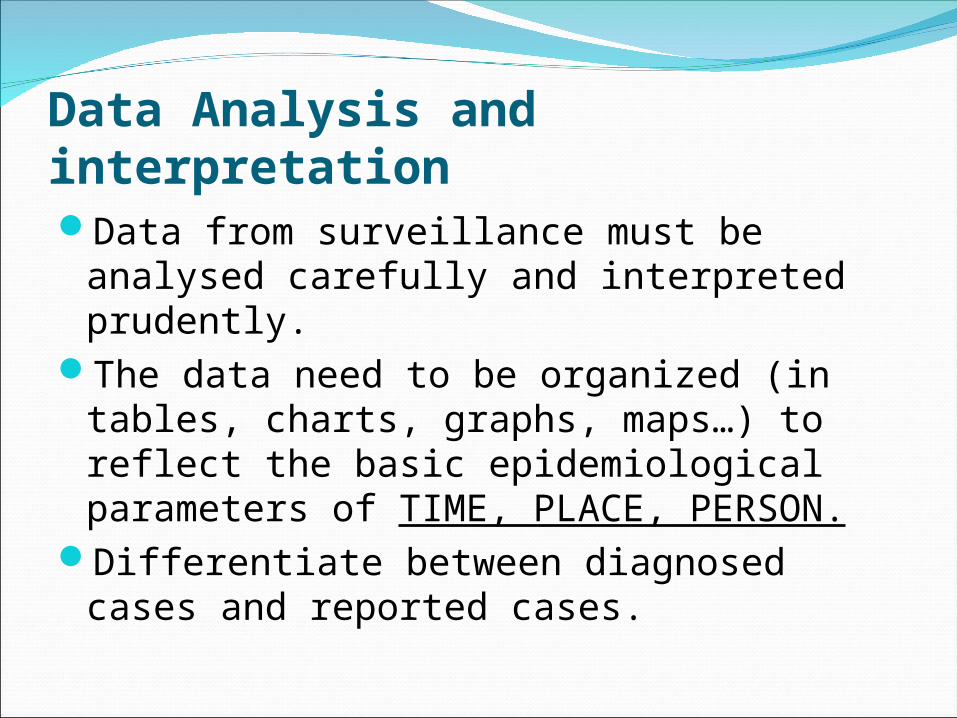
Data Analysis and interpretationData from surveillance must be analysed
carefully and interpreted prudently.The data need to be organized (in tables,
charts, graphs, maps…) to reflect the basic epidemiological parameters of TIME, PLACE, PERSON.
Differentiate between diagnosed cases and reported cases.
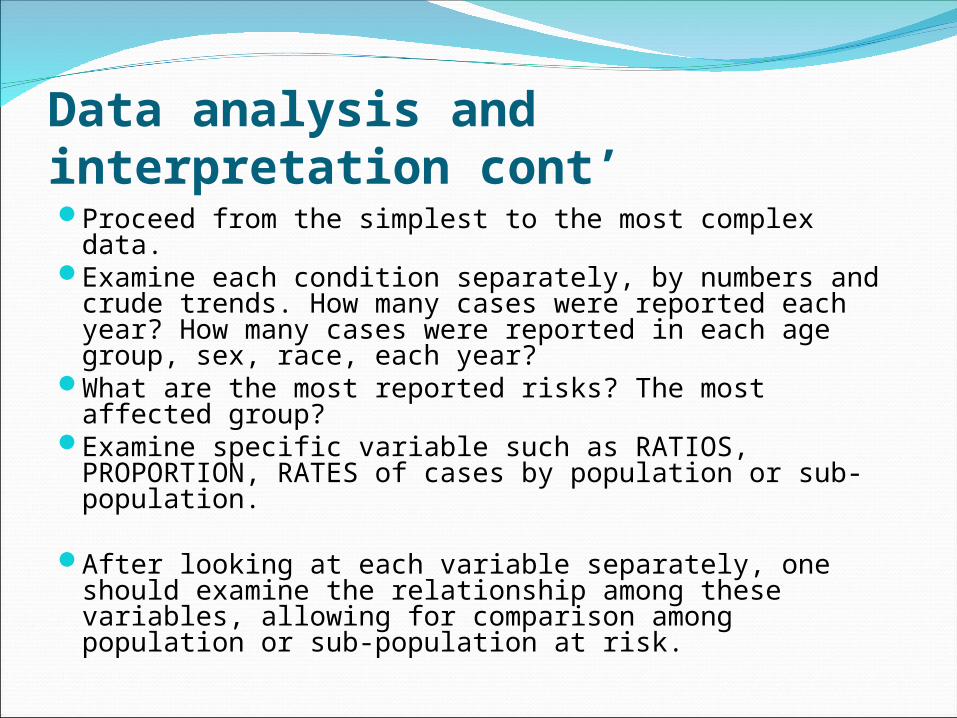
Data analysis and interpretation cont’Proceed from the simplest to the most complex data.Examine each condition separately, by numbers and
crude trends. How many cases were reported each year? How many cases were reported in each age group, sex, race, each year?
What are the most reported risks? The most affected group?
Examine specific variable such as RATIOS, PROPORTION, RATES of cases by population or sub-population.
After looking at each variable separately, one should examine the relationship among these variables, allowing for comparison among population or sub-population at risk.
Dissemination of Surveillance DataEstablish the message The message should reflect the basic purpose of the
surveillance system. Information should include: routine data report, routine analyses of the data, notification of changes in the course of the disease.
Define the audience: Population at risk of exposure or disease. Public health practitioners Health care providers. Policy makers. The press The general publicDevelop formats (maps, graphs, diagrams…)Evaluation of the effect
How to best use surveillance data in a day to day HERRTo identify those who are affected (population,
age groups, race/ethnic groups, etc)What are the exposures or behaviors that
place individuals at risk for diseasesWhere are the diseases occurring, Where are
the events that place individuals at risk occurring
What are the trends?To prioritize HERR activities, shape messages
according to risk behaviors.
End of the Epidemiology Class Thank You! Have a nice day!