Public Governance Indicators: A Literature Review · PDF filePublic Governance Indicators: A...
61
ST/ESA/PAD/SER.E/100 Department of Economic and Social Affairs Public Governance Indicators: A Literature Review United Nations New York, 2007
Transcript of Public Governance Indicators: A Literature Review · PDF filePublic Governance Indicators: A...
ST/ESA/PAD/SER.E/100
Department of Economic and Social Affairs
Public Governance Indicators: A Literature Review
United Nations New York, 2007
ii
DESA The Department of Economic and Social Affairs of the United Nations Secretariat is a vital interface between global policies in the economic, social and environmental spheres and national action. The Department works in three main interlinked areas: (i) it generates, compiles and analyses a wide range of economic, social and environmental data and information on which Member States of the United Nations draw to review common problems and to take stock of policy options; (ii) it facilitates the negotiations of Member States in many intergovernmental bodies on joint courses of action to address ongoing or emerging global challenges; and (iii) it advises interested Governments on the ways and means of translating policy frameworks developed in United Nations conferences and summits into programmes at the country level and, through technical assistance, helps build national capacities.
Note
The designations employed and the presentation of the material in this publication do not imply the expression of any opinion whatsoever on the part of the Secretariat of the United Nations concerning the legal status of any country, territory, city or area, or of its authorities, or concerning the delimitation of its frontiers or boundaries. The designations “developed” and “developing” economies are intended for statistical convenience and do not necessarily imply a judgement about the stage reached by a particular country or area in the development process. The term “country” as used in the text of this publication also refers, as appropriate, to territories or areas. The present report was drafted by Mr. Michael G. Mimicopoulos, Senior Economic Affairs Officer Knowledge Management Branch (KMB), Division for Public Administration and Development Management (DPADM), United Nations Department of Economic and Social Affairs (UNDESA), and two interns, Ms.Lada Kyj, Department of Statistics, Rice University, Houston, Texas; and Mr. Nicolas Sormani, Ecole Nationale de la Statistique et de l’Administration Economique (ENSAE), Paris, France. Mr. Guido Bertucci, Director of DPADM/UNDESA, provided overall guidance for the report, and Ms. Haiyan Qian, Chief, KMB/DPADM/UNDESA, was the direct supervisor. The views expressed are those of the authors and do not imply any expression of opinion on the part of the United Nations. Inquiries concerning this document may be directed to: Division for Public Administration and Development Management Department of Economic and Social Affairs United Nations, New York, NY 10017, USA Fax: 1-212-963-9681; Tel.: 1-212-963-5859 ST/ESA/PAD/SER.E/100 United Nations publication All rights reserved.
iii
FOREWORD
Societies are characterized by two distinct sectors – the public and the private. The public sector is monopolistic, providing essential services, while the private sector is competitive, with alternative sources for the goods and services it produces. Government is a particularly effective form of monopoly since government cannot go out of business. Reducing the cost of government by downsizing, outsourcing and improving government efficiency, is but one of the challenges faced by governments worldwide in their effort to maximize value for citizens. What is equally important, in the process of government reinvention which societies are currently undergoing in building the government institutions for the 21st century, is to implement policies and initiatives to promote transparency and accountability in public administration, and policies which foster an environment of trust in the private sector. Good public governance also underpins good corporate governance. Governance refers to the formal and informal arrangements that determine how public decisions are made and how public actions are carried out from the perspective of maintaining a country’s constitutional values. Public administration is a constituent pillar of governance. Governance indicators assess and compare the institutional quality of countries and can assist in research and policymaking. Initially these indicators were used by academics in analyzing economic growth and evaluating the performance of the public sector. More recently however governance indicators are being used to evaluate decisions about conditional development assistance. Measuring governance quality is thus of great significance. A number of different indicators are in use by different organizations. Indicators are complex and reductive and the evaluation process is a complex exercise, given that the public sector is no longer homogeneous. It is also difficult to draw conclusions from input data to output, and then to outcome. It is moreover important to have data on the regional and local levels, as the more resources that are allocated at the subnational level, the more value that citizens obtain. It is therefore prudent to pay attention to user satisfaction. Evaluating the public sector is moreover fraught with the difficulty of assessing that which is effective in the long run, but not in the short run, as in the case of education. It would be an impossible exercise to try to aggregate all indicators and come up with an index. But there are useful indicators that can be extracted from organizations’ data–bases, such as indicators on corruption by Transparency International and on democratic control by Freedom House, data from the Economist Intelligence unit on countries, OECD data, and data from a number of other organizations. It all depends on what is looking for. This report intends to give an overview of those indicators, and will briefly discuss their pros and cons. “Good” governance, which establishes a framework for fighting poverty and inequality, has motivated many researchers to compute single or aggregated indicators. Part I of the paper evaluates existing methodologies, including data collection, sampling and ideological biases, the validity of proxy variables, aggregation methods, and applicability of results, and argues that any discussion of governance should integrate the private sector more closely as a partner. The paper argues that new transforming factors such as the Information Age, globalization and decentralization should be better taken into account in the assessment process of governance. It
iv
also discusses the topic of accurately assessing citizen needs to better implement “good” governance mechanisms. It concludes with a discussion of future directions for data collection, particularly the need for more objective and geographically disaggregated indicators. Part II selects three core dimensions of governance and some economic indicators which can assist in monitoring governance in the public sector. Guido Bertucci Director Division for Public Administration and Development Management United Nations Department of Economic and Social Affairs New York, January 2007
v
Contents
PART I: REVIEW OF THE LITERATURE............................................................................. 1 I. Introduction ........................................................................................................................................... 1
1. Definitions........................................................................................................................................ 2 2. What is “good” governance?............................................................................................................ 4 3. Why evaluate governance?............................................................................................................... 5 4. How to evaluate governance? .......................................................................................................... 6
II. Transforming Factors........................................................................................................................... 7 1. The Information Age, towards e-governance and e-democracy....................................................... 8 2. Does globalization weaken public governance? .............................................................................. 9 3. Decentralization, a way towards democratization and better public governance?......................... 11
III. Data and Analysis............................................................................................................................. 12 1. Characteristics of a “good” source data set .................................................................................... 12 2. Single governance indicators ......................................................................................................... 14 3. Aggregated governance indicators ................................................................................................. 16
a. World Bank Research Institute’s aggregated governance indicators ......................................... 16 b. OECD’s governance indicators.................................................................................................. 17 c. Transparency International’s aggregated governance indicators ............................................... 19 d. Global Integrity’s index ............................................................................................................. 20 e. Other aggregated governance indicators .................................................................................... 21 f. Comparison and use of aggregated governance indicators......................................................... 23
4. Private sector’s assessment of governance..................................................................................... 24 5. E-governance, from governmental website evaluation to e-governmental practices assessment .. 26
IV. Methods............................................................................................................................................ 28 1. The Unobserved Component Model .............................................................................................. 29 2. Parametric aggregated governance indicators ................................................................................ 30 3. Non-parametric aggregated governance indicators ........................................................................ 31 4. An original linear ordering method ................................................................................................ 32 5. Factor Analysis............................................................................................................................... 32 6. Panel data analysis ......................................................................................................................... 33
V. Future directions on public governance assessment .......................................................................... 34 1. Building an international objective data set on public governance................................................ 34 2. Reforms in local governance demand disaggregated indicators .................................................... 35 3. The bottom-up approach, or how public governance could better implement citizen needs ......... 37
VI. Concluding remarks ......................................................................................................................... 38 PART II: CORE DIMENSIONS OF GOVERNANCE AND ECONOMIC INDICATORS TO MONITOR THE PUBLIC SECTOR................................................................................. 40
I. Efficiency, transparency and participation.......................................................................................... 40 1. Efficiency ....................................................................................................................................... 40 2. Transparency .................................................................................................................................. 41 3. Participation ................................................................................................................................... 42
II. Economic Indicators .......................................................................................................................... 42 References.................................................................................................................................... 46 Annex: Table ............................................................................................................................... 53

1
Public Governance Indicators: A Literature Review
PART I: REVIEW OF THE LITERATURE I. Introduction The issue of governance has emerged as a key concept pre-occupying the international community. Governance refers to the way a society sets and manages the rules that guide policy-making and policy implementation. Per capita income and the quality of governance are strongly positively correlated across countries. Three complementary possibilities work their way into this correlation. One possibility is that better governance exerts a powerful effect on income. A second possibility is that improvements in governance are the result of a higher income. Yet, a third possibility is that there are other factors that interplay to make countries richer and better governed. In cases where higher per capita incomes fail to result in better governance, one possible explanation is ‘state capture’, defined as the illicit influence of the elite in shaping the laws, policies and regulations of the state. The ‘capture’ of the institutions of the state by elites implies that they can benefit from the lack of good governance, and therefore are likely to resist demands for change. Governance is a very broad concept, and operates at every level, such as household, village, municipality, nation, region or globe [Nzongola-Ntalaja 2002]. The present report reviews the literature on the concept of governance when it is applied to a nation-state, with a focus on data and methodology. Furthermore, it synthesizes the various perspectives on public governance to present a comprehensive understanding of this issue. The role of governments should be to provide a stable political and economic environment. Government policies throughout the world should aim to promote fiscal responsibility, remove barriers to competition, ensure a legal framework for property rights and regulatory oversight, and ensure transparency of the law and policies. The United Nations has considered “good” governance as an essential component of the Millennium Development Goals [MDGs], because “good” governance establishes a framework for fighting poverty, inequality, and many of humanities’ other shortcomings. This fact has motivated researchers to try to assess governance, and this effort is an attempt to synthesize the results of this ever-expanding body of literature. The paper seeks to provide an overview of the existing indicator variables, both single and aggregated. It also attempts to evaluate existing methodologies, ranging from data collection problems, sampling and ideological biases, validity of some proxy variables, aggregation methods, and applicability of results. While acknowledging the pro-business bias of this data, the profound impact of Foreign Direct Investment on economic development cannot be ignored. Hence any discussion of governance reform should
2
integrate the private sector more closely as a partner. In light of this, the paper includes some private sector’s assessing methodologies. Governance studies should moreover, integrate a number of new factors which have greatly transformed the notion and practice of governance. In particular, it singles out the Information Age, Globalization, and Decentralization. The Information Age in the form of Information and Communication Technologies (ICTs) has most visibly changed the face of governance. The internet is quickly becoming the new “assembly room” around the world. E-governance has two parts: 1) e-government provides a cost effective means of disseminating information, and 2) e-democracy enables citizens to participate more actively in governance. The approach taken here is that e-governance data should be included in the governance debate. Globalization renders vacuum-like single country analysis irrelevant, because the effects of public policies are no longer limited by national boundaries. As a result, the impact of globalization begs the question of whether or not the size of the public sector has changed. Finally, decentralization has played a pivotal role in engaging civil society into the governance process.
The paper concludes with a discussion of future directions for data collection. As stated above, decentralization requires data collection at more local levels as well as geographically disaggregated indicators. Likewise, the need to limit the bias introduced by subjective data calls for objective and internationally comparable data on the global level and in this context a current project is highlighted. Assessing citizen needs accurately is also taken up along with the importance this plays in determining “good” governance. 1. Definitions Due to the inherent diversity in national traditions and public cultures, there exist many definitions of governance in the literature, but it is possible to isolate just three main types of governance, as Nzongola-Ntalaja does in [Nzongola-Ntalaja 2003]. First, political or public governance, whose authority is the State, government or public sector, relates to the process by which a society organizes its affairs and manages itself. The public sector could be defined as “activities that are undertaken with public funds, whether within or outside of core government, and whether those funds represent a direct transfer or are provided in the form of an implicit guarantee” [Manning, Kraan 2006]1. Second, economic governance, whose authority is the private sector, relates to the policies, the processes or organizational mechanisms that are necessary to produce and distribute services and goods. Third, social governance, whose authority is the civil society, including citizens and non-for-profit organizations, relates to a system of values and beliefs that are necessary for social behaviors to happen and for public decisions to be taken.
1 We are very grateful to Nick Manning, Dirk-Jan Kraan and Jana Malinska, at the OECD, for providing us a draft of their coming publication for the OECD Project on Management in Government expected in November 2006 [Manning, Kraan, Malinska 2006]
3
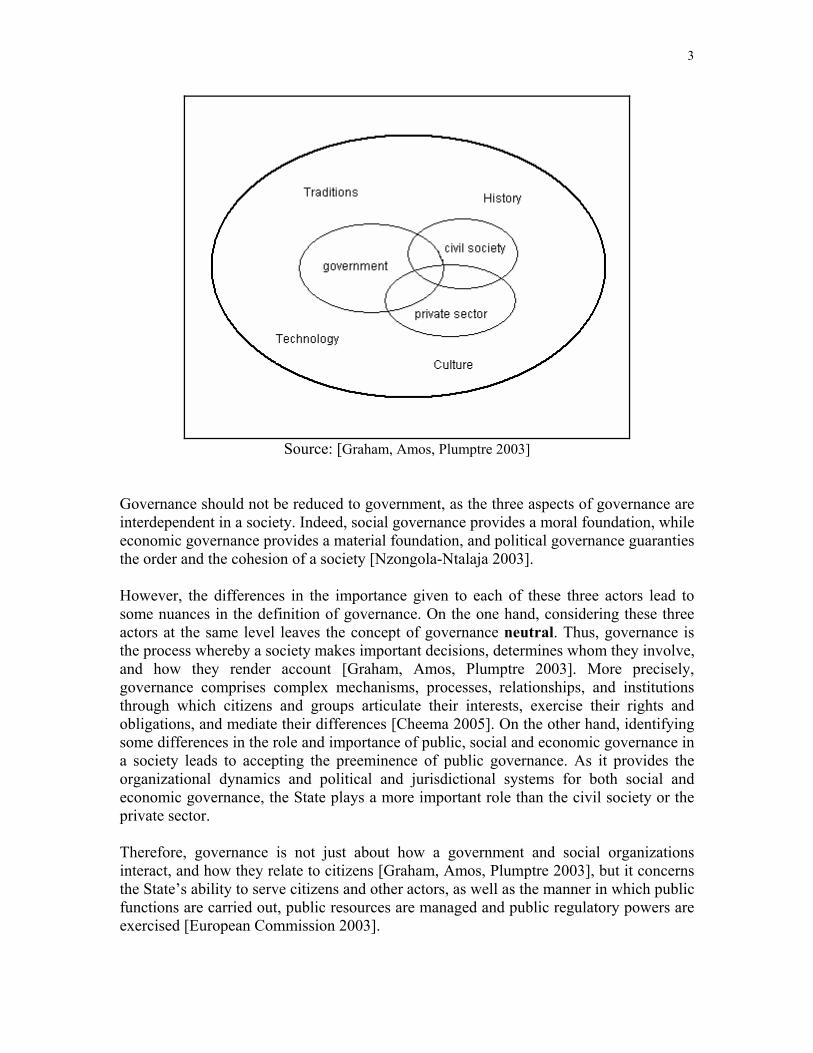
Source: [Graham, Amos, Plumptre 2003]
Governance should not be reduced to government, as the three aspects of governance are interdependent in a society. Indeed, social governance provides a moral foundation, while economic governance provides a material foundation, and political governance guaranties the order and the cohesion of a society [Nzongola-Ntalaja 2003]. However, the differences in the importance given to each of these three actors lead to some nuances in the definition of governance. On the one hand, considering these three actors at the same level leaves the concept of governance neutral. Thus, governance is the process whereby a society makes important decisions, determines whom they involve, and how they render account [Graham, Amos, Plumptre 2003]. More precisely, governance comprises complex mechanisms, processes, relationships, and institutions through which citizens and groups articulate their interests, exercise their rights and obligations, and mediate their differences [Cheema 2005]. On the other hand, identifying some differences in the role and importance of public, social and economic governance in a society leads to accepting the preeminence of public governance. As it provides the organizational dynamics and political and jurisdictional systems for both social and economic governance, the State plays a more important role than the civil society or the private sector. Therefore, governance is not just about how a government and social organizations interact, and how they relate to citizens [Graham, Amos, Plumptre 2003], but it concerns the State’s ability to serve citizens and other actors, as well as the manner in which public functions are carried out, public resources are managed and public regulatory powers are exercised [European Commission 2003].
4
In this context, governance can be viewed as the traditions and the institutions by which authority in a country is exercised for the common good. This includes the process by which those in authority are selected, monitored and replaced, the capacity of the government to effectively manage its resources and implement sound policies, and the respect of citizens and the state for the institutions that govern economic and social interactions among them [World Bank b]. Besides, public governance represents more than a means of providing common good, as it can be related to the government capacity to help their citizens’ ability to achieve individual satisfaction and material prosperity. Therefore, governance could be compared to the management, supply, and delivery of political goods to citizens of a nation-state. Political goods are various, and they include human security, rule of law, political and civil freedoms, medical and health care, schools and education, communication networks, money and banking system, fiscal and institutional context, support for civil society, or regulating the sharing of the environmental commons [Rotberg 2004-05] [Besancon 2003]. The practice of governance is also ruled by community values, informal traditions, accepted practices, or unwritten codes of conduct [Plumptre]. 2. What is “good” governance? Governance is “good” when it allocates and manages resources to respond to collective problems, in other words, when a State efficiently provides public goods of necessary quality to its citizens. Hence states should be assessed on both the quality and the quantity of public goods provided to citizens [Rotberg 2004-05]. The policies that supply public goods are guided by principles such as human rights, democratization and democracy, transparency, participation and decentralized power sharing, sound public administration, accountability, rule of law, effectiveness, equity, and strategic vision [Cheema 2005]. The Human Development Report issued in 2002 insists on “good” governance as a democratic exigency, in order to “[rid] societies of corruption, [give] people the rights, the means, and the capacity to participate in the decisions that affect their lives and to hold their governments accountable for what they do” [Nzongola-Ntalaja 2002]. “Good” governance promotes gender equality, sustains the environment, enables citizens to exercise personal freedoms, and provides tools to reduce poverty, deprivation, fear, and violence [Cheema 2005]. The UN views good governance as participatory, transparent and accountable. It encompasses state institutions and their operations and includes private sector and civil society organizations. In practice, such principles should translate into “strengthening democratic institutions” [Nzongola-Ntalaja 2002] by free, fair and frequent elections, a representative legislature, some judiciary and media independence from the State, the guarantee of human rights, transparent and accountable institutions, local governments that possess decentralized authority, a civil society which sets priorities and defends “the needs of the most vulnerable people” [Cheema 2005].
5
Good public governance also underpins good corporate governance. Good public governance is the bedrock for stable and successful economies. The same underlying principles that are found in public governance also apply in their standards for good corporate governance.
3. Why evaluate governance? The evaluation of “good” governance is important for a number of reasons. First, donors and reformers take it into consideration when assessing the impact of policies and determining future development projects. Second, “good” governance evaluations determine the investment climate. It is well established that aid flows have greater impacts on development in countries with “good” governance.
Having established why, the next step is to identify the parties interested in evaluating “good” governance. Consistent with Kaufmann’s suggestion to integrate other key actors outside the public sector into the governance debate [Kaufmann, Kraay, Mastruzzi 2005], interested parties are classified into four groups: Donors, Monitors, Private Interests, and Scholars. The Donors group consists of the World Bank (WB), the International Monetary Fund, the European Bank for Reconstruction and Development, the Asian Development Bank and donor nations who have an institutional or economic interest in assessing the level of governance in countries where they donate money for economic development projects. For instance, some World Bank’s stakeholder governments insist on avoiding arbitrary decisions when lending money to developing countries, and M. Wolfowitz would like the WB to “ensure its money is well spent” [The Financial Times 2006a]. The Asian Development Bank recently revealed that 300 billion of dollars are annually invested in “badly needed infrastructure” in Asia [The Financial Times 2006b]. Donor countries can require periodic reporting and auditing to ensure that allocated funds are spent as they ought to be. Such reporting should also be made transparent to the public so that the public can hold the government accountable for its actions. Corruption is perhaps the single biggest obstacle to the delivery of aid to the poor. The Monitors group consists of the United Nations (UN) and Non Governmental Organizations (NGOs) that monitor as well as implement humanitarian and economic development projects. Specifically, the UN seeks to improve governance by increasing participation and accountability. The Private Interests group is composed of transnational corporations with an interest in Foreign Direct Investment. This group is concerned with the risk of their investments. . Finally, the Scholars group is composed of scholars in both think tanks and academia who have an interest in the impact of governance on topics in political science and economics. Each group brings a different perspective to the debate and as a result considering all four provides a more comprehensive view of governance evaluation.
6
4. How to evaluate governance? Governance can be examined at three levels. On a global level, governance can be compared across countries and over time, thanks to standardized data that can be applied to diverse cultures, economies, and political systems. Governance data can enable robust benchmarking between countries, using common units of analysis. On a national level, governance can be analyzed more comprehensively thanks to more flexible and specific features. On a local level, governance assessment is targeted in a geographical region. This paper focuses on the global and national perspectives, but the importance of local perspective data should not be overlooked and will be discussed in greater detail in section V. Gross Domestic Product (GDP) per head is the most commonly used measure of a country’s success, and represents a yardstick which attempts to measure economic welfare which may result from good governance among other factors. But it is flawed as a guide to a nation’s economic well-being. The Organisation for Economic Cooperation and Development (OECD) considers some alternatives in a new study [OECD, 2006]. A nation’s well-being depends on factors, not incorporated into GDP calculations, such as uneven distribution of income, the quality of the environment, or leisure time. Governance has a role to play in this respect. The recent work of OECD adjusts GDP for the distribution of income and places a value on leisure. Thus, a country enjoying a very uneven distribution of income would have a lower level of well-being than one with the same GDP but less poverty. Even with these adjustments however, GDP is far from being a comprehensive yardstick in assessing a nation’s quality of governance. The question that needs to be answered is how do governments manage the totality of their competencies to achieve prosperity and well-being? A country’s well-being cannot be reduced only to GDP and productivity because its enterprises and its people must cope with political, social and cultural dimensions. Therefore, governments need to provide an environment that has effective and efficient institutions and policies. Most global governance evaluations have focused on standardized principles of administration that are believed to be fundamental to the development of effective public administration. Once these principles have been identified, the second step involves the compiling of necessary measures from quantifiable inputs, processes, and outputs that manifest these desired dimensions. Three dimensions of governance are isolated as essential: Efficiency, Transparency, and Participation [Mimicopoulos 2006]. These dimensions are explored in further detail in part II of this paper. Efficiency should be understood as a government’s ability to establish predictability in the institutional and policy environment [Mimicopoulos 2006]. This is brought about by an economically efficient system of production and distribution as well as a fair and consistent legal system. Efficiency is also a question of correctly prioritizing government services to correspond with citizen needs [Afonso, Schuknecht, Tanzi 2006]. This includes the provision of services such as security, healthcare, and education.
7
Transparency is the availability and clarity of information provided to the general public about government activity. Governments must not only provide information, but also ensure that as many citizens as possible have access to this information with the goal of increasing citizen participation. A lack of transparency creates opportunities for government corruption and reduces public sector efficiency. Linked with transparency is the issue of Accountability. Accountability rests on the establishment of criteria for evaluating the performance of public sector institutions. This includes economic and financial accountability brought about by efficiency in resource use, expenditure control, and internal and external audits. Accountability improves a government’s legitimacy. Transparency and participation are essential ingredients in establishing accountability [ADB].
Participation is an essential element for an engaged civil society. The public sector can promote participation by enacting legislation that strengthens the freedom and plurality of media, establishing an independent electoral management body, and encouraging public input into decision making on government plans and budgeting. Participation requires enhanced capacity and skills of stakeholders and sustainable policies supported by institutions of public administration [ADB]. II. Transforming Factors Notions of citizen engagement in governance and the emergence of a knowledge society have played an important role in transforming the nature of governance. Access to opportunity has developed into a requisite element of “good” governance. Specifically, the Information Age and the resulting Information and Communication Technology (ICT) tools have dramatically altered the relationship between the public sector and other actors in society. ICT has proven to be a powerful means of disseminating information in times of political uncertainty [Kyj 2006]. More importantly, ICT can be used in a sustainable manner to facilitate government operations as well as engage civil society. Globalization has increased the role of global institutions and has simultaneously expanded the scope of government responsibilities. Thus, the manner a state manages its economy has changed, and the importance of its regulatory role may have decreased as a consequence of the increased interdependence of economies. Finally, decentralization has also altered the relationship between citizens and public administration institutions. Increasingly, more public service responsibilities are being delegated to local governments, thereby reducing the layers of bureaucracy between service provider and citizen. Although decentralization limits the corruption introduced by excessive bureaucratic hierarchies, in some instances it also reinforces the dominance of local hegemony. All of these factors have not only provided new means for the government to conduct operations, but have also generated new demands for services. The position is taken here that any discussion of governance should actively incorporate these factors.
8
1. The Information Age, towards e-governance and e-democracy The Information Age has ushered in changes in regulation/deregulation, licensing, incentives, and risk management. The challenge is to improve efficiency and provide more transparent, higher quality service. The main principles driving these changes range from downsizing and outsourcing whenever possible, empowering government employees through training and rewarding productivity and creativity, viewing citizens as clients, to implementing initiatives to promote increased levels of transparency and accountability in government [Mimicopoulos 2006]. Furthermore, the Information Age has exacerbated the divide in access opportunities between enfranchised and poor/disenfranchised [Khan 2005]. As a result, “good” governance is no longer limited to adopting efficient methods offered by ICT, but now also includes ensuring that all citizens have access to this technology. Access to opportunity is recognized as an important vehicle for development [Khan 2005]. The top three barriers to accessing ITC tools have been identified as poverty, lack of education, and lack of infrastructure [UNDESA 2004]. “Good” governance must work to help the neediest citizens overcome these barriers. The use of ICTs to improve the ability of government to address the needs of society is defined as e-governance. These services include improved dissemination of information to citizens, better coordination of the strategic planning process, and facilitating the attainment of development goals. In contrast, E-government is limited to the use of ICTs by a government [World Bank a]. E-government is composed of e-administration and e-services. E-administration, the use of ICTs in creating data repositories for Management Information Systems and computerizing records, has rendered traditional administration more efficient. Furthermore, e-services, namely the provision of government services online, has also greatly improved efficiency as well as eliminated access points for corrupt practices. Finally, ICTs play an important role in enhancing democracy by way of e-democracy, namely, the ability of all sections of society to participate in the governance of the State. The focus of e-democracy is to improve transparency, accountability and participation [India].
The benefits of adopting ICTs in governance include: reducing costs, promoting economic development by creating a more positive business climate and better interactions between business and industry, enhancing transparency and accountability of decision-making processes, citizen empowerment through access to information, improving the quality of the service delivery to citizens, improving public administration and the efficiency of government management, and facilitating an e-society by promoting the use of ICTs in other sectors.
Anecdotal evidence justifies the inclusion of ICTs and e-government in the governance discussion.
9
The OPEN (Online Procedures Enhancement for Civil Applications) in Seoul, South Korea, demonstrates the role that ICTs can play in improving transparency and efficiency in public administration institutions. The program gives citizens the ability to track online the progress of their applications for public services. Initiated in 1998 as a component of a comprehensive campaign battling corruption, OPEN has succeeded in bringing transparency to government functions such as licensing and permits. By streamlining regulatory rules and creating an online monitoring system to track the progress of government applications, this program has eliminated many potential sources of bribery and corruption [Park 2005]. Forum, a website launched by Armenia’s National Academy of Sciences with the support of the United Nations Development Programme (UNDP), has helped increase public participation in governance, created new opportunities to broaden public awareness about democratic issues, and established new opportunities for interaction. The website hosts online communities on human rights, environmental protection, politics, human development, gender equality, and volunteering. Forum uses a variety of tools to keep participants informed and encourages interaction. Political parties participate in the online discussions, post drafts of legislation, and receive comments form the general public [UNDP BRC 2004].
2. Does globalization weaken public governance? Globalization is a complex and broad concept. It is usually related to goods, services, financial products, information and cultures which are more mobile and spread “more freely” all around the world [Global Policy Forum]. Global firms have emerged, and the markets are more integrated as a result of technical progress (ICTs). International competition and the division of labor have forced countries to specialize their productions, which has simultaneously brought exacerbated inequalities between countries [IMF 2002]. Therefore, coping with more global issues has increased the importance of international organizations such as the World Trade Organization, the International Monetary Fund, or the World Bank. Helping the poorest countries is a necessity because they are confronted with weaker negotiating positions compared to the developed world on issues such as international trade, capital markets regulation, human trafficking, and environmental concerns. Nevertheless, this evolution simultaneously raises a problem of loss of “sovereignty”, viewed as the exclusive authority of a nation-State to manage itself [Global Policy Forum] [Zhongying 2005]. Indeed, global organizations assist developing countries in their economic reforms but are “neither elected by nor are they accountable to citizens” [Cheema 2005]. In addition, globalization has made public policies more global [Mimicopoulos 2006] and transformed the supply of services in developed countries, with more and more private services replacing state-supplied services [Cheema 2005]. The 1990’s saw many developing countries peg their currencies to foreign currencies. While providing greater
10
currency stability, such policies limited the scope of monetary policies for these countries and left states with less control over their economies [Global Policy Forum]. Globalization has also led to a decrease in trade tariffs, thereby creating greater markets for exported goods and at the same time reducing protective measures for nascent industries in the developing world. Also, globalization, with the resulting access to the global capital markets, has increased the privatization of public enterprises. Finally, due to more economic competition, states may have been forced to develop export processing zones, weakening public tax and regulatory systems [Global Policy Forum].
The question is not whether globalization has transformed public governance worldwide, but rather the nature and the extent of this transformation. A study conducted by the United Nations Department of Economic and Social Affairs (UNDESA) in 2001 attempted to measure one aspect of public governance, the size of the State, and quantify the impact of globalization on it [UNDESA 2001]. The State is defined as the entity which aims at maximizing public policy, and not profit, like a voluntary organization. Even if it has the monopoly of legitimate force, it is often limited by democratic traditions or a written code (Constitution, bill of rights). Four dimensions can be isolated in the regulatory role of the State. First, the State is a tax collector. Second, the State is a producer of public services, as it provides goods and services, sold or distributed without charge to residents. Third, the State is a consumer, and its consumption corresponds to the sum of government production and purchases of goods and services distributed without charge, less fees. Fourth, the State redistributes wealth by transferring cash to households, and paying subsidies to private or public organizations. Four variables approximate the size of governments and then, its determinants and evolution between 1990 and 1997 are studied by the UNDESA via Ordinary Least Square regressions.
First, the size of a government is measured by its public sector employment, approximated by the share of government employees in the total population. The data reveal that public sector employment is large in the developed and transitional economies compared to developing countries. Nevertheless, the size of government is very diverse everywhere, and remains relatively static over time. Only a few transition countries show a large drop in government size due to massive privatization of State corporations. Furthermore, the study finds that population is a statistically significant negative factor of the size of a government, while area is a positive one. Thus, the size of a State should be lower where population is high and the territory small. Second, the size of government is measured by the share of government consumption of Gross Domestic Product (GDP) in US Dollars. Government consumption is reducing over time in Africa and in Asia, and it is increasing in transitional economies. The DESA study finds that income in domestic prices is a statistically significant positive factor of the size of a government, but the results should be considered with caution, as it becomes a negative factor when expressed in Purchasing Power Parity prices.
11
Third, central government expenditure is utilized to approximate the size of government. The transfers, subsidies, outlays for consumption and investment data show that developed countries have larger governments than developing ones. In developed and transitional countries, the subsidies and transfers are the most important, whereas wage payments are so in developing economies. In this case, the size of the State is positively correlated with globalization. Indeed, the ratio of trade to GDP, as well as foreign direct investment flows, has a statistically significant positive impact on central government expenditure. This positive correlation between globalization and the size of the State may be explained by the fact that the consequences of globalization demand more public budgets to be efficiently faced. Fourth, central government tax revenue is used to represent the presence of the State in the economy. Developed and transitional economies collect more taxes than developing countries. Trade taxes emerge as a larger portion of the tax revenue in developing nations. Once again, globalization positively impacts the change in central government tax revenue and expenditure between 1990 and 1997, and more “open economies are better at collecting all types of tax” [UNDESA 2001]. Finally, the UNDESA study displays no evidence that globalization has a negative impact on the size of the State, and that it would weaken its presence and some of its functions in the economy. Nonetheless, quantity and quality of data need to be improved in order to facilitate cross-country comparison and refine the interpretations of the effect of globalization on public governance [UNDESA 2001]. 3. Decentralization, a way towards democratization and better public governance?
Decentralization has been suggested as an alternative model of government that builds trust, transparency, and accountability. Decentralized governance defines the systematic and harmonious interrelationship resulting from the balancing of power and responsibilities between central governments, other levels of government, and non-government actors, and the capacity of local bodies to carry out their responsibilities using participatory mechanisms. United Nations Development Programme’s experiences with decentralization have demonstrated its significant contributions to improving the population’s access to health, education, employment and sustainable livelihoods’ opportunities, and various social services [UNDP 2000]. Decentralization is strongly correlated with citizen’s increased participation in economic, social, and political activities. Furthermore, it is essential in developing and enhancing people’s capacities and fostering government responsiveness.
Nevertheless, decentralization should not be viewed as a panacea. A UNDP study in Indonesia finds that instead of strengthening local participation, decentralization can reinforce the power and influence of the local elites [Khan 2005]. The focus of decentralization is on increasing the ability of public administration institutions to meet a variety of social needs, with success dependent on involving public, private and civil sectors.
12
Decentralization can take four major forms [Rondinelli, Cheema 1983]:
1) Deconcentration – dispersing decision making authority to reach the entire territory
2) Delegation – allocating decision making authority to local governments 3) Devolution – financial and legal establishment of government bodies at the
sub-national level 4) Divestment – transfer of planning and administrative responsibilities from
government to private or non-governmental institutions. Decentralization is championed as a vehicle of democratization. It should be recognized that decentralization does not render central governments obsolete. Instead both play complementary roles that help bring about the most effective service. Decentralization needs to be done in the context of existing cultural elements, be sensitive of changing relationships, and seek to enhance mechanisms of participation and partnership. III. Data and Analysis
Decision makers and academics have contributed to the development of a large body of data concerned with measuring governance [Malik 2002]. In this section some key issues are presented concerning data sets, single and aggregated governance indicators. Then, some examples are included of “traditional” assessments of governance provided by the private sector. The sectin concludes with some evaluations of e-governance. 1. Characteristics of a “good” source data set The validity of statistical analysis is dependent upon the quality of the underlying data. The following paragraphs are designed to better understand the idealized data collection methodology, and identify numerous biases that should be avoided [UNDP Eurostat]. First of all, the institutions collecting the data play a crucial role in guarantying quality. Indeed, integrity, trust, independence, and an unbiased approach are requisite features. Data can be divided into two types: objective and subjective. On the one hand, objective data can be collected through standards, codes, treaties, and various administrative documents [UNDP Eurostat]. Objective indicators are based on quantifiable inputs or outputs, such as percentage of government sector of the gross economic product, number of military coups per decade, etc. Objective data is desirable because it is reproducible, and more difficult to dismiss than “mere opinion”. A major drawback of objective data is that it is often of poor quality or not always available, especially in the case of some developing countries. A cautionary example is the case of corruption measures, where objective data would measure the number of corruption cases tried each year. In this context, many corruption cases may indicate an aggressive judicial branch demonstrating competence in curtailing corruption. However, “the lack of
13
relevant objective data has forced many organizations that measure governance to rely on subjective data”.
On the other hand, subjective data rely on perceptions of people. Such data are consequently gathered through more complex processes than objective ones, like polls or surveys of residents, national or international experts. These gathering methods can be participatory, such as discussion groups or interviews, or conducted through mail or the internet. Concept, country coverage, time coverage, sampled population, nature and order of questions are key issues concerning the reliability of the data sets. Comparability of subjective data is a major concern as some concepts relating to governance may not be accurately translated due to local cultures and traditions. Despite possibly ambiguous perceptions of citizens or experts, subjective data provides information when objective data may not be relevant or available. For instance, limited objective data is available to measure corruption or property right enforcement systems [Kaufmann, Kraay, Zoido-Lobaton 1999a]. Nevertheless, both types of data contain some margin of error. For objective indicators, the risk arises when they are inappropriately used as proxies for broad concepts of governance. In fact, in “Governance Matters III”, Kaufmann finds that when comparing a single objective indicator to the aggregated subjective one which best corresponds to it, the authors surprisingly find that the implied standard deviation of measurement of error in the objective indicator is much higher than the standard deviation of the subjective one [Kaufmann, Kraay, Mastruzzi 2003]. These results provide another compelling reason for adopting subjective indicators in governance studies. Finally, Kaufmann et al. show that firms’ perceptions of starting a business depend on de jure regulations (objective data), but also on the environment in which these rules are applied (informal mechanisms, subjective data, that is always missed by objective data) [Kaufmann, Kraay, Mastruzzi 2005]. Therefore, it is crucial to rely on a wide range of measures to assess governance. Ideological biases may be introduced by the ideology of institutions collecting data. For instance, the Heritage Foundation, whose rating indicators are used by Kaufmann et al. [Kaufmann, Kraay, Mastruzzi 2005] to compute governance aggregated indicators, is a research institute “whose mission is to formulate and promote conservative public policies based on the principles of free enterprise, limited government, individual freedom, traditional American values, and a strong national defense” [Heritage]. The ideological biases which affect the quality and reliability of data, and as a consequence the rankings, can be detected by analyses of correlation between several studies of governance indicators. The risk of dealing with biased data decreases when all the major sources are strongly and positively correlated. Other methods can be implemented to discover ideological bias. For instance, Kaufmann et al. [Kaufmann, Kraay, Mastruzzi 2003] regress the difference between the percentile rank of a country on several polls and its rank on the World’s Bank Business Environment Survey, on a numeric variable indicating the ideology of the country’s government. They find that the Heritage Foundation’s data are impacted on by a consistent bias. Nevertheless, Kaufmann et al. show that this ideological bias may be rather small in their study, as only a small amount of differences in the sources result from the assessment of the ideology of the country’s
14
government. In “Governance Matters IV”, Kaufmann et al. discuss the “halo effect”, a spurious upward bias in perceptions of governance in developed countries because they are rich. This effect is modeled as a correlation between the error term and country income. Ultimately, the authors dismiss the halo effect as not significant as it would need to be implausibly large to have an impact [Kaufmann, Kraay, Mastruzzi 2005]. The discussion above motivates defining characteristics of idealized data sets. For many years, quality has meant accuracy, but it is more and more seen as “fitness for use” [OECD 2005]. As a consequence, the Organization for Economic Cooperation and Development (OECD) has added some other meaningful attributes to the concept, such as relevance, credibility, timeless, interpretability, coherence and accessibility [OECD 2005]. Despite some variations, there is a general consensus on these properties, as they are agreed on by several international organizations, such as the OECD, Eurostat, or the International Monetary Fund. Every data set should be assessed by a questionnaire dealing with the seven following dimensions [OECD 2005].
A data set is [OECD 2005]:
- relevant when it satisfies the demand and the needs of users. - accurate when it adequately measures the concepts or characteristics that it is designed for. - credible when users can trust it, thanks to the integrity of collecting processes, independent from any pressure, particularly political. Data collected by standard and replicable procedures are more objective than surveys or expert assessments. The institutions in charge of collecting the data play a crucial role in guarantying their quality, as integrity, trust, and non biased approach are the necessary qualities such organizations should have. - timely and punctual when its availability and frequency are compatible with a valuable assessment of the facts or events it is supposed to estimate. - interpretable when it is easily and correctly used and understood by users, thanks to precise definitions, variables and limitations. - coherent when it is “logically connected and mutually consistent within a dataset, across datasets, over time and across countries” [OECD 2005]. - accessible and clear when its source is well located and its access easy.
Then, cost-efficiency is considered by the OECD as a complementary aspect of “good” quality which can have an impact on the other dimensions of the quality of a data set [OECD 2005]. 2. Single governance indicators Designed to quantitatively or qualitatively measure specific aspects of governance, a single governance indicator can evaluate the commitments made by countries, such as national constitutions or ratified treaties, or the processes by which public governance is implemented. A single indicator can also evaluate the inputs used in these processes (expenditures in labour, goods and services, or capital investment [Manning, Kraan, Malinska 2006]), as well as the outputs produced by the public or private sectors.
15
Nonetheless, inputs might only reveal public budget allocation, and not a real and effective delivery of public services [Rotberg 2004-05]. The OECD calls for studying additional variables such as “antecedents [and] constraints [because they] contextualize government efficiency and effectiveness” by influencing the production of public outcomes [Manning, Kraan 2006]. Nevertheless, Manning, Kraan and Malinska point out “attribution problems” in outcome measurement due to a large number of private and public actors contributing to the production of public services [Manning, Kraan, Malinska 2006]. Then, single indicators can assess the performance of the actors involved in governance practices, particularly government effectiveness or the public sector efficiency, by comparing public inputs and outputs [UNDP Eurostat].
The current indicators are subject to imperfection, since the observation and the evaluation of institutional processes are particularly difficult [World Bank 2006] [Manning, Kraan, Malinska 2006]. Single indicators (or individual indicators), so called to be easily distinguished from the aggregated indicators which are studied in the following paragraph, can only cover a particular aspect of governance. For instance, the characteristics of electoral systems, corruption, human rights enforcement, public service delivery, civil society, or gender equality can be analyzed by a single indicator. Therefore, a wide and balanced range of single indicators is necessary to provide an adequate diagnosis of public governance [UNDP Eurostat]. A list of key governance indicators is provided in the Annex of the present report. To illustrate the definition of a single indicator, two notable indexes of how governments rule business are provided. First, the World Bank’s Investment Climate Survey surveys more than 30,000 businesses across 50 nations. This index measures a firm’s performance, and its economic environment, such as physical infrastructure, the structure of factor and product markets, interactions within different businesses, industrial regulation, law and order, or tax and customs administration. Second, the World Bank’s Doing Business Survey provides single indicators on ten particular areas of business regulation: starting a business, dealing with licenses, employing workers, registering property, getting credit, protecting investors, paying taxes, trading across borders, enforcing contracts and closing a business. Although some other important areas to business are not covered, these indicators are available across 175 countries, and they are computed consistently from one year to the other in order to facilitate comparison over time. The survey is designed for small or medium-size firms, and was answered to by more than 5,000 local experts in 2006. The last report, “Doing Business 2007: How to reform” [World Bank 2007], found that Georgia was the best reforming country. Despite the fact that Africa is the slowest continent to implement reforms, many individual African countries have already demonstrated better performance. Furthermore, China and Eastern Europe show speedy reform. Finally, Singapore is found to be the “most business-friendly economy” [World Bank 2007].
16
3. Aggregated governance indicators There exists a large body of single indicators and practitioners seek to combine the information from numerous sources into aggregate or composite governance indicators. OECD experts define a composite indicator as a compilation of “individual indicators into a single index on the basis of an underlying model” [Manning, Kraan, Malinska 2006]. Aggregate indicators offer three advantages. First, they span a larger set of countries than any individual source. Second, they provide more precise measures of governance than single indicators. Third, they allow for formal hypothesis tests regarding cross-country differences [Kaufmann, Kraay, Zoido-Lobaton 1999a]. However, by adopting aggregate indicators, the researcher sacrifices the richness and scope of the original individual indicators. In addition, developing composite governance indicators might be risky. According to OECD economists, an aggregated index may combine different and uncommon aspects of public governance, and hence be useless for the design and implementation of reforms and “suggest a spurious degree of precision in inter-country ranking” [Manning, Kraan, Malinska 2006]. The main problem in aggregating single indicators is the absence of an acknowledged “theoretical framework” [Manning, Kraan, Malinska 2006]. a. World Bank Research Institute’s aggregated governance indicators Kaufman, Kraay, and Zoido-Lobaton have attempted to mitigate these challenges by aggregating a database of hundreds of cross-country governance indicators into six fundamental indicators [Kaufmann, Kraay, Zoido-Lobaton 1999a]. An extension of the classical unobserved components model was used to aggregate governance indicators. This methodology is discussed in detail in the Methods section of this paper. Kaufman, Kraay, and Zoido-Lobaton identify six fundamental dimensions of governance as:
1) voice and accountability: political process, civil liberties and political rights, independence of media 2) political instability and violence: perceptions that the government will be destabilized or overthrown by unconstitutional or violent means 3) government effectiveness: quality of public service provision, of bureaucracy, competence of civil servants, independence of civil service from politicians 4) regulatory burden: incidence of market-unfriendly policies 5) rule of law: incidence of violent or non-violent crime, effectiveness and predictability of the judiciary, enforceability of contracts 6) graft: corruption (exercise of public power for private gains)
Even if Kaufmann’s indicators “refer to a concept of governance that does not emerge from, or imply, a theory of governance” as stated by Arndt and Oman [Arndt, Oman 2006], one should notice that Kaufmann et al. negatively rate the public policies which decrease the freedom of the markets. The Regulatory Quality aggregate indicator is indeed designed to measure “the incidence of market-unfriendly policies such as price
17
controls or inadequate bank supervision, as well as perceptions of the burdens imposed by excessive regulation in areas such as foreign trade and business development” [Kaufmann, Kraay, Zoido-Lobaton 1999a]. This approach is not neutral on an economic plan and might lead to a “pro-business” bias.
A limitation of the aggregate data is that they do not permit precise estimates of governance. The confidence intervals of the computed governance scores are relatively large compared to the units of measurement, and especially large in the event that the country is considered by few sources. The by-product of these large confidence intervals is that although cross-country hypothesis is possible very few differences are statistically significant [Kaufmann, Kraay, Zoido-Lobaton 1999a]. Caution must be taken when classifying countries into groups according to governance indicators. Most of the countries have their 90% confidence interval including the median score, and a large range of countries have a non-trivial probability to belong to the top or bottom sample [Kaufmann, Kraay, Mastruzzi 2003].
Nevertheless, it is theoretically possible to sort countries into three broad categories: those with governance problems (the associated 90% interval under the bottom third of point estimates), those without governance problems (the associated 90% interval above the top third of point estimates), and a neutral group in between where a large number of countries cannot be clearly discriminated.
In “Governance Matters II: Updated indicators for 2000/01”, analysis of variance of changes over time shows that three-quarters of changes are due to changes in underlying scores as opposed to changes in sources being used or weights assigned to underlying sources [Kaufmann, Kraay, Zoido-Lobaton 2002]. This result supports the claims that aggregate indicators measure governance and are not distorted by statistical issues. In “Governance Matters III: governance indicators for 1996-2002”, Kaufmann et al. study global trends by considering four underlying sources [Kaufmann, Kraay, Mastruzzi 2003]. Their aggregate indicators cannot be used for this purpose because of the rescaling of their mean to zero. They consider a t-statistic test and a hypothesis test where the null is that the world average score is the same in both periods. Rule of law, political stability, control of corruption and government effectiveness show a small decline. But there is no definitive evidence of a global improvement of governance as there are increases and decreases over time among these sources. Then, in “Governance Matters IV: governance indicators for 1996-2004”, Kaufmann et al. introduce a dynamic version of the unobserved components model and formally demonstrate that their aggregate indicators are more informative on trends in governance than any individual sub-indicators [Kaufmann, Kraay, Mastruzzi 2005].
b. OECD’s governance indicators The Organisation for Economic Co-operation and Development (OECD) looks at governance from a broad perspective, based on the principle that efficient delivery of services is just one aspect of governments’ tasks. Government is also responsible to a substantial degree for efficiency in the public sector as public policies play an essential role in shaping competitiveness and growth through its share of government employment,
18
through tax policy, through spending on areas such as education, research and development or infrastructure, and through economic regulation. OECD recognizes that analysis of public management reforms has been hampered by the lack of good-quality comparative information. In the absence of good data, assessments of progress made and opportunities for learning from other countries’ experiences remain limited. In consequence, public management reforms have been driven significantly by assumptions concerning “best practices” rarely defined precisely. Although there is a significant growth in broad measures of “governance”, most of these data are based on subjective assessments and have little relevance for public management. There are few terms and definitions applied consistently, further undermining public administration debate.
Against this background, GOV launched a project under the working title “Management in Government: Comparative Country Data” in November 2005.[OECD, 2005]. The project plans a series of annual working papers, building towards the first publication of “Government at a Glance” in late 2009. This planned biennial publication will provide a set of key indicators of good government and efficient public services to help member countries to better assess, plan and measure their public sector reform agenda. It will help governments and other analysts in two main ways:
• For individual countries, it will enable robust benchmarking using common units of analysis, facilitating a structured practitioner dialogue.
• Longer term, it will contribute to the OECD-wide lesson learning process concerning:
o Sector efficiency and institutional effectiveness, providing insights into the results of service provision via different institutional and managerial arrangements.
o Observed relationships (what kind of changes in public sector processes are associated with changes in public sector results).
o Absorptive capacity (the impact on productivity of softer budget constraints following significant increases in sector expenditures).
This project will:
• Provide a “suite” of separate datasets across OECD countries (“Government at a Glance”)
• Provide the best information to hand, enabling governments to compare their systems with others
• Ensure that existing surveys are focused and better co-ordinated
The project will not:
• Provide any overall, single score measure
19
• Rank or evaluate countries on the basis of overall government performance
• Increase the burden of surveys on member governments
Project Scope
Broadly, “Government at a Glance” will comprise measures of both the market and non-market activities of government and government-owned enterprises. This is known as the public sector and includes what the System of National Accounts recognises as general government and the government owned part of the (quasi-) corporate sector. However, and somewhat experimentally, it also pays attention to other activities which are undertaken outside of core governmental structures and that are only partly funded through taxation or other public sector revenues (including a new classification of “private sector in the public domain”). The significance of this domain is its size and the potentially significant contingent fiscal liability that it represents for government.
Coverage
The project will encompass six categories of variables: revenues; inputs; public sector processes; outputs; outcomes; and antecedents or constraints that contextualise government efficiency and effectiveness. The project’s approach is incremental, starting from existing data and statistics and gathering new data when and if necessary and at minimal cost. By publishing regularly all available data with a cautious phased approach, the OECD will create a high profile locus, which brings together all relevant comparative data of appropriate quality. This development would also highlight gaps in available data, encouraging governments, professional bodies, research institutes and other academic institutions to undertake further data
c. Transparency International’s aggregated governance indicators Since 1995, Dr. Lambsdorff has created a Corruption Perceptions Index (CPI) on behalf of Transparency International [Lambsdorff 2005]. The 2005 CPI is a poll-of-polls index that uses 16 sources, many of which are also used as underlying data in the Kaufmann aggregate governance indicators. This index only considers corruption, but the methodology and conclusions are interesting to the general discussion of measuring “good” governance. The term “extent of corruption” is defined by the frequency of corruption and the total value of bribes paid. The 2005 CPI shows that perceived corruption affects public governance in more than 100 countries out of the 156 surveyed [Transparency International 2005]. In 70 of them, such as Chad, Bangladesh, Turkmenistan, Myanmar and Haiti, this problem is so severe that both economic development and the reduction of poverty by 2015 are threatened. Perceived corruption is also “rampant” in Costa Rica, Gabon, Nepal, Papua New Guinea, Russia, Seychelles, Sri Lanka, Suriname, Trinidad & Tobago and Uruguay [Transparency International 2005]. However, countries like Estonia, France, Hong Kong, Japan, Jordan, Kazakhstan, Nigeria, Qatar, Taiwan Province of China, or Turkey are distinguished for its decline. For
20
ten years, perceived corruption has been successfully controlled in some lower-income nations such as Bulgaria, Colombia or Estonia, whereas it has increased in some high-income countries (Canada or Ireland). This second phenomenon may partly result from more corrupting activities by their domestic firms outside their own borders. Thus, Transparency International claims that wealthy countries should “ensure that their companies are not involved in corrupt practices abroad” [Transparency International 2005]. According to data from Transparency International, the number of successful prosecutions for foreign bribery and corruption has been low since 1997, when the OECD’s convention on bribery was signed by 36 countries. The US has been the most active jurisdiction, bringing 35 cases since 1998 and 17 serious investigations. France has had three foreign bribery cases and although Germany has brought only one case, it has conducted 12 serious investigations. The UK has brought no prosecutions for bribing foreign officials overseas (since the convention came into force in UK law in 2002) and there have been only four serious investigations. To assess this non-domestic bribery of wealthy nations’ companies, Transparency International created the Bribe Payers Index (BPI), a large survey of business executives in almost 130 countries. As revealed by the Financial Times, the next 2006 BPI would find that Brazilian, Chinese, Indian and Russian corporations are “most prone to paying bribes both at home and abroad” in order to sign contracts [The Financial Times 2006c]. This corrupted corporate governance would stem from accommodating public governance, since some public authorities, from China or Malaysia for instance, defend their domestic firms claiming that the illicit payments they make abroad are local practices, and that forbidding them “would interfere in national sovereignty” [The Financial Times 2006c]. Despite being a worldwide acknowledged tool to assess corruption, critics claim that the CPI has seven major shortcomings [Galtung, Sampford 2005]. First, Galtung argues that CPI exclusively focuses on bribe takers, and excludes bribe makers and enablers. Second, approximately 50 countries are not covered by this index. Third, the CPI is biased because it imposes western concepts of corruption, and its business oriented sampling excludes women and the poor. Fourth, the validity of the sources is questionable. Fifth, the concept of corruption is poorly defined. Sixth, the CPI fails in assessing trends of corruption. Seventh, this index is characterized by an abuse of correlation as causation. Year-to-year comparisons should be made with respect to score instead of ranking, where rank is dependent on the number of countries in the survey and this may change for year to year. The data should not be used as a time series because changes in score may be due to change in performance, sample, or methodology.
Despite Galtung’s criticisms, the CPI still has an important role to play in the assessment of world-wide corruption and should not be dismissed. d. Global Integrity’s index
21
The Global Integrity Index, compiled by Global Integrity, an international nonprofit organization that tracks governance and corruption trends around the world, assesses the existence and effectiveness of anti-corruption mechanisms that promote public integrity. More than 290 discrete Integrity Indicators generate the Integrity Index and are organized into six key categories and twenty three sub-categories. Prepared by a lead researcher in the country and then blindly reviewed by additional in-country and external experts, the Integrity Indicators not only assess the existence of laws, regulations, and institutions designed to curb corruption but also their implementation, as well as the access that average citizens have to those mechanisms. The interesting thing about this governance monitoring tool is that the data are based on empirical on-the-ground research and that the indicators measure the existence, implementation, and citizen access to governance/anti-corruption mechanisms and not merely the perceived levels of corruption, which Transparency International does. The Global Integrity methodology is a major breakthrough in assessing the anti-corruption safeguards, laws, and institutions designed to curb abuses of power in countries around the globe. It serves as an important tool for grassroots advocates, reform-minded governments, multilateral aid agencies, local journalists, aid officials and foreign investors alike.
e. Other aggregated governance indicators First, the European Central Bank (ECB) has constructed Public Sector Efficiency (PSE) and Performance (PSP) composite indicators assessing new European Union member states and emerging markets [Afonso, Schuknecht, Tanzi 2006]. A detailed discussion of the methodology is included in the Methods section.
The study concluded that the most efficient countries displayed relatively small public sectors and public expenditure was limited to approximately 30% of Gross Domestic Product. Furthermore, the most efficient countries boasted PSE scores that were more than two times the poorest performers’ PSE scores. The results are startling when considering the fact that the study only considers emerging markets, and this suggests that the performance ratios would be much more extreme if the set of countries studied was expanded. Second, the World Bank’s Country Policy and Institutional Assessment (CPIA) is a measure made by World Bank experts of the quality of policies and institutions related to economic growth and poverty reduction. Twenty equally weighted criteria are grouped into four clusters, such as economic management, structural policies, policies for social inclusion and equity, and public sector management and institutions. This assessment is rather subjective as the World Bank experts may ignore some details or have ideological biases. Nevertheless, CPIA is used to allocate the resources donated by the International Development Association. The World Economic Forum, through its flagship publication, The Global Competitiveness Report, has led the way in assessing the competitiveness of nations
22
{WEF 2005-2006}. Its Growth Competitiveness Index (GCI), which assesses 117 economies, is composed of three pillars all of which are widely accepted as being critical to economic growth: the quality of the macroeconomic environment, the state of a country’s public institutions, and, given the increasing importance of technology in the development process, a country’s technological readiness. Using a combination of publicly available hard data, and information provided in the Forum’s Executive Opinion Survey – which provides more textured qualitative information on difficult-to-measure concepts – these three pillars are brought together in the three indexes of the GCI: the macroeconomic environment index, the public institutions index, and the technology index. The Institute for Management Development (IMD) based in Lausanne, produces the World Competitiveness Yearbook (WCY), which is an annual report on the competitiveness of nations, ranking and analyzing how a nation’s environment creates and sustains the competitiveness of enterprises.{ IMD, 2005}. The WCY provides extensive coverage of 60 countries and regional economies, all key players in world markets. Over 300 competitiveness criteria have been selected as a result of extensive research using economic literature, international, national and regional sources and feedback from the business community, government agencies and academics. The criteria are revised and updated on a regular basis as new theory, research and data become available and as the global economy evolves. The methodology of the WGC divides the national environment in four main Competitiveness Factors: Economic Performance, Government Efficiency, Business Efficiency and Infrastructure. Each of these four factors has been broken down into five sub-factors, each highlighting different facets of competitiveness. Altogether, the WGC features 20 such sub-factors. The WGC is an invaluable dynamic and constantly updated benchmark for decision-makers. The business community uses it as an essential tool in determining investment plans and assessing locations of new operations. Government agencies find important indicators to benchmark their policies against those of other countries and to evaluate performance over time. The academic world also uses the wealth of data in the WGC to better understand and analyse how nations (and not only enterprises) compete in world markets. Every year the IMD conducts an Executive Survey in order to complement the statistics that it uses from international, national and regional sources. Whereas the hard data shows how competitiveness is measured over a specific period of time, the Survey data measures competitiveness as it is perceived. The survey is an in-depth 113-point questionnaire sent to executives in top-and middle management in all of the economies covered by the WGC. According to IMD”s 2005 data, the US is still the world’s most competitive economy but others are closing the gap, aided by better government performance and efficiency. Hong Kong and Singapore are catching up with the US because their governments are more in synchronization with economic performance. The annual Global Entrepreneurship Monitor (GEM) is the largest annual measure of start-up activity [London Business School and Babson College, 2004]. The sixth annual report covers 34 countries and a total labour force of 784 million people. The GEM report combines research from 150 academics. The level of entrepreneurial activity reflects differences in countries’ national income, increasing or decreasing depending on their per
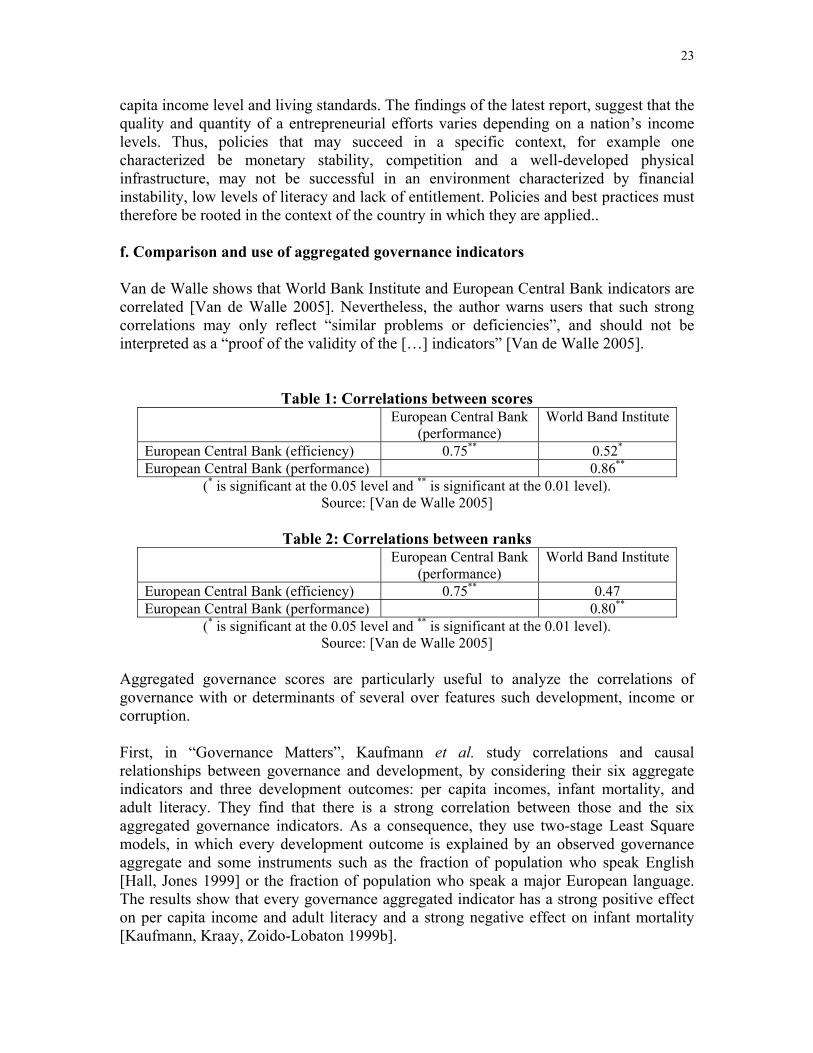
23
capita income level and living standards. The findings of the latest report, suggest that the quality and quantity of a entrepreneurial efforts varies depending on a nation’s income levels. Thus, policies that may succeed in a specific context, for example one characterized be monetary stability, competition and a well-developed physical infrastructure, may not be successful in an environment characterized by financial instability, low levels of literacy and lack of entitlement. Policies and best practices must therefore be rooted in the context of the country in which they are applied.. f. Comparison and use of aggregated governance indicators Van de Walle shows that World Bank Institute and European Central Bank indicators are correlated [Van de Walle 2005]. Nevertheless, the author warns users that such strong correlations may only reflect “similar problems or deficiencies”, and should not be interpreted as a “proof of the validity of the […] indicators” [Van de Walle 2005].
Table 1: Correlations between scores European Central Bank
(performance) World Band Institute
European Central Bank (efficiency) 0.75** 0.52* European Central Bank (performance) 0.86**
(* is significant at the 0.05 level and ** is significant at the 0.01 level). Source: [Van de Walle 2005]
Table 2: Correlations between ranks
European Central Bank (performance)
World Band Institute
European Central Bank (efficiency) 0.75** 0.47 European Central Bank (performance) 0.80**
(* is significant at the 0.05 level and ** is significant at the 0.01 level). Source: [Van de Walle 2005]
Aggregated governance scores are particularly useful to analyze the correlations of governance with or determinants of several over features such development, income or corruption. First, in “Governance Matters”, Kaufmann et al. study correlations and causal relationships between governance and development, by considering their six aggregate indicators and three development outcomes: per capita incomes, infant mortality, and adult literacy. They find that there is a strong correlation between those and the six aggregated governance indicators. As a consequence, they use two-stage Least Square models, in which every development outcome is explained by an observed governance aggregate and some instruments such as the fraction of population who speak English [Hall, Jones 1999] or the fraction of population who speak a major European language. The results show that every governance aggregated indicator has a strong positive effect on per capita income and adult literacy and a strong negative effect on infant mortality [Kaufmann, Kraay, Zoido-Lobaton 1999b].
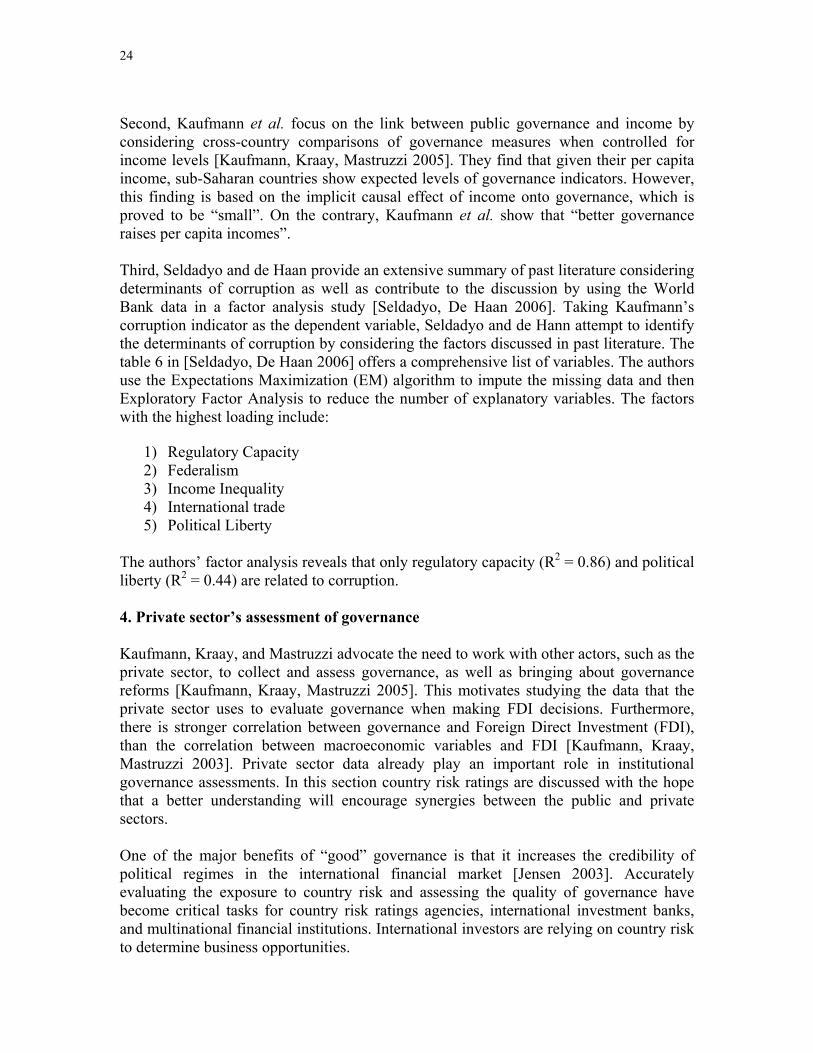
24
Second, Kaufmann et al. focus on the link between public governance and income by considering cross-country comparisons of governance measures when controlled for income levels [Kaufmann, Kraay, Mastruzzi 2005]. They find that given their per capita income, sub-Saharan countries show expected levels of governance indicators. However, this finding is based on the implicit causal effect of income onto governance, which is proved to be “small”. On the contrary, Kaufmann et al. show that “better governance raises per capita incomes”. Third, Seldadyo and de Haan provide an extensive summary of past literature considering determinants of corruption as well as contribute to the discussion by using the World Bank data in a factor analysis study [Seldadyo, De Haan 2006]. Taking Kaufmann’s corruption indicator as the dependent variable, Seldadyo and de Hann attempt to identify the determinants of corruption by considering the factors discussed in past literature. The table 6 in [Seldadyo, De Haan 2006] offers a comprehensive list of variables. The authors use the Expectations Maximization (EM) algorithm to impute the missing data and then Exploratory Factor Analysis to reduce the number of explanatory variables. The factors with the highest loading include:
1) Regulatory Capacity 2) Federalism 3) Income Inequality 4) International trade 5) Political Liberty
The authors’ factor analysis reveals that only regulatory capacity (R2 = 0.86) and political liberty (R2 = 0.44) are related to corruption. 4. Private sector’s assessment of governance Kaufmann, Kraay, and Mastruzzi advocate the need to work with other actors, such as the private sector, to collect and assess governance, as well as bringing about governance reforms [Kaufmann, Kraay, Mastruzzi 2005]. This motivates studying the data that the private sector uses to evaluate governance when making FDI decisions. Furthermore, there is stronger correlation between governance and Foreign Direct Investment (FDI), than the correlation between macroeconomic variables and FDI [Kaufmann, Kraay, Mastruzzi 2003]. Private sector data already play an important role in institutional governance assessments. In this section country risk ratings are discussed with the hope that a better understanding will encourage synergies between the public and private sectors. One of the major benefits of “good” governance is that it increases the credibility of political regimes in the international financial market [Jensen 2003]. Accurately evaluating the exposure to country risk and assessing the quality of governance have become critical tasks for country risk ratings agencies, international investment banks, and multinational financial institutions. International investors are relying on country risk to determine business opportunities.
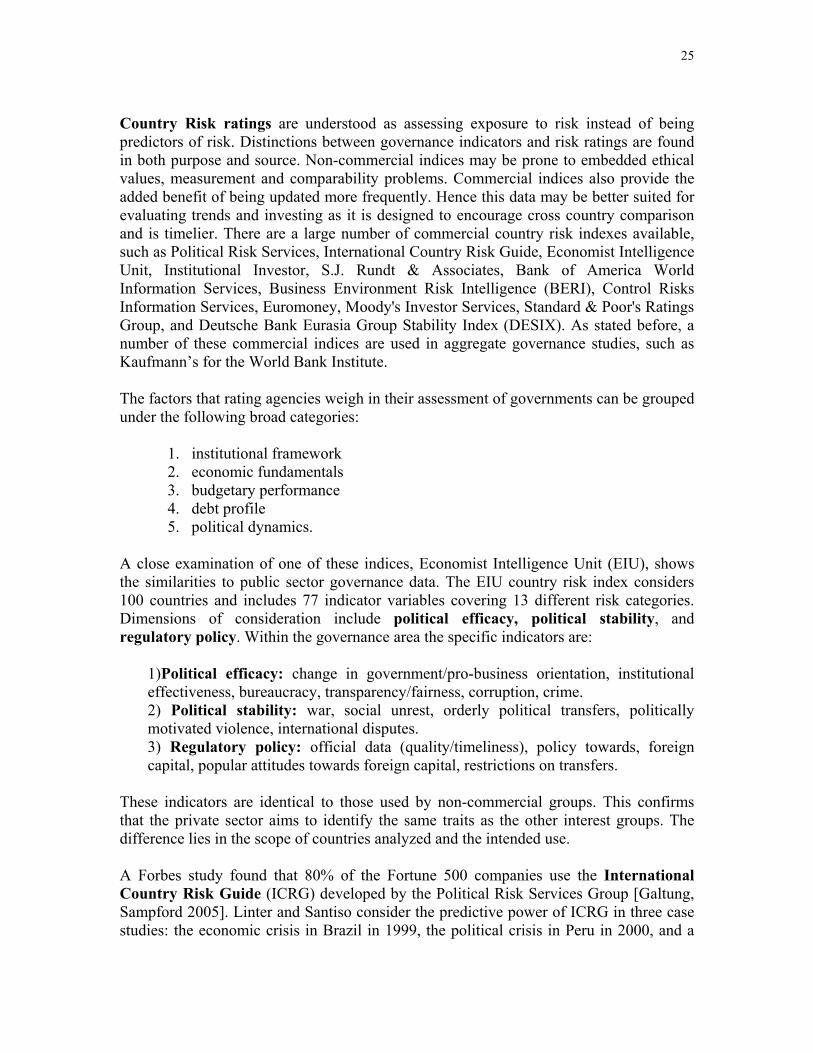
25
Country Risk ratings are understood as assessing exposure to risk instead of being predictors of risk. Distinctions between governance indicators and risk ratings are found in both purpose and source. Non-commercial indices may be prone to embedded ethical values, measurement and comparability problems. Commercial indices also provide the added benefit of being updated more frequently. Hence this data may be better suited for evaluating trends and investing as it is designed to encourage cross country comparison and is timelier. There are a large number of commercial country risk indexes available, such as Political Risk Services, International Country Risk Guide, Economist Intelligence Unit, Institutional Investor, S.J. Rundt & Associates, Bank of America World Information Services, Business Environment Risk Intelligence (BERI), Control Risks Information Services, Euromoney, Moody's Investor Services, Standard & Poor's Ratings Group, and Deutsche Bank Eurasia Group Stability Index (DESIX). As stated before, a number of these commercial indices are used in aggregate governance studies, such as Kaufmann’s for the World Bank Institute.
The factors that rating agencies weigh in their assessment of governments can be grouped under the following broad categories:
1. institutional framework 2. economic fundamentals 3. budgetary performance 4. debt profile 5. political dynamics.
A close examination of one of these indices, Economist Intelligence Unit (EIU), shows the similarities to public sector governance data. The EIU country risk index considers 100 countries and includes 77 indicator variables covering 13 different risk categories. Dimensions of consideration include political efficacy, political stability, and regulatory policy. Within the governance area the specific indicators are:
1)Political efficacy: change in government/pro-business orientation, institutional effectiveness, bureaucracy, transparency/fairness, corruption, crime. 2) Political stability: war, social unrest, orderly political transfers, politically motivated violence, international disputes. 3) Regulatory policy: official data (quality/timeliness), policy towards, foreign capital, popular attitudes towards foreign capital, restrictions on transfers.
These indicators are identical to those used by non-commercial groups. This confirms that the private sector aims to identify the same traits as the other interest groups. The difference lies in the scope of countries analyzed and the intended use. A Forbes study found that 80% of the Fortune 500 companies use the International Country Risk Guide (ICRG) developed by the Political Risk Services Group [Galtung, Sampford 2005]. Linter and Santiso consider the predictive power of ICRG in three case studies: the economic crisis in Brazil in 1999, the political crisis in Peru in 2000, and a
26
combination of crises in Argentina in 2001 and 2002 [Linder, Santiso 2002]. The ICRG weights country risk as 50% political risk, 25% economic risk, and 25% financial risk. The study found that the ICRG predicted the Brazilian crises, failed to predict the Peruvian crisis, and showed mixed results for the Argentine crises. The results of this study confirm the limitations of political risk ratings as predictive measures. Governance indicators are not collected with the requisite frequency, nor are they necessarily designed to capture crises. A major disadvantage of country risks rating is that these indices are not comprehensive and hence many least developed nations are not included in the analysis [Galtung 2005]. Data collection is determined by market needs with respect to investment decisions, reinforcing the view that the four interest groups have different needs and perspectives in assessing governance. This fact alone necessitates that non-commercial agencies conduct governance studies. More importantly, country risks ratings are not substitutes for governance studies because they only focus on the business climate. The commercial data sets also suffer from an inherent sampling bias that excludes women and the poor [Galtung, Sampford 2005]. 5. E-governance, from governmental website evaluation to e-governmental practices assessment E-Governance represents the use of ICTs by a government to better disseminate information to citizens, coordinate the strategic planning process, and facilitate the attainment of development goals. In practice, a government can develop an informative website which also provides e-services designed to citizens and firms, making the Internet emerge as a new crossroads between policy-makers and actors of the civil society and the private sector. Two kinds of e-governance studies should be distinguished. The first focuses on website assessment, and the second enlarges the analysis and evaluates the modifications in the practice of governance which stem from ICTs. First, some studies attempt to evaluate government websites, as they may display the best image of the means a government uses to modify and improve its relationships with citizens. The Digital Governance study, conducted by Holzer and Kim [Holzer, Kim 2005], builds an E-governance Performance Index to assess one hundred major city websites using five components: 1) security and privacy of the Internet user, 2) website’s usability, 3) informational content, 4) services, and 5) citizen participation. Seoul, New York, Shanghai, Hong Kong and Sydney were deemed to have the most effective websites. Oceania is the highest ranked continent, and is followed by Europe, Asia, and North America. Africa and South America are the lowest ranked continents. Cities in OECD member countries performed better than cities in non OECD member countries. Scores improved between 2003 and 2005, particularly in privacy and security.
27
However, the authors warn that score changes may be due to differences in the methodology over time.
The Global E-government study, conducted by Darrell West in 2005 at Brown University, USA, is more comprehensive and robust than the E-governance Performance Index one, as it analyses almost 1800 government web sites in 200 countries (executive, legislative, judicial, and cabinet offices, plus major agencies) [West 2005]. Similar to Digital Governance, the study conducted by West is based upon information availability, service delivery and public access. For each criterion the author sums points for each country and calculates a national e-government Index on a 0-100 scale. The cross-country results are rather consistent with the Digital Governance Study, as the nations which have best e-governance layouts are Taiwan Province of China, Singapore, the United States, Hong-Kong, China, Canada, Germany and Australia. However, West finds that North America performs better than Asia, Western Europe and Oceania. While the amount of information available online is increasing between 2004 and 2005, the percentage of web sites offering services remains constant. Privacy and security are still underdeveloped, but disability access is the least developed. West proposes that governments use advertisements to finance their websites, a feature that is rarely used in practice. The afore-mentioned studies provide insights on the interface governments build to relate to their constituents. Nonetheless, interface alone fails to convey a comprehensive understanding of the practices of e-governance. This method is incapable of capturing actual constituent use or the impact this interface has on the user’s relationship with governing bodies. Additional studies have been designed to answer these particular issues.
In 2003, the United Nations Department of Economic and Social Affairs (UNDESA) issued an annual E-government Readiness Report [UNPAN]. E-government readiness assessment is based upon three surveys, which gather information from central government, ministries, and on the needs and expectations of the civil society and the private sector. The 2004 version of the E-government Readiness Report is aimed at measuring the access to opportunity, by establishing the synergies between new technologies, an educated population, and a knowledge based economy. Two main indexes reveal the role of ICTs in reducing poverty, and improving transparency and efficiency of the public sector. The first index is the e-government Readiness Index, which is computed to measure a country’s willingness and capacity to use e-government for ICT-led development, particularly by studying government-to-citizen and citizen-to-government interactions. Governments should demonstrate a willingness to provide information and knowledge for the empowerment of citizens, and deploy the capacity of public sector ICT tools (financial, infrastructural, human capital, regulatory, administrative, and systemic capacity of the State) to improve citizen access. This index is an average of a Web
28
Measure Index, which evaluates a government’s presence on the web, a Telecommunication Infrastructure Index, and a Human Capital Index. The second index is the e-Participation Index, which assesses quality, usefulness and relevance of e-government programs, by focusing on information, consultation for participatory process, and the increased citizen input in decision-making. National, regional and international results can be consulted on the new United Nations E-government Readiness Knowledge Base (www.unkb.org).
UNDESA has transformed these indices into METER, a new ready-to-use tool for governments to assess and monitor their national enabling environment, which is critical to their e-government development programme. Available on the UN Public Administration Network (www.unpan.org), this tool helps a country improve e-governance, by analyzing the existing e-governance environment, and then identifying and prioritizing the principal activities for improvement.
Accenture provides a noteworthy private sector study about the practices of e-governance. This global management and technology services company issued an e-governance study in 2004 [Rohleder, Jupp 2004]. To determine how citizens think about and use e-government services, Accenture’s analysts based their analysis on a poll of 5000 people in 12 countries, performed via telephone. Internet users were defined as individuals who use the Internet at least once a week in each country. Accenture acknowledges that the survey was not conducted on a truly representative sample of the population. Accenture uses its Public Sector Value Model to explain how governments could take advantage of e-governance, deliver more valued services, and improve their delivering performance. Public value is analyzed through outcomes, a set of social achievements, and cost effectiveness. Although this model provides data for year-to-year and cross-country comparisons, it was not designed to evaluate government performance. Finally, Rohleder and Jupp provide several examples of remarkably innovative e-service delivery around the world, such as tax collecting via the Internet (Australia, France, Spain), highly competitive postal services (Sweden, United-States, Germany), or human services and job searches (Australia, Canada, United States). IV. Methods This section describes the methods used to compose the most popular aggregate indicators. The methods are classified as Unobserved Components Model, and parametric and non-parametric aggregate indicators. IT also highlights an original linear ordering method. In addition, this section contains a short discussion of two well known methodologies commonly applied to governance data. Factor analysis is a useful technique for data reduction and classification. Panel data analysis is a proven technique
29
for pooling information and better identifying country specific effects. These latter two methods are used in auxiliary studies that study particular elements of governance. 1. The Unobserved Component Model The World Bank Institute’s Governance Indicators [Kaufmann, Kraay, Zoido-Lobaton 1999] are constructed using an extension of the standard Unobserved Component Model originally presented by Goldberg [Goldberg 1972]. One can view the entire set of governance data as a composition of a handful of clusters. Let k indicate the cluster and j indicate the country. Then the relationship can be described with the following linear function:
(1) ( )),()().()(),( kjjgkkkjy εβα ++= where α(k) and β(k) are unknown parameters that need to be estimated from the observed data y(j,k). It is assumed that g(j) is a random variable with mean zero and variance one for identifying the parameters α(k) and β(k). Likewise the error term ε(j,k) is assumed to have zero mean and variance that is similar across countries, but not indicators. Hence [ ] )(),( 22 kkjE εσε = . Finally, errors are assumed to be independent across sources: [ ] 10)1,().,( ≠∀= kjkjE εε .
Note the responses are categorical and this introduces a number of methodology issues. Nevertheless, the data are made compatible by orienting them so that larger values correspond to favorable outcomes, and finally they are rescaled by maximum and minimum possible values so that the scores are contained between 0 and 1.
Upon closer examination, the authors discovered two issues:
1) some indicators fail to use the entire range of possible scores, and hence this may introduce a distortion to the rescaled value.
2) a given indicator may be “easy”/”tough” relative to other indicators. This would impact the α(k) value.
This model is implemented as followed. First step is to estimate the unknown parameters: α(k), β(k), and )(2 kεσ for every indicator k. Assume the normality of g(j) and ε(j,k) to write down the likelihood function of the observed data. The second step is to maximize this function to obtain estimates of the unknown parameters. Then report the measure of governance g(j) for each country j as the conditional distribution of g(j) given the observed data y(j,k), k=1,…,K(j) for country j. So we have
∑∑=
=
−
−
+
⋅=
)(
1)(
1
2
2
)(1
),(~)()](|)([
jK
kjK
k
k
kjykjyjgE
ε
ε
σ
σ and
1)(
1
2)(1)](|)([−
=
−
+= ∑
jK
kkjyjgV εσ .
This framework has a Bayesian interpretation as the distribution of g(j) conditional on the observed data y(j) can be viewed as a posterior distribution. The intuition behind this
30
estimate is straight forward. Assume that α(k), β(k), and )(2 kεσ are known, then rescale
the observation such that ),()()(
)(),(),(~ kjjgk
kkjykjy εβ
α+=
−= .
Then the conditional mean is a weighted average of these standardized scores, with weights corresponding to the inverse of the variance of the error term on each indicator. The variance is a decreasing function with respect to the number of indicators available for that country, and is an increasing function with respect to the variance of the error term of each of these indicators. 2. Parametric aggregated governance indicators In its worldwide study of public sector performance, the Social and Cultural Planning Office in the Netherlands measures stabilization and growth, distribution of welfare, allocation of public services, and quality of public administration via aggregated indicators [Social and Cultural Planning Office 2004]. First, single characteristics are added together, regardless of the scale or confidence of the original sub-indicators, without introducing arbitrary weights in the absence of information. Second, a z-transformation corrects the variations on scales and variability
by normalizing the observations according to the formula: ( )
smx
z ii
−= where iz is the
transformed score for country i, ix is its observed value, m is the country mean, and s is the standard deviation of the cross-country observations. Each national score lies between -2 and 2 with a 95% probability [ ]( )95.022 =<<−Ρ iz . To obtain 95% of the scores between 2 and 8, the scores are linearly transformed as follows: ii zz 5.15* ±= such that ( ) 95.082 * =<<Ρ iz . The aggregated score for a country i is calculated as the equally
weighted average of all its scores *iz . Despite arbitrary choices of indicators, weights, and
categorization, this system of ranking is rather robust.
Such a parametric methodology was also employed by economists at the European Central Bank (ECB) to compute public sector performance and efficiency [Afonso, Schuknecht, Tanzi 2006]. The study shifts the focus to program outcomes, instead of resource inputs. First, Public Sector Performance (PSP) is defined as the outcome of public policies, ∑
=
=1
,j
jii PSPPSP , where i represents the country and J the number of
different dimensions of government performance. Second, Public Sector Efficiency (PSE) is defined as the average of public outcomes, weighted by the national public
resources employed, ∑=
==1j ij
ij
i
ii PEX
PSPPEXPSP
PSE , where ijPEX corresponds to country i’s
expenditure in the jth dimension of governance performance. The ECB study includes seven sub-indicators of public service outcome. Four are “process” sub-indicators (administrative, education, health and public infrastructure) that evaluate the impact of fiscal policies on individual opportunities. Three are “traditional” sub-indicators
31
measuring the interactions between the market and government. These “traditional” sub-indicators include income distribution, economic stability, and efficiency in allocation measured by economic performance. Holzer and Kim claim that the E-governance Performance Index they compute in their Digital governance study is one of the most comprehensive attempts to measure e-governance [Holzer, Kim 2005]. They select one hundred cities around the world according to population, and total the number and percentage of Internet users. After identifying five components of e-governance, they evaluate about twenty dichotomous variables on a four-point scale. Then, they sum all of these indices with equal weights, and obtain an overall score on a scale from 0 to 100. When reading Holzer’s and Kim’s study, one can wonder whether the usage of the word “country” in the interpretation of the results is appropriate. Regardless of location and influence, a city may not be representative of an entire country’s e-governance performance. To conclude, OECD experts focus on several deficiencies affecting such parametric aggregating procedures [Manning, Kraan, Malinska 2006]. First, weightings may be arbitrary. Second, some dimensions of public governance may be overestimated as sets of sub-indicators are not necessary mutually exclusive. Third, scores cannot be studied over time due to changes in the set of underlying sub-indicators. 3. Non-parametric aggregated governance indicators To analyze public sector efficiency, some economists at the European Central Bank (ECB) compute composite indicators by using the Data Envelopment Analysis (DEA), which assumes the existence of a convex production frontier calculated using a linear programming method [Afonso, Schuknecht, Tanzi 2006]. The DEA is an extreme point method which evaluates the efficiency of a number of producers, also called decision making unit (DMU), relative to the best producers [Anderson]. If A is a DMU capable of producing Y(A) units of outputs with X(A) units of inputs, and B is a DMU capable of producing Y(B) units of outputs with X(B) units of inputs, then, other producers would be efficient if they produced as much as A or B. But A can be combined with B into a virtual producer with composite inputs and outputs. The best virtual producer (Y,X) for each real analyzed producer (X0,Y0) minimizes the difference between the country output and the efficiency frontier ( )Θ equal to the best combination of producers. The conditions require that the best virtual producer provides at least as many outputs as the studied DMU (virtual output), and with the fewest possible inputs (virtual input). In the following linear program, λ represents the percentages of the other real producers used to construct the virtual one:
32
≥Θ≥−Θ
≥Θ
0,0..
...
0
0
λλ
λ
freeXX
YYtsMin
The ECB authors test the difference between the computed theoretical frontier ( )iXf and realized output iY . Specifically, for each country i: ( )ii XfY = , where iY is a composite indicator approximating the public output measure, iX is the public spending, and ( )iXf the best virtual corresponding production. A country i is inefficient if ( )ii XfY < .
The DEA method is limited in that it can only determine the relative efficiency of a producer compared to others. In addition, no statistical test is available to assess the validity of the results. Finally, the separate linear program necessary for each analyzed producer leads to intensive computation [Anderson]. 4. An original linear ordering method The Corruption Perception Index (CPI), created by Dr. Lambsdorff on behalf of Transparency International, is computed through several steps [Lambsdorff 2005]. As the individual indicators are measured on different scales, the first step is to standardize the data newly included into the index via a matching percentile method. While already present sources are considered using the previous year’s CPI value, the best score of the previous year’s CPI is matched to the best ranked country by the new sub-indicator, and then the method works sequentially for every country both present in the new sub-indicator and the previous year’s CPI data set. As a consequence, every score lies between 0 and 10. Second, a beta transformation,
dXXXXXf11
1
0 101
1010*10)(
−−
−
= ∫
βα
, is applied to the standardized scores in order
to keep them into a 0-10 interval and avoid the natural process of scores converging to the middle of the scale. The parameters α and β are computed through a particular algorithm. Afterwards, the equally weighted average of all the sub-indicators is reported as the CPI value for every country of the data set. Finally, confidence intervals are calculated by bootstrapping, a non-parametric method which consists in estimating first the unknown distribution of the data on a large number of samples derived from the original one by random replacements. In a second step, the statistics of the estimated distribution enable to compute confidence intervals [DiCiccio, Efron 1996]. 5. Factor Analysis
Factor analysis is useful in governance studies as it allows users to identify indicators with the greatest impact on desired outcomes, e.g. economic development, corruption,
33
transparency, trust in government, etc. As the previous sections have shown, there is an impressive, if not overwhelming, amount of indicators measuring different facets of governance. Factor analysis emerges as a useful methodology for decision makers at it enables them to isolate the most relevant indicators. Factor Analysis is a well established statistical method frequently used in the social sciences. It allows users to reduce the number of variables, classify variables into common groups, and identify primary independent components. This process effectively identifies the latent variables, called factors in this context. Linearity is an underlying assumption in factor analysis and the observed variables are viewed as linear combinations of the unobserved factors, plus an error term. The factor loadings are the correlation coefficients between the variables and factors.
Data reduction is accomplished by pooling highly correlated items that are redundant and manifest the same latent variable. Factor analysis boils down to explaining the maximal amount of variation using the most parsimonious set of components. It is an iterative process where the first factor explains the most variation, and then the second factor maximizes the remaining variability, and so on. By this construction factors are independent of each other. The reader is referred to Multivariate Analysis by Mardia, Kent, and Bibby for a detailed exposition of this method [Mardia 1979]. Factor analysis is used in the Public Sector Performance report by the Social and Cultural Planning Office several times [Social and Cultural Planning Office 2004]. It reveals that the amount of expenditures financing public services, the public or private aspect of these resources, and the delivery characteristics of public services are the three key components of public services. Furthermore, this study distinguishes and classifies countries according to these components. Finally, factor analysis is used to show that country performance in the public sector is correlated with educational performance, economic growth, and quality of public administration. Seldadyo and de Haan use Kaufmann’s corruption indicator as the response variable in a factor analysis that identifies the primary determinants of corruption [Seldadyo, De Haan 2006]. The study singles out regulatory capacity and political liberty as being strongly correlated with corruption. This application demonstrates the benefits of aggregate governance indicators, in that they not only provide measures of progress, but also serve as tools in isolating paths for development. Indeed, identifying the major source of a problem enables decision makers to better combat that issue. 6. Panel data analysis Panel data analysis, also referred to as longitudinal analysis, is a well established econometrics method commonly used in development economics. Panel data consists of a sample of subjects observed over a series of time points, hence providing multiple observations on each subject in the sample. It provides information about individual patterns of change, and enables the user to separate time and country effects.
34
This methodology boasts two major advantages over cross-sectional or single country time series analysis. First, it increases the number of data points in the analysis, thereby increasing the efficiency of statistical estimates. Second, it provides the researcher with greater flexibility in analyzing dynamics of change. Specifically, panel data analysis allows for distinction between within-subject and between-subject covariates and time-varying covariates. Hence, panel data may provide the exogenous variation that is required for identification of structural parameters through comparisons across periods covering policy changes. The reader is reffered to Analysis of Panel Data by Cheng Hsiao for a detailed exposition of this method [Hsiao 2002].
As stated above, panel data analysis is designed to assess global trends, and hence is an essential tool in governance studies. For instance, Frechette uses panel data analysis to identify the determinants of corruption [Frechette 2004]. It should be noted that a number of data sets do not have many different time points [Kaufmann, Kraay, Mastruzzi 2005], and hence it is difficult to control for the time effect. Nevertheless, as more time points are added to the data set, panel studies improve in precision.
V. Future directions on public governance assessment As exposed in the Data and Analysis section, the numerous limitations to the current data call for more objectiveness and consistency across countries and over time. This part focuses the attention upon the necessity of gathering objective data worldwide to provide consistent global comparisons, and developing complementarily disaggregated indicators to better implement country-specific policies. It finally synthesizes a new promising way of assessing public governance, the United Nations bottom-up approach. 1. Building an international objective data set on public governance Despite a large amount of quantitative studies of governance, the existing data are limited, as previously discussed through part III, because most of them are based on subjective perceptions. The Organization for Economic Cooperation and Development (OECD) Governance Directorate is now dealing with the “Management in Government: Comparative Country Data” project, which aims at complementing available international databases and developing comparable and robust data and indicators of “good” government and efficient public services [OECD 2005].
The OECD project is normally designed to study the impact of public sector processes on public outputs. It will also help better understand how public services are produced by “different institutional and management arrangements”, how government activities are linked to the economy and society, and how the efficiency of public services can be increased by assessing government quality and performance [Manning, Kraan 2006]. This more reliable data will facilitate robust cross-country comparisons. Annual Working Papers “Towards Better Measurement of Government” will be issued in 2006, 2007 and 2008, and the first publication “Government at a glance” will be published in 2009.
The first 2006 paper will publish the available data on the public sector, highlight current inadequacies and deficiencies and provide a framework. It would mainly deal with inputs
35
and processes, such as costs, human resources, and institutions (budget processes, nature of civil service, structure of government, intergovernmental relations, transparency, etc.). To expand data coverage, Manning, Kraan and Malinska suggest relying on the credibility of the OECD Governance Directorate, and then facilitating multiple data collection from member and non-member countries. “Derived indicators” on the availability and the willingness of a country to participate in this process would be useful to support such an effort [Manning, Kraan, Malinska 2006]. 2. Reforms in local governance demand disaggregated indicators As presented in the third part of this report, existing national-level governance indicators enable comparison of governance level and performance, and may be useful for national policy makers. However, the UN Development Program claims that these indices are not operational [UNDP 2005]. Not only may they be unable to “capture such a complex concept as governance” [UNDP 2005], but they may also fail to provide a basis for policy-action. Indeed, the actions that are necessary to improve governance practices and reduce poverty cannot be revealed by global rankings. In addition, international cross-country comparisons are of limited use for developing countries, which need more national and sub-national policy-orientated and capacity-building indices. Therefore, two different kinds of indicators should be developed. First, core indicators should reflect universal aspects of governance, and be relevant everywhere at both national and local levels to make global comparisons across countries. For instance, they should evaluate parliamentary development, electoral systems and processes, justice and human rights, e-governance and access to information, decentralization, or public administration reform and anti-corruption. Second, some satellite indicators should complement the core ones, by measuring several aspects of governance which are specific to a country. These indices should be disaggregated according to location and population [UNDP 2005]. First, the disaggregating according to location could lead to assessing public governance in sub-states within a federal union, or even to city-based evaluations. For instance, the Government Performance Project (GPP) evaluates how well state governments in the United States of America perform their basic management functions with the goal of helping state governments serve citizens better. The grades are on an academic scale of A+ being the highest and F being the lowest. The data used in this study were collected from existing sources, as well as web-based surveys and expert opinions. Assigned by a team of scholars and journalists, the grades are based on a state government’s performance in the four dimensions of governance, and are independent of other states governments’ scores. The project assesses four dimensions of governance: 1) Money Management, 2) People Management, 3) Infrastructure, and 4) Information.
36
The first GPP was published in 1999 in response to the recognition that state governments are playing an increasingly large role in implementing public policy. Indeed, this project demonstrates the transition from national to sub-national policy implementation. Unfortunately due to methodological changes, current grades are not comparable with previous years. Nevertheless, theses grades establish benchmarks for state government performance and hopefully encourage governance improvements [GPP]. Another promising method of disaggregating governance indicators is performing evaluations at a city-level, as advised by the UN-Habitat [UN-Habitat 2005]. This UN body launched the Global Campaign on Urban Governance in 1999, and has since developed indicators to measure urban governance, or the ways citizens, public and private institutions manage the common affairs of their city. The Urban Governance Index (UGI) has been created to answer to these needs [UN-Habitat 2003]. The UN-Habitat has disaggregated this index into five principles of “good” governance, such as effectiveness (efficiency, subsidiarity, strategic vision), equity (sustainability, gender equality, intergenerational equity), accountability (transparency, rule of law, responsiveness), participation (citizenship, consensus orientation, civic engagement), and security (conflict resolution, human security, environmental safety). In practice, the UGI embraces 16 indicators, which are based on factual data provided by municipalities and local governments, and grouped into the first four sub-indices (the security index was dropped for statistical reasons). This indicator can be useful to test for “correlation between the quality of urban governance and urban poverty reduction, city competitiveness and inclusiveness” [UN-Habitat 2003]. The UGI is planned to be refined through global initiatives, like surveys of 120 cities conducted mid-2005 to obtain a statistically valid global data base, and national efforts, to develop capacity for data collection. These indicators reveal the factors explaining the differences in governance processes and quality across regions, and therefore allow comparisons between cities in a country. They also promote participation, accountability and efficiency by helping “municipalities improve their functioning, engage more closely with the communities, and become more responsive and accountable” [UN-Habitat 2005].
Finally, disaggregating governance indicators on population would enable directing policies towards groups who are generally excluded from governance processes (gender, age, minorities, income, or social characteristics). On the subject of subnationals, one measure of governance which reflects overall credit risk in the municipal sector is the BIS ratio. Since the relationship between national governments and subnationals varies from country to country, the Basle Agreement allows for a discretionary assignment of risk by the Central Bank to municipal loans. Such risk weightings can fluctuate between 0 and 1.0., and are known as BIS ratios. These ratios play an important role in municipal lending, especially in Europe. They reflect the Central Bank’s assessment of municipal credit risk and its guidance to commercial banks regarding lending. Banks are required to add more capital for any
37
given volume of municipal lending (assuming a bank is near its minimum capital adequacy ratio), which in effect raises the cost to banks of making municipal loans, and which in turn tends to drive up both interest rates in the sector and also slow the rate of growth of loans, both effects having macroeconomic implications. This is important because borrowing is often the only practical way to finance large capital outlays, without huge and undesirable variations in local tax rates from year to year. 3. The bottom-up approach, or how public governance could better implement citizen needs The future of governance must echo the sentiments of James Surowiecki in his book The Wisdom of Crowds [Surowiecki 2004]. Large groups of people outperform an elite few at solving problems, fostering innovation, and coming to wise decisions. The United Nations bottom-up study argues that traditional governance principles have been developed top-down, and states the need to verify whether these principles are indeed what citizens value most in public administration [UNDESA 2005].
The bottom up approach is an alternative methodology that first asks what the local population’s most pressing needs are and then begins to assess how well the government delivers these services. This criteria-based approach is unique in the sense that it evolves from citizen needs and that it is flexible to adapt to diverse national contexts and circumstances. This approach also stresses the importance of considering capacity building as an important signal of future performance [UNDESA 2005].
Indeed, the trends of decentralization and engaged governance, foster the evolution towards better reflecting citizen needs. Furthermore, needs are not homogenous over countries, or even within regions of an individual country. It is imperative for governments to recognize the different needs of citizens, and pay special attention to the poor and disadvantaged groups. This process may be actualized via two ways: first, direct measurement of citizen needs, and second, increased citizen participation altering the focus of governance assessors. Due to heterogeneity, assessing citizen needs will be most effective for local studies. This raises the question of defining “citizens’ most pressing needs”, and its relationship to maximizing utility within society. There may be plausible answers to this question for local institutions responsible for a subset of the population. This first option appears inefficient. Nevertheless, researchers are encouraged to further consider this avenue, as properly assessing needs is essential in determining “good” governance.
Increased citizen participation is perhaps the most important feature of future governance. There are a number of programs currently in place that are providing venues for citizens to monitor and influence the activities of public administration institutions [Khan 2005]. Here, the Citizen’s Charters program is highlighted. In 1991, UK Prime Minister John Major introduced Citizen's Charters as an initiative to improve the quality, transparency, and accountability of public services. Subsequently many countries such as Armenia, Belgium, Czech Republic, France, India, Jamaica, and
38
the United States of America, have adopted this program. The fundamental idea behind Citizen’s Charters is the recognition that voting is an inefficient method of influencing public services and instead granting taxpayers consumer rights. This is a yet another example of the public sector adopting well established private sector practices. According to Madsen Pirie of the Adam Smith Institute, public services “have had to consult with members of the public to discover what would be expected of them and what would be thought reasonable. In many cases this has been the first time that it even occurred to the services to find out what their customers thought” [Pirie 1992]. The effective implementation of the Citizen’s Charters program requires “good” governance, and may fail in countries that have not yet reached some threshold level of governance.
VI. Concluding remarks This report has presented a review of the literature assessing public governance. It finds that there is no definitive authority in public governance evaluation, and instead sees considerable contributions from very diverse sources, institutional or private. Users are encouraged to take advantage of these different but complementary perspectives. Efforts to measure governance have run into various kinds of problems related to the specific interests of the clients or constituents of the specific organisations, which attempt to measure governance. For example, Freedom House focuses only on civil liberties and political rights. Transparency International focuses on corrupt issues. The World Bank views governance from an economic perspective. Transparency International’s annual Corruption Perceptions Index (CPI) for example – a composite index -- aggregates the perceptions of well-informed persons with regard to the extent of corruption, defined as the misuse of power for private benefit. The extent of corruption reflects the frequency of corrupt payments, the value of bribes paid and the resulting obstacles imposed on businesses. But attempts to compare the amount of corruption between different countries are fraught with difficulties surrounding the fact that bribery is usually illegal and firms are expected to be reluctant to admit that they pay bribes. Bribes paid by firms range from getting licenses and permits; dealing with taxes and tax collection; procuring of government contracts; dealing with customs/imports; and influencing the content of legislation. The measurement of governance also suffers from the lack of relevant objective data, which has forced many organisations, which attempt to measure governance to rely on subjective data. How do you for instance, measure corruption or people’s confidence that property rights are protected, except by relying on the views of well-informed persons? Using the example of measuring corruption again, one might think that it would be possible to measure corruption indirectly. But relying on the frequency of references to corruption in the media, for example, runs into problems of determining the extent to which the press is free and objective in each particular country. Another indirect measure could be derived from relying on prosecutions or conviction rates in corruption trials. But such a measure would to no small extent reflect the competence and independence of the policing and judicial system, rather than the prevalence of corruption itself.
39
Some recent attempts to measure corruption by looking for patterns in objective data have also been made. One example is the variation in the prices paid for very homogeneous medical inputs such as syringes across hospitals in Buenos Aires, as an indicator in procurement. Another attempt has been to measure the variation in the differences between existing stocks of public infrastructure and past flows of infrastructure spending across Italian regions, interpreting this gap as a measure of procurement corruption. But cross-country measures of corruption based on such objective data are not available. One can also attempt to tally the presence or absence of independent anti-corruption commissions, across the world, but the issue here becomes one of the varying degree of their effectiveness. In the same vein, while measures of decentralisation may be correlated with the incidence of corruption across countries, generally, the explanatory power of this variable is not sufficiently strong that decentralisation could be considered to be a reasonable proxy for corruption. Other objective measures of governance that have been put forth, are variables such as the waiting time required to obtain a telephone line, and the number of telephone faults, which can serve as proxies for public administrative capacity. The reliance of the government on trade taxes can serve as a proxy for the inability of the government to broaden the tax base. The willingness of individuals to hold currency in the banking system has been put forth as a proxy of the extent to which individuals in a country can be confident that their property rights are protected. The number of administrative procedures required to start a business and to collect unpaid debt, have also been put forth as measures that capture the complexity of the regulatory and legal environment. But these concepts measure special aspects of governance. For example, the number of procedures required to start a business measure, may not be a good indicator of the complexity or burden of regulation in other areas. The willingness of individuals to hold deposits in banks may in a similar vein reflect their confidence in a particular set of property rights vis-a-vis the banks and may not necessarily capture other dimensions of property rights protection, such as confidence in the police and judicial system to uphold private property rights. The governance discussion presents a paradox: despite large volumes of data, the quality inference is very limited due to quality and incompatibility issues. In fact, the hope is that these initial measurement efforts will help design a rigorous new data set that is both comprehensive and relevant. Nevertheless, the literature suggests that the discussion is splitting now into local and global, with the local assessment increasing in flexibility and relevance, whereas the global assessment will take necessary steps towards standardization and better trend analysis. This report has identified the changes occurring in governance assessment and suggests that e-governance has emerged as an essential component of the public governance discussion. The current data collection projects offer exciting new opportunities for building an international objective data set on public governance. Finally, the user is reminded that all data is subject to distortions and caution should be exercised when developing policies.
40
PART II: CORE DIMENSIONS OF GOVERNANCE AND ECONOMIC INDICATORS TO MONITOR THE PUBLIC SECTOR I. Efficiency, transparency and participation The preceding review of governance indicators shows that governments have many objectives. Governance indicators serve to inform the different stakeholders, as outlined above, including the public, on the state of public finances and governmental performance; they can assist the public in making informed choices, understand the impact of their collective actions on public finances; and perhaps most importantly enable the public to judge the performance of government and governmental institutions. This process will ultimately lead society to evaluate and possibly redefine the tasks that are to be accomplished by the public sector and its specific institutions, which in turn would enhance democracy. Any effort to monitor governance is limited by resource constraints, as well as the need to be realistic in terms of what data can be systematically collected and compared on a cross-country basis. If it is desirable to collect data on a systematic basis on a cross country level, the following three inter-related dimensions of governance would seem to stand out. 1. Efficiency Efficiency can be measured in a narrow, as well as in a broad sense. A narrow approach to efficiency can translate into specific measures, such as cost per case, as for example, cost per patient, or cost per service type, as for example unit cost per refuse collection. A broader approach to the concept of efficiency, however, looks at the extent to which government is fostering an economically efficient system of production and distribution, and reduces uncertainty. If one had to single out the most important public good that the state can provide from the point of view of business and the population at large, that public good would be predictability in the institutional and policy environment. Unpredictability in government policy or regulations increases the risk factor in the business environment and produces large disincentives for investment. A broader definition of efficiency looks at the allocation of public spending and the institutions of government and its capacity to manage the economy and to implement its policies in a stable and predictable manner. A broader definition adheres to the adage that it is more important to do the right thing than to do things right. It is thus more important to achieve the outcomes that businesses and people want, i.e. a stable environment, rather than becoming optimally efficient in delivery. Efficiency improvements in a narrow sense may be achieved either by increasing outputs while employing the same inputs, or by maintaining the same output while employing reduced inputs. But adopting a broader definition emphasizes the importance of achieving the right outputs, in preference to the goal of using inputs with optimal efficiency. For instance, the ratio of judges to
41
population constitutes a narrow measure of efficiency of government, as it focuses on a specific area, i.e. the redress of claims. Another such example would be the number of civic and criminal cases pending before the courts for more than a year (case backlog). The average time required for the issuance of a business license, could be a very useful indicator of the overall administrative efficiency of government. Excessive government regulation not only increases the level of economic activity of the informal sector, but it also enables regulators to collect bribes from potential entrants, thus linking efficiency with the issue of transparency (corruption). . Looking at the broad spectrum of possible indicators that would fit the profile of being broad enough and would also relate to the predictability of the government policy issue, it is suggested that the one indicator that fits that profile is the volatility in budgetary expenditure shares and the volatility of revenue shares. Budgetary expenditure and revenue volatility, more than any other single indicator, captures the element of providing a predictable policy environment and it is broad enough. A stable policy should be reflected in stable budget allocations. Budgetary volatility tends to be high in countries in which businesses report that government policy-making is arbitrary and unpredictable. 2. Transparency The efficiency of a government can be seriously reduced, if its regulatory policies are not viewed as being legitimate by the eyes of the public at large. Regulations and policies can be accepted as legitimate only if they are fundamentally transparent and based on objective criteria. In order to legitimize their policies, governments must provide transparency about state actions, as well as about the procedures that underpin the carrying out of state actions. Transparency requires that governments not only do not impede the flow of information to the public, but also an active involvement on their part to make the necessary provisions to ensure that public information can have a feedback effect on governmental performance, since it empowers the public to put pressure on government to deliver services and to do so properly. It can thus strengthen the legitimacy of government. In order to instill a stable and predictable policy environment, governments must therefore subject themselves to the scrutiny of the public. That involves subjecting their operations to regular and independent financial audits. Looking at the spectrum of indicators that attempt to evaluate government transparency, one can select, for instance, an indicator of administrative transparency, such as whether procedures for the appointment and removal of judges are undertaken through a transparent and constitutional process. Another indicator on transparency could be the existence of an ombudsman office, which is fully staffed and funded. But such types of indicators do not immediately impact on governmental efficiency, and are unrelated to the indicator proposed for governmental efficiency. It is thus suggested that the indicator on transparency should be whether there are regular and independent financial audits of governmental and parastatal bodies.
42
3. Participation Governmental policies stimulate human development only if they bring the masses into the mainstream of society. That involves participation in decision-making at the regional and local levels. Legitimacy goes hand in hand with participation. The process of fiscal federalism, which has placed the financial and political relationships between the central and lower levels of government in a state of transition, is bringing about the redefinition of taxing and expenditure responsibilities and the adoption of new tax systems without any previous administrative history. Many local governments have been moving from a dependency on central government receipts, to a system under which they directly raise a higher percentage of revenues in their budgets while assuming greater responsibility for developing their own spending programmes. In line with new public management concepts, which have influenced a comprehensive process of change to public sector organisations across the board, the emphasis now is on decentralisation, devolution and modernisation of public sector delivery. Participation has many dimensions. Increased participation can be achieved through legislation enacted to strengthen the freedom and pluralism of the media. It can be achieved through the institution of an independent electoral management body empowered to conduct free and fair elections. It can be achieved through the existence of institutionalised mechanisms for regular consultation between local governments and civil society organisations on economic and social policies and programmes. It can be achieved through the legal aid and legal counsel systems accessed by the poor. It can be achieved through the frequency of local elections and referenda. It can be achieved through the use of e-government tools and community networks. It can be achieved through public input into decision-making on government plans and budgets via ICT tools. But many of these indicators are somewhat specific in focus. In line with the objective of providing a broad indicator, and one that has a common thread with the other two, it is therefore suggested that the indicator for participation should be the proportion of total public revenues allocated and managed at the sub-national level. II. Economic Indicators A more in-depth approach of evaluating governance from an economic perspective would collect and monitor data on the following variables. Central bank independence This can be derived qualitatively from:
The bank’s objectives The formal structure of policy formulation The terms of office of the head of the bank
43
Limitations on lending to the government
The importance of this indicator is underlined by the fact that a stable macro environment and stability in public finances may not be achievable without a strong commitment to price stability by the monetary authority. Guaranteeing the independence from all levels of the government, for a central bank whose principal mission is price stability could establish the credibility of such a commitment. Empirical studies show that the three most independent central banks (the National Bank of Switzerland, Bundesbank of Germany, and the U.S. Federal Reserve Board) over the period 1955 to 1988 had average inflation rates of 4.4 per cent compared to 7.8 per cent for the three least independent banks (New Zealand until 1989, Spain and Italy). [Barro, 1996]. The inflation rate in the former countries further showed lower volatility. The same studies also show that the degree of central bank independence is not related to the average rate of growth and average rate of unemployment. The conclusion drawn is that a “more independent central bank appears to be all gain and no pain”. But this indicator is also very significant because when central banks lack independence, they tend to inflate the money supply. When they inflate the money stock through the credit markets, they distort the prices upon which sound loans are made. As interest rates are driven artificially below the levels determined by the supply of credit from savers, capital values increase and entrepreneurs debt-finance projects they would have avoided in the absence of central bank distortions. In the first stages of this credit expansion, less risky longer-term projects are financed, but inevitably loans are made for riskier short-term projects. This leads the discussion to the next indicator, namely: Bank lending to the private sector as a percentage of GDP. Institutional arrangements on the part of the public sector are often inadequate, especially in many developing countries, and government regulators often have limited foresight; their experience and supervision tend to lag changes in the financial system and markets. They are therefore usually unable to stop such lending booms. The most damaging lending booms tend to fuel asset price inflation, particularly in the real estate sector, and end in massive price deflation in these assets. Thus, the Level and rate of increase of asset prices, is another useful indicator. Since banks are intermediaries between savers and investors, this brings the discussion to the next two indicators, namely: Savings as a percentage of GDP, and Investment as a percentage of GDP.
The savings and investment indicators are important when looked at vis-à-vis each other. If investment spending as a percentage of GDP is higher than the savings rate,
44
the result will be a current account deficit and over-investment, was the case in the Asian countries before the 1997 crisis. This brings the discussion to the next indicator namely: Current account balance as a percent a GDP. The current account balance leads to the accumulation of foreign debt, either through the direct purchase by non-residents of securities such as private and public bonds and equities, or through external borrowing by the banking system that in turn will lend these funds to the private and public sector to finance the excess of investment over savings by the non-financial sectors of the economy. The central government’s fiscal balance as a percentage of GDP, would be another useful indicator. The type of capital – fixed investment versus portfolio investment that comes in to finance the imbalance – is an equally important factor to the quantity of capital that pours into a country. FDI goes into the real economy and creates growth. By contrast, portfolio investments go largely into financial markets and create currency volatility. Because currency values are determined by the interaction of supply and demand, countries that run surpluses and adopt tight monetary policies enjoy long-term currency strength. Those that run deficits financed largely by portfolio inflows enjoy currency weakness. Balance of payments crises seem to be highly correlated with banking crises. As is usually the case, when foreign capital flows into emerging financial systems, its impact is magnified many times. The result is either a consumer boom and a swelling trade deficit or a long period of over-investment that culminates in severe debt and banking crises. Many emerging financial systems have insufficient domestic financial instruments and are incapable of sterilizing the effects of large capital inflows. Institutional arrangements in public sector governance become important at this juncture. The inflow of foreign capital can translate into high money supply growth rates and bank lending growth. M2 to foreign reserves ratio would be a useful indicator in this regard. The following five debt indicators are also of significant value. Debt per capita. This would provide a rough measure of the extent of a government’s indebtedness. It could readily be compared across countries to make broad judgments about debt exposure. And then there are: Short-term debt as a percentage of total debt Short-term debt as a percentage of foreign reserves. This indicator proved to be a significant indicator of financial vulnerability during the Asian crisis. Ratio of debt service to recurring revenues. This would measure the capacity of a government to cover debt service from regular revenue sources. The numerator would be annual interest payments plus annual principal payments on debt, including any proposed new debt that is being evaluated. The denominator would be recurring ordinary revenues minus one-time proceeds from asset sales.

45
Debt service plus short term debt as a percent of foreign reserves. The debt service is the interest on all debt plus the principal to be repaid on long-term debt. This indicator becomes important in the event of a liquidity crisis. If such an event occurs, foreign reserves must be potentially large enough to cover debt service (including the roll-over of short term debt) in order to avoid a crisis. Its crucial importance in public finances was underlined during the Asian crisis.
46
REFERENCES [Afonso, Schuknecht, Tanzi 2006] Afonso A., Schuknecht L., Tanzi V., “Public sector efficiency: evidence for new EU member states and emerging markets”, European Central Bank, Working Paper Series No. 581 (2006) <http://www.ecb.int/pub/pdf/scpwps/ecbwp581.pdf> [Anderson] Anderson T., “A DEA homepage”, Engineering Management Program, Portland State University, Oregon, <http://www.emp.pdx.edu/dea/homedea.html> [ADB] Asian Development Bank, “Governance: Sound Development Management” <http://www.adb.org/Governance/gov_elements.asp> [Arndt, Oman 2006] Arndt C., Oman C., “Uses and abuses of governance indicators”, Organization for Economic Cooperation and Development Centre Studies, ISBN 92-64-02685 (2006) < http://www.oecd.org/document/25/0,2340,en_2649_33731_37081881_1_1_1_1,00.html> [Babson College and London Business School, 2004] Babson College and London Business School, Global Entrepreneurship Monitor, 2004. <http://entrepreneurs.about.com/od/research/a/study2004htm.> [Barro, 1996] Robert J. Barro, Getting it Right: Markets and Choices in a Free Society, Cambridge, Mass: MIT Press, 1996. 57. [Besancon 2003] Besancon M., “Good governance rankings: the art of measurement”, World Peace Foundation Reports, No. 36, Cambridge, Massachusetts (2003) <http://bcsia.ksg.harvard.edu/BCSIA_content/documents/WPF36Governance.pdf> [Cheema 2005] Cheema G.S., Building democratic institutions: governance reform in developing countries (New York, Kumarian Press Inc., 2005): 4-6 [DiCiccio, Efron 1996] DiCiccio T.J., Efron B., “Bootstrap confidence intervals”, Statistical Science vol. 11 No.3 (1996): 189-228 [Eurostat UNDP] Eurostat, United Nations Development Programme Oslo Governance Center, “Governance indicators: a user’s guide” <http://www.undp.org/governance/docs/policy-guide-IndicatorsUserGuide.pdf> [The Financial Times 2006a] Giles C., Guha K., “Blow to Wolfowitz as governments insist in final say over corruption”, International Economy, The Financial Times, Tuesday September 19 2006
47
[The Financial Times 2006b] Donnan S., “Corruption still holds emerging markets back”, International Economy, The Financial Times, Tuesday September 26 2006 [The Financial Times 2006c] Williamson H., “West failing to curb bribery overseas”, International Economy, The Financial Times, Tuesday September 26 2006 [Frechette 2004] Frechette G.R., “A Panel Data Analysis of the Time-Varying Determinants of Corruption”, Working Paper, Department of Economics, New York University, New York (2004) [Galtung, Sampford 2005] Galtung F., Sampford C, “Measuring the Immeasurable: Boundaries and Functions of (Macro) Corruption Indices”, Measuring Corruption, Ashgate UK (2005, forthcoming) [Global Integrity report 2006] Global Integrity Report, http://www.globalintegrity.org [Global Policy Forum] Global Policy Forum, “State sovereignty and globalization”, <http://www.globalpolicy.org/nations/sovereign/econindex.htm> [Goldberg 1972] Goldberg A., “Maximum Likelihood Estimation of Regressions Containing Unobservable Independent Variables”, International Economic Review vol. 13 No. 1 (1972): 1-15 [GPP] Government Performance Project, <http://results.gpponline.org/> [Graham, Amos, Plumptre 2003] Graham J., Amos B., Plumptre T., “Principles for good governance in the 21st century”, Policy brief No. 15, Institute on Governance (2003) <www.iog.ca> [Hall, Jones 1999] Hall R.E., Jones C.I., “Why do some countries produce so much more output per worker than others?”, The Quarterly Journal of Economics vol. 114 No. 1 (1999): 83-116 <http://ideas.repec.org/a/tpr/qjecon/v114y1999i1p83-116.html> [Heritage] The Heritage Foundation, <http://www.heritage.org> [Holzer, Kim 2005] Holzer M., Kim S-T., “Digital governance in municipalities worldwide 2005: a longitudinal assessment of municipal websites throughout the world” (2005) <http://unpan1.un.org/intradoc/groups/public/documents/ASPA/UNPAN022839.pdf> [Hsiao 2002] Hsiao C., Analysis of Panel Data, 2nd ed., Cambridge University Press, Cambridge UK (2002)

48
[India] India’s ICT Policy Gateway, < http://www.ictpolicy.org> [IMD 2005], World Competitiveness Yearbook, <http://www01.imd.ch/wgc/yearbook/> [IMF 2002] International Monetary Fund Staff, “Globalization: Threat or Opportunity?” (2000, corrected 2002) <http://www.imf.org/external/np/exr/ib/2000/041200.htm#I> [Jensen 2003] Jensen N.M., “Democratic Governance and Multinational Corporations: Political Regimes and Inflows of Foreign Direct Investment”, International Organization 57 (2003): 587-616 [Kaufmann, Kraay, Mastruzzi 2003] Kaufmann D., Kraay A., Mastruzzi M., “Governance Matters III: governance indicators for 1996-2002”, The World Bank Institute, Draft for comment (2003) <http://www.worldbank.org/wbi/governance/pubs/govmatters3.html> [Kaufmann, Kraay, Mastruzzi 2005] Kaufmann D., Kraay A., Mastruzzi M., “Governance Matters IV: governance indicators for 1996-2004”, The World Bank Institute, draft, May 2005 <http://www.worldbank.org/wbi/governance/pubs/govmatters4.html> [Kaufmann, Kraay, Zoido-Lobaton 1999a] Kaufmann D., Kraay A., Zoido-Lobaton P., “Aggregating Governance Indicators”, World Bank Policy Research Working Paper No. 2195 (1999a) <http://www.worldbank.org/wbi/governance/wp-governance.html> [Kaufmann, Kraay, Zoido-Lobaton 1999b] Kaufmann D., Kraay A., Zoido-Lobaton P., “Governance matters”, World Bank Policy Research Working Paper No. 2196 (1999b) <http://www.worldbank.org/wbi/governance/pubs/govmatters.html> [Kaufmann, Kraay, Zoido-Lobaton 2002] Kaufmann D., Kraay A., Zoido-Lobaton P., “Governance matters II: updated indicators for 2000/01”, World Bank Policy Research Working Paper No. 2772 (2002) <http://www.worldbank.org/wbi/governance/pdf/govmatters2.pdf> [Khan 2005] Khan M.A., “Engaged Governance: A Strategy for Mainstreaming Citizens in the Public Policy Processes”, United Nations Department of Economic and Social Affairs (2005) [Kyj 2006] Kyj M.J., “Internet use in Ukraine's Orange Revolution”, Business Horizons vol. 49 Issue 1 (January-February 2006): 71-80 [Lambsdorff 2005] Lambsdorff J.G., “The Methodology of the Transparency International 2005 Corruption Perception Index”, Transparency International and University of Passau (2005)
49
[Linder, Santiso 2002] Linder A., Santiso C., “Assessing the Predictive Power of Country Risk Ratings and Governance Indicators”, SIAS Working Paper Series WP/02/02 (2002) [Malik 2002] Malik A., “State of the art in governance indicators”, Occasional paper, Background paper for the Human Development Report 2002, United Nations Development Programme (2002) <http://hdr.undp.org/publications/papers.cfm> [Manning, Kraan 2006] Manning N., Kraan D-J., “The metrics of tracking change in the public sector”, Call for Papers for the Eleventh International Research Symposium on Public Management, Organization for Economic Cooperation and Development [Manning, Kraan, Malinska 2006] Manning N., Kraan D-J., Malinska J., “How and why should government activity be measured in “Government at a glance”?”, Draft, Project on Management in Government, Organization for Economic Cooperation and Development (2006) [Mardia 1979] Mardia K., Kent, J., and Bibby, J., Multivariate Analysis, Academic Press, London, (1979) [Mimicopoulos 2006] Mimicopoulos M.G., Department of Economic and Social Affairs, United Nations, Presentation to the United Nations World Tourism Organization Knowledge Management International Seminar on Global issues in Local Government: Tourism Policy Approaches, Madrid (2006) [Narang 2005] Narang S., “Disaggregating governance indicators: why local governance is important and how it can be measured”, Urban Governance Section, UN-Habitat, Technical workshop on governance indicators, New Delhi (2005) [Nzongola-Ntalaja 2002] Nzongola-Ntalaja G., “UNDP role in promoting good governance”, Seminar for the International Guests at the Congress of the Labour Party of Norway, Oslo (2002) <http://www.undp.org/oslocentre/pub.htm> [Nzongola-Ntalaja 2003] Nzongola-Ntalaja G., “Gouvernance et developpement”, Conférence préparée à l’intention d’un groupe de politiciens haïtiens en visite d’études en Norvège à l’invitation du gouvernement norvégien et de l’Institut d’Etudes Internationales Appliquées, Oslo (2003) <http://www.undp.org/oslocentre/pub.htm> [OECD 2005] Organization for Economic Cooperation and Development, Public Governance Committee, Public Governance and Territorial Development Directorate, “Management in government: feasibility report on the development of comparative data” (2005) <http://appli1.oecd.org/olis/2005doc.nsf/linkto/GOV-PGC(2005)10> [OECD2006]
50
Organisation for Economic Cooperation and Development, Going for Growth (2006) <http://www.oecd.org/document/7/0,2340,en_2649_201185_35995079_1_1_1_1,00.html> [Park 2005] Park H.M., “A Cost-Benefit Analysis of the Seoul OPEN System: Policy Lessons for Electronic Government Projects”, Proceedings of the 38th Hawaii International Conference on System Sciences (2005) [Pirie 1992] Pirie M., “Blueprint for a Revolution”, Adam Smith Institute (1992) [Plumptre] Plumptre T., “What is governance?”, Institute on Governance <http://www.iog.ca/page.asp?pageID=3&htmlarea=home> [Rohleder, Jupp 2004] Rohleder S., Jupp V., “E-government leadership: high performance, maximum value”, The government executive series, Accenture (2004) <http://www.accenture.com/NR/rdonlyres/D7206199-C3D4-4CB4-A7D8-846C94287890/0/gove_egov_value.pdf> [Rondinelli, Cheema 1983] Rondinelli D.A., Cheema G.S., (Eds.) Decentralization and Development. London, Sage (1983) [Rotberg 2004-05] Rotberg R.I., “Strengthening governance: ranking countries would help”, The Washington Quarterly 28:1 (2004-05): 71-81 <http://bcsia.ksg.harvard.edu/person.cfm?order_by=name&program=WPF&ln=full&item_id=242> [Seldadyo, De Haan 2006] Seldadyo H., De Haan J., “The Determinants of Corruption: A Literature Survey and New Evidence”, Working Paper University of Groningen (2006) <http://congress.utu.fi/epcs2006/docs/D1_seldadyo.pdf> [SCPO 2004] Social and Cultural Planning Office, “Public sector performance: an international comparison of education, health care, law and order and public administration”, The Hague (2004) <http://www.scp.nl/english/publications/books/9037701841/Public_sector_performance.pdf> [Surowiecki 2004] Surowiecki J., The Wisdom of Crowds, Random House Inc. (2004) [Transparency International 2005] Transparency International, “Corruption Perceptions Index 2005: Corruption still rampant in 70 countries”, Press Release (2005) <http://www.transparency.org/policy_research/surveys_indices/cpi/2005/media_pack> [UN MDGs] United Nations, “Millennium Development Goals”, <http://www.un.org/millenniumgoals/#>
51
[UNDESA 2005] United Nations Department of Economic and Social Affairs, Committee of Experts on Public Administration, “Bottom-up approaches and methodologies to develop foundations and principles of public administration: the example of criteria-based organizational assessment”, E/C.16/2005/3 (2005) [UNDESA 2004] United Nations Department of Economic and Social Affairs, Division for Public Administration and Development Management, “Global E-government Readiness Report 2004: Towards Access for Opportunity” (2004) <http://www.unpan.org/egovernment4.asp> [UNDESA 2001] United Nations Department of Economic and Social Affairs, “World Public Sector Report: Globalization and the State” (2001) <http://unpan1.un.org/intradoc/groups/public/documents/un/unpan012761.pdf> [UNDP 2000] United Nations Development Programme, “Decentralised Governance: A Global Matrix of Experiences” (2000) [UNDP ICSSR 2005] United Nations Development Programme and Indian Council on Social Science Research, International technical workshop on governance indicators, “Governance indicators for pro-poor and gender-sensitive policy reform”, New Deli (2005) [UNDP BRC 2004] United Nations Development Programme, Bratislava Regional Center, “How to Build Information Societies” (2004) [UNDP 2006] United Nations Development Programme, “Measuring democratic governance: a framework for pro-poor and gender-sensitive policy reform” (2006) <http://www.undp.org/oslocentre/docs06/Framework%20paper%20-%20entire%20paper.pdf> [UNDP 2004] United Nations Development Programme, Strategy Note on Governance for Human Development (2004) [UN-HABITAT 2003] UN-Habitat, Global campaign on urban governance, “Urban Governance Index: a tool to measure progress in achieving good urban governance” (2003) [UNPAN] United Nations Administration Programme, Department of Economic and Social Affairs, UN Global E-Government Readiness Report, <http://www.unpan.org/dpepa-egovernment%20readiness%20report.asp> [Van de Walle 2005] Van de Walle S., “Measuring Bureaucratic Quality in Governance Indicators”, Working Paper Instituut voor de Overheid, Katholieke Universiteit Leuven (2005)
52
[West 2005] West D.M., “Global e-government, 2005”, Center for Public Policy, Brown University, Rhode Island (2005) <http://www.insidepolitics.org/egovt05int.pdf> [World Bank a] The World Bank Institute, “E-government” <www.worldbank.org/egov> [World Bank b] The World Bank Institute, “Governance and anti-corruption” <www.worldbank.org/wbi/governance? [World Bank 2006] World Bank Global Monitoring Report 2006, “Millennium Development Goals: Strengthening Mutual Accountability, Aid, Trade, and Governance” (2006) <http://publications.worldbank.org/ecommerce/catalog/product?item_id=5367015> [World Bank 1007] World Bank Doing Business Report, “Doing Business 2007: how to reform” (2006) <http://www.doingbusiness.org/> World Economic Forum, Global Competitiveness Report 2005-2006, <http://www.weforum.org/en/initiatives/gcp/Global%20Competitiveness%20Report/index.htm>
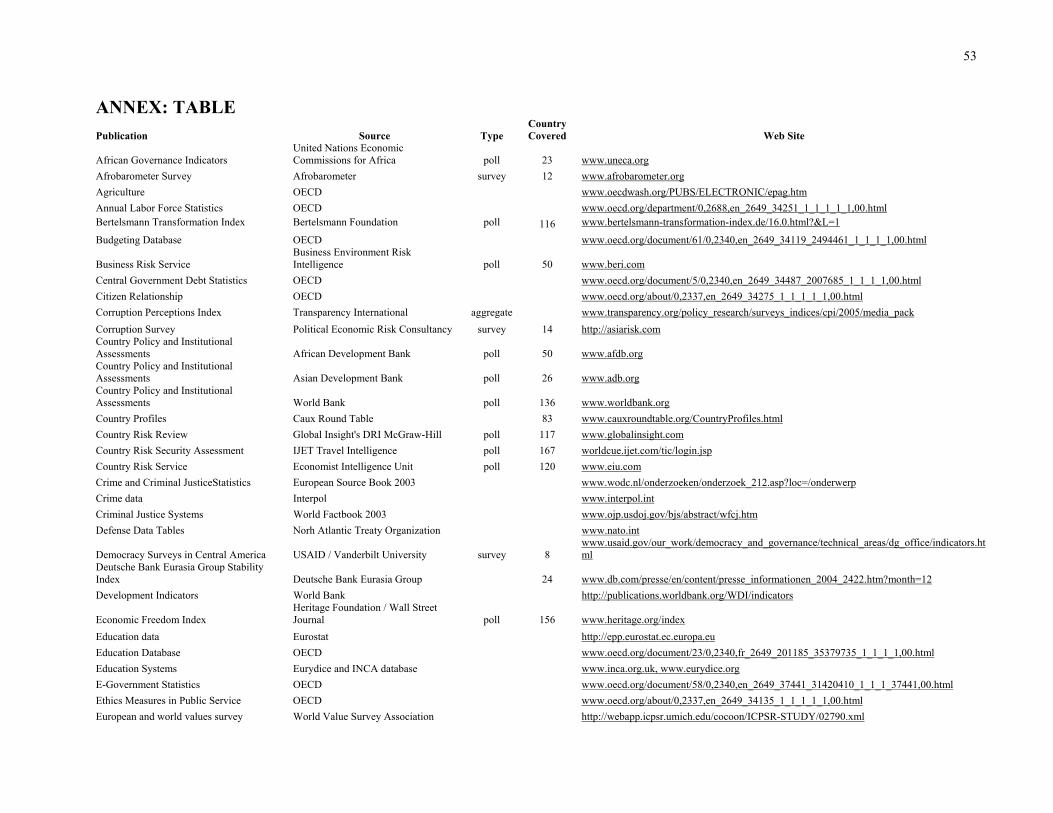
53
ANNEX: TABLE Publication Source Type
Country Covered Web Site
African Governance Indicators United Nations Economic Commissions for Africa poll 23 www.uneca.org
Afrobarometer Survey Afrobarometer survey 12 www.afrobarometer.org Agriculture OECD www.oecdwash.org/PUBS/ELECTRONIC/epag.htm Annual Labor Force Statistics OECD www.oecd.org/department/0,2688,en_2649_34251_1_1_1_1_1,00.html Bertelsmann Transformation Index Bertelsmann Foundation poll 116 www.bertelsmann-transformation-index.de/16.0.html?&L=1
Budgeting Database OECD www.oecd.org/document/61/0,2340,en_2649_34119_2494461_1_1_1_1,00.html
Business Risk Service Business Environment Risk Intelligence poll 50 www.beri.com
Central Government Debt Statistics OECD www.oecd.org/document/5/0,2340,en_2649_34487_2007685_1_1_1_1,00.html Citizen Relationship OECD www.oecd.org/about/0,2337,en_2649_34275_1_1_1_1_1,00.html Corruption Perceptions Index Transparency International aggregate www.transparency.org/policy_research/surveys_indices/cpi/2005/media_pack Corruption Survey Political Economic Risk Consultancy survey 14 http://asiarisk.com Country Policy and Institutional Assessments African Development Bank poll 50 www.afdb.org Country Policy and Institutional Assessments Asian Development Bank poll 26 www.adb.org Country Policy and Institutional Assessments World Bank poll 136 www.worldbank.org Country Profiles Caux Round Table 83 www.cauxroundtable.org/CountryProfiles.html Country Risk Review Global Insight's DRI McGraw-Hill poll 117 www.globalinsight.com Country Risk Security Assessment IJET Travel Intelligence poll 167 worldcue.ijet.com/tic/login.jsp Country Risk Service Economist Intelligence Unit poll 120 www.eiu.com Crime and Criminal JusticeStatistics European Source Book 2003 www.wodc.nl/onderzoeken/onderzoek_212.asp?loc=/onderwerp Crime data Interpol www.interpol.int Criminal Justice Systems World Factbook 2003 www.ojp.usdoj.gov/bjs/abstract/wfcj.htm Defense Data Tables Norh Atlantic Treaty Organization www.nato.int
Democracy Surveys in Central America USAID / Vanderbilt University survey 8 www.usaid.gov/our_work/democracy_and_governance/technical_areas/dg_office/indicators.html
Deutsche Bank Eurasia Group Stability Index Deutsche Bank Eurasia Group 24 www.db.com/presse/en/content/presse_informationen_2004_2422.htm?month=12 Development Indicators World Bank http://publications.worldbank.org/WDI/indicators
Economic Freedom Index Heritage Foundation / Wall Street Journal poll 156 www.heritage.org/index
Education data Eurostat http://epp.eurostat.ec.europa.eu Education Database OECD www.oecd.org/document/23/0,2340,fr_2649_201185_35379735_1_1_1_1,00.html Education Systems Eurydice and INCA database www.inca.org.uk, www.eurydice.org E-Government Statistics OECD www.oecd.org/document/58/0,2340,en_2649_37441_31420410_1_1_1_37441,00.html Ethics Measures in Public Service OECD www.oecd.org/about/0,2337,en_2649_34135_1_1_1_1_1,00.html European and world values survey World Value Survey Association http://webapp.icpsr.umich.edu/cocoon/ICPSR-STUDY/02790.xml
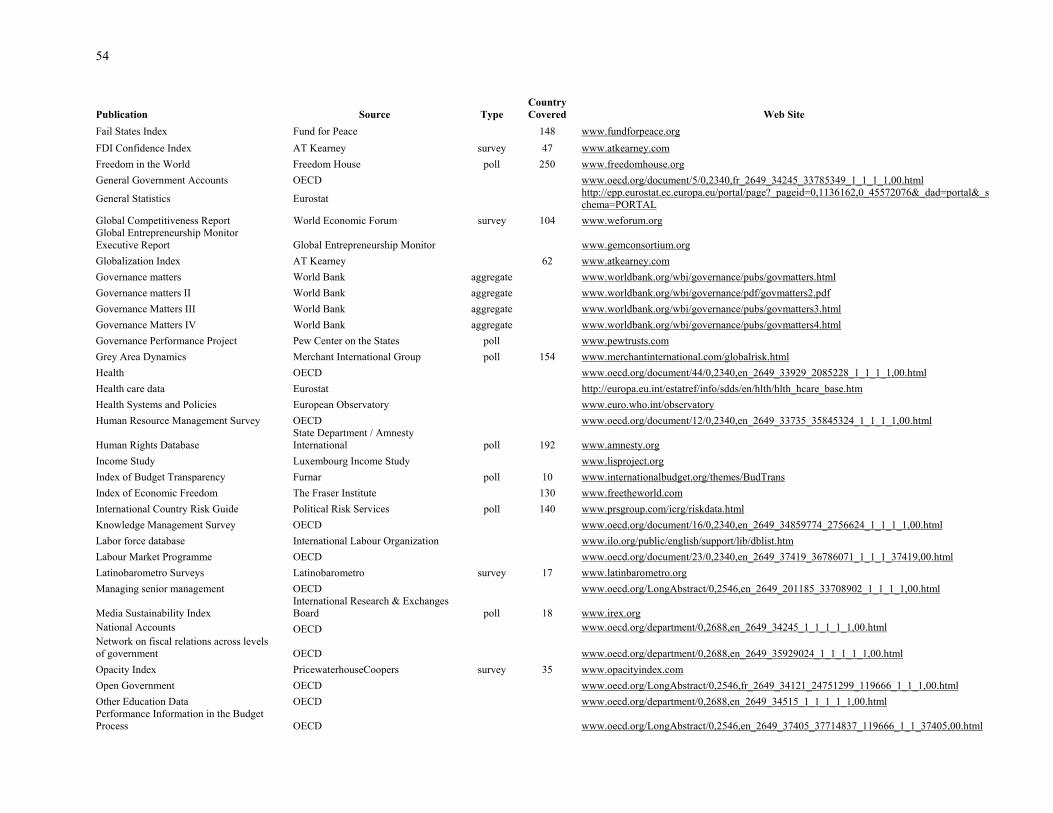
54
Publication Source Type Country Covered Web Site
Fail States Index Fund for Peace 148 www.fundforpeace.org FDI Confidence Index AT Kearney survey 47 www.atkearney.com Freedom in the World Freedom House poll 250 www.freedomhouse.org General Government Accounts OECD www.oecd.org/document/5/0,2340,fr_2649_34245_33785349_1_1_1_1,00.html
General Statistics Eurostat http://epp.eurostat.ec.europa.eu/portal/page?_pageid=0,1136162,0_45572076&_dad=portal&_schema=PORTAL
Global Competitiveness Report World Economic Forum survey 104 www.weforum.org Global Entrepreneurship Monitor Executive Report Global Entrepreneurship Monitor www.gemconsortium.org Globalization Index AT Kearney 62 www.atkearney.com Governance matters World Bank aggregate www.worldbank.org/wbi/governance/pubs/govmatters.html Governance matters II World Bank aggregate www.worldbank.org/wbi/governance/pdf/govmatters2.pdf Governance Matters III World Bank aggregate www.worldbank.org/wbi/governance/pubs/govmatters3.html Governance Matters IV World Bank aggregate www.worldbank.org/wbi/governance/pubs/govmatters4.html Governance Performance Project Pew Center on the States poll www.pewtrusts.com Grey Area Dynamics Merchant International Group poll 154 www.merchantinternational.com/globalrisk.html Health OECD www.oecd.org/document/44/0,2340,en_2649_33929_2085228_1_1_1_1,00.html Health care data Eurostat http://europa.eu.int/estatref/info/sdds/en/hlth/hlth_hcare_base.htm Health Systems and Policies European Observatory www.euro.who.int/observatory Human Resource Management Survey OECD www.oecd.org/document/12/0,2340,en_2649_33735_35845324_1_1_1_1,00.html
Human Rights Database State Department / Amnesty International poll 192 www.amnesty.org
Income Study Luxembourg Income Study www.lisproject.org Index of Budget Transparency Furnar poll 10 www.internationalbudget.org/themes/BudTrans Index of Economic Freedom The Fraser Institute 130 www.freetheworld.com International Country Risk Guide Political Risk Services poll 140 www.prsgroup.com/icrg/riskdata.html Knowledge Management Survey OECD www.oecd.org/document/16/0,2340,en_2649_34859774_2756624_1_1_1_1,00.html Labor force database International Labour Organization www.ilo.org/public/english/support/lib/dblist.htm Labour Market Programme OECD www.oecd.org/document/23/0,2340,en_2649_37419_36786071_1_1_1_37419,00.html Latinobarometro Surveys Latinobarometro survey 17 www.latinbarometro.org Managing senior management OECD www.oecd.org/LongAbstract/0,2546,en_2649_201185_33708902_1_1_1_1,00.html
Media Sustainability Index International Research & Exchanges Board poll 18 www.irex.org
National Accounts OECD www.oecd.org/department/0,2688,en_2649_34245_1_1_1_1_1,00.html Network on fiscal relations across levels of government OECD www.oecd.org/department/0,2688,en_2649_35929024_1_1_1_1_1,00.html Opacity Index PricewaterhouseCoopers survey 35 www.opacityindex.com Open Government OECD www.oecd.org/LongAbstract/0,2546,fr_2649_34121_24751299_119666_1_1_1,00.html Other Education Data OECD www.oecd.org/department/0,2688,en_2649_34515_1_1_1_1_1,00.html Performance Information in the Budget Process OECD www.oecd.org/LongAbstract/0,2546,en_2649_37405_37714837_119666_1_1_37405,00.html
http://epp.eurostat.ec.europa.eu/portal/page?_pageid=0,1136162,0_45572076&_dad=portal&_schema=PORTAL
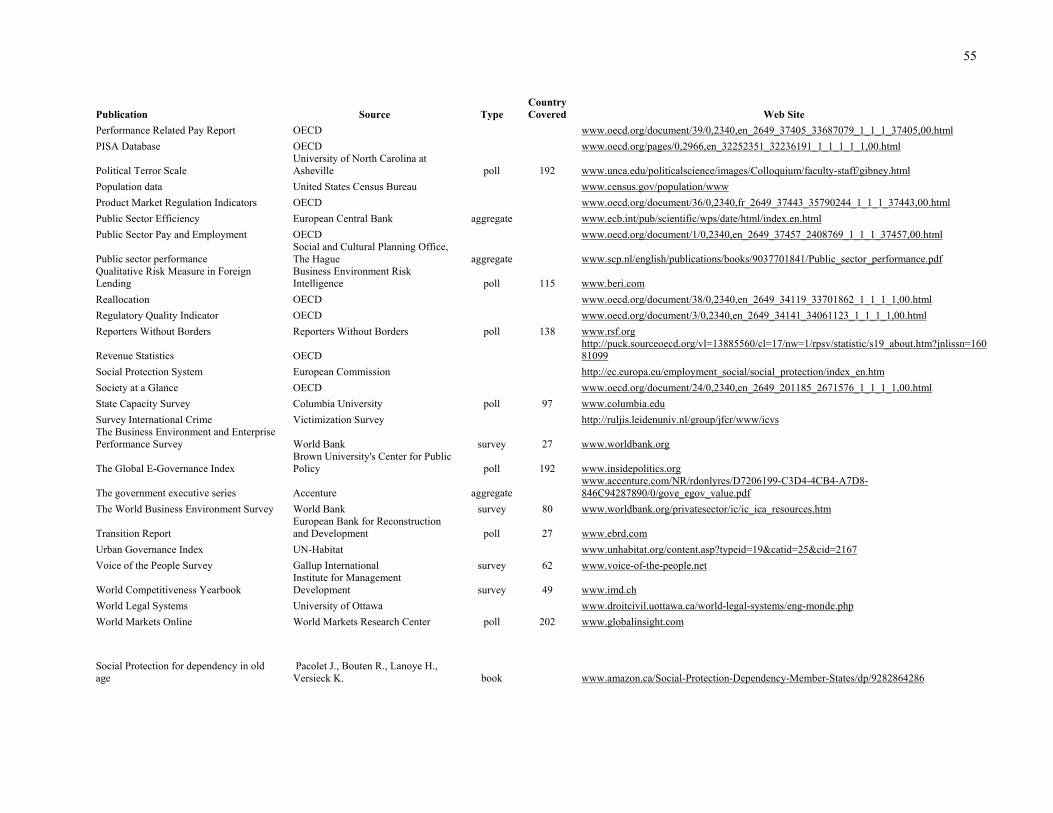
55
Publication Source Type Country Covered Web Site
Performance Related Pay Report OECD www.oecd.org/document/39/0,2340,en_2649_37405_33687079_1_1_1_37405,00.html PISA Database OECD www.oecd.org/pages/0,2966,en_32252351_32236191_1_1_1_1_1,00.html
Political Terror Scale University of North Carolina at Asheville poll 192 www.unca.edu/politicalscience/images/Colloquium/faculty-staff/gibney.html
Population data United States Census Bureau www.census.gov/population/www Product Market Regulation Indicators OECD www.oecd.org/document/36/0,2340,fr_2649_37443_35790244_1_1_1_37443,00.html Public Sector Efficiency European Central Bank aggregate www.ecb.int/pub/scientific/wps/date/html/index.en.html Public Sector Pay and Employment OECD www.oecd.org/document/1/0,2340,en_2649_37457_2408769_1_1_1_37457,00.html
Public sector performance Social and Cultural Planning Office, The Hague aggregate www.scp.nl/english/publications/books/9037701841/Public_sector_performance.pdf
Qualitative Risk Measure in Foreign Lending
Business Environment Risk Intelligence poll 115 www.beri.com
Reallocation OECD www.oecd.org/document/38/0,2340,en_2649_34119_33701862_1_1_1_1,00.html Regulatory Quality Indicator OECD www.oecd.org/document/3/0,2340,en_2649_34141_34061123_1_1_1_1,00.html Reporters Without Borders Reporters Without Borders poll 138 www.rsf.org
Revenue Statistics OECD http://puck.sourceoecd.org/vl=13885560/cl=17/nw=1/rpsv/statistic/s19_about.htm?jnlissn=16081099
Social Protection System European Commission http://ec.europa.eu/employment_social/social_protection/index_en.htm Society at a Glance OECD www.oecd.org/document/24/0,2340,en_2649_201185_2671576_1_1_1_1,00.html State Capacity Survey Columbia University poll 97 www.columbia.edu Survey International Crime Victimization Survey http://ruljis.leidenuniv.nl/group/jfcr/www/icvs The Business Environment and Enterprise Performance Survey World Bank survey 27 www.worldbank.org
The Global E-Governance Index Brown University's Center for Public Policy poll 192 www.insidepolitics.org
The government executive series Accenture aggregate www.accenture.com/NR/rdonlyres/D7206199-C3D4-4CB4-A7D8-846C94287890/0/gove_egov_value.pdf
The World Business Environment Survey World Bank survey 80 www.worldbank.org/privatesector/ic/ic_ica_resources.htm
Transition Report European Bank for Reconstruction and Development poll 27 www.ebrd.com
Urban Governance Index UN-Habitat www.unhabitat.org/content.asp?typeid=19&catid=25&cid=2167 Voice of the People Survey Gallup International survey 62 www.voice-of-the-people.net
World Competitiveness Yearbook Institute for Management Development survey 49 www.imd.ch
World Legal Systems University of Ottawa www.droitcivil.uottawa.ca/world-legal-systems/eng-monde.php World Markets Online World Markets Research Center poll 202 www.globalinsight.com Social Protection for dependency in old age
Pacolet J., Bouten R., Lanoye H., Versieck K. book www.amazon.ca/Social-Protection-Dependency-Member-States/dp/9282864286