Public Functions, Private Markets: Credit Registration … functions... · 3 notaries and aldermen....
34
1 Public Functions, Private Markets: Credit Registration by Aldermen and Notaries in the Low Countries, 1500-1800. 1 This draft, October 2016 Oscar Gelderblom a Mark Hup ab Joost Jonker ac Abstract We explore financial market development in preindustrial Europe by examining the financial functions performed by aldermen and notaries. Using a new dataset of 13,000 credit transactions registered by these public officials in six different cities in the Low Countries between 1500 and 1780, we analyse who used their services, for which purposes, and at what price. We find that notaries and aldermen were very active administrators throughout this period, yet failed to obtain a commanding position as financial intermediaries in the way Parisian notaries did. As they registered only a small fraction of local credit transactions, notaries and aldermen in the Low Countries never possessed the information advantage of their French counterparts. Our findings highlight the degree to which subtle regulatory differences profoundly affected the dynamics of financial market evolution. 1 (a) Utrecht University; (b) UC Irvine; (c) University of Amsterdam
Transcript of Public Functions, Private Markets: Credit Registration … functions... · 3 notaries and aldermen....

1
Public Functions, Private Markets:
Credit Registration by Aldermen and Notaries in the Low
Countries, 1500-1800.1
This draft, October 2016
Oscar Gelderbloma
Mark Hupab
Joost Jonkerac
Abstract
We explore financial market development in preindustrial Europe by examining the financial functions
performed by aldermen and notaries. Using a new dataset of 13,000 credit transactions registered by
these public officials in six different cities in the Low Countries between 1500 and 1780, we analyse who
used their services, for which purposes, and at what price. We find that notaries and aldermen were very
active administrators throughout this period, yet failed to obtain a commanding position as financial
intermediaries in the way Parisian notaries did. As they registered only a small fraction of local credit
transactions, notaries and aldermen in the Low Countries never possessed the information advantage
of their French counterparts. Our findings highlight the degree to which subtle regulatory differences
profoundly affected the dynamics of financial market evolution.
1 (a) Utrecht University; (b) UC Irvine; (c) University of Amsterdam

2
1. Introduction
Well-organized financial systems are conducive to economic growth and development
(Levine 1997, Sylla 2002), but the ways in which they do so vary greatly. Countries
with similar performance often have very differently organized financial systems, and
long-running debates about the respective merits of particular institutional
configurations, say banks versus markets or the presumed advantages of
Universalbanken, did not yield firm conclusions as to the economic superiority of
one configuration over another (Sylla and Toniolo 1991; Fohlin 1999; Levine 2002;
Carlos and Neal 2011; Calomiris and Haber 2014). The recent financial crisis has
added a new dimension to these debates, however, some systems proving more
resilient than others (e.g. Bordo et al. 2015).
Tracing the historical roots of today’s financial systems is the obvious way to
understand their respective differences, but only if we do not take the 20th century
model outcome, big banks and flexible securities markets financing modern
economic growth, for granted. Important though it is to trace the evolution of, say,
deposit banking and securities trading from late medieval Italy and Flanders via
seventeenth-century Holland to eighteenth-century Britain, we need to put that
evolution back into its historical context if we want to learn why the eventual
outcome between countries differed. Merton and Bodie’s 1995 functional analysis
provides a very practical framework for doing this, because by analyzing how basic
financial functions were performed in any given system we get to know at the same
time how the system worked, and what kind of opportunities and constraints the
individual operators faced, in short, what determined the pattern of supply and
demand which drove a particular system’s evolution. Moreover, such a functional
analysis is particularly useful for understanding Early Modern financial systems,
because patterns of supply and demand were so very different. Most firms were
financed directly, through family deposits, partnerships, suppliers’ credit or outside
borrowing with bills. Moreover, there existed a large and diverse group of
intermediaries, such as money changers, notaries, cashiers, attorneys, and town
magistrates which in the end disappeared, but whose operations, to a greater or lesser
degree, shaped a financial system’s evolution.
In this paper we adopt the functional analysis framework for exploring the
operations of two groups of such disappeared intermediaries in the Low Countries,

3
notaries and aldermen. Drawing our inspiration from the pioneering work of
Hoffman, Postel-Vinay, and Rosenthal (2000) on the Parisian notaries’ extensive
financial intermediation for private customers, we ask whether, in the Low Countries,
officials with a similar position could also build and maintain what was essentially a
banking business in all but name and, if not, why not. The Parisian notaries’
commanding position as financial intermediaries rested on their ability to combine
the positive externalities of their professional network with informational advantages
from property transactions, the issuing of government debt, and managing clients’
estates, thereby reducing information asymmetries between borrowers and lenders.
In theory, notaries in the Low Countries could have developed similar
informational advantages but their position in the market seems to have been quite
different. When public notaries were first admitted as administrators of private
contracts in the sixteenth century, cities already offered registration facilities for
contracts such as annuities, mortgages, or debts arising from market or fair
transactions (Soly 1974; Dambruyne 1989; Zuijderduijn 2009; Cappon 2005; Nève
2005). What is more, local governments increasingly accepted business ledgers and
privately written contracts as conclusive proof in court cases, which may have
reduced the benefits of public registration (Gelderblom 2013; Van Bochove and Kole
2014).
To determine the function of notaries and aldermen in the financial system of
the early modern Low Countries, we compiled a new database of almost 13,000 credit
transactions registered by aldermen and notaries between 1500 and 1780 sampled at
forty-year intervals from six cities: Amsterdam, Utrecht, Den Bosch, Leiden,
Antwerp, and Ghent. The cities were chosen to reflect differences in political regime
and economic conditions. Until the end of the sixteenth century all six cities belonged
in the Habsburg empire, but thereafter the four northern cities Amsterdam, Utrecht,
Leiden and, from 1628, Den Bosch became part of the Dutch Republic, whereas
Ghent and Antwerp remained in the Spanish Habsburg empire. As for their economic
position, Antwerp and Amsterdam were major international financial and trading
hubs, while Ghent and Leiden were manufacturing cities.
The dataset serves four related aims in this chapter. First, we compare the
volume of the credit transactions processed by aldermen and notaries in each city,
looking at the number and value of registered loans. We also split the sample to see
whether there were any differences between the contracts registered by aldermen and

4
by the notaries. Then we compare the size of the markets which aldermen and
notaries served with that of other credit markets within and outside to Low
Countries. Finally, we use these loan characteristics in a multivariate regression
analysis to measure how well different aspects of risk were priced in the markets
served by aldermen and notaries. Taken together, the answers to these questions will
allow us to establish whether notaries and aldermen merely acted as public
administrators of private loans, or became active intermediaries in local credit
markets.
2. Registering private debt
In the Low Countries town magistrates preceded notaries as administrators of credit
transactions by several centuries. In all major cities in Flanders, Brabant, and
Holland the registration of private loans by the court of aldermen (schepenbank) can
be traced back to the fourteenth century, if not earlier (Zuijderduijn 2009: 184-190;
Van Bochove et al. 2015). The reason for this was the formal obligation for property
owners to register loans secured on real estate with the local authorities. Initially, the
loans took the form of annuities (renten), i.e. mortgages on real estate, that were used
by artisans and merchants to fund the initial purchase of a house or piece of land but
also, for those already in possession of the premises, to free up capital for other
investments, or transfer assets to the next generation (Schnapper 1956). During the
fourteenth century urban governments followed suit by selling renten secured on
future tax revenues. By 1500 every major town in the Habsburg Netherlands had
become used to selling annuities to raise money, either for exceptional expenses such
as rebuilding defences in the face of war, or to meet the constantly rising fiscal
demands of the Brussels government (Munro 2003; Boone et al. 2003; Van der
Heijden 2006; Zuijderduijn 2009).
Besides renten local governments registered other private loans as well. In
Flanders as early as the twelfth century the city of Ypres famously registered debts
issuing from transactions at the local fairs (Des Marez 1901). By 1500 town
magistrates across the Low Countries exercised their so-called voluntary jurisdiction,
to allow their citizens to formalize debts issuing from the sales of sundry goods, house
5
rentals, or labour services (Zuijderduijn 2009).2 These promissory notes went by a
variety of names (schepenbrief, schepenkennis, plecht) but they shared two key
characteristics. On the one hand, unlike annuities, both the debtor and the creditor
could terminate the contract upon maturity (Schnapper 1956). On the other, the loan
did not have to be secured on a specific piece of real estate. More often than not the
parties agreed upon a so-called general mortgage, a formal claim on someone’s
person plus all his or her present and future possessions in the form of real estate or
other goods (Van Bochove et al. 2015; Van Hoof 2015: 85-140). This turned the
schepenkennissen into transferable claims not dissimilar to IOUs circulated by
businessmen in Antwerp and Amsterdam (Van Der Wee 1967; Gelderblom and
Jonker 2004; Puttevils 2015a), but with the additional legal security of formal
registration.
For the present chapter we collected both the private annuities and
schepenkennissen recorded by the aldermen of six cities: Ghent, Antwerp, Den Bosch,
Utrecht, Leyden, and Amsterdam. However, unlike previous studies by Soly (1974,
1977), Dambruyne (1988, 2001) Hanus (2009), and others, we did not include
annuities contracted between the buyer and seller of a specific piece of property with
the sole purpose of funding the purchase. Surely this was a very large segment of the
annuities market, but these loans left debtors no choice as to the amount, purpose, or
counterparty of the contract.3 In other words, we only collected private annuities that
were functionally equivalent to the schepenkennissen or IOUs that allowed borrowers
and lenders to set terms and conditions without any prior constraint.4 For the same
reason we excluded the so-called kustingen or kustingbrieven, i.e. deferred payments
of real estate, as often as not in three annual installments of equal size. (cf.
2 Compare for Gouda***. 3 Cf. the distinction made by Schnapper (1956) between the rente as a counterclaim created to finance the transfer of a property, and the constitution of a rente as a means to obtain ready cash on the collateral of a house or a piece of land. 4 Following the same logic we did collect life annuities, but the number of these self-extinguishing cash loans was very limited, i.e. 230 across the entire sample.

6
Zuijderduijn 2008).5 Finally, we did not include any transfers of schepenkennissen or
annuities because these did not constitute the creation of credit either.6
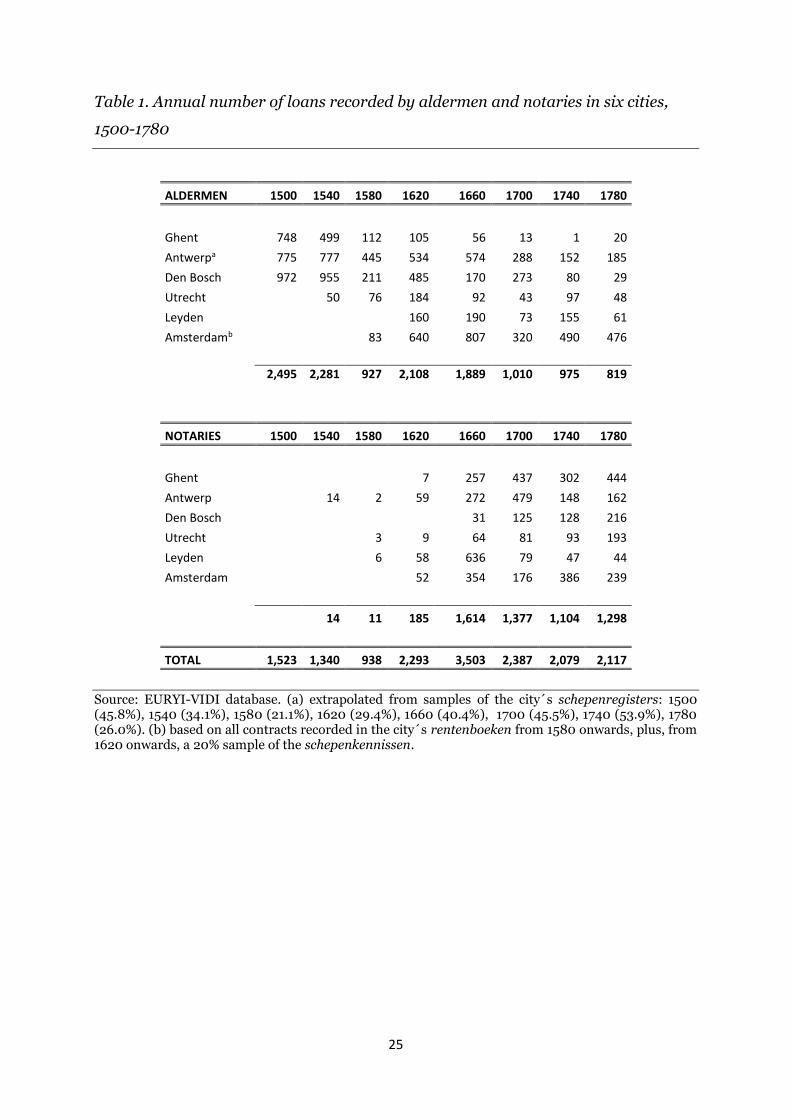
[Table 1 about here]
The aldermen’s records from the six cities shows their registration of private loans in
full-swing in the sixteenth century. The magistrates of Antwerp and Ghent recorded
hundreds of loans every year, with numbers in Den Bosch even higher because its
aldermen were also responsible for the recording if debts in the surrounding
countryside. For Amsterdam en Leiden no records survive for most of the sixteenth
century but the data we do have for the final quarter of the sixteenth century shows
these towns’ magistrates very active as well. In the seventeenth and eighteenth
centuries, the aldermen fared differently across cities. In Ghent they virtually stopped
recording private loans after 1600, and also in Utrecht, Den Bosch and Leyden there
is a marked decline, especially in the eighteenth century. In Antwerp and Amsterdam
debt registration also diminished but notably in the Dutch port the aldermen
continued to register several hundred new loans per year.
These general trends are reflected in the value of the loans registered by the
aldermen (Table 2). Amsterdam stands out with annual loan values between 1 and 1.5
million guilders in the eighteenth century, with Antwerp a distant second with total
amounts of between 400,000 and 800,000 in the seventeenth century. In that same
period loans recorded by the aldermen of Den Bosch and Leiden peaked at 200,000
guilders in 1620 and 1660 respectively. These very different totals were obviously
related to the size of the population. To correct for this we can divide the total sums
by the number of inhabitants. Measured per capita, the first thing to notice are the
very low loan values: never more than 10 or 15 guilders, the level reached by the
aldermen of Antwerp and Den Bosch in the seventeenth century. Equally striking is
5 Notably in Holland the market for these kustingen was very large. For instance in Amsterdam the number of registered kustingen rose from 150 to 200 per year in the late 16th century to 1,500 in 1620 and 900 in 1660 – an upward trend related to the city’s very rapid expansion during the Golden Age. By 1700 the number had dropped to 300. (EURYI/VIDI database, data drawn from ACA, Archive 5063, Register van Schepenkennisen 1594-1595. Archive 5065, Register van Rentebrieven en Transporten van los- en lijfrenten, 1580, 1620, 1660, 1700, 1740, 1780). 6 We know from the work of Soly, Dambruyne, and Hanus that the number of recorded transfers in Antwerp, Ghent and Den Bosch, respectively, was very large in the sixteenth century. A small sample of our own, for the aldermen of Den Bosch in 1580 and 1620, revealed 173 and 113 transfers of annuities per year, respectively. SDB, Archive 5.1, Bosch Protocol, 1580, 1620)

7
the persistently low value of recorded loans in Ghent (less than 1.50 guilders per
capita), throughout the early modern period. In the eighteenth century the other
cities reached similarly low levels, expect for Amsterdam, where aldermen remained
as active as they had been since the middle of the seventeenth century.
[Table 2 about here]
One explanation for this divergent development would be the more or less successful
entry of notaries as administrators of private loans.7 In the 1530s ordinances issued
by Charles V raised their existing private practice of drafting formal legal documents
into a public office, with the result that notarial contracts obtained the same legal
status as those drawn up by aldermen, provided they kept registers with copies of all
deeds signed in their offices. This opened the way for notaries to develop into a legal
service provider offering a full range of contracts, including last wills and testaments,
marriage contracts, business partnerships, shipping contracts, property transactions,
and selling assets such as annuities (Gelderblom 2013: 87-94). To determine whether
they build on this business to become financial intermediaries as well, we collected
the private loans they recorded in the six cities between 1540 and 1780.
Before the middle of the seventeenth century we found very few debt contracts
in the notarial protocols (Table 1). In 1620 there are less than 200 contracts in the six
cities, against 2,100 for the aldermen. But in 1660 the notaries, with 1,600 contracts,
were almost at a par with the aldermen (1,900 contracts). Their share continued to
grow in later years but even in 1780 the aldermen in the six cities combined still
recorded one third of all loans recorded. This persistence is partially caused by the
inclusion of Amsterdam in our sample, as the aldermen of the Dutch port registered
twice as many loans per year as the notaries in 1780. In all the other cities the
notaries had clearly surpassed the aldermen as the principal public administrators of
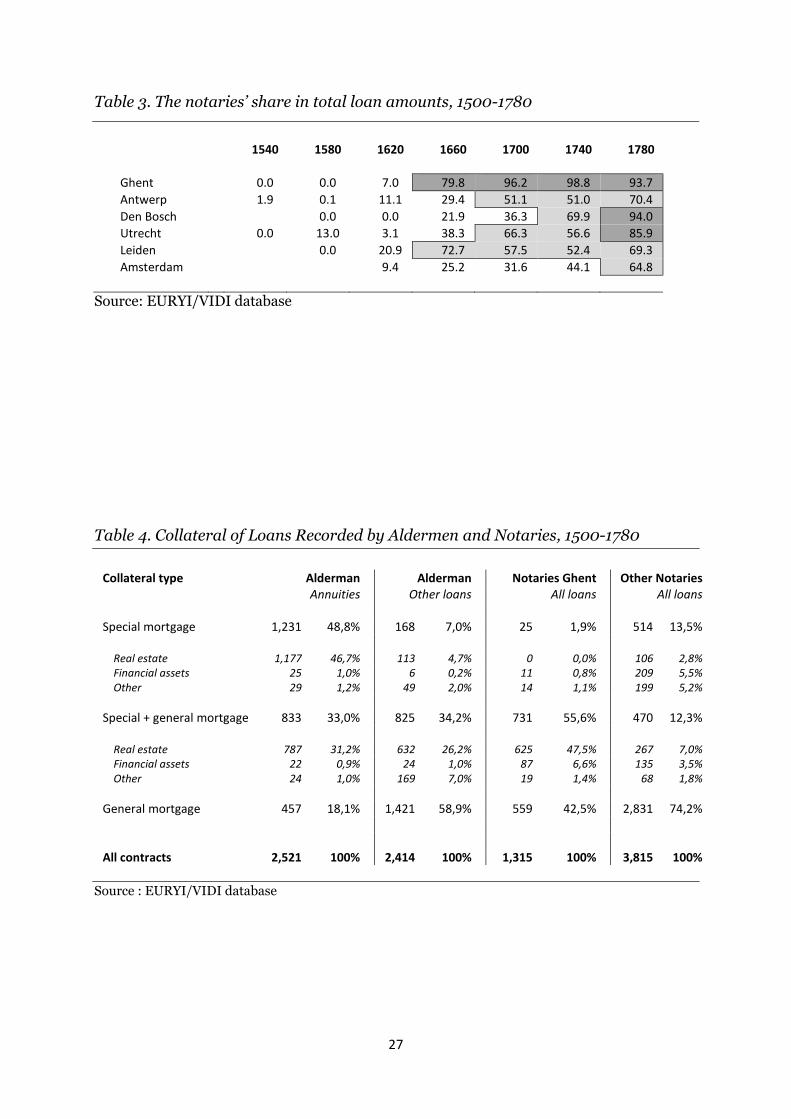
debt. This shifting balance is also reflected in the value of loans registered by notaries
and aldermen (Table 3). Already in 1660 notaries processed 80 per cent of total loan
amounts in Ghent, just under three quarters in Leiden, and some 40 per cent in
Utrecht (Table 3). In the other three cities they handled between a fifth and one third
of the business. In the eighteenth century the share of the notaries increased across
7 Table 12 presents a lower bound estimate of this very gradual process, since, to avoid duplication with the aldermen, we did not collect transactions secured on real estate processed by the notaries.

8
the board, with the differences between cities decreasing. Still, in 1780, notaries in
Leyden, Antwerp and Amsterdam were responsible for only 70% of the value of all
publicly registered loans.
[Table 3 about here]
So, why did the public registration of private loans in the Low Countries gradually
shift from the aldermen to the notaries? Only in the case of Ghent the answer is
straightforward. This city had a particular feudal legacy in that landlords retained the
right to register any transfer of real property and related credit transactions. Without
the formal obligation to register loans with Ghent’s aldermen, the administration of
annuities ended up in the protocols of notaries (Van Bochove et al. 2015). Ghent was
the only city where this happened, however. In Antwerp and Den Bosch notaries were
formally required to take turns as clerks at city hall, but the registers they kept for the
town were kept completely separate from their own protocols. In the other three
cities some notaries also doubled as town secretaries, but these were incidental
appointments only, so here aldermen and notaries kept their separate offices and
their function in the local financial market may have differed accordingly. To find out
how their respective functions developed, we have to look more closely at the
transactions in our sample.
3. Transaction patterns
One reason for the segmentation of local credit markets in the early modern period
was the use of different kinds of loan collateral. At least until the end of the sixteenth
century real estate was the most important store of wealth for town dwellers. As
urban governments wanted to keep track of the ownership of this property, anybody
who wanted to use a house or a piece of land to secure a loan ended up registering
this loan with the aldermen. In fact, the annuities (renten) sold for this purpose were
themselves considered real property, and while borrowers had the right to repay
these loans, creditors who wanted their money back had to sell the annuity to
somebody else – once again a transaction that required formal registration at the
9
town hall. Thus, as long as borrowers and lenders valued these specific terms, the
aldermen were indispensable as loan administrators. The number of annuities
recorded in the six cities declined, however, from six per thousand inhabitants at the
beginning of the sixteenth century to less than one per thousand in the eighteenth
century (Figure 1) .
[Figure 1 about here]
This movement away from losrenten and lijfrenten as the preferred credit instrument
coinced with the emergence of a new type of collateral, the general mortgage, which
allowed creditors to seize any part of a debtor’s property in case of default. First
applied as an additional safeguard for annuities in the fifteenth century, the general
mortgage was increasingly used as the sole guarantee for loans. This is clearly visible
in Table 4, which summarizes our knowledge of the collateral of 10,065 loans (83.7
per cent of the total) registered by aldermen and notaries in the Low Countries.8
More than three quarters of the annuities (losrenten, lijfrenten) registered at the
town hall came with a specific piece of real estate as collateral. Conversely, three
quarters of the loans recorded by notaries specified no other collateral than the
person and goods of the borrowers. The specific collateral pledged for the remaining
quarter consisted not only of real estate but also financial assets. The one exception
are the notaries in Ghent who doubled as town clerks (cf. supra). The vast majority of
the loans they recorded did indeed carrry a general mortgage, but half of them also
specified real estate as collateral, mirroring the notaries’ involvement in two distinct
markets segments.
[Table 4 about here]
But even if borrowers and lenders turned away from annuities, they kept coming to
the aldermen for the registration of other private loans (Figure 1). Admittedly the
number of recorded contracts was modest in most cities, but especially in Antwerp in
the sixteenth century, and in Amsterdam in the seventeenth and eighteenth centuries,
8 In our tabulation the general mortgage includes ‘persoon en goed’ and ‘persoon’; Real estate includes: houses, land, workshops, mills; financial assets include bonds, shares, and loans; other includes: merchandise, ships, unspecified ‘goods’, collective goods (e.g. from inheritance or communal institution), and any other kind of collateral;

10
several hundreds of loans were registered every year. The collateral pledged for these
plechten, schepenkennissen, and schuldbekentenissen resembled that of the notarial
loans: a general mortgage, sometimes with an additional pledge of real estate as
collateral. One possible explanation for this persistent involvement of the aldermen
could be the social background of the borrowers and lenders who used their services.
As various historians have shown for the cities of Flanders and Brabant in the
sixteenth century, craftsmen were the principal sellers of annuities, with a mixed
group of retailers and wholesalers a distant second. Their creditors issued from
broader shifts of society, including craftsmen, traders, civil servants, clergy, and a
substantial group of widows and (the guardians of) orphans.
[Table 5 about here]
Our sample gives us the professions of some 2,000 borrowers and 3,000 lenders.
These data, summarized in Table 5, suggest that the aldermen in other parts of the
Low Countries served a clientele similar to that in Antwerp in the sixteenth century.
Craftsmen and laborers make up 60 per cent of the debtors with known profession,
with traders a distant second at 25 per cent. The craftsmen and laborers were much
less dominant among the creditors which comprised a much broader group of
artisans, traders, and public officials. If we then look at the professional background
of debtors and creditors appearing before notaries between 1660 and 1780, it turns
out that these officials had an equally broad customer base. Traders and public
officials together accounted for half the loans, but craftsmen and laborers still took up
about a third of all notarial credit. Only the creditors issued almost exclusively from
the upper shifts of society, with traders, public officials, noblemen, and clergy signing
more than 85 per cent of the loans.
[Table 6 about here]
With both market segments accessible to broad shifts of society there must be
another explanation for the growing share of notaries in the public registration of
private loans. Differences in the average and median loan amounts recorded by
notaries and aldermen offer a partial answer. As Table 6 shows, the higher these
amounts, the more likely it was that people went to a notarial rather than the

11
aldermen’s bench. By 1780 the average amount of loans processed by notaries was
double the aldermen’s average. One obvious reason was the higher number of
merchants among the notaries’ clientele, but if we compare average to medium loan
amounts (reported in Table 7) a more subtle difference between the two segments
emerges. While median loan amounts remained largely similar, the averages diverged
especially in the eighteenth century when notaries started to register some very large
loans.
[Table 7 about here]
If average and median amounts rose across the board, then small loans became more
and more exceptional. In 1620 the median amount was just over half to one-and-a-
half a skilled artisan’s annual wage of 200 guilders, but that rose to more than 2.5
times by 1660, four times by 1740 and five times by 1780. Presumably over time
people needing small loans found other ways to borrow, avoiding the formalities and
cost of contracting before magistrates or notaries. The same was true for loans of
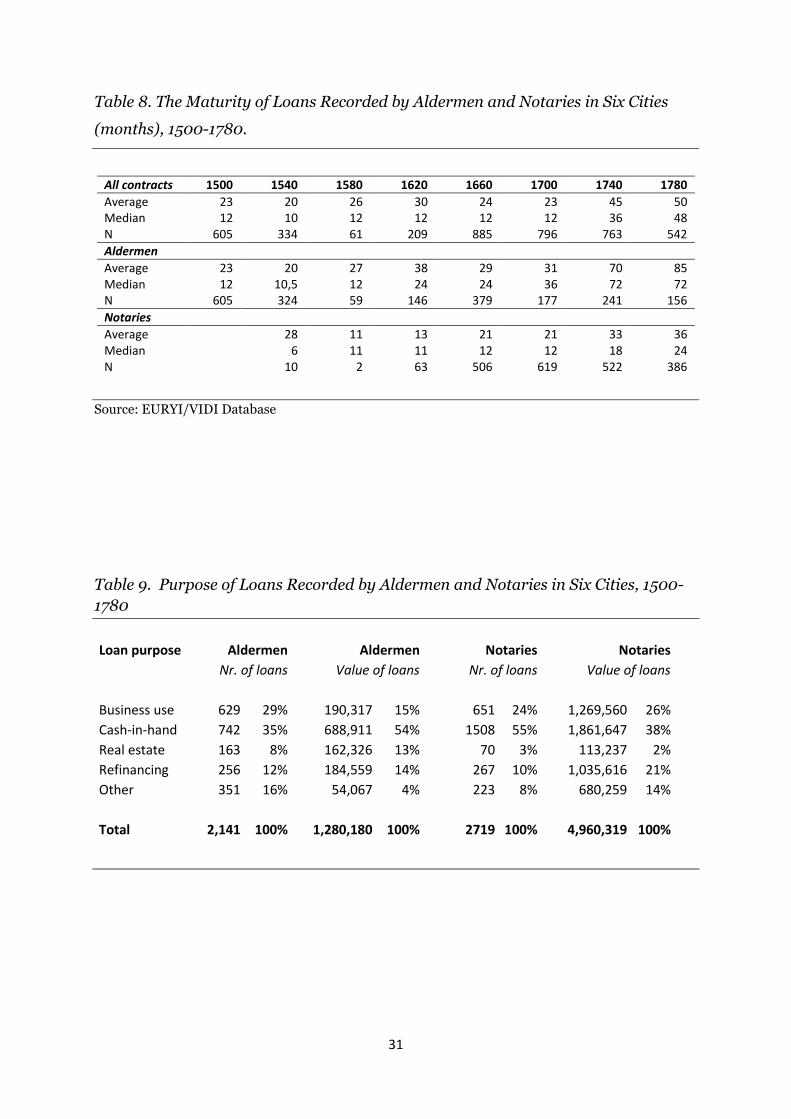
short duration. We know loan maturities for about a third of all transactions. As
Table 8 shows, up to 1700 loans averaged about two years, but with a median of only
a year, so a considerable number of contracts had either a much shorter or a rather
longer maturity. During the eighteenth century maturities doubled to four years while
the difference between average and median, i.e. the extreme maturities, dropped
considerably. By all looks the transactions in our sample evolved into a sort of
standard longer-term loan, most noticeably so for the aldermen contracts with
average maturities of seven years by 1780, against three for the notaries.
[Tables 8 and 9 about here]
As a final gauge of the differences between the two segments, we can probe loan
purposes but again with a strong proviso since tw0-thirds of all contracts sampled
come into the category other and unknown (Table 9). The stated loan purposes did
not differ that much between the two service providers, save for the fact that the
notaries processed rather more contracts with borrowers stating cash-in-hand as
purpose. Since we filtered out the direct mortgaging of property on purchase, the low
percentage of loans to buy real estate fails to surprise.

12
4. The Function of Aldermen and Notaries
Our data show that aldermen and notaries in the Low Countries served partially
overlapping market segments – with the formal, public registration of loans as the
common denominator. They both offered legal security to borrowers and lenders but
aldermen offered more standard solutions, while notaries registered loans with more
specific terms and conditions regarding the size, maturity, collateral, and purpose of
the contract. In terms of Merton and Bodie’s functional approach to financial markets
the aldermen and notaries helped debtors and creditors to overcome incentive
problems (function 6). The public registration of the terms and conditions of a loan,
whether in the form of a standard contract or an explicit adaptation thereof, made for
easy enforcement with the added advantage of a priority claim in case of liquidation
of the debtor’s estate. Now the question is, whether the aldermen and notaries in the
Low Countries built on this administrative role to perform additional functions as
well, in particular the ones highlighted by Hofmann et al. in their work on Parisian
notaries, i.e. the transfer of funds from savers and investors to borrowers (function 3)
and the allocation of these loans according to the perceived default risk of the debtors
(function 4)?9
To answer this question we first need to establish how important the
registration of loans by notaries and aldermen was in comparison to other segments
of the market. We know that some Antwerp merchants during the sixteenth century,
and some of their Amsterdam colleagues a century later, possessed commercial paper
worth tens of thousands guilders, but we have no idea of how much of that paper
circulated (Gelderblom and Jonker 2004; Puttevils 2015a, Gelderblom, Jonker, and
Kool 2016). Nor do we know more about bills of exchange or suppliers’ credit, apart
from the fact that it was very widely used. The only gauge we have is the issue of
public debt by the sovereign province of Holland, the single biggest issuer in the Low
Countries during the seventeenth and eighteenth century. From a creditor’s
viewpoint this is not such a bad gauge. Formally, Holland bills had a maturity of six
to twelve months, though most if not all were habitually rolled over to become de
facto consolidated debt (Gelderblom and Jonker 2011). As often as not the contracts
that interest us had a maturity of some eighteen months across all cities, with an
9 We can be brief about a potential fourth function of the notaries – the pooling of household wealth to fund government expenditure. Unlike in France, notaries in the Low Countries played no role whatsoever in the placement of public loans (Gelderblom and Jonker 2011, 2014)
13
average of 24 to 30 months and a median of 12 during the seventeenth century, rising
to 45-50 and 36-48 respectively during the eighteenth century.
Because there are no comparable figures for public debt issues in the provinces
Flanders, Brabant, and Utrecht, we can only draw a comparison for the two Holland
cities in our sample, Leiden and Amsterdam, for the five benchmark years between
1620 and 1780. Provincial debt was issued by the local tax receivers, each in
proportion to their share in total tax receipts. Consequently, the receivers in Leiden
and Amsterdam together sold about 35 per cent of each new loan. Elsewhere we have
reconstructed detailed, annual figures for Holland’s total debt, repayments and new
issues (Gelderblom and Jonker 2011). Figure 2 compares the value of 35 per cent of
those new issues with the amount of debt processed by aldermen and notaries during
the benchmark years. Our comparison makes the volume of private debt stand out as
very substantial: in each of the benchmark years aldermen and notaries processed
higher amounts than the tax receivers issued in public debt. If the volume of private
debt outstripped public debt issues in most years, we may also assume the reverse to
have been true. The comparatively low figure for Amsterdam in 1700, about half of
that in 1660, 1740, and 1780, could then be explained by strong public demand
during the preceding Nine Years’ War.
[Figure 2 about here]
Thus, measured by the value of the loans they recorded, notaries and aldermen
played a substantial role in local credit markets. But still their position may have been
much weaker than that of Parisian notaries. For one thing, merchants in major
commercial cities used notaries only sparingly. In Amsterdam, and probably
elsewhere, too, bills of exchange generated a steady stream of notarized protests,
because local custom required such documents to start proceedings for non-payment.
But the initial bills were never notarized. By contrast merchants initially, that is to say
during the last quarter of the 16th century, used notarized shipping contracts, but as
shipping grew and contracts standardized, they switched to private contracting and
used notaries only as an exception, for trips with unusual cargoes, partners, or
destinations (Hart, ‘Shipping contracts’.*). The securities trade showed a similar
switch from notarized to private contracting (Petram 2014). The use of affidavits or
solemn depositions taken by notaries also appears to have dropped over time as
14
merchants found other, cheaper ways of giving formal testimony in business
disputes.
Because of the formalities involved, registered contracts were better legal proof
for transactions than underhand, private contracts, but registration also cost time
and money.10 The same goes for borrowers and lenders, who may have employed a
notary or aldermen only when they were unfamiliar with a particular type of contract,
uncertain about its outcome, unsure about their counterparty, or when they wanted
legal advice. In other cases they may have preferred direct, private dealings with
friends, relatives, and business association. In sixteenth-century Antwerp, for
instance, merchants commonly relied on private IOUs as backing for debts, while
local cashiers developed a note circulation which must have included overdrafts for
trusted clients (Puttevils 2015b; Van der Wee 1967). For Amsterdam we know that, by
the last quarter of the seventeenth century, several alternative credit options had
emerged, including pre-printed private loan contracts (Van Bochove and Kole 2014),
wage advances from the colonial companies (Van Bochove and Van Velzen 2014),
bills of exchange, suppliers’ credit, and short-term borrowing against securities
(Gelderblom, Jonker, and Kool 2016).
Thus it seems that the business model of notaries in the Low Countries was
very different from that in France. Until well into the nineteenth century the licenses
which notaries needed to set themselves up in business was no more than a diploma,
an official qualification. Obtaining such a license meant entering a competitive
business, because the authorities rarely restricted the number of licenses granted to
notaries or, if they attempted to do so, their efforts failed (Cappon 2005: 20; Nève
2005: 48).11 Consequently passing deeds remained a sideline for most notaries. As a
rule they saw only one, perhaps two or three clients a week (cf. Table 10). Amsterdam
formed the exception. The city council succeeded in keeping down numbers and local
notaries sought to boost their business through specialization, say by focusing on
shipping contracts or building ties to specific business communities like Sephardic or
Armenian merchants.12 But even in Amsterdam the average practice in 1620 or 1780,
dealing with eight clients a week, cannot have kept notaries very busy or yielded them
10 Cf. Van Hoof, Generale zekerheidsrechten 108-109 quoting Pos, Bezitloos pandrecht 161, about merchants generally lacking the time to formalize claims. 11 Cf. also Sprenger, ‘Notariaat’, 128, 130; and for a rare instance of restrictions in Breda idem, 124. 12 ***ref.
15
a living commensurate with their social rank and their standing as qualified legal
experts.13
[Table 10 about here]
Unlike their Paris counterparts, notaries in the Low Countries could rarely earn a
living from processing deeds alone. Therefore they needed income from other work.
They often doubled as aldermen and occupied other administrative positions, such as
court clerk and bailiff, they acted as solicitors, or, in the southern Low Countries,
served as priests.14 In such circumstances one would expect them to have used the
information about their clients to sollicit new business by moving into active financial
intermediation. This did indeed happen in Utrecht.15 At least two notaries had
switched entirely to financial services by the end of the 18th century, one to deposit
banking, the other to securities underwriting and trading.16 In both cases notarial and
financial services developed side-by-side until the latter generated sufficient income
to drop the former.
However, Utrecht was an exception. Notaries did not, as a rule, branch out into
financial intermediation to supplement their income. Regressing the total number of
deeds processed on the number of debt transactions per notary and per city, we found
a negative non-linear relation between them. That is to say, the notaries with the best
informational basis to capitalize on the information available to them, i.e. those with
the highest number of deeds per year, had a lower proportion of financial contracts
than notaries who processed few deeds and thus possessed little information with
which to canvass business. This suggests that the Low Countries notaries could not
emulate their Parisian colleagues’ example for two reasons. First, as noted above, the
13 Roes, Goede, afvallige notaris 7, 9, 13, 14, on the social status of notaries in Gelderland. ***Income Amsterdam notaries, cost of deeds, data HK. 14 Roes, Goede, afvallige notaris, 7, 9; Sprenger, ‘Notariaat’, 127, and 125, mentioning one 17th century case of a surgeon-notary. 15 Van Bochove (2013). In Utrecht’s notarial protocols we found 218 transfers of private and public bonds in 1740, and another 256 in 1780. With 17 and 19 transfers in 1660 and 1700, respectively, this specialization seems much less pronounced in the seventeenth century (HUA, Archive 34-4, Notariële archieven stad Utrecht). In the eighteenth century notaries in Den Bosch also recorded several dozens of transfers per year: in 1700: 10; in 1740: 33; in 1780: 33 (SDB, Archive 9.1, Notarieel Archief, 1660, 1700, 1740, 1780) 16 Resp Jan Kol, a cashier and fledgling deposit banker, and D.W. van Vloten, an underwriter for Hope & Co.’s foreign loans (Van Bochove 2013)
16
information about real estate transactions was essentially free; second, because the
authorities failed to restrict the number of notaries, they could not exploit any
information exclusively available to them, despite the fact that they had an incentive
to do so.
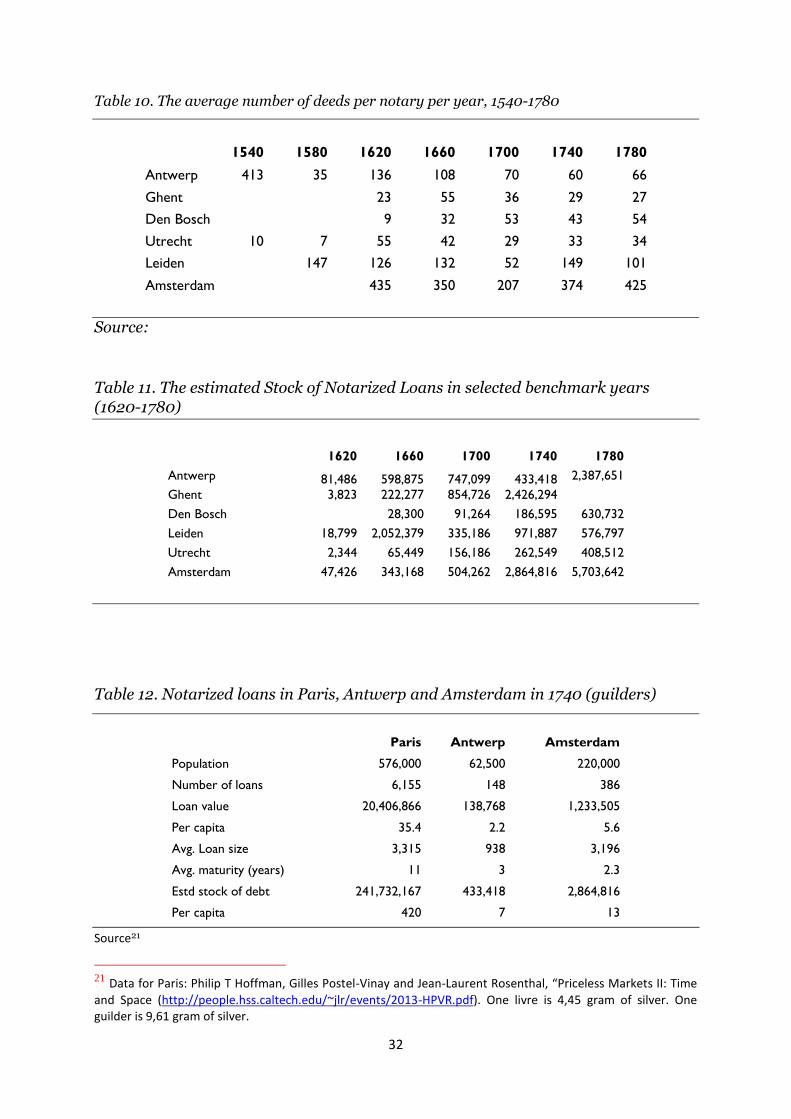
Thirdly, the per capita figures reported in Table 2 (cf. supra) provide further
perspective on the volume of transactions. By 1780 this type of credit had passed the
20 guilder per head mark in three cities, Amsterdam, Ghent, and Den Bosch. In
Antwerp and Utrecht two others the figure stood at between 10 and 20 guilders,
whereas Leiden remained below 10. By contrast, Parisian new notarial credit already
amounted to 35 guilders per capita in 1740, more than twice what aldermen and
notaries processed in any of our cities during the same year. Following the lead of
Hoffman et al. (2000) we can use the stated maturity of loans to derive the stock of
credit at the benchmark years. The notarial contracts do not always record the
maturity or the actual extinction of debts, but at least sufficiently often to permit a
rough estimate of debt stock by combining the actual maturity of the loans with the
number of contracts passed.17 Table 11 shows very low initial numbers overall, rising
considerably only during the eighteenth century, the estimated Amsterdam stock
growing to 2,8 million guilders in 1740 and double that amount in 1780. Ghent was
not far behind in 1740, which leads us to suppose it must have risen further by 1780,
when Antwerp reached almost 2.4 million guilders in 1780.
[Table 11 about here]
To put these numbers in perspective we compare those for our two biggest cities first
of all with some of the Paris figures (Table 12). The difference between the cities is
huge. With a population less than three times that of Amsterdam, the notaries of
Paris contracted 16 times as many loans as their Dutch counterparts. The average
loan amounts in Paris and Amsterdam were similar, but as a result of the much larger
population and the much longer maturity of loans, the stock of notarized loans in
Paris was 85 times bigger than in Amsterdam.
17 We know the maturity of 67.2% of the loans recorded in Amsterdam, 52.4% of loans in Antwerp. This information is more sparse for Den Bosch (42%), and especially Leiden (19%), Utrecht (22%), and Ghent (4%).
17
In brief, the credit processed by aldermen and notaries in the Low Countries,
though substantial in itself compared to what the public debt absorbed, was far less
important than notarial credit was in Paris. In each of the six cities explored here, the
formally registered contracts were only one of many forms of debt, and certainly not
the dominant one.18 People needing credit possessed a range of alternatives, from
lombarding securities or commodities via private, underhand contracts with family
members, to current accounts kept with business associates, and deferred payments
to suppliers.
5. Risk Pricing
Borrowers and lenders in the Low Countries may have benefited from this
segmentation of local credit markets as it facilitated the matching of a very
heterogeneous supply and demand for loans. On the other hand, it may have been
more difficult to find the right counterparty in the absence of the kind information
sharing practiced by Parisian notaries. To explore which of these two interpretations
holds, we can examine the ability of creditors and debtors to adequately price risks.
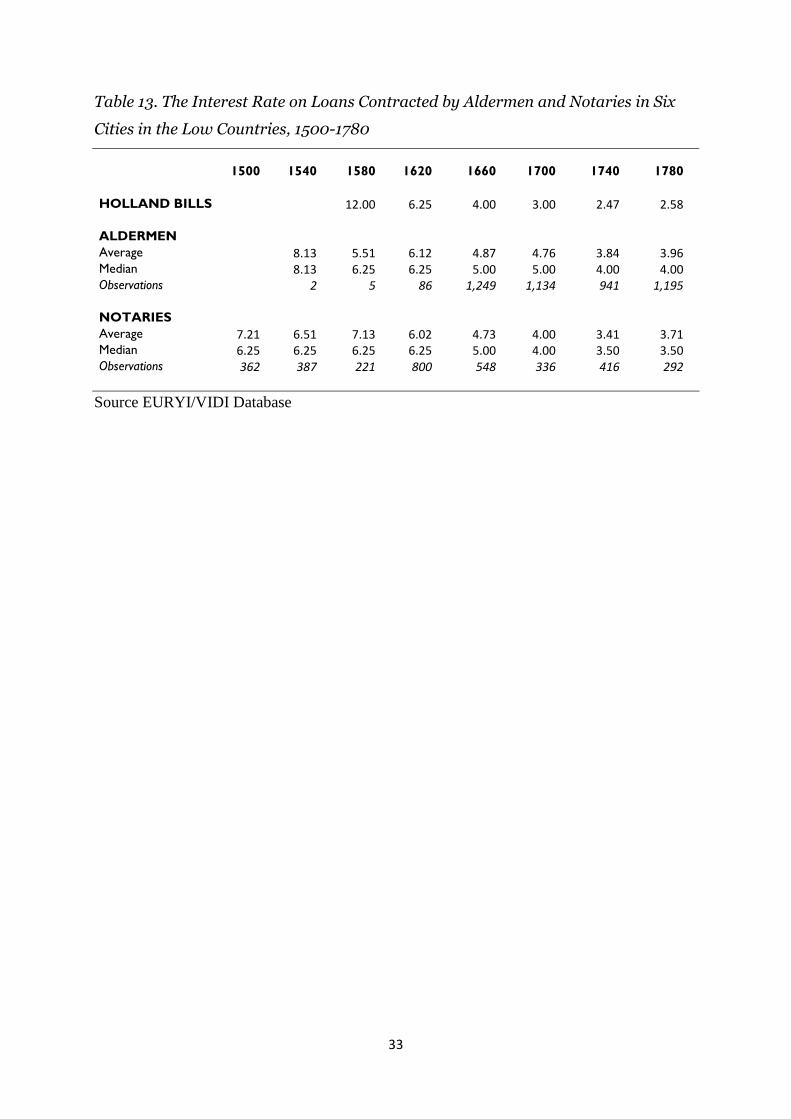
As a first gauge, we simply compare the average interest rate on loans registered by
aldermen and notaries to the yield on bonds of the Estates of Holland. As Table ***
shows, the start of the 17th-century roughly marks the beginning of the downward
trend in interest rates, both public and private, due to more certainty and general
economic growth along with financial innovations. The rates charged in the private
markets followed market developments but they were usually higher than the yield on
Holland bonds.19
[Table 13 about here]
To determine exactly how well risks were priced in these two market segments is
impossible. Frequently there is no information on if and when a loan was repaid, for
18 Sneller, ‘Twentsche’***. 19 There is a possibly very important technicality here: from about 1680 onwards public bond holders paid a withholding tax on Holland’s bonds which stood at 1.5% from the early seventeenth century onwards. It is quite conceivable that loans that were formally registered also fell under this tax regime, which would imply that the yield on these private loans was actually on par with the public loans.
18
example. Moreover, the exact riskiness of a loan is hard to measure as, for instance,
the collateral is often only described and no exact value is given. Presumably, the
creditor knew more about the exact value of the collateral than what is noted in our
database. Nevertheless, the size of the database and the richness of information in
other respects (e.g. interest rate, loan size, collateral type and the presence of a
guarantor and family relations) does allow a further examination of the relationship
between return on the one hand and risk on the other. To do so we replicate the
methodology of an earlier study on price setting on the Amsterdam credit market
(Gelderblom et al. 2016).
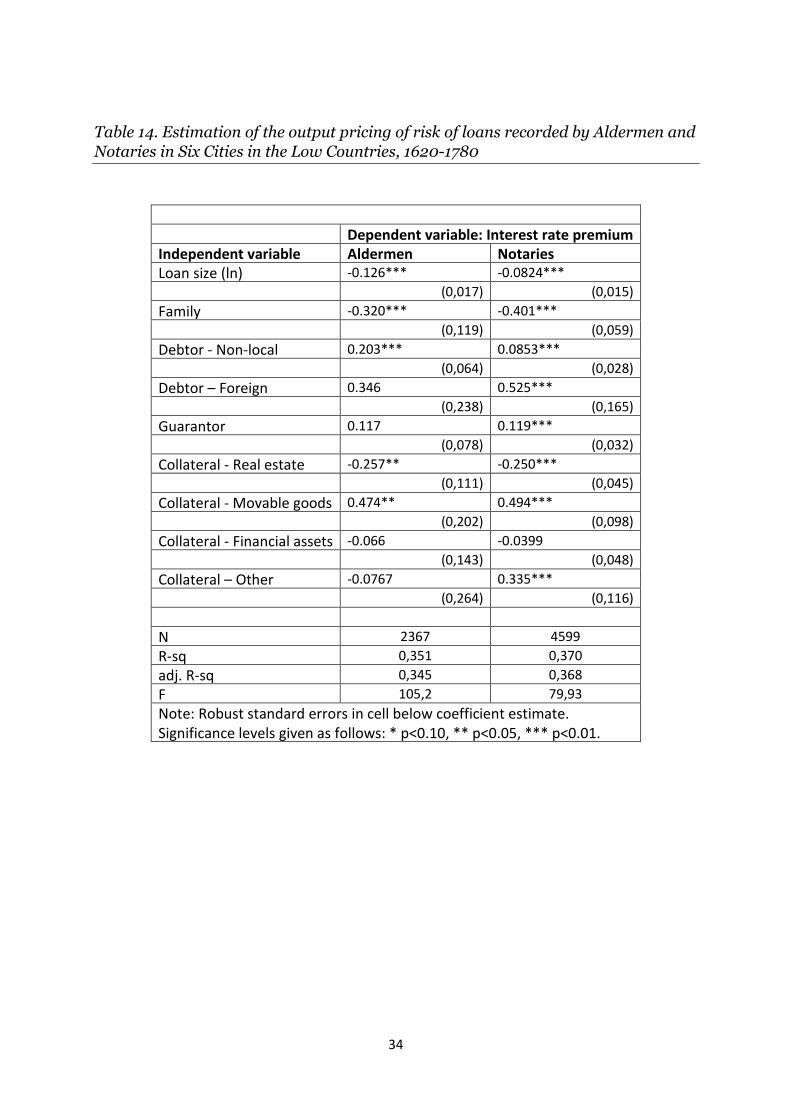
We use OLS to estimate an independently pooled cross section model for circa
8,000 credit transactions between 1620 and 1780, i.e. the period in which both
alderman and notaries were active. In Table *** the first column shows the
estimation results for the loans registered by aldermen, the second those of the
notarial loans. The dependent variable is the interest rate premium which is the
interest rate minus the risk-free rate at the time. The interest rate on bonds issued by
the province of Holland is taken as the risk-free rate. The explanatory variables
capture different dimensions of risk. Loan size, the kind of collateral (real estate,
movable goods, financial assets, others, and general), the location of the debtor (local,
non-local, and foreign), and the presence of a guarantor and family relations are the
main explanatory variables. Control variables include the year, the location and the
type of contract (life annuity, redeemable annuity, obligation, and general debt
notice).
[Table 14 about here]
The results show, first of all, that in both market segments larger loan sizes are
related to a lower interest rate premium. This makes sense as the relative importance
of fixed costs involved with credit decline as the size of the loan increases. Moreover,
larger loan sizes probably capture other aspects, like the wealth of the debtor, on
which we have no data. We do capture another well-known aspect of early modern
credit markets, that is the impact of the social and geographical distance between
creditors and debtors on loan terms. As expected, a family relationship between the
contracting parties is related to a cut in the interest rate premium. Conversely non-
local and foreigner borrowers paid a premium, although this effect is statistically

19
insignificant for the three (!) foreigners we identified in the aldermen’s registers. The
presence of a guarantor for a creditor to call upon in case of default seems to be
related to a small increase in the risk premium, at least with notarial loans. This
effect, though not very strong, is worth pondering as a guarantor should increase the
security of a loan, ceteris paribus. In this case, the increased premium seems to
suggest that the debtor needed this additional safeguard to obtain a loan in the first
place.
When looking at the impact of different types of collateral, it is important to
remember that our reference group is the general mortgage (“person and goods”).
Securing a loan with just this kind of collateral might indicate that the creditor knew
and trusted the debtor and/or estimated the debtor’s assets to be of enough value to
cover the loan in case of default. But it could also mean that the debtor actually had
nothing specific to offer as collateral, indicating a rather risky loan. It is hard to
distinguish between these two possibilities. However, since we control for family
relations, the presence of a guarantor, and the location of the debtor, one would
expect the pledging of a specific kind of collateral to reduce the risk for creditors. This
is indeed what we find for the safest type of collateral, real estate: the premium goes
down. Movable goods, however, are priced as less secure than the very general
collateral. This is most likely due to them being rather unstable in value and hard to
control, especially if the debtor retained them in his or her own control. Finally, the
use of financial assets as collateral does not lead to a lower premium. These assets
were supposedly easy to price and highly liquid, and therefore a very attractive loan
collateral (Gelderblom and Jonker 2004). But many financial assets that were used as
collateral here were actually not highly liquid VOC shares or government bonds, but
rather parts in smaller shipping companies or deeds of private loans.
For all the reasons mentioned above, we have to be careful to read too much
into these results. There is little doubt, however, that the parties who registered loans
with the aldermen and notaries were able to estimate what made a loan riskier and
what made it less so. They calibrated the allocation and pricing of credit in various
ways: choosing more or less distant counter parties, laying down different forms of
collateral, presenting a guarantor, and of course using the services of notaries and
aldermen to make sure creditors had legal preeminence in case of default.
20
6. Conclusion
By the mid-sixteenth century the unification of the Netherlands under Burgundian
and Habsburg rule had created an institutional framework for private and public
credit markets that was remarkably similar across the realm. Key features were the
introduction of a funded public debt organized by urban governments; private
annuities, mortgages, and other medium- and long-term loans registered by these
same rulers; the admission of notaries as formal registrars of an even broader variety
of debt and equity contracts; and the enforceability in local courts of privately
recorded loans. In the major commercial cities, Antwerp and Amsterdam in
particular, local judges supported an even wider range of negotiable instruments,
notably bills of exchanges and bills obligatory, and they regulated the work of various
financial intermediaries, including brokers, moneychangers, and cashiers.
In this paper we explored the functioning of two adjacent market segments in
various cities in the Low Countries: the loans recorded by aldermen and notaries
between 1500 and 1780. We find that broad shifts of society used notaries and
aldermen to register loans of various kinds. Yet the notaries and aldermen failed to
obtain a commanding position on the capital market in the way Parisian notaries did
and remained locked in a comparatively small segment of the total market, largely
because they did not possess the information advantages of their French
counterparts. The notaries, for instance, played no role in either the marketing of
public debt or in the mortgage market. The aldermen were central in the mortgage
market, but of only secondary importance in the wider loan market, dominated as it
was by a highly liquid form of commercial lending on collateral of personal bonds or
of securities (Gelderblom, Jonker and Kool, 2015). These findings highlight the
degree to which subtle regulatory differences profoundly affected the dynamics of
financial market evolution.

21
References
Baum, H.P. Hochkonjunktur und Wirtschaftskrise im spätmittelalterlichen Hamburg Hamburger
Rentengeschäfte 1371 – 1410 (Hamburg 1976)
Bochove, C. van. (2013). “Configuring Financial Markets in Preindustrial Europe”, The Journal of
Economic History, 73:1, 247-274.
Bochove, C. van, and T. van Velzen (2014) “Loans to Salaried Employees: The Case of the Dutch East
India Company, 1602-1794”, European Review of Economic History 18:1, 19-3.
Bochove, C. van, and H. Kole. (2014). “Uncovering private credit markets: Amsterdam, 1660-1809”, in:
The Low Countries Journal of Social and Economic History 11:3, 39-72.
Bochove, C. van, H. Deneweth and J. Zuijderduijn (2015), “Real estate and mortgage finance in
England and the Low Countries, 1300–1800.” Continuity and Change, 30, 9-38.
Boone, M., K. Davids and P. Janssens, eds. Urban Public Debts. Urban Governments and the Market
for Annuities in Western Europe (14th-18th centuries). Turnhout: Brepols 2003.
Bordo, M.D., A. Redish, and H. Rockoff, “Why didn't Canada have a banking crisis in 2008 (or in 1930,
or 1907, or …)?”, Economic History Review, 68-1 (2015), pp. 218-243
Calomiris, C.W. and S.H. Haber, Fragile by Design. The Political Origins of Banking Crises & Scarce
Credit, Princeton: Princeton University Press (2014).
Cappon, C.M., ‘Het notariaat in de late Middeleeuwen (± 1250 – ± 1540)’, in: A.F. Gehlen en P.L. Nève,
ed., Het notariaat in de Lage Landen (± 1250-1842) (Kluwer: Deventer 2005) 1-30.
Carlos, A.M., and L. Neal, ‘Amsterdam and London as financial centers in the eighteenth century’,
Financial History Review 18 (2011) 2146
Dambruyne, Johan. “De 17de-eeuwse schepenregisters en de rente- en immobiliëntransacties te Gent:
enkele beschouwingen.” Handelingen der Maatschappij voor geschiedenis en oudheidkkunde te
Gent 42 (1988) 153-182.
Dambruyne, Johan. 2001. Mensen en centen: Het 16de-eeuwse Gent in demografisch en economisch
perspectief. Verhandelingen der Maatschappij voor Geschiedenis en Oudheidkunde te Gent. Vol.
26. Gent: Maatschappij voor Geschiedenis en Oudheidkunde.
Des Marez, G. (1901), La lettre de foire a Ypres au XIIIe siècle, contribution à l'étude des papiers de
crédit. Bruxelles: H. Lamertin.
Dickson, P.G.M. (1967). The financial revolution in England: a study in the development of public
credit, 1688–1756. Oxford: Oxford University Press.
Fohlin, C. “Universal Banking in Pre-World War I Germany: Model or Myth”, Explorations in
Economic History, 36, 305–343 (1999)
Fratianni, M. and F. Spinelli. (2006). “Italian city-states and financial evolution”, European Review of
Economic History, 10, 257–78.
Fritschy, W. (2003). "A 'Financial Revolution' Reconsidered: Public Finance in Holland during the
Dutch Revolt, 1568-1648", The Economic History Review, 56:1, 57-89.
Gelderblom, O. (2008). “The Golden Age of the Dutch Republic”, in: The Invention of Enterprise,
Chapter 6, Princeton: Princeton University Press.
Gelderblom, O. and J.P.B. Jonker. (2004). “Completing a financial revolution: the finance of the Dutch
East India trade and the rise of the Amsterdam capital market, 1595–1612”, Journal of Economic
History, 64, 641–72.
Gelderblom, O. and J.P.B. Jonker. (2010). “Alba’s Irony: Urban Autonomy and Public Finance in the
Low Countries, 1384-1713”. Working paper.
Gelderblom, O. and J.P.B. Jonker. (2011). "Public Finance and Economic Growth: The Case of Holland
in the Seventeenth Century", The Journal of Economic History 71:1, 1-39.
Gelderblom, O. and J.P.B. Jonker. (2014). “The Low Countries”, in: The Cambridge History of
Capitalism, Vol. 1. The Rise of Capitalism, Ch. 11. Cambridge: Cambridge University Press.
Gelderblom, O., J. Jonker and C.J.M. Kool (2016), ‘Direct finance in the Dutch Golden Age’, Economic
History Review,
Hanus, Jord (2009), Een efficiënte pre-industriële kapitaalmarkt? Het vroeg zestiende-eeuwse 's-
Hertogenbosch als voorbeeld, Tijdschrift voor Sociale en Economische Geschiedenis 3, 82-113.

22
Hart, M. ‘t, J.P.B. Jonker and J.L. van Zanden. (1997). A Financial History of the Netherlands.
Cambridge: Cambridge University Press.
Heijden, Manon van der. Geldschieters van de stad. Financiële relaties tussen stad, burgers en
overheden 1550-1650. Amsterdam: Bert Bakker, 2006.
Hoffman, P.T., G. Postel-Vinay and J.L. Rosenthal. (1998). “What do Notaries do? Overcoming
Asymmetric Information in Financial Markets: The Case of Paris, 1751”, Journal of Institutional
and Theoretical Economics 154, 499-530.
Hoffman, P.T., G. Postel-Vinay and J.L. Rosenthal. (1999). “Information and Economic History: How
the Credit Market in Old Regime Paris Forces Us To Rethink the Transition to Capitalism”, The
American Historical Review 104:1, 69-94.
Hoffman, Ph. T., G. Postel-Vinay, and J.-L. Rosenthal. Priceless markets. The Political Economy of
Credit in Paris, 1660-1870. Chicago: University of Chicago Press, 2000.
Hoffman, Ph. T., G. Postel-Vinay, and J.-L. Rosenthal. “Entry, information, and financial
development: A century of competition between French banks and notaries”, Explorations in
Economic History, forthcoming (2015)
Hoof, van. (2015)*
Houtman De Smedt, Gamel*
Israel, J.I. (1995). The Dutch Republic: Its Rise, Greatness, and Fall 1477-1806. Oxford: Clarendon
Press.
Levine, R. (1997). “Financial development and economic growth: views and agenda”, Journal of
Economic Literature 35, 688-726.
Levine, R., ‘Bank-based or market-based financial systems: which is better?’, in: Journal of financial
intermediation 11 (2002), 398-428
Lourens, P. and J. Lucassen. (1997). Inwoneraantallen van Nederlandse steden ca. 1300-1800.
Amsterdam: NEHA.
McCants, A.E.C. (2007a). “Goods at Pawn: The Overlapping Worlds of Material Possessions and
Family Finance in Early Modern Amsterdam”, Social Science History, 31:2, 213-238.
McCants, A.E.C. (2007b). “Inequality among the poor of eighteenth century Amsterdam”,
Explorations in Economic History, 44, 1-21.
Merton, Robert C. and Zvi Bodie (1995). ‘A conceptual framework for analyzing the financial
environment’, in: D.B. Crane et al., ed., The global financial system, a functional perspective
(Harvard Business School: Boston, 1995) 3-32
Muldrew, C. (1988). The Economy of Obligation: The Culture of Credit and Social Relations in Early
Modern England. Basingstoke.
Munro, John H., ‘The Medieval Origins of the Financial Revolution: Usury, Rentes, and
Negotiablity’,The International History Review, 25:3 (September 2003), 505-62.
Neal, L. (1990). The Rise of Financial Capitalism: International Capital Markets in the Age of
Reason. Cambridge: Cambridge University Press.
Nève, P.L. ‘Het notariaat in de Habsburgse Nederlanden’, in: A.F. Gehlen en P.L. Nève, ed., Het
notariaat in de Lage Landen (± 1250-1842) (Kluwer: Deventer 2005) , 37-76.
Petram, L.O. (2014). The World's First Stock Exchange (New York).
Poterba, J.M. (2005). “Annuities in Early Modern Europe”, in: Goetzmann, W.N., and K.G.
Rouwenhorst. (2005). The Origins of Value: The Financial Innovations that Created Modern
Capital Markets. New York: Oxford University Press, 207-224.
Puttevils, Jeroen (2015a). Merchants and trading in the sixteenth century : the Golden Age of
Antwerp London: Pickering & Chatto.
Puttevils Jeroen (2015b), “Tweaking financial instruments : bills obligatory in sixteenth-century
Antwerp”, Financial history review 22:3 (2015), 337-361.
Quinn, S. and W. Roberds. (2007). “The Bank of Amsterdam and the Leap to Central Bank Money”,
The American Economic Review, 97:2, 262-265.
Rousseau, P.L. and R. Sylla. (2007). “Financial Systems, Economic Growth, and Globalization”, in:
Globalization in Historical Perspective, Ch. 8. Chicago: University of Chicago Press.

23
Schnapper, B., Les rentes au XVIe siècle. Histoire d'un instrument de crédit, Paris, Université de Paris,
(1956).
Sneller, Twentsche*
Soly, Hugo. “De schepenregisters als bron voor de conjunctuurgeschiedenis van Zuid- en
Noordnederlandse steden in het Ancien Régime”, in: Tijdschrift voor Geschiedenis, 87, 1974, 521-
544.
Soly, Hugo (1977), Urbanisme en kapitalisme te Antwerpen in de 16de eeuw: de stedebouwkundige en
industriële ondernemingen van Gilbert van Schoonbeke, Brussel, Gemeentekrediet.
Sprenger, Notariaat*
Stiglitz, J.E. and A. Weiss. (1981). “Credit Rationing in Markets with Imperfect Information” The
American Economic Review 71:3, 393-410.
Sylla, R. (2002). “Financial systems and economic modernization”, The Journal of EconomicHistory,
62, 277–92.
Sylla, R., and G. Toniolo, eds., Patterns of European industrialization, the nineteenth century
(Londen 1991)
Sylla, R., 'The role of banks', in: Sylla and Toniolo, Patterns of European industrialization, 45-63.
Tracy, J.D. (1985). A financial revolution in the Habsburg Netherlands: renten and renteniers in the
county of Holland, 1515–1565. California: Berkeley.
Wee, Herman van der. “Anvers et les innovations de la technique financière aux XVIe et XVIIe siècles.”
Annales ESC, 22, no. 5 (1967) : 1067-89.
Wee, Herman van der; and J. Materné. “Het kredietsysteem in Brabant tijdens de late middeleeuwen
en in het begin van de nieuwe tijd”, In: Bankieren in Brabant*** (1987), 59-78.
Vries, J. de, and A.M. van der Woude. (1997). The first modern economy: success, failure, and
perseverance of the Dutch economy, 1500-1815. Cambridge: Cambridge University Press.
Vries, J. de. (2000). “Dutch economic growth in comparative-historical perspective, 1500-2000”, De
Economist, 148:4, 443-467.
Zanden, J.L. van, J. Zuijderduijn and T. de Moor. (2012). “Small is beautiful: the efficiency of credit
markets in the late medieval Holland”, European Review of Economic History, 16, 3-22.
Zuijderduijn, J. and T. de Moor. (2013). “Spending, saving, or investing? Risk management in
sixteenth-century Dutch households”, Economic History Review, 66:1, 38-56.
Zuijderduijn, J. “Conjunctuur in laatmiddeleeuws Haarlem. Schepenregisters als bron voor de
economische ontwikkeling van een Hollandse stad”, Tijdschrift Holland 40: 1 (2008), 3-17
Zuijderduijn, Jaco (C.J.). Medieval capital markets, markets for renten, state formation and private
investment in Holland (1300-1550). Leiden: Brill, 2009).

24
Figure 1. Estimated Number of Annuities and Other Loans per 1,000 Inhabitants
Recorded by Aldermen in Six Cities (1500-1780)
Source: EURYI/VIDI database ; extrapolation based on sampling for Amsterdam and Antwerp; the
graph includes credit transactions recorded by Ghent notaries between 1620 and 1780
Figure 2. Public Debt Issues and Private Loans Recorded by Aldermen and Notaries in Leyden and Amsterdam, 1600-1780
Source***
25
Table 1. Annual number of loans recorded by aldermen and notaries in six cities,
1500-1780
ALDERMEN 1500 1540 1580 1620 1660 1700 1740 1780
Ghent 748 499 112 105 56 13 1 20
Antwerpa 775 777 445 534 574 288 152 185
Den Bosch 972 955 211 485 170 273 80 29
Utrecht 50 76 184 92 43 97 48
Leyden 160 190 73 155 61
Amsterdamb 83 640 807 320 490 476
2,495 2,281 927 2,108 1,889 1,010 975 819
NOTARIES 1500 1540 1580 1620 1660 1700 1740 1780
Ghent 7 257 437 302 444
Antwerp 14 2 59 272 479 148 162
Den Bosch 31 125 128 216
Utrecht 3 9 64 81 93 193
Leyden 6 58 636 79 47 44
Amsterdam 52 354 176 386 239
14 11 185 1,614 1,377 1,104 1,298
TOTAL 1,523 1,340 938 2,293 3,503 2,387 2,079 2,117
Source: EURYI-VIDI database. (a) extrapolated from samples of the city´s schepenregisters: 1500 (45.8%), 1540 (34.1%), 1580 (21.1%), 1620 (29.4%), 1660 (40.4%), 1700 (45.5%), 1740 (53.9%), 1780 (26.0%). (b) based on all contracts recorded in the city´s rentenboeken from 1580 onwards, plus, from 1620 onwards, a 20% sample of the schepenkennissen.

26
Table 2. The Annual Value of Credit Transactions Recorded by Aldermen and
Notaries in Six Cities in Guilders and (in brackets) per Capita, 1500-1780.
ALDERMEN 1500 1540 1580 1620 1660 1700 1740 1780
Ghent 28,551 31,711 28,367 50,927 57,227 18,760 5,400 66,900 (0.63) (0.53) (0.68) (1.38) (1.18) (0.38) (0.12) (1.31)
Antwerp 90,610 166,989 234,113 484,511 778,814 408,832 133,514 203,666 (2.75) (3.04) (2.86) (8.97) (13.66) (6.22) (2.14) (3.39)
Den Bosch 30,291 193,161 79,135 148,010 57,338 16,313 (1.71) (10.73) (8.79) (13.72) (4.56) (1.27)
Utrecht 5,503 20,100 96,243 94,483 33,750 115,840 50,224 (0.23) (0.73) (3.21) (3.15) (1.22) (4.59) (1.56)
Leyden 75,373 214,892 57,927 119,128 48,414 (1.68) (3.21) (0.85) (3.13) (1.56)
Amsterdam 406,675 1,261,397 685,024 1,562,757 1,326,288 (3.88) (7.10) (2.97) (7.10) (6.00)
TOTAL
NOTARIES 1500 1540 1580 1620 1660 1700 1740 1780
Ghent 3,823 226,044 469,845 437,828 994,755
(0.10) (4.66) (9.44) (9.88) (19.41)
Antwerp 3,153 122 60,773 323,862 427,321 138,768 483,575
(0.06) (0.00) (1.13) (5.68) (6.50) (2.22) (8.05)
Den Bosch 22,153 84,179 133,203 254,584
(2.46) (7.80) (10.59) (19.83)
Utrecht 2,997 3,125 58,655 66,415 151,252 306,002
(0.11) (0.10) (1.96) (2.40) (5.99) (9.48)
Leyden 19,963 573,157 78,391 131,188 109,501
(0.45) (8.55) (1.14) (3.44) (3.54)
Amsterdam 42,063 424,538 316,814 1,233,505 2,440,931
(0.40) (2.39) (1.37) (5.61) (11.04)
TOTAL
Source: see Table 1.
27
Table 3. The notaries’ share in total loan amounts, 1500-1780
1540 1580 1620 1660 1700 1740 1780
Ghent 0.0 0.0 7.0 79.8 96.2 98.8 93.7
Antwerp 1.9 0.1 11.1 29.4 51.1 51.0 70.4
Den Bosch 0.0 0.0 21.9 36.3 69.9 94.0
Utrecht 0.0 13.0 3.1 38.3 66.3 56.6 85.9
Leiden 0.0 20.9 72.7 57.5 52.4 69.3
Amsterdam 9.4 25.2 31.6 44.1 64.8
Source: EURYI/VIDI database
Table 4. Collateral of Loans Recorded by Aldermen and Notaries, 1500-1780
Collateral type Alderman Alderman Notaries Ghent Other Notaries Annuities Other loans All loans All loans
Special mortgage 1,231 48,8% 168 7,0% 25 1,9% 514 13,5%
Real estate 1,177 46,7% 113 4,7% 0 0,0% 106 2,8% Financial assets 25 1,0% 6 0,2% 11 0,8% 209 5,5% Other 29 1,2% 49 2,0% 14 1,1% 199 5,2%
Special + general mortgage 833 33,0% 825 34,2% 731 55,6% 470 12,3%
Real estate 787 31,2% 632 26,2% 625 47,5% 267 7,0% Financial assets 22 0,9% 24 1,0% 87 6,6% 135 3,5% Other 24 1,0% 169 7,0% 19 1,4% 68 1,8%
General mortgage 457 18,1% 1,421 58,9% 559 42,5% 2,831 74,2%
All contracts 2,521 100% 2,414 100% 1,315 100% 3,815 100%
Source : EURYI/VIDI database

28
Table 5. Professions of Debtors and Creditors in Loans Recorded by Aldermen and
Notaries in Six Cities, 1500-1780
1500-1620 1660-1780
Panel A. Debtors aldermen notaries aldermen notaries
(n=1,072) (n=80) (n=493) (n=293)
Craftsmen and laborers 61,5% 45,0% 58,4% 33,8%
Traders 27,7% 38,8% 22,7% 29,4%
Public officials and civil servants 4,1% 6,3% 11,6% 19,5%
Nobility and Clergy 3,5% 3,8% 5,1% 10,6%
Other 3,3% 6,3% 2,2% 6,8%
Panel B. Creditors aldermen notaries aldermen Notaries
(n=994) (n=75) (n=399) (n=1,661)
Craftsmen and laborers 36,3% 21,3% 19,3% 12,3%
Traders 25,5% 62,7% 24,3% 35,8%
Public officials and civil servants 14,0% 12,0% 41,9% 31,7%
Nobility and Clergy 10,5% 2,7% 14,0% 17,3%
Other 13,8% 1,3% 0,5% 2,8%
Table 5a. Widows and Orphans as Debtors and Creditors in Loans Recorded by
Aldermen and Notaries in Six Cities, 1500-1780
1500-1620 1660-1780
Aldermen (n=3,531)
Notaries (n=199)
Aldermen (n=2,315)
Notaries (n=5,393)
Debtors 2,5% 5,5% 3,1% 1,2%
Creditors 11,3% 13,1% 11,8% 13,8%
29
Table 6. The Average Size of Loans Recorded by Aldermen and Notaries in Six Cities
(in guilders), 1500-1780. 20
ALDERMEN 1500 1540 1580 1620 1660 1700 1740 1780
Ghent 38 64 253 485 1,022 1,443 5,400a 3,345 Antwerpa 117 215 526 907 1,357 1,420 878 1,101 Den Bosch 144 398 466 542 717 563 Utrecht 110 264 523 1,027 785 1,194 1,046 Leyden 471 1,131 794 769 794 Amsterdamb 635 1,563 2,141 3,189 2,786
All cities 48 90 338 620 1,316 1,339 2,045 2,090
NOTARIES 1500 1540 1580 1620 1660 1700 1740 1780
Ghent 546 880 1,075 1,450 2,240 Antwerp 225 61 1,030 1,191 892 938 2,985 Den Bosch 715 673 1,041 1,179 Utrecht 999 347 916 820 1,626 1,586 Leyden 344 901 992 2,791 2,489 Amsterdam 809 1,199 1,800 3,196 10,213
All cities 225 284 701 1,009 1,048 2,016 3,536
(a) Ghent 1740 is one observation;
Table 7. Median loan amounts at aldermen and notaries, 1500-1780
Aldermen 1500 1540 1580 1620 1660 1700 1740 1780
Ghenta 25 143 120 288 700 900 5,400 1,800 Antwerp 72 128 203 562 671 900 600 850 Den Bosch 100 150 262 300 538 380 Utrecht 63 184 400 700 500 1,000 600 Leyden 300 800 500 500 500
Amsterdam 320 1,040 1,300 2,200 2,000
Notaries 1500 1540 1580 1620 1660 1700 1740 1780
Ghent 288 480 600 900 1,200 Antwerp 84 61 274 330 300 400 600 Den Bosch 250 300 400 600 Utrecht 372 177 323 600 550 800
Leyden 156 239 500 500 1,400 1,000
Amsterdam 500 600 855 1,300 2,500
20 **Rijen met <200 gld herberekenen, totalen met bedragen lager dan cijfers alle obs, waarmee leningen onder 200 berekend

30
Source : EURYI /VIDI database; (a) one contract
31
Table 8. The Maturity of Loans Recorded by Aldermen and Notaries in Six Cities
(months), 1500-1780.
All contracts 1500 1540 1580 1620 1660 1700 1740 1780
Average 23 20 26 30 24 23 45 50 Median 12 10 12 12 12 12 36 48 N 605 334 61 209 885 796 763 542
Aldermen
Average 23 20 27 38 29 31 70 85 Median 12 10,5 12 24 24 36 72 72 N 605 324 59 146 379 177 241 156
Notaries
Average
28 11 13 21 21 33 36 Median
6 11 11 12 12 18 24
N 10 2 63 506 619 522 386
Source: EURYI/VIDI Database
Table 9. Purpose of Loans Recorded by Aldermen and Notaries in Six Cities, 1500-
1780
Loan purpose Aldermen Aldermen Notaries Notaries
Nr. of loans Value of loans Nr. of loans Value of loans
Business use 629 29% 190,317 15% 651 24% 1,269,560 26%
Cash-in-hand 742 35% 688,911 54% 1508 55% 1,861,647 38%
Real estate 163 8% 162,326 13% 70 3% 113,237 2%
Refinancing 256 12% 184,559 14% 267 10% 1,035,616 21%
Other 351 16% 54,067 4% 223 8% 680,259 14%
Total 2,141 100% 1,280,180 100% 2719 100% 4,960,319 100%
32
Table 10. The average number of deeds per notary per year, 1540-1780
1540 1580 1620 1660 1700 1740 1780
Antwerp 413 35 136 108 70 60 66
Ghent
23 55 36 29 27
Den Bosch 9 32 53 43 54
Utrecht 10 7 55 42 29 33 34
Leiden
147 126 132 52 149 101
Amsterdam 435 350 207 374 425
Source:
Table 11. The estimated Stock of Notarized Loans in selected benchmark years
(1620-1780)
1620 1660 1700 1740 1780
Antwerp 81,486 598,875 747,099 433,418 2,387,651
Ghent 3,823 222,277 854,726 2,426,294
Den Bosch
28,300 91,264 186,595 630,732
Leiden 18,799 2,052,379 335,186 971,887 576,797
Utrecht 2,344 65,449 156,186 262,549 408,512
Amsterdam 47,426 343,168 504,262 2,864,816 5,703,642
Table 12. Notarized loans in Paris, Antwerp and Amsterdam in 1740 (guilders)
Paris Antwerp Amsterdam
Population 576,000 62,500 220,000
Number of loans 6,155 148 386
Loan value 20,406,866 138,768 1,233,505
Per capita 35.4 2.2 5.6
Avg. Loan size 3,315 938 3,196
Avg. maturity (years) 11 3 2.3
Estd stock of debt 241,732,167 433,418 2,864,816
Per capita 420 7 13
Source21
21
Data for Paris: Philip T Hoffman, Gilles Postel-Vinay and Jean-Laurent Rosenthal, “Priceless Markets II: Time
and Space (http://people.hss.caltech.edu/~jlr/events/2013-HPVR.pdf). One livre is 4,45 gram of silver. One guilder is 9,61 gram of silver.
33
Table 13. The Interest Rate on Loans Contracted by Aldermen and Notaries in Six
Cities in the Low Countries, 1500-1780
1500 1540 1580 1620 1660 1700 1740 1780
HOLLAND BILLS 12.00 6.25 4.00 3.00 2.47 2.58
ALDERMEN Average 8.13 5.51 6.12 4.87 4.76 3.84 3.96 Median 8.13 6.25 6.25 5.00 5.00 4.00 4.00 Observations 2 5 86 1,249 1,134 941 1,195
NOTARIES Average 7.21 6.51 7.13 6.02 4.73 4.00 3.41 3.71 Median 6.25 6.25 6.25 6.25 5.00 4.00 3.50 3.50 Observations 362 387 221 800 548 336 416 292
Source EURYI/VIDI Database
34
Table 14. Estimation of the output pricing of risk of loans recorded by Aldermen and
Notaries in Six Cities in the Low Countries, 1620-1780
Dependent variable: Interest rate premium
Independent variable Aldermen Notaries Loan size (ln) -0.126*** -0.0824***
(0,017) (0,015)
Family -0.320*** -0.401*** (0,119) (0,059)
Debtor - Non-local 0.203*** 0.0853*** (0,064) (0,028)
Debtor – Foreign 0.346 0.525*** (0,238) (0,165)
Guarantor 0.117 0.119*** (0,078) (0,032)
Collateral - Real estate -0.257** -0.250*** (0,111) (0,045)
Collateral - Movable goods 0.474** 0.494*** (0,202) (0,098)
Collateral - Financial assets -0.066 -0.0399 (0,143) (0,048)
Collateral – Other -0.0767 0.335*** (0,264) (0,116)
N 2367 4599
R-sq 0,351 0,370
adj. R-sq 0,345 0,368
F 105,2 79,93
Note: Robust standard errors in cell below coefficient estimate. Significance levels given as follows: * p<0.10, ** p<0.05, *** p<0.01.