PUBLIC EXPOSE PT TOBA BARA SEJAHTRA Tbk EXPOSE PT TOBA BARA SEJAHTRA Tbk 2 Agenda CSR &...
28
1 Indonesia Stock Exchange Building Jakarta, 18 th December 2013 PUBLIC EXPOSE PT TOBA BARA SEJAHTRA Tbk
Transcript of PUBLIC EXPOSE PT TOBA BARA SEJAHTRA Tbk EXPOSE PT TOBA BARA SEJAHTRA Tbk 2 Agenda CSR &...

1 Indonesia Stock Exchange Building
Jakarta, 18th December 2013
PUBLIC EXPOSE
PT TOBA BARA SEJAHTRA Tbk

2
Agenda
CSR & Environmental Highlights
2
Corporate Profile
4
Performance Highlights
3 Initiatives and Operational Achievements
1

3
Corporate Profile 1

4
Toba specializes in thermal coal production and comprises three operating subsidiaries: Adimitra
Baratama Nusantara (ABN), Indomining (IM) and Trisensa Mineral Utama (TMU), which hold adjacent
concession areas located in East Kalimantan, Indonesia
Toba in Brief
• Substantial and diversified thermal coal
reserves and resources
oJORC-compliant proved and probable reserves of
147 MM tons and measured, indicated and
inferred resources of 236 MM tons
oCoal brands with calorific values ranging from
4,700 - 5,800 Kcal / kg GAR
Reserves
%
• Strong growth profile
oProduced 5.6 MM tons of coal in 2012 and grew to
produce around 5.8-6.4 MM tons of coal in 2013
o Prime location provides the operational cost edge to
grow as a logistical & operational center for the area
oContinued exploration effort to increase our Reserves and
Resources. Current reserves only account for 52% of our
total area has been explored
Revenue (1)
%
EBITDA(1)
%
Resources %
Total: 147 MM Tonnes Total: US$ 443 MM Total: US$ 45 MM Total: 236 MM Tonnes
Note: (1) Last Twelve Month analysis ~ Revenue and EBITDA
ABN 80%
IM 15%
TMU 5%
ABN 66%
IM 16%
TMU 18%
ABN 74%
IM 22%
TMU 6%
ABN 77%
IM 17%
TMU 6%

5
Notes:
1. Son of TS founder, Luhut B. Pandjaitan
2. Figures are rounded off
Ownership Structure
• 20-year Production
Operation Mining Permit
(“IUPOP”) expiring in
December 2029
• IUPOP was converted from
Kuasa Pertambangan
(“KP”) in 2009
• IUPOP expires in June 2013
• IUPOP was converted from KP in
2010
• IUPOP extension was completed
in March 2013 (First out of 2
extensions: in 2023, with tenor of
10 years each)
• 13-year IUPOP expires in December
2023
• IUPOP was converted from a KP in
2010
• Plantation permit expires in 2036
• 2,990 ha • 683 ha • 3,414 ha • 8,633 ha (Right to Use Land)
• Reserves: 117MT- JORC
• Resources: 156MT- JORC
• Reserve: 22 MT- JORC
• Resources: 37MT- JORC
• Reserves : 8 MT - JORC and
additional 7 MT of internal estimate
• Resources: 43 MT- JORC
• Planted Area: 2,896 ha
License
Area
Davit Togar Pandjaitan (1) PT Bara Makmur Abadi PT Toba Sejahtra (“TS”) Roby Budi Prakoso PT Sinergi Sukses Utama
71.8% 0.8% 6.2% 5.1%
PT Toba Bumi Energi (“TBE”)
99.99% (2)
99.99% (2)
3.6%
ABN Minorities
49.0%
51.00% 99.99% (2)
Public
12.5%
Reserve
90.00%
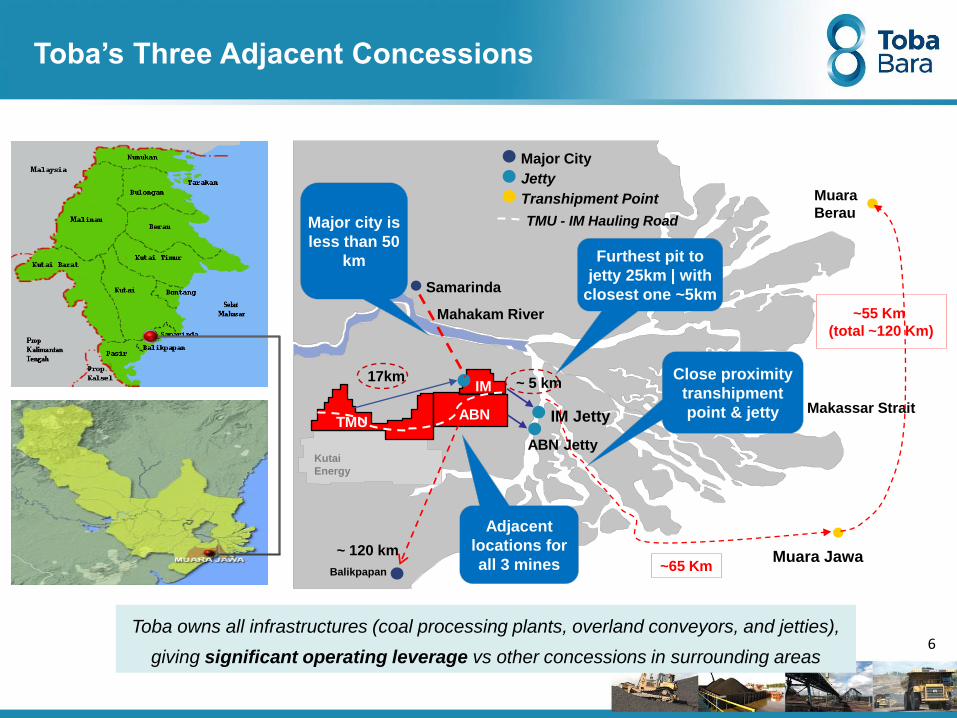
6
Samarinda
Mahakam River
Muara Jawa
Muara
Berau
Makassar Strait
Major City
Jetty
Transhipment Point
~55 Km
(total ~120 Km)
~65 Km
ABN
Kutai
Energy
Adjacent
locations for
all 3 mines
TMU ABN
IM
ABN Jetty
IM Jetty
~ 5 km 17km
Furthest pit to
jetty 25km | with
closest one ~5km
Major city is
less than 50
km
Close proximity
transhipment
point & jetty
Toba owns all infrastructures (coal processing plants, overland conveyors, and jetties),
giving significant operating leverage vs other concessions in surrounding areas
Balikpapan
TMU - IM Hauling Road
~ 120 km
Toba’s Three Adjacent Concessions

7
Initial Public Offering
Listed on IDX 06 July 2012
Number of Shares Offered 210,681,000 shares or 10.47%
IPO Proceed IDR 400,293,900,000
Anchor Investor Baring Private Equity Asia (8% at IPO)
Ticker Code TOBA

8
Performance Highlights 2

Key Message
Maximizing productivity and
coal sales amid weak coal
industry
Proven production achievement
where in September 2013 posted
13.3% YoY increase from 2012, or
75.4% from 2013 production
target of 5.8 – 6.4 million tons
Undergoing continuous
efficiency program to
improve profitability and
competitiveness
A series of projects have been
completed throughout 2013 to
facilitate efficiency program,
including “hauling road” and
“underpass”
Increasing financial
capability to foster corporate
growth
Good financial standings with cash
position reaching US$ 45,5 million
or an increase of 25% from
December 2012, supported by
available loan facilities from
internationally reputable banks
Supporting and actively
being involved in Corporate
Social Responsibility (CSR)
Actively participating in the
development in CSR, and receiving
several mining proper awards in
2013
9

Achievements in 9M 2013
Operational (in million tons) 9M13 9M12 Changes
Production 4.6 4.1 13%
Sales 4.4 3.7 20%
Stripping Ratio (x) 13.7 16.0 -14%
Sales 297.5 283.4 5%
EBITDA* 40.1 22.6 78%
Net Profit 19.7 15.9 23%
Financial (in US$ million) 9M13 9M12 Changes
Note : Company’s achievements in 9M 2013 and 9M 2012
(*) EBITDA = Gross Profit – Selling & Marketing Expenses and G&A + Depreciation and Amortization
67.4
10
Newc. Index 100.1 -14% 85.7
Average Selling Price 77.2 -13%

Annual Coal Production In Million Tons
Operational Data
2008 2009 2010 2011 2012 2013
TMU IM ABN
*4.5 mt
5,6 mt 5,2 mt
4,0 mt
2,0 mt
0,8 mt
~ 6,4 mt • Production volume rose
significantly from only
800,000 tons in 2008 to ~5.8
– 6.4 mm tons in 2013
• Stripping Ratio fell from
14.9x in 2012 to 13.7x in
2013
• TMU’s production increased
from only 32,000 tons/month
in January 2013 to high of
109,000 tons in September
2013
Q1-Q
3 2
013
Q4 2
013
Note: * In 9M 2013
2008 2009 2010 2011 2012 9M13*
Production Volume ('milliion ton) 0,8 2,0 4,0 5,2 5,6 4,6
ABN 0,1 1,1 3,1 3,8 4,4 3,1
IM 0,7 0,9 1,0 1,4 1,0 1,0
TMU - - - 0,0 0,2 0,5
Total Overburden ('million bcm) 9,5 20,7 39,8 65,9 83,5 62,9
Stripping Ratio (x) 11,9 10,5 9,9 12,7 14,9 13,7
Production
achievement >10
million tons
Production
Achievement >20
million tons
11
Solid Operating Track Record

..Coinciding with Decreasing Cash Cost
Significant decrease in FOB vessel cash cost from US$ 65.1/ton in 9M12 to US$ 54.4/ton in 9M13,
whereby mining cost (overburden removal and dump distance) accounts for its two major cost
components
Quarterly FOB Vessel Cash Cost In US$/ton
Notes (1) FOB Vessel Cash Cost = COGS including royalty and selling expenses – depreciation and amortization
(2) Adj. FOB vessel cash costs = COGS, including selling & marketing expense and royalty – depreciation & amortization of exploration & development and excluding deferred stripping cost 12
Profitability
283.4
297.5
9M-12 9M-13
22.6
40.1
9M-12 9M-13
16.0
19.7
9M-12 9M-13
Revenue EBITDA Net Profit
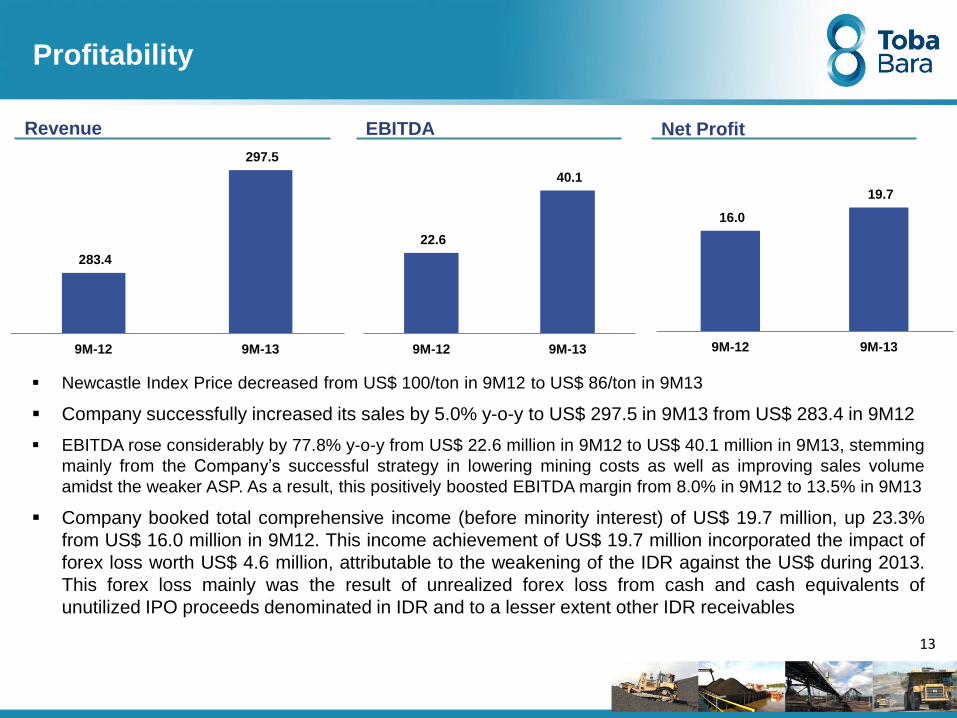
Newcastle Index Price decreased from US$ 100/ton in 9M12 to US$ 86/ton in 9M13
Company successfully increased its sales by 5.0% y-o-y to US$ 297.5 in 9M13 from US$ 283.4 in 9M12
EBITDA rose considerably by 77.8% y-o-y from US$ 22.6 million in 9M12 to US$ 40.1 million in 9M13, stemming
mainly from the Company’s successful strategy in lowering mining costs as well as improving sales volume
amidst the weaker ASP. As a result, this positively boosted EBITDA margin from 8.0% in 9M12 to 13.5% in 9M13
Company booked total comprehensive income (before minority interest) of US$ 19.7 million, up 23.3%
from US$ 16.0 million in 9M12. This income achievement of US$ 19.7 million incorporated the impact of
forex loss worth US$ 4.6 million, attributable to the weakening of the IDR against the US$ during 2013.
This forex loss mainly was the result of unrealized forex loss from cash and cash equivalents of
unutilized IPO proceeds denominated in IDR and to a lesser extent other IDR receivables
13

14
Consolidated Balance Sheet
The Company’s asset stood at US$ 289.8 million in 9M13 or up 10.8% from US$ 261.5 as per end-
December 2012. Such growth predominantly resulted from a build-up in cash and equivalents of US$
9.2 million, inventories of US$ 7.9 million, and fixed assets of US$ 8.3 million.
Total Liabilities rose by 11.4% y-o-y to US$ 167.7 million in 9M13 from US$ 150.6 million as per 31st
December 2012 and interest bearing debt (loans) expanded by 20.2% to US$ 58.9 million in 9M13 from
US$ 49.0 million as per end of 2012.
Total Equity in 9M13 increased 10.1% to US$ 122.1 million from US$ 110.94 million as per end-2012,
and this was attributable to additional income for the period.
Consolidated Balance Sheet In Thousand US$
Net Debt Position In Million US$
Net Debt
to Equity 2% 34% 6% 11% Net
Cash 3% 11%
Dec-12 Sep-13 % Changes
Cash and cash equivalents 36.307 45.470 25%
Fixed asset - net 34.053 42.391 24%
Others 191.166 201.976 6%
Total Assets 261.526 289.837 11%
Trade payables 58.362 66.836 15%
Net Debt 49.035 58.915 20%
Advances from customers 11.625 10.821 -7%
Others 31.560 31.134 -1%
Total Liabilities 150.582 167.706 11%
Total Equity 110.944 122.131 10%

15
Sales and Marketing
Up to September 2013, Toba has sold its coal to several notable countries in Asia such as: China,
Taiwan, India, and Vietnam. Its sales reached 72,1% of its production target for 2013 at fixed prices
* In first 9M2013, and includes sales from subsidiaries of 200,000 tons
South Korea
11%
Japan
Hong Kong
Vietnam
Thailand
Taiwan
24%
China
41%
India
14%
2011 2012 2013*
Sales (million ton)
ABN 3,7 4,1 3,2
IM 1,8 1,1 0,9
TMU - 0,2 0,4
Total 5,5 5,5 4,4
(1) Sales to export destinations ie. Vietnam, Thailand , Hong Kong and Japan each
below 3%
Malaysia
Total Sales: 4.4 MT

16
Average Selling Price
(US$)
Source : Global Coal
Note: ASP for first 9M2013
Newcastle Index declined by 29% from US$ 121,2/ton in 2011 to US$ 85,7/ton in 2013
Comparatively, Toba’s ASP corrected 26% from US$ 91,3/ton in 2011 to US$ 67,4/ton in 2013

17
Strong Relationships with Multinational Customers
Major Customers
DRAGON ENERGY GROUP
Major customers provide the stable
business support for Toba’s marketing…
… minimum marketing fees because Toba
handles our own marketing internally
Toba’s Marketing Operations
Central Marketing Operations of all 3
subsidiaries
Internally developed customer base
that allows Toba to have low marketing
costs
Balance mix of long term contracts,
short term and spot
Active participation in reputable
conference and trade shows to promote
Toba brand
Enhance marketing strategy to sell
directly to end-users

18
Initiatives and Operational Achievements 3

Corporate Strategy
Continued focus on health, safety, environment, and CSR
Relationship improvement and development with
existing and new customer base
Increase in production level on continuous
basis
Operational integration between all three mines
Growth in reserves and resources
Major Strategic Factors
The Company is currently faced with weak
coal industry due to low global coal prices
Strategic Initiatives :
Underwent cost efficiency via lower SR and
reducing OB dump distance
Built and completed hauling road from TMU to
IM
Optimized use of integrated infrastructure:
CPP and Jetty
Maximized use of fuel
Maximized sales through coordinated sales
force
Increasing Profitability and Reserve for Production Continuity
19
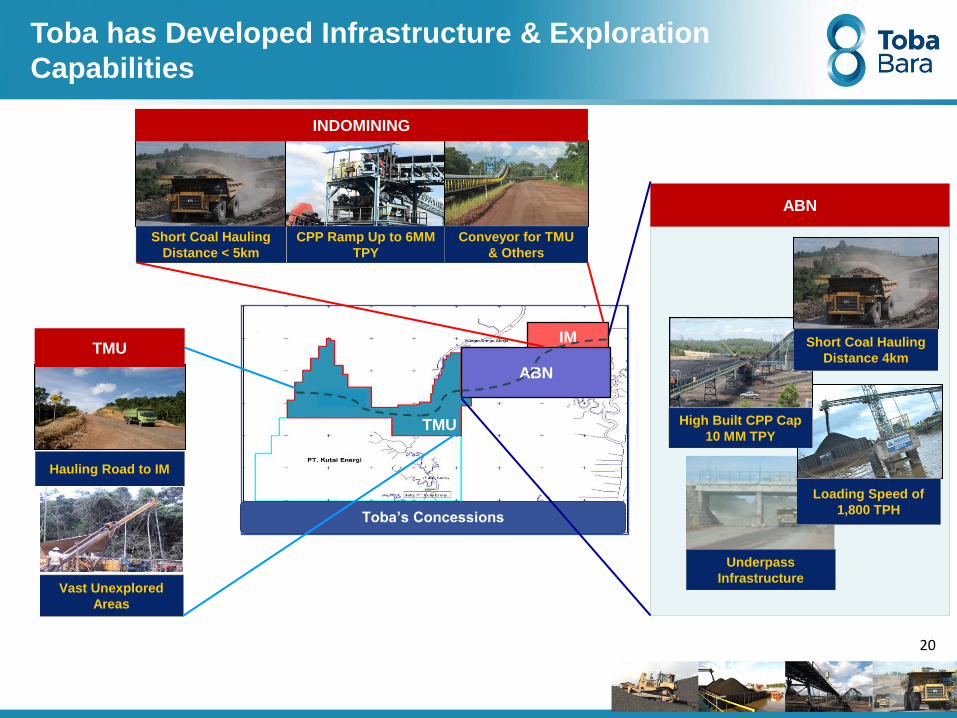
Underpass
Infrastructure
Loading Speed of
1,800 TPH
20
High Built CPP Cap
10 MM TPY
Hauling Road to IM
Vast Unexplored
Areas
Short Coal Hauling
Distance < 5km
CPP Ramp Up to 6MM
TPY
Conveyor for TMU
& Others
Short Coal Hauling
Distance 4km TMU IM
ABN
TMU
Toba’s Concessions
ABN
TMU
Toba has Developed Infrastructure & Exploration
Capabilities
INDOMINING

Infrastructure Achievements in 2013
TOBA continues its strategy to lower cost via, inter alia, investment in infrastructure
Project Background Future Benefits %
Completion Actual
Hauling road from
TMU to IM
To streamline
logistical flow for
TMU
To obtain cost efficiency and
allow for TMU production
ramp up
100% Q2-2013
Underpass at ABN To support
infrastructure
facilities at ABN
To lower OB overhaul dump
distance 100 % Q4-2013
Initial Target
Q3-2013
CPP at IM To increase coal
production capacity
at IM from 3 mn tons
per annum to 6 mn
tpa
To process TMU’s coal ,
reduce costs, and enhance
and boost stockpile capacity
of up to 16 tpa from 13 tpa
presently
91 % In finalization
stage
Q3-2013
Q4-2013
Workshop at ABN To require
maintenance and
repair facilities for
mining equipment
To ensure streamlined
operational activities related
to heavy equipment and
supporting equipment
100 % Q4-2013 Q4-2013
21
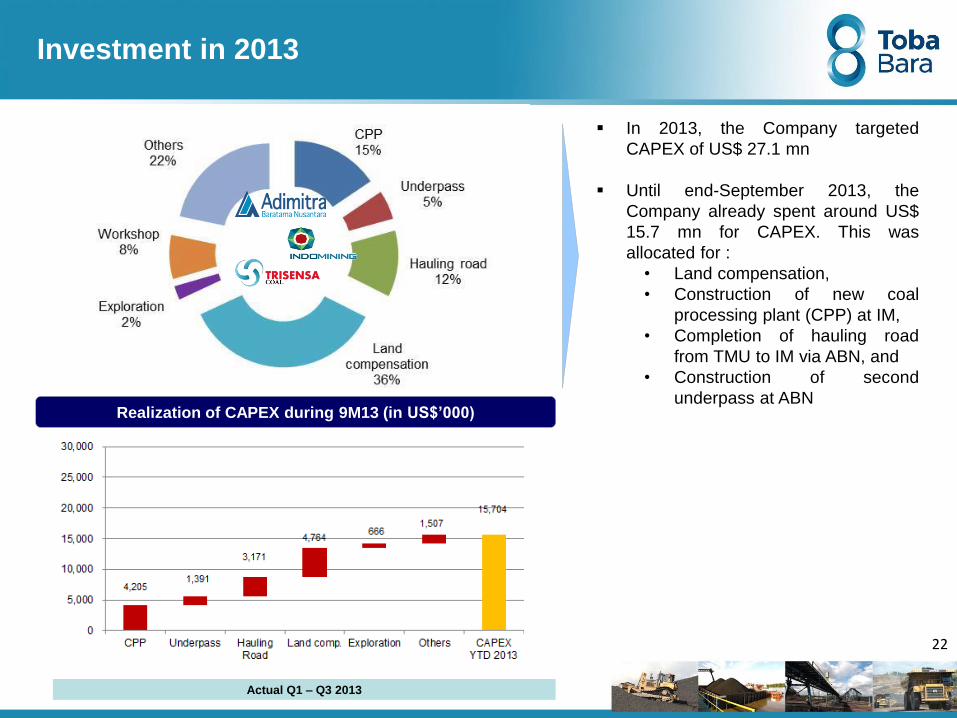
Investment in 2013
In 2013, the Company targeted
CAPEX of US$ 27.1 mn
Until end-September 2013, the
Company already spent around US$
15.7 mn for CAPEX. This was
allocated for :
• Land compensation,
• Construction of new coal
processing plant (CPP) at IM,
• Completion of hauling road
from TMU to IM via ABN, and
• Construction of second
underpass at ABN Realization of CAPEX during 9M13 (in US$’000)
Actual Q1 – Q3 2013
22

Investment Plans for 2014
For 2014, the Company has allocated
CAPEX worth around US$ 8 mn, and can
reach up to US$15,5 mn should there
occur speedy land compensation
The Company has prioritized the CAPEX
on TMU with exploration and land
compensation accounting for around 55%
of total CAPEX for 2014
Investment plans are focused on growth and continuous production
CAPEX 2014
Total: US$ 8.0 – 15.5 mn
Conveyor 48%
Machinery and heavy equipment
23%
Exploration 7%
Port facilities
9%
Others 13%
Mahinery and heavy
equipment 46%
Building 41%
Exploration 8%
Others 5%
23

24
CSR & Environmental Highlights 4

25
• Toba is continuously developing and implementing its corporate social responsibility programs
– Creating educational opportunities for local communities including renovating schools, training teachers,
providing post-graduate educational assistance and creating a literacy program for adults and a scholarship
program for school-aged children
– Providing health services to the local communities
– Helping groups of farmers plant crops of vegetables and bamboo and assisting with land rehabilitation
– Creating local employment opportunities by sourcing some of the Company’s site workforce from the
neighboring areas
Helping Farmers Plant Crops Creating Educational Opportunities Providing Health Services
Toba is Committed to Being a Responsible
Corporate Citizen

2007 2008 2009 2010
2
0
1
1
Target
PROPER Mining Award for
ABN, IM, & TMU
26
Award and Recognition
ABN
East Kalimantan PROPER Green
Mining Award
2012 2014 2011
Ernst and Young
Social
Entrepreneur of
the Year 2011
2013
Indomining
East Kalimantan PROPER Blue
Mining Award
PT Toba Bara Sejahtra Tbk Ranks as one of Indonesia’s Top
50 companies
!

THANK YOU
27

28
Appendix - Evolution of FOB Vessel Cash Cost
on Quarterly Basis
ABN
IM
3Q 2013 2Q 2012 3Q 2012 4Q 2012
Adj. FOB vessel
cash cost (b) US$51/ton US$73/ton US$64/ton
US$50/ton US$64/ton US$49/ton
SR 12,7x 17,1x 14,7x 12,6x
14,7x 14,5x 13,1x 10,5x
14,2x
12,9x
US$56/ton
US$53/ton
US$51/ton
US$61/ton
Notes (a) FOB vessel cash costs: COGS, Selling Expenses, Royalty,excluding depreciation fixed assets and amortization of exploration and development
(b) Adj. FOB vessel cash costs: COGS, Selling Expenses, Royalty excluding depreciation fixed asset and amortization of exploration and development asset &
without accounting for component of deferred striping cost
FOB vessel
cash cost (a) US$57/ton US$68/ton US$61/ton US$57/ton US$56/ton
US$60/ton US$71/ton US$57/ton US$57/ton US$57/ton Adj. FOB vessel
cash cost (b)
SR
FOB vessel
cash cost (a)
TMU
Adj. FOB vessel
cash cost (b)
SR
FOB vessel
cash cost (a) US$38/ton US$69/ton US$64/ton
10,4x 14,4x 10,9x 10,8x 12,7x
US$42/ton US$66/ton
US$42/ton US$56/ton US$41/ton US$52/ton US$64/ton
1Q 2013
16,6x
11,3x
US$62/ton
US$57/ton
US$56/ton
US$55/ton
11,2x
US$44/ton
US$49/ton
2Q 2013