Public Expenditure and Financial Accountability (PEFA ... · 1 Public Expenditure and Financial...
102
1 Public Expenditure and Financial Accountability (PEFA) Assessment Greater Amman Municipality, The Hashemite Kingdom of Jordan FINAL REPORT October 2017
Transcript of Public Expenditure and Financial Accountability (PEFA ... · 1 Public Expenditure and Financial...
1
Public Expenditure and
Financial Accountability (PEFA) Assessment
Greater Amman Municipality, The Hashemite Kingdom of
Jordan
FINAL REPORT
October 2017
2
Contents
ACRONYMS AND ABBREVIATIONS ................................................................................................ 3
EXECUTIVE SUMMARY .................................................................................................................. 5
1 INTRODUCTION .................................................................................................................... 11
1.1 RATIONALE AND PURPOSE .............................................................................................................. 11
1.2 ASSESSMENT MANAGEMENT AND QUALITY ASSURANCE ....................................................................... 11
1.3 ASSESSMENT METHODOLOGY ......................................................................................................... 12
2 COUNTRY BACKGROUND INFORMATION .............................................................................. 15
2.1 COUNTRY ECONOMIC SITUATION ..................................................................................................... 15
2.2 FISCAL AND BUDGETARY TRENDS ...................................................................................................... 18
2.3 LEGAL AND REGULATORY ARRANGEMENTS FOR PFM .......................................................................... 19
2.4 INSTITUTIONAL ARRANGEMENTS FOR PFM ........................................................................................ 22
2.5 OTHER IMPORTANT FEATURES OF PFM AND ITS OPERATING ENVIRONMENT ........................................... 22
3 ASSESSMENT OF PFM PERFORMANCE ................................................................................... 23
SUBNATIONAL INDICATOR ....................................................................................................................... 23
PILLAR I. BUDGET RELIABILITY .................................................................................................................. 24
PILLAR II. TRANSPARENCY OF PUBLIC FINANCES .......................................................................................... 28
PILLAR III. MANAGEMENT OF ASSETS AND LIABILITIES ................................................................................. 35
PILLAR V. PREDICTABILITY AND CONTROL IN BUDGET EXECUTION .................................................................. 49
PILLAR VI. ACCOUNTING AND REPORTING ................................................................................................. 66
PILLAR VII. EXTERNAL SCRUTINY AND AUDIT .............................................................................................. 70
4 CONCLUSIONS OF THE ANALYSIS OF PFM SYSTEMS ............................................................... 75
4.1 INTEGRATED ASSESSMENT OF PFM PERFORMANCE ............................................................................. 75
4.2 EFFECTIVENESS OF THE INTERNAL CONTROL FRAMEWORK ................................................................... 78
4.3 PFM STRENGTHS AND WEAKNESSES ................................................................................................ 80
4.4 PERFORMANCE CHANGES SINCE A PREVIOUS ASSESSMENT .................................................................... 82
5 GOVERNMENT REFORM PROCESS ......................................................................................... 83
ANNEXES.................................................................................................................................... 86
ANNEX 1: PERFORMANCE INDICATOR SUMMARY ....................................................................... 86
ANNEX 2: SUB-NATIONAL PROFILE, JORDAN ............................................................................... 93
ANNEX 3: SUMMARY OF OBSERVATIONS ABOUT THE INTERNAL CONTROL FRAMEWORK ............ 96
ANNEX 4A: DATA USED FOR SCORING PI-1, 2 & 3 ........................................................................ 98
ANNEX 4B: LIST OF STAKEHOLDERS INTERVIEWED...................................................................... 101
3
Acronyms and Abbreviations
AB Audit Bureau (Jordan’s SAI) AFD Agence Française de
Développement AFS Annual Financial Statements AIPD Audit and Institutional Performance Development ARABOSAI Arab Organization of Supreme Audit Institutions BCC Budget Call Circular BoD Board of Directors BRTS Bus Rapid Transit System CD Customs Department CFS Consolidated Financial Statements CG Central Government CIP Capital Investment Plan CPI Consumer price index CVDB Community and Village Development Bank DoF Department of Finance DoP Department of Planning DSA Debt Sustainability Analysis EDP Executive Development Plan EU European Union FDI Foreign direct investment FMIS Financial Management Information System FY Fiscal Year GAM Greater Amman Municipality GBE Government Business Enterprise GCC Gulf Cooperation Council GDP Gross Domestic Product GFS Government Finance Statistics GFSM Government Financial Statistics Manual GNI Gross national income GoJ Government of Jordan HLG Higher-level government HR Human Resources HRD Human Resources Department IASB International Accounting Standards Board ICAD Internal Control and Audit Department IFAC International Federation of Accountants IFMIS Integrated Financial Management Information Systems IGF Intergovernmental finance IIA Institute of Internal Auditors IMF International Monetary Fund INTOSAI International Organization of Supreme Audit Institutions IPPF International Professional Practice Framework IPSAS International Public Sector Accounting Standards ISSAI International Standards of Supreme Audit Institutions ISTD Income and Sales Tax Department IT Information technology JD Jordanian Dinar KPI Key Performance Indicator MDAs Ministries, Departments, and Agencies MoI Ministry of Interior MoMA Ministry of Municipal Affairs MoPIC Ministry of Planning and International Cooperation MTEF Medium Term Expenditure Framework N/A Not applicable NEPCO National Electricity Power Company
4
NGO Non-Government Organization ODA Official development assistance PE Public Enterprise PEFA Public Expenditure and Financial Accountability PETS Public Expenditure Tracking Survey PFM Public Financial Management PI Performance Indicator PPIAF Public-Private Infrastructure Advisory Facility PPP Public-Private Partnership RCD Revenue Collection Department SAI Supreme Audit Institution STA Single Treasury Account TA Technical assistance TPD Tendering and Procurement Department TSA Treasury Single Account UN United Nations UNHCR United Nations High Commissioner for Refugees USAID United States Agency for International Development US$ United States Dollars WB World Bank
Fiscal year: 1 January
Currency: Dinar ‘JD’ (1 JD = USD 1.41)
5
Executive Summary
Purpose and management of the assessment
The overall objective of this Public Expenditure and Financial Accountability (PEFA)
Assessment was to draft a comprehensive “Public Financial Management Performance
Report” according to the upgraded PEFA Performance Measurement Framework
Methodology of 2016. This involves an analysis of the overall performance of the PFM
systems of the Greater Amman Municipality (GAM) in Jordan. It will also provide an
important baseline against which future progress can be measured.
Assessment coverage and timing
This assessment covered the City Government of GAM. The bulk of the fieldwork took
place in October 2016, with a follow-up visit in February 2017. Most of the indicators were
assessed using data from 2016, as well as the two previously completed fiscal years (FYs).
The first draft of the assessment and the ratings were discussed in detail with the GAM at
a workshop in February 2017. The draft was revised, based on comments from the
workshop. It was then translated into Arabic and shared with the GAM in April 2017. The
GAM reviewed the Arabic draft and provided further comments, which have been
addressed. This updated draft was shared with GAM in June 2017. This report is the
finalized version that now addresses all comments and suggestions received from the
GAM.
Impact of PFM Systems on the three main budgetary outcomes
Aggregate fiscal discipline
Overall, fiscal discipline in the GAM is reasonable, at least when viewed in the context of
the annual budget process currently in place. However, the lack of multi-year fiscal
planning remains an issue, particularly in light of the risks that may arise from the existence
of various long-term, public-private partnership (PPP) arrangements.
Most of the elements in the overall PFM system that contribute to achieving short-term
fiscal discipline appear to be sound. For example, the aggregate outturns of both revenues
and expenditures are close to those in the original budget, although there is an issue about
the variance in the composition of revenue (Performance Indicator [PI]-3.2, rated ‘D’). In
addition, the stock of payment arrears is declining (PI-22), and there are a few unreported
operations (PI-6, rated ‘B’).
There are risks to fiscal discipline (beyond the concern about ‘PPPs’), such as the lack of
a debt management strategy (PI-13.3, rated ‘D’) and the absence of conventional oversight
arrangements (PI-29.2, rated ‘D’). However, it should be noted that these risks are, to a
certain extent, mitigated by the fact that various elements of the system concerned with
budget execution work well. For example, a number of factors contribute to achieving
aggregate fiscal discipline, including: predictability in the availability of resources; most
aspects of procurement; the low level of expenditure arrears; and at least a basic operation
for internal controls.
6
Strategic allocation of resources
The three indicators concerned with ‘policy-based fiscal strategy and budgeting’, (PIs 14 to
16) received poor ratings because current legislation does not require medium-term
budgeting. Hence, it is difficult to demonstrate that the (annual) process of allocating
budgetary resources is in accordance with GAM’s declared strategic objectives. However,
there is a new indicator relevant to this budgetary outcome, namely: ‘Public Investment
Management’ (PI-11). Fortunately, given that almost half of the resources available through
the budget go to capital projects, this indicator is given an overall rating of ‘C+’, which
represents sound practice.
The otherwise-sound budget preparation process is weakened by the absence of ceilings
to guide units when compiling their estimates (PI-17.2, rated ‘D’). It is also weakened by
the limited scope of the scrutiny undertaken by the GAM Council (PI-18.1 and 2, both rated
‘C’). On the positive side, the budget is approved before the start of the financial year, and
the Council does have oversight of any amendments made during the year.
The GAM performs reasonably well in administering its own revenues. Both indicators
concerned with the collection of revenues are under the control of the GAM. Although PI
19 is rated ‘C’ overall, there are weaknesses in some elements pertaining to procedures
that are not formally documented, and where the monitoring of arrears (PI-19.4) is relatively
weak. However, ‘Accounting for revenues’ (PI-20) is highly rated with an ‘A’.
Most of the other indicators that relate to the strategic resource allocation function at a
satisfactory level. However, there is an exception. Although the budget documentation
meets all the ‘basic’ requirements (PI-5, ‘B’), its classification in accordance with
international standards does not (PI-4, ‘D’).
Efficient use of resources for service delivery
Financial management is not an end, but rather a tool to assist a government in delivering
public services to its citizens. From this standpoint, the GAM's PFM system appears to
work reasonably well. This can be seen in the rating for ‘performance information’ (PI-8,
‘B+’), which demonstrates the efficiency with which services are delivered. Of course,
services cannot be delivered in the absence of funds. In this respect, there may be some
concerns associated with the rating for predictability in the availability of funds to support
expenditures (PI-21, ‘C+’). On the other hand, most of the mechanisms in place to reduce
possible leakages in the system — such as internal controls, procurement, and controls
over payroll (PIs 25, 24 and 23 respectively) — are at least reasonable, although ‘Public
Asset Management’ (PI-12) shows a poor level of performance. The Internal Control and
Audit Department requires some improvement in performing according to the modern
concept of Internal Audit (PI-26; ‘C+’). However, this weakness is offset to a significant
extent by the good ratings for the basic accounting controls in place (PI 27, rated ‘B+’).
Lastly, the oversight arrangements (addressed in PIs 30-31) are unusual, in that the Audit
Law (amended in 2002) and the Municipal Law both require the Audit Bureau to audit the
GAM (although no deadline is specified). However, the report of the audit does not go to
the GAM council but to the Parliament, with copies to the Prime Minister and Minister of
Finance. In addition, the GAM has hired a private auditor to report on an annual ‘statement
of revenues and expenses’. The report for 2015 was submitted to the GAM Council at the
beginning of February 2017.
In summary, and given the legal restrictions requiring an annual budget process, most
aspects of the GAM’s PFM system function at a satisfactory level, and should allow it to
attain its short-term fiscal and budgetary objectives. However, there remain areas for
7
improvement — although any sub-national government can only operate within the
confines of the legal framework established by the national government.
Performance changes since last assessment
This is the first assessment of the GAM.
Overview of on-going and planned PFM reforms and identification of main
weaknesses
The Ministry of Municipal Affairs has been working in accordance with its reform strategy
for 2015-2020, which was approved by the Council of Ministers. The strategy contains six
national objectives:
(i) Develop the performance of the municipal sector and enhance its efficiency;
(ii) Enhance service delivery to the local community;
(iii) Contribute to the fight against poverty and employment;
(iv) Contribute toward the achievement of balanced development among governorates and
districts;
(v) Solve environmental problems that are within the responsibility of municipalities and
joint services councils; and,
(vi) Contribute to solving traffic problems in the Kingdom. The strategy aims at significant
municipal reforms, concentrating on three themes: legislative , financial , and
administrative reform.
On the legislative front, major reform has been achieved by the enactment of the Municipal
Law No. 41 of 2015 and the Decentralization Law No. 49 of 2015. The Ministry of Municipal
Affairs (MoMA) had prepared these two laws with the objective of widening public
participation in decision making at the local governmental level, thereby strengthening
decentralization.
The Municipal Law is intended to strengthen the independence of the municipalities and
widen their functions and responsibilities. They also embody the principle of
decentralization through the establishment of local councils. The Decentralization Law is
intended to actualize the national vision of expanding democratic elections at the local level.
It also aims to increase public participation in decision making and implementation,
especially regarding sustainable development. In addition, the law supports the
implementation of administrative decentralization. The municipal elections on August 15,
2017, which were held for the first time in Jordan, will put the decentralization principle into
practice. The hope is that it will address the real needs of the people, and improve service
delivery and standards of living in the governorates and districts.
The financial reform included strengthening the government support to municipalities by
increasing transfers from oil revenues and other channels of support. In this same regard,
on August 13, 2017, the government decided to distribute Jordanian Dinar (JD) 100 million)
to municipalities to help them settle a proportion of their debts. In addition, the MoMA is
providing municipalities with vehicles and equipment in cooperation with the Ministry of
Planning and International Cooperation (MoPIC) and international donors.
The administrative reform includes legislative amendments to assign appointments to the
Civil Service Bureau — and to stop random appointments. There are plans for capacity-
building and training programs, as well as the establishment of new structures to implement
decentralization.
8
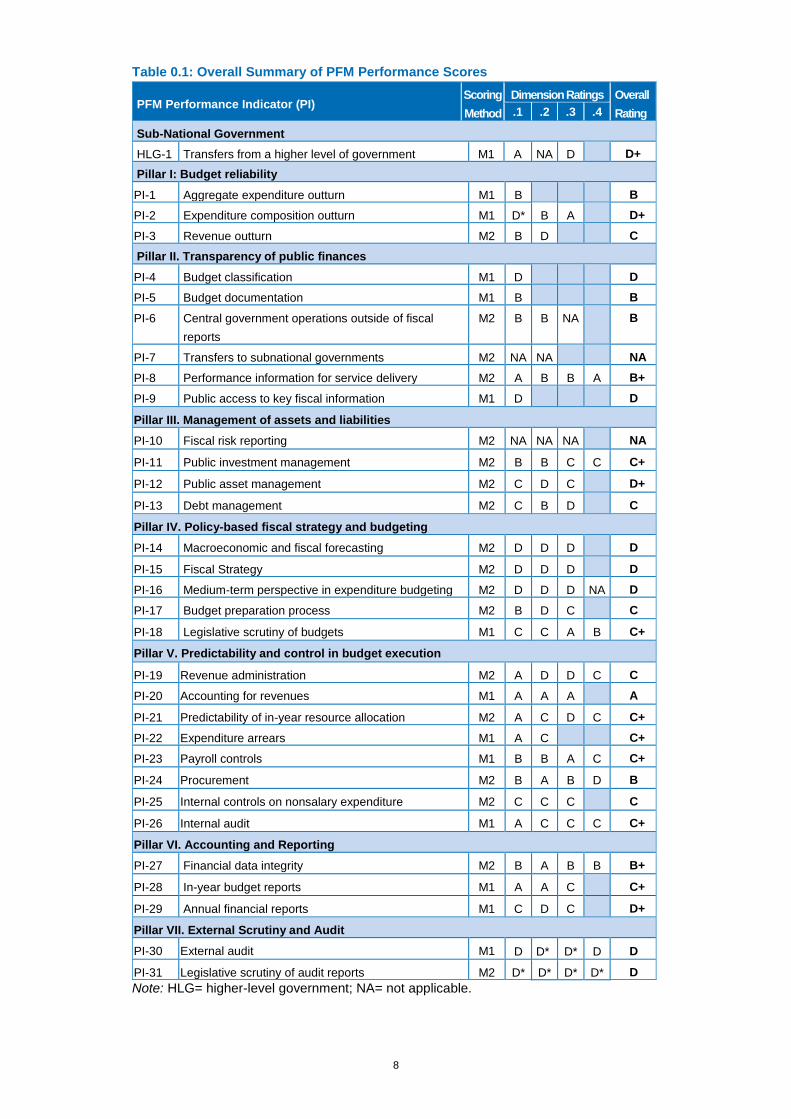
Table 0.1: Overall Summary of PFM Performance Scores
PFM Performance Indicator (PI) Scoring
Method
Dimension Ratings Overall
Rating .1 .2 .3 .4
Sub-National Government
HLG-1 Transfers from a higher level of government M1 A NA D D+
Pillar I: Budget reliability
PI-1 Aggregate expenditure outturn M1 B B
PI-2 Expenditure composition outturn M1 D* B A D+
PI-3 Revenue outturn M2 B D C
Pillar II. Transparency of public finances
PI-4 Budget classification M1 D D
PI-5 Budget documentation M1 B B
PI-6 Central government operations outside of fiscal
reports
M2 B B NA B
PI-7 Transfers to subnational governments M2 NA NA NA
PI-8 Performance information for service delivery M2 A B B A B+
PI-9 Public access to key fiscal information M1 D D
Pillar III. Management of assets and liabilities
PI-10 Fiscal risk reporting M2 NA NA NA NA
PI-11 Public investment management M2 B B C C C+
PI-12 Public asset management M2 C D C D+
PI-13 Debt management M2 C B D C
Pillar IV. Policy-based fiscal strategy and budgeting
PI-14 Macroeconomic and fiscal forecasting M2 D D D D
PI-15 Fiscal Strategy M2 D D D D
PI-16 Medium-term perspective in expenditure budgeting M2 D D D NA D
PI-17 Budget preparation process M2 B D C C
PI-18 Legislative scrutiny of budgets M1 C C A B C+
Pillar V. Predictability and control in budget execution
PI-19 Revenue administration M2 A D D C C
PI-20 Accounting for revenues M1 A A A A
PI-21 Predictability of in-year resource allocation M2 A C D C C+
PI-22 Expenditure arrears M1 A C C+
PI-23 Payroll controls M1 B B A C C+
PI-24 Procurement M2 B A B D B
PI-25 Internal controls on nonsalary expenditure M2 C C C C
PI-26 Internal audit M1 A C C C C+
Pillar VI. Accounting and Reporting
PI-27 Financial data integrity M2 B A B B B+
PI-28 In-year budget reports M1 A A C C+
PI-29 Annual financial reports M1 C D C D+
Pillar VII. External Scrutiny and Audit
PI-30 External audit M1 D D* D* D D
PI-31 Legislative scrutiny of audit reports M2 D* D* D* D* D
Note: HLG= higher-level government; NA= not applicable.

9
10
Public Expenditure and Financial Accountability (PEFA) Assessment
Greater Amman Municipality
The Hashemite Kingdom of Jordan
Final Report – October 2017
The quality assurance process followed in the production of this report satisfies all the requirements of the PEFA Secretariat and hence receives the ‘PEFA CHECK’. PEFA Secretariat October 23, 2017
11
1 Introduction
1.1 Rationale and purpose
The Public Expenditure and Financial Accountability (PEFA) Program provides a
framework for assessing and reporting on the strengths and weaknesses of public financial
management (PFM) using quantitative indicators to measure performance. PEFA is a tool
that helps governments achieve sustainable improvements in PFM practices. It does so by
providing a means to measure and monitor performance against a set of indicators across
the entire range of public financial management institutions, systems, and processes.
The overall objective of this assessment was to draft a comprehensive “PFM Performance
Report” using the PEFA Performance Measurement Framework Methodology of 2016. The
assessment provides the management of the Greater Amman Municipality (GAM) with an
indicator-led assessment of the operation of the city’s PFM systems. It also provides an
objective understanding of the overall fiduciary environment of these systems. In addition,
it identifies those parts of the PFM system that may need further reform and development.
The specific objectives of the assessment were to:
1. Use the 2016 PEFA Framework to assess the GAM’s current PFM performance;
2. Provide a basis for the preparation of a technical assistance (TA) plan for strengthening
GAM’s PFM systems and processes, thereby enhancing the efficiency, transparency
and accountability of the city’s finances. (The TA plan does not form a part of the PEFA
Report (although it was developed by the same team); rather, it is an independent
product for use by the GAM); and
3. Establish a baseline for GAM’s PFM systems that will help the city management to
calibrate and monitor improvements made to the city’s ability to manage its finances
efficiently over time.
1.2 Assessment management and quality assurance
Box 1.1: Assessment Management and Quality Assurance Arrangements PEFA Assessment Management Organization
• Oversight Team – Chair and Members: Renaud Seligmann, Practice Manager,
Governance Practice, MENA, The World Bank; Lewis Hawke, Head, PEFA
Secretariat.
• Assessment Manager and Task Team Leader: Rama Krishnan Venkateswaran,
Lead Financial Management Specialist, The World Bank.
• Assessment Task Team: Jad Mazahreh, Senior Financial Management Specialist;
Lea Hakim, Senior Country Economist; Lina Fares, Senior Procurement Specialist;
Mona El-Chami, Senior Financial Management Specialist; and Walid Al Najjar,
Financial Management Specialist.
• Amal Chaoul, Program Assistant, provided administrative and logistical support to
the team (World Bank staff), and was assisted by Philip Sinnett, Charles Hegbor
and Sura Khuzai (international and local consultants).
Review of Concept Note and/or Terms of Reference
• Virtual Peer Review between September 28, 2016 and October 18, 2016
12
• Franck Bessette, Program Manager (World Bank), Julia Dhimitri, Public Sector Specialist (PEFA Secretariat), Kirti Devi, Senior Municipal Finance Specialist (Public-Private Infrastructure Advisory Facility - PPIAF), Thierry Laibastre, Senior Project Officer (Agence Français des Développement [French Development Agency] - AFD) October 18, 2016.
Review of the Assessment Report
• Date of reviewed draft report: September 2017.
• Reviewers: Franck Bessette, Program Manager (World Bank); Kirti Devi, Senior Municipal Finance Specialist, Public-Private Infrastructure Advisory Facility (PPIAF); Dickel Schweitzer, Urban Projects Officer, Agence Français des Développement (AFD), Jordan; and, Holy-Tiana Rame, Public Finance Specialist, PEFA Secretariat.
This initiative was carried out in collaboration with the French Development Agency (AFD),
although the World Bank was responsible for quality assurance of the assessment report.
The World Bank used its standard procedures for analytical work, and the whole exercise
was subject to the quality assurance process of the PEFA Secretariat: “PEFA CHECK”,
which includes peer reviews of the concept note and the final draft report by the government
of the GAM, and two additional peer reviewers from development partners.
1.3 Assessment Methodology
Coverage of the assessment
The 2016 PEFA methodology is described in the Public Finance Management Performance
Measurement Framework (available at www.pefa.org). It uses seven pillars and 31 specific
Performance Indicators (PIs) to measure the operational performance of the key elements
of PFM systems, processes and institutions. The Framework is a tool which enables the
identification of information for measurement and monitoring of PFM performance progress
over time. It also serves as a common platform for dialogue. In addition, it supports the
development of a shared information pool, thus avoiding duplicative and inconsistent
analytical work. Finally, the Framework forms a part of a strengthened approach to
supporting PFM reform, which emphasizes country-led reform, donor harmonization,
alignment around the country strategy, and a focus on monitoring and results. In this
regard, the PEFA Secretariat also offers specific guidance on the application of the
Framework to Subnational Governments.
Each Performance Indicator is scored on a scale from A to D. The bases for these ratings
are the minimum requirements set out in the methodology. Many indicators include two or
more dimensions, which are “added up” using PEFA-specific methods M1 or M2. For
method M1, the weakest link is decisive; the overall rating is based on the lowest score.
For M2, the average of the sub-ratings is used to arrive at the score for the overall indicator.
This assessment focuses on GAM’s PFM system, according to Government Finance
Statistics (GFS) from 2014. It includes cross-cutting and overall issues, revenue issues,
and the budget cycle from planning through execution to control, reporting and audit. A
number of indicators are designed to probe the interaction between the GAM and public
service providers at the local level, including the use of extrabudgetary funds. Therefore,
this assessment covers the general government as applied to the GAM, including all
districts and GAM-controlled funds which are accounted for separately outside of the
budget.
13
The assessment process
• The first step in the preparation of this assessment was for the Team to review
supporting documents, before starting the fieldwork. This was followed by a two-day
PEFA training workshop in May 2016 for a core team of GAM officials responsible for
coordinating and supporting the assessment. The workshop introduced the PEFA
methodology, and explained the purpose of the assessment, as well as the roles and
responsibilities of the various entities. The workshop also provided an overview of the
requirements for each indicator. In this regard, the Framework was translated into
Arabic for the core team prior to the assessment.
• The Assessment Team met with the GAM, government officials and other institutions
during the first mission in October 2016. The purpose was to clarify information
received, obtain additional information, and conduct interviews regarding the actual
functioning of financial management processes — and the status of reform efforts. At
the end of the first field mission, the Team discussed initial observations with the GAM
pertaining to each indicator.
• A second mission in February 2017 reviewed and revised the draft Performance
Report, based on consultations with different stakeholders and development partners
in a two-day workshop. The feedback received was used to revise the draft
assessment, which was then translated into Arabic, and again shared with the GAM to
ensure that the contents of the report and the ratings were clearly understood by senior
management. The GAM reviewed the translated draft assessment, and provided
additional comments which have been incorporated into the draft report.
• The GAM hosted a final workshop on September 20, 2017 with key internal
counterparts, including the Worshipful Mayor of Amman, His Excellency the City
Manager, as well as other officials from the Ministry of Finance, the Ministry of Planning
and International Cooperation, and the Ministry of Municipal Affairs. Development
partners and other relevant stakeholders (identified by the authorities) also participated
in the workshop. The findings and conclusions of the assessment were presented, and
areas for a future public financial management reform program (including an outline of
the TA Plan) were discussed.
When performance was assessed
Much of the fieldwork took place in October 2016 (with follow-up work early in 2017).
However, as the financial year begins on January 1st, data from 2016 and from the two,
previous completed fiscal years (FYs) was used. PEFA is essentially a backward-looking
process, based on evidence about actual current public sector financial management
practices. As such, it uses statistical information about different aspects of revenues and
expenditures over the most recent fiscal years.
Sources of information
The sources of information for the assessment included relevant legislation, budget
documentation, and reports and other documentation and data provided by the GAM,
oversight agencies and non-state sources (for example, the Jordan Audit Bureau, the
Parliament, and the Chamber of Commerce). It also utilized data and information from other
institutions such as the World Bank and the International Monetary Fund (IMF). The
government officials and other stakeholders interviewed are listed in Annex 4B.
Other methodological issues for the preparation of the report
The assessment process required the:

14
• Review of legal and regulatory documentation, budget documentation and financial and
audit reports;
• Assessment of PFM practice procedures and systems;
• Quantitative analysis of official financial and budgetary data; and,
• The application of professional judgment.
An important consideration in this Assessment is an appreciation of the quality,
comprehensiveness and accuracy of data that is used to determine the budget credibility
indicators. The reliability of the PEFA indicators can only be as good as the accuracy of the
financial data upon which they were assessed.
15
2 Country background Information
2.1 Country economic situation
2.1.1.1 Country context
The Hashemite Kingdom of Jordan is an upper-middle-income country with a population of
around 9.5 million, including 2.9 million guests and a per-capita gross national income
(GNI) of US $4,390. The population is around 80 percent urban. Jordan is also one of the
youngest among the upper-middle-income countries, with 38 percent of the population
under the age of 14. Jordanian policymakers aim to use the demographic opportunity of a
well-educated, young population to build a dynamic, knowledge-based economy, as
articulated in the National Agenda and Executive Development Plan (EDP).
The country has limited natural resources and agricultural land, and water is especially
scarce. Potash and phosphate are the main export commodities. Jordan ranks as the
world’s fourth poorest country in terms of water resources. Services account for more than
70 percent of gross domestic product (GDP), and more than 75 percent of jobs. As one of
the most open economies in the Middle East and North Africa (MENA) region, Jordan is
well integrated with its neighbors through trade, remittances, foreign direct investment
(FDI), and tourism. It has especially strong links to the Arab Gulf economies.
Two successive external shocks — the 2007-2008 Global Financial Crisis and the regional
turmoil that followed the Arab Spring in 2010 — have worsened Jordan’s long-term
structural vulnerabilities. Following the Global Financial Crisis, growth decelerated sharply.
Turmoil throughout the region led to slower growth and lower fiscal revenues, as well as
increased public spending to partly accommodate social pressures. This has resulted in an
accumulation of a large public debt, the servicing of which exacerbates fiscal pressures.
However, Jordan has proven remarkably resilient despite decades of turmoil in its
neighborhood. The economy has absorbed the recurrent population influx, and has dealt
with its high vulnerability to energy and food import prices, and lack of natural resources. It
has generated sustained growth and low headcount poverty, coupled with generally low
inflation and a credible exchange-rate regime. Jordan has managed a unique balancing act
in the region in terms of maintaining domestic stability — despite the persistent conflicts on
its doorstep.
More than six years of violent conflict in Syria have resulted in massive movements of
people within Syria, as well as into neighboring countries. The United Nations (UN)
estimated that by the end of August 2016, Jordan was hosting more than 600,0001
registered refugees. It has granted Syrian refugees access to services, such as health care
and education, in host communities. Standing at about 10 percent of Jordan’s population,
the large influx of refugees is straining the availability and quality of public services,
especially in the northern governorates. The country faces immediate security, social and
fiscal challenges, as well as adverse impacts on its future potential development gains.
Indeed, the additional demand for public services — including electricity, water, solid waste
management, education, and health — is adding a significant burden to Jordan’s already
1 As of August 2016, the United Nations High Commissioner for Refugees (UNHCR) reported that there are 5,165,317 Syrian "persons of concern" — of whom 660,442 are registered as refugees in Jordan. There are about 1.5 million Syrian refugees in Jordan; only 20 percent are living in the Za'atari, Marjeeb al-Fahood, Cyber City and Al-Azraq refugee camps.
16
weak public finances.
In 2014, the Government published the National Resilience Plan 2014–2016, presenting
proposed priority responses to mitigate the impact of the Syrian crisis on Jordan and
Jordanian host communities. To meet its increasing needs, Jordan has had to substitute
cheap gas with expensive oil imports at an average annual cost of about US$2 billion. As
a result, the National Electricity Power Company (NEPCO) has been accumulating deficits,
and gross public debt has risen rapidly. It is estimated to have reached around 92 percent
of GDP as of the end of 2015.
2.1.1.2 Institutional Context
Political authority in Jordan lies with His Majesty the King, who issues Directives through
the Prime Minister, as Head of Government (GoJ). The members of the GoJ – the Council
of Ministers – which represent the various sectoral and inter-sectoral ministries, are
appointed through the Prime Minister. However, they are not elected or ratified by
Parliament, as in other countries. The framework for public decision-making is governed
by legislation in which two Houses of Parliament participate. The members of the Lower
House, (the House of Representatives) are elected, and the members of the Upper House
(the Senate) are appointed.
2.1.1.3 Municipal Governance
Local governance is structured into 12 regional authorities/Governorates, each further
subdivided into Districts and headed by a Governor appointed by the King. The line
ministries work through regional agents (Directors) assigned to the Governorates. The
regional authorities act as agents ‘on behalf’ of their respective central authority as the
principal. After several rounds of amalgamation of local governments, there are now 99
municipalities, plus the Greater Amman Municipality (GAM).
The legal framework of municipalities is established in Law 14 of 2007, and the most recent
version, Law 41 of 2015. Municipalities are private associations and do not form a part of
the central government. As such, they possess some elements of self-rule through elected
officials. The Law gives municipalities the right to levy and collect a limited range of local
taxes and fees, hence their “quasi-public” status. In this regard, they are considered to be
local service providers.
The GoJ considers empowering local governments a key priority, and the current policy
initiatives on decentralization are steps in this direction. Although the Decentralization Bill
passed by the Parliament in 2015 was rejected by the King as some provisions were
contrary to the Constitution, the need to empower local governments with functions, powers
and resources is generally accepted. With the Royal Government of Jordan embarking on
decentralization reforms, local governments will be expected to be more efficient and
accountable in providing for local services.
2.1.1.4 Background to the Greater Amman Municipality
The metropolitan area of Amman, Jordan’s capital, accounts for approximately 40 percent
of the country’s population; 80 percent of its industry; and 55 percent of total employment.
In recognition of the expansion of the city and the integration of nearby villages and
suburban developments, the perimeter of the GAM was extended in 2007 to include seven
additional districts. This brings its total area to 1,680 square kilometers (km) with a then
population of 2.2 million. However, this figure does not include the influx of citizens from
neighboring countries, such as Iraq, Syria and the West Bank and Gaza who are
increasingly taking up residence in Amman on a more-or-less permanent basis. These
developments lead to unofficial estimates of the city’s current population of 4.5 million.
17
The increasing level of urbanization, as well as the burgeoning demands on civic services
by the rapidly growing population, has created tremendous pressure on the GAM to put
into place efficient and accountable systems for delivering municipal services. To address
this need, the GAM has embarked on a Capital Investment Plan (CIP). The goal of the plan
is to upgrade existing systems for delivering urban services, and to put in place new
infrastructure, such as a Bus Rapid Transit System, which is expected to enhance the
quality of traffic management in the city. The GAM is currently financing most of its CIP
from donor support (for example, the Bus Rapid Transit System [BRTS] is financed through
a loan from AFD).
In the longer term, the GAM intends to finance its CIP from its own resources and by
accessing capital markets, based on the strength of its financial management and
creditworthiness. In this context, GAM intends to enhance the capacities and performance
of its financial management systems and processes so that it can manage its current
resources in a more efficient, transparent and accountable manner.
Although other municipalities are subject to supervision by the Ministry of Municipal Affairs
(MoMA), the GAM reports directly to the Prime Minister and is considered a part of the
Governorate of Amman. The Mayor of the GAM is directly appointed by the Prime Minister,
and is supported by a local administration whose head is the city manager. The Mayor is
held accountable by the citizens to implement programs (waste disposal, urban planning,
permit issuance, emergency services, and so on) based on the agreed-upon budget
priorities laid out by the Municipal Council.
The GAM is by far the largest local government in Jordan, with more than 22,000 staff
organized into seven administrative units (see table 2.3 below). The GAM’s efforts to
improve the quality of its financial management and enhance its financial sustainability will
also serve as a model for other local governments in Jordan.
World Bank support focuses on mitigating the immediate impact of the regional crisis, while
at the same time supporting long-term development objectives and structural reforms.
These include improving the equity and quality of public service delivery, particularly for
water and energy services. The development objective is to assess and strengthen the
financial management systems of the GAM, thereby enabling it to meet its service delivery
responsibilities in an efficient, transparent and accountable manner. In addition, stronger
financial management systems will facilitate the city’s access to market finance, based on
the strength of its financial performance.
2.1.2 Key aspects of GAM's economic and fiscal reforms
At the national level, Jordan has ambitious plans to achieve the social and economic
development objectives set out in the Government’s ‘Vision 2025’. More immediate actions
are set out in the Executive Development Program of 2016-18, which makes relatively
modest assumptions about economic growth, and provides a realistic diagnosis of many of
the obstacles to improvements in public service delivery.
As the major driver of economic growth in the country (as well as being the largest
population center by far), the GAM is central to achieving these objectives. For example, a
sound public investment management framework is in place. This was internationally
recognized in 2014 by an award from the World Council on City Data, namely the Platinum
Level ISO 37120. A recognition of the need to build from this sound base underlies the
GAM’s commitment to reform its PFM practices.
18
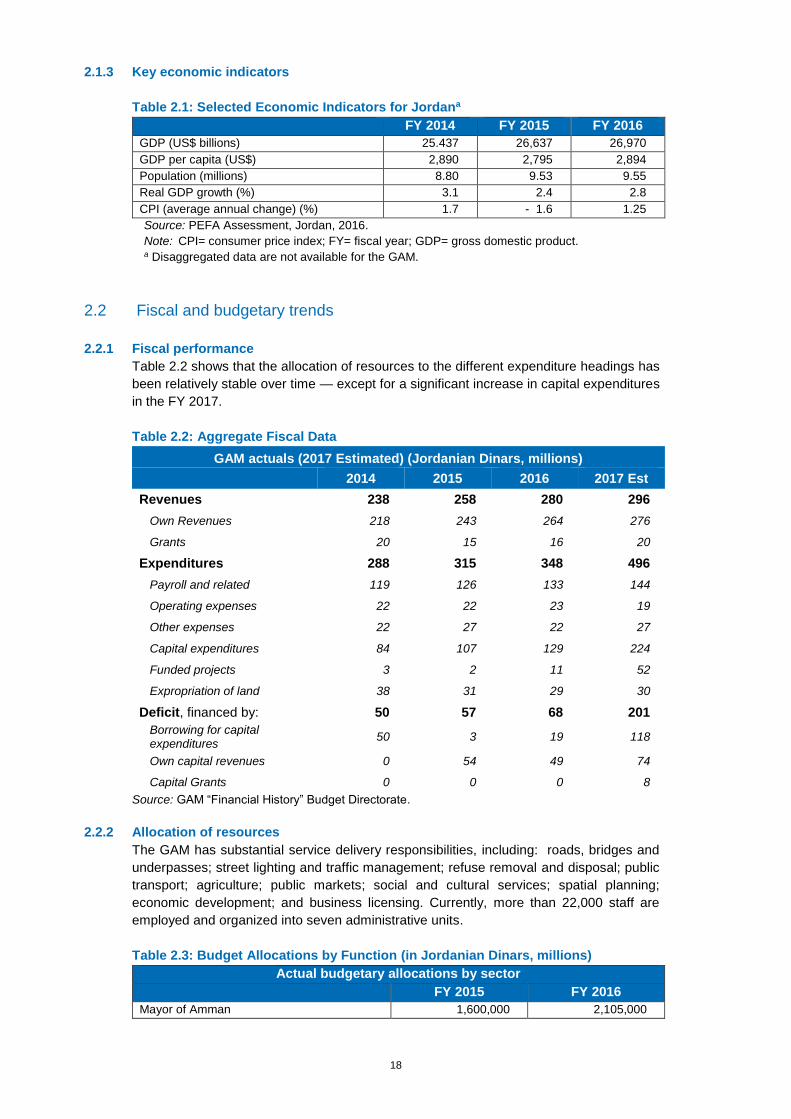
2.1.3 Key economic indicators
Table 2.1: Selected Economic Indicators for Jordana
FY 2014 FY 2015 FY 2016
GDP (US$ billions) 25.437 26,637 26,970
GDP per capita (US$) 2,890 2,795 2,894
Population (millions) 8.80 9.53 9.55
Real GDP growth (%) 3.1 2.4 2.8
CPI (average annual change) (%) 1.7 - 1.6 1.25
Source: PEFA Assessment, Jordan, 2016.
Note: CPI= consumer price index; FY= fiscal year; GDP= gross domestic product. a Disaggregated data are not available for the GAM.
2.2 Fiscal and budgetary trends
2.2.1 Fiscal performance
Table 2.2 shows that the allocation of resources to the different expenditure headings has
been relatively stable over time — except for a significant increase in capital expenditures
in the FY 2017.
Table 2.2: Aggregate Fiscal Data
GAM actuals (2017 Estimated) (Jordanian Dinars, millions) 2014 2015 2016 2017 Est
Revenues 238 258 280 296
Own Revenues 218 243 264 276
Grants 20 15 16 20
Expenditures 288 315 348 496
Payroll and related 119 126 133 144
Operating expenses 22 22 23 19
Other expenses 22 27 22 27
Capital expenditures 84 107 129 224
Funded projects 3 2 11 52
Expropriation of land 38 31 29 30
Deficit, financed by: 50 57 68 201
Borrowing for capital expenditures
50 3 19 118
Own capital revenues 0 54 49 74
Capital Grants 0 0 0 8
Source: GAM “Financial History” Budget Directorate.
2.2.2 Allocation of resources
The GAM has substantial service delivery responsibilities, including: roads, bridges and
underpasses; street lighting and traffic management; refuse removal and disposal; public
transport; agriculture; public markets; social and cultural services; spatial planning;
economic development; and business licensing. Currently, more than 22,000 staff are
employed and organized into seven administrative units.
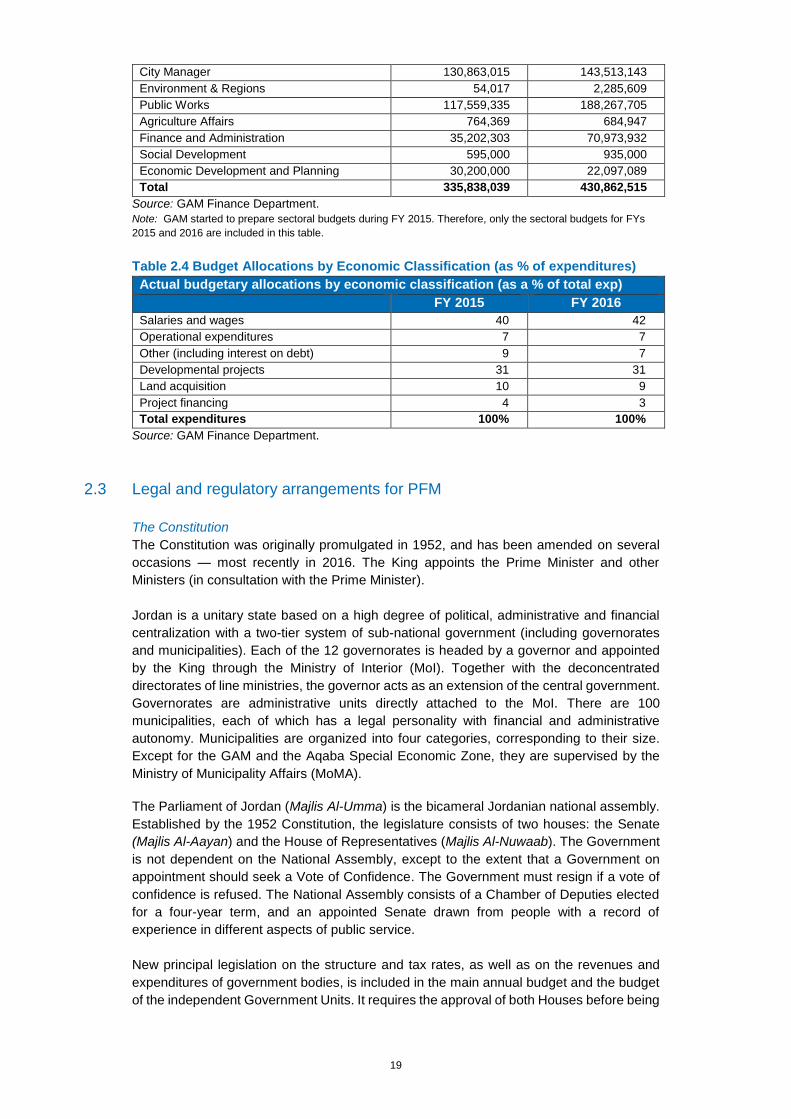
Table 2.3: Budget Allocations by Function (in Jordanian Dinars, millions)
Actual budgetary allocations by sector
FY 2015 FY 2016
Mayor of Amman 1,600,000 2,105,000
19
City Manager 130,863,015 143,513,143
Environment & Regions 54,017 2,285,609
Public Works 117,559,335 188,267,705
Agriculture Affairs 764,369 684,947
Finance and Administration 35,202,303 70,973,932
Social Development 595,000 935,000
Economic Development and Planning 30,200,000 22,097,089
Total 335,838,039 430,862,515
Source: GAM Finance Department.
Note: GAM started to prepare sectoral budgets during FY 2015. Therefore, only the sectoral budgets for FYs
2015 and 2016 are included in this table.
Table 2.4 Budget Allocations by Economic Classification (as % of expenditures)
Actual budgetary allocations by economic classification (as a % of total exp)
FY 2015 FY 2016
Salaries and wages 40 42
Operational expenditures 7 7
Other (including interest on debt) 9 7
Developmental projects 31 31
Land acquisition 10 9
Project financing 4 3
Total expenditures 100% 100%
Source: GAM Finance Department.
2.3 Legal and regulatory arrangements for PFM
The Constitution
The Constitution was originally promulgated in 1952, and has been amended on several
occasions — most recently in 2016. The King appoints the Prime Minister and other
Ministers (in consultation with the Prime Minister).
Jordan is a unitary state based on a high degree of political, administrative and financial
centralization with a two-tier system of sub-national government (including governorates
and municipalities). Each of the 12 governorates is headed by a governor and appointed
by the King through the Ministry of Interior (MoI). Together with the deconcentrated
directorates of line ministries, the governor acts as an extension of the central government.
Governorates are administrative units directly attached to the MoI. There are 100
municipalities, each of which has a legal personality with financial and administrative
autonomy. Municipalities are organized into four categories, corresponding to their size.
Except for the GAM and the Aqaba Special Economic Zone, they are supervised by the
Ministry of Municipality Affairs (MoMA).
The Parliament of Jordan (Majlis Al-Umma) is the bicameral Jordanian national assembly.
Established by the 1952 Constitution, the legislature consists of two houses: the Senate
(Majlis Al-Aayan) and the House of Representatives (Majlis Al-Nuwaab). The Government
is not dependent on the National Assembly, except to the extent that a Government on
appointment should seek a Vote of Confidence. The Government must resign if a vote of
confidence is refused. The National Assembly consists of a Chamber of Deputies elected
for a four-year term, and an appointed Senate drawn from people with a record of
experience in different aspects of public service.
New principal legislation on the structure and tax rates, as well as on the revenues and
expenditures of government bodies, is included in the main annual budget and the budget
of the independent Government Units. It requires the approval of both Houses before being
20
promulgated by the King (Articles 111 and 112 of the Constitution). The National Assembly
is normally in session for four months each year, beginning in November Thus, it should
be able to approve each year’s budget before the new fiscal year begins. Laws require the
approval of both houses, and the Government has the power to issue by-laws, which
determine many aspects of PFM.
Budget preparation and execution
Budget preparation and execution is governed by the Law on Municipalities No.41/2015.
The Law details the responsibilities of the local Council to approve the general and annual
budgets of the municipality. It is then endorsed by the Minister of Municipalities. However,
in the case of the GAM, the Prime Minister approves its annual budget.
The Council is composed of the heads of the local councils attached to it (which comprise
75 percent of its members), and the rest are assigned by the Prime Minister. The Prime
Minister designates the Mayor based on the recommendation of the Minister. The GAM
has administrative and financial independence. The Council has the responsibility of
approving GAM’s annual budget and having it endorsed by the Prime Minister. The GAM
City Manager is responsible for preparing the annual budget. The Municipal Financial
Bylaw No. 142/2016 establishes the format by which the GAM should prepare its annual
budget. Budget execution rules and procedures mainly follow the Municipalities’ Regulation
No. 142/2016, as well as national financial regulations.
Taxation
Taxation is administered by the Income and Sales Tax Department (ISTD), the Customs
Department, and the Lands and Survey Department, which is responsible for property
taxes. All departments report to the Minister of Finance. Customs duties are detailed in the
1998 law and numerous subsequent directives, and property taxes by the 1954 law, as
subsequently amended. Personal income taxes are currently governed by the 2014 Income
Tax Law, while sales taxes are covered by the 2010 General Sales Tax Law.
State Audit Agency
The Audit Bureau is Jordan’s Supreme Audit Institution (SAI). It was established in its
present form in 1952 under Law No. 28, issued in accordance with Article 119 of the
Constitution. This Article stipulates that the “Audit Bureau has been set to audit the
revenues and expenditures of the state and ways of expenditure”. Coinciding with recent
developments in Jordan, an Amending Audit Law No. (3) of 2002 has been passed. It
included several aspects, the most important of which are the following:
• Providing the Audit Bureau with the power to conduct post-audits of expenditures; in
the meantime, the head of the Audit Bureau may in certain cases, under an approval
of the Prime Minister take a decision to conduct a pre-audit. Before this amendment,
the Audit Bureau has been conducting pre-audits of all amounts of expenditure
exceeding JD 5,000. It is currently working on shifting its focus gradually from pre- to
post-audits.
• Providing the Audit Bureau with the power to conduct the administrative audit.
Previously the Audit Bureau has been conducting audits of administrative decisions
and procedures, only if they related directly to financial issues.
• Giving the Audit Bureau the mandate to conduct the environmental and performance
audits.
• Expanding the Audit Bureau's scope of audit to include the companies for which the
government maintains ownership of 50 percent and more.
• Giving the President of the Audit Bureau the authority to call on counselors, experts,
and specialists for any issues that require special technical expertise.
21
• Employees and officers were made subject to legal accountability if they refuse to
present documentation to the auditors of the Audit Bureau, or if they do not respond to
audit inquires within the period specified by law.
The Audit Bureau is a member of international and regional SAI bodies, such as the
International Organization of Supreme Audit Institutions (INTOSAI) and the Arab
Organization of Supreme Audit Institutions (ARABOSAI). It is proceeding toward
compliance with the International Standards of Supreme Audit Institutions (ISSAIs)
according to a phased program supported by INTOSAI.
The Audit Bureau has the mandate of auditing GAM’s accounts according to the
Municipalities and Audit Bureau Laws. However, the Municipalities Law does not set a
deadline for the audit, and does not require the Audit Bureau to submit an annual audit
report to the GAM Council.
The Audit Bureau has a resident team at the GAM that performs continuous audits. The
Audit Bureau performs ex-ante audits over 100 percent of GAM’s expenditures, 70 percent
of revenues (mainly building licenses fees), and 15 percent of other revenues.
A withdrawal from the ex-ante audit process started a few years ago, along with the
government strengthening of internal audit in public entities. It is expected that the Audit
Bureau will progressively withdraw completely from ex-ante audits in more entities,
including the GAM. The GAM does not submit annual financial statements to the Audit
Bureau for audit. However, the Audit Bureau’s annual audit report includes audit findings
regarding the GAM derived from the continuous audits.
In general, the annual audit report improved over the last year, becoming more in
compliance with international auditing standards. The Audit Bureau confirms that it
performs a comprehensive audit that covers performance audits. Follow up on audit
findings has improved. However, more efforts are needed to improve timeliness. The audit
findings of the last three annual audit reports (2013-2015) were classified based on
criticality and will be discussed with the Parliament. In this regard, it should be noted that
the Audit Bureau is not financially and administratively independent.
Although the GAM acts as its own legislative authority, the Council does not perform any
scrutiny of Audit Bureau reports. The Parliament reviews the annual audit report of the
Audit Bureau, which has a section on the GAM, and holds public hearings.
Internal Control and Audit
Internal control and audit in the GAM are governed by its policies and procedures, as
approved by the Board of Directors (BoD). It follows the national related laws and
regulations, where applicable. The GAM’s senior management maintains layers of controls
that ensure ethical conduct and acceptable work upon service delivery. Currently, there is
a heavy apparatus of control on a transactional basis by each of the department’s internal
controllers and the Audit Bureau’s representative.
The GAM was advised to achieve a balance between the ex-ante and ex-post review
procedures on transactions. More importantly, the GAM was advised to shift some effort to
the review and testing of the internal control systems in place, from a higher procedural
level. It was also directed to inform on the adequacy of the design and effectiveness of
controls, especially because most departments have established automated systems.
Finally, the GAM should head toward system integration with others in the institution.
22
Internal audit practice is mainly governed by the audit charter approved by the BoD. The
internal audit department is being positioned to provide reasonable assurance and in-
house advisory services, developing year after year. To ensure that the internal audit
department is in line with good practices, the department will need to adopt the international
standards set by the Institute of Internal Auditors (IIA), which regulates the profession
globally.
In general, although there is room for improvement, the GAM is currently maintaining an
internal control framework with effective internal controls in place.
Legal framework for procurement
Each of the main procuring entities, as well as every independent agency or government
entity (including local government units) engaging in procurement, have their own
procurement by-laws. This fragmentation leads to a situation in which the totality of
Jordan’s procurement is covered by 56 separate by-laws. Although the procedures for
similar goods and services seem to be quite comparable, the differences that do exist —
as well as the sheer number of separate by-laws — impose a burden on business and
make it very difficult to adjust the procurement process.
Local governments, especially the GAM, also carry out their own procurement, which is
governed by Bylaw No. 153 of 2016 – Regulations of Supplies and Works. This translates
into high legal risks for vendors; increased costs involved in learning agency specific
regulations; and/or possible market fragmentation (and capture) as vendors bid only for
contracts with those agencies they know best. It is also costlier for the government to
oversee multiple regulatory systems.
2.4 Institutional arrangements for PFM
The main responsibility for PFM rests with the Department of Finance (DoF), which
prepares the 5-year Socio-Economic Development Plan. As such, it is responsible for
economic forecasting and for the planning of capital expenditures, including determination
of the list of capital projects approved for the following year presented to the Majalis as part
of the budget. The DoF is also responsible for revenues, expenditures, financing,
accounting, reporting and the overall fiscal stance. It also allocates expenditure provisions
to departments and nine ‘Sectors’, where the responsibility for implementing GAM’s
activities actually lies. Further, the Department of Finance (DoF) is responsible for
managing cash balances and monitoring the revenue and expenditure cash flows.
2.5 Other important features of PFM and its operating environment
The Jordanian PFM System has a clear legal framework led by the MoF. It is implemented
across PFM institutions, including the GAM. The degree of reliance on the Financial
Management Information System (FMIS) is currently very high and is expected to increase
over time, as is the sophistication of reporting needs.
23
3 Assessment of PFM Performance
Subnational Indicator
HLG-1 Transfers from a higher level of government
This indicator assesses the extent to which transfers to the subnational government from
a higher-level government are consistent with the originally-approved high-level budgets,
and that they are provided according to acceptable time frames.
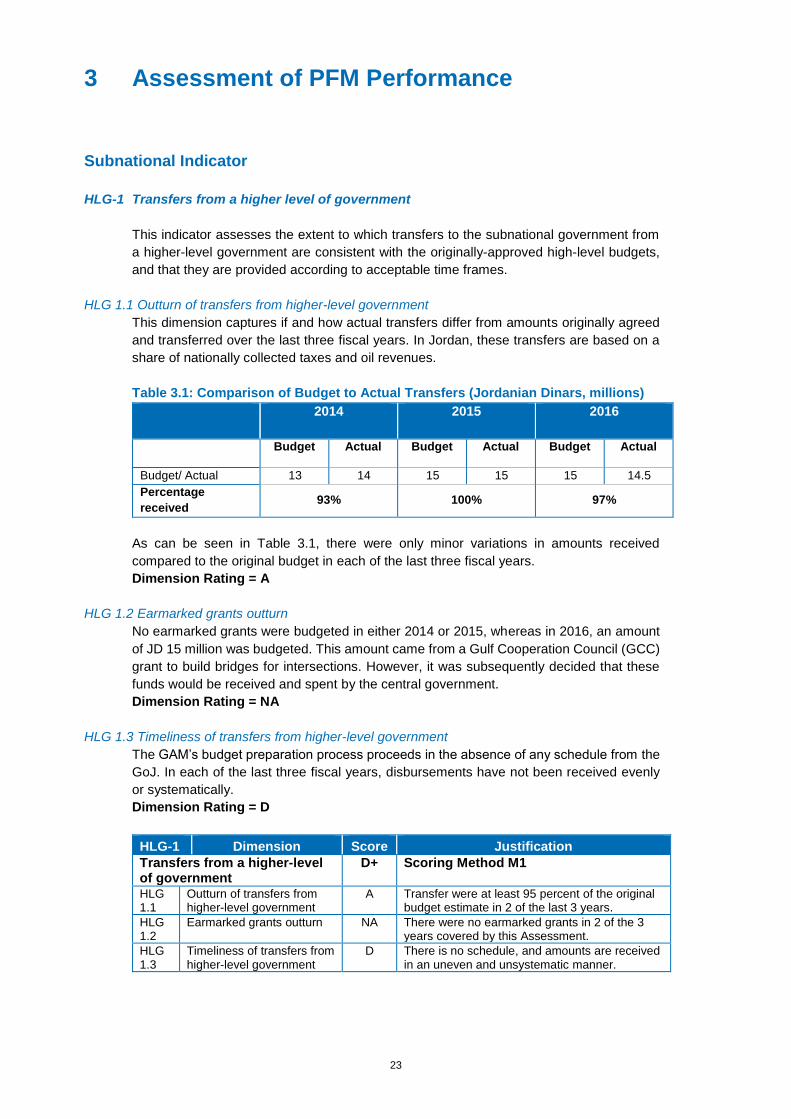
HLG 1.1 Outturn of transfers from higher-level government
This dimension captures if and how actual transfers differ from amounts originally agreed
and transferred over the last three fiscal years. In Jordan, these transfers are based on a
share of nationally collected taxes and oil revenues.
Table 3.1: Comparison of Budget to Actual Transfers (Jordanian Dinars, millions)
2014
2015 2016
Budget Actual Budget Actual Budget Actual
Budget/ Actual 13 14 15 15 15 14.5
Percentage
received 93% 100% 97%
As can be seen in Table 3.1, there were only minor variations in amounts received
compared to the original budget in each of the last three fiscal years.
Dimension Rating = A
HLG 1.2 Earmarked grants outturn
No earmarked grants were budgeted in either 2014 or 2015, whereas in 2016, an amount
of JD 15 million was budgeted. This amount came from a Gulf Cooperation Council (GCC)
grant to build bridges for intersections. However, it was subsequently decided that these
funds would be received and spent by the central government.
Dimension Rating = NA
HLG 1.3 Timeliness of transfers from higher-level government
The GAM’s budget preparation process proceeds in the absence of any schedule from the
GoJ. In each of the last three fiscal years, disbursements have not been received evenly
or systematically.
Dimension Rating = D
HLG-1 Dimension Score Justification
Transfers from a higher-level of government
D+ Scoring Method M1
HLG 1.1
Outturn of transfers from higher-level government
A Transfer were at least 95 percent of the original budget estimate in 2 of the last 3 years.
HLG 1.2
Earmarked grants outturn NA There were no earmarked grants in 2 of the 3 years covered by this Assessment.
HLG 1.3
Timeliness of transfers from higher-level government
D There is no schedule, and amounts are received in an uneven and unsystematic manner.
24
Ongoing reforms:
No known reforms.
Pillar I. Budget reliability
PI-1 Aggregate expenditure outturn
This indicator measures the deviation between the GAM’s actual total expenditures and
the originally approved budget over the last three completed fiscal years, that is, for 2014,
2015 and 2016. On the one hand, it reflects discipline in compliance with the originally
approved budget. On the other hand, it demonstrates the city’s ability to implement the
budgeted expenditures. PEFA defines good practice, that is, qualifying for the highest
rating, as avoiding a deviation of more than ± 5 percent in at least two of the last three
years.
1.1 Aggregate expenditure outturn
It is important to contextualize this dimension, as GAM's annual budget is prepared using
a Microsoft Excel spreadsheet. There is no medium-term expenditure framework even
though the annual budget is linked to the 5-year, medium-term strategic plan. The budget
is manually uploaded onto Oracle through the General Ledger, which could result in
misclassifications and omissions, thereby affecting the outcome of budget execution and
reporting.
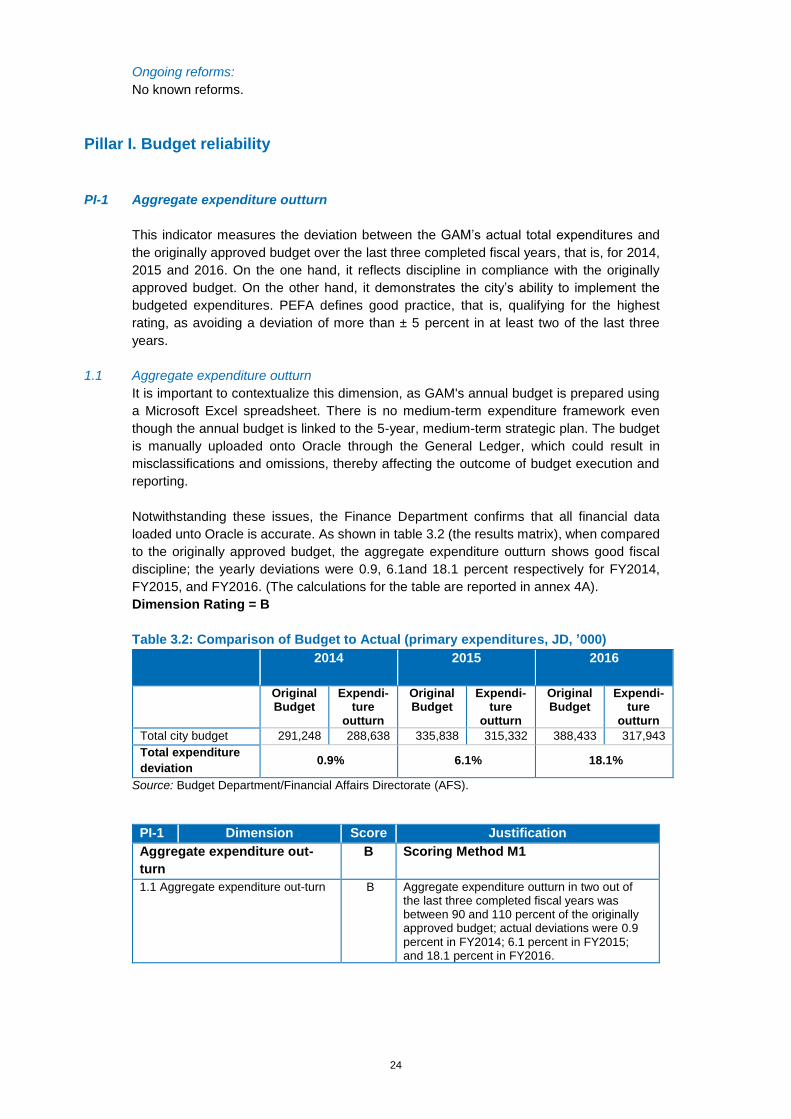
Notwithstanding these issues, the Finance Department confirms that all financial data
loaded unto Oracle is accurate. As shown in table 3.2 (the results matrix), when compared
to the originally approved budget, the aggregate expenditure outturn shows good fiscal
discipline; the yearly deviations were 0.9, 6.1and 18.1 percent respectively for FY2014,
FY2015, and FY2016. (The calculations for the table are reported in annex 4A).
Dimension Rating = B
Table 3.2: Comparison of Budget to Actual (primary expenditures, JD, ’000)
2014
2015 2016
Original Budget
Expendi-ture
outturn
Original Budget
Expendi- ture
outturn
Original Budget
Expendi-ture
outturn
Total city budget 291,248 288,638 335,838 315,332 388,433 317,943
Total expenditure
deviation 0.9% 6.1% 18.1%
Source: Budget Department/Financial Affairs Directorate (AFS).
PI-1 Dimension Score Justification
Aggregate expenditure out-
turn
B Scoring Method M1
1.1 Aggregate expenditure out-turn B Aggregate expenditure outturn in two out of the last three completed fiscal years was between 90 and 110 percent of the originally approved budget; actual deviations were 0.9 percent in FY2014; 6.1 percent in FY2015; and 18.1 percent in FY2016.
25
Ongoing reforms:
No known reforms.
PI-2 Expenditure composition outturn
When the composition of actual expenditure varies considerably from the original budget,
the budget is unlikely to be a useful statement of policy intent. PEFA’s PI-2 is a tighter
measure of budget discipline, as it measures how well expenditures can forecast at the
vote level ie the level at which the Council approves the budget.The indicator has three
dimensions, and measures the deviation in the composition of expenditure outturn
compared to the originally approved budget. The originally approved budget reflects the
GAM Council’s decisions regarding the relative priority of resources in each function or
socio-economic mandate. Hence, substantial variations between the outturn and the
original budget suggest that the relative importance of functions has been undermined.
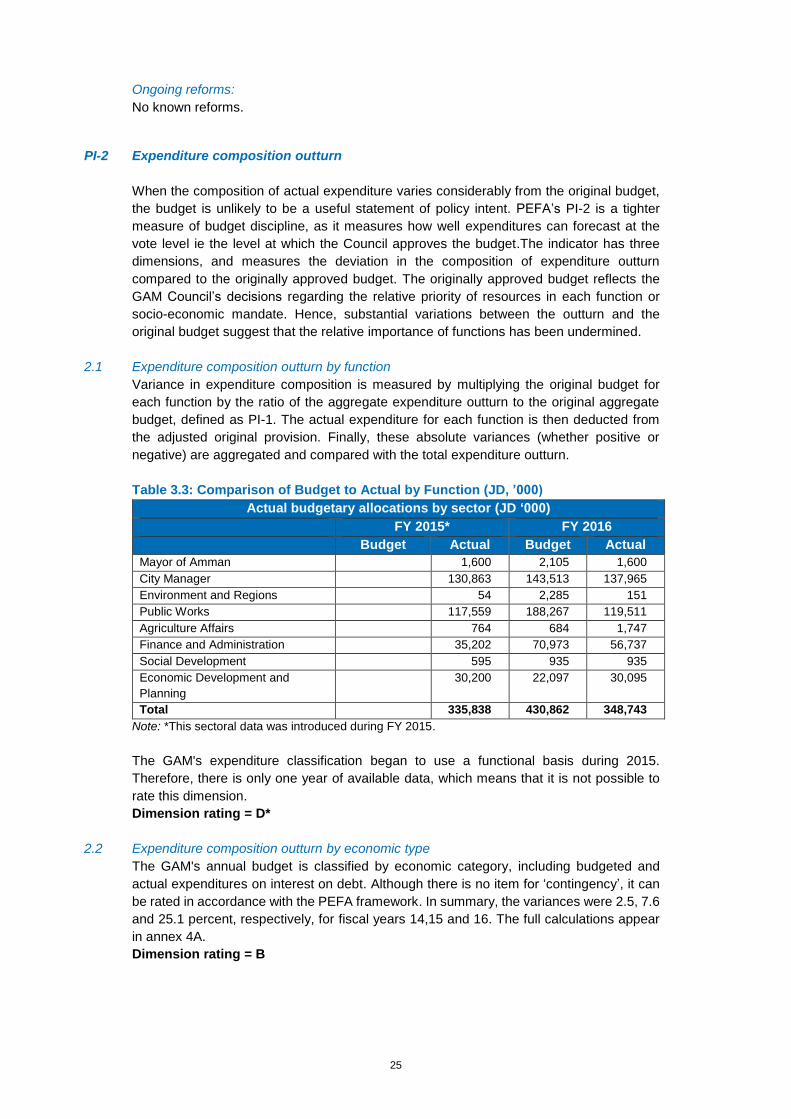
2.1 Expenditure composition outturn by function
Variance in expenditure composition is measured by multiplying the original budget for
each function by the ratio of the aggregate expenditure outturn to the original aggregate
budget, defined as PI-1. The actual expenditure for each function is then deducted from
the adjusted original provision. Finally, these absolute variances (whether positive or
negative) are aggregated and compared with the total expenditure outturn.
Table 3.3: Comparison of Budget to Actual by Function (JD, ’000)
Actual budgetary allocations by sector (JD ‘000)
FY 2015* FY 2016
Budget Actual Budget Actual
Mayor of Amman 1,600 2,105 1,600
City Manager 130,863 143,513 137,965
Environment and Regions 54 2,285 151
Public Works 117,559 188,267 119,511
Agriculture Affairs 764 684 1,747
Finance and Administration 35,202 70,973 56,737
Social Development 595 935 935
Economic Development and
Planning
30,200 22,097 30,095
Total 335,838 430,862 348,743
Note: *This sectoral data was introduced during FY 2015.
The GAM's expenditure classification began to use a functional basis during 2015.
Therefore, there is only one year of available data, which means that it is not possible to
rate this dimension.
Dimension rating = D*
2.2 Expenditure composition outturn by economic type
The GAM's annual budget is classified by economic category, including budgeted and
actual expenditures on interest on debt. Although there is no item for ‘contingency’, it can
be rated in accordance with the PEFA framework. In summary, the variances were 2.5, 7.6
and 25.1 percent, respectively, for fiscal years 14,15 and 16. The full calculations appear
in annex 4A.
Dimension rating = B
26
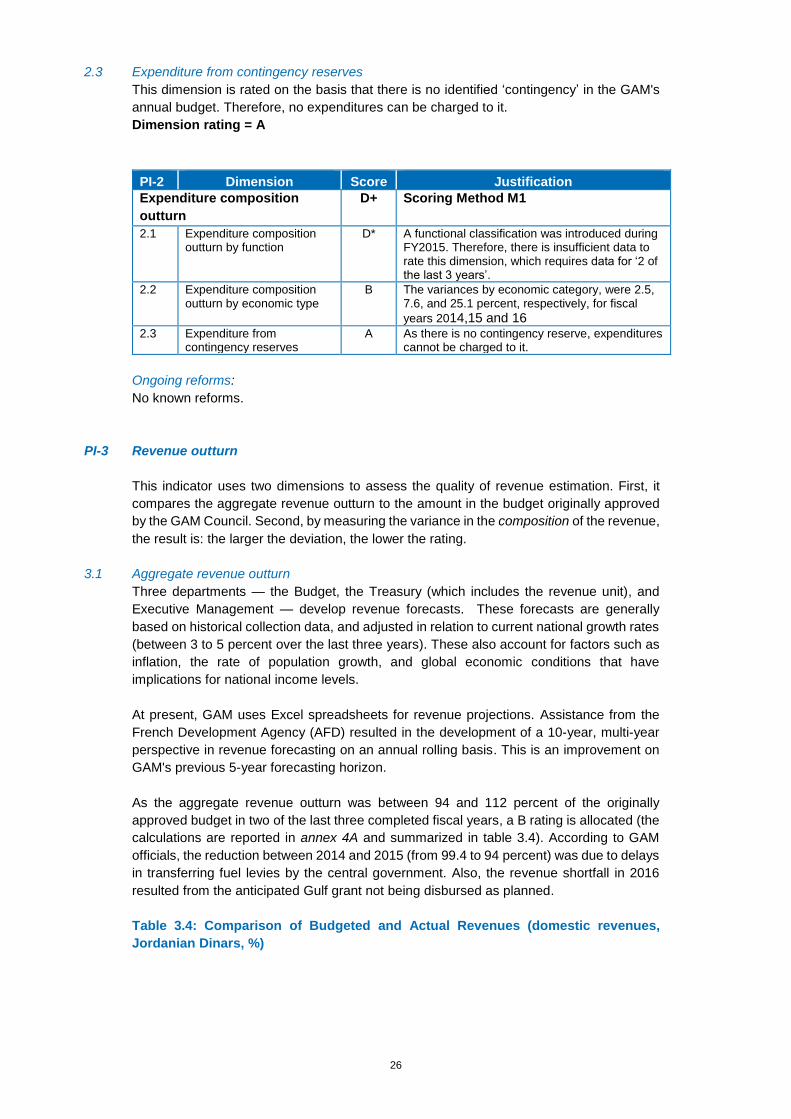
2.3 Expenditure from contingency reserves
This dimension is rated on the basis that there is no identified ‘contingency’ in the GAM's
annual budget. Therefore, no expenditures can be charged to it.
Dimension rating = A
PI-2 Dimension Score Justification
Expenditure composition
outturn
D+ Scoring Method M1
2.1 Expenditure composition outturn by function
D* A functional classification was introduced during FY2015. Therefore, there is insufficient data to rate this dimension, which requires data for ‘2 of the last 3 years’.
2.2 Expenditure composition outturn by economic type
B The variances by economic category, were 2.5, 7.6, and 25.1 percent, respectively, for fiscal
years 2014,15 and 16
2.3 Expenditure from contingency reserves
A As there is no contingency reserve, expenditures cannot be charged to it.
Ongoing reforms:
No known reforms.
PI-3 Revenue outturn
This indicator uses two dimensions to assess the quality of revenue estimation. First, it
compares the aggregate revenue outturn to the amount in the budget originally approved
by the GAM Council. Second, by measuring the variance in the composition of the revenue,
the result is: the larger the deviation, the lower the rating.
3.1 Aggregate revenue outturn
Three departments — the Budget, the Treasury (which includes the revenue unit), and
Executive Management — develop revenue forecasts. These forecasts are generally
based on historical collection data, and adjusted in relation to current national growth rates
(between 3 to 5 percent over the last three years). These also account for factors such as
inflation, the rate of population growth, and global economic conditions that have
implications for national income levels.
At present, GAM uses Excel spreadsheets for revenue projections. Assistance from the
French Development Agency (AFD) resulted in the development of a 10-year, multi-year
perspective in revenue forecasting on an annual rolling basis. This is an improvement on
GAM's previous 5-year forecasting horizon.
As the aggregate revenue outturn was between 94 and 112 percent of the originally
approved budget in two of the last three completed fiscal years, a B rating is allocated (the
calculations are reported in annex 4A and summarized in table 3.4). According to GAM
officials, the reduction between 2014 and 2015 (from 99.4 to 94 percent) was due to delays
in transferring fuel levies by the central government. Also, the revenue shortfall in 2016
resulted from the anticipated Gulf grant not being disbursed as planned.
Table 3.4: Comparison of Budgeted and Actual Revenues (domestic revenues,
Jordanian Dinars, %)
27
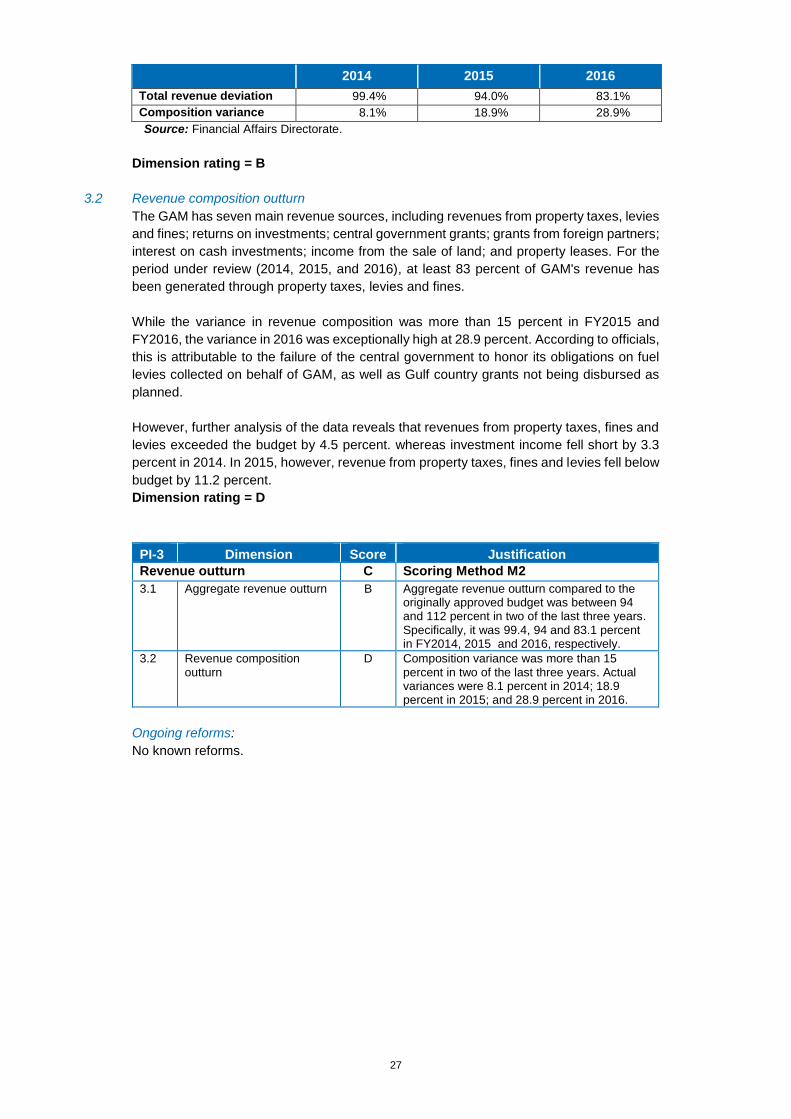
2014 2015 2016
Total revenue deviation 99.4% 94.0% 83.1%
Composition variance 8.1% 18.9% 28.9%
Source: Financial Affairs Directorate.
Dimension rating = B
3.2 Revenue composition outturn
The GAM has seven main revenue sources, including revenues from property taxes, levies
and fines; returns on investments; central government grants; grants from foreign partners;
interest on cash investments; income from the sale of land; and property leases. For the
period under review (2014, 2015, and 2016), at least 83 percent of GAM's revenue has
been generated through property taxes, levies and fines.
While the variance in revenue composition was more than 15 percent in FY2015 and
FY2016, the variance in 2016 was exceptionally high at 28.9 percent. According to officials,
this is attributable to the failure of the central government to honor its obligations on fuel
levies collected on behalf of GAM, as well as Gulf country grants not being disbursed as
planned.
However, further analysis of the data reveals that revenues from property taxes, fines and
levies exceeded the budget by 4.5 percent. whereas investment income fell short by 3.3
percent in 2014. In 2015, however, revenue from property taxes, fines and levies fell below
budget by 11.2 percent.
Dimension rating = D
PI-3 Dimension Score Justification
Revenue outturn C Scoring Method M2
3.1 Aggregate revenue outturn B Aggregate revenue outturn compared to the originally approved budget was between 94 and 112 percent in two of the last three years. Specifically, it was 99.4, 94 and 83.1 percent in FY2014, 2015 and 2016, respectively.
3.2 Revenue composition outturn
D Composition variance was more than 15 percent in two of the last three years. Actual variances were 8.1 percent in 2014; 18.9 percent in 2015; and 28.9 percent in 2016.
Ongoing reforms:
No known reforms.
28
Pillar II. Transparency of public finances
PI-4 Budget classification
This indicator uses a single dimension to assess the extent to which GAM’s budget and
account classification is consistent with international standards.
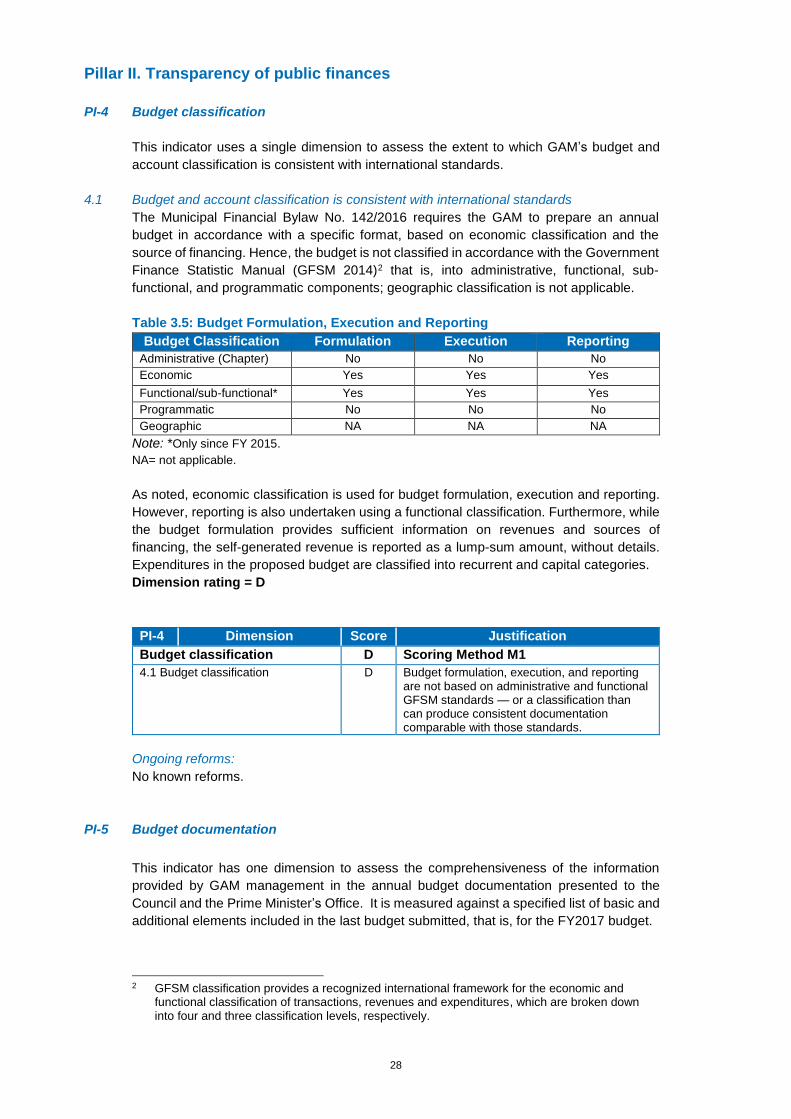
4.1 Budget and account classification is consistent with international standards
The Municipal Financial Bylaw No. 142/2016 requires the GAM to prepare an annual
budget in accordance with a specific format, based on economic classification and the
source of financing. Hence, the budget is not classified in accordance with the Government
Finance Statistic Manual (GFSM 2014)2 that is, into administrative, functional, sub-
functional, and programmatic components; geographic classification is not applicable.
Table 3.5: Budget Formulation, Execution and Reporting
Budget Classification Formulation Execution Reporting
Administrative (Chapter) No No No
Economic Yes Yes Yes
Functional/sub-functional* Yes Yes Yes
Programmatic No No No
Geographic NA NA NA
Note: *Only since FY 2015.
NA= not applicable.
As noted, economic classification is used for budget formulation, execution and reporting.
However, reporting is also undertaken using a functional classification. Furthermore, while
the budget formulation provides sufficient information on revenues and sources of
financing, the self-generated revenue is reported as a lump-sum amount, without details.
Expenditures in the proposed budget are classified into recurrent and capital categories.
Dimension rating = D
PI-4 Dimension Score Justification
Budget classification D Scoring Method M1
4.1 Budget classification D Budget formulation, execution, and reporting are not based on administrative and functional GFSM standards — or a classification than can produce consistent documentation comparable with those standards.
Ongoing reforms:
No known reforms.
PI-5 Budget documentation
This indicator has one dimension to assess the comprehensiveness of the information
provided by GAM management in the annual budget documentation presented to the
Council and the Prime Minister’s Office. It is measured against a specified list of basic and
additional elements included in the last budget submitted, that is, for the FY2017 budget.
2 GFSM classification provides a recognized international framework for the economic and
functional classification of transactions, revenues and expenditures, which are broken down into four and three classification levels, respectively.
29
5.1 The comprehensiveness of the information provided in the annual budget documentation
In accordance with the Law on Municipalities (No. 41/2015), the Council approves the
general and annual budgets. Whereas for all other municipalities in Jordan, this requires
the endorsement by the Minister of Municipalities, in the case of GAM, the Prime Minister
approves the annual budget.
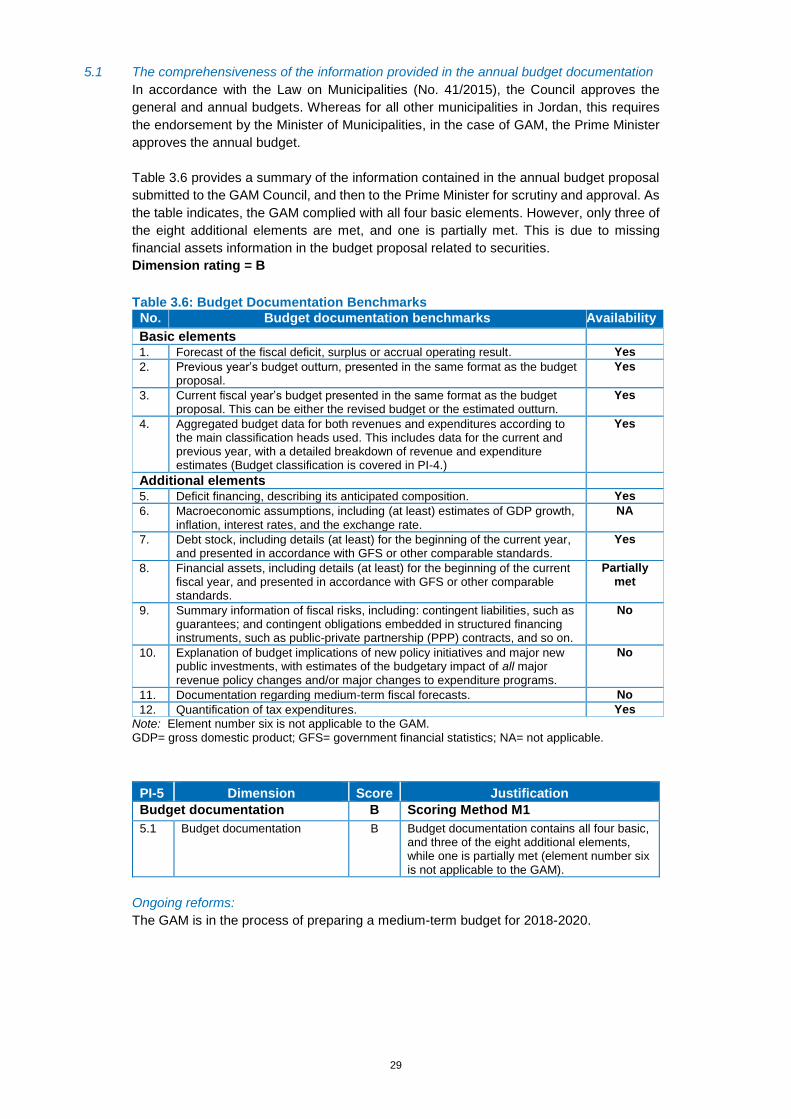
Table 3.6 provides a summary of the information contained in the annual budget proposal
submitted to the GAM Council, and then to the Prime Minister for scrutiny and approval. As
the table indicates, the GAM complied with all four basic elements. However, only three of
the eight additional elements are met, and one is partially met. This is due to missing
financial assets information in the budget proposal related to securities.
Dimension rating = B
Table 3.6: Budget Documentation Benchmarks
No. Budget documentation benchmarks Availability
Basic elements 1. Forecast of the fiscal deficit, surplus or accrual operating result. Yes
2. Previous year’s budget outturn, presented in the same format as the budget proposal.
Yes
3. Current fiscal year’s budget presented in the same format as the budget proposal. This can be either the revised budget or the estimated outturn.
Yes
4. Aggregated budget data for both revenues and expenditures according to the main classification heads used. This includes data for the current and previous year, with a detailed breakdown of revenue and expenditure estimates (Budget classification is covered in PI-4.)
Yes
Additional elements
5. Deficit financing, describing its anticipated composition. Yes
6. Macroeconomic assumptions, including (at least) estimates of GDP growth, inflation, interest rates, and the exchange rate.
NA
7. Debt stock, including details (at least) for the beginning of the current year, and presented in accordance with GFS or other comparable standards.
Yes
8. Financial assets, including details (at least) for the beginning of the current fiscal year, and presented in accordance with GFS or other comparable standards.
Partially met
9. Summary information of fiscal risks, including: contingent liabilities, such as guarantees; and contingent obligations embedded in structured financing instruments, such as public-private partnership (PPP) contracts, and so on.
No
10. Explanation of budget implications of new policy initiatives and major new public investments, with estimates of the budgetary impact of all major revenue policy changes and/or major changes to expenditure programs.
No
11. Documentation regarding medium-term fiscal forecasts. No
12. Quantification of tax expenditures. Yes
Note: Element number six is not applicable to the GAM. GDP= gross domestic product; GFS= government financial statistics; NA= not applicable.
PI-5 Dimension Score Justification
Budget documentation B Scoring Method M1
5.1 Budget documentation B Budget documentation contains all four basic, and three of the eight additional elements, while one is partially met (element number six is not applicable to the GAM).
Ongoing reforms:
The GAM is in the process of preparing a medium-term budget for 2018-2020.
30
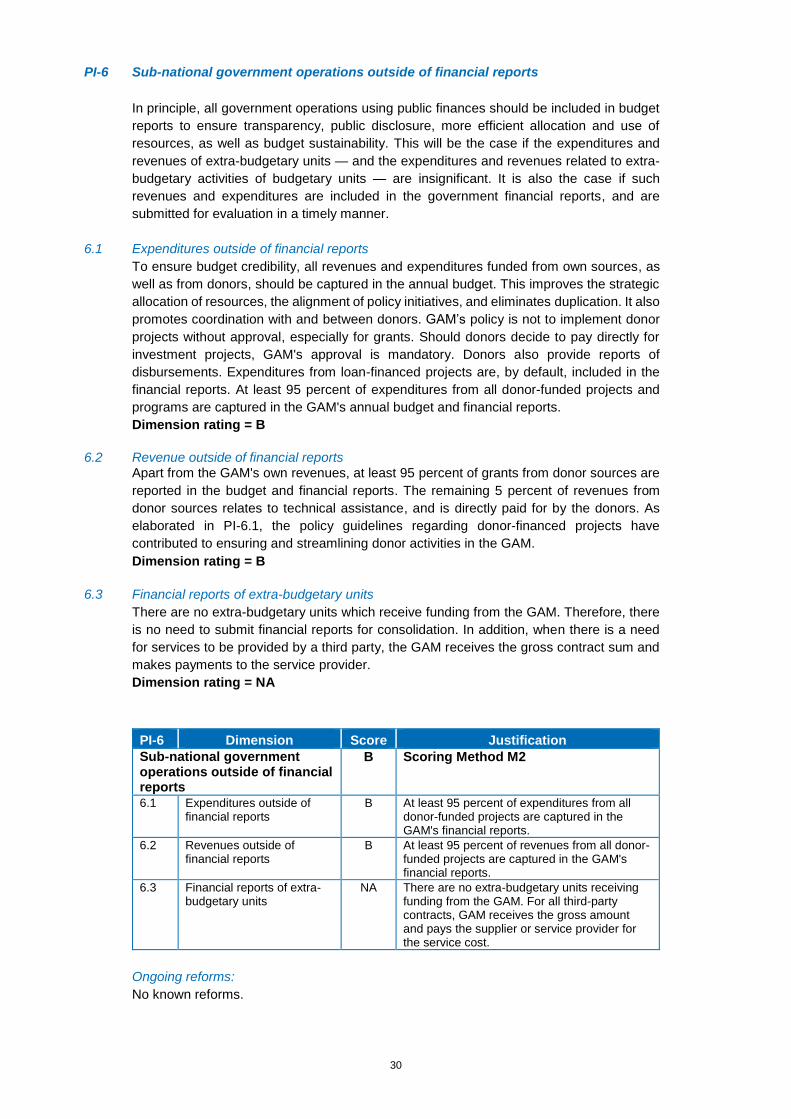
PI-6 Sub-national government operations outside of financial reports
In principle, all government operations using public finances should be included in budget
reports to ensure transparency, public disclosure, more efficient allocation and use of
resources, as well as budget sustainability. This will be the case if the expenditures and
revenues of extra-budgetary units — and the expenditures and revenues related to extra-
budgetary activities of budgetary units — are insignificant. It is also the case if such
revenues and expenditures are included in the government financial reports, and are
submitted for evaluation in a timely manner.
6.1 Expenditures outside of financial reports
To ensure budget credibility, all revenues and expenditures funded from own sources, as
well as from donors, should be captured in the annual budget. This improves the strategic
allocation of resources, the alignment of policy initiatives, and eliminates duplication. It also
promotes coordination with and between donors. GAM’s policy is not to implement donor
projects without approval, especially for grants. Should donors decide to pay directly for
investment projects, GAM's approval is mandatory. Donors also provide reports of
disbursements. Expenditures from loan-financed projects are, by default, included in the
financial reports. At least 95 percent of expenditures from all donor-funded projects and
programs are captured in the GAM's annual budget and financial reports.
Dimension rating = B
6.2 Revenue outside of financial reports Apart from the GAM's own revenues, at least 95 percent of grants from donor sources are
reported in the budget and financial reports. The remaining 5 percent of revenues from
donor sources relates to technical assistance, and is directly paid for by the donors. As
elaborated in PI-6.1, the policy guidelines regarding donor-financed projects have
contributed to ensuring and streamlining donor activities in the GAM.
Dimension rating = B
6.3 Financial reports of extra-budgetary units
There are no extra-budgetary units which receive funding from the GAM. Therefore, there
is no need to submit financial reports for consolidation. In addition, when there is a need
for services to be provided by a third party, the GAM receives the gross contract sum and
makes payments to the service provider.
Dimension rating = NA
PI-6 Dimension Score Justification
Sub-national government operations outside of financial reports
B Scoring Method M2
6.1 Expenditures outside of financial reports
B At least 95 percent of expenditures from all donor-funded projects are captured in the GAM's financial reports.
6.2 Revenues outside of financial reports
B At least 95 percent of revenues from all donor-funded projects are captured in the GAM's financial reports.
6.3 Financial reports of extra-budgetary units
NA There are no extra-budgetary units receiving funding from the GAM. For all third-party contracts, GAM receives the gross amount and pays the supplier or service provider for the service cost.
Ongoing reforms:
No known reforms.
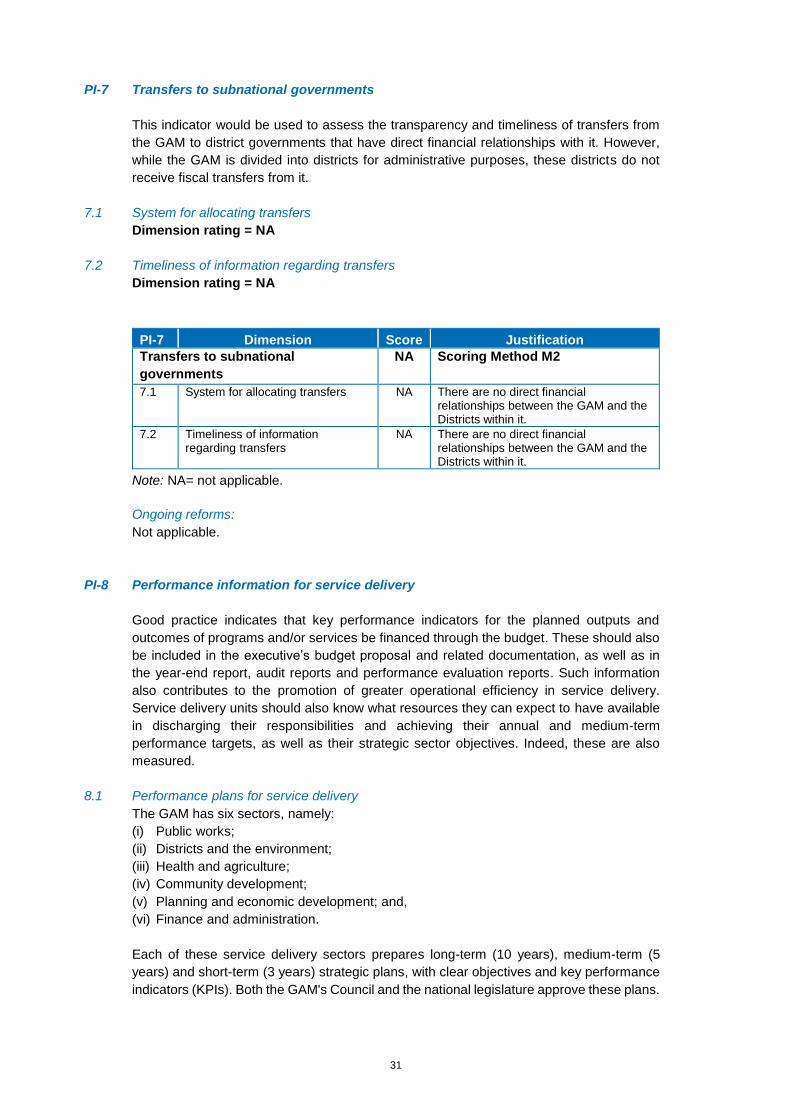
31
PI-7 Transfers to subnational governments
This indicator would be used to assess the transparency and timeliness of transfers from
the GAM to district governments that have direct financial relationships with it. However,
while the GAM is divided into districts for administrative purposes, these districts do not
receive fiscal transfers from it.
7.1 System for allocating transfers
Dimension rating = NA
7.2 Timeliness of information regarding transfers
Dimension rating = NA
PI-7 Dimension Score Justification
Transfers to subnational
governments
NA Scoring Method M2
7.1 System for allocating transfers NA There are no direct financial relationships between the GAM and the Districts within it.
7.2 Timeliness of information regarding transfers
NA There are no direct financial relationships between the GAM and the Districts within it.
Note: NA= not applicable.
Ongoing reforms:
Not applicable.
PI-8 Performance information for service delivery
Good practice indicates that key performance indicators for the planned outputs and
outcomes of programs and/or services be financed through the budget. These should also
be included in the executive’s budget proposal and related documentation, as well as in
the year-end report, audit reports and performance evaluation reports. Such information
also contributes to the promotion of greater operational efficiency in service delivery.
Service delivery units should also know what resources they can expect to have available
in discharging their responsibilities and achieving their annual and medium-term
performance targets, as well as their strategic sector objectives. Indeed, these are also
measured.
8.1 Performance plans for service delivery
The GAM has six sectors, namely:
(i) Public works;
(ii) Districts and the environment;
(iii) Health and agriculture;
(iv) Community development;
(v) Planning and economic development; and,
(vi) Finance and administration.
Each of these service delivery sectors prepares long-term (10 years), medium-term (5
years) and short-term (3 years) strategic plans, with clear objectives and key performance
indicators (KPIs). Both the GAM's Council and the national legislature approve these plans.
32
Annual action plans are developed from the 3-year, short-term strategy with succinct
linkages. Royal initiatives are also included in the strategic plans.
One important feature during preparation of the GAM's strategic plans is the collaboration
between the GAM and the private sector, as well as with the community. This is necessary
to ensure the 'buy-in' of all stakeholders. The GAM has a communications strategy, which
outlines modes of public information. Key among them are: publications posted to GAM's
website; a weekly 4-hour radio program; constant interaction with all 22 district
representatives on GAM's Governing Council; and a community feedback mechanism
implemented through the distribution of questionnaires. For instance, the launch of the
'Cave Tourist Project' was given media coverage and published on the GAM's website.
Each district representative receives a copy of the approved sector strategies, which
contains KPIs classified according to each service sector. This is in turn used to monitor
implementation of planned activities and performance targets.
Dimension rating = A
8.2 Performance achieved for service delivery
The Strategic Planning Department monitors and evaluates projects and programs by
measuring outcomes against KPIs, and using reporting templates developed to monitor
progress. Monitoring is twofold in nature: (i) financial, in collaboration with the finance, audit
and budget departments; and (ii) the monitoring of physical progress. Financial monitoring
considers approved project budget allocations, actual cash disbursements or cost to date,
rate of absorption, unutilized budget, and the variance in terms of budget versus actual
disbursements. Physical progress monitoring measures the rate of implementation by
comparing target completion dates against actual completion dates, as well as the planned
versus actual outcomes in terms of quality and standards. Project completion and
performance reports are published at least annually on GAM's website according to each
sector. District representatives also receive copies of completion reports.
Dimension rating = B
8.3 Resources received by service delivery units
This dimension measures the extent to which a system is in place to monitor if the service
delivery units received the funds allocated to the sector/services as planned.
Although a Public Expenditure Tracking Survey (PETS) has not been conducted in the last
three fiscal years to track resource allocation to service delivery sectors, the GAM's internal
reporting framework provides a detailed account of all resources received both in cash and
in kind. The information is reported in GAM's audited annual financial statements. For
instance, donor contributions (grants) in cash and in kind amounted to JD 1.1 million (US$
equivalent) in FY2015. The Royal Initiative on Public Parks in Amman donated toys and
gaming equipment to the GAM. These were received and recorded into the stores ledger,
and distributed to the designated parks.
Dimension rating = B
8.4 Performance evaluation for service delivery
This dimension assesses the extent to which the design of service delivery programs and
the efficiency and effectiveness of these programs is assessed in a systematic manner
through independent performance evaluations. The GAM’s Excellence Department is
responsible for internal monitoring and evaluation of projects and performance standards
for service delivery across all sectors. The institutional framework for monitoring and
evaluation (M&E) includes collection of feedback from citizens through questionnaires,
which has proven to be very useful. The Audit Bureau also undertakes performance audits
and publishes its reports. Projects and programs funded by development partners have a
mandatory external evaluation system as part of the contractual terms. For instance, the
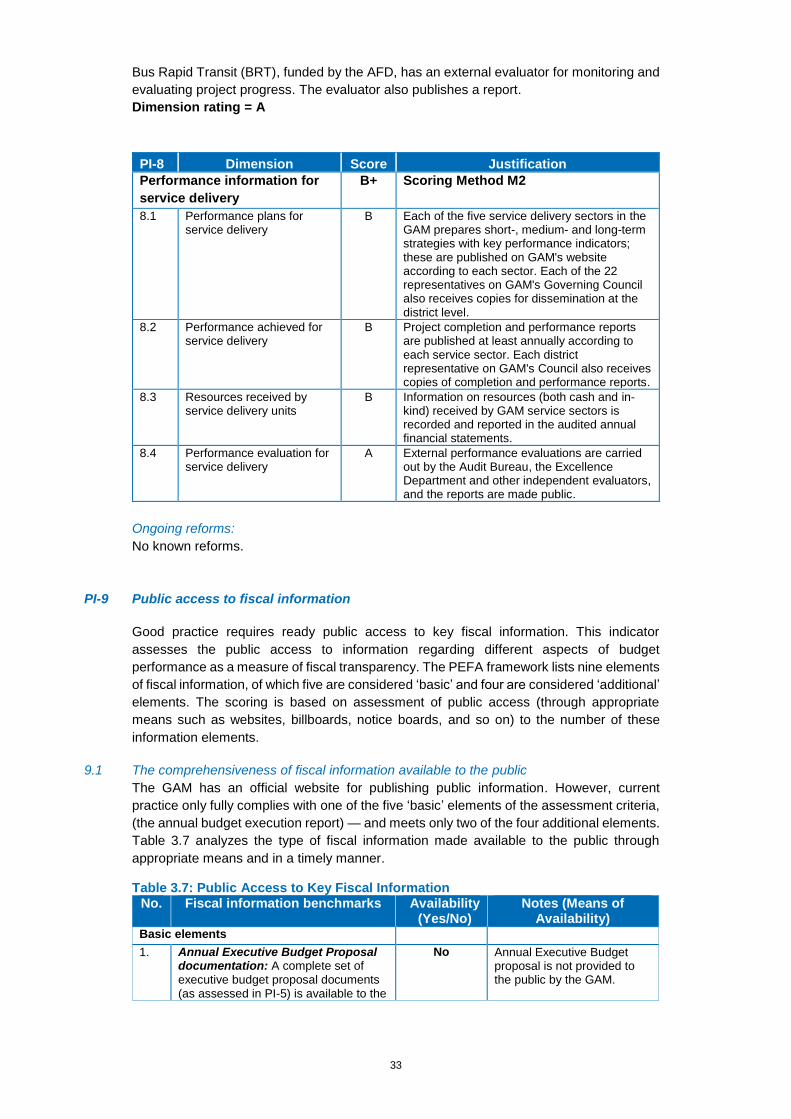
33
Bus Rapid Transit (BRT), funded by the AFD, has an external evaluator for monitoring and
evaluating project progress. The evaluator also publishes a report.
Dimension rating = A
PI-8 Dimension Score Justification
Performance information for
service delivery
B+ Scoring Method M2
8.1 Performance plans for service delivery
B Each of the five service delivery sectors in the GAM prepares short-, medium- and long-term strategies with key performance indicators; these are published on GAM's website according to each sector. Each of the 22 representatives on GAM's Governing Council also receives copies for dissemination at the district level.
8.2 Performance achieved for service delivery
B Project completion and performance reports are published at least annually according to each service sector. Each district representative on GAM's Council also receives copies of completion and performance reports.
8.3 Resources received by service delivery units
B Information on resources (both cash and in-kind) received by GAM service sectors is recorded and reported in the audited annual financial statements.
8.4 Performance evaluation for service delivery
A External performance evaluations are carried out by the Audit Bureau, the Excellence Department and other independent evaluators, and the reports are made public.
Ongoing reforms:
No known reforms.
PI-9 Public access to fiscal information
Good practice requires ready public access to key fiscal information. This indicator
assesses the public access to information regarding different aspects of budget
performance as a measure of fiscal transparency. The PEFA framework lists nine elements
of fiscal information, of which five are considered ‘basic’ and four are considered ‘additional’
elements. The scoring is based on assessment of public access (through appropriate
means such as websites, billboards, notice boards, and so on) to the number of these
information elements.
9.1 The comprehensiveness of fiscal information available to the public
The GAM has an official website for publishing public information. However, current
practice only fully complies with one of the five ‘basic’ elements of the assessment criteria,
(the annual budget execution report) — and meets only two of the four additional elements.
Table 3.7 analyzes the type of fiscal information made available to the public through
appropriate means and in a timely manner.
Table 3.7: Public Access to Key Fiscal Information No. Fiscal information benchmarks Availability
(Yes/No) Notes (Means of
Availability) Basic elements
1. Annual Executive Budget Proposal documentation: A complete set of executive budget proposal documents (as assessed in PI-5) is available to the
No Annual Executive Budget proposal is not provided to the public by the GAM.
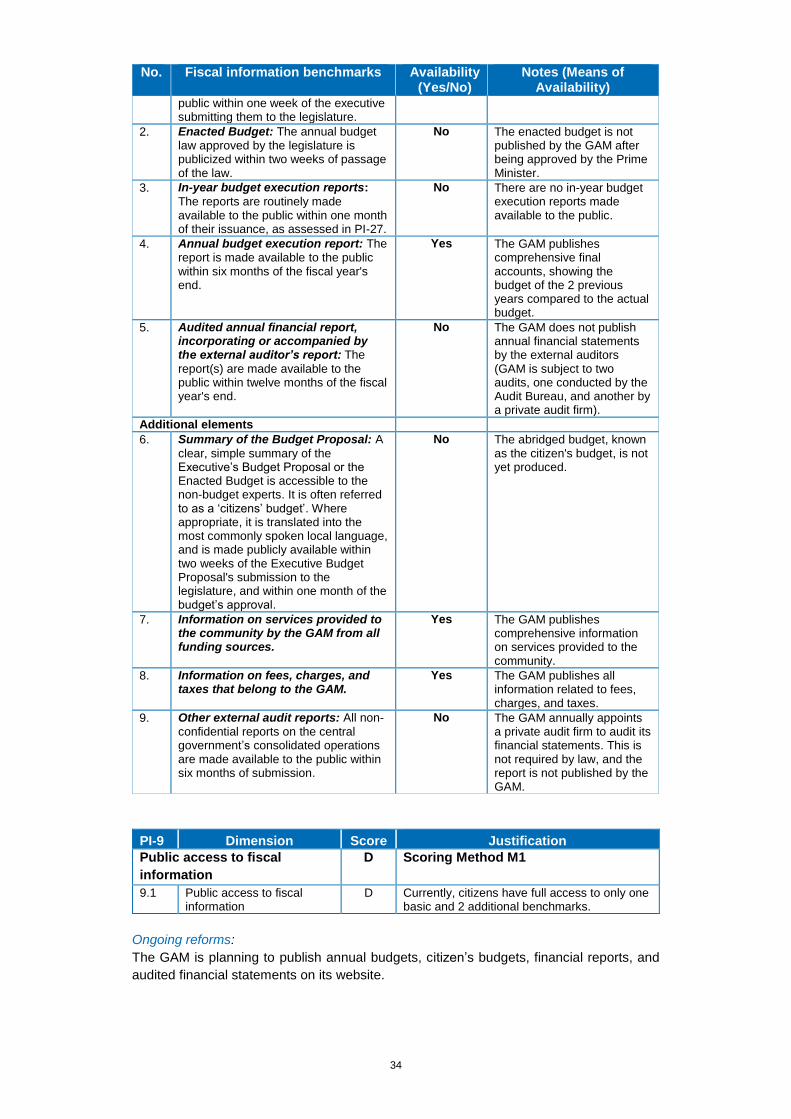
34
No. Fiscal information benchmarks Availability (Yes/No)
Notes (Means of Availability)
public within one week of the executive submitting them to the legislature.
2. Enacted Budget: The annual budget law approved by the legislature is publicized within two weeks of passage of the law.
No The enacted budget is not published by the GAM after being approved by the Prime Minister.
3. In-year budget execution reports:
The reports are routinely made available to the public within one month of their issuance, as assessed in PI-27.
No There are no in-year budget execution reports made available to the public.
4. Annual budget execution report: The report is made available to the public within six months of the fiscal year's end.
Yes The GAM publishes comprehensive final accounts, showing the budget of the 2 previous years compared to the actual budget.
5. Audited annual financial report, incorporating or accompanied by the external auditor’s report: The
report(s) are made available to the public within twelve months of the fiscal year's end.
No The GAM does not publish annual financial statements by the external auditors (GAM is subject to two audits, one conducted by the Audit Bureau, and another by a private audit firm).
Additional elements
6. Summary of the Budget Proposal: A
clear, simple summary of the Executive’s Budget Proposal or the Enacted Budget is accessible to the non-budget experts. It is often referred to as a ‘citizens’ budget’. Where appropriate, it is translated into the most commonly spoken local language, and is made publicly available within two weeks of the Executive Budget Proposal's submission to the legislature, and within one month of the budget’s approval.
No The abridged budget, known as the citizen's budget, is not yet produced.
7. Information on services provided to the community by the GAM from all funding sources.
Yes The GAM publishes comprehensive information on services provided to the community.
8. Information on fees, charges, and taxes that belong to the GAM.
Yes The GAM publishes all information related to fees, charges, and taxes.
9. Other external audit reports: All non-confidential reports on the central government’s consolidated operations are made available to the public within six months of submission.
No The GAM annually appoints a private audit firm to audit its financial statements. This is not required by law, and the report is not published by the GAM.
PI-9 Dimension Score Justification
Public access to fiscal
information
D Scoring Method M1
9.1 Public access to fiscal information
D Currently, citizens have full access to only one basic and 2 additional benchmarks.
Ongoing reforms:
The GAM is planning to publish annual budgets, citizen’s budgets, financial reports, and
audited financial statements on its website.
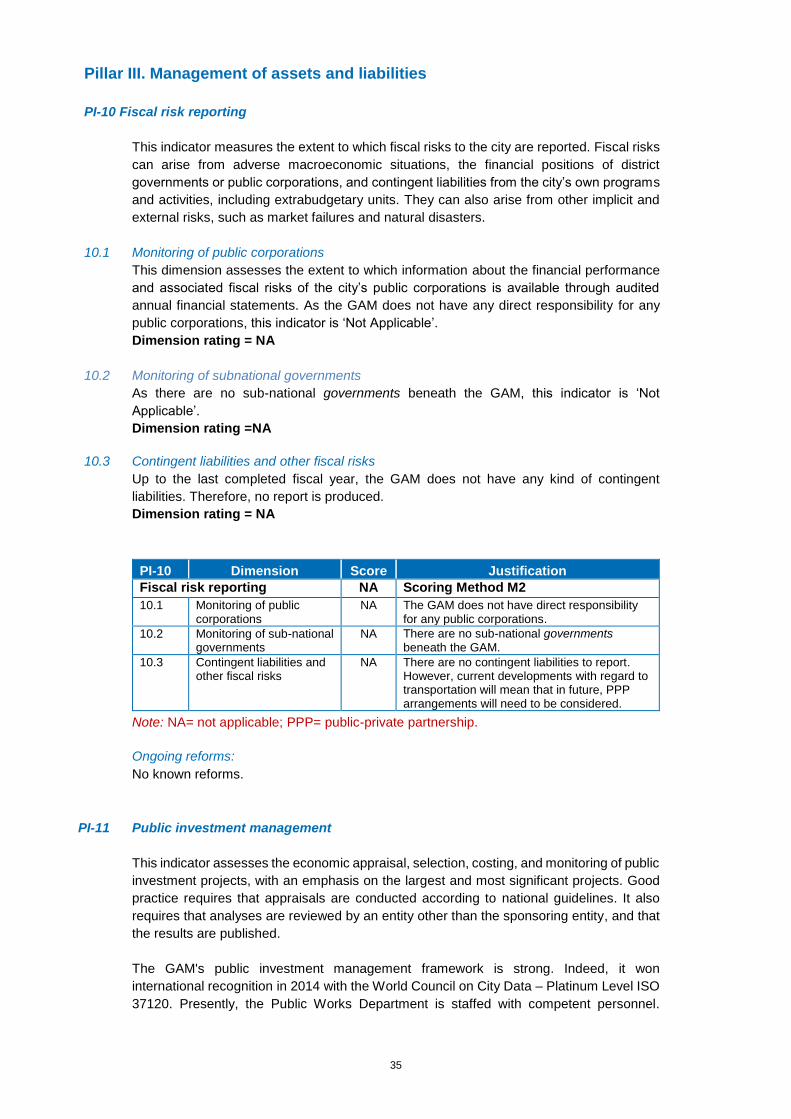
35
Pillar III. Management of assets and liabilities
PI-10 Fiscal risk reporting
This indicator measures the extent to which fiscal risks to the city are reported. Fiscal risks
can arise from adverse macroeconomic situations, the financial positions of district
governments or public corporations, and contingent liabilities from the city’s own programs
and activities, including extrabudgetary units. They can also arise from other implicit and
external risks, such as market failures and natural disasters.
10.1 Monitoring of public corporations
This dimension assesses the extent to which information about the financial performance
and associated fiscal risks of the city’s public corporations is available through audited
annual financial statements. As the GAM does not have any direct responsibility for any
public corporations, this indicator is ‘Not Applicable’.
Dimension rating = NA
10.2 Monitoring of subnational governments
As there are no sub-national governments beneath the GAM, this indicator is ‘Not
Applicable’.
Dimension rating =NA
10.3 Contingent liabilities and other fiscal risks
Up to the last completed fiscal year, the GAM does not have any kind of contingent
liabilities. Therefore, no report is produced.
Dimension rating = NA
PI-10 Dimension Score Justification
Fiscal risk reporting NA Scoring Method M2
10.1 Monitoring of public corporations
NA The GAM does not have direct responsibility for any public corporations.
10.2 Monitoring of sub-national governments
NA There are no sub-national governments beneath the GAM.
10.3 Contingent liabilities and other fiscal risks
NA There are no contingent liabilities to report. However, current developments with regard to transportation will mean that in future, PPP arrangements will need to be considered.
Note: NA= not applicable; PPP= public-private partnership.
Ongoing reforms:
No known reforms.
PI-11 Public investment management
This indicator assesses the economic appraisal, selection, costing, and monitoring of public
investment projects, with an emphasis on the largest and most significant projects. Good
practice requires that appraisals are conducted according to national guidelines. It also
requires that analyses are reviewed by an entity other than the sponsoring entity, and that
the results are published.
The GAM's public investment management framework is strong. Indeed, it won
international recognition in 2014 with the World Council on City Data – Platinum Level ISO
37120. Presently, the Public Works Department is staffed with competent personnel.
36
However, it appears there is a sustainability plan to ensure continuity should current staff
vacate their posts.
11.1 Economic analysis of investment proposals
The PEFA Framework defines “major investment projects” as those in which the total
investment cost of the project amounts to 1 percent or more of total annual budget
expenditures. Such projects must be among the largest 10 projects (by total investment
cost) for each of the five largest government units, as measured by the units’ investment
project expenditures. Table 3.8 uses this definition to highlight the five largest current
projects.
The GAM Works Department is responsible for critically analyzing investment proposals,
although the analysis seems to be less rigorous for those initiated by His Majesty the King.
The public investment technical team is comprised of staff from the Works, Operations, and
Budget Departments. Investment proposals are analyzed in line with investment guidelines
developed by the GAM. The guidelines provide institutional content, among other
information, including the project approval process, the private sector, and community
involvement and project impact evaluation.
The institutional framework supporting economic analysis of investment projects is twofold.
First, His Majesty initiates projects of interest. Second, it is underpinned by community
necessity and coincides with GAM's medium-term strategic plans where questionnaires are
distributed to assess the socio-economic impact. Investment projects emanating from the
Royal Court are mandatory and receive requisite budgeting. Those from the communities
and the strategic plan undergo rigorous economic analysis to ensure that they fit into the
overall medium-term strategy. This takes into consideration: GAM's fiscal space; its staff
capacity to undertake, monitor and implement projects; and, most importantly, the overall
public interest — irrespective of whether the investment is economically profitable or not.
Further, proposed projects will have to be prioritized based on GAM's financial position and
the overall public interest.
Although the GAM is administratively and financially independent of the central
government, project appraisals are undertaken in consultation with the Ministry of Public
Works, and the final review and approval rests solely with the Prime Minister. The results
of the economic analysis of investment projects are published, first by informing each of
the 22 community representatives on GAM's Council, and second through media
engagements spearheaded by the Mayor. Results are also posted on GAM's website.
Dimension rating = B
11.2 Investment project selection
Project prioritization and selection is based on established guidelines. Three key criteria
underpin project prioritization and selection, including:
• Desirability – project(s) must be in line with GAM's overall medium-term strategic
plan; projects must also be of institutional relevance, and provide support to both the
public and private sectors;
• Achievability – this criterion looks at project deliverability, funding mechanisms and
other environmental constraints and challenges; and
• Viability – including cost implications and mainstream revenue-generating potential,
management implications, financial sustainability and project economic impact. More
importantly, the overall public interest overrides economic benefits.
Another key feature in the project selection process is the use of the PESTEL analysis
module. Specifically, this analysis examines the political, economic, social, technological,
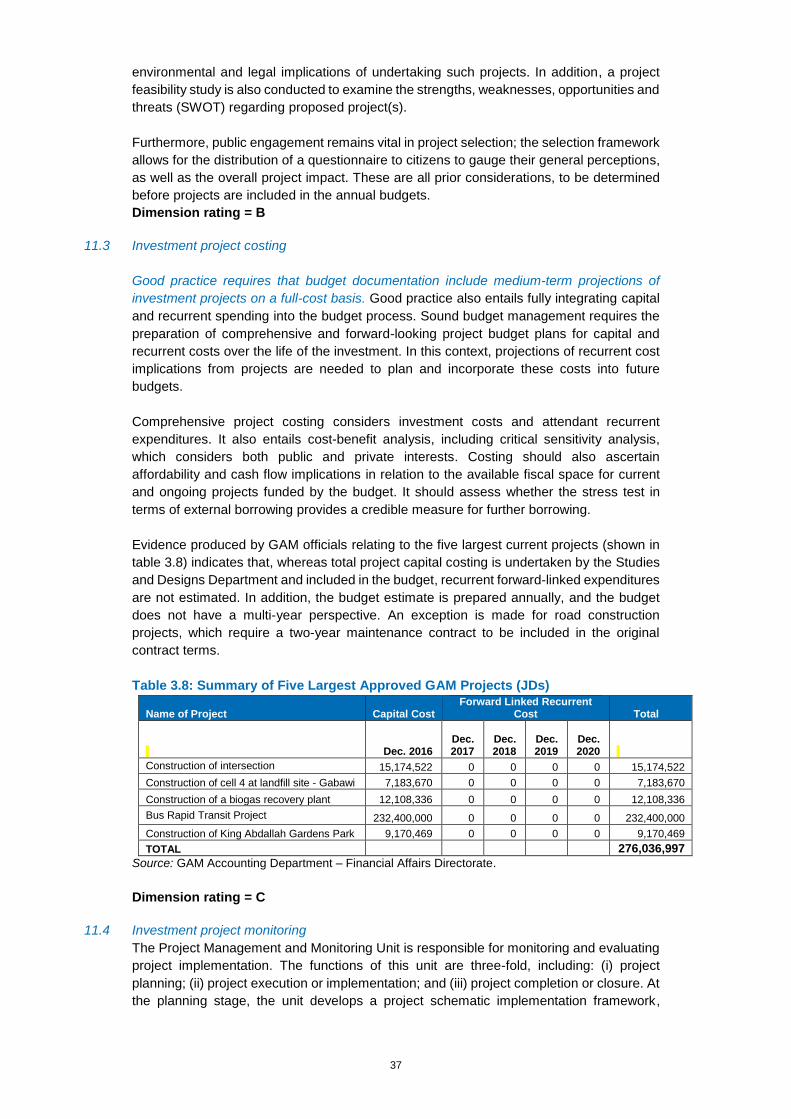
37
environmental and legal implications of undertaking such projects. In addition, a project
feasibility study is also conducted to examine the strengths, weaknesses, opportunities and
threats (SWOT) regarding proposed project(s).
Furthermore, public engagement remains vital in project selection; the selection framework
allows for the distribution of a questionnaire to citizens to gauge their general perceptions,
as well as the overall project impact. These are all prior considerations, to be determined
before projects are included in the annual budgets.
Dimension rating = B
11.3 Investment project costing
Good practice requires that budget documentation include medium-term projections of
investment projects on a full-cost basis. Good practice also entails fully integrating capital
and recurrent spending into the budget process. Sound budget management requires the
preparation of comprehensive and forward-looking project budget plans for capital and
recurrent costs over the life of the investment. In this context, projections of recurrent cost
implications from projects are needed to plan and incorporate these costs into future
budgets.
Comprehensive project costing considers investment costs and attendant recurrent
expenditures. It also entails cost-benefit analysis, including critical sensitivity analysis,
which considers both public and private interests. Costing should also ascertain
affordability and cash flow implications in relation to the available fiscal space for current
and ongoing projects funded by the budget. It should assess whether the stress test in
terms of external borrowing provides a credible measure for further borrowing.
Evidence produced by GAM officials relating to the five largest current projects (shown in
table 3.8) indicates that, whereas total project capital costing is undertaken by the Studies
and Designs Department and included in the budget, recurrent forward-linked expenditures
are not estimated. In addition, the budget estimate is prepared annually, and the budget
does not have a multi-year perspective. An exception is made for road construction
projects, which require a two-year maintenance contract to be included in the original
contract terms.
Table 3.8: Summary of Five Largest Approved GAM Projects (JDs)
Name of Project Capital Cost Forward Linked Recurrent
Cost Total
Dec. 2016
Dec. 2017
Dec. 2018
Dec. 2019
Dec. 2020
Construction of intersection 15,174,522 0 0 0 0 15,174,522
Construction of cell 4 at landfill site - Gabawi 7,183,670 0 0 0 0 7,183,670
Construction of a biogas recovery plant 12,108,336 0 0 0 0 12,108,336
Bus Rapid Transit Project 232,400,000 0 0 0 0 232,400,000
Construction of King Abdallah Gardens Park 9,170,469 0 0 0 0 9,170,469
TOTAL 276,036,997
Source: GAM Accounting Department – Financial Affairs Directorate.
Dimension rating = C
11.4 Investment project monitoring
The Project Management and Monitoring Unit is responsible for monitoring and evaluating
project implementation. The functions of this unit are three-fold, including: (i) project
planning; (ii) project execution or implementation; and (iii) project completion or closure. At
the planning stage, the unit develops a project schematic implementation framework,
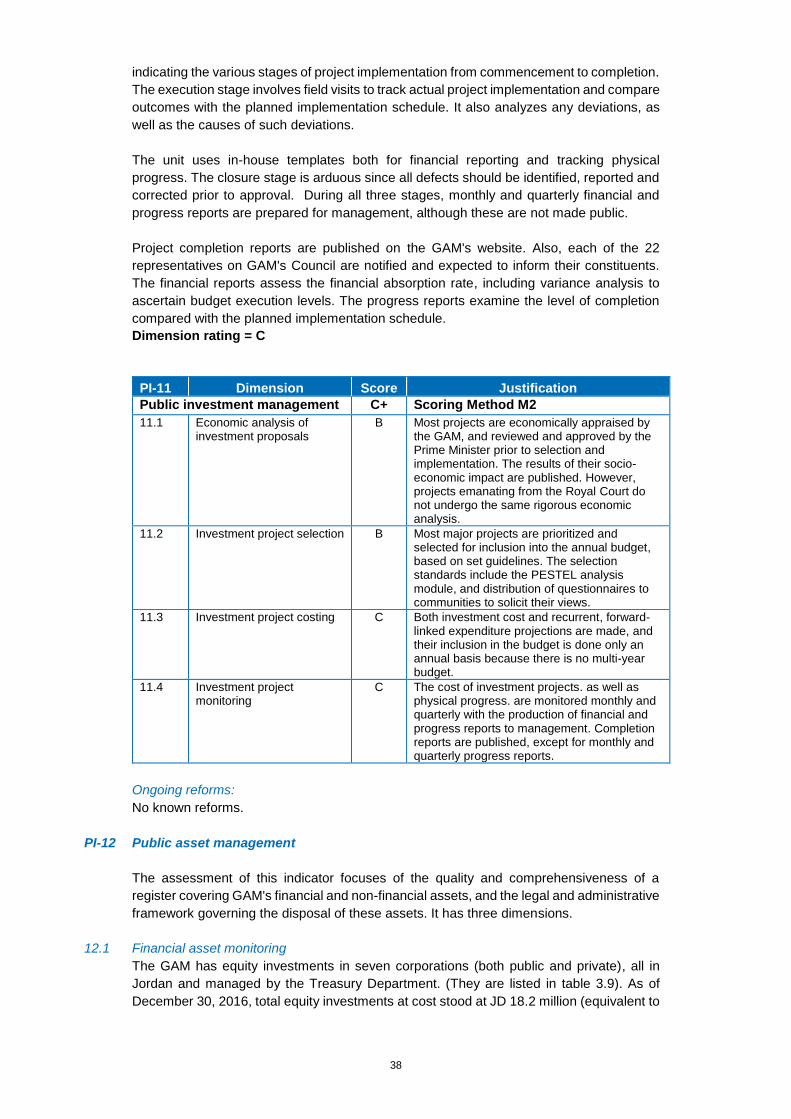
38
indicating the various stages of project implementation from commencement to completion.
The execution stage involves field visits to track actual project implementation and compare
outcomes with the planned implementation schedule. It also analyzes any deviations, as
well as the causes of such deviations.
The unit uses in-house templates both for financial reporting and tracking physical
progress. The closure stage is arduous since all defects should be identified, reported and
corrected prior to approval. During all three stages, monthly and quarterly financial and
progress reports are prepared for management, although these are not made public.
Project completion reports are published on the GAM's website. Also, each of the 22
representatives on GAM's Council are notified and expected to inform their constituents.
The financial reports assess the financial absorption rate, including variance analysis to
ascertain budget execution levels. The progress reports examine the level of completion
compared with the planned implementation schedule.
Dimension rating = C
PI-11 Dimension Score Justification
Public investment management C+ Scoring Method M2
11.1 Economic analysis of investment proposals
B Most projects are economically appraised by the GAM, and reviewed and approved by the Prime Minister prior to selection and implementation. The results of their socio-economic impact are published. However, projects emanating from the Royal Court do not undergo the same rigorous economic analysis.
11.2 Investment project selection B Most major projects are prioritized and selected for inclusion into the annual budget, based on set guidelines. The selection standards include the PESTEL analysis module, and distribution of questionnaires to communities to solicit their views.
11.3 Investment project costing C Both investment cost and recurrent, forward-linked expenditure projections are made, and their inclusion in the budget is done only an annual basis because there is no multi-year budget.
11.4 Investment project monitoring
C The cost of investment projects. as well as physical progress. are monitored monthly and quarterly with the production of financial and progress reports to management. Completion reports are published, except for monthly and quarterly progress reports.
Ongoing reforms:
No known reforms.
PI-12 Public asset management
The assessment of this indicator focuses of the quality and comprehensiveness of a
register covering GAM's financial and non-financial assets, and the legal and administrative
framework governing the disposal of these assets. It has three dimensions.
12.1 Financial asset monitoring
The GAM has equity investments in seven corporations (both public and private), all in
Jordan and managed by the Treasury Department. (They are listed in table 3.9). As of
December 30, 2016, total equity investments at cost stood at JD 18.2 million (equivalent to
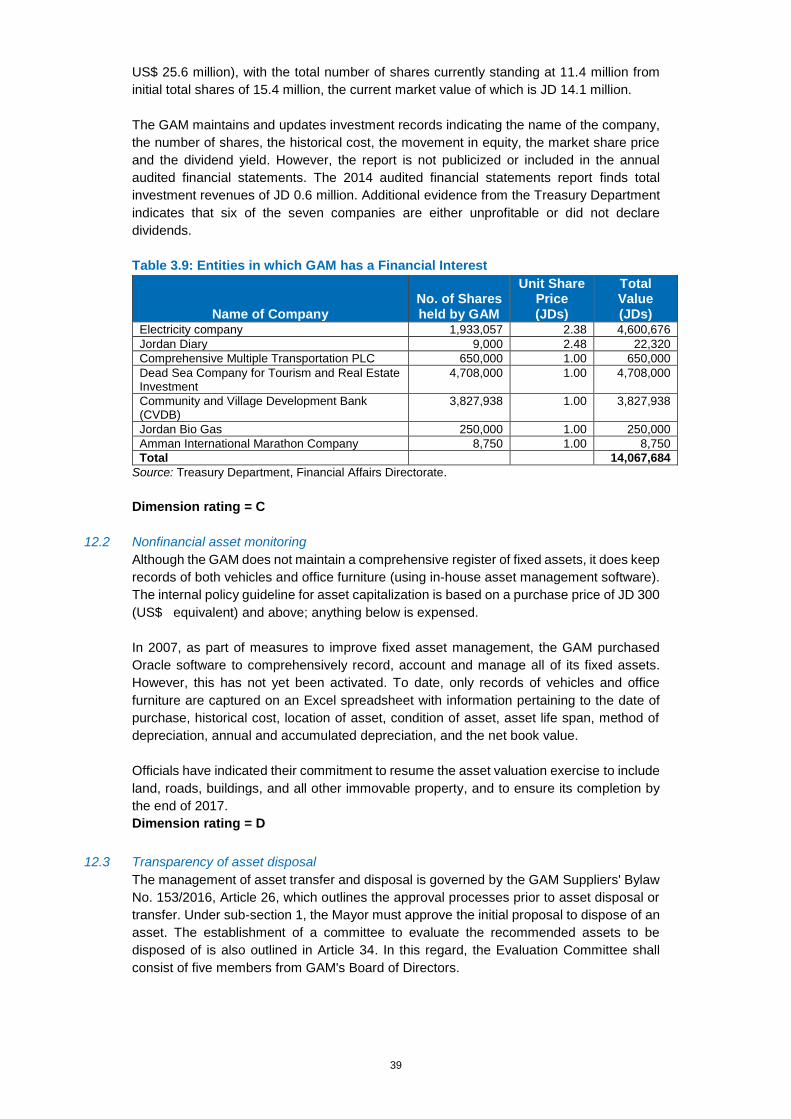
39
US$ 25.6 million), with the total number of shares currently standing at 11.4 million from
initial total shares of 15.4 million, the current market value of which is JD 14.1 million.
The GAM maintains and updates investment records indicating the name of the company,
the number of shares, the historical cost, the movement in equity, the market share price
and the dividend yield. However, the report is not publicized or included in the annual
audited financial statements. The 2014 audited financial statements report finds total
investment revenues of JD 0.6 million. Additional evidence from the Treasury Department
indicates that six of the seven companies are either unprofitable or did not declare
dividends.
Table 3.9: Entities in which GAM has a Financial Interest
Name of Company No. of Shares held by GAM
Unit Share Price (JDs)
Total Value (JDs)
Electricity company 1,933,057 2.38 4,600,676
Jordan Diary 9,000 2.48 22,320
Comprehensive Multiple Transportation PLC 650,000 1.00 650,000
Dead Sea Company for Tourism and Real Estate Investment
4,708,000 1.00 4,708,000
Community and Village Development Bank (CVDB)
3,827,938 1.00 3,827,938
Jordan Bio Gas 250,000 1.00 250,000
Amman International Marathon Company 8,750 1.00 8,750
Total
14,067,684
Source: Treasury Department, Financial Affairs Directorate.
Dimension rating = C
12.2 Nonfinancial asset monitoring
Although the GAM does not maintain a comprehensive register of fixed assets, it does keep
records of both vehicles and office furniture (using in-house asset management software).
The internal policy guideline for asset capitalization is based on a purchase price of JD 300
(US$ equivalent) and above; anything below is expensed.
In 2007, as part of measures to improve fixed asset management, the GAM purchased
Oracle software to comprehensively record, account and manage all of its fixed assets.
However, this has not yet been activated. To date, only records of vehicles and office
furniture are captured on an Excel spreadsheet with information pertaining to the date of
purchase, historical cost, location of asset, condition of asset, asset life span, method of
depreciation, annual and accumulated depreciation, and the net book value.
Officials have indicated their commitment to resume the asset valuation exercise to include
land, roads, buildings, and all other immovable property, and to ensure its completion by
the end of 2017.
Dimension rating = D
12.3 Transparency of asset disposal
The management of asset transfer and disposal is governed by the GAM Suppliers' Bylaw
No. 153/2016, Article 26, which outlines the approval processes prior to asset disposal or
transfer. Under sub-section 1, the Mayor must approve the initial proposal to dispose of an
asset. The establishment of a committee to evaluate the recommended assets to be
disposed of is also outlined in Article 34. In this regard, the Evaluation Committee shall
consist of five members from GAM's Board of Directors.
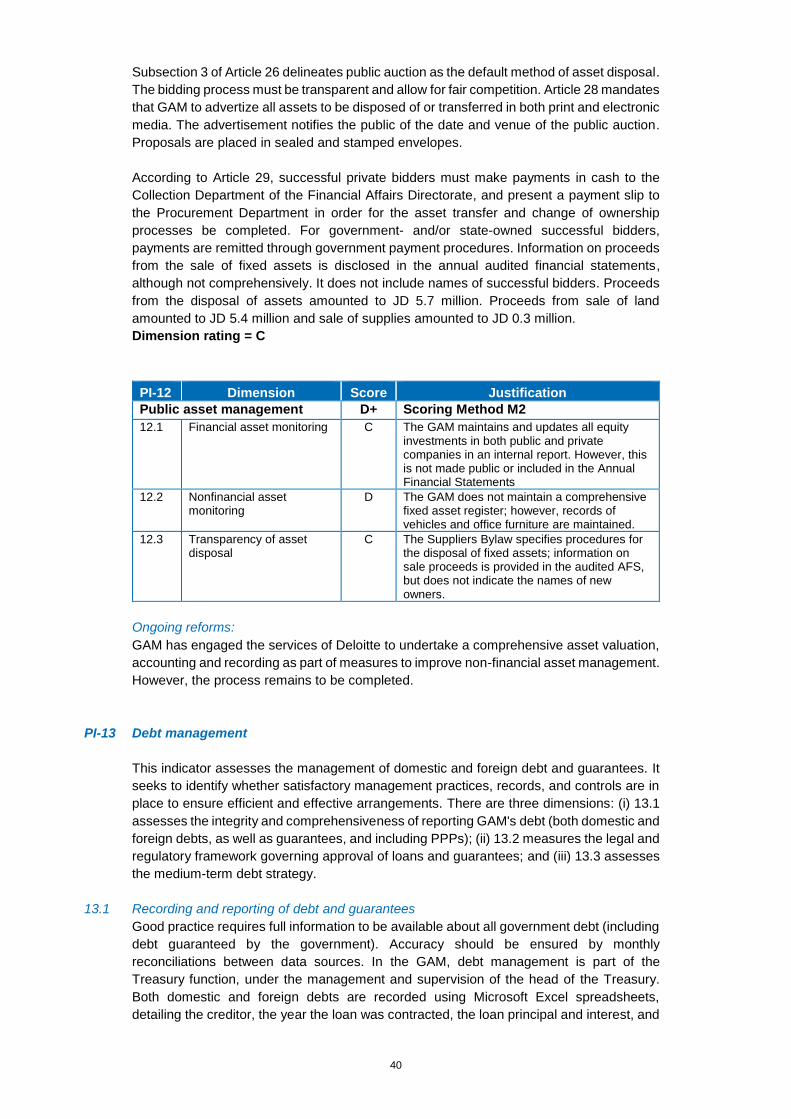
40
Subsection 3 of Article 26 delineates public auction as the default method of asset disposal.
The bidding process must be transparent and allow for fair competition. Article 28 mandates
that GAM to advertize all assets to be disposed of or transferred in both print and electronic
media. The advertisement notifies the public of the date and venue of the public auction.
Proposals are placed in sealed and stamped envelopes.
According to Article 29, successful private bidders must make payments in cash to the
Collection Department of the Financial Affairs Directorate, and present a payment slip to
the Procurement Department in order for the asset transfer and change of ownership
processes be completed. For government- and/or state-owned successful bidders,
payments are remitted through government payment procedures. Information on proceeds
from the sale of fixed assets is disclosed in the annual audited financial statements,
although not comprehensively. It does not include names of successful bidders. Proceeds
from the disposal of assets amounted to JD 5.7 million. Proceeds from sale of land
amounted to JD 5.4 million and sale of supplies amounted to JD 0.3 million.
Dimension rating = C
PI-12 Dimension Score Justification
Public asset management D+ Scoring Method M2
12.1 Financial asset monitoring C The GAM maintains and updates all equity investments in both public and private companies in an internal report. However, this is not made public or included in the Annual Financial Statements
12.2 Nonfinancial asset monitoring
D The GAM does not maintain a comprehensive fixed asset register; however, records of vehicles and office furniture are maintained.
12.3 Transparency of asset disposal
C The Suppliers Bylaw specifies procedures for the disposal of fixed assets; information on sale proceeds is provided in the audited AFS, but does not indicate the names of new owners.
Ongoing reforms:
GAM has engaged the services of Deloitte to undertake a comprehensive asset valuation,
accounting and recording as part of measures to improve non-financial asset management.
However, the process remains to be completed.
PI-13 Debt management
This indicator assesses the management of domestic and foreign debt and guarantees. It
seeks to identify whether satisfactory management practices, records, and controls are in
place to ensure efficient and effective arrangements. There are three dimensions: (i) 13.1
assesses the integrity and comprehensiveness of reporting GAM's debt (both domestic and
foreign debts, as well as guarantees, and including PPPs); (ii) 13.2 measures the legal and
regulatory framework governing approval of loans and guarantees; and (iii) 13.3 assesses
the medium-term debt strategy.
13.1 Recording and reporting of debt and guarantees
Good practice requires full information to be available about all government debt (including
debt guaranteed by the government). Accuracy should be ensured by monthly
reconciliations between data sources. In the GAM, debt management is part of the
Treasury function, under the management and supervision of the head of the Treasury.
Both domestic and foreign debts are recorded using Microsoft Excel spreadsheets,
detailing the creditor, the year the loan was contracted, the loan principal and interest, and
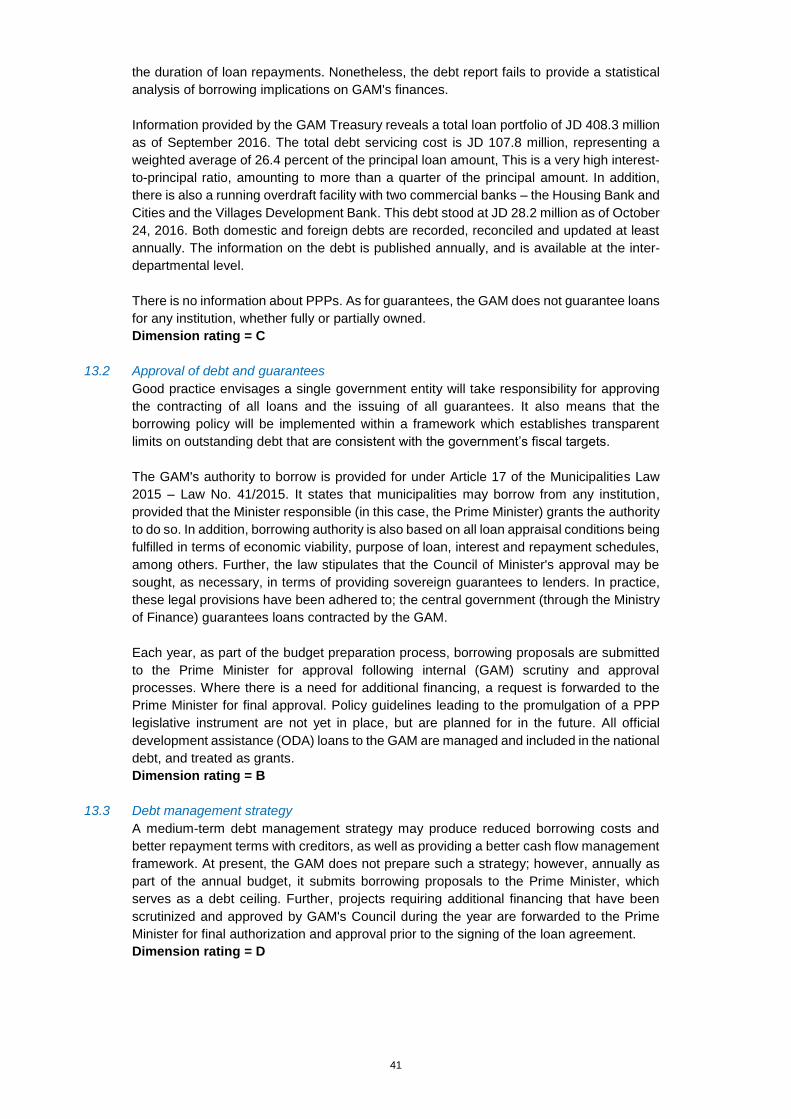
41
the duration of loan repayments. Nonetheless, the debt report fails to provide a statistical
analysis of borrowing implications on GAM's finances.
Information provided by the GAM Treasury reveals a total loan portfolio of JD 408.3 million
as of September 2016. The total debt servicing cost is JD 107.8 million, representing a
weighted average of 26.4 percent of the principal loan amount, This is a very high interest-
to-principal ratio, amounting to more than a quarter of the principal amount. In addition,
there is also a running overdraft facility with two commercial banks – the Housing Bank and
Cities and the Villages Development Bank. This debt stood at JD 28.2 million as of October
24, 2016. Both domestic and foreign debts are recorded, reconciled and updated at least
annually. The information on the debt is published annually, and is available at the inter-
departmental level.
There is no information about PPPs. As for guarantees, the GAM does not guarantee loans
for any institution, whether fully or partially owned.
Dimension rating = C
13.2 Approval of debt and guarantees
Good practice envisages a single government entity will take responsibility for approving
the contracting of all loans and the issuing of all guarantees. It also means that the
borrowing policy will be implemented within a framework which establishes transparent
limits on outstanding debt that are consistent with the government’s fiscal targets.
The GAM's authority to borrow is provided for under Article 17 of the Municipalities Law
2015 – Law No. 41/2015. It states that municipalities may borrow from any institution,
provided that the Minister responsible (in this case, the Prime Minister) grants the authority
to do so. In addition, borrowing authority is also based on all loan appraisal conditions being
fulfilled in terms of economic viability, purpose of loan, interest and repayment schedules,
among others. Further, the law stipulates that the Council of Minister's approval may be
sought, as necessary, in terms of providing sovereign guarantees to lenders. In practice,
these legal provisions have been adhered to; the central government (through the Ministry
of Finance) guarantees loans contracted by the GAM.
Each year, as part of the budget preparation process, borrowing proposals are submitted
to the Prime Minister for approval following internal (GAM) scrutiny and approval
processes. Where there is a need for additional financing, a request is forwarded to the
Prime Minister for final approval. Policy guidelines leading to the promulgation of a PPP
legislative instrument are not yet in place, but are planned for in the future. All official
development assistance (ODA) loans to the GAM are managed and included in the national
debt, and treated as grants.
Dimension rating = B
13.3 Debt management strategy
A medium-term debt management strategy may produce reduced borrowing costs and
better repayment terms with creditors, as well as providing a better cash flow management
framework. At present, the GAM does not prepare such a strategy; however, annually as
part of the annual budget, it submits borrowing proposals to the Prime Minister, which
serves as a debt ceiling. Further, projects requiring additional financing that have been
scrutinized and approved by GAM's Council during the year are forwarded to the Prime
Minister for final authorization and approval prior to the signing of the loan agreement.
Dimension rating = D
42
PI-13 Dimension Score Justification
Debt management C Scoring Method M2
13.1 Recording and reporting of debt and guarantees
C Both domestic and foreign debts are recorded and reconciled at least annually; however, information on the GAM's debt is not publicly available.
13.2 Approval of debt and guarantees
B The approval to borrow rests solely with the Prime Minister; reports on loans are also forwarded to the Prime Minister.
13.3 Debt management strategy D The GAM does not prepare a medium-term debt management strategy; however, it appears that an informal mechanism exists in managing its debt portfolio.
Ongoing reforms:
No known reforms.
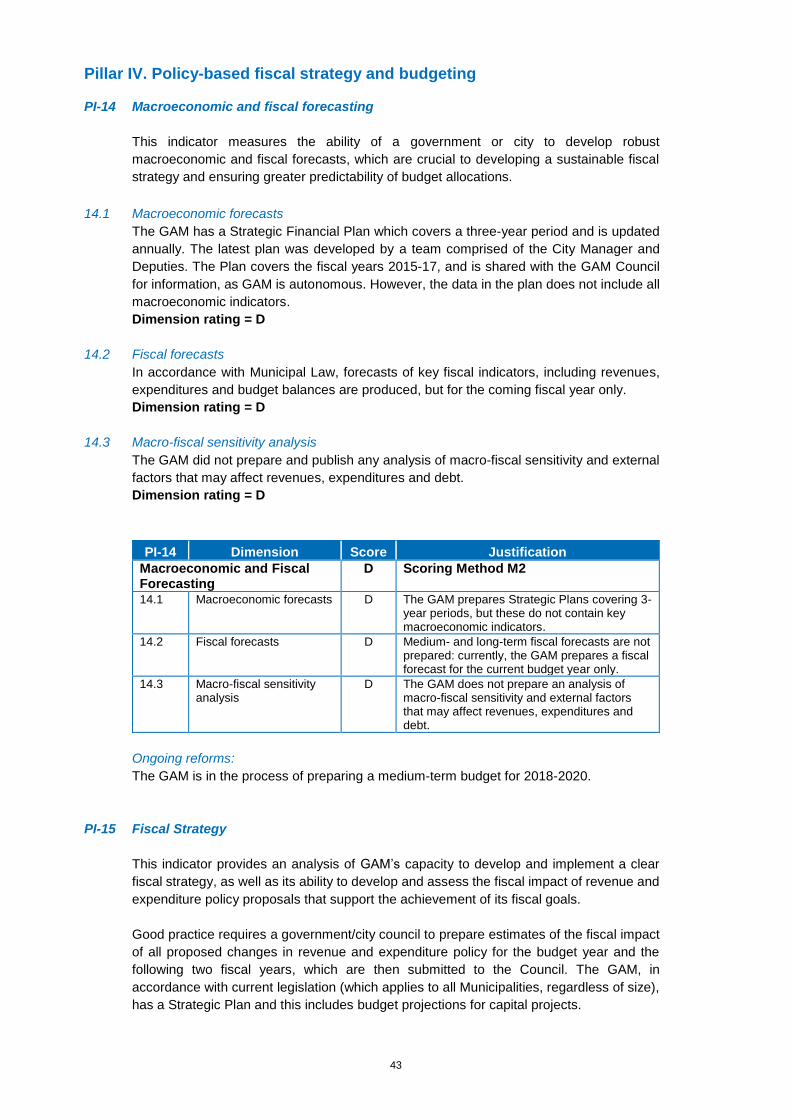
43
Pillar IV. Policy-based fiscal strategy and budgeting
PI-14 Macroeconomic and fiscal forecasting
This indicator measures the ability of a government or city to develop robust
macroeconomic and fiscal forecasts, which are crucial to developing a sustainable fiscal
strategy and ensuring greater predictability of budget allocations.
14.1 Macroeconomic forecasts
The GAM has a Strategic Financial Plan which covers a three-year period and is updated
annually. The latest plan was developed by a team comprised of the City Manager and
Deputies. The Plan covers the fiscal years 2015-17, and is shared with the GAM Council
for information, as GAM is autonomous. However, the data in the plan does not include all
macroeconomic indicators.
Dimension rating = D
14.2 Fiscal forecasts
In accordance with Municipal Law, forecasts of key fiscal indicators, including revenues,
expenditures and budget balances are produced, but for the coming fiscal year only.
Dimension rating = D
14.3 Macro-fiscal sensitivity analysis
The GAM did not prepare and publish any analysis of macro-fiscal sensitivity and external
factors that may affect revenues, expenditures and debt.
Dimension rating = D
PI-14 Dimension Score Justification
Macroeconomic and Fiscal Forecasting
D Scoring Method M2
14.1 Macroeconomic forecasts D The GAM prepares Strategic Plans covering 3-year periods, but these do not contain key macroeconomic indicators.
14.2 Fiscal forecasts D Medium- and long-term fiscal forecasts are not prepared: currently, the GAM prepares a fiscal forecast for the current budget year only.
14.3 Macro-fiscal sensitivity analysis
D The GAM does not prepare an analysis of macro-fiscal sensitivity and external factors that may affect revenues, expenditures and debt.
Ongoing reforms:
The GAM is in the process of preparing a medium-term budget for 2018-2020.
PI-15 Fiscal Strategy
This indicator provides an analysis of GAM’s capacity to develop and implement a clear
fiscal strategy, as well as its ability to develop and assess the fiscal impact of revenue and
expenditure policy proposals that support the achievement of its fiscal goals.
Good practice requires a government/city council to prepare estimates of the fiscal impact
of all proposed changes in revenue and expenditure policy for the budget year and the
following two fiscal years, which are then submitted to the Council. The GAM, in
accordance with current legislation (which applies to all Municipalities, regardless of size),
has a Strategic Plan and this includes budget projections for capital projects.
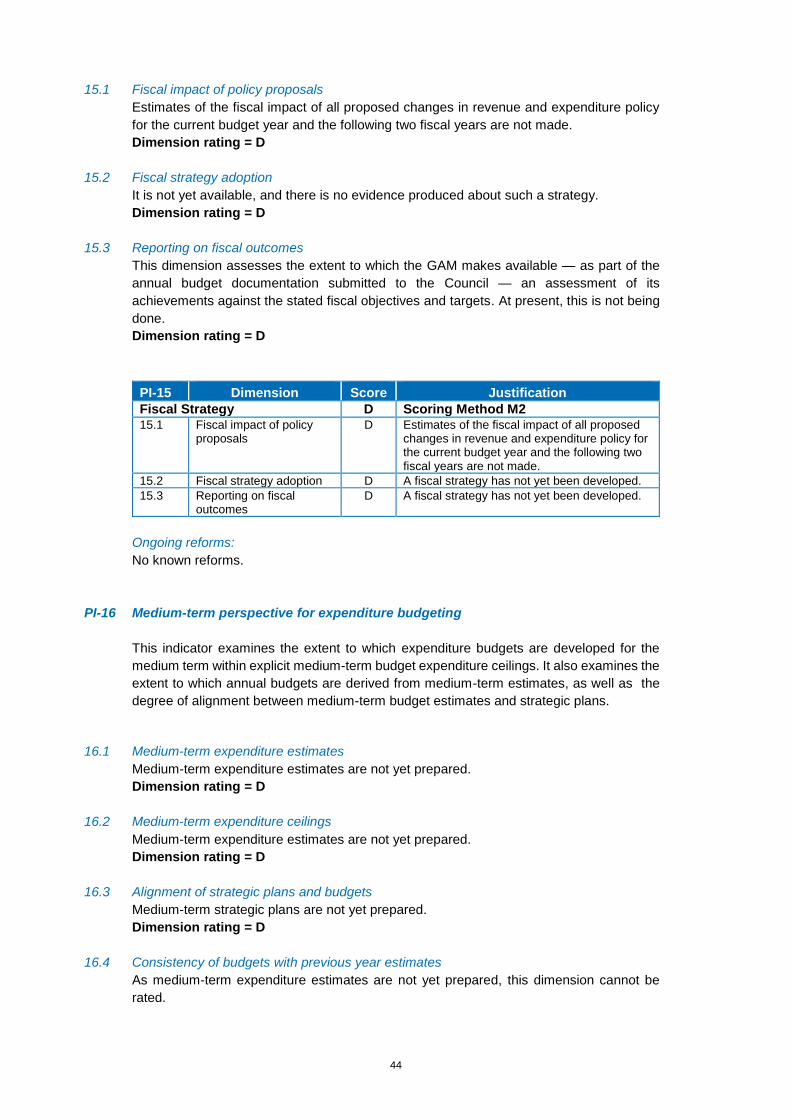
44
15.1 Fiscal impact of policy proposals
Estimates of the fiscal impact of all proposed changes in revenue and expenditure policy
for the current budget year and the following two fiscal years are not made.
Dimension rating = D
15.2 Fiscal strategy adoption
It is not yet available, and there is no evidence produced about such a strategy.
Dimension rating = D
15.3 Reporting on fiscal outcomes
This dimension assesses the extent to which the GAM makes available — as part of the
annual budget documentation submitted to the Council — an assessment of its
achievements against the stated fiscal objectives and targets. At present, this is not being
done.
Dimension rating = D
PI-15 Dimension Score Justification
Fiscal Strategy D Scoring Method M2
15.1 Fiscal impact of policy proposals
D Estimates of the fiscal impact of all proposed changes in revenue and expenditure policy for the current budget year and the following two fiscal years are not made.
15.2 Fiscal strategy adoption D A fiscal strategy has not yet been developed.
15.3 Reporting on fiscal outcomes
D A fiscal strategy has not yet been developed.
Ongoing reforms:
No known reforms.
PI-16 Medium-term perspective for expenditure budgeting
This indicator examines the extent to which expenditure budgets are developed for the
medium term within explicit medium-term budget expenditure ceilings. It also examines the
extent to which annual budgets are derived from medium-term estimates, as well as the
degree of alignment between medium-term budget estimates and strategic plans.
16.1 Medium-term expenditure estimates
Medium-term expenditure estimates are not yet prepared.
Dimension rating = D
16.2 Medium-term expenditure ceilings
Medium-term expenditure estimates are not yet prepared.
Dimension rating = D
16.3 Alignment of strategic plans and budgets
Medium-term strategic plans are not yet prepared.
Dimension rating = D
16.4 Consistency of budgets with previous year estimates
As medium-term expenditure estimates are not yet prepared, this dimension cannot be
rated.
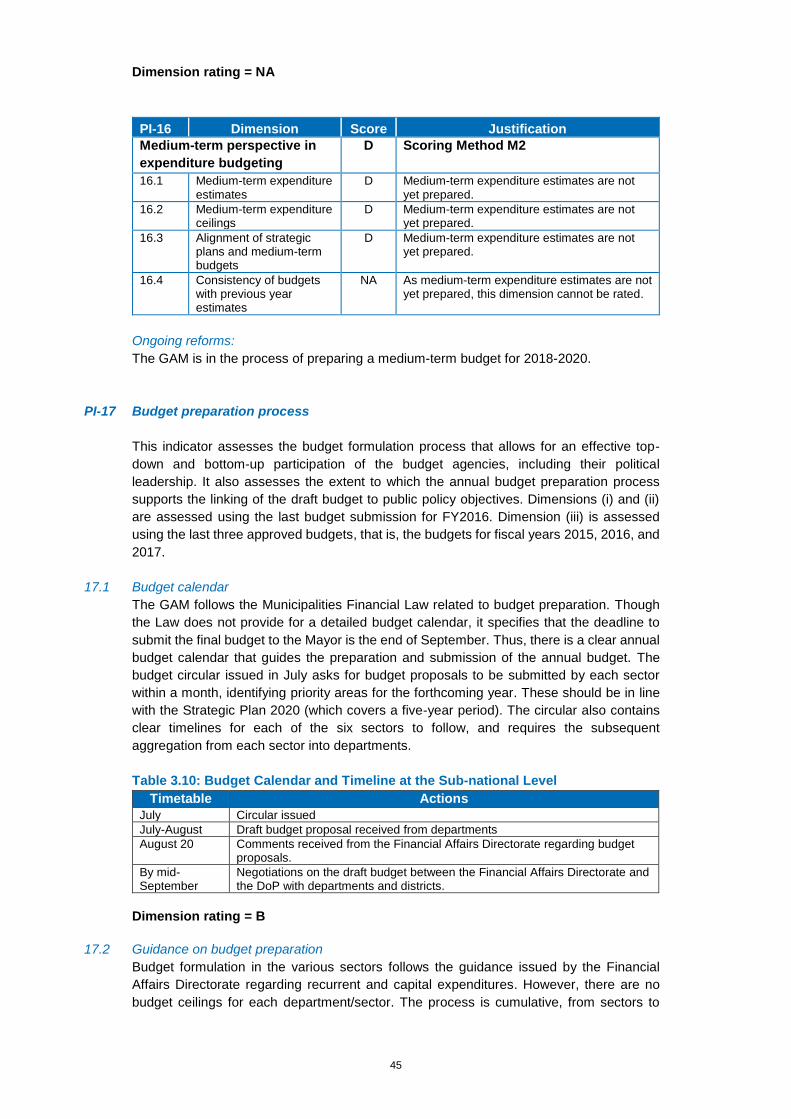
45
Dimension rating = NA
PI-16 Dimension Score Justification
Medium-term perspective in
expenditure budgeting
D Scoring Method M2
16.1 Medium-term expenditure estimates
D Medium-term expenditure estimates are not yet prepared.
16.2 Medium-term expenditure ceilings
D Medium-term expenditure estimates are not yet prepared.
16.3 Alignment of strategic plans and medium-term budgets
D Medium-term expenditure estimates are not yet prepared.
16.4 Consistency of budgets with previous year estimates
NA As medium-term expenditure estimates are not yet prepared, this dimension cannot be rated.
Ongoing reforms:
The GAM is in the process of preparing a medium-term budget for 2018-2020.
PI-17 Budget preparation process
This indicator assesses the budget formulation process that allows for an effective top-
down and bottom-up participation of the budget agencies, including their political
leadership. It also assesses the extent to which the annual budget preparation process
supports the linking of the draft budget to public policy objectives. Dimensions (i) and (ii)
are assessed using the last budget submission for FY2016. Dimension (iii) is assessed
using the last three approved budgets, that is, the budgets for fiscal years 2015, 2016, and
2017.
17.1 Budget calendar
The GAM follows the Municipalities Financial Law related to budget preparation. Though
the Law does not provide for a detailed budget calendar, it specifies that the deadline to
submit the final budget to the Mayor is the end of September. Thus, there is a clear annual
budget calendar that guides the preparation and submission of the annual budget. The
budget circular issued in July asks for budget proposals to be submitted by each sector
within a month, identifying priority areas for the forthcoming year. These should be in line
with the Strategic Plan 2020 (which covers a five-year period). The circular also contains
clear timelines for each of the six sectors to follow, and requires the subsequent
aggregation from each sector into departments.
Table 3.10: Budget Calendar and Timeline at the Sub-national Level
Timetable Actions
July Circular issued
July-August Draft budget proposal received from departments
August 20 Comments received from the Financial Affairs Directorate regarding budget proposals.
By mid-September
Negotiations on the draft budget between the Financial Affairs Directorate and the DoP with departments and districts.
Dimension rating = B
17.2 Guidance on budget preparation
Budget formulation in the various sectors follows the guidance issued by the Financial
Affairs Directorate regarding recurrent and capital expenditures. However, there are no
budget ceilings for each department/sector. The process is cumulative, from sectors to
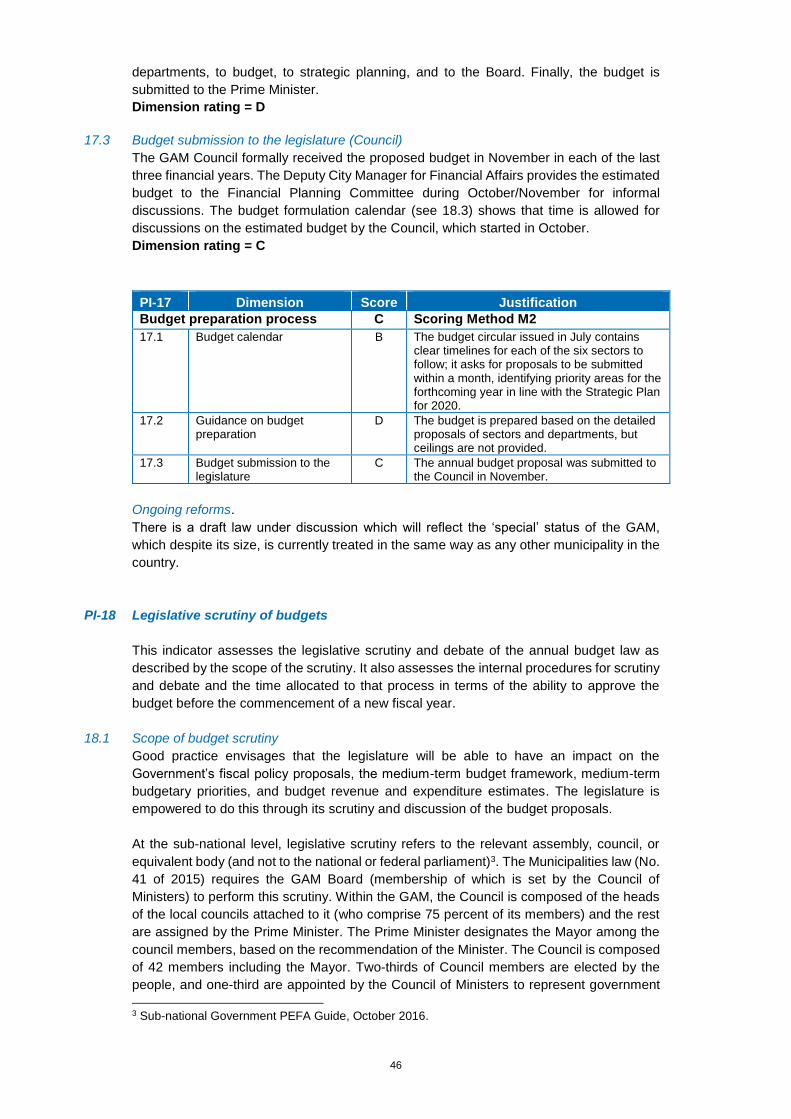
46
departments, to budget, to strategic planning, and to the Board. Finally, the budget is
submitted to the Prime Minister.
Dimension rating = D
17.3 Budget submission to the legislature (Council)
The GAM Council formally received the proposed budget in November in each of the last
three financial years. The Deputy City Manager for Financial Affairs provides the estimated
budget to the Financial Planning Committee during October/November for informal
discussions. The budget formulation calendar (see 18.3) shows that time is allowed for
discussions on the estimated budget by the Council, which started in October.
Dimension rating = C
PI-17 Dimension Score Justification
Budget preparation process C Scoring Method M2
17.1 Budget calendar B The budget circular issued in July contains clear timelines for each of the six sectors to follow; it asks for proposals to be submitted within a month, identifying priority areas for the forthcoming year in line with the Strategic Plan for 2020.
17.2 Guidance on budget preparation
D The budget is prepared based on the detailed proposals of sectors and departments, but ceilings are not provided.
17.3 Budget submission to the legislature
C The annual budget proposal was submitted to the Council in November.
Ongoing reforms.
There is a draft law under discussion which will reflect the ‘special’ status of the GAM,
which despite its size, is currently treated in the same way as any other municipality in the
country.
PI-18 Legislative scrutiny of budgets
This indicator assesses the legislative scrutiny and debate of the annual budget law as
described by the scope of the scrutiny. It also assesses the internal procedures for scrutiny
and debate and the time allocated to that process in terms of the ability to approve the
budget before the commencement of a new fiscal year.
18.1 Scope of budget scrutiny
Good practice envisages that the legislature will be able to have an impact on the
Government’s fiscal policy proposals, the medium-term budget framework, medium-term
budgetary priorities, and budget revenue and expenditure estimates. The legislature is
empowered to do this through its scrutiny and discussion of the budget proposals.
At the sub-national level, legislative scrutiny refers to the relevant assembly, council, or
equivalent body (and not to the national or federal parliament)3. The Municipalities law (No.
41 of 2015) requires the GAM Board (membership of which is set by the Council of
Ministers) to perform this scrutiny. Within the GAM, the Council is composed of the heads
of the local councils attached to it (who comprise 75 percent of its members) and the rest
are assigned by the Prime Minister. The Prime Minister designates the Mayor among the
council members, based on the recommendation of the Minister. The Council is composed
of 42 members including the Mayor. Two-thirds of Council members are elected by the
people, and one-third are appointed by the Council of Ministers to represent government
3 Sub-national Government PEFA Guide, October 2016.
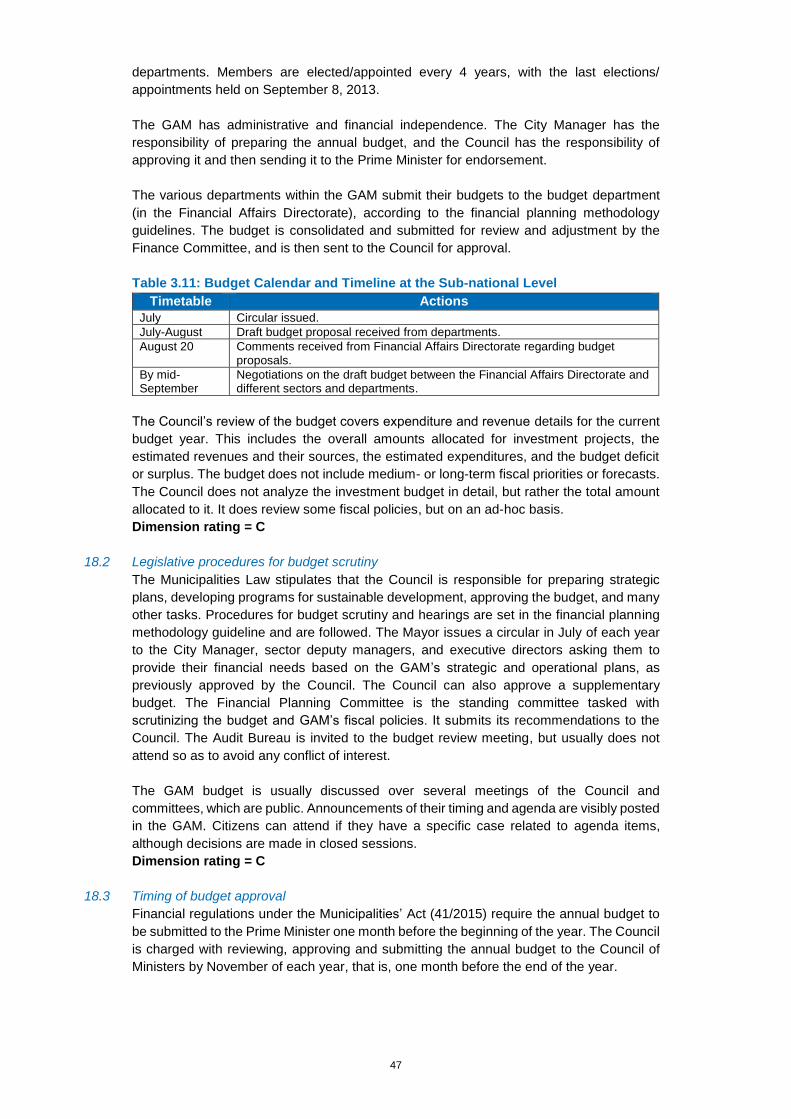
47
departments. Members are elected/appointed every 4 years, with the last elections/
appointments held on September 8, 2013.
The GAM has administrative and financial independence. The City Manager has the
responsibility of preparing the annual budget, and the Council has the responsibility of
approving it and then sending it to the Prime Minister for endorsement.
The various departments within the GAM submit their budgets to the budget department
(in the Financial Affairs Directorate), according to the financial planning methodology
guidelines. The budget is consolidated and submitted for review and adjustment by the
Finance Committee, and is then sent to the Council for approval.
Table 3.11: Budget Calendar and Timeline at the Sub-national Level
Timetable Actions
July Circular issued.
July-August Draft budget proposal received from departments.
August 20 Comments received from Financial Affairs Directorate regarding budget proposals.
By mid-September
Negotiations on the draft budget between the Financial Affairs Directorate and different sectors and departments.
The Council’s review of the budget covers expenditure and revenue details for the current
budget year. This includes the overall amounts allocated for investment projects, the
estimated revenues and their sources, the estimated expenditures, and the budget deficit
or surplus. The budget does not include medium- or long-term fiscal priorities or forecasts.
The Council does not analyze the investment budget in detail, but rather the total amount
allocated to it. It does review some fiscal policies, but on an ad-hoc basis.
Dimension rating = C
18.2 Legislative procedures for budget scrutiny
The Municipalities Law stipulates that the Council is responsible for preparing strategic
plans, developing programs for sustainable development, approving the budget, and many
other tasks. Procedures for budget scrutiny and hearings are set in the financial planning
methodology guideline and are followed. The Mayor issues a circular in July of each year
to the City Manager, sector deputy managers, and executive directors asking them to
provide their financial needs based on the GAM’s strategic and operational plans, as
previously approved by the Council. The Council can also approve a supplementary
budget. The Financial Planning Committee is the standing committee tasked with
scrutinizing the budget and GAM’s fiscal policies. It submits its recommendations to the
Council. The Audit Bureau is invited to the budget review meeting, but usually does not
attend so as to avoid any conflict of interest.
The GAM budget is usually discussed over several meetings of the Council and
committees, which are public. Announcements of their timing and agenda are visibly posted
in the GAM. Citizens can attend if they have a specific case related to agenda items,
although decisions are made in closed sessions.
Dimension rating = C
18.3 Timing of budget approval
Financial regulations under the Municipalities’ Act (41/2015) require the annual budget to
be submitted to the Prime Minister one month before the beginning of the year. The Council
is charged with reviewing, approving and submitting the annual budget to the Council of
Ministers by November of each year, that is, one month before the end of the year.
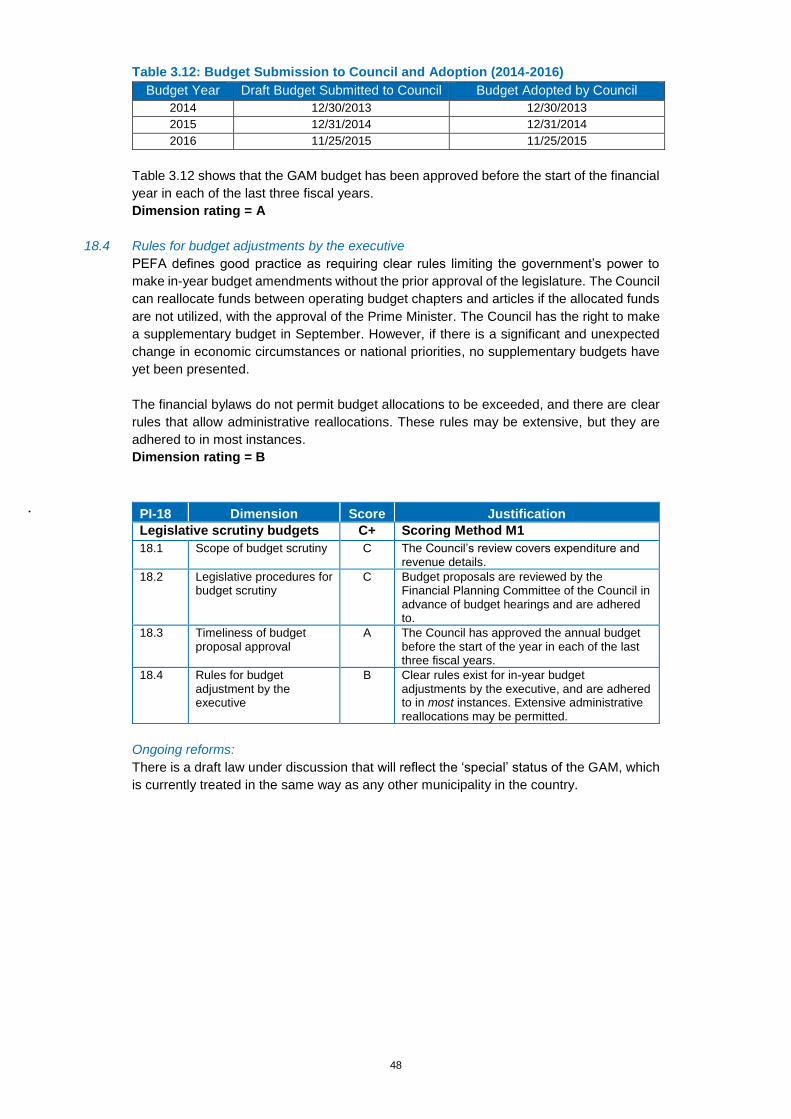
48
Table 3.12: Budget Submission to Council and Adoption (2014-2016)
Budget Year Draft Budget Submitted to Council Budget Adopted by Council
2014 12/30/2013 12/30/2013
2015 12/31/2014 12/31/2014
2016 11/25/2015 11/25/2015
Table 3.12 shows that the GAM budget has been approved before the start of the financial
year in each of the last three fiscal years.
Dimension rating = A
18.4 Rules for budget adjustments by the executive
PEFA defines good practice as requiring clear rules limiting the government’s power to
make in-year budget amendments without the prior approval of the legislature. The Council
can reallocate funds between operating budget chapters and articles if the allocated funds
are not utilized, with the approval of the Prime Minister. The Council has the right to make
a supplementary budget in September. However, if there is a significant and unexpected
change in economic circumstances or national priorities, no supplementary budgets have
yet been presented.
The financial bylaws do not permit budget allocations to be exceeded, and there are clear
rules that allow administrative reallocations. These rules may be extensive, but they are
adhered to in most instances.
Dimension rating = B
PI-18 Dimension Score Justification
Legislative scrutiny budgets C+ Scoring Method M1
18.1 Scope of budget scrutiny C The Council’s review covers expenditure and revenue details.
18.2 Legislative procedures for budget scrutiny
C Budget proposals are reviewed by the Financial Planning Committee of the Council in advance of budget hearings and are adhered to.
18.3 Timeliness of budget proposal approval
A The Council has approved the annual budget before the start of the year in each of the last three fiscal years.
18.4 Rules for budget adjustment by the executive
B Clear rules exist for in-year budget adjustments by the executive, and are adhered to in most instances. Extensive administrative reallocations may be permitted.
Ongoing reforms:
There is a draft law under discussion that will reflect the ‘special’ status of the GAM, which
is currently treated in the same way as any other municipality in the country.
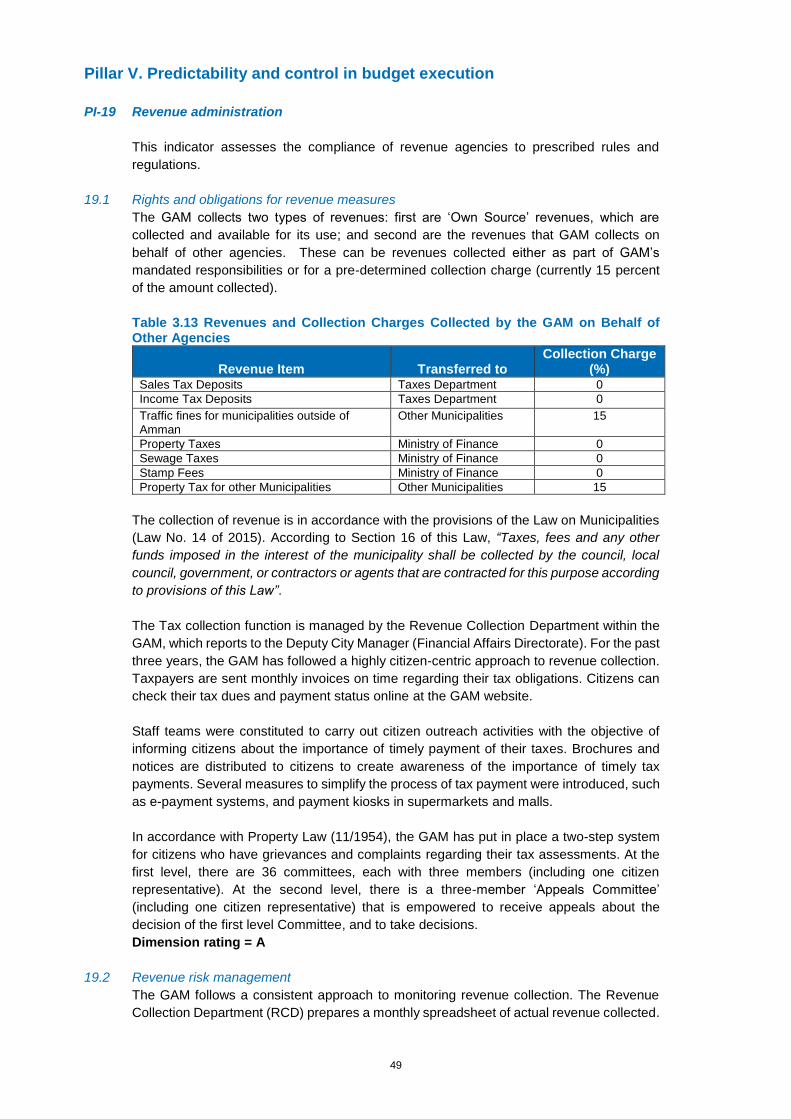
49
Pillar V. Predictability and control in budget execution
PI-19 Revenue administration
This indicator assesses the compliance of revenue agencies to prescribed rules and
regulations.
19.1 Rights and obligations for revenue measures
The GAM collects two types of revenues: first are ‘Own Source’ revenues, which are
collected and available for its use; and second are the revenues that GAM collects on
behalf of other agencies. These can be revenues collected either as part of GAM’s
mandated responsibilities or for a pre-determined collection charge (currently 15 percent
of the amount collected).
Table 3.13 Revenues and Collection Charges Collected by the GAM on Behalf of Other Agencies
Revenue Item Transferred to Collection Charge
(%) Sales Tax Deposits Taxes Department 0
Income Tax Deposits Taxes Department 0
Traffic fines for municipalities outside of Amman
Other Municipalities 15
Property Taxes Ministry of Finance 0
Sewage Taxes Ministry of Finance 0
Stamp Fees Ministry of Finance 0
Property Tax for other Municipalities Other Municipalities 15
The collection of revenue is in accordance with the provisions of the Law on Municipalities
(Law No. 14 of 2015). According to Section 16 of this Law, “Taxes, fees and any other
funds imposed in the interest of the municipality shall be collected by the council, local
council, government, or contractors or agents that are contracted for this purpose according
to provisions of this Law”.
The Tax collection function is managed by the Revenue Collection Department within the
GAM, which reports to the Deputy City Manager (Financial Affairs Directorate). For the past
three years, the GAM has followed a highly citizen-centric approach to revenue collection.
Taxpayers are sent monthly invoices on time regarding their tax obligations. Citizens can
check their tax dues and payment status online at the GAM website.
Staff teams were constituted to carry out citizen outreach activities with the objective of
informing citizens about the importance of timely payment of their taxes. Brochures and
notices are distributed to citizens to create awareness of the importance of timely tax
payments. Several measures to simplify the process of tax payment were introduced, such
as e-payment systems, and payment kiosks in supermarkets and malls.
In accordance with Property Law (11/1954), the GAM has put in place a two-step system
for citizens who have grievances and complaints regarding their tax assessments. At the
first level, there are 36 committees, each with three members (including one citizen
representative). At the second level, there is a three-member ‘Appeals Committee’
(including one citizen representative) that is empowered to receive appeals about the
decision of the first level Committee, and to take decisions.
Dimension rating = A
19.2 Revenue risk management
The GAM follows a consistent approach to monitoring revenue collection. The Revenue
Collection Department (RCD) prepares a monthly spreadsheet of actual revenue collected.
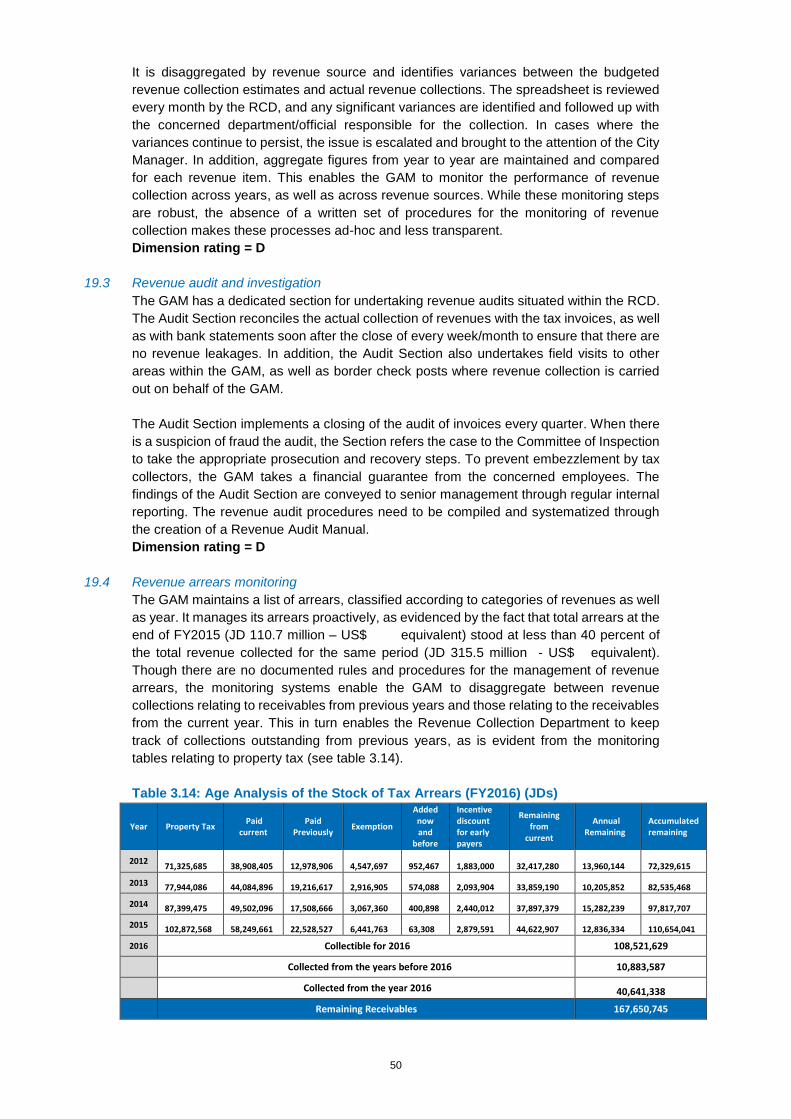
50
It is disaggregated by revenue source and identifies variances between the budgeted
revenue collection estimates and actual revenue collections. The spreadsheet is reviewed
every month by the RCD, and any significant variances are identified and followed up with
the concerned department/official responsible for the collection. In cases where the
variances continue to persist, the issue is escalated and brought to the attention of the City
Manager. In addition, aggregate figures from year to year are maintained and compared
for each revenue item. This enables the GAM to monitor the performance of revenue
collection across years, as well as across revenue sources. While these monitoring steps
are robust, the absence of a written set of procedures for the monitoring of revenue
collection makes these processes ad-hoc and less transparent.
Dimension rating = D
19.3 Revenue audit and investigation
The GAM has a dedicated section for undertaking revenue audits situated within the RCD.
The Audit Section reconciles the actual collection of revenues with the tax invoices, as well
as with bank statements soon after the close of every week/month to ensure that there are
no revenue leakages. In addition, the Audit Section also undertakes field visits to other
areas within the GAM, as well as border check posts where revenue collection is carried
out on behalf of the GAM.
The Audit Section implements a closing of the audit of invoices every quarter. When there
is a suspicion of fraud the audit, the Section refers the case to the Committee of Inspection
to take the appropriate prosecution and recovery steps. To prevent embezzlement by tax
collectors, the GAM takes a financial guarantee from the concerned employees. The
findings of the Audit Section are conveyed to senior management through regular internal
reporting. The revenue audit procedures need to be compiled and systematized through
the creation of a Revenue Audit Manual.
Dimension rating = D
19.4 Revenue arrears monitoring
The GAM maintains a list of arrears, classified according to categories of revenues as well
as year. It manages its arrears proactively, as evidenced by the fact that total arrears at the
end of FY2015 (JD 110.7 million – US$ equivalent) stood at less than 40 percent of
the total revenue collected for the same period (JD 315.5 million - US$ equivalent).
Though there are no documented rules and procedures for the management of revenue
arrears, the monitoring systems enable the GAM to disaggregate between revenue
collections relating to receivables from previous years and those relating to the receivables
from the current year. This in turn enables the Revenue Collection Department to keep
track of collections outstanding from previous years, as is evident from the monitoring
tables relating to property tax (see table 3.14).
Table 3.14: Age Analysis of the Stock of Tax Arrears (FY2016) (JDs)
Year Property Tax Paid
current Paid
Previously Exemption
Added now and
before
Incentive discount for early payers
Remaining from
current
Annual Remaining
Accumulated remaining
2012 71,325,685 38,908,405 12,978,906 4,547,697 952,467 1,883,000 32,417,280 13,960,144 72,329,615
2013 77,944,086 44,084,896 19,216,617 2,916,905 574,088 2,093,904 33,859,190 10,205,852 82,535,468
2014 87,399,475 49,502,096 17,508,666 3,067,360 400,898 2,440,012 37,897,379 15,282,239 97,817,707
2015 102,872,568 58,249,661 22,528,527 6,441,763 63,308 2,879,591 44,622,907 12,836,334 110,654,041
2016 Collectible for 2016 108,521,629
Collected from the years before 2016 10,883,587
Collected from the year 2016 40,641,338
Remaining Receivables 167,650,745
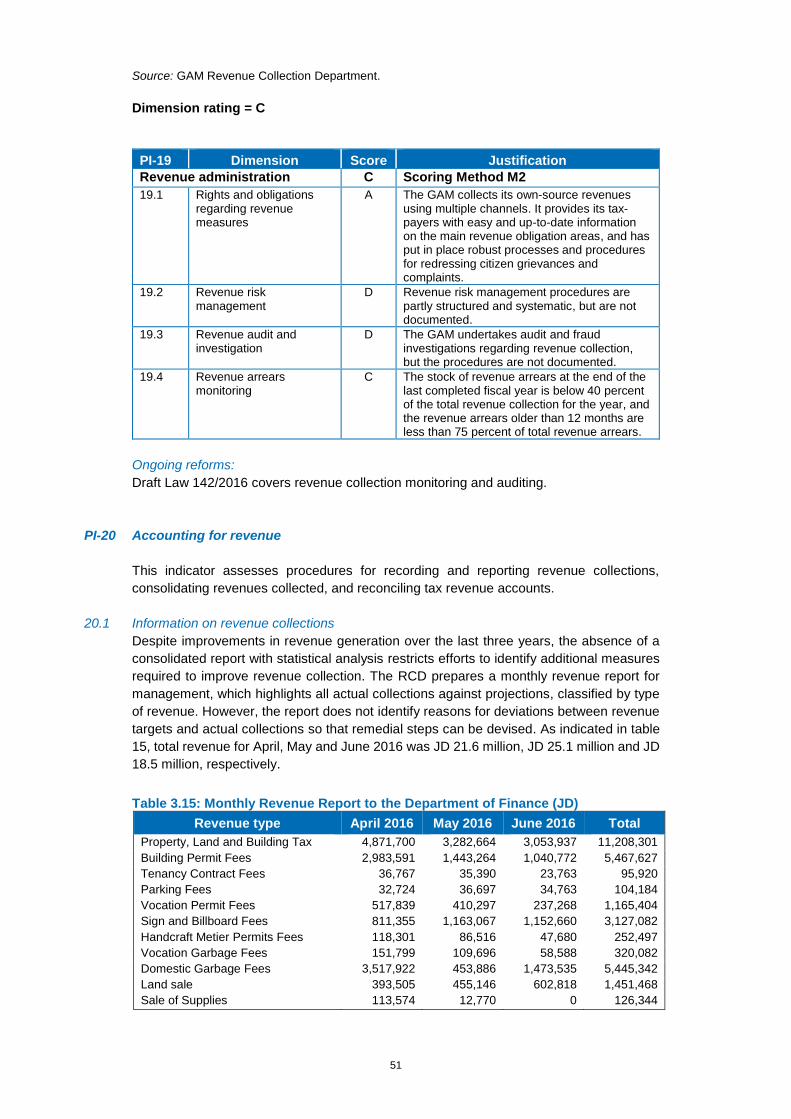
51
Source: GAM Revenue Collection Department.
Dimension rating = C
PI-19 Dimension Score Justification
Revenue administration C Scoring Method M2
19.1 Rights and obligations regarding revenue measures
A The GAM collects its own-source revenues using multiple channels. It provides its tax-payers with easy and up-to-date information on the main revenue obligation areas, and has put in place robust processes and procedures for redressing citizen grievances and complaints.
19.2 Revenue risk management
D Revenue risk management procedures are partly structured and systematic, but are not documented.
19.3 Revenue audit and investigation
D The GAM undertakes audit and fraud investigations regarding revenue collection, but the procedures are not documented.
19.4 Revenue arrears monitoring
C The stock of revenue arrears at the end of the last completed fiscal year is below 40 percent of the total revenue collection for the year, and the revenue arrears older than 12 months are less than 75 percent of total revenue arrears.
Ongoing reforms:
Draft Law 142/2016 covers revenue collection monitoring and auditing.
PI-20 Accounting for revenue
This indicator assesses procedures for recording and reporting revenue collections,
consolidating revenues collected, and reconciling tax revenue accounts.
20.1 Information on revenue collections
Despite improvements in revenue generation over the last three years, the absence of a
consolidated report with statistical analysis restricts efforts to identify additional measures
required to improve revenue collection. The RCD prepares a monthly revenue report for
management, which highlights all actual collections against projections, classified by type
of revenue. However, the report does not identify reasons for deviations between revenue
targets and actual collections so that remedial steps can be devised. As indicated in table
15, total revenue for April, May and June 2016 was JD 21.6 million, JD 25.1 million and JD
18.5 million, respectively.
Table 3.15: Monthly Revenue Report to the Department of Finance (JD)
Revenue type April 2016 May 2016 June 2016 Total
Property, Land and Building Tax 4,871,700 3,282,664 3,053,937 11,208,301
Building Permit Fees 2,983,591 1,443,264 1,040,772 5,467,627
Tenancy Contract Fees 36,767 35,390 23,763 95,920
Parking Fees 32,724 36,697 34,763 104,184
Vocation Permit Fees 517,839 410,297 237,268 1,165,404
Sign and Billboard Fees 811,355 1,163,067 1,152,660 3,127,082
Handcraft Metier Permits Fees 118,301 86,516 47,680 252,497
Vocation Garbage Fees 151,799 109,696 58,588 320,082
Domestic Garbage Fees 3,517,922 453,886 1,473,535 5,445,342
Land sale 393,505 455,146 602,818 1,451,468
Sale of Supplies 113,574 12,770 0 126,344
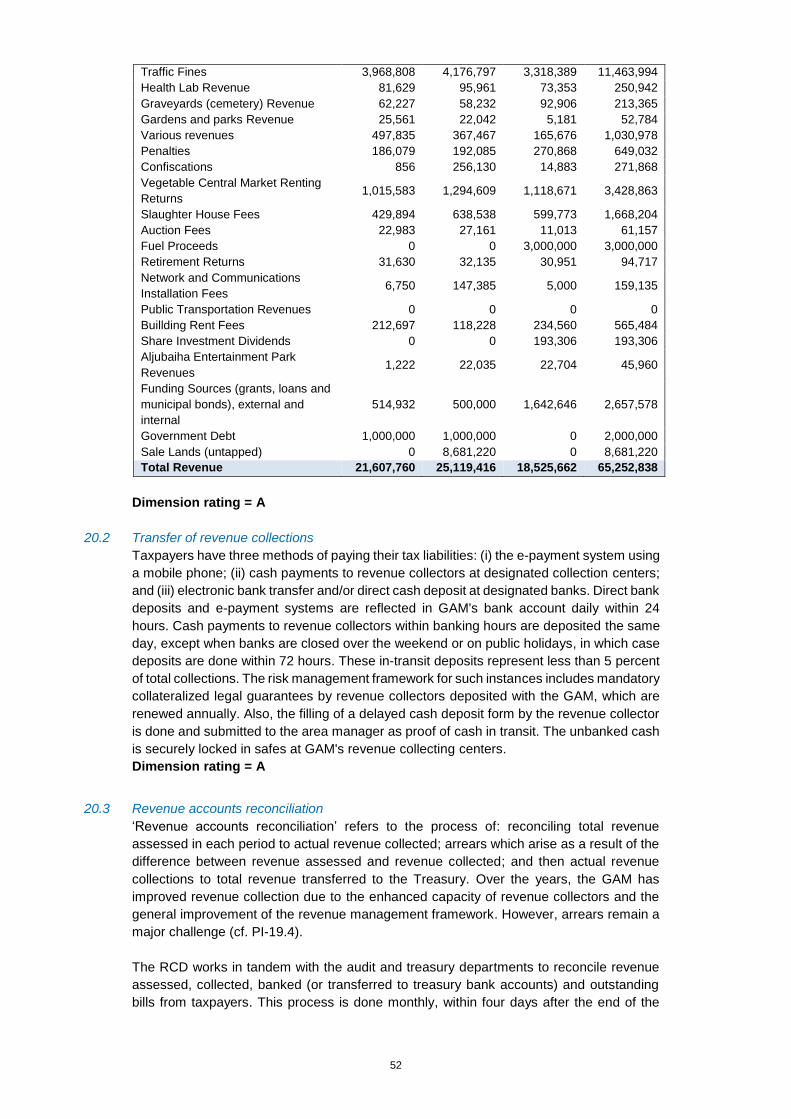
52
Traffic Fines 3,968,808 4,176,797 3,318,389 11,463,994
Health Lab Revenue 81,629 95,961 73,353 250,942
Graveyards (cemetery) Revenue 62,227 58,232 92,906 213,365
Gardens and parks Revenue 25,561 22,042 5,181 52,784
Various revenues 497,835 367,467 165,676 1,030,978
Penalties 186,079 192,085 270,868 649,032
Confiscations 856 256,130 14,883 271,868
Vegetable Central Market Renting
Returns 1,015,583 1,294,609 1,118,671 3,428,863
Slaughter House Fees 429,894 638,538 599,773 1,668,204
Auction Fees 22,983 27,161 11,013 61,157
Fuel Proceeds 0 0 3,000,000 3,000,000
Retirement Returns 31,630 32,135 30,951 94,717
Network and Communications
Installation Fees 6,750 147,385 5,000 159,135
Public Transportation Revenues 0 0 0 0
Buillding Rent Fees 212,697 118,228 234,560 565,484
Share Investment Dividends 0 0 193,306 193,306
Aljubaiha Entertainment Park
Revenues 1,222 22,035 22,704 45,960
Funding Sources (grants, loans and
municipal bonds), external and
internal
514,932 500,000 1,642,646 2,657,578
Government Debt 1,000,000 1,000,000 0 2,000,000
Sale Lands (untapped) 0 8,681,220 0 8,681,220
Total Revenue 21,607,760 25,119,416 18,525,662 65,252,838
Dimension rating = A
20.2 Transfer of revenue collections
Taxpayers have three methods of paying their tax liabilities: (i) the e-payment system using
a mobile phone; (ii) cash payments to revenue collectors at designated collection centers;
and (iii) electronic bank transfer and/or direct cash deposit at designated banks. Direct bank
deposits and e-payment systems are reflected in GAM's bank account daily within 24
hours. Cash payments to revenue collectors within banking hours are deposited the same
day, except when banks are closed over the weekend or on public holidays, in which case
deposits are done within 72 hours. These in-transit deposits represent less than 5 percent
of total collections. The risk management framework for such instances includes mandatory
collateralized legal guarantees by revenue collectors deposited with the GAM, which are
renewed annually. Also, the filling of a delayed cash deposit form by the revenue collector
is done and submitted to the area manager as proof of cash in transit. The unbanked cash
is securely locked in safes at GAM's revenue collecting centers.
Dimension rating = A
20.3 Revenue accounts reconciliation
‘Revenue accounts reconciliation’ refers to the process of: reconciling total revenue
assessed in each period to actual revenue collected; arrears which arise as a result of the
difference between revenue assessed and revenue collected; and then actual revenue
collections to total revenue transferred to the Treasury. Over the years, the GAM has
improved revenue collection due to the enhanced capacity of revenue collectors and the
general improvement of the revenue management framework. However, arrears remain a
major challenge (cf. PI-19.4).
The RCD works in tandem with the audit and treasury departments to reconcile revenue
assessed, collected, banked (or transferred to treasury bank accounts) and outstanding
bills from taxpayers. This process is done monthly, within four days after the end of the
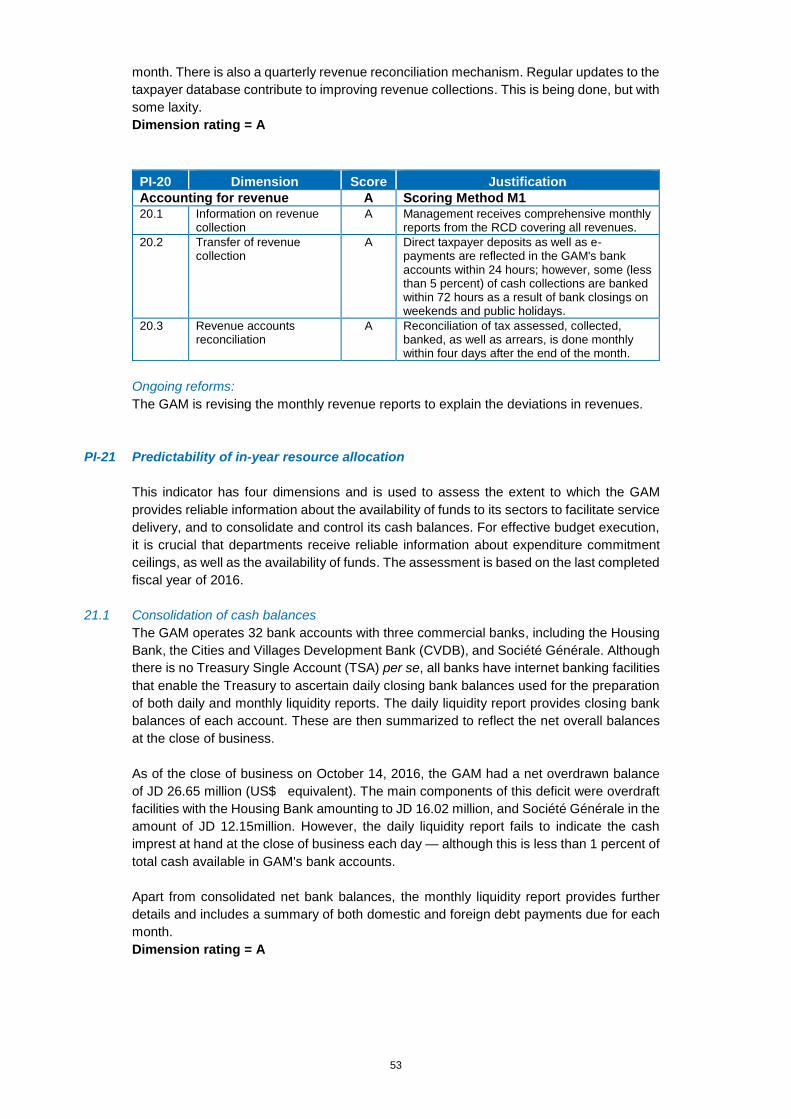
53
month. There is also a quarterly revenue reconciliation mechanism. Regular updates to the
taxpayer database contribute to improving revenue collections. This is being done, but with
some laxity.
Dimension rating = A
PI-20 Dimension Score Justification
Accounting for revenue A Scoring Method M1
20.1 Information on revenue collection
A Management receives comprehensive monthly reports from the RCD covering all revenues.
20.2 Transfer of revenue collection
A Direct taxpayer deposits as well as e-payments are reflected in the GAM's bank accounts within 24 hours; however, some (less than 5 percent) of cash collections are banked within 72 hours as a result of bank closings on weekends and public holidays.
20.3 Revenue accounts reconciliation
A Reconciliation of tax assessed, collected, banked, as well as arrears, is done monthly within four days after the end of the month.
Ongoing reforms:
The GAM is revising the monthly revenue reports to explain the deviations in revenues.
PI-21 Predictability of in-year resource allocation
This indicator has four dimensions and is used to assess the extent to which the GAM
provides reliable information about the availability of funds to its sectors to facilitate service
delivery, and to consolidate and control its cash balances. For effective budget execution,
it is crucial that departments receive reliable information about expenditure commitment
ceilings, as well as the availability of funds. The assessment is based on the last completed
fiscal year of 2016.
21.1 Consolidation of cash balances
The GAM operates 32 bank accounts with three commercial banks, including the Housing
Bank, the Cities and Villages Development Bank (CVDB), and Société Générale. Although
there is no Treasury Single Account (TSA) per se, all banks have internet banking facilities
that enable the Treasury to ascertain daily closing bank balances used for the preparation
of both daily and monthly liquidity reports. The daily liquidity report provides closing bank
balances of each account. These are then summarized to reflect the net overall balances
at the close of business.
As of the close of business on October 14, 2016, the GAM had a net overdrawn balance
of JD 26.65 million (US$ equivalent). The main components of this deficit were overdraft
facilities with the Housing Bank amounting to JD 16.02 million, and Société Générale in the
amount of JD 12.15million. However, the daily liquidity report fails to indicate the cash
imprest at hand at the close of business each day — although this is less than 1 percent of
total cash available in GAM's bank accounts.
Apart from consolidated net bank balances, the monthly liquidity report provides further
details and includes a summary of both domestic and foreign debt payments due for each
month.
Dimension rating = A
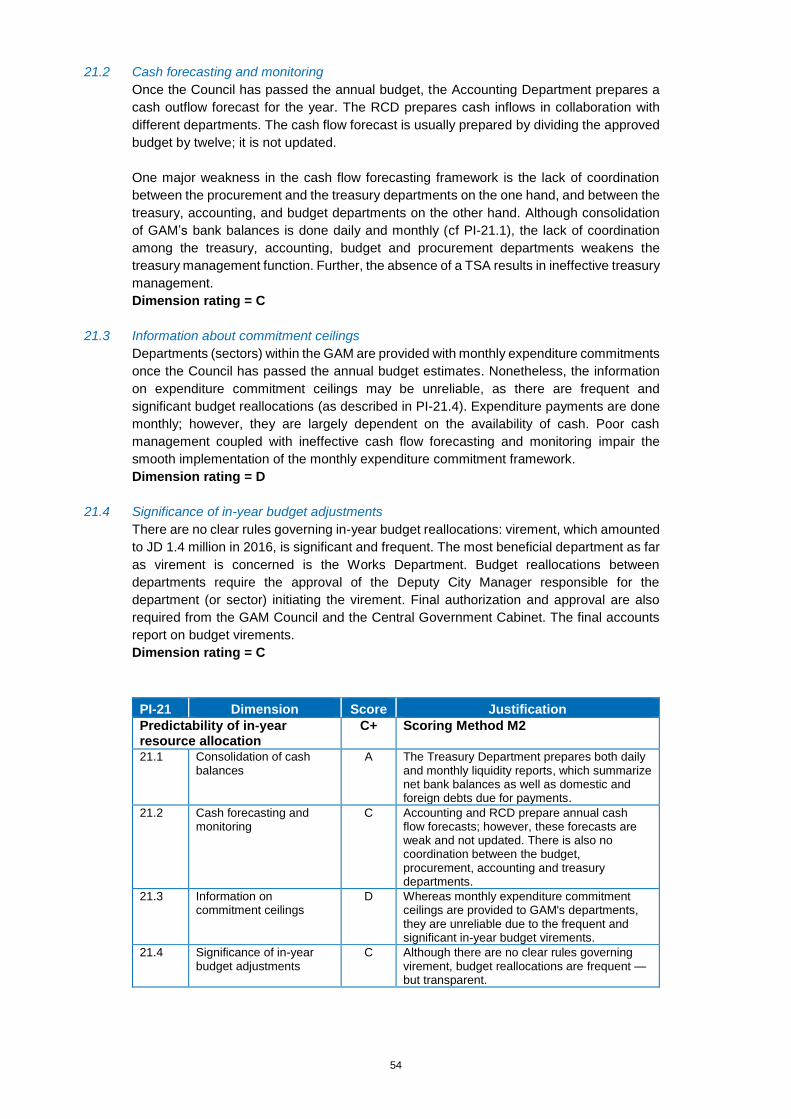
54
21.2 Cash forecasting and monitoring
Once the Council has passed the annual budget, the Accounting Department prepares a
cash outflow forecast for the year. The RCD prepares cash inflows in collaboration with
different departments. The cash flow forecast is usually prepared by dividing the approved
budget by twelve; it is not updated.
One major weakness in the cash flow forecasting framework is the lack of coordination
between the procurement and the treasury departments on the one hand, and between the
treasury, accounting, and budget departments on the other hand. Although consolidation
of GAM’s bank balances is done daily and monthly (cf PI-21.1), the lack of coordination
among the treasury, accounting, budget and procurement departments weakens the
treasury management function. Further, the absence of a TSA results in ineffective treasury
management.
Dimension rating = C
21.3 Information about commitment ceilings
Departments (sectors) within the GAM are provided with monthly expenditure commitments
once the Council has passed the annual budget estimates. Nonetheless, the information
on expenditure commitment ceilings may be unreliable, as there are frequent and
significant budget reallocations (as described in PI-21.4). Expenditure payments are done
monthly; however, they are largely dependent on the availability of cash. Poor cash
management coupled with ineffective cash flow forecasting and monitoring impair the
smooth implementation of the monthly expenditure commitment framework.
Dimension rating = D
21.4 Significance of in-year budget adjustments
There are no clear rules governing in-year budget reallocations: virement, which amounted
to JD 1.4 million in 2016, is significant and frequent. The most beneficial department as far
as virement is concerned is the Works Department. Budget reallocations between
departments require the approval of the Deputy City Manager responsible for the
department (or sector) initiating the virement. Final authorization and approval are also
required from the GAM Council and the Central Government Cabinet. The final accounts
report on budget virements.
Dimension rating = C
PI-21 Dimension Score Justification
Predictability of in-year resource allocation
C+ Scoring Method M2
21.1 Consolidation of cash balances
A The Treasury Department prepares both daily and monthly liquidity reports, which summarize net bank balances as well as domestic and foreign debts due for payments.
21.2 Cash forecasting and monitoring
C Accounting and RCD prepare annual cash flow forecasts; however, these forecasts are weak and not updated. There is also no coordination between the budget, procurement, accounting and treasury departments.
21.3 Information on commitment ceilings
D Whereas monthly expenditure commitment ceilings are provided to GAM's departments, they are unreliable due to the frequent and significant in-year budget virements.
21.4 Significance of in-year budget adjustments
C Although there are no clear rules governing virement, budget reallocations are frequent — but transparent.
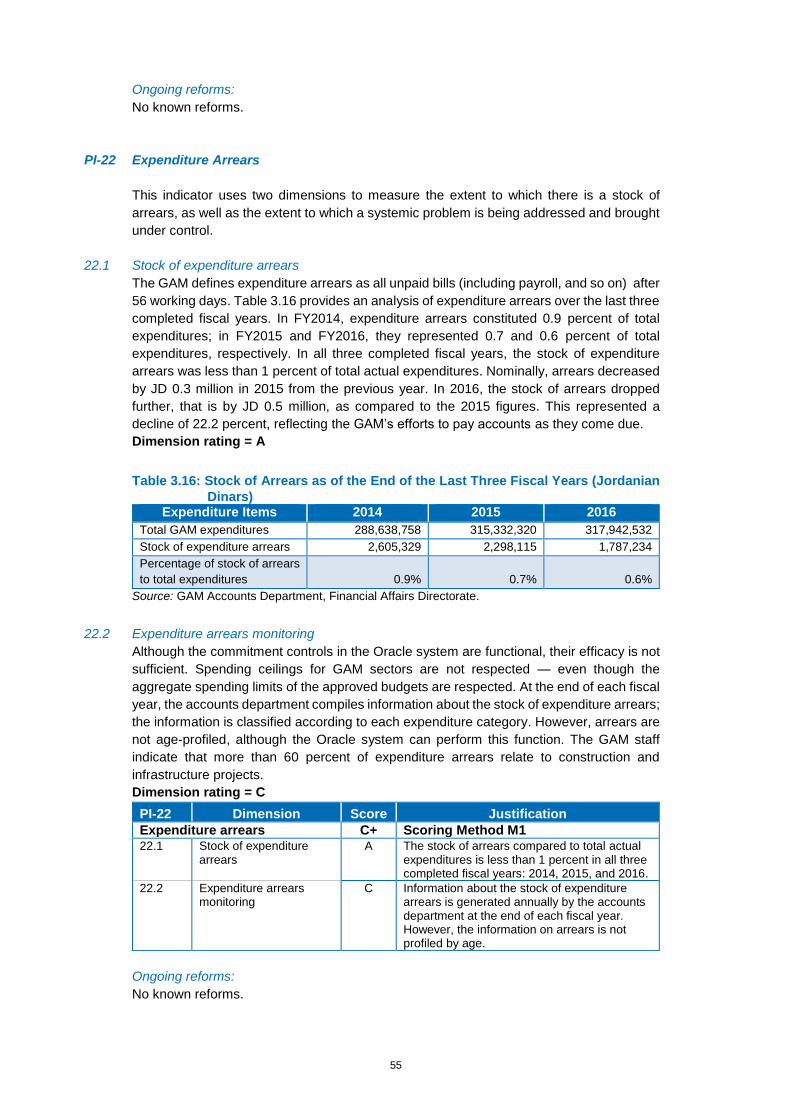
55
Ongoing reforms:
No known reforms.
PI-22 Expenditure Arrears
This indicator uses two dimensions to measure the extent to which there is a stock of
arrears, as well as the extent to which a systemic problem is being addressed and brought
under control.
22.1 Stock of expenditure arrears
The GAM defines expenditure arrears as all unpaid bills (including payroll, and so on) after
56 working days. Table 3.16 provides an analysis of expenditure arrears over the last three
completed fiscal years. In FY2014, expenditure arrears constituted 0.9 percent of total
expenditures; in FY2015 and FY2016, they represented 0.7 and 0.6 percent of total
expenditures, respectively. In all three completed fiscal years, the stock of expenditure
arrears was less than 1 percent of total actual expenditures. Nominally, arrears decreased
by JD 0.3 million in 2015 from the previous year. In 2016, the stock of arrears dropped
further, that is by JD 0.5 million, as compared to the 2015 figures. This represented a
decline of 22.2 percent, reflecting the GAM’s efforts to pay accounts as they come due.
Dimension rating = A
Table 3.16: Stock of Arrears as of the End of the Last Three Fiscal Years (Jordanian
Dinars) Expenditure Items 2014 2015 2016
Total GAM expenditures 288,638,758 315,332,320 317,942,532
Stock of expenditure arrears 2,605,329 2,298,115 1,787,234
Percentage of stock of arrears
to total expenditures 0.9% 0.7% 0.6%
Source: GAM Accounts Department, Financial Affairs Directorate.
22.2 Expenditure arrears monitoring
Although the commitment controls in the Oracle system are functional, their efficacy is not
sufficient. Spending ceilings for GAM sectors are not respected — even though the
aggregate spending limits of the approved budgets are respected. At the end of each fiscal
year, the accounts department compiles information about the stock of expenditure arrears;
the information is classified according to each expenditure category. However, arrears are
not age-profiled, although the Oracle system can perform this function. The GAM staff
indicate that more than 60 percent of expenditure arrears relate to construction and
infrastructure projects.
Dimension rating = C
PI-22 Dimension Score Justification
Expenditure arrears C+ Scoring Method M1
22.1 Stock of expenditure arrears
A The stock of arrears compared to total actual expenditures is less than 1 percent in all three completed fiscal years: 2014, 2015, and 2016.
22.2 Expenditure arrears monitoring
C Information about the stock of expenditure arrears is generated annually by the accounts department at the end of each fiscal year. However, the information on arrears is not profiled by age.
Ongoing reforms:
No known reforms.
56
PI-23 Payroll controls
This indicator is concerned with the payroll for public servants only. Specifically, it examines
the way in which the payroll is managed, how changes are handled, and how consistency
with personnel records management is achieved.
23.1 Integration of payroll and personnel records
Good practice calls for personnel and payroll records to be closely linked in such a way
that any decisions by the relevant authorities that make changes to personnel records (for
example, a promotion of a staff member) automatically result in an appropriate change to
that person’s salary.
The Human Resources department (HRD) manages personnel appointments, changes in
status, and terminations/retirements. Staff hiring and promotions are controlled by a list of
approved positions. The HRD is responsible for the employment process in accordance
with the civil service laws and regulations, as well as relevant municipalities’ laws. The HRD
are now working on drafting their own regulations that would better suit the GAM
environment. The HRD maintains a database that includes records for each employee
(softcopies), and maintains the same information in its personnel folders (hardcopies).
The payroll section, once part of human resources (HR), has recently been undergone an
organizational move to the accounting department. However, it continues to have access
to personnel data in the HR system used to prepare payroll lists. Whereas the payroll list
production is automated, it is not integrated with the HR system — although monthly
reconciliations occur to ensure the completeness and accuracy of records with respective
salary amounts.
Once payroll lists are prepared and reviewed by the section’s internal controllers,
calculations are made on a trial basis with the information technology (IT) department.
These are done to ensure that any potential anomalies and errors are discovered before
final posting and the further processing of payments. A copy is sent to the budget
department to ensure budget classifications and allocation availability. The payroll section
then sends it to the accounting department for their review and feedback. Once approvals
are received, the payroll list is submitted to treasury for payment by check or transfer to
staff bank accounts.
In conclusion, HR, the payroll section (accounting department) and the budget department
systems are not fully integrated. This poses the risk of human errors and data transfer
disruptions from one department to another. However, controls currently in place are
assessed to reduce such errors. In this regard, it should be noted that the GAM is currently
working on integrating the payroll process and related procedures into the Oracle system.
Dimension rating = B
23.2 Management of payroll changes
Good practice requires the avoidance of frequent retrospective adjustments to individual
pay, which can easily be the source of error.
Changes to personnel records are initiated by employment letters from GAM senior
management resulting from a new hiring or appointment process. The Civil Service Law
and the HR Regulation of 2012, including amendments in 2015 and 2016, are correctly
followed. Such changes are reviewed and approved by HR section heads and the director,
and then reflected in the HR system. Since the payroll accounting section has access to
57
the HR system and can extract data to prepare payroll lists, payroll accountants are notified
of changes when they occur.
Retroactive adjustments can occur, especially when an employee receives approval for
overtime compensation or a plea is resolved. Adjustments are calculated and included in
the following month’s payroll to avoid any salary arrears.
Dimension rating = B
23.3 Internal control of payroll
Good practice requires strong control by senior management to prevent unauthorized
changes to personnel and payroll records. Such unauthorized changes could result in
unjustified increases in the pay of some individual staff members to administrative agencies
and city-owned enterprises.
The payroll expenditure cycle starts with the preparation of the monthly payroll lists by the
designated accountant. It follows with sequential reviews by supervisors, the department’s
own financial controllers, and budget holders. Payroll lists undergo review by the Audit
Bureau representative before being cleared and forwarded to the Treasury Department for
payment. The Budget department receives a copy of the payroll lists and performs its own
review.
Changes to personnel and payroll data are restricted. Any changes are documented
throughout the process and the controls in place are sufficient to prevent material
deficiencies, unauthorized intrusions, and errors. The payroll section has continued to
develop its own automated system by strengthening entry validity controls, expanding the
database, and obtaining IT technical support. Output from the system is then matched by
HR and senior management, and then reported to the head of the payroll section. Data
transmission from HR to the finance, treasury and budgeting departments are well
consolidated. The controls in place ensure the integrity of payroll data, even in the absence
of automated systems integration. (GAM is currently working on integrating these separate
systems with Oracle to streamline procedures and ensure full data integrity.)
This assessment has revealed that the HR department is the main party responsible for
managing changes and documenting them in a way that creates an acceptable audit trail.
This allows for reasonable accountability checks, intrusion detection, and problem analysis.
Due to capacity constraints, the payroll section does not maintain its own archive, but relies
on the HR archive to which they have access.
Dimension rating = A
23.4 Payroll audit
The PEFA ‘good practice’ criteria look for a system of dedicated payroll audits, which will
check the existence of each staff member and the underlying justification for elements in
personnel records (for example, certification of claimed professional qualifications). Good
practice also considers the accuracy of the calculation of staff salaries.
The internal controller within the payroll unit and the Audit Bureau office (both ex-ante and
ex-post) perform transaction-based reviews concerning the accuracy of the payroll
calculation. These reviews help to detect discrepancies, which to some extent, can help
identify the existence of ghost workers or the need to fill data gaps. The HR department
undertakes reviews through field visits and the matching of personnel folders to check for
ghost workers.
However, no external party has assessed the adequacy and effectiveness of the design
and overall implementation for the payroll system as a whole. The IT system developed in-
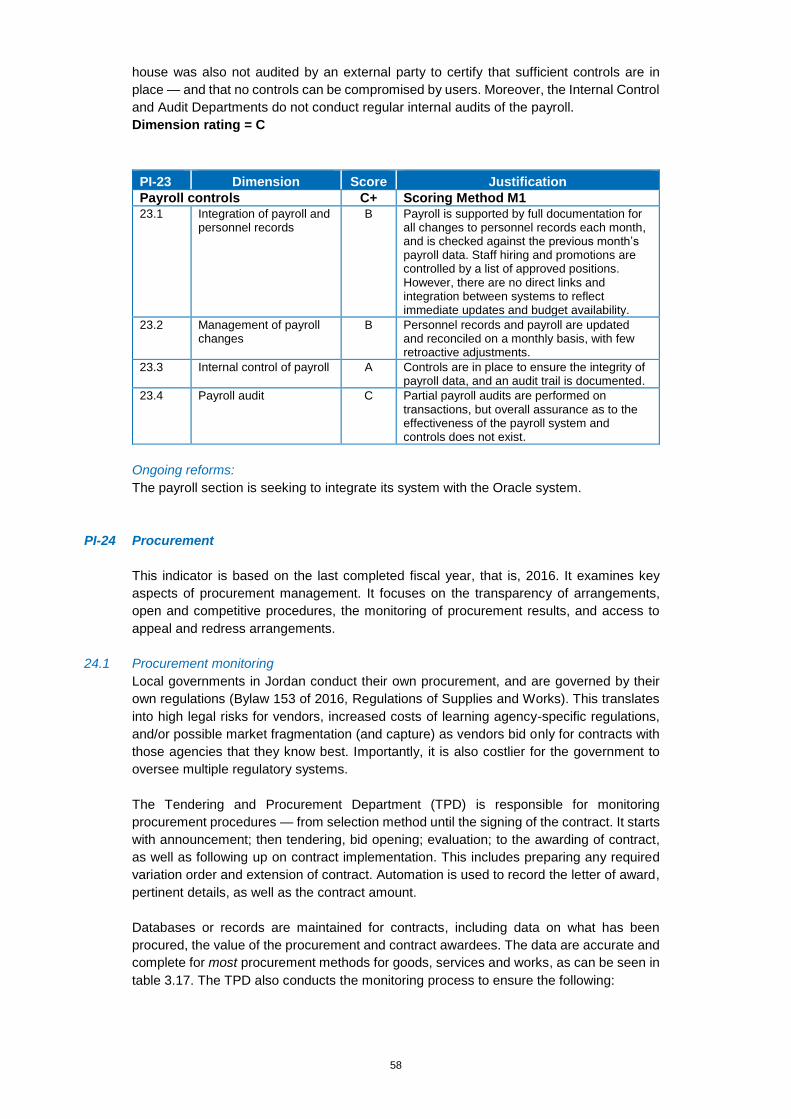
58
house was also not audited by an external party to certify that sufficient controls are in
place — and that no controls can be compromised by users. Moreover, the Internal Control
and Audit Departments do not conduct regular internal audits of the payroll.
Dimension rating = C
PI-23 Dimension Score Justification
Payroll controls C+ Scoring Method M1
23.1 Integration of payroll and personnel records
B Payroll is supported by full documentation for all changes to personnel records each month, and is checked against the previous month’s payroll data. Staff hiring and promotions are controlled by a list of approved positions. However, there are no direct links and integration between systems to reflect immediate updates and budget availability.
23.2 Management of payroll changes
B Personnel records and payroll are updated and reconciled on a monthly basis, with few retroactive adjustments.
23.3 Internal control of payroll A Controls are in place to ensure the integrity of payroll data, and an audit trail is documented.
23.4 Payroll audit C Partial payroll audits are performed on transactions, but overall assurance as to the effectiveness of the payroll system and controls does not exist.
Ongoing reforms:
The payroll section is seeking to integrate its system with the Oracle system.
PI-24 Procurement
This indicator is based on the last completed fiscal year, that is, 2016. It examines key
aspects of procurement management. It focuses on the transparency of arrangements,
open and competitive procedures, the monitoring of procurement results, and access to
appeal and redress arrangements.
24.1 Procurement monitoring
Local governments in Jordan conduct their own procurement, and are governed by their
own regulations (Bylaw 153 of 2016, Regulations of Supplies and Works). This translates
into high legal risks for vendors, increased costs of learning agency-specific regulations,
and/or possible market fragmentation (and capture) as vendors bid only for contracts with
those agencies that they know best. Importantly, it is also costlier for the government to
oversee multiple regulatory systems.
The Tendering and Procurement Department (TPD) is responsible for monitoring
procurement procedures — from selection method until the signing of the contract. It starts
with announcement; then tendering, bid opening; evaluation; to the awarding of contract,
as well as following up on contract implementation. This includes preparing any required
variation order and extension of contract. Automation is used to record the letter of award,
pertinent details, as well as the contract amount.
Databases or records are maintained for contracts, including data on what has been
procured, the value of the procurement and contract awardees. The data are accurate and
complete for most procurement methods for goods, services and works, as can be seen in
table 3.17. The TPD also conducts the monitoring process to ensure the following:
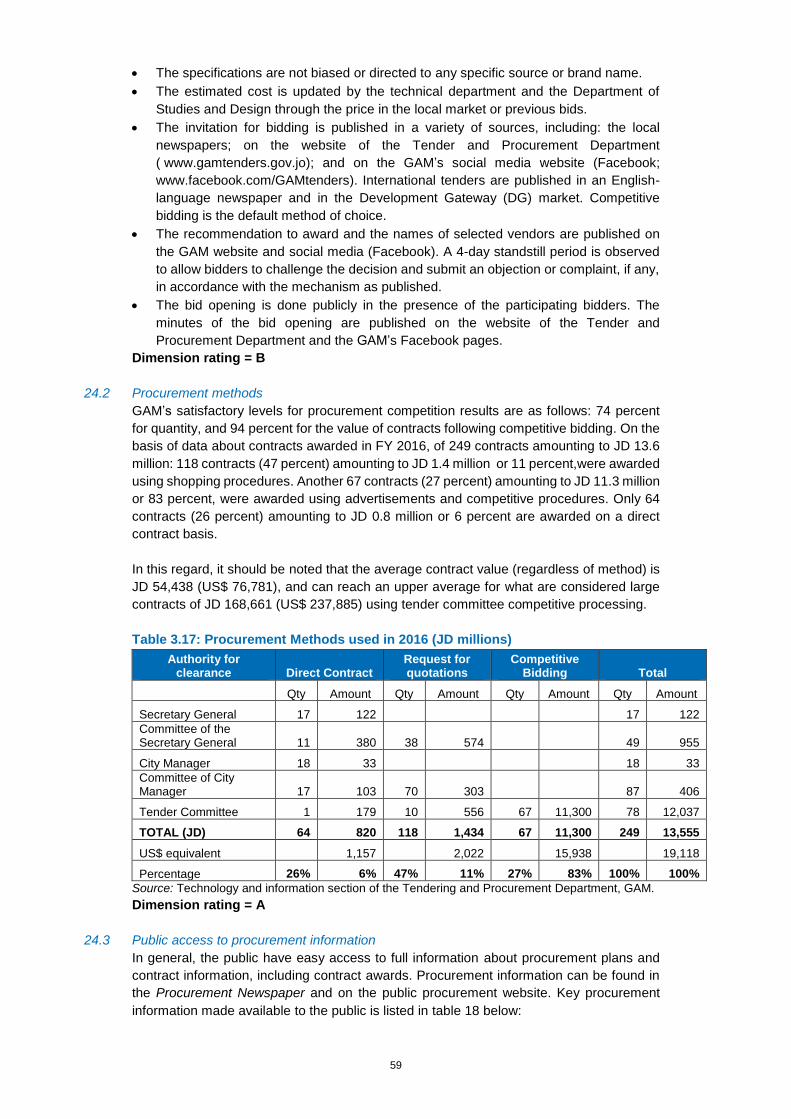
59
• The specifications are not biased or directed to any specific source or brand name.
• The estimated cost is updated by the technical department and the Department of
Studies and Design through the price in the local market or previous bids.
• The invitation for bidding is published in a variety of sources, including: the local
newspapers; on the website of the Tender and Procurement Department
( www.gamtenders.gov.jo); and on the GAM’s social media website (Facebook;
www.facebook.com/GAMtenders). International tenders are published in an English-
language newspaper and in the Development Gateway (DG) market. Competitive
bidding is the default method of choice.
• The recommendation to award and the names of selected vendors are published on
the GAM website and social media (Facebook). A 4-day standstill period is observed
to allow bidders to challenge the decision and submit an objection or complaint, if any,
in accordance with the mechanism as published.
• The bid opening is done publicly in the presence of the participating bidders. The
minutes of the bid opening are published on the website of the Tender and
Procurement Department and the GAM’s Facebook pages.
Dimension rating = B
24.2 Procurement methods
GAM’s satisfactory levels for procurement competition results are as follows: 74 percent
for quantity, and 94 percent for the value of contracts following competitive bidding. On the
basis of data about contracts awarded in FY 2016, of 249 contracts amounting to JD 13.6
million: 118 contracts (47 percent) amounting to JD 1.4 million or 11 percent,were awarded
using shopping procedures. Another 67 contracts (27 percent) amounting to JD 11.3 million
or 83 percent, were awarded using advertisements and competitive procedures. Only 64
contracts (26 percent) amounting to JD 0.8 million or 6 percent are awarded on a direct
contract basis.
In this regard, it should be noted that the average contract value (regardless of method) is
JD 54,438 (US$ 76,781), and can reach an upper average for what are considered large
contracts of JD 168,661 (US$ 237,885) using tender committee competitive processing.
Table 3.17: Procurement Methods used in 2016 (JD millions)
Authority for clearance Direct Contract
Request for quotations
Competitive Bidding Total
Qty Amount Qty Amount Qty Amount Qty Amount
Secretary General 17 122 17 122
Committee of the Secretary General 11 380 38 574 49 955
City Manager 18 33 18 33
Committee of City Manager 17 103 70 303 87 406
Tender Committee 1 179 10 556 67 11,300 78 12,037
TOTAL (JD) 64 820 118 1,434 67 11,300 249 13,555
US$ equivalent 1,157 2,022 15,938 19,118
Percentage 26% 6% 47% 11% 27% 83% 100% 100%
Source: Technology and information section of the Tendering and Procurement Department, GAM.
Dimension rating = A
24.3 Public access to procurement information
In general, the public have easy access to full information about procurement plans and
contract information, including contract awards. Procurement information can be found in
the Procurement Newspaper and on the public procurement website. Key procurement
information made available to the public is listed in table 18 below:
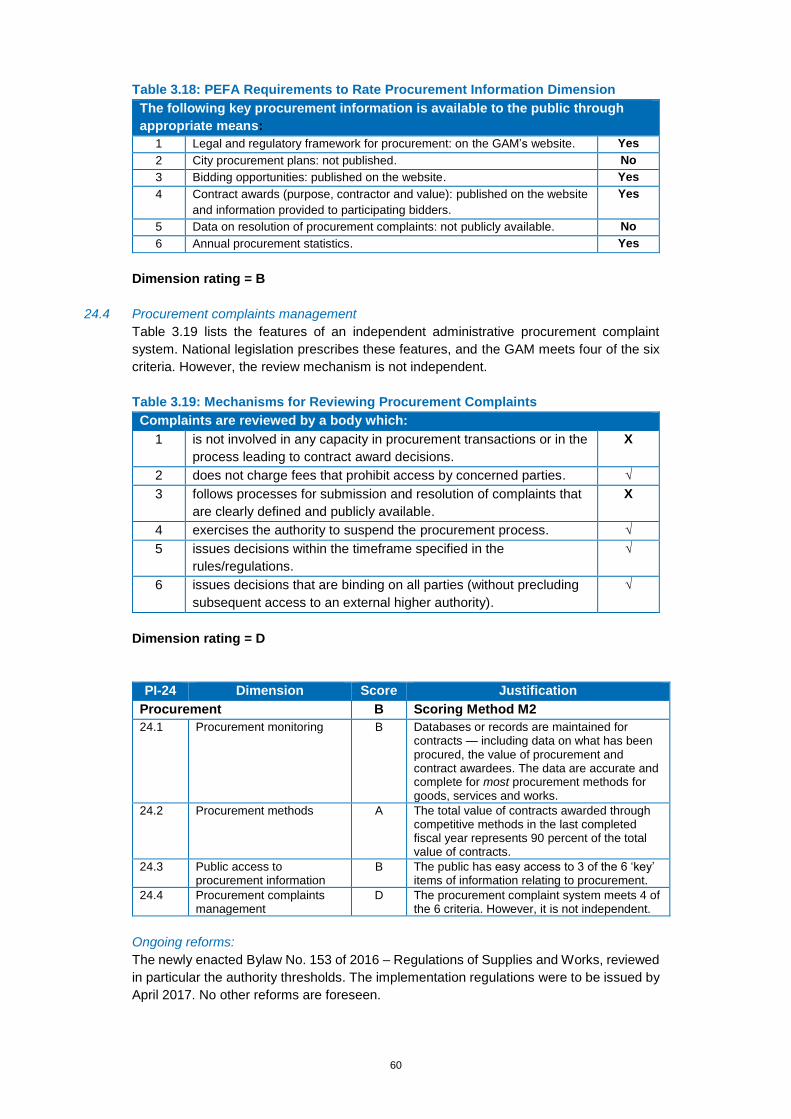
60
Table 3.18: PEFA Requirements to Rate Procurement Information Dimension
The following key procurement information is available to the public through
appropriate means:
1 Legal and regulatory framework for procurement: on the GAM’s website. Yes
2 City procurement plans: not published. No
3 Bidding opportunities: published on the website. Yes
4 Contract awards (purpose, contractor and value): published on the website
and information provided to participating bidders.
Yes
5 Data on resolution of procurement complaints: not publicly available. No
6 Annual procurement statistics. Yes
Dimension rating = B
24.4 Procurement complaints management
Table 3.19 lists the features of an independent administrative procurement complaint
system. National legislation prescribes these features, and the GAM meets four of the six
criteria. However, the review mechanism is not independent.
Table 3.19: Mechanisms for Reviewing Procurement Complaints
Complaints are reviewed by a body which:
1 is not involved in any capacity in procurement transactions or in the
process leading to contract award decisions.
X
2 does not charge fees that prohibit access by concerned parties. √
3 follows processes for submission and resolution of complaints that
are clearly defined and publicly available.
X
4 exercises the authority to suspend the procurement process. √
5 issues decisions within the timeframe specified in the
rules/regulations.
√
6 issues decisions that are binding on all parties (without precluding
subsequent access to an external higher authority).
√
Dimension rating = D
PI-24 Dimension Score Justification
Procurement B Scoring Method M2
24.1 Procurement monitoring B Databases or records are maintained for contracts — including data on what has been procured, the value of procurement and contract awardees. The data are accurate and complete for most procurement methods for goods, services and works.
24.2 Procurement methods A The total value of contracts awarded through competitive methods in the last completed fiscal year represents 90 percent of the total value of contracts.
24.3 Public access to procurement information
B The public has easy access to 3 of the 6 ‘key’ items of information relating to procurement.
24.4 Procurement complaints management
D The procurement complaint system meets 4 of the 6 criteria. However, it is not independent.
Ongoing reforms:
The newly enacted Bylaw No. 153 of 2016 – Regulations of Supplies and Works, reviewed
in particular the authority thresholds. The implementation regulations were to be issued by
April 2017. No other reforms are foreseen.
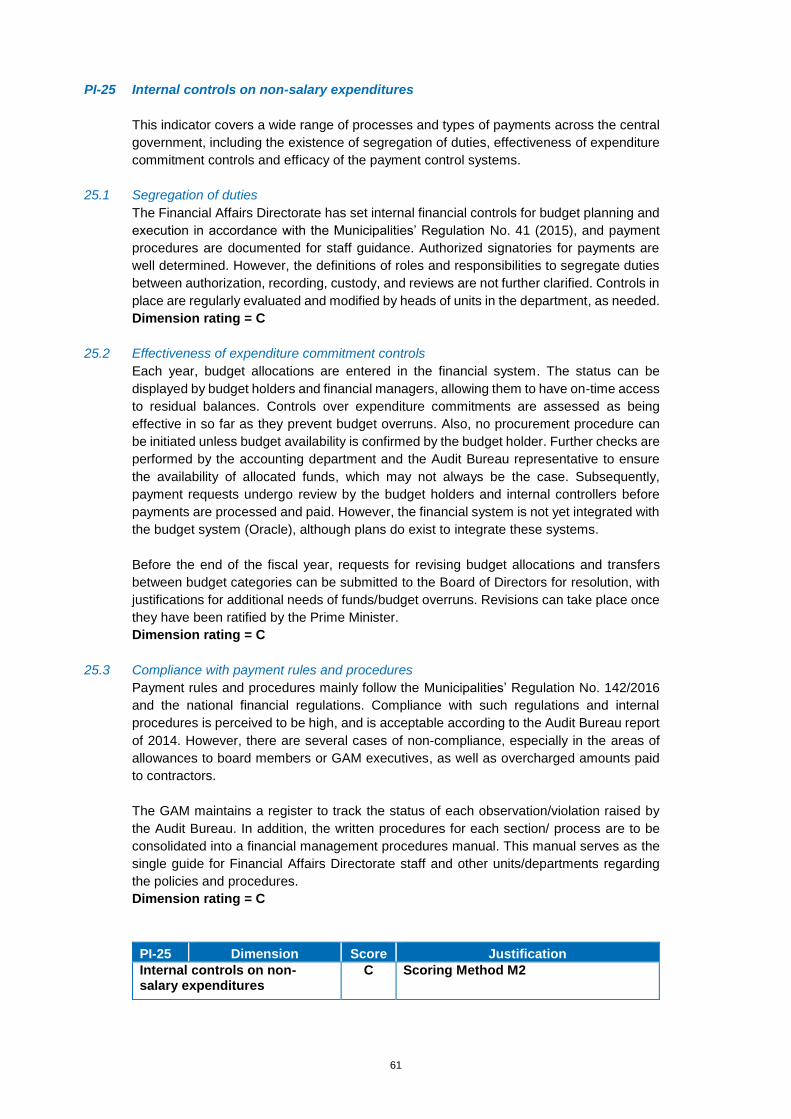
61
PI-25 Internal controls on non-salary expenditures
This indicator covers a wide range of processes and types of payments across the central
government, including the existence of segregation of duties, effectiveness of expenditure
commitment controls and efficacy of the payment control systems.
25.1 Segregation of duties
The Financial Affairs Directorate has set internal financial controls for budget planning and
execution in accordance with the Municipalities’ Regulation No. 41 (2015), and payment
procedures are documented for staff guidance. Authorized signatories for payments are
well determined. However, the definitions of roles and responsibilities to segregate duties
between authorization, recording, custody, and reviews are not further clarified. Controls in
place are regularly evaluated and modified by heads of units in the department, as needed.
Dimension rating = C
25.2 Effectiveness of expenditure commitment controls
Each year, budget allocations are entered in the financial system. The status can be
displayed by budget holders and financial managers, allowing them to have on-time access
to residual balances. Controls over expenditure commitments are assessed as being
effective in so far as they prevent budget overruns. Also, no procurement procedure can
be initiated unless budget availability is confirmed by the budget holder. Further checks are
performed by the accounting department and the Audit Bureau representative to ensure
the availability of allocated funds, which may not always be the case. Subsequently,
payment requests undergo review by the budget holders and internal controllers before
payments are processed and paid. However, the financial system is not yet integrated with
the budget system (Oracle), although plans do exist to integrate these systems.
Before the end of the fiscal year, requests for revising budget allocations and transfers
between budget categories can be submitted to the Board of Directors for resolution, with
justifications for additional needs of funds/budget overruns. Revisions can take place once
they have been ratified by the Prime Minister.
Dimension rating = C
25.3 Compliance with payment rules and procedures
Payment rules and procedures mainly follow the Municipalities’ Regulation No. 142/2016
and the national financial regulations. Compliance with such regulations and internal
procedures is perceived to be high, and is acceptable according to the Audit Bureau report
of 2014. However, there are several cases of non-compliance, especially in the areas of
allowances to board members or GAM executives, as well as overcharged amounts paid
to contractors.
The GAM maintains a register to track the status of each observation/violation raised by
the Audit Bureau. In addition, the written procedures for each section/ process are to be
consolidated into a financial management procedures manual. This manual serves as the
single guide for Financial Affairs Directorate staff and other units/departments regarding
the policies and procedures.
Dimension rating = C
PI-25 Dimension Score Justification
Internal controls on non-salary expenditures
C Scoring Method M2
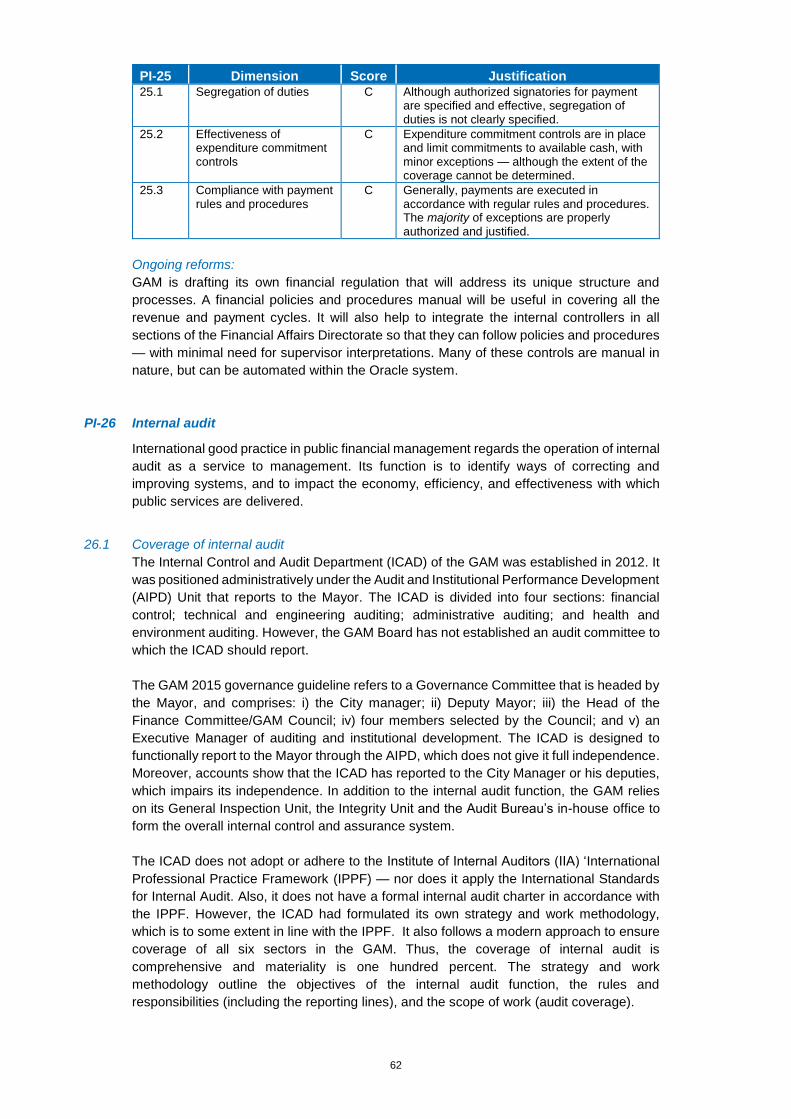
62
PI-25 Dimension Score Justification 25.1 Segregation of duties C Although authorized signatories for payment
are specified and effective, segregation of duties is not clearly specified.
25.2 Effectiveness of expenditure commitment controls
C Expenditure commitment controls are in place and limit commitments to available cash, with minor exceptions — although the extent of the coverage cannot be determined.
25.3 Compliance with payment rules and procedures
C Generally, payments are executed in accordance with regular rules and procedures. The majority of exceptions are properly authorized and justified.
Ongoing reforms:
GAM is drafting its own financial regulation that will address its unique structure and
processes. A financial policies and procedures manual will be useful in covering all the
revenue and payment cycles. It will also help to integrate the internal controllers in all
sections of the Financial Affairs Directorate so that they can follow policies and procedures
— with minimal need for supervisor interpretations. Many of these controls are manual in
nature, but can be automated within the Oracle system.
PI-26 Internal audit
International good practice in public financial management regards the operation of internal
audit as a service to management. Its function is to identify ways of correcting and
improving systems, and to impact the economy, efficiency, and effectiveness with which
public services are delivered.
26.1 Coverage of internal audit
The Internal Control and Audit Department (ICAD) of the GAM was established in 2012. It
was positioned administratively under the Audit and Institutional Performance Development
(AIPD) Unit that reports to the Mayor. The ICAD is divided into four sections: financial
control; technical and engineering auditing; administrative auditing; and health and
environment auditing. However, the GAM Board has not established an audit committee to
which the ICAD should report.
The GAM 2015 governance guideline refers to a Governance Committee that is headed by
the Mayor, and comprises: i) the City manager; ii) Deputy Mayor; iii) the Head of the
Finance Committee/GAM Council; iv) four members selected by the Council; and v) an
Executive Manager of auditing and institutional development. The ICAD is designed to
functionally report to the Mayor through the AIPD, which does not give it full independence.
Moreover, accounts show that the ICAD has reported to the City Manager or his deputies,
which impairs its independence. In addition to the internal audit function, the GAM relies
on its General Inspection Unit, the Integrity Unit and the Audit Bureau’s in-house office to
form the overall internal control and assurance system.
The ICAD does not adopt or adhere to the Institute of Internal Auditors (IIA) ‘International
Professional Practice Framework (IPPF) — nor does it apply the International Standards
for Internal Audit. Also, it does not have a formal internal audit charter in accordance with
the IPPF. However, the ICAD had formulated its own strategy and work methodology,
which is to some extent in line with the IPPF. It also follows a modern approach to ensure
coverage of all six sectors in the GAM. Thus, the coverage of internal audit is
comprehensive and materiality is one hundred percent. The strategy and work
methodology outline the objectives of the internal audit function, the rules and
responsibilities (including the reporting lines), and the scope of work (audit coverage).
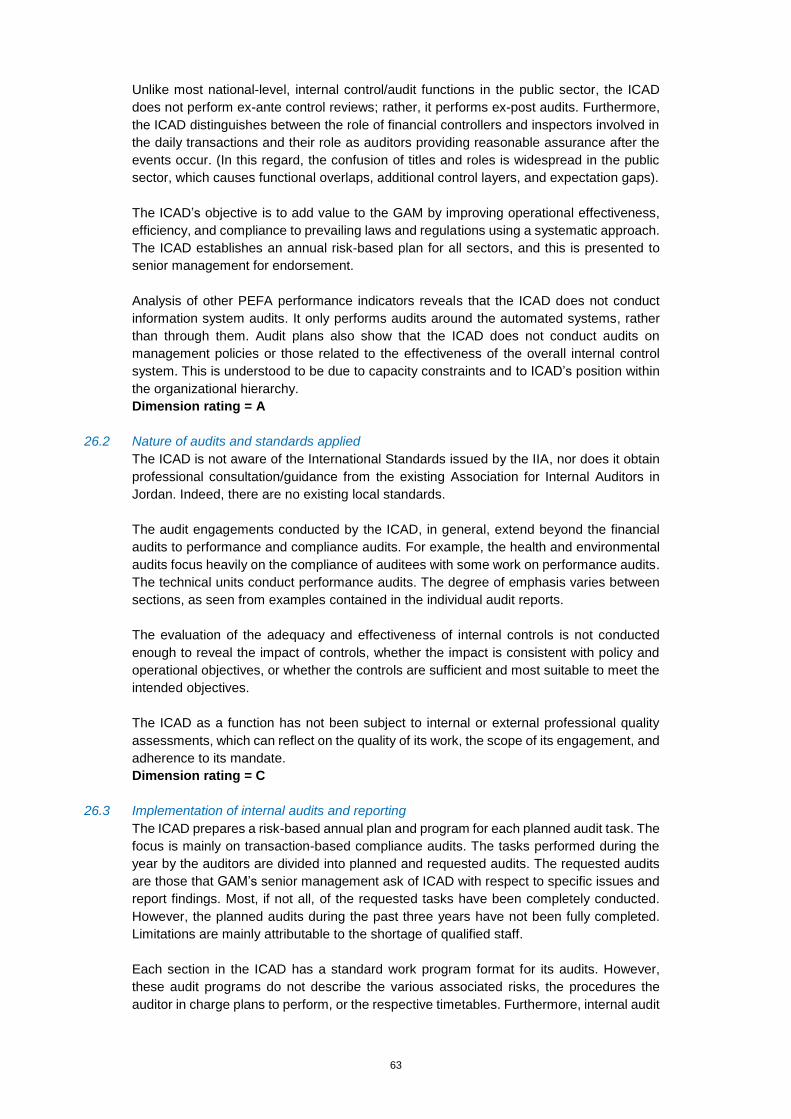
63
Unlike most national-level, internal control/audit functions in the public sector, the ICAD
does not perform ex-ante control reviews; rather, it performs ex-post audits. Furthermore,
the ICAD distinguishes between the role of financial controllers and inspectors involved in
the daily transactions and their role as auditors providing reasonable assurance after the
events occur. (In this regard, the confusion of titles and roles is widespread in the public
sector, which causes functional overlaps, additional control layers, and expectation gaps).
The ICAD’s objective is to add value to the GAM by improving operational effectiveness,
efficiency, and compliance to prevailing laws and regulations using a systematic approach.
The ICAD establishes an annual risk-based plan for all sectors, and this is presented to
senior management for endorsement.
Analysis of other PEFA performance indicators reveals that the ICAD does not conduct
information system audits. It only performs audits around the automated systems, rather
than through them. Audit plans also show that the ICAD does not conduct audits on
management policies or those related to the effectiveness of the overall internal control
system. This is understood to be due to capacity constraints and to ICAD’s position within
the organizational hierarchy.
Dimension rating = A
26.2 Nature of audits and standards applied
The ICAD is not aware of the International Standards issued by the IIA, nor does it obtain
professional consultation/guidance from the existing Association for Internal Auditors in
Jordan. Indeed, there are no existing local standards.
The audit engagements conducted by the ICAD, in general, extend beyond the financial
audits to performance and compliance audits. For example, the health and environmental
audits focus heavily on the compliance of auditees with some work on performance audits.
The technical units conduct performance audits. The degree of emphasis varies between
sections, as seen from examples contained in the individual audit reports.
The evaluation of the adequacy and effectiveness of internal controls is not conducted
enough to reveal the impact of controls, whether the impact is consistent with policy and
operational objectives, or whether the controls are sufficient and most suitable to meet the
intended objectives.
The ICAD as a function has not been subject to internal or external professional quality
assessments, which can reflect on the quality of its work, the scope of its engagement, and
adherence to its mandate.
Dimension rating = C
26.3 Implementation of internal audits and reporting
The ICAD prepares a risk-based annual plan and program for each planned audit task. The
focus is mainly on transaction-based compliance audits. The tasks performed during the
year by the auditors are divided into planned and requested audits. The requested audits
are those that GAM’s senior management ask of ICAD with respect to specific issues and
report findings. Most, if not all, of the requested tasks have been completely conducted.
However, the planned audits during the past three years have not been fully completed.
Limitations are mainly attributable to the shortage of qualified staff.
Each section in the ICAD has a standard work program format for its audits. However,
these audit programs do not describe the various associated risks, the procedures the
auditor in charge plans to perform, or the respective timetables. Furthermore, internal audit
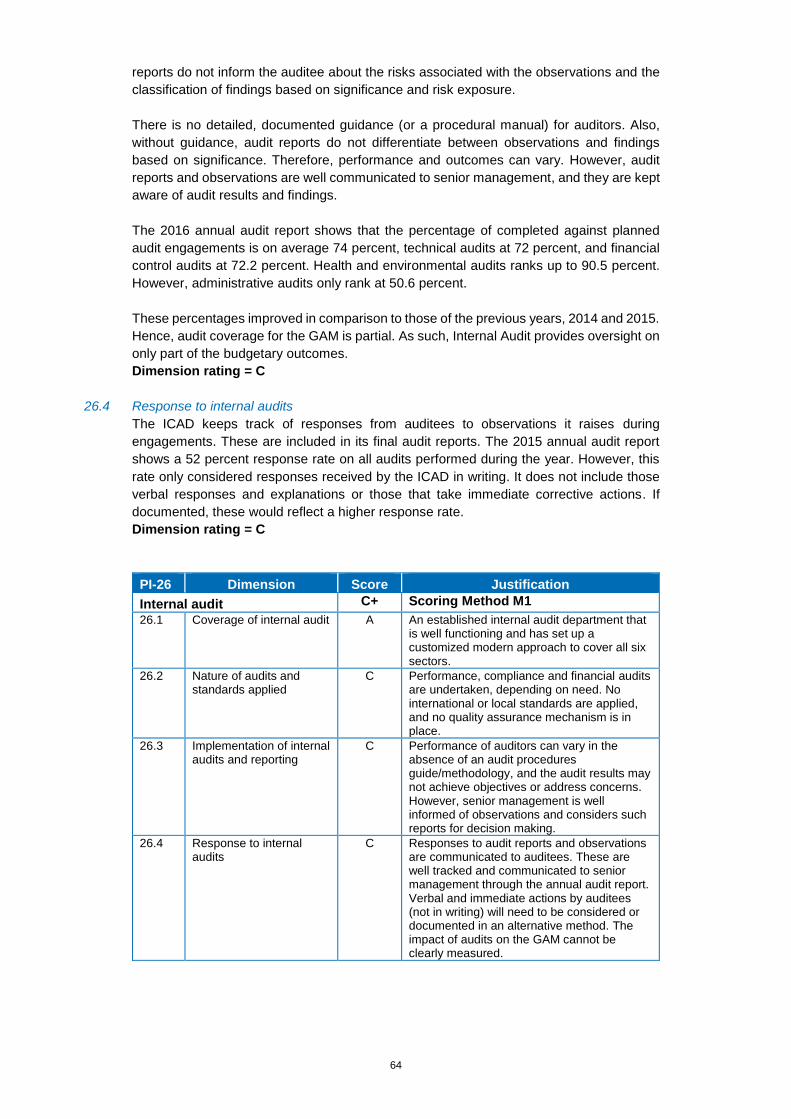
64
reports do not inform the auditee about the risks associated with the observations and the
classification of findings based on significance and risk exposure.
There is no detailed, documented guidance (or a procedural manual) for auditors. Also,
without guidance, audit reports do not differentiate between observations and findings
based on significance. Therefore, performance and outcomes can vary. However, audit
reports and observations are well communicated to senior management, and they are kept
aware of audit results and findings.
The 2016 annual audit report shows that the percentage of completed against planned
audit engagements is on average 74 percent, technical audits at 72 percent, and financial
control audits at 72.2 percent. Health and environmental audits ranks up to 90.5 percent.
However, administrative audits only rank at 50.6 percent.
These percentages improved in comparison to those of the previous years, 2014 and 2015.
Hence, audit coverage for the GAM is partial. As such, Internal Audit provides oversight on
only part of the budgetary outcomes.
Dimension rating = C
26.4 Response to internal audits
The ICAD keeps track of responses from auditees to observations it raises during
engagements. These are included in its final audit reports. The 2015 annual audit report
shows a 52 percent response rate on all audits performed during the year. However, this
rate only considered responses received by the ICAD in writing. It does not include those
verbal responses and explanations or those that take immediate corrective actions. If
documented, these would reflect a higher response rate.
Dimension rating = C
PI-26 Dimension Score Justification
Internal audit C+ Scoring Method M1
26.1 Coverage of internal audit A An established internal audit department that is well functioning and has set up a customized modern approach to cover all six sectors.
26.2 Nature of audits and standards applied
C Performance, compliance and financial audits are undertaken, depending on need. No international or local standards are applied, and no quality assurance mechanism is in place.
26.3 Implementation of internal audits and reporting
C Performance of auditors can vary in the absence of an audit procedures guide/methodology, and the audit results may not achieve objectives or address concerns. However, senior management is well informed of observations and considers such reports for decision making.
26.4 Response to internal audits
C Responses to audit reports and observations are communicated to auditees. These are well tracked and communicated to senior management through the annual audit report. Verbal and immediate actions by auditees (not in writing) will need to be considered or documented in an alternative method. The impact of audits on the GAM cannot be clearly measured.

65
Ongoing reforms:
No known reforms.
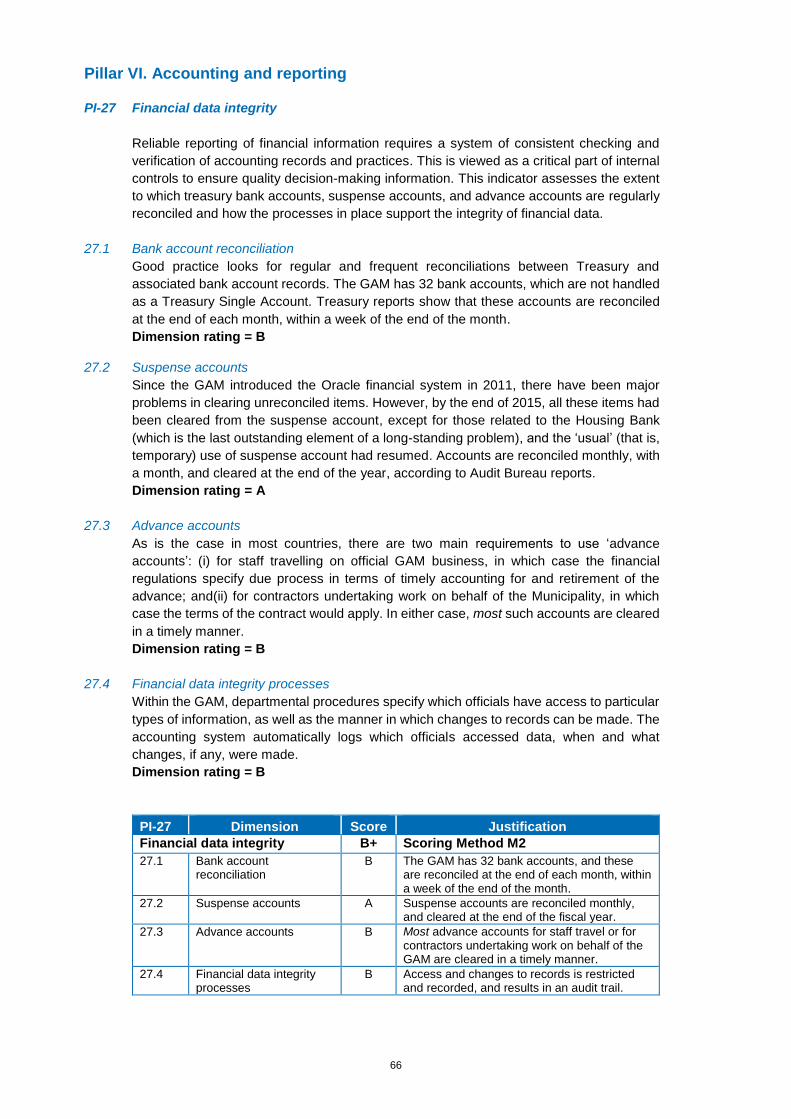
66
Pillar VI. Accounting and reporting
PI-27 Financial data integrity
Reliable reporting of financial information requires a system of consistent checking and
verification of accounting records and practices. This is viewed as a critical part of internal
controls to ensure quality decision-making information. This indicator assesses the extent
to which treasury bank accounts, suspense accounts, and advance accounts are regularly
reconciled and how the processes in place support the integrity of financial data.
27.1 Bank account reconciliation
Good practice looks for regular and frequent reconciliations between Treasury and
associated bank account records. The GAM has 32 bank accounts, which are not handled
as a Treasury Single Account. Treasury reports show that these accounts are reconciled
at the end of each month, within a week of the end of the month.
Dimension rating = B
27.2 Suspense accounts
Since the GAM introduced the Oracle financial system in 2011, there have been major
problems in clearing unreconciled items. However, by the end of 2015, all these items had
been cleared from the suspense account, except for those related to the Housing Bank
(which is the last outstanding element of a long-standing problem), and the ‘usual’ (that is,
temporary) use of suspense account had resumed. Accounts are reconciled monthly, with
a month, and cleared at the end of the year, according to Audit Bureau reports.
Dimension rating = A
27.3 Advance accounts
As is the case in most countries, there are two main requirements to use ‘advance
accounts’: (i) for staff travelling on official GAM business, in which case the financial
regulations specify due process in terms of timely accounting for and retirement of the
advance; and(ii) for contractors undertaking work on behalf of the Municipality, in which
case the terms of the contract would apply. In either case, most such accounts are cleared
in a timely manner.
Dimension rating = B
27.4 Financial data integrity processes
Within the GAM, departmental procedures specify which officials have access to particular
types of information, as well as the manner in which changes to records can be made. The
accounting system automatically logs which officials accessed data, when and what
changes, if any, were made.
Dimension rating = B
PI-27 Dimension Score Justification
Financial data integrity B+ Scoring Method M2
27.1 Bank account reconciliation
B The GAM has 32 bank accounts, and these are reconciled at the end of each month, within a week of the end of the month.
27.2 Suspense accounts A Suspense accounts are reconciled monthly, and cleared at the end of the fiscal year.
27.3 Advance accounts B Most advance accounts for staff travel or for contractors undertaking work on behalf of the GAM are cleared in a timely manner.
27.4 Financial data integrity processes
B Access and changes to records is restricted and recorded, and results in an audit trail.
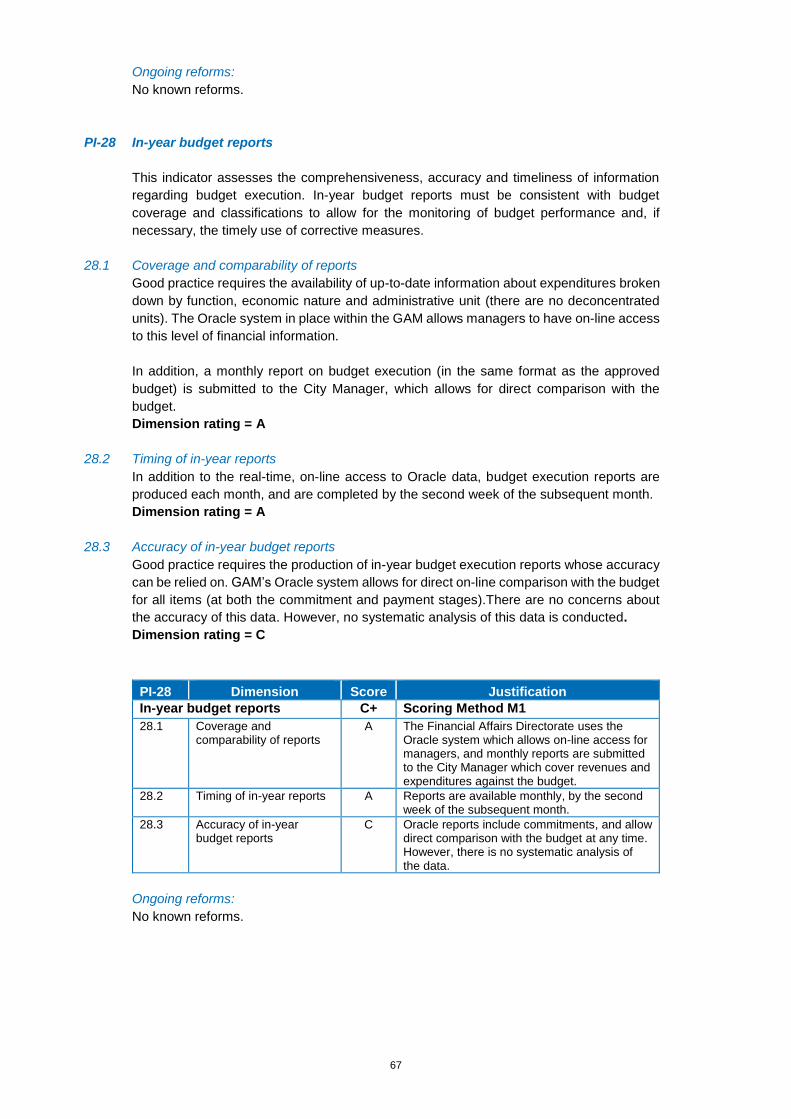
67
Ongoing reforms:
No known reforms.
PI-28 In-year budget reports
This indicator assesses the comprehensiveness, accuracy and timeliness of information
regarding budget execution. In-year budget reports must be consistent with budget
coverage and classifications to allow for the monitoring of budget performance and, if
necessary, the timely use of corrective measures.
28.1 Coverage and comparability of reports Good practice requires the availability of up-to-date information about expenditures broken
down by function, economic nature and administrative unit (there are no deconcentrated
units). The Oracle system in place within the GAM allows managers to have on-line access
to this level of financial information.
In addition, a monthly report on budget execution (in the same format as the approved
budget) is submitted to the City Manager, which allows for direct comparison with the
budget.
Dimension rating = A
28.2 Timing of in-year reports
In addition to the real-time, on-line access to Oracle data, budget execution reports are
produced each month, and are completed by the second week of the subsequent month.
Dimension rating = A
28.3 Accuracy of in-year budget reports
Good practice requires the production of in-year budget execution reports whose accuracy
can be relied on. GAM’s Oracle system allows for direct on-line comparison with the budget
for all items (at both the commitment and payment stages).There are no concerns about
the accuracy of this data. However, no systematic analysis of this data is conducted.
Dimension rating = C
PI-28 Dimension Score Justification
In-year budget reports C+ Scoring Method M1
28.1 Coverage and comparability of reports
A The Financial Affairs Directorate uses the Oracle system which allows on-line access for managers, and monthly reports are submitted to the City Manager which cover revenues and expenditures against the budget.
28.2 Timing of in-year reports A Reports are available monthly, by the second week of the subsequent month.
28.3 Accuracy of in-year budget reports
C Oracle reports include commitments, and allow direct comparison with the budget at any time. However, there is no systematic analysis of the data.
Ongoing reforms:
No known reforms.
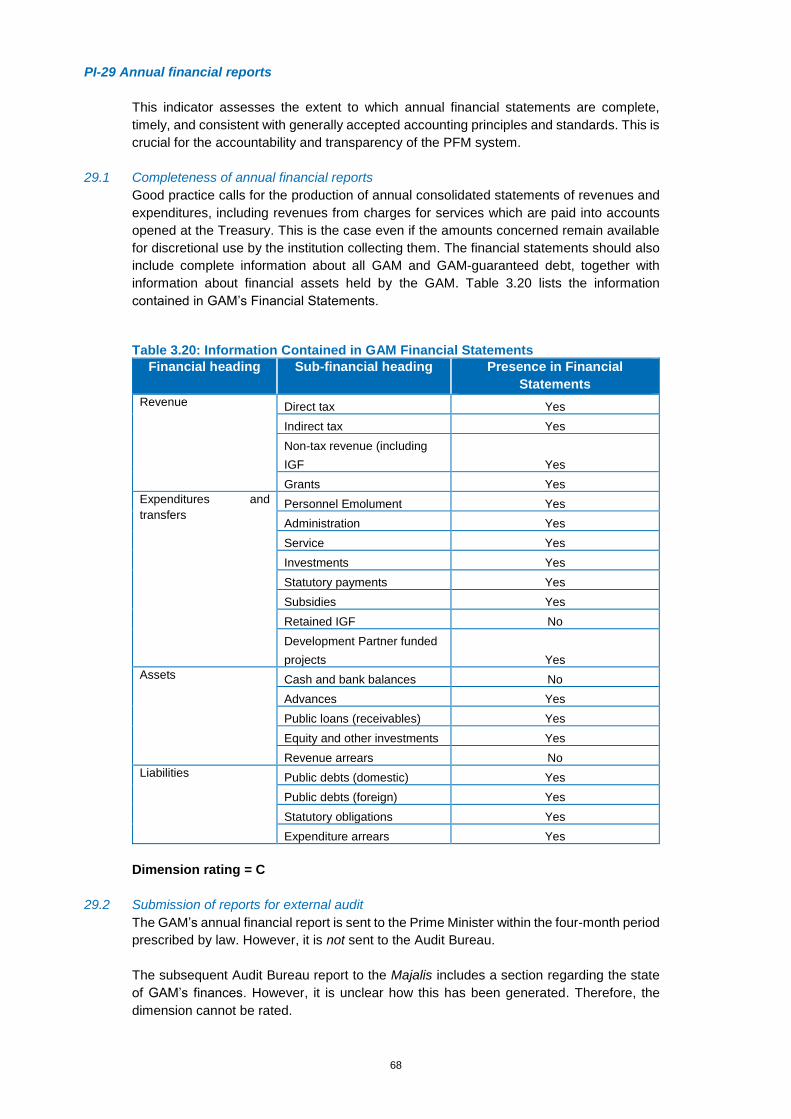
68
PI-29 Annual financial reports
This indicator assesses the extent to which annual financial statements are complete,
timely, and consistent with generally accepted accounting principles and standards. This is
crucial for the accountability and transparency of the PFM system.
29.1 Completeness of annual financial reports
Good practice calls for the production of annual consolidated statements of revenues and
expenditures, including revenues from charges for services which are paid into accounts
opened at the Treasury. This is the case even if the amounts concerned remain available
for discretional use by the institution collecting them. The financial statements should also
include complete information about all GAM and GAM-guaranteed debt, together with
information about financial assets held by the GAM. Table 3.20 lists the information
contained in GAM’s Financial Statements.
Table 3.20: Information Contained in GAM Financial Statements
Financial heading Sub-financial heading Presence in Financial
Statements
Revenue Direct tax Yes
Indirect tax Yes
Non-tax revenue (including
IGF Yes
Grants Yes
Expenditures and
transfers Personnel Emolument Yes
Administration Yes
Service Yes
Investments Yes
Statutory payments Yes
Subsidies Yes
Retained IGF No
Development Partner funded
projects Yes
Assets Cash and bank balances No
Advances Yes
Public loans (receivables) Yes
Equity and other investments Yes
Revenue arrears No
Liabilities Public debts (domestic) Yes
Public debts (foreign) Yes
Statutory obligations Yes
Expenditure arrears Yes
Dimension rating = C
29.2 Submission of reports for external audit
The GAM’s annual financial report is sent to the Prime Minister within the four-month period
prescribed by law. However, it is not sent to the Audit Bureau.
The subsequent Audit Bureau report to the Majalis includes a section regarding the state
of GAM’s finances. However, it is unclear how this has been generated. Therefore, the
dimension cannot be rated.
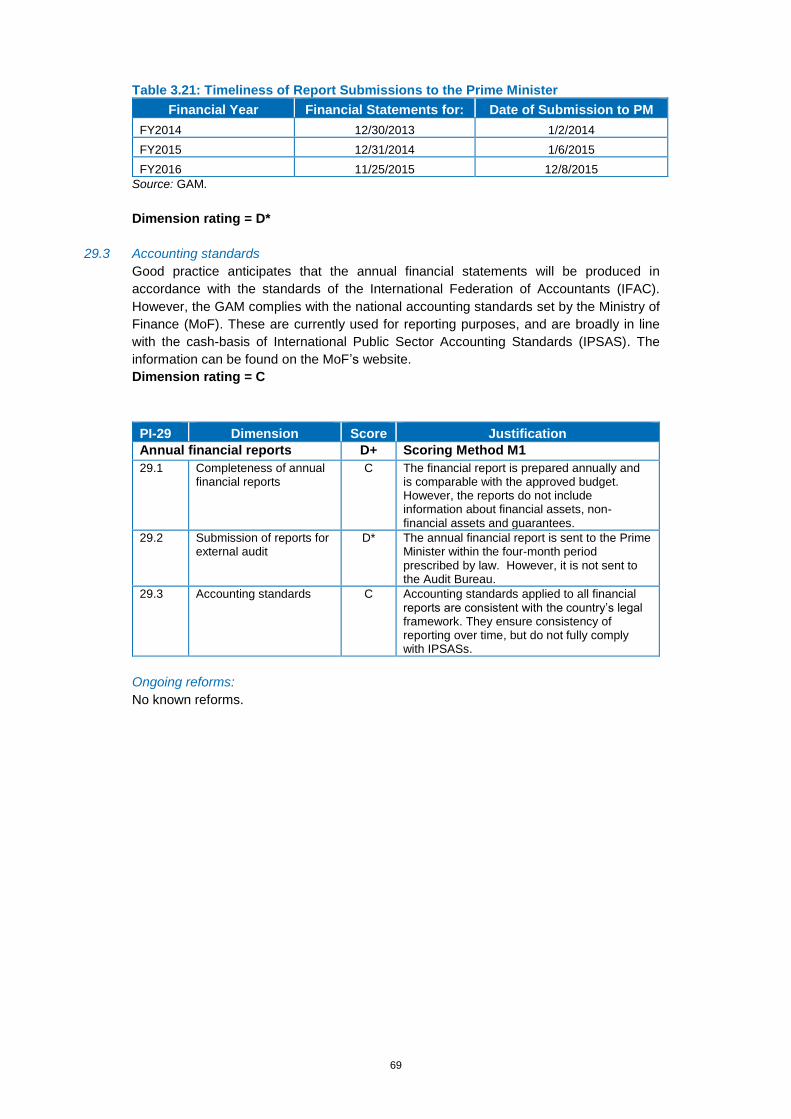
69
Table 3.21: Timeliness of Report Submissions to the Prime Minister
Financial Year Financial Statements for: Date of Submission to PM
FY2014 12/30/2013 1/2/2014
FY2015 12/31/2014 1/6/2015
FY2016 11/25/2015 12/8/2015
Source: GAM.
Dimension rating = D*
29.3 Accounting standards
Good practice anticipates that the annual financial statements will be produced in
accordance with the standards of the International Federation of Accountants (IFAC).
However, the GAM complies with the national accounting standards set by the Ministry of
Finance (MoF). These are currently used for reporting purposes, and are broadly in line
with the cash-basis of International Public Sector Accounting Standards (IPSAS). The
information can be found on the MoF’s website.
Dimension rating = C
PI-29 Dimension Score Justification
Annual financial reports D+ Scoring Method M1
29.1 Completeness of annual financial reports
C The financial report is prepared annually and is comparable with the approved budget. However, the reports do not include information about financial assets, non-financial assets and guarantees.
29.2 Submission of reports for external audit
D* The annual financial report is sent to the Prime Minister within the four-month period prescribed by law. However, it is not sent to the Audit Bureau.
29.3 Accounting standards C Accounting standards applied to all financial reports are consistent with the country’s legal framework. They ensure consistency of reporting over time, but do not fully comply with IPSASs.
Ongoing reforms:
No known reforms.
70
Pillar VII. External scrutiny and audit
PI-30 External audit
This indicator assesses the quality of the external audit in terms of: the scope and coverage
of the audit; adherence to appropriate audit standards (including independence of the
external audit institutions); the focus on significant and systemic PFM issues in its reports;
and the performance of a full range of financial audits — such as the reliability of financial
statements, the regularity of transactions and the functioning of internal control and
procurement systems. The assessment focuses on the last audited financial year, 2015.
30.1 Audit coverage and standards
The Audit Bureau is Jordan’s supreme audit institution (SAI). It was established in its
present form in 1952, under Law No. 28 issued in accordance with Article 119 of the
Constitution, stipulating that the “Audit Bureau Act has been set to audit the revenues and
expenditures of the state and ways of expenditure”. Taking account of recent developments
in Jordan, an Amending Audit Law No 3 of 2002 has been passed. It included several
aspects, the most important of which are providing the Audit Bureau with the following:
• The power to conduct post-audits for expenditures. In the meantime, the head of the
Audit Bureau may in certain cases, if approved by the Prime Minister, take a decision
to conduct pre-audits. Before this amendment, the Audit Bureau has been conducting
pre-audit of the amounts of expenditure that exceed JD 5,000. It is working currently
on shifting its focus gradually from pre- to post-audit.
• The power to conduct administrative audits. Previously, the Audit Bureau had been
conducting audits to administrative decisions and procedures only if they related
directly to financial issues.
• The mandate to conduct the environmental and performance audits.
• An expanded scope, to include companies of which the government owns 50 percent.
• The authority for the President of the Audit Bureau to call on counselors, experts, and
specialists for any issues that require special technical expertise.
• Powers to make employees and officers legally accountability if they refuse to present
documentation to auditors, or if they do not respond to audit inquiries within the period
specified by law.
The Audit Bureau is a member of international and regional SAI bodies, such as INTOSAI
and ARABOSAI. It is also proceeding toward compliance with ISSAIs, according to a
phased program supported by INTOSAI.
The Audit Bureau Law requires the GAM — as for any entity subject to Audit Bureau audit
— to submit final accounts to the Audit Bureau within 6 months from the end of the year.
Any auditee is required respond to the Audit Bureau observations within 30 days if it is
based in Jordan, and within 60 days if it is based outside of Jordan. The Audit Bureau has
to submit an annual audit report to the parliament, with copies to the Prime Minister and
Minister of Finance at the beginning of the regular parliamentary session or when the
parliament asks for the report (October/November). The Municipalities Law confirms that
the GAM is subject to the Audit Bureau audit, but does not specify any details regarding
the scope and timeliness of this audit.
According to the Audit Bureau law, it performs ex-post audits on expenses. However, in
special cases, the President of the Audit Bureau is permitted to perform ex-ante audits with
the approval of the Prime Minister. The Audit Bureau also has a resident office at the GAM,
and performs both ex-ante and ex-post audits of revenues and expenses as follows:
71
• Expenses are 100 percent pre-audited.
• Revenues are 70 percent pre-audited. Building licenses fee revenues constitute
around 70 percent of all revenues. The rest is audited based on a random sample of
15 percent of transactions.
The Audit Bureau 2015 Annual Report contains around 26 pages on the GAM (in 2014, the
report contained around 50 pages). Observations are very detailed, and are based on ex-
ante work and participation in committees.
The Audit Bureau has mostly been involved in ex-ante auditing (such as auditing payments
before they are disbursed), given that most public entities lacked effective internal auditing
systems. However, over the past few years — and with the support of development
partners — the Audit Bureau has been training internal auditors at various public bodies. It
has also been trying to engage more in ex-post auditing. In this context, the World Bank
has provided a US$250,000 grant to build its capacity.
The Audit Bureau also has a Memorandum of Understanding with Jordan’s Anti-Corruption
Commission, and they are trying to increase cooperation between the two bodies. For
example, they exchange quarterly reports, and are currently developing electronic
databases to simplify exchange and access to information between the two organizations.
In addition to being audited by the Audit Bureau, the GAM has decided, but is not obliged,
to hire a private external auditor. Regarding timeliness issues, the private external auditor
audit report for 2015 was submitted at beginning of February 2017, although it should be
noted that only the statement of revenues and expenses is audited.
The 2016 PEFA criteria emphasize the role of the external auditor in relation to the annual
financial statements, to which the Audit Bureau has devoted little attention in the past.
Indeed, its stance has been that it would provide an audit opinion when financial statements
were presented in accordance with international standards.
Dimension rating = D
30.2 Submission of audit reports to the legislature (that is, the GAM Council)
PEFA considers good practice to be defined by the delivery to the Council of the annual
report on GAM’s financial statements within three months of the auditor’s receipt of these
statements.
The Audit Bureau Law requires the MoF to submit final accounts, including all auditees’
annual financial statements for audit within 6 months from the end of the year. In addition,
the Municipalities Law requires the Mayor to provide final accounts to the Prime Minister
within four months from the end of the year. While the law mentions that the GAM’s
accounts are subject to the audit of the Audit Bureau, the Bureau is not required to submit
an audit report to the GAM Council. Hence, no audit reports are submitted to the GAM
Council.
Dimension rating = D*
30.3 External audit follow-up
Good practice envisages that audited units will respond constructively to audit
recommendations. These may address a variety of follow-up issues, such as how to
improve the performance of systems; how to strengthen discipline of employees; as well
as more narrowly defined financial issues. In addition, information may be collected about
the extent to which recommendations are followed, and the results obtained.
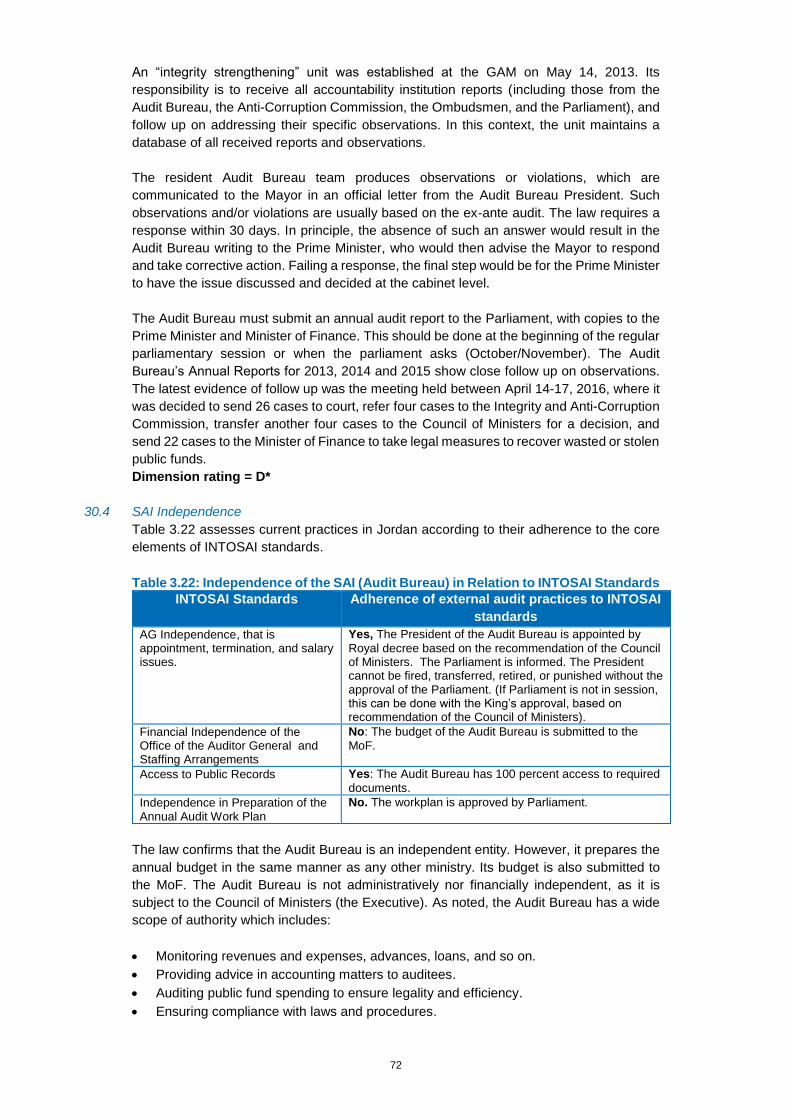
72
An “integrity strengthening” unit was established at the GAM on May 14, 2013. Its
responsibility is to receive all accountability institution reports (including those from the
Audit Bureau, the Anti-Corruption Commission, the Ombudsmen, and the Parliament), and
follow up on addressing their specific observations. In this context, the unit maintains a
database of all received reports and observations.
The resident Audit Bureau team produces observations or violations, which are
communicated to the Mayor in an official letter from the Audit Bureau President. Such
observations and/or violations are usually based on the ex-ante audit. The law requires a
response within 30 days. In principle, the absence of such an answer would result in the
Audit Bureau writing to the Prime Minister, who would then advise the Mayor to respond
and take corrective action. Failing a response, the final step would be for the Prime Minister
to have the issue discussed and decided at the cabinet level.
The Audit Bureau must submit an annual audit report to the Parliament, with copies to the
Prime Minister and Minister of Finance. This should be done at the beginning of the regular
parliamentary session or when the parliament asks (October/November). The Audit
Bureau’s Annual Reports for 2013, 2014 and 2015 show close follow up on observations.
The latest evidence of follow up was the meeting held between April 14-17, 2016, where it
was decided to send 26 cases to court, refer four cases to the Integrity and Anti-Corruption
Commission, transfer another four cases to the Council of Ministers for a decision, and
send 22 cases to the Minister of Finance to take legal measures to recover wasted or stolen
public funds.
Dimension rating = D*
30.4 SAI Independence
Table 3.22 assesses current practices in Jordan according to their adherence to the core
elements of INTOSAI standards.
Table 3.22: Independence of the SAI (Audit Bureau) in Relation to INTOSAI Standards
INTOSAI Standards Adherence of external audit practices to INTOSAI
standards
AG Independence, that is appointment, termination, and salary issues.
Yes, The President of the Audit Bureau is appointed by
Royal decree based on the recommendation of the Council of Ministers. The Parliament is informed. The President cannot be fired, transferred, retired, or punished without the approval of the Parliament. (If Parliament is not in session, this can be done with the King’s approval, based on recommendation of the Council of Ministers).
Financial Independence of the Office of the Auditor General and Staffing Arrangements
No: The budget of the Audit Bureau is submitted to the
MoF.
Access to Public Records Yes: The Audit Bureau has 100 percent access to required
documents.
Independence in Preparation of the Annual Audit Work Plan
No. The workplan is approved by Parliament.
The law confirms that the Audit Bureau is an independent entity. However, it prepares the
annual budget in the same manner as any other ministry. Its budget is also submitted to
the MoF. The Audit Bureau is not administratively nor financially independent, as it is
subject to the Council of Ministers (the Executive). As noted, the Audit Bureau has a wide
scope of authority which includes:
• Monitoring revenues and expenses, advances, loans, and so on.
• Providing advice in accounting matters to auditees.
• Auditing public fund spending to ensure legality and efficiency.
• Ensuring compliance with laws and procedures.
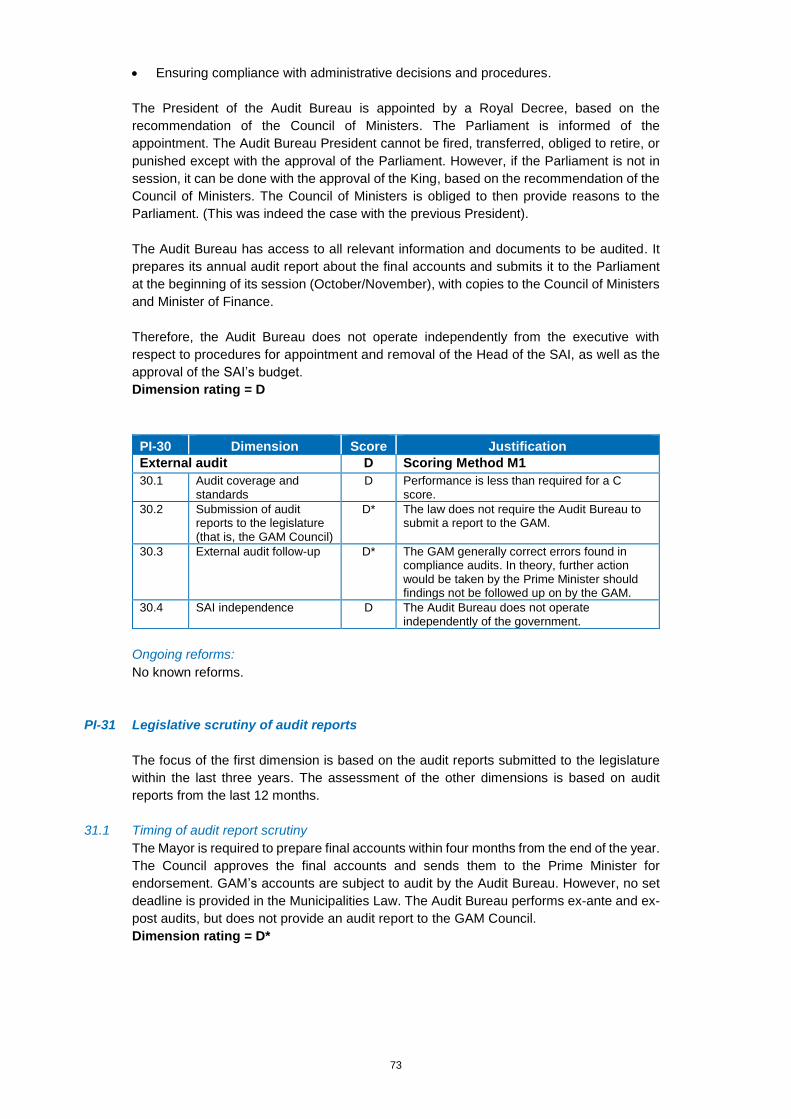
73
• Ensuring compliance with administrative decisions and procedures.
The President of the Audit Bureau is appointed by a Royal Decree, based on the
recommendation of the Council of Ministers. The Parliament is informed of the
appointment. The Audit Bureau President cannot be fired, transferred, obliged to retire, or
punished except with the approval of the Parliament. However, if the Parliament is not in
session, it can be done with the approval of the King, based on the recommendation of the
Council of Ministers. The Council of Ministers is obliged to then provide reasons to the
Parliament. (This was indeed the case with the previous President).
The Audit Bureau has access to all relevant information and documents to be audited. It
prepares its annual audit report about the final accounts and submits it to the Parliament
at the beginning of its session (October/November), with copies to the Council of Ministers
and Minister of Finance.
Therefore, the Audit Bureau does not operate independently from the executive with
respect to procedures for appointment and removal of the Head of the SAI, as well as the
approval of the SAI’s budget.
Dimension rating = D
PI-30 Dimension Score Justification
External audit D Scoring Method M1
30.1 Audit coverage and standards
D Performance is less than required for a C score.
30.2 Submission of audit reports to the legislature (that is, the GAM Council)
D* The law does not require the Audit Bureau to submit a report to the GAM.
30.3 External audit follow-up D* The GAM generally correct errors found in compliance audits. In theory, further action would be taken by the Prime Minister should findings not be followed up on by the GAM.
30.4 SAI independence D The Audit Bureau does not operate independently of the government.
Ongoing reforms:
No known reforms.
PI-31 Legislative scrutiny of audit reports
The focus of the first dimension is based on the audit reports submitted to the legislature
within the last three years. The assessment of the other dimensions is based on audit
reports from the last 12 months.
31.1 Timing of audit report scrutiny
The Mayor is required to prepare final accounts within four months from the end of the year.
The Council approves the final accounts and sends them to the Prime Minister for
endorsement. GAM’s accounts are subject to audit by the Audit Bureau. However, no set
deadline is provided in the Municipalities Law. The Audit Bureau performs ex-ante and ex-
post audits, but does not provide an audit report to the GAM Council.
Dimension rating = D*
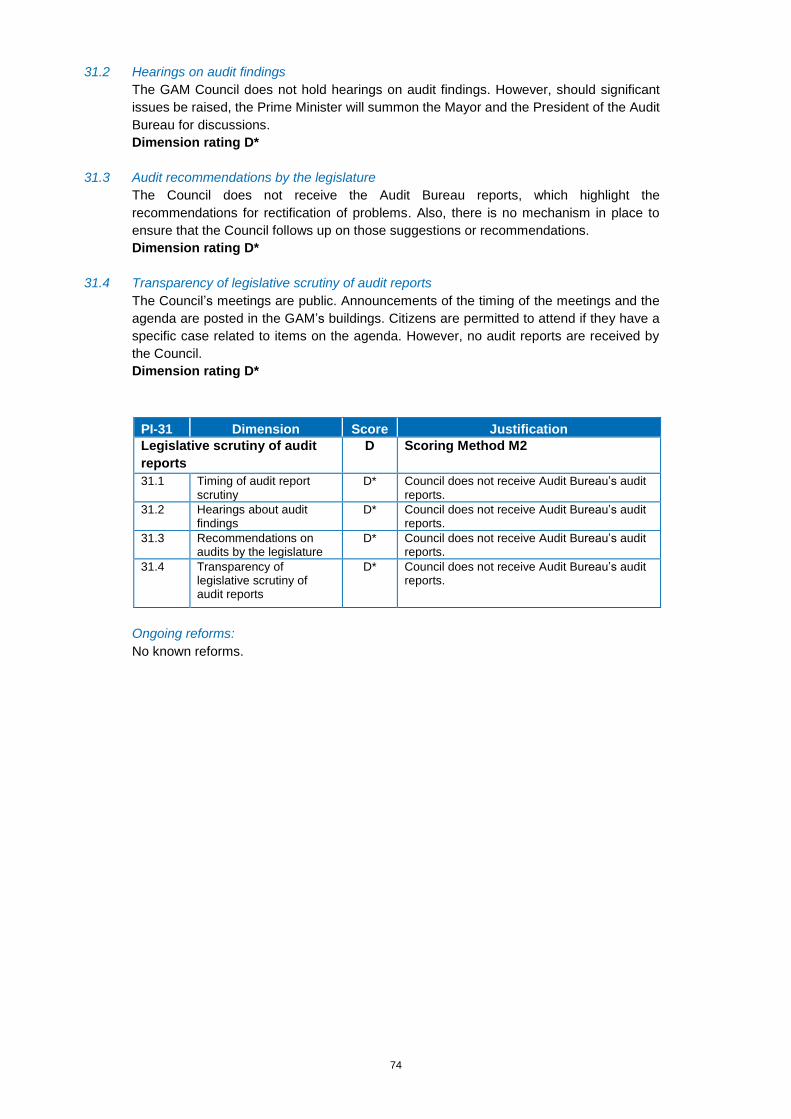
74
31.2 Hearings on audit findings
The GAM Council does not hold hearings on audit findings. However, should significant
issues be raised, the Prime Minister will summon the Mayor and the President of the Audit
Bureau for discussions.
Dimension rating D*
31.3 Audit recommendations by the legislature
The Council does not receive the Audit Bureau reports, which highlight the
recommendations for rectification of problems. Also, there is no mechanism in place to
ensure that the Council follows up on those suggestions or recommendations.
Dimension rating D*
31.4 Transparency of legislative scrutiny of audit reports
The Council’s meetings are public. Announcements of the timing of the meetings and the
agenda are posted in the GAM’s buildings. Citizens are permitted to attend if they have a
specific case related to items on the agenda. However, no audit reports are received by
the Council.
Dimension rating D*
Ongoing reforms:
No known reforms.
PI-31 Dimension Score Justification
Legislative scrutiny of audit
reports
D Scoring Method M2
31.1 Timing of audit report scrutiny
D* Council does not receive Audit Bureau’s audit reports.
31.2 Hearings about audit findings
D* Council does not receive Audit Bureau’s audit reports.
31.3 Recommendations on audits by the legislature
D* Council does not receive Audit Bureau’s audit reports.
31.4 Transparency of legislative scrutiny of audit reports
D* Council does not receive Audit Bureau’s audit reports.
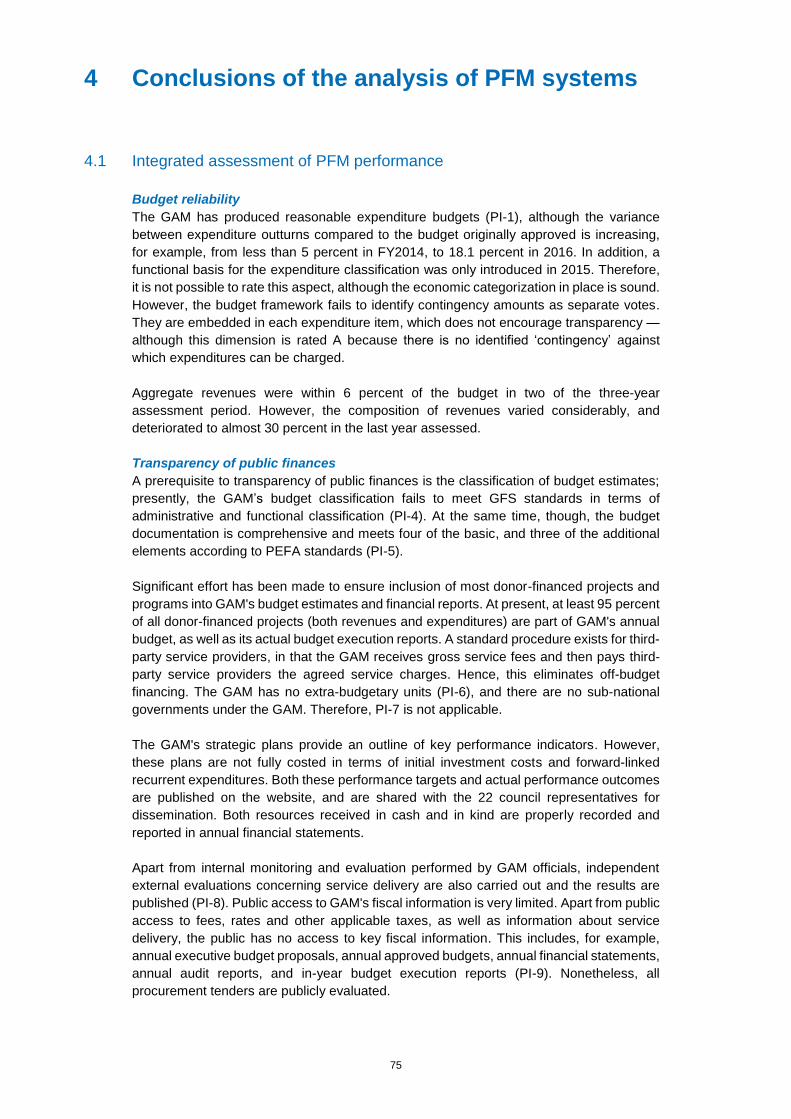
75
4 Conclusions of the analysis of PFM systems
4.1 Integrated assessment of PFM performance
Budget reliability
The GAM has produced reasonable expenditure budgets (PI-1), although the variance
between expenditure outturns compared to the budget originally approved is increasing,
for example, from less than 5 percent in FY2014, to 18.1 percent in 2016. In addition, a
functional basis for the expenditure classification was only introduced in 2015. Therefore,
it is not possible to rate this aspect, although the economic categorization in place is sound.
However, the budget framework fails to identify contingency amounts as separate votes.
They are embedded in each expenditure item, which does not encourage transparency —
although this dimension is rated A because there is no identified ‘contingency’ against
which expenditures can be charged.
Aggregate revenues were within 6 percent of the budget in two of the three-year
assessment period. However, the composition of revenues varied considerably, and
deteriorated to almost 30 percent in the last year assessed.
Transparency of public finances
A prerequisite to transparency of public finances is the classification of budget estimates;
presently, the GAM’s budget classification fails to meet GFS standards in terms of
administrative and functional classification (PI-4). At the same time, though, the budget
documentation is comprehensive and meets four of the basic, and three of the additional
elements according to PEFA standards (PI-5).
Significant effort has been made to ensure inclusion of most donor-financed projects and
programs into GAM's budget estimates and financial reports. At present, at least 95 percent
of all donor-financed projects (both revenues and expenditures) are part of GAM's annual
budget, as well as its actual budget execution reports. A standard procedure exists for third-
party service providers, in that the GAM receives gross service fees and then pays third-
party service providers the agreed service charges. Hence, this eliminates off-budget
financing. The GAM has no extra-budgetary units (PI-6), and there are no sub-national
governments under the GAM. Therefore, PI-7 is not applicable.
The GAM's strategic plans provide an outline of key performance indicators. However,
these plans are not fully costed in terms of initial investment costs and forward-linked
recurrent expenditures. Both these performance targets and actual performance outcomes
are published on the website, and are shared with the 22 council representatives for
dissemination. Both resources received in cash and in kind are properly recorded and
reported in annual financial statements.
Apart from internal monitoring and evaluation performed by GAM officials, independent
external evaluations concerning service delivery are also carried out and the results are
published (PI-8). Public access to GAM's fiscal information is very limited. Apart from public
access to fees, rates and other applicable taxes, as well as information about service
delivery, the public has no access to key fiscal information. This includes, for example,
annual executive budget proposals, annual approved budgets, annual financial statements,
annual audit reports, and in-year budget execution reports (PI-9). Nonetheless, all
procurement tenders are publicly evaluated.
76
Management of assets and liabilities
As GAM has no responsibility for public corporations or sub-national governments, there
are no such fiscal risks. However, although there are no PPP arrangements currently in
place, there soon will be (in the form of the Rapid Transit initiative). However, there are no
relevant policy guidelines or legislation in place. The GAM does not keep track of its
contingent liabilities (PI-10).
There are two broad categories of public investments. The first concerns those arising from
a Royal Initiative, and the second are derived from GAM's own investment strategy.
Whereas all project investments drawn from GAM's strategy (the majority of GAM's capital
investment projects) undergo rigorous economic analysis to determine their socio-
economic viability, those initiated by the Royal family do not. Project selection (with the
exception of Royal Initiatives) is based on approved selection criteria, and also includes
solicitation of public opinion. Whereas initial project costs are fully budgeted for, forward-
linked recurrent expenditures are not, thereby revealing weaknesses in the medium-term
budgeting framework. Independent evaluations of investment projects are conducted and
published (c.f. PI-11).
The GAM’s management of assets —both financial and non-financial — is inconsistent.
Although records of all equity investments are maintained and updated, the information is
not published or included in the annual financial statements. The GAM does not keep a
comprehensive fixed asset (non-financial assets) register, although some fixed assets,
such as vehicles and furniture, are recorded. The legal framework (Suppliers Bylaw)
outlines the asset disposal framework. Nonetheless, the process for asset disposal fails to
comprehensively disclose new owners (PI-12).
The GAM has a large debt portfolio. As of September 2016, it stood at JD 408.3 million,
with a debt servicing cost of JD 107.8 million, representing a weighted average of 26.4
percent of total debt. Again, it has a running overdraft of JD 28.2 million as of October 2016.
The GAM uses a Microsoft Excel spreadsheet to record both domestic and foreign debt.
This is then reconciled and updated at least annually. However, the information is not made
public. The Prime Minister is solely responsible for authorizing GAM's borrowing.
Nonetheless, no medium-term debt management strategy has been prepared.
Policy-based fiscal strategy and budgeting
There is a clear annual budget calendar, which is adhered to, and which allows budgetary
units at least four weeks to complete their detailed estimates, but without ceilings (PI-17).
The requirements of the indicators related to ‘macroeconomic and fiscal forecasting’, ‘fiscal
policy’ and ‘medium-term perspective in expenditure budgeting’ (PIs-14, 15 & 16) are all
rated ‘D’. Until the present time, the GAM has followed the law which requires only an
annual budget process. The annual budget proposal is submitted to the Council in
November, before the beginning of the financial year.
Predictability and control in budget execution
Measures adopted by the GAM regarding the rights and obligations of taxpayers and
citizens are comprehensive, adequate and simple; some of these measures include online
access to tax information, client service desks, distribution of brochures, timely remittance
of tax liabilities and IT-based revenue collection mechanisms. The revenue risk
management framework is satisfactory, and limits the potential of massive revenue
leakages. Nonetheless, revenue audit measures need improvement in terms of the
systematic documentation of compliance improvement plans. Revenue arrears are quite
significant, and represent 40 percent of total own revenues (PI-19).

77
The Department of Revenue Collection (the Treasury) is responsible for recording and
reporting on all revenues collected by the GAM. Each month, a revenue report is prepared
for executive management. It categorizes revenue types and compares the budget against
actual collections. However, there are no explanations for deviations. At least 95 percent
of all revenues collected are banked within 24 hours; exceptions arise when collections are
made during off-banking hours and some holidays. Complete revenue reconciliation is
carried out within four weeks after the end of the preceding month (PI-20).
Treasury management functions are weak. Whereas daily and monthly cash consolidation
statements are prepared, there is no systematic framework for preparing and updating cash
flow forecasts to better manage treasury operations that will ultimately reduce the need to
borrow. In addition, there is no coordination between the procurement, treasury and budget
departments, necessary for effective cash flow management. Significant in-year budget
reallocations are made with no clear rules, thereby negatively affecting project
implementation — as well as the effective implementation of the monthly expenditure
commitment framework (PI-21).
Expenditure arrears constitute between 5 and 11 percent of total expenditure, and have
been declining in both nominal and percentage terms since 2013, that is, 8 percent in
FY2013, 11.2 percent in FY2014, and 5.1 percent in FY2015. The accounts department
generates a statement of expenditure arrears annually, even though the GAM's basis of
accounting is cash. Nonetheless, expenditure arrears are not age-profiled (PI-22).
Payroll controls are satisfactory, with changes to personnel and payroll effected within a
month. However, there is no direct interface between personnel and payroll data. All
updates are manual; these are reconciled monthly and within a month. Manual control
processes resulting in audit trails are in place to guarantee the integrity of personnel and
payroll data. However, no payroll audits have been conducted in the last three years (PI-
23).
The procurement management system only keeps records on contract awards. There is no
framework for preparing and publishing annual procurement plans. Competitive tendering
is the default method of procurement, with at least 90 percent of contracts awarded through
competitive bids.
As stated under PI-9, public access to fiscal information is limited, and this also applies to
procurement. Whereas procurement statistics, laws, and contract awards are made public,
information regarding procurement complaints, procurement plans, and bidding
opportunities are not. While there is a functional administrative procurement complaints
mechanism, it lacks transparency (PI-24).
The internal control environment is satisfactory, and the framework clearly spells out the
segregation of duties among authorized officials. There is work in progress to integrate the
budget with the financial management system through the Oracle system; presently
expenditure commitments are controlled by actual cash available. Although clear rules exist
regarding payment procedures, authorized exceptions do arise — but are not necessarily
justified (PI-25). In general, internal audit functions do not meet international standards.
They lack audit plans with clear objectives. Also, performance is limited with respect to
specialized audits. Nonetheless, management provides a formal response to all audit
queries. It also tracks implementation of recommended actions (PI-26).
Accounting and reporting
Monthly reconciliations of bank accounts are satisfactory and carried out within a week of
the preceding month — although not within the Treasury Single Account framework.
78
Financial data integrity relies heavily on the internal control environment, which is
satisfactory and provides both manual and IT-based audit trails. The reconciliation and
clearing of suspense and advance accounts have been impressive, thereby improving
financial data accuracy (PI-27).
The timeliness of producing in-year financial statements is adequate, and is done within
two weeks after the end of the previous month. These reports are compatible with the
original budget estimates and allow for easy statistical analysis at both the expenditure
commitment and payment stages. However, the extent to which this facility is used is not
clear (PI-28). The annual financials are produced on a simplified cash basis. The GAM also
maintains records of revenue and expenditure arrears (PI-29).
External scrutiny and audit
According to the Municipalities and Audit Bureau Laws, the Audit Bureau has the mandate
to audit GAM’s accounts. However, the Municipalities Law does not set deadlines for
audits, nor does it require the Audit Bureau to submit annual audit reports to the GAM
Council. The Audit Bureau has a resident team at the GAM that performs continuous audits.
The Audit Bureau performs ex-ante audits for 100 percent of GAM’s expenditures, 70
percent of its revenues (mainly building licenses fees), and 15 percent of other revenues.
A withdrawal from the ex-ante audit process started a few years ago, along with the
government strengthening of internal audit in public entities. In the future, it is expected that
the Audit Bureau will withdraw from the ex-ante audit of more entities, including the GAM.
The GAM does not submit annual financial statements to the Audit Bureau for auditing.
However, the Audit Bureau’s annual audit report includes audit findings regarding the GAM,
derived from the continuous audits.
In general, the annual audit report has improved over the last year, becoming more in
compliance with international auditing standards. The Audit Bureau confirms that it
performs a comprehensive audit covering performance audit. Follow-up on audit findings
has improved. However, more effort is needed to improve timeliness. The findings of the
last three annual audit reports (2013-2015) were classified based on criticality, and will be
discussed with the Parliament. The Audit Bureau is not financially and administratively
independent.
Although the GAM Council is the legislative authority, it does not perform any scrutiny of
the Audit Bureau reports. The Parliament reviews the annual audit report of the Audit
Bureau, which has a section on the GAM, and holds public hearings.
4.2 Effectiveness of the Internal Control Framework
The internal control framework components work to establish the foundation for sound
internal controls within the entity through directed leadership, shared values and a culture
that emphasizes accountability for control.
Control Environment
The GAM is mainly governed by the Municipalities Law No. 41 of 2015. It also follows
related national laws and bylaws, such as the Labor Law and the Civil Service Bylaws.
Where relevant, GAM also follows the Financial Control Bylaw No. 11 of 2015.
The GAM is governed by its Board of Directors, and executively reports directly to the
Prime Minister. The GAM is subject to State Audit Bureau auditing, and its heavy ex-
ante control intervention is well evidenced in the revenue and expenditure processes.
79
As a public interest entity, GAM’s performance is closely followed by the public and the
Parliament.
On the executive level, the Mayor of Amman is GAM’s Chief Executive Officer. The
Mayor of Amman, with the Board of Directors being informed, sets the “tone at the top”
or corporate culture. The tone at the top, which is communicated to GAM staff, reveals
the importance of management’s tight control and collective accountability. Due to the
bureaucratic structure and public administration policies, transparency within the GAM
units is not emphasized. The degree of transparency is controlled by managers, with
each in their own capacity. Thus, levels of transparency vary across the GAM units.
In terms of the internal control structure, GAM senior management maintains layers of
controls to ensure proper work conduct, ethical conduct, and integrity of staff
concerning the provision of public services. Directorates, such as the Institutional
Performance Development (which the Internal Audit is positioned under), the Inspector
General, and the Legal Affairs, have been charged by senior management with
overseeing and emphasizing internal control of the GAM. At this time, the GAM is
internally reevaluating the internal control setup. It is reconsidering the directorate
structures along with their respective responsibilities in pursuit of an effective internal
control framework, which will serve and support GAM’s vision and latest strategy.
While commitment to competence is showcased by management in several key staff
positions, the GAM suffers from the large number of staff that were injected annually
by the Civil Service Authority. This was done as part of addressing the high
unemployment rate among the Jordanian workforce. The GAM was also required to
absorb some of these workers. Hence, external hiring became a challenge, and was
then limited to critical positions and expertise. To reduce some pressure and to
overcome these challenges, at least partially, the GAM adopted a strategic staff
rotation approach. The GAM Human Resources (HR) Unit has been working on a
strategy to utilize available human resources more effectively based on its own HR
Bylaw of 2012, as well as through its annual HR policies and procedures.
Risk Assessment
Risk identification in the GAM arises from the pursuit of achieving the entity-wide
objectives, steered by the Board of Directors and executed by senior management.
Similarly, risk identification regarding process levels occurs during application of set
policies and procedures. These are discussed/reported to middle-level management,
and possibly communicated to senior management for assessment as to their
significance.
Responsibilities for risk assessment and management are not clear and not formally
structured. However, they tend to be the focus of management as they pursue
improving GAM’s performance and enhancing its capabilities. Still, the regularity of
such an exercise is unclear.
The observations that GAM receives from the Audit Bureau, Internal Audit, and the
Inspection Directorate also form a feedback to GAM’s risks, as well as its continuous
assessment process.
Control Activities
The GAM has designed and implemented a set of internal controls on different levels,
from decision making to transactional processes. The internal controls are dictated by
the national laws and spelled out in GAM’s policies and procedures. The control
80
activities are implemented in a more bureaucratic form, with a vertical reporting
structure. Controls in place can be either manual or automated.
Through this assessment, and as noted from audit reports, the GAM in general
maintains a sound internal control system. The control setting/ evaluation by
management is primarily based on practice and experience in addressing and
mitigating significant, perceived risks. However, these rarely result from a formal
internal control evaluation regarding the adequacy of the control design and the
effectiveness of its implementation.
Information and Communication
The GAM maintains channels of communication with internal as well as external
parties. Internally, the Board of Directors and the Mayor’s decrees are physically mailed
and communicated to relevant parties. Instructions from the City Manager and middle-
level managers can be in the form of letters or emails.
A management information system is maintained, and the information technology unit
is an integral unit that GAM’s management relies on for managing data. With the Oracle
system, the information across directorates and several units has been either
integrated or processed, or is planned to be automatically integrated. Given the size of
the GAM, this process is being implemented through a multi-year program.
Monitoring
The Board of Directors exercises oversight over high-level objectives, and ensures that
senior management continues to monitor the accomplishment of these objectives on
an ongoing basis. Senior management monitors the performance of middle-
management/staff and outcomes. Extensive vertical reporting provides evidence about
the level of coordination, oversight and accountability in the top-down hierarchy.
Monitoring activities in the form of separate evaluations are assigned to the internal
assurance units. Their results then inform the level and adequacy of monitoring
activities carried out by management.
4.3 PFM Strengths and Weaknesses
Aggregate fiscal discipline
Overall, fiscal discipline in the GAM is reasonable, at least when viewed in the context of
the annual budget process currently in place. However, the lack of multi-year fiscal planning
is an issue in need of attention, particularly in the light of the risks that may arise from the
various public-private partnership arrangements currently in place.
Most elements in the overall PFM system that contribute to achieving short-term fiscal
discipline appear to be sound. For example, the aggregate outturns of both revenue and
expenditure are close to those in the original budget, although there is an issue about the
variance in the composition of revenue (PI-3.2, rated ‘D’). In addition, the stock of payment
arrears is declining (PI-22), and there are few unreported operations (PI-6, rated ‘B’).
Although there are risks to fiscal discipline (beyond the concerns noted about ‘PPPs’), such
as the lack of a debt management strategy (PI-13.3, rated ‘D’) and the absence of
conventional oversight arrangements (PI-29.2, rated ‘D’), it should be noted that these risks
are, to a certain extent, mitigated by the fact that various elements of the system concerned
with budget execution do work well. A number of factors contribute to the achievement of
aggregate fiscal discipline, such as the predictability in the availability of resources, most
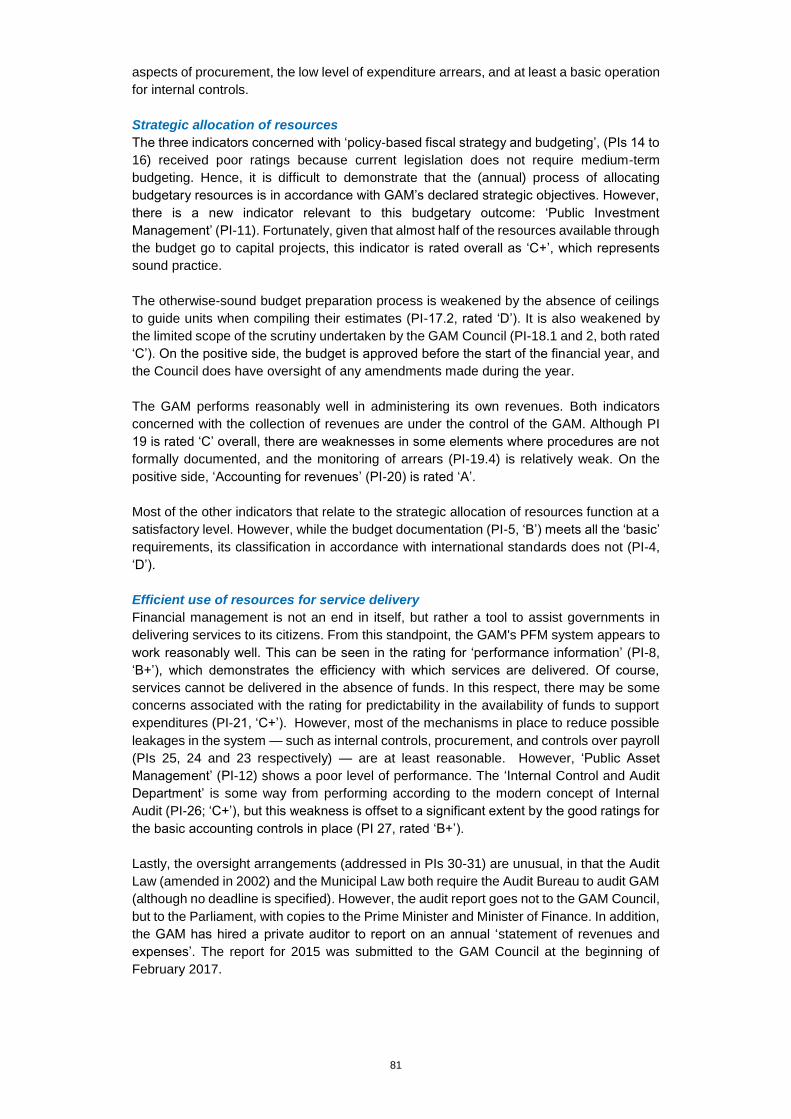
81
aspects of procurement, the low level of expenditure arrears, and at least a basic operation
for internal controls.
Strategic allocation of resources
The three indicators concerned with ‘policy-based fiscal strategy and budgeting’, (PIs 14 to
16) received poor ratings because current legislation does not require medium-term
budgeting. Hence, it is difficult to demonstrate that the (annual) process of allocating
budgetary resources is in accordance with GAM’s declared strategic objectives. However,
there is a new indicator relevant to this budgetary outcome: ‘Public Investment
Management’ (PI-11). Fortunately, given that almost half of the resources available through
the budget go to capital projects, this indicator is rated overall as ‘C+’, which represents
sound practice.
The otherwise-sound budget preparation process is weakened by the absence of ceilings
to guide units when compiling their estimates (PI-17.2, rated ‘D’). It is also weakened by
the limited scope of the scrutiny undertaken by the GAM Council (PI-18.1 and 2, both rated
‘C’). On the positive side, the budget is approved before the start of the financial year, and
the Council does have oversight of any amendments made during the year.
The GAM performs reasonably well in administering its own revenues. Both indicators
concerned with the collection of revenues are under the control of the GAM. Although PI
19 is rated ‘C’ overall, there are weaknesses in some elements where procedures are not
formally documented, and the monitoring of arrears (PI-19.4) is relatively weak. On the
positive side, ‘Accounting for revenues’ (PI-20) is rated ‘A’.
Most of the other indicators that relate to the strategic allocation of resources function at a
satisfactory level. However, while the budget documentation (PI-5, ‘B’) meets all the ‘basic’
requirements, its classification in accordance with international standards does not (PI-4,
‘D’).
Efficient use of resources for service delivery
Financial management is not an end in itself, but rather a tool to assist governments in
delivering services to its citizens. From this standpoint, the GAM's PFM system appears to
work reasonably well. This can be seen in the rating for ‘performance information’ (PI-8,
‘B+’), which demonstrates the efficiency with which services are delivered. Of course,
services cannot be delivered in the absence of funds. In this respect, there may be some
concerns associated with the rating for predictability in the availability of funds to support
expenditures (PI-21, ‘C+’). However, most of the mechanisms in place to reduce possible
leakages in the system — such as internal controls, procurement, and controls over payroll
(PIs 25, 24 and 23 respectively) — are at least reasonable. However, ‘Public Asset
Management’ (PI-12) shows a poor level of performance. The ‘Internal Control and Audit
Department’ is some way from performing according to the modern concept of Internal
Audit (PI-26; ‘C+’), but this weakness is offset to a significant extent by the good ratings for
the basic accounting controls in place (PI 27, rated ‘B+’).
Lastly, the oversight arrangements (addressed in PIs 30-31) are unusual, in that the Audit
Law (amended in 2002) and the Municipal Law both require the Audit Bureau to audit GAM
(although no deadline is specified). However, the audit report goes not to the GAM Council,
but to the Parliament, with copies to the Prime Minister and Minister of Finance. In addition,
the GAM has hired a private auditor to report on an annual ‘statement of revenues and
expenses’. The report for 2015 was submitted to the GAM Council at the beginning of
February 2017.

82
In summary, given the legal restrictions requiring an annual budget process, most aspects
of the GAM’s PFM system function at a satisfactory level, and should allow it to attain its
short-term fiscal and budgetary objectives. However, there remain areas for improvement,
although it must always be borne in mind that any sub-national government can only
operate within the confines of the legal framework established by the national government.
4.4 Performance changes since a previous assessment
This is not applicable because this is the first assessment of the GAM.
83
5 Government Reform Process
PFM reforms are at the heart of the Government of Jordan’s priorities. These reforms
continue to be of great importance in keeping the economy stable at a time of exceptional
difficulty caused by external circumstances. Since 2004, Jordan has been continuously
engaged in improving PFM, both for the direct benefits it brings —and because progress
in this area is a key condition to be met in maintaining the support of development partners.
Within the government, the lead role is taken by the Ministry of Finance (MoF) (including
the General Budget Department, the three tax Departments and the General Supplies
Department. The other Ministries principally concerned are the Ministry of Planning and
International Cooperation (MoPIC), which coordinates public investment planning
(including responsibility for the current program to improve public investment management)
and external assistance, and the Ministry of Public Sector Development (MPSD), which
seeks to rationalize the structure of government and reduce the burden on the rest of the
economy. For its part, the Ministry of Municipal Affairs (MoMA) has been leading the
reforms at the municipal level.
The MoMA has been working in accordance with its reform strategy for 2015-2020, which
consists of six national objectives to: (i) develop the performance of the municipal sector
and enhance its efficiency; (ii) enhance service delivery to local communities; (iii) contribute
to the fight against poverty and employment creation; (iv) contribute toward the
achievement of balanced development among governorates and districts; (v) solve
environmental problems that are within the responsibility of the municipalities and joint
services councils; and (vi) contribute to solving traffic problems in the Kingdom. The
strategy aims at significant municipal improvements being achieved through legislative,
financial, and administrative reforms.
The enactment of the Municipal Law No. 41 of 2015 and the Decentralization Law No. 49
of 2015 are considered two major legislative reforms. These two laws aim to widen public
participation in decision making and to enforce decentralization. The Municipality Law
came to strengthen the municipalities’ independence and widen its functions and
responsibilities. As such, it embodies the principle of decentralization through the
establishment of local councils.
The Decentralization Law came to materialize the national vision to expand the adoption
of democratic elections in accordance with the state approach to increase public
participation in decision making and implementation — especially regarding sustainable
development and the implementation of administrative decentralization. The municipal and
decentralization elections were held for the first time in Jordan on August 15, 2017. They
will put the decentralization principle into practice, with the hope of addressing the real
needs of the people and improving service delivery and living standards in the governorates
and districts.
The fiscal reform included strengthening government support to municipalities by
increasing oil product transfers and other channels of support. For instance, the
government took a decision on August 13, 2017 to distribute JD 100 million to the
municipalities to help them settle much of their debts. In addition, the MoMA is providing
municipalities with vehicles and equipment in cooperation with MoPIC and international
donors.
84
The administrative reform includes legislative amendments to stop random appointments
and assign appointments to the Civil Service Bureau. There are plans for capacity-building
and training programs, as well as the establishment of new structures to implement
decentralization.
At the national level, development partners have contributed, and are continuing to
contribute substantially to these efforts. New programs begun in 2015 by the European
Union (EU) include direct budget support of €40 million over three years, with an additional
€7.5 million for technical assistance. In 2016, the United States Agency for International
Development (USAID) decided to provide US$ 35 million over four years for the third Fiscal
Reform Project.
At the local governmental level, the Municipal Finances Sector Policy Loan (SPL) was
approved by the AFD Board of Directors on October 20th, 2016, in response to a financing
request by the Government of Jordan. The financing agreement was signed on November
30, 2016, and was followed by the December disbursement of the first half of its € 100
million budget support to the Government of Jordan for the strengthening of municipalities.
This budget support is based on meeting specific policy reform triggers at the local
government level, covering the following areas: (i) strengthening the national framework to
improve municipal financial sustainability; (ii) strengthening municipal financial
management systems and capacities; and (iii) strengthening the Cities and Villages
Development Bank (CVDB) contribution to municipal development financing.
The USAID has an ongoing US$ 40 million program for “fiscal reform and public financial
management” covering the period 2016-2020. The program seeks to improve Jordan’s
overall fiscal and macroeconomic stability through: improved revenue performance;
strengthened budgeting and debt management practices; increased accountability and
performance of governmental institutions; and increased participation by the private sector.
Part of the program supports increased capacity for fiscal management at decentralized
levels of government.
The World Bank is supporting PFM reforms at the local government level in the context of
“strengthening municipal financial management systems to sustain service delivery in
municipalities affected by the refugee crisis”. The objective of the project is to strengthen
the institutional and financial systems, as well as the capacities of selected municipalities
in Jordan, to improve local service delivery.
Under the broad objective of helping to improve municipalities’ financial management
capabilities, the project sets out four specific goals to: (i) improve the effectiveness and
impact of municipal spending; (ii) enhance the transparency and accountability of
municipalities vis-à-vis local communities and beneficiaries; (iii) strengthen the
municipalities’ capacity to mobilize their own revenues; and (iv) reduce the debt and
improve the solvency of the municipalities. Although this project focuses on the 20
municipalities in the northern governorates, some of the outputs and lessons learned could
potentially be scaled up to other municipalities — resulting in additional improvements in
the delivery of basic services to a wider number of beneficiaries.
Most power below the central level in Jordan is located within the 12 governorates. These
are deconcentrated units of the central government that receive their funding through the
Ministry of the Interior (MoI). Governors are appointed by the central government and are
responsible to the MoI. They also must report to the MoI. The governorates’ mandates
under the new decentralization law increase their coordination role of the existing Executive
Councils and envisioned elected Governorate Councils. In addition, their planning
authorities for the development in each Governorate would also be increased. Within the

85
new decentralization framework, the role of Governorates in development planning must
be linked to input from and coordination with the municipalities, as they are the centers of
population and economic activity.
In contrast, Jordan’s 100 municipalities are legal and budgetary entities governed by the
Law on Municipalities, which defines them as “a civil institution with financial and
administrative independence.” They are classified into four categories based on population
size. Their affairs are overseen by the MoMA. Municipalities are, for the most part,
institutionally weak, and many responsibilities and financial resources remain vested in
centrally-controlled agencies. Yet, municipalities remain responsible for a variety of
services that affect the daily lives of ordinary citizens.
Despite multiple constraints, the Municipal Councils and Mayors currently remain the only
elected and accountable officials below the national parliament to whom citizens have
access. An estimated 83 percent of Jordan’s 9.5 million people are urban residents, and a
majority of them live below the poverty line. The municipalities remain the most visible
element of public administration for most citizens. However weakly, they represent the
State’s capacity for and commitment to service delivery.
There are numerous difficulties in achieving rapid change, including the persistence of very
cumbersome financial control arrangements applicable to all payments by government
bodies, including municipalities. Another example is the approach to audit taken by the
Audit Bureau, which is largely based on compliance testing of individual transactions.
Fortunately, there is now movement in both areas, although there is still a considerable
distance between Jordan’s adopted financial control and audit arrangements and
international best practices. There is also a need to revise the Audit Bureau Law to improve
its financial and administrative independence, as well as its immunity vis-a-vis
the President.
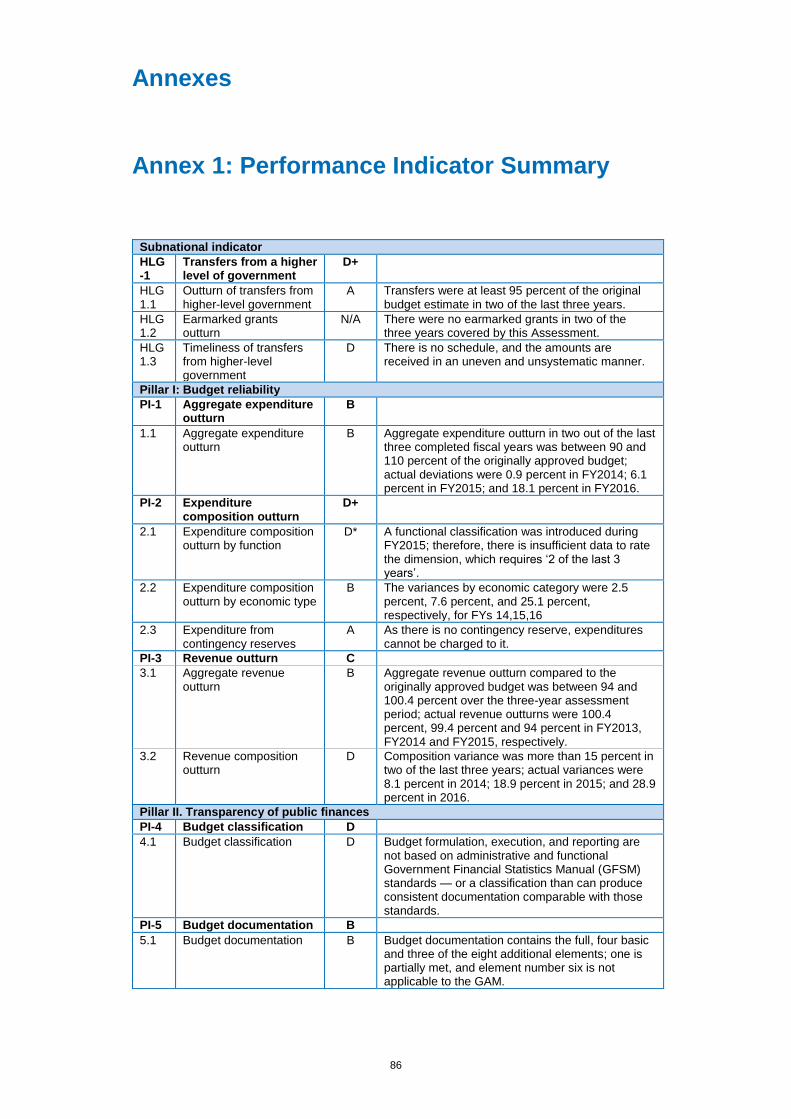
86
Annexes
Annex 1: Performance Indicator Summary
Subnational indicator
HLG-1
Transfers from a higher level of government
D+
HLG 1.1
Outturn of transfers from higher-level government
A Transfers were at least 95 percent of the original budget estimate in two of the last three years.
HLG 1.2
Earmarked grants outturn
N/A There were no earmarked grants in two of the three years covered by this Assessment.
HLG 1.3
Timeliness of transfers from higher-level government
D There is no schedule, and the amounts are received in an uneven and unsystematic manner.
Pillar I: Budget reliability
PI-1 Aggregate expenditure outturn
B
1.1 Aggregate expenditure outturn
B Aggregate expenditure outturn in two out of the last three completed fiscal years was between 90 and 110 percent of the originally approved budget; actual deviations were 0.9 percent in FY2014; 6.1 percent in FY2015; and 18.1 percent in FY2016.
PI-2 Expenditure composition outturn
D+
2.1 Expenditure composition outturn by function
D* A functional classification was introduced during FY2015; therefore, there is insufficient data to rate the dimension, which requires ‘2 of the last 3 years’.
2.2 Expenditure composition outturn by economic type
B The variances by economic category were 2.5 percent, 7.6 percent, and 25.1 percent, respectively, for FYs 14,15,16
2.3 Expenditure from contingency reserves
A As there is no contingency reserve, expenditures cannot be charged to it.
PI-3 Revenue outturn C
3.1 Aggregate revenue outturn
B Aggregate revenue outturn compared to the originally approved budget was between 94 and 100.4 percent over the three-year assessment period; actual revenue outturns were 100.4 percent, 99.4 percent and 94 percent in FY2013, FY2014 and FY2015, respectively.
3.2 Revenue composition outturn
D Composition variance was more than 15 percent in two of the last three years; actual variances were 8.1 percent in 2014; 18.9 percent in 2015; and 28.9 percent in 2016.
Pillar II. Transparency of public finances
PI-4 Budget classification D
4.1 Budget classification D Budget formulation, execution, and reporting are not based on administrative and functional Government Financial Statistics Manual (GFSM) standards — or a classification than can produce consistent documentation comparable with those standards.
PI-5 Budget documentation B
5.1 Budget documentation B Budget documentation contains the full, four basic and three of the eight additional elements; one is partially met, and element number six is not applicable to the GAM.
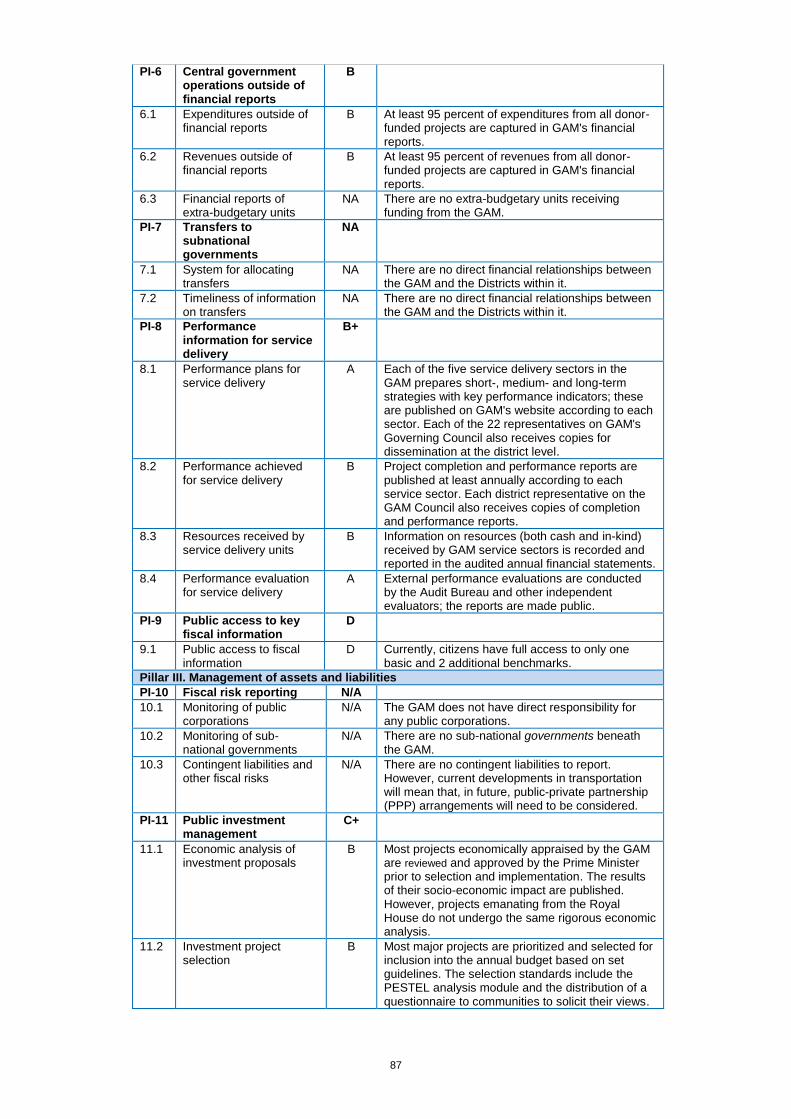
87
PI-6 Central government operations outside of financial reports
B
6.1 Expenditures outside of financial reports
B At least 95 percent of expenditures from all donor-funded projects are captured in GAM's financial reports.
6.2 Revenues outside of financial reports
B At least 95 percent of revenues from all donor-funded projects are captured in GAM's financial reports.
6.3 Financial reports of extra-budgetary units
NA There are no extra-budgetary units receiving funding from the GAM.
PI-7 Transfers to subnational governments
NA
7.1 System for allocating transfers
NA There are no direct financial relationships between the GAM and the Districts within it.
7.2 Timeliness of information on transfers
NA There are no direct financial relationships between the GAM and the Districts within it.
PI-8 Performance information for service delivery
B+
8.1 Performance plans for service delivery
A Each of the five service delivery sectors in the GAM prepares short-, medium- and long-term strategies with key performance indicators; these are published on GAM's website according to each sector. Each of the 22 representatives on GAM's Governing Council also receives copies for dissemination at the district level.
8.2 Performance achieved for service delivery
B Project completion and performance reports are published at least annually according to each service sector. Each district representative on the GAM Council also receives copies of completion and performance reports.
8.3 Resources received by service delivery units
B Information on resources (both cash and in-kind) received by GAM service sectors is recorded and reported in the audited annual financial statements.
8.4 Performance evaluation for service delivery
A External performance evaluations are conducted by the Audit Bureau and other independent evaluators; the reports are made public.
PI-9 Public access to key fiscal information
D
9.1 Public access to fiscal information
D Currently, citizens have full access to only one basic and 2 additional benchmarks.
Pillar III. Management of assets and liabilities
PI-10 Fiscal risk reporting N/A
10.1 Monitoring of public corporations
N/A The GAM does not have direct responsibility for any public corporations.
10.2 Monitoring of sub-national governments
N/A There are no sub-national governments beneath the GAM.
10.3 Contingent liabilities and other fiscal risks
N/A There are no contingent liabilities to report. However, current developments in transportation will mean that, in future, public-private partnership (PPP) arrangements will need to be considered.
PI-11 Public investment management
C+
11.1 Economic analysis of investment proposals
B Most projects economically appraised by the GAM are reviewed and approved by the Prime Minister prior to selection and implementation. The results of their socio-economic impact are published. However, projects emanating from the Royal House do not undergo the same rigorous economic analysis.
11.2 Investment project selection
B Most major projects are prioritized and selected for inclusion into the annual budget based on set guidelines. The selection standards include the PESTEL analysis module and the distribution of a questionnaire to communities to solicit their views.
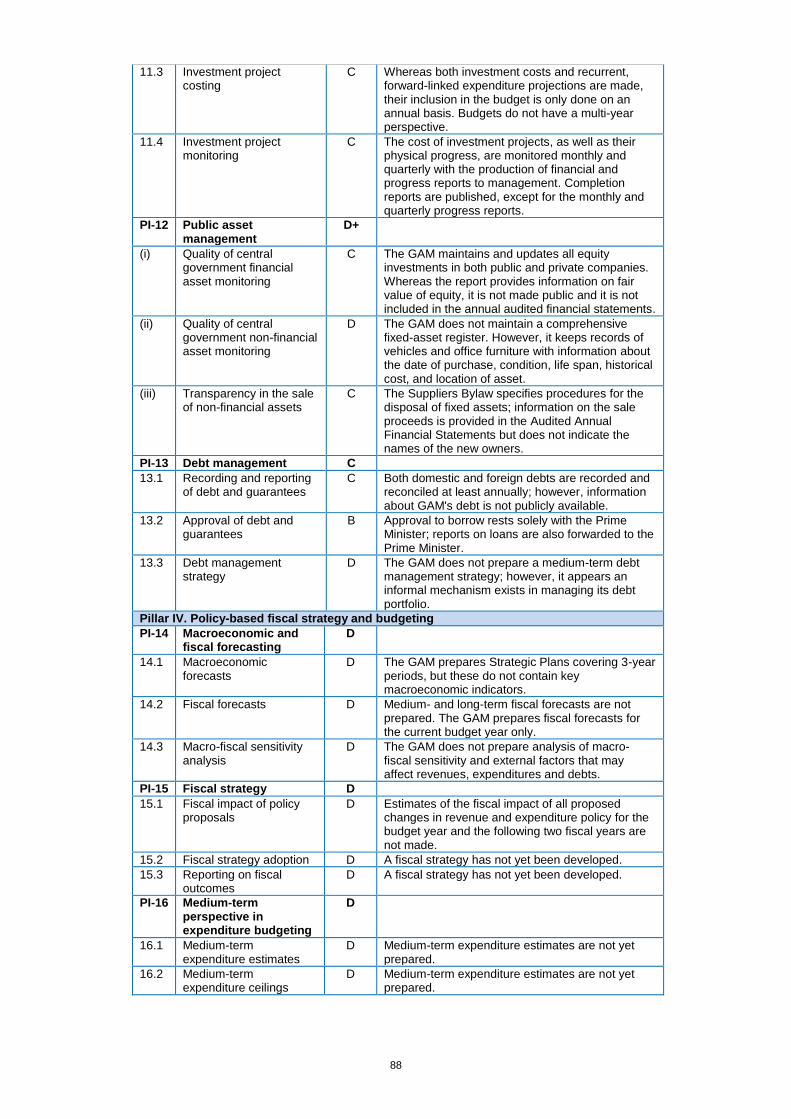
88
11.3 Investment project costing
C Whereas both investment costs and recurrent, forward-linked expenditure projections are made, their inclusion in the budget is only done on an annual basis. Budgets do not have a multi-year perspective.
11.4 Investment project monitoring
C The cost of investment projects, as well as their physical progress, are monitored monthly and quarterly with the production of financial and progress reports to management. Completion reports are published, except for the monthly and quarterly progress reports.
PI-12 Public asset management
D+
(i) Quality of central government financial asset monitoring
C The GAM maintains and updates all equity investments in both public and private companies. Whereas the report provides information on fair value of equity, it is not made public and it is not included in the annual audited financial statements.
(ii) Quality of central government non-financial asset monitoring
D The GAM does not maintain a comprehensive fixed-asset register. However, it keeps records of vehicles and office furniture with information about the date of purchase, condition, life span, historical cost, and location of asset.
(iii) Transparency in the sale of non-financial assets
C The Suppliers Bylaw specifies procedures for the disposal of fixed assets; information on the sale proceeds is provided in the Audited Annual Financial Statements but does not indicate the names of the new owners.
PI-13 Debt management C
13.1 Recording and reporting of debt and guarantees
C Both domestic and foreign debts are recorded and reconciled at least annually; however, information about GAM's debt is not publicly available.
13.2 Approval of debt and guarantees
B Approval to borrow rests solely with the Prime Minister; reports on loans are also forwarded to the Prime Minister.
13.3 Debt management strategy
D The GAM does not prepare a medium-term debt management strategy; however, it appears an informal mechanism exists in managing its debt portfolio.
Pillar IV. Policy-based fiscal strategy and budgeting
PI-14 Macroeconomic and fiscal forecasting
D
14.1 Macroeconomic forecasts
D The GAM prepares Strategic Plans covering 3-year periods, but these do not contain key macroeconomic indicators.
14.2 Fiscal forecasts D Medium- and long-term fiscal forecasts are not prepared. The GAM prepares fiscal forecasts for the current budget year only.
14.3 Macro-fiscal sensitivity analysis
D The GAM does not prepare analysis of macro-fiscal sensitivity and external factors that may affect revenues, expenditures and debts.
PI-15 Fiscal strategy D
15.1 Fiscal impact of policy proposals
D Estimates of the fiscal impact of all proposed changes in revenue and expenditure policy for the budget year and the following two fiscal years are not made.
15.2 Fiscal strategy adoption D A fiscal strategy has not yet been developed.
15.3 Reporting on fiscal outcomes
D A fiscal strategy has not yet been developed.
PI-16 Medium-term perspective in expenditure budgeting
D
16.1 Medium-term expenditure estimates
D Medium-term expenditure estimates are not yet prepared.
16.2 Medium-term expenditure ceilings
D Medium-term expenditure estimates are not yet prepared.
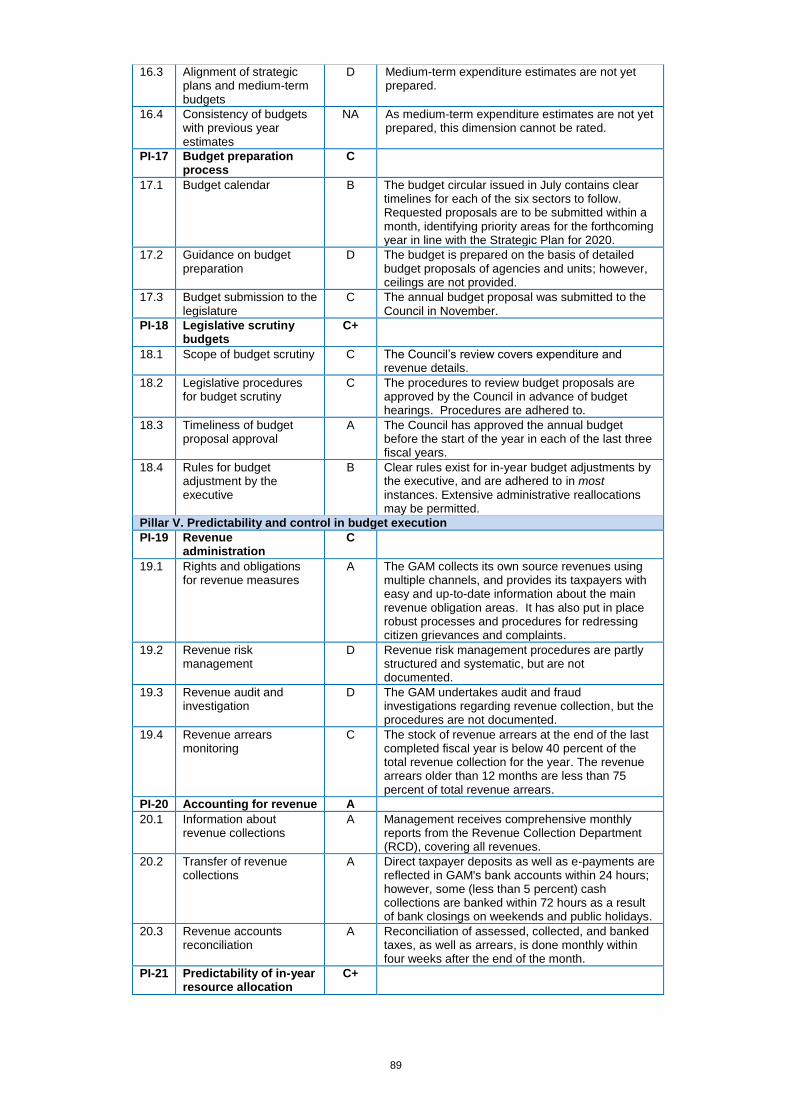
89
16.3 Alignment of strategic plans and medium-term budgets
D Medium-term expenditure estimates are not yet prepared.
16.4 Consistency of budgets with previous year estimates
NA As medium-term expenditure estimates are not yet prepared, this dimension cannot be rated.
PI-17 Budget preparation process
C
17.1 Budget calendar B The budget circular issued in July contains clear timelines for each of the six sectors to follow. Requested proposals are to be submitted within a month, identifying priority areas for the forthcoming year in line with the Strategic Plan for 2020.
17.2 Guidance on budget preparation
D The budget is prepared on the basis of detailed budget proposals of agencies and units; however, ceilings are not provided.
17.3 Budget submission to the legislature
C The annual budget proposal was submitted to the Council in November.
PI-18 Legislative scrutiny budgets
C+
18.1 Scope of budget scrutiny C The Council’s review covers expenditure and revenue details.
18.2 Legislative procedures for budget scrutiny
C The procedures to review budget proposals are approved by the Council in advance of budget hearings. Procedures are adhered to.
18.3 Timeliness of budget proposal approval
A The Council has approved the annual budget before the start of the year in each of the last three fiscal years.
18.4 Rules for budget adjustment by the executive
B Clear rules exist for in-year budget adjustments by the executive, and are adhered to in most instances. Extensive administrative reallocations may be permitted.
Pillar V. Predictability and control in budget execution
PI-19 Revenue administration
C
19.1 Rights and obligations for revenue measures
A The GAM collects its own source revenues using multiple channels, and provides its taxpayers with easy and up-to-date information about the main revenue obligation areas. It has also put in place robust processes and procedures for redressing citizen grievances and complaints.
19.2 Revenue risk management
D Revenue risk management procedures are partly structured and systematic, but are not documented.
19.3 Revenue audit and investigation
D The GAM undertakes audit and fraud investigations regarding revenue collection, but the procedures are not documented.
19.4 Revenue arrears monitoring
C The stock of revenue arrears at the end of the last completed fiscal year is below 40 percent of the total revenue collection for the year. The revenue arrears older than 12 months are less than 75 percent of total revenue arrears.
PI-20 Accounting for revenue A
20.1 Information about revenue collections
A Management receives comprehensive monthly reports from the Revenue Collection Department (RCD), covering all revenues.
20.2 Transfer of revenue collections
A Direct taxpayer deposits as well as e-payments are reflected in GAM's bank accounts within 24 hours; however, some (less than 5 percent) cash collections are banked within 72 hours as a result of bank closings on weekends and public holidays.
20.3 Revenue accounts reconciliation
A Reconciliation of assessed, collected, and banked taxes, as well as arrears, is done monthly within four weeks after the end of the month.
PI-21 Predictability of in-year resource allocation
C+
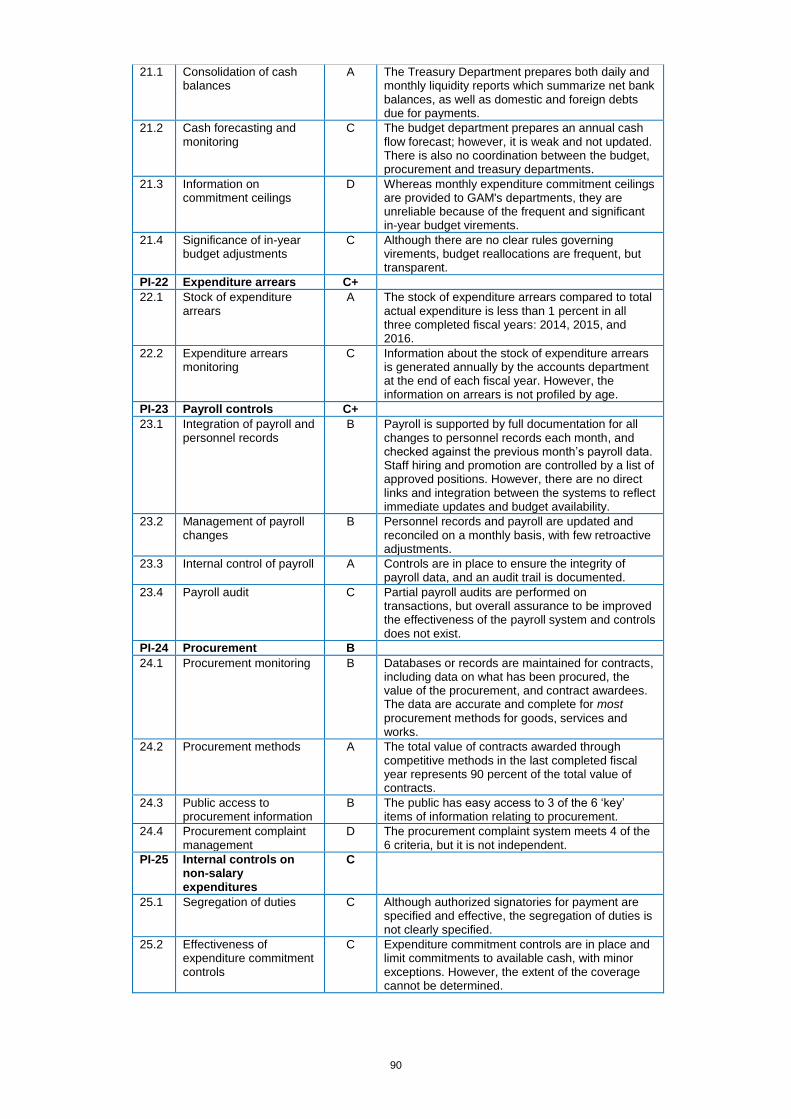
90
21.1 Consolidation of cash balances
A The Treasury Department prepares both daily and monthly liquidity reports which summarize net bank balances, as well as domestic and foreign debts due for payments.
21.2 Cash forecasting and monitoring
C The budget department prepares an annual cash flow forecast; however, it is weak and not updated. There is also no coordination between the budget, procurement and treasury departments.
21.3 Information on commitment ceilings
D Whereas monthly expenditure commitment ceilings are provided to GAM's departments, they are unreliable because of the frequent and significant in-year budget virements.
21.4 Significance of in-year budget adjustments
C Although there are no clear rules governing virements, budget reallocations are frequent, but transparent.
PI-22 Expenditure arrears C+
22.1 Stock of expenditure arrears
A The stock of expenditure arrears compared to total actual expenditure is less than 1 percent in all three completed fiscal years: 2014, 2015, and 2016.
22.2 Expenditure arrears monitoring
C Information about the stock of expenditure arrears is generated annually by the accounts department at the end of each fiscal year. However, the information on arrears is not profiled by age.
PI-23 Payroll controls C+
23.1 Integration of payroll and personnel records
B Payroll is supported by full documentation for all changes to personnel records each month, and checked against the previous month’s payroll data. Staff hiring and promotion are controlled by a list of approved positions. However, there are no direct links and integration between the systems to reflect immediate updates and budget availability.
23.2 Management of payroll changes
B Personnel records and payroll are updated and reconciled on a monthly basis, with few retroactive adjustments.
23.3 Internal control of payroll A Controls are in place to ensure the integrity of payroll data, and an audit trail is documented.
23.4 Payroll audit C Partial payroll audits are performed on transactions, but overall assurance to be improved the effectiveness of the payroll system and controls does not exist.
PI-24 Procurement B
24.1 Procurement monitoring B Databases or records are maintained for contracts, including data on what has been procured, the value of the procurement, and contract awardees. The data are accurate and complete for most
procurement methods for goods, services and works.
24.2 Procurement methods A The total value of contracts awarded through competitive methods in the last completed fiscal year represents 90 percent of the total value of contracts.
24.3 Public access to procurement information
B The public has easy access to 3 of the 6 ‘key’ items of information relating to procurement.
24.4 Procurement complaint management
D The procurement complaint system meets 4 of the 6 criteria, but it is not independent.
PI-25 Internal controls on non-salary expenditures
C
25.1 Segregation of duties C Although authorized signatories for payment are specified and effective, the segregation of duties is not clearly specified.
25.2 Effectiveness of expenditure commitment controls
C Expenditure commitment controls are in place and limit commitments to available cash, with minor exceptions. However, the extent of the coverage cannot be determined.
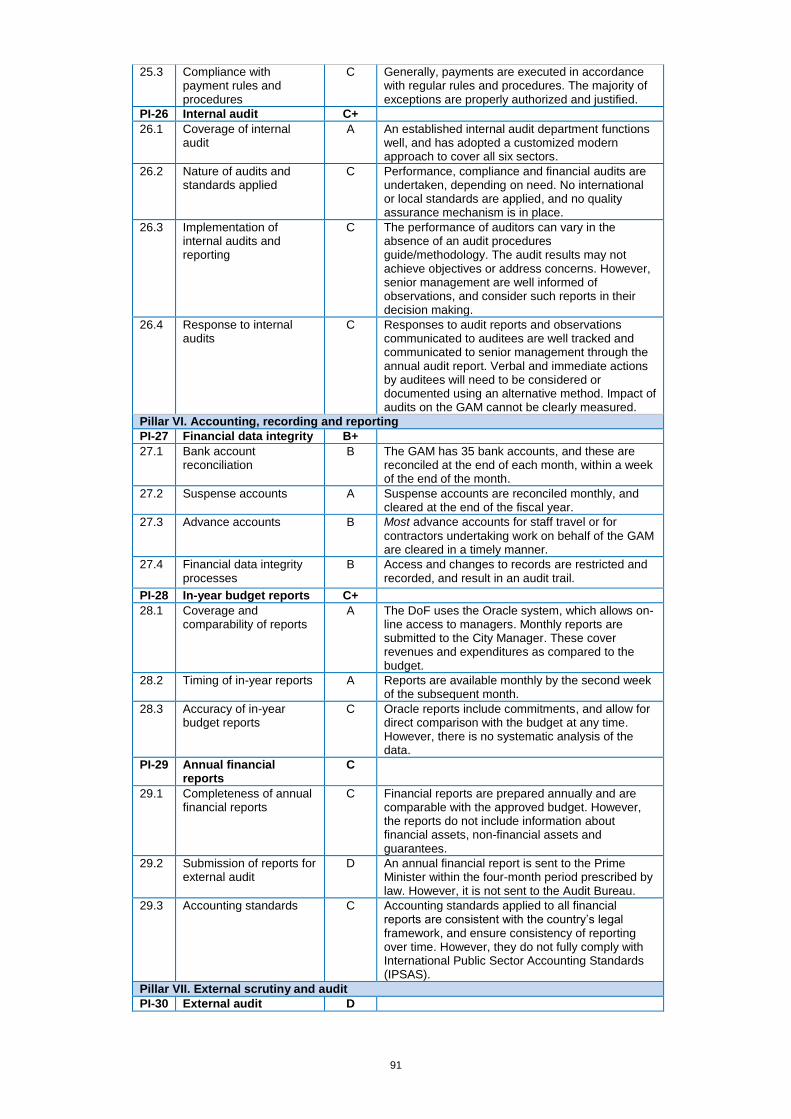
91
25.3 Compliance with payment rules and procedures
C Generally, payments are executed in accordance with regular rules and procedures. The majority of exceptions are properly authorized and justified.
PI-26 Internal audit C+
26.1 Coverage of internal audit
A An established internal audit department functions well, and has adopted a customized modern approach to cover all six sectors.
26.2 Nature of audits and standards applied
C Performance, compliance and financial audits are undertaken, depending on need. No international or local standards are applied, and no quality assurance mechanism is in place.
26.3 Implementation of internal audits and reporting
C The performance of auditors can vary in the absence of an audit procedures guide/methodology. The audit results may not achieve objectives or address concerns. However, senior management are well informed of observations, and consider such reports in their decision making.
26.4 Response to internal audits
C Responses to audit reports and observations communicated to auditees are well tracked and communicated to senior management through the annual audit report. Verbal and immediate actions by auditees will need to be considered or documented using an alternative method. Impact of audits on the GAM cannot be clearly measured.
Pillar VI. Accounting, recording and reporting
PI-27 Financial data integrity B+
27.1 Bank account reconciliation
B The GAM has 35 bank accounts, and these are reconciled at the end of each month, within a week of the end of the month.
27.2 Suspense accounts A Suspense accounts are reconciled monthly, and cleared at the end of the fiscal year.
27.3 Advance accounts B Most advance accounts for staff travel or for
contractors undertaking work on behalf of the GAM are cleared in a timely manner.
27.4 Financial data integrity processes
B Access and changes to records are restricted and recorded, and result in an audit trail.
PI-28 In-year budget reports C+
28.1 Coverage and comparability of reports
A The DoF uses the Oracle system, which allows on-line access to managers. Monthly reports are submitted to the City Manager. These cover revenues and expenditures as compared to the budget.
28.2 Timing of in-year reports A Reports are available monthly by the second week of the subsequent month.
28.3 Accuracy of in-year budget reports
C Oracle reports include commitments, and allow for direct comparison with the budget at any time. However, there is no systematic analysis of the data.
PI-29 Annual financial reports
C
29.1 Completeness of annual financial reports
C Financial reports are prepared annually and are comparable with the approved budget. However, the reports do not include information about financial assets, non-financial assets and guarantees.
29.2 Submission of reports for external audit
D An annual financial report is sent to the Prime Minister within the four-month period prescribed by law. However, it is not sent to the Audit Bureau.
29.3 Accounting standards C Accounting standards applied to all financial reports are consistent with the country’s legal framework, and ensure consistency of reporting over time. However, they do not fully comply with International Public Sector Accounting Standards (IPSAS).
Pillar VII. External scrutiny and audit
PI-30 External audit D
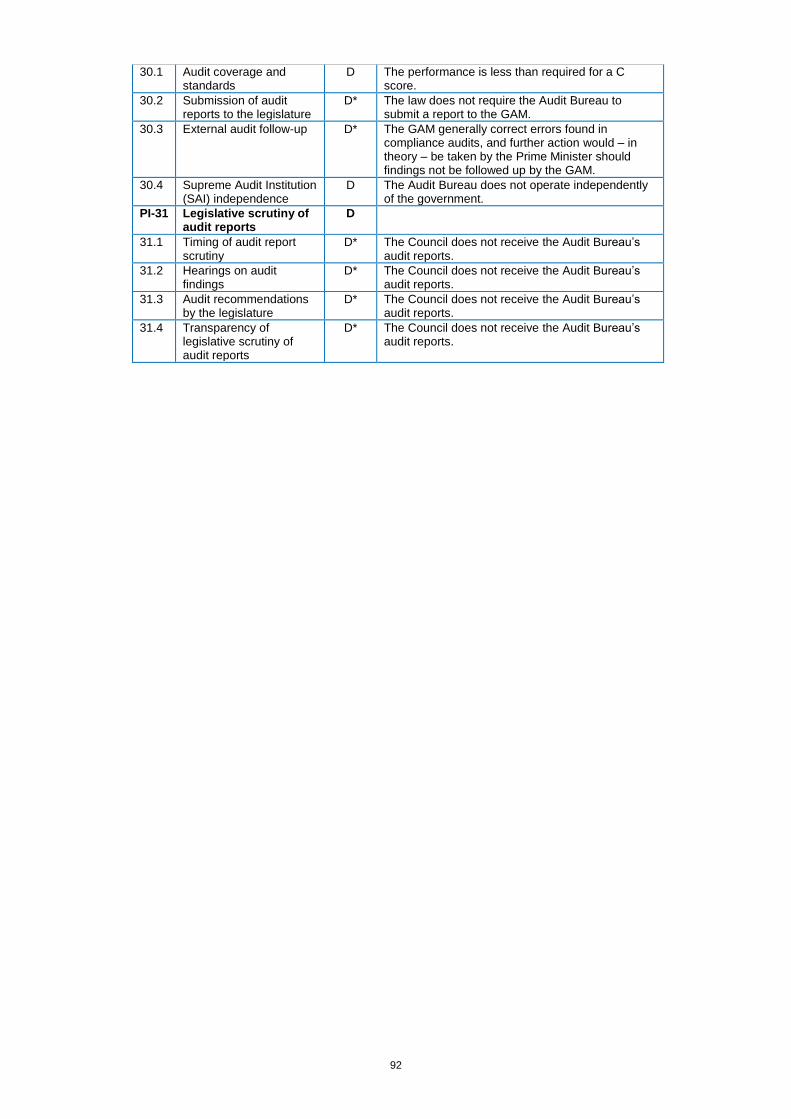
92
30.1 Audit coverage and standards
D The performance is less than required for a C score.
30.2 Submission of audit reports to the legislature
D* The law does not require the Audit Bureau to submit a report to the GAM.
30.3 External audit follow-up D* The GAM generally correct errors found in compliance audits, and further action would – in theory – be taken by the Prime Minister should findings not be followed up by the GAM.
30.4 Supreme Audit Institution (SAI) independence
D The Audit Bureau does not operate independently of the government.
PI-31 Legislative scrutiny of audit reports
D
31.1 Timing of audit report scrutiny
D* The Council does not receive the Audit Bureau’s audit reports.
31.2 Hearings on audit findings
D* The Council does not receive the Audit Bureau’s audit reports.
31.3 Audit recommendations by the legislature
D* The Council does not receive the Audit Bureau’s audit reports.
31.4 Transparency of legislative scrutiny of audit reports
D* The Council does not receive the Audit Bureau’s audit reports.
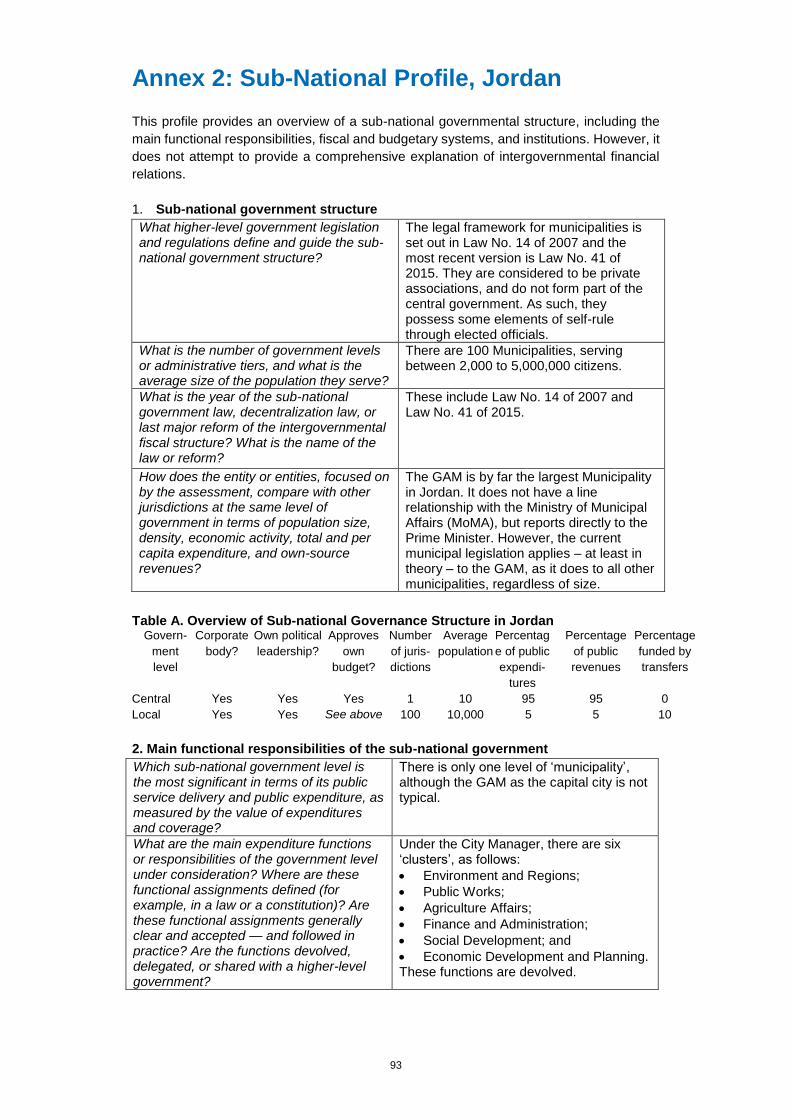
93
Annex 2: Sub-National Profile, Jordan
This profile provides an overview of a sub-national governmental structure, including the
main functional responsibilities, fiscal and budgetary systems, and institutions. However, it
does not attempt to provide a comprehensive explanation of intergovernmental financial
relations.
1. Sub-national government structure
What higher-level government legislation and regulations define and guide the sub-national government structure?
The legal framework for municipalities is set out in Law No. 14 of 2007 and the most recent version is Law No. 41 of 2015. They are considered to be private associations, and do not form part of the central government. As such, they possess some elements of self-rule through elected officials.
What is the number of government levels or administrative tiers, and what is the average size of the population they serve?
There are 100 Municipalities, serving between 2,000 to 5,000,000 citizens.
What is the year of the sub-national government law, decentralization law, or last major reform of the intergovernmental fiscal structure? What is the name of the law or reform?
These include Law No. 14 of 2007 and Law No. 41 of 2015.
How does the entity or entities, focused on by the assessment, compare with other jurisdictions at the same level of government in terms of population size, density, economic activity, total and per capita expenditure, and own-source revenues?
The GAM is by far the largest Municipality in Jordan. It does not have a line relationship with the Ministry of Municipal Affairs (MoMA), but reports directly to the Prime Minister. However, the current municipal legislation applies – at least in theory – to the GAM, as it does to all other municipalities, regardless of size.
Table A. Overview of Sub-national Governance Structure in Jordan
Govern-
ment
level
Corporate
body?
Own political
leadership?
Approves
own
budget?
Number
of juris-
dictions
Average
population
Percentag
e of public
expendi-
tures
Percentage
of public
revenues
Percentage
funded by
transfers
Central Yes Yes Yes 1 10 95 95 0
Local Yes Yes See above 100 10,000 5 5 10
2. Main functional responsibilities of the sub-national government
Which sub-national government level is the most significant in terms of its public service delivery and public expenditure, as measured by the value of expenditures and coverage?
There is only one level of ‘municipality’, although the GAM as the capital city is not typical.
What are the main expenditure functions or responsibilities of the government level under consideration? Where are these functional assignments defined (for example, in a law or a constitution)? Are these functional assignments generally clear and accepted — and followed in practice? Are the functions devolved, delegated, or shared with a higher-level government?
Under the City Manager, there are six ‘clusters’, as follows:
• Environment and Regions;
• Public Works;
• Agriculture Affairs;
• Finance and Administration;
• Social Development; and
• Economic Development and Planning. These functions are devolved.
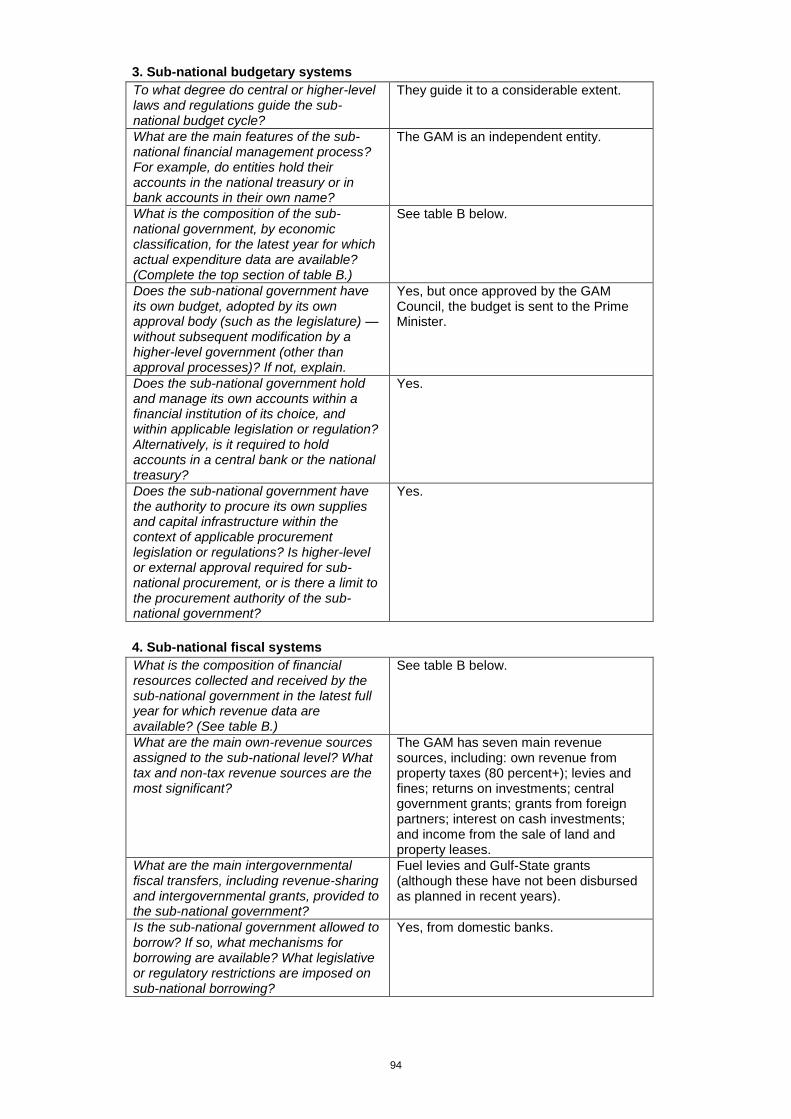
94
3. Sub-national budgetary systems
To what degree do central or higher-level laws and regulations guide the sub-national budget cycle?
They guide it to a considerable extent.
What are the main features of the sub-national financial management process? For example, do entities hold their accounts in the national treasury or in bank accounts in their own name?
The GAM is an independent entity.
What is the composition of the sub-national government, by economic classification, for the latest year for which actual expenditure data are available? (Complete the top section of table B.)
See table B below.
Does the sub-national government have its own budget, adopted by its own approval body (such as the legislature) — without subsequent modification by a higher-level government (other than approval processes)? If not, explain.
Yes, but once approved by the GAM Council, the budget is sent to the Prime Minister.
Does the sub-national government hold and manage its own accounts within a financial institution of its choice, and within applicable legislation or regulation? Alternatively, is it required to hold accounts in a central bank or the national treasury?
Yes.
Does the sub-national government have the authority to procure its own supplies and capital infrastructure within the context of applicable procurement legislation or regulations? Is higher-level or external approval required for sub-national procurement, or is there a limit to the procurement authority of the sub-national government?
Yes.
4. Sub-national fiscal systems
What is the composition of financial resources collected and received by the sub-national government in the latest full year for which revenue data are available? (See table B.)
See table B below.
What are the main own-revenue sources assigned to the sub-national level? What tax and non-tax revenue sources are the most significant?
The GAM has seven main revenue sources, including: own revenue from property taxes (80 percent+); levies and fines; returns on investments; central government grants; grants from foreign partners; interest on cash investments; and income from the sale of land and property leases.
What are the main intergovernmental fiscal transfers, including revenue-sharing and intergovernmental grants, provided to the sub-national government?
Fuel levies and Gulf-State grants (although these have not been disbursed as planned in recent years).
Is the sub-national government allowed to borrow? If so, what mechanisms for borrowing are available? What legislative or regulatory restrictions are imposed on sub-national borrowing?
Yes, from domestic banks.
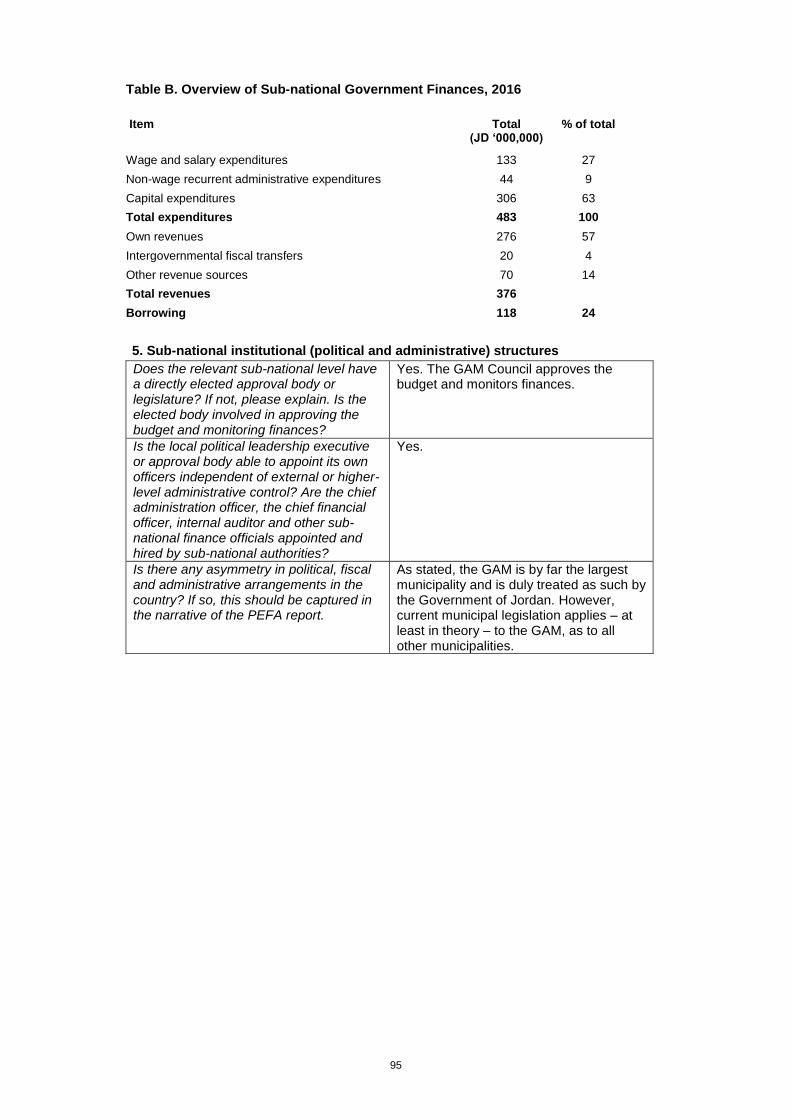
95
Table B. Overview of Sub-national Government Finances, 2016
Item Total (JD ‘000,000)
% of total
Wage and salary expenditures 133 27
Non-wage recurrent administrative expenditures 44 9
Capital expenditures 306 63
Total expenditures 483 100
Own revenues 276 57
Intergovernmental fiscal transfers 20 4
Other revenue sources 70 14
Total revenues 376
Borrowing 118 24
5. Sub-national institutional (political and administrative) structures
Does the relevant sub-national level have a directly elected approval body or legislature? If not, please explain. Is the elected body involved in approving the budget and monitoring finances?
Yes. The GAM Council approves the budget and monitors finances.
Is the local political leadership executive or approval body able to appoint its own officers independent of external or higher-level administrative control? Are the chief administration officer, the chief financial officer, internal auditor and other sub-national finance officials appointed and hired by sub-national authorities?
Yes.
Is there any asymmetry in political, fiscal and administrative arrangements in the country? If so, this should be captured in the narrative of the PEFA report.
As stated, the GAM is by far the largest municipality and is duly treated as such by the Government of Jordan. However, current municipal legislation applies – at least in theory – to the GAM, as to all other municipalities.
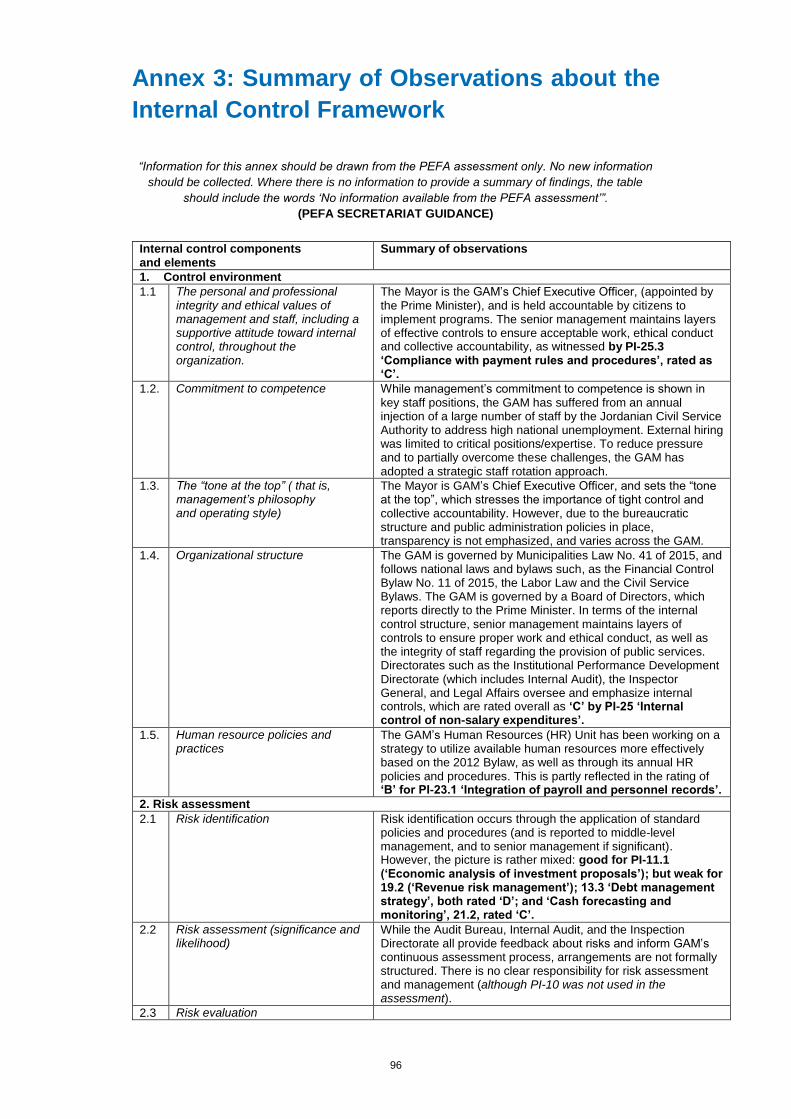
96
Annex 3: Summary of Observations about the
Internal Control Framework
“Information for this annex should be drawn from the PEFA assessment only. No new information
should be collected. Where there is no information to provide a summary of findings, the table
should include the words ‘No information available from the PEFA assessment’”.
(PEFA SECRETARIAT GUIDANCE)
Internal control components and elements
Summary of observations
1. Control environment
1.1 The personal and professional integrity and ethical values of management and staff, including a supportive attitude toward internal control, throughout the organization.
The Mayor is the GAM’s Chief Executive Officer, (appointed by the Prime Minister), and is held accountable by citizens to implement programs. The senior management maintains layers of effective controls to ensure acceptable work, ethical conduct and collective accountability, as witnessed by PI-25.3 ‘Compliance with payment rules and procedures’, rated as ‘C’.
1.2. Commitment to competence While management’s commitment to competence is shown in key staff positions, the GAM has suffered from an annual injection of a large number of staff by the Jordanian Civil Service Authority to address high national unemployment. External hiring was limited to critical positions/expertise. To reduce pressure and to partially overcome these challenges, the GAM has adopted a strategic staff rotation approach.
1.3. The “tone at the top” ( that is, management’s philosophy and operating style)
The Mayor is GAM’s Chief Executive Officer, and sets the “tone at the top”, which stresses the importance of tight control and collective accountability. However, due to the bureaucratic structure and public administration policies in place, transparency is not emphasized, and varies across the GAM.
1.4. Organizational structure The GAM is governed by Municipalities Law No. 41 of 2015, and follows national laws and bylaws such, as the Financial Control Bylaw No. 11 of 2015, the Labor Law and the Civil Service Bylaws. The GAM is governed by a Board of Directors, which reports directly to the Prime Minister. In terms of the internal control structure, senior management maintains layers of controls to ensure proper work and ethical conduct, as well as the integrity of staff regarding the provision of public services. Directorates such as the Institutional Performance Development Directorate (which includes Internal Audit), the Inspector General, and Legal Affairs oversee and emphasize internal controls, which are rated overall as ‘C’ by PI-25 ‘Internal control of non-salary expenditures’.
1.5. Human resource policies and practices
The GAM’s Human Resources (HR) Unit has been working on a strategy to utilize available human resources more effectively based on the 2012 Bylaw, as well as through its annual HR policies and procedures. This is partly reflected in the rating of ‘B’ for PI-23.1 ‘Integration of payroll and personnel records’.
2. Risk assessment
2.1 Risk identification Risk identification occurs through the application of standard policies and procedures (and is reported to middle-level management, and to senior management if significant). However, the picture is rather mixed: good for PI-11.1 (‘Economic analysis of investment proposals’); but weak for 19.2 (‘Revenue risk management’); 13.3 ‘Debt management strategy’, both rated ‘D’; and ‘Cash forecasting and monitoring’, 21.2, rated ‘C’.
2.2 Risk assessment (significance and likelihood)
While the Audit Bureau, Internal Audit, and the Inspection Directorate all provide feedback about risks and inform GAM’s continuous assessment process, arrangements are not formally structured. There is no clear responsibility for risk assessment and management (although PI-10 was not used in the assessment).
2.3 Risk evaluation
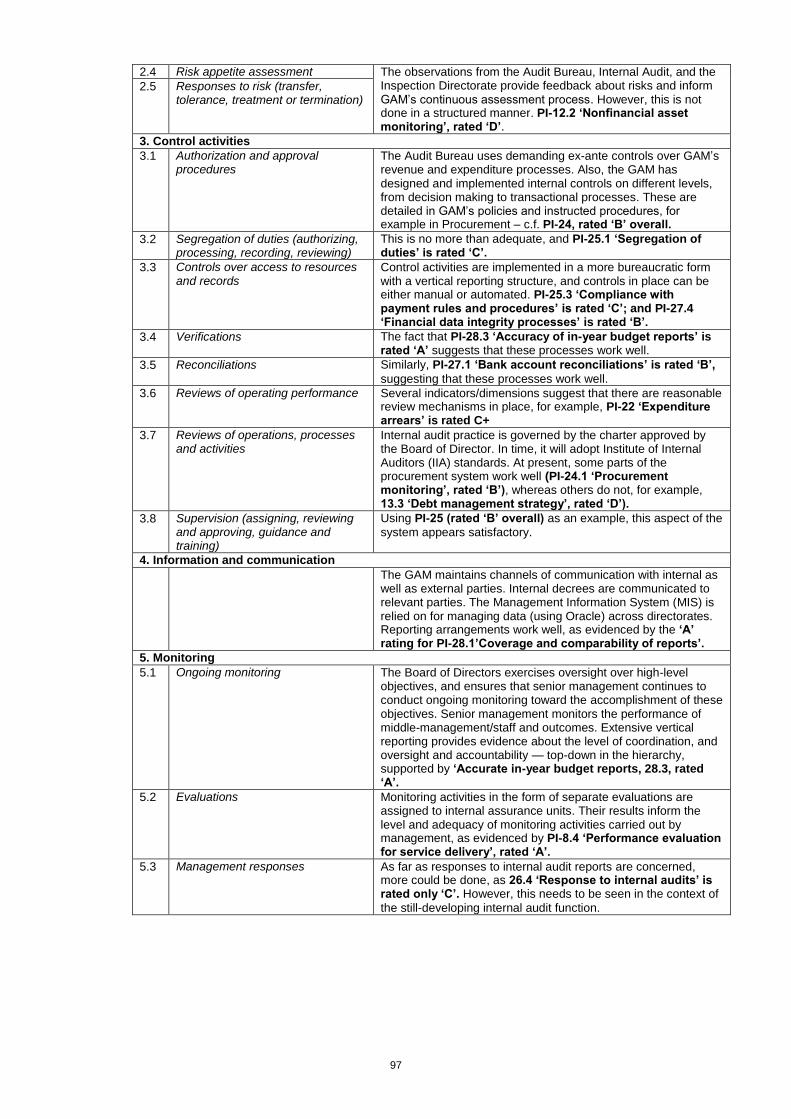
97
2.4 Risk appetite assessment The observations from the Audit Bureau, Internal Audit, and the Inspection Directorate provide feedback about risks and inform GAM’s continuous assessment process. However, this is not done in a structured manner. PI-12.2 ‘Nonfinancial asset monitoring’, rated ‘D’.
2.5 Responses to risk (transfer, tolerance, treatment or termination)
3. Control activities
3.1 Authorization and approval procedures
The Audit Bureau uses demanding ex-ante controls over GAM’s revenue and expenditure processes. Also, the GAM has designed and implemented internal controls on different levels, from decision making to transactional processes. These are detailed in GAM’s policies and instructed procedures, for example in Procurement – c.f. PI-24, rated ‘B’ overall.
3.2 Segregation of duties (authorizing, processing, recording, reviewing)
This is no more than adequate, and PI-25.1 ‘Segregation of duties’ is rated ‘C’.
3.3 Controls over access to resources and records
Control activities are implemented in a more bureaucratic form with a vertical reporting structure, and controls in place can be either manual or automated. PI-25.3 ‘Compliance with payment rules and procedures’ is rated ‘C’; and PI-27.4 ‘Financial data integrity processes’ is rated ‘B’.
3.4 Verifications The fact that PI-28.3 ‘Accuracy of in-year budget reports’ is rated ‘A’ suggests that these processes work well.
3.5 Reconciliations Similarly, PI-27.1 ‘Bank account reconciliations’ is rated ‘B’,
suggesting that these processes work well.
3.6 Reviews of operating performance Several indicators/dimensions suggest that there are reasonable review mechanisms in place, for example, PI-22 ‘Expenditure arrears’ is rated C+
3.7 Reviews of operations, processes and activities
Internal audit practice is governed by the charter approved by the Board of Director. In time, it will adopt Institute of Internal Auditors (IIA) standards. At present, some parts of the procurement system work well (PI-24.1 ‘Procurement monitoring’, rated ‘B’), whereas others do not, for example, 13.3 ‘Debt management strategy’, rated ‘D’).
3.8 Supervision (assigning, reviewing and approving, guidance and training)
Using PI-25 (rated ‘B’ overall) as an example, this aspect of the
system appears satisfactory.
4. Information and communication
The GAM maintains channels of communication with internal as well as external parties. Internal decrees are communicated to relevant parties. The Management Information System (MIS) is relied on for managing data (using Oracle) across directorates. Reporting arrangements work well, as evidenced by the ‘A’ rating for PI-28.1’Coverage and comparability of reports’.
5. Monitoring
5.1 Ongoing monitoring The Board of Directors exercises oversight over high-level objectives, and ensures that senior management continues to conduct ongoing monitoring toward the accomplishment of these objectives. Senior management monitors the performance of middle-management/staff and outcomes. Extensive vertical reporting provides evidence about the level of coordination, and oversight and accountability — top-down in the hierarchy, supported by ‘Accurate in-year budget reports, 28.3, rated ‘A’.
5.2 Evaluations Monitoring activities in the form of separate evaluations are assigned to internal assurance units. Their results inform the level and adequacy of monitoring activities carried out by management, as evidenced by PI-8.4 ‘Performance evaluation for service delivery’, rated ‘A’.
5.3 Management responses As far as responses to internal audit reports are concerned, more could be done, as 26.4 ‘Response to internal audits’ is rated only ‘C’. However, this needs to be seen in the context of
the still-developing internal audit function.
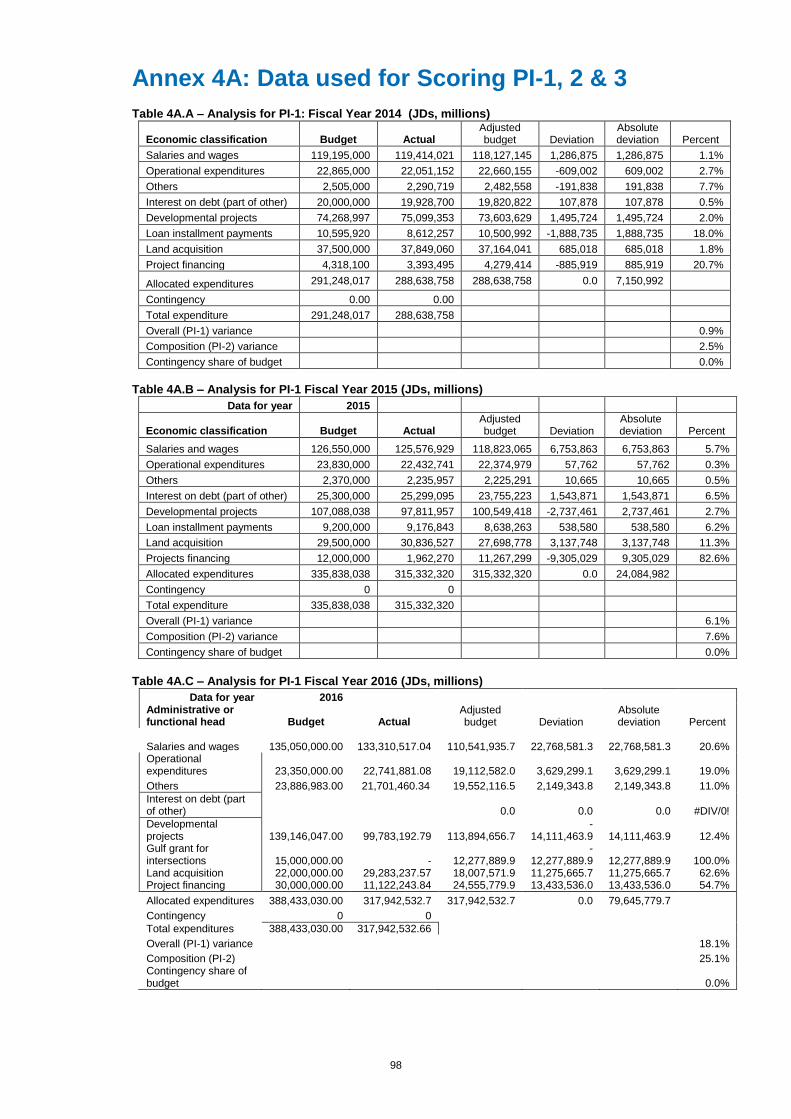
98
Annex 4A: Data used for Scoring PI-1, 2 & 3 Table 4A.A – Analysis for PI-1: Fiscal Year 2014 (JDs, millions)
Economic classification Budget Actual Adjusted budget Deviation
Absolute deviation Percent
Salaries and wages 119,195,000 119,414,021 118,127,145 1,286,875 1,286,875 1.1%
Operational expenditures 22,865,000 22,051,152 22,660,155 -609,002 609,002 2.7%
Others 2,505,000 2,290,719 2,482,558 -191,838 191,838 7.7%
Interest on debt (part of other) 20,000,000 19,928,700 19,820,822 107,878 107,878 0.5%
Developmental projects 74,268,997 75,099,353 73,603,629 1,495,724 1,495,724 2.0%
Loan installment payments 10,595,920 8,612,257 10,500,992 -1,888,735 1,888,735 18.0%
Land acquisition 37,500,000 37,849,060 37,164,041 685,018 685,018 1.8%
Project financing 4,318,100 3,393,495 4,279,414 -885,919 885,919 20.7%
Allocated expenditures 291,248,017 288,638,758 288,638,758 0.0 7,150,992
Contingency 0.00 0.00
Total expenditure 291,248,017 288,638,758
Overall (PI-1) variance 0.9%
Composition (PI-2) variance 2.5%
Contingency share of budget 0.0%
Table 4A.B – Analysis for PI-1 Fiscal Year 2015 (JDs, millions)
Data for year 2015
Economic classification Budget Actual Adjusted budget Deviation
Absolute deviation Percent
Salaries and wages 126,550,000 125,576,929 118,823,065 6,753,863 6,753,863 5.7%
Operational expenditures 23,830,000 22,432,741 22,374,979 57,762 57,762 0.3%
Others 2,370,000 2,235,957 2,225,291 10,665 10,665 0.5%
Interest on debt (part of other) 25,300,000 25,299,095 23,755,223 1,543,871 1,543,871 6.5%
Developmental projects 107,088,038 97,811,957 100,549,418 -2,737,461 2,737,461 2.7%
Loan installment payments 9,200,000 9,176,843 8,638,263 538,580 538,580 6.2%
Land acquisition 29,500,000 30,836,527 27,698,778 3,137,748 3,137,748 11.3%
Projects financing 12,000,000 1,962,270 11,267,299 -9,305,029 9,305,029 82.6%
Allocated expenditures 335,838,038 315,332,320 315,332,320 0.0 24,084,982
Contingency 0 0
Total expenditure 335,838,038 315,332,320
Overall (PI-1) variance 6.1%
Composition (PI-2) variance 7.6%
Contingency share of budget 0.0%
Table 4A.C – Analysis for PI-1 Fiscal Year 2016 (JDs, millions)
Data for year 2016 Administrative or functional head Budget Actual
Adjusted budget Deviation
Absolute deviation Percent
Salaries and wages
135,050,000.00
133,310,517.04 110,541,935.7 22,768,581.3 22,768,581.3 20.6% Operational expenditures
23,350,000.00
22,741,881.08 19,112,582.0 3,629,299.1 3,629,299.1 19.0%
Others 23,886,983.00 21,701,460.34 19,552,116.5 2,149,343.8 2,149,343.8 11.0%
Interest on debt (part of other) 0.0 0.0 0.0 #DIV/0!
Developmental projects
139,146,047.00
99,783,192.79 113,894,656.7
-14,111,463.9 14,111,463.9 12.4%
Gulf grant for intersections
15,000,000.00
- 12,277,889.9
-12,277,889.9 12,277,889.9 100.0%
Land acquisition 22,000,000.00 29,283,237.57 18,007,571.9 11,275,665.7 11,275,665.7 62.6% Project financing 30,000,000.00 11,122,243.84 24,555,779.9 13,433,536.0 13,433,536.0 54.7%
Allocated expenditures 388,433,030.00 317,942,532.7 317,942,532.7 0.0 79,645,779.7
Contingency 0 0
Total expenditures 388,433,030.00 317,942,532.66
Overall (PI-1) variance 18.1%
Composition (PI-2) 25.1% Contingency share of budget 0.0%
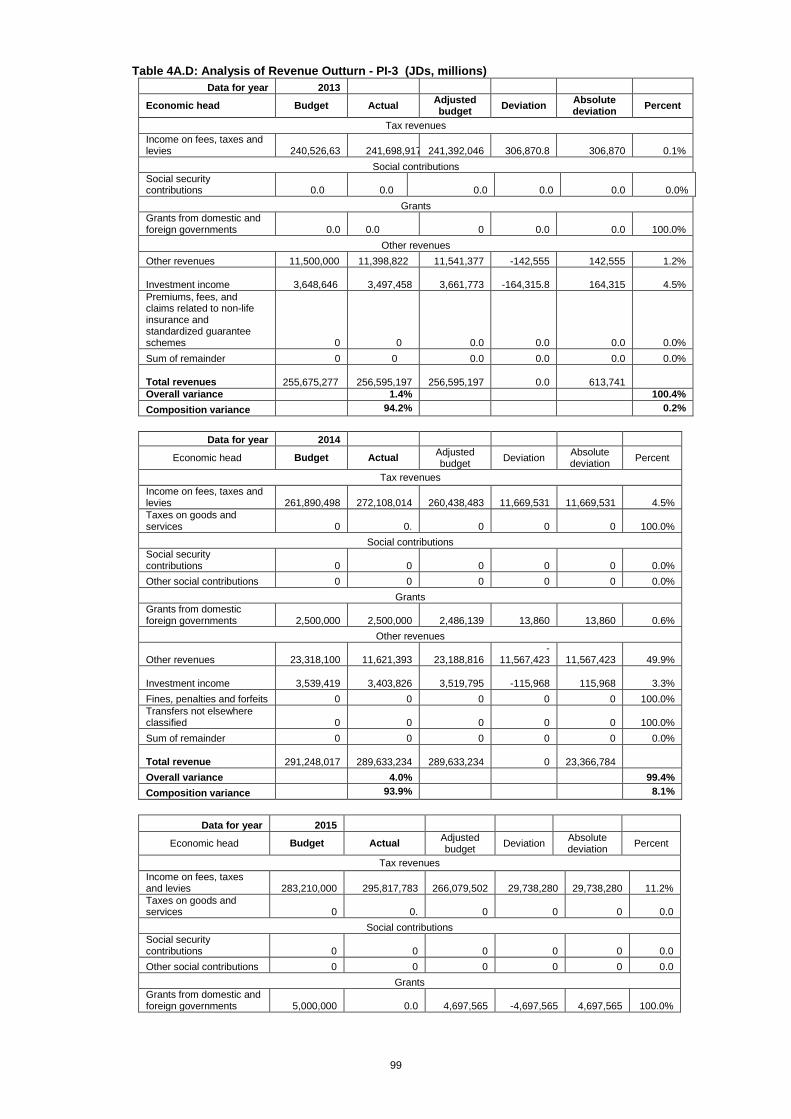
99
Table 4A.D: Analysis of Revenue Outturn - PI-3 (JDs, millions)
Data for year 2013
Economic head Budget Actual Adjusted budget
Deviation Absolute deviation
Percent
Tax revenues
Income on fees, taxes and levies
240,526,63 241,698,917 241,392,046 306,870.8 306,870 0.1%
Social contributions
Social security contributions 0.0 0.0 0.0 0.0 0.0 0.0%
Grants
Grants from domestic and foreign governments 0.0 0.0 0 0.0 0.0 100.0%
Other revenues
Other revenues 11,500,000 11,398,822 11,541,377 -142,555 142,555 1.2%
Investment income 3,648,646
3,497,458 3,661,773 -164,315.8 164,315 4.5%
Premiums, fees, and claims related to non-life insurance and standardized guarantee schemes
0 0 0.0 0.0 0.0 0.0%
Sum of remainder 0 0 0.0 0.0 0.0 0.0%
Total revenues 255,675,277 256,595,197 256,595,197 0.0 613,741
Overall variance 1.4% 100.4%
Composition variance 94.2% 0.2%
Data for year 2014
Economic head Budget Actual Adjusted budget
Deviation Absolute deviation
Percent
Tax revenues
Income on fees, taxes and levies
261,890,498
272,108,014 260,438,483 11,669,531 11,669,531 4.5%
Taxes on goods and services 0 0. 0 0 0 100.0%
Social contributions
Social security contributions 0 0 0 0 0 0.0%
Other social contributions 0 0 0 0 0 0.0%
Grants
Grants from domestic foreign governments
2,500,000
2,500,000 2,486,139 13,860 13,860 0.6%
Other revenues
Other revenues
23,318,100
11,621,393 23,188,816 -
11,567,423 11,567,423 49.9%
Investment income
3,539,419
3,403,826 3,519,795 -115,968 115,968 3.3%
Fines, penalties and forfeits 0 0 0 0 0 100.0%
Transfers not elsewhere classified 0 0 0 0 0 100.0%
Sum of remainder 0 0 0 0 0 0.0%
Total revenue
291,248,017
289,633,234 289,633,234 0 23,366,784
Overall variance 4.0% 99.4%
Composition variance 93.9% 8.1%
Data for year 2015
Economic head Budget Actual Adjusted budget
Deviation Absolute deviation
Percent
Tax revenues
Income on fees, taxes and levies
283,210,000
295,817,783 266,079,502 29,738,280 29,738,280 11.2%
Taxes on goods and services 0 0. 0 0 0 0.0
Social contributions
Social security contributions 0 0 0 0 0 0.0
Other social contributions 0 0 0 0 0 0.0
Grants
Grants from domestic and foreign governments
5,000,000 0.0 4,697,565 -4,697,565 4,697,565 100.0%
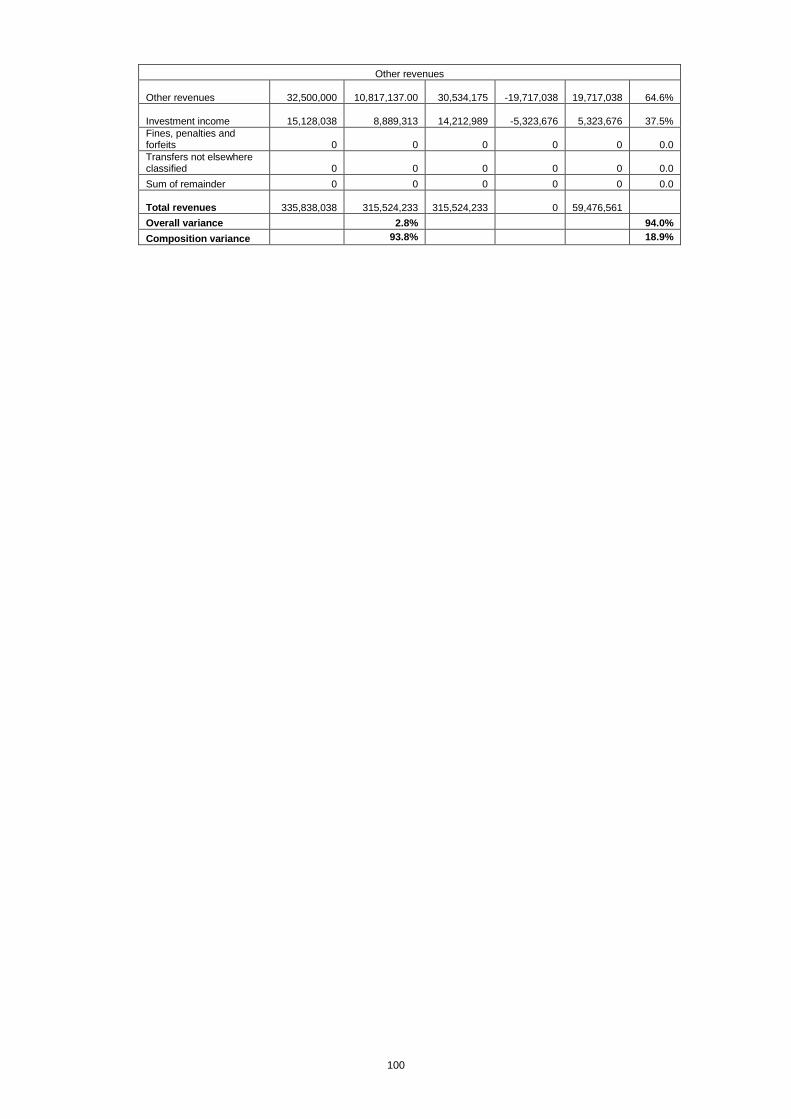
100
Other revenues
Other revenues
32,500,000
10,817,137.00 30,534,175 -19,717,038 19,717,038 64.6%
Investment income
15,128,038
8,889,313 14,212,989 -5,323,676 5,323,676 37.5%
Fines, penalties and forfeits 0 0 0 0 0 0.0
Transfers not elsewhere classified 0 0 0 0 0 0.0
Sum of remainder 0 0 0 0 0 0.0
Total revenues
335,838,038 315,524,233 315,524,233 0 59,476,561
Overall variance 2.8% 94.0%
Composition variance 93.8% 18.9%
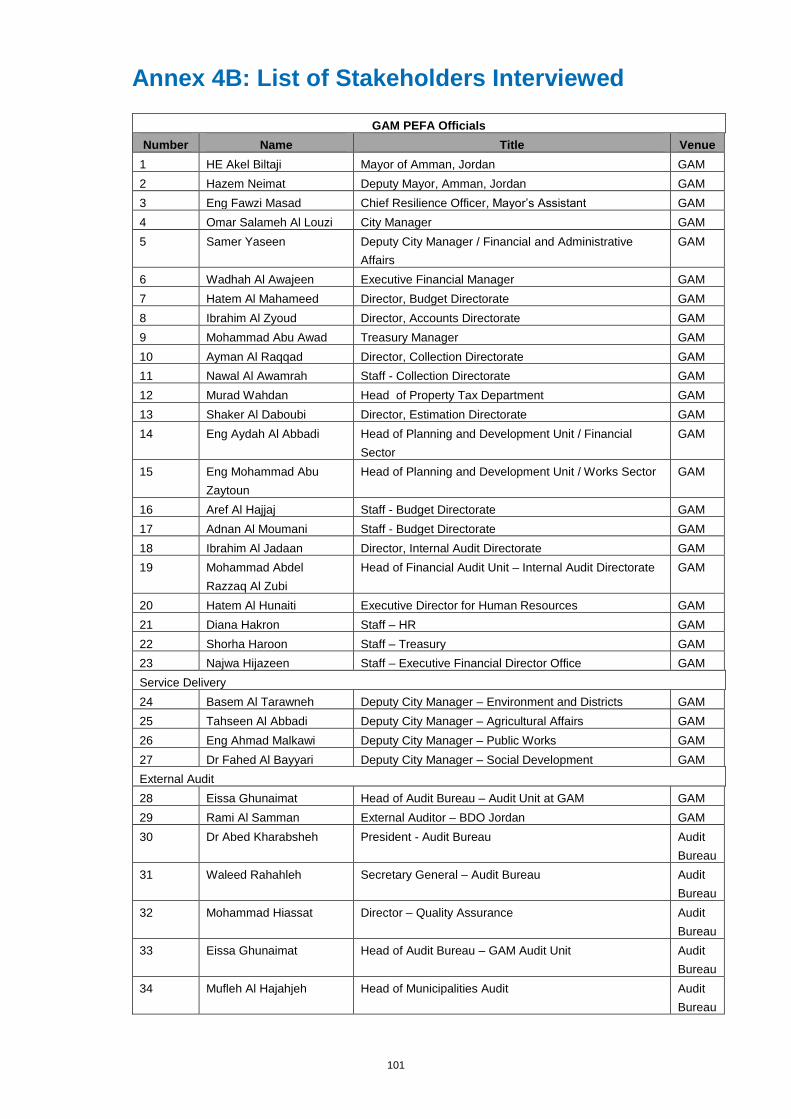
101
Annex 4B: List of Stakeholders Interviewed
GAM PEFA Officials
Number Name Title Venue
1 HE Akel Biltaji Mayor of Amman, Jordan GAM
2 Hazem Neimat Deputy Mayor, Amman, Jordan GAM
3 Eng Fawzi Masad Chief Resilience Officer, Mayor’s Assistant GAM
4 Omar Salameh Al Louzi City Manager GAM
5 Samer Yaseen Deputy City Manager / Financial and Administrative
Affairs
GAM
6 Wadhah Al Awajeen Executive Financial Manager GAM
7 Hatem Al Mahameed Director, Budget Directorate GAM
8 Ibrahim Al Zyoud Director, Accounts Directorate GAM
9 Mohammad Abu Awad Treasury Manager GAM
10 Ayman Al Raqqad Director, Collection Directorate GAM
11 Nawal Al Awamrah Staff - Collection Directorate GAM
12 Murad Wahdan Head of Property Tax Department GAM
13 Shaker Al Daboubi Director, Estimation Directorate GAM
14 Eng Aydah Al Abbadi Head of Planning and Development Unit / Financial
Sector
GAM
15 Eng Mohammad Abu
Zaytoun
Head of Planning and Development Unit / Works Sector GAM
16 Aref Al Hajjaj Staff - Budget Directorate GAM
17 Adnan Al Moumani Staff - Budget Directorate GAM
18 Ibrahim Al Jadaan Director, Internal Audit Directorate GAM
19 Mohammad Abdel
Razzaq Al Zubi
Head of Financial Audit Unit – Internal Audit Directorate GAM
20 Hatem Al Hunaiti Executive Director for Human Resources GAM
21 Diana Hakron Staff – HR GAM
22 Shorha Haroon Staff – Treasury GAM
23 Najwa Hijazeen Staff – Executive Financial Director Office GAM
Service Delivery
24 Basem Al Tarawneh Deputy City Manager – Environment and Districts GAM
25 Tahseen Al Abbadi Deputy City Manager – Agricultural Affairs GAM
26 Eng Ahmad Malkawi Deputy City Manager – Public Works GAM
27 Dr Fahed Al Bayyari Deputy City Manager – Social Development GAM
External Audit
28 Eissa Ghunaimat Head of Audit Bureau – Audit Unit at GAM GAM
29 Rami Al Samman External Auditor – BDO Jordan GAM
30 Dr Abed Kharabsheh President - Audit Bureau Audit
Bureau
31 Waleed Rahahleh Secretary General – Audit Bureau Audit
Bureau
32 Mohammad Hiassat Director – Quality Assurance Audit
Bureau
33 Eissa Ghunaimat Head of Audit Bureau – GAM Audit Unit Audit
Bureau
34 Mufleh Al Hajahjeh Head of Municipalities Audit Audit
Bureau

102
Procurement
35 Eng Omar Al Adwan Director, Tenders’ Directorate GAM
French Development Agency (Agence Française de Développement) (AFD)
36 Thierry Liabastre Senior Projects Officer, AFD Urban Development
Program
AFD