Public Disclosure Authorized Report No. 5865-EC Ecuador...
128
Report No. 5865-EC Ecuador: Issues and Options in the Energy Sector December 1985 A . . : § U r- 0': . . .r . . . - . - . . - .- , . ~ ;;sr >s - W ,,e', ;''- 'iksE?eir;y- id'dlM't%Ufib4 Public Disclosure Authorized Public Disclosure Authorized Public Disclosure Authorized Public Disclosure Authorized
Transcript of Public Disclosure Authorized Report No. 5865-EC Ecuador...

Report No. 5865-EC
Ecuador: Issues and Optionsin the Energy Sector
December 1985
A . .
: § U r- 0': . . .r . . . - . - . . - . - , . ~ ;;sr >s -
W ,,e', ;''- 'iksE?eir;y-
id'dlM't%Ufib4
Pub
lic D
iscl
osur
e A
utho
rized
Pub
lic D
iscl
osur
e A
utho
rized
Pub
lic D
iscl
osur
e A
utho
rized
Pub
lic D
iscl
osur
e A
utho
rized
JOINT UNDP/WORLD BANK ENERGY SECTOR ASSESSMENT PROGRAMREPORTS ALRFADY ISSUED
Coiirtrv DaLte Number
Ind t7 nees Ia Nov emb er 1981 3543-INI)8-Il rirt his December 1Q81 3910w-MASV enya- Max' 19982 3800-KESri l.arika. 'ia; t11W 37q?-Cii
.ii t ' .;ilime It I:' 36I725-I
Il:i rl. New ni lin June. 19 82 3852-pI;Innetlv.'; I:wil.^ ] QLJ} 3f77-H A
P.w Ind l i Iht'l 1 9S" 1 i79-1RW1;I A: t;,S i- ! Uc" 30 s-!A!.
Bane izi;. s ! : eit h'e r 91-.! g 8 7t;3-iso- a Utn: :na.,rv !W *)' :,I fl-z.IA '. - -19
i :r'.ex 't~~~~~~~~~~~~~~~-;irch ll 18si i.1i 77-'I'!;
, r I 1'). A 2 1 3 2-80F1 : . 21jfli' 198 -IR;..j!'p '-rli
I ''''iS I ' I I v :1.- }tr! |i,::! '41 .1l'. |L4: 3s);-tl
A-.!: :Z :I 'i'' 781 l:[ i.rruta. itt?'; 1 9'., >3it
t'j1. I~~~~~ ~~~~~~~~~~~~~ 1 c 'I
'sta .-. r. .1 rans 1')8 A 94-uI.osuit t,in wrunr')I 4 7bih- L.SISek'rbri -1 T In.£n'i r 46x 0 3-, EY
:':i r j ?i t I41 5-!oR
;ii- Vr rdi' A,.: '. :* iri S-* CII rt" .. ;I I'iin I tWSM-C!S3
s. X'w (;~i~; a. .' sp *'il:r'5t'r.Z I9MA 111-ST:Y
Ma}!Se r t-Q 5I l 1 -'CTJI'd r Hg i i av .IItohc r 18 : --S "5- AT;i1 a Tai :i 7 Nnvemnbir ]TW 9!A JhQ-TAYemen Ar-b Repubi Direnbe r 1: 41MA- 48 -2VYAR1. iberia, nlereribe-r 109F4 S:'79-;.RR
Mauiri tan a Apr,l' 1989 922.4-MAP ,JIaraI Ca Ap ril I 989i 9466-.IMhuorv C! oast April 198 85 52 50-I VCBenin -1IuTe 1189 9i2??-9ENToga. .;'I 9 8 5 5221-TOVantuatii June 1989 5577-VATonga Jlune 1989 54-98-To)NW-lestern Samoa Tune I -1 5 94 7-UITSoBurma TuneI 19 85 5416-1BATha i eanc Sep Pt t-em r i qp 5 '7i9-THSao Tome A rrincipe October 1985 5803-STP
FOR OFFICIAL USE ONLY
Report No. 5865-EC
ECUADOR
ISSUES AND OPTIONS IN THE ENERGY SECTOR
DECEMBER 1985
This is one of a series of reports of the Joint UNDP/World Bank EnergySector Assessment Program. Finance for the work has been provided, inpart, by the UNDP Energy Account, and the work has been carried out bythe World Bank. This report has a restricted distribution. Its contentsmay not be disclosed without authorization from the Government, the UNDPor the World Bank.
The main energy issues in Ecuador concern petroleum explora-tion, development of existing oil fields, the role of the State PetroleumCorporation (CEPE), inadequate energy pricing, and the power subsector'sfinancial difficulties.
Petroleum exploration is the key investment priority inEcuador t energy sector. The country is so dependent on oil that what-ever happens to the voLume of oil production or to oil prices, over-shadows developments in the rest of the economy. Nevertheless, pastexploration efforts in Ecuador have been insufficient, resulting in asteady decline in petroleum reserves of almost 30Z between 1973 and 1984.
In accordance with the country's requirements and good pros-pects for future oil discoveries, the overall strategy for the petroleums-bsector should aim to increase current petroleum production as long asproduction is backed by a strong exploration program. No other invest-ment in Ecuador has a higher expected rate of return, a quicker pay-off,and a more dramatic impact on exports.
The role of CEPE should be redefined and the government shouldtake actions to implement its decision. CEPE is not able to function asan efficient oil company mainly because of limited exploration involve-ment, and insufficient autonomy permitted by the petroleum legislation.
Petroleum pricing policy involves heavy subsidies with retailprices roughly 50Z of economic cost, and power tariffs exceedingly lowwhen compared to marginal cost.
The power subsector has been facing serious financial diffi-culties for a number of years. These only became apparent at the turn ofthe decade after the sector had started an ambitious investment programto be financed mostly by oil revenues.
ACONYNS
BEOE Banco Ecuatoriano do DesarolIo (Development Bank of Ecuador)EF i3Banco Naclonal de Feoento (National Development Bank)CAF Corporacion Andine, de Fomento (Andean Development Fund)CEDEGE Comision de Estudios para el (Guayas Basin Development
Desarrollo de Rio Guayas Comission)CEPE Corporacion Estata i Petrolera (Ecuadorian Petroleum State
Ecuatorl3na CorporationiWONAOE Consejo pacibonal de DesarolIa (National Development Office)ONi Direccion Nacional de (Hidrocarbons Nationai
Hldrocarburos Directorate)EEC Comunidad Economica Europea European Economic CommunityEMELEC Empresa Electrica del Ecuador (Ecuadorian Electric Company)FONAFOR Fonda NacTonal Forestal (National Forestry Fund)GDE Goblerno de la Republica del
Ecuador (Government of Ecuador)[NE Instituto Macional de Energia O(ational Energy Institute)INECEL Instituto Ecuatoriano de (Ecuadorian Electrificiation
Electrificacion Institute)MAG Ministerio de Agricultura (Ministry of Agriculture)NOF Ministerio de Finanzas (Ministry of Finance)MRNE Ministerio de Recursos (Ministry of Natural and Energy
Naturales y Energeticos Resources)OLAIE Organication Latinoamericana (Latin American Energy
de Energla Organization)OPEC Organization of Petroleum
Exporting CountriesPRONAF Prograra Naciona Forestal (National Forestry Program)USAID U.S. Agency for International Development
ASRESVIATIONS
B Billion = 109 km Kilometerbbl Barrel kW Kilowattbd Barrel per day kWh Kilowatt hourrTU British thermal unit L Liquefied Petroleum GasCFD Cubic feet per day m Cubic meterGN Gigawatt MM MillionGQh Sigawatt hour MT Metric Tonha hectare MW Megawattkcal Kilocalorie MWh Megawatt hourkgoa Kilograms of oil equivalent toe Tons of oil equivalentktoe Kilo tons of oil equivalent TPD Ton per day
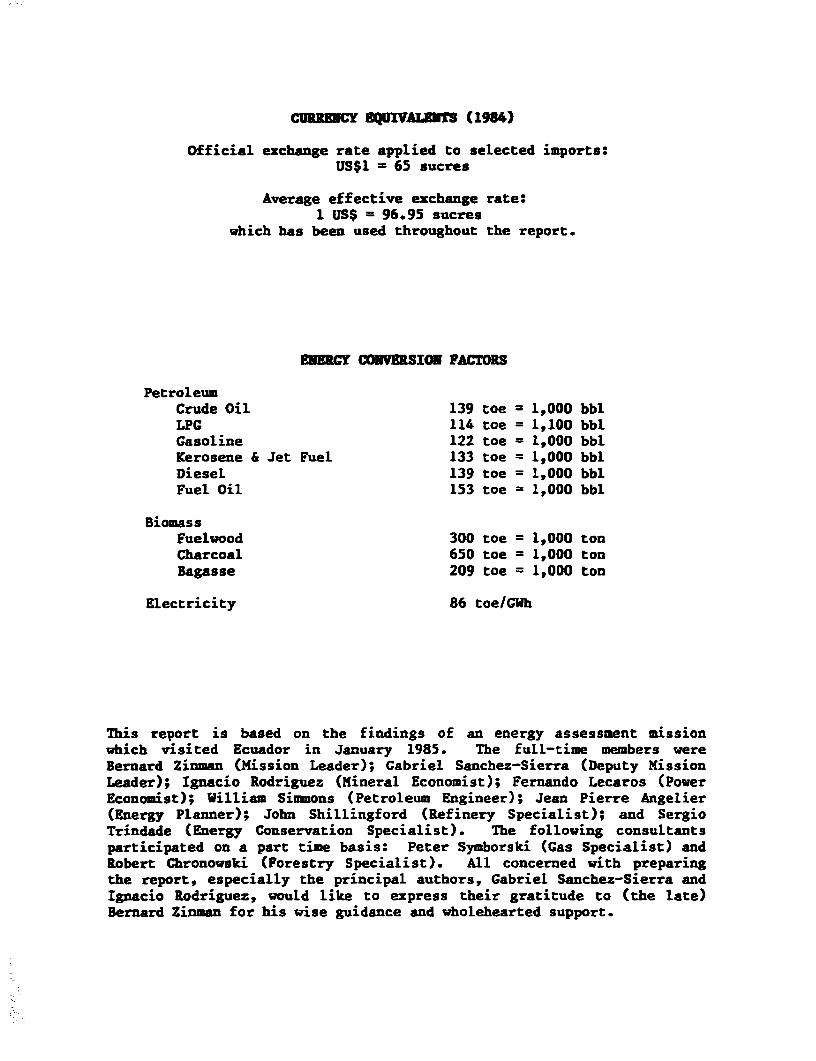
CURRWC DQUIVE (1984)
Official exchange rate applied to selected imports:US$1 = 65 sucres
Average effective exchange rate:1 US$ = 96.95 sucres
which has been used throughout the report.
EKENCY CONVERSION FACTORS
PetroleumCrude Oil 139 toe = 1,000 bblLPG 114 toe = 1,100 bblGasoline 122 toe = 1,000 bblKerosene & Jet Fuel 133 toe = 1,000 bblDiesel 139 toe = 1,000 bblFuel Oil 153 toe = 1,000 bbl
BiomassFuelwood 300 toe = 1,000 tonCharcoal 650 toe = 1,000 tonBagasse 209 toe = 1,000 ton
Electricity 86 toe/GWh
This report is based on the findings of an energy assessment missionwhich visited Ecuador in January 1985. The full-time members wereBernard Zinman (Mission Leader); Gabriel Sanchez-Sierra (Deputy MissionLeader); Ignacio Rodriguez (Mineral Economist); Fernando Lecaros (PowerEconomist); William Simmons (Petroleum Engineer); Jean Pierre Angelier(Energy Planner); John Shillingford (Refinery Specialist); and SergioTrindade (Energy Conservation Specialist). The following consultantsparticipated on a part time basis: Peter Symborski (Gas Specialist) andRobert Chronowski (Forestry Specialist). All concerned with preparingthe report, especially the principal authors, Gabriel Sanchez-Sierra andIgnacio Rodriguez, would like to express their gratitude to (the late)Bernard Zinman for his wise guidance and wholehearted support.
TABLE OF COMTEETS
SUMMARY AND RECOMMENDATIONS .................. . ........... i
IsENERGY IN THE ECONOMY..*.s.. 1I * NRYI H CNM..................................... 1Country Backgroundo ............. 1Economic Situation ..................................... 1Energy Resources3....................................* 3Energy Balance, 1984 .................................... 3Energy Demand Projections ..... ............. 4
II. ENERGY DEMAND MANAG EN ENT. ..... .. ...... ...... 7Energy Pricing .......................................... 7Petroleum Products.... ....... ........... 7Reconmendations .............. . 9Electricity Tariffs ....... 0669 ..... 11Recommendations ..0.0..O,,.,........................ -. 0 ....... .. 13
Energy Conservation and Substitution ....................0 13The Structure of Energy Demand ........................ 13The Household Sector .......................... ........ 13The Industrial Sector ..........o....................... .. 14The Transport Sector .... ... ...... .... ..... .... 0........ 16Recommendations ..... -............ .. .... ..... ......... 20
III. PETROLEUM .................... ,o . .. ee.o 21Background .o..................... ..0.0......... .......... 6.09...... 21Petroleum Exploration and Development Activities ........ 22Current Reserves ............ o......................... 22Petroleum Exploration ....... .................. ...... 23Petroleum Production and Secondary Recovery ........ .... 24Heavy Crudes ..... ..... ........... .............. .. 26
Petroleum Supply .. ....................... o....- ........ ............. 26Refining Facilities .... o............................................. 27Supply/Demand Imbalance ...... ....... . 27Storage .e.....es....................................... oo.. ...... 27
InstitutionaL Issues* ........ o......................... .- ............ 28Petroleum Legislation and the Role of CEPE ............ 28CEPE's Finances .. ........... .......... .... ...... o ..... . 30
CEPE's Investment Program....... ............... . ....... 3.1Exploration and Oil Field Development ................. 32
33Transportation and Storage. ... .................. 35
Recommendations ................ o...................... 36
IV. NATURAL GAS ................. .......... ........................ 38Background*...*..* ................... .......................... 38Gas Development in the Gulf of Guayaquil ...... .......... 39Oriente - Efficient Use and Recovery of Gas ............ 43Recommendations ......................................... 46
Vs ELECTRICITY ...eeee.....o...........o..o.........................e.. 48Background ........................................................ 48Basic Resources and Existing Facilities ................. 49Electricity Growth and Demand Forecasts ................. .50Short Term Expansion Plans.............................. 51Long Term Expansion Plans ............................... 54System Operations....................................... 54Sector Finances ooesee.moo..os..e.... .e.o..*.......................... 55The Power Sector rnvestment Program ..................... 57Institutional Problems.o...o.......o ......... .. o ... 60Recommendations .. 9. wosooa........oo...see......o..o..oo........... oo.... 61
VI. FUELVOODo*.oo..o..o.o......................................... 62Background.................... ... 62Fuelwood Consumptiono ........................................... .0.00...... 62Supply Sources and Relative Availability .............. 64Organization of the Forestry Sector .................. .64Reforestation Programs.....ooo........ o ........... o... o.. 65Investment Priorities .... o ....... .sees............ . ... .. 66Recommendationso ....... ..*. .................. o...... 67
VII. NON-CONVENTIONAL ENERGY SOURCES ......owes....... o ........ o.. 68Geothermal ... ............. ............................... .......... 68Small Hydro For Rural Areas ....... ....... o ........ ...... 70Solar Energy .............. ............... .......................... .. 71Wind Energy;..............0-............. ....................... ..... 73Biogas ..... . es......... ..... ....0 ............ 74Other Biomass Energy Sources .......... .................. .. 74Role of INE ..........o ......... .............. ... . .. 76
TABLES
Table 1.1: Relative Importance of Petroleum in Ecuador ........ ... 2Table 1.2: Summary Energy Balance, 1984 .......................... 3Table 1.3: Economic Growth and Commercial Energy Consumption ..... 4Table 1.4: Final Energy Demand ................... o................ 5Table 1.5: Increase in National Oil Revenues Resulting From
a 50Z Increase in Domestic Product Prices ...... .. 6Table 2.1: Comparison of Energy Prices in Ecuador,
January 1985 .......... .................. 0........ ..... ............. 8Table 2.2: Petroleum Products Retail Prices and Opportunity
Costs - July 1985.. ......... . ... ......... 8Table 2.3: Estimate of Petroleum Product Subsidies in 1984 ....... 10Table 2.4: Comparison of Average Bills in the Sierra and the
Coast .... o ...... . ... ....... .......... .......... . 11Table 2.5: Electricity Reference Tariffs Based on Marginal
Costs Analysis ..........na - y..s i.s ........... 12Table 2.6: Estimated Energy Consumption of Selected Industries
in Ecuador, 1984 ........................... 15Table 2.7: Economics of DieseLization .18Table 3.1: Oriente Oil Reserves ..............................v...e 23Table 3.2: Petroleum Production, Requirements and Surplus
(Deficit) .................................................... .25
Table 3.3: Surplus (Deficit) of Production over Demand....... ... 28Table 3.4: CEPE's Investment Plan 1985-1988 ...................... 31Table 3.5: Libertad -Nanta Transport Costs .................-... 36Table 4.1: Potential Domestic Market For Gas Utilization in
Ecuador ................... ................ ........... . 38Table 4.2: Summary of Economic Analysis of Gas Utilization
Projects in Guayaquil .............. 40Table 4.3: Project Packages - Gulf of Guayaquil Gas4.............. 41Table 4.4: Summary of Economic Analysis of Gas Utilization
Projects in the Oriente . ..................... . 44Table 5.1: Basic Characteristics of the Ecuadorian Power
System 1984 ........................................................ 50Table 5.2: Paute Mazar Benefits and Estimated Costs .............. 52Table 5.3: INECEL'S Investment Program .. 58Table 5.4: Recommended Investment Program in the Power
Sector, 1985-1988 . ...................... ... . 58Table 6.1: Remaining Forest Resources of Ecuador ........ 64Table 6.2: Five-Year FONAFOR Reforestation Plan, 1984-1988 ....... 66Table 7.1: ConventionaL Water Heating Fuel Costs in Ecuador ...... 72Table 7.2: Solar Water Heating Costs ............................. 72Table 7.3: Windmill Water Pumping Energy Costs ................... 73Table 7.4: Availability of Crop Residues in 1980 ................. 75
ANNEXES
1. Ecuador Overall Energy Balance - 1984 ....... 100.. 782. Exportable Crude Oil Production, 1985 to 2000 ............. 793. Estimation of the Cost of Petroleum Product Contraband
in 1984 .......................................................... 844. Marginal Cost and Tariff Analysis ......................... 855. Energy Conservation and Substitution in the Transport
Sector .................................................. 886. Ecuador Prediction of Future Oil Production by Field ...... 907. CEPEts 1985 Investment Program -
Exploration and Production .. 918. Investments in Oil Field Developments, 1985 - 1990 ........ 939. Gulf of Guayaquil - Gas Reserve Estimates ................. 9410. Gulf of Guayaquil Economic Analysis ....................... 9511. Assumptions Underlying Economic Analysis for the
Ammonia/Urea Option of Gas Utilization .................. 9712. Oriente Economic Analysis ................................. 9913. Power Demand Projections .................................. 10114. Recommended Organization of PRONAF ........................ 103
MAPS
IBRD 18179 EcuadorIBRD 18930R Petroleum Resources and Supporting InfrastructureIBRD 19042 Ecuador's Power SystemIBBD 19295 Solutions to the Paute Siltation Problem
SUMNY AND ECNE ONS
1. Ecuador has abundant energy resources which, if exploitedproperly, could improve the country's development prospects during the1980s. Its major resources consist of: 1.5 billion bbl of petroleum 1/(928 MMbbl proven and 526 MKbbl probable), 550 BCF of natural gas,21,000 KW of hydropower, and abundant forest resources. Despite sub-stantial potential energy resources, Ecuador's per capita consumption ofenergy (533 kgoe) is low compared with the Latin American average.
2. Ecuador's growth prospects will depend critically uponpetroleum exports and international petroleum prices. The discovery andexploitation of oil in Ecuador initiated an unprecedented economic boomin the 1970s. Since then, petroleum has been the backbone of theEcuadorian economy. In 1984, petroleum accounted for about 72Z of allcommodity exports, 15% of the country's GDP, 50Z of Central Governmentrevenues, and 74Z of the total finaL domestic energy demand.
3. The major issues in Ecuador revolve around investment prio-rities, energy demand management and institutional problems. Althoughthe country has a plentiful supply of energy resources, it has limitedfinancial resources which must be allocated efficiently according topriorities. In energy demand management, the present pricing policy is amajor constraint to an efficient allocation of energy resources. Lack ofconservation incentives, contraband trafficking of petroleum products toneighboring countries, illegal interfuel substitution, and revenue lossesare all a consequence of this policy. With respect to institutionalproblems, procurement bottlenecks and the undefined role of majorinstitutions in the energy sector are the main concerns.
Investment Priorities
4. Short term economic conditions in Ecuador will require asetting of priorities in public investment in the 1985-1988 period.Taking into account the public investment review requested by theGovernment of Ecuador (GOE) and conducted by the World Bank in early1985, the mission reviewed the energy sector's investment program withthe purpose of seeking an overall reduction of one-third.
Petroleum
5. Petroleum exploration is the key investment priority inEcuador's energy sector. The country is so dependent on oil that
1/ DNH has estimated total reserves at a mrre conservative 1.13 billionbbl.
- ii -
whatever happens to the volume of oil production or to oil pricesovershadows developments in the rest of the economy. Nevertheless, pastexploration efforts in Ecuador have been insufficient, resulting in asteady decline in petroleum reserves of almost 30X between 1973 and1984. After 1988, production rates from existing fields will not be ableto maintsin crude oil exports at the 1982 levels and provide for thegrowing demand on the internal market. New possibilities exist, however,as a result of the Ecuadorian Congress approving new legislation torevise the Hydrocarbon Law in August 1982 in order to attract privateinvestors. This legislation has been successful, as evidenced by therecent signing of exploration service contracts with Occidental PetroleumCompany in January 1985, Belco in June 1985, and anticipated contractswith Exxon and possibly other companies.
6. The mission agrees with the Government's overall strategy ofattracting private capital for future oil exploration but is concernedabout the limits placed on the scope of the State Petroleum Corporation(CEPE) activities. CEPE should continue in low risk exploratory work inview of the Corporation's good discovery rate (62.5Z from 1975 thru 1984)and the long lead-time required before production from any new field cantake place, since production resulting from private investment inexploration may not start until the 1990s. In order that new discoveriescan quickly be developed for exploitation and to reduce the risk level,CEPE should concentrate on those prospects located close to their oilfields now producing in the Oriente. This would ensure an increase inpetroleum supply over the next several years, and maintain an adequatereserves/production ratio in the near and medium-term. CEPE should alsoconduct more detailed seismic surveys, geochemical prospecting, andgeological studies in relatively unknown but attractive areas to assistin the promotion of new service contracts in such areas by privatecompanies (paras. 3.8-3.11 and 3.39-3.40)-
7. Development of existing oil fields is the most profitableinvestment the GOE can undertake in the energy sector. Purchasing ofartificial lift equipment will be crucial to increasing output in certainCEPE oil fields in the Oriente where US$40 million in capitalexpenditures have already been made in developing the fields involved.The CEPE-Texaco Consortium could increase its production by 20,000 bd,without doing harm to the oil fields, which would permit an increase inexports valued at about US$200 million annually. No other investment inEcuador has a higher expected rate of return, a quicker pay-off, and amore dramatic impact on exports.
8. In accordance with the country's requirements and good pros-pects for future oil discoveries, the mission considers that the overallstrategy for the petroleum subsector should aim to increase currentpetroleum production as long as production is backed by a strong explora-tion program. This would provide revenue which could be used for furtherexploration and to alleviate Ecuador's urgent need for foreignexchange. In view of the higher risk involved in the Santa Elena oil
- iii -
fields, rehabilitation program and its lower priority, it should becarried out under a joint-venture operation (paras. 3.12-3.17 and 3.41-3.44).
9. Ecuador's refinery strategy is justified in expanding refiningcapacity to balance local production with demand. This appears to be aprudent decision since the future of the refineries in the Caribbean thatsupply Ecuador is at this time unknown, and the petroleum market is veryunstabLe. Ecuador does not plan to emulate the larger OPEC nations, inattempting to refine on a large scale for the export of products.
10. The expansion of the Esmeraldas refinery (US$125 million) isattractive, as the refinery has a yield structure well suited to domesticdemand. The mission estimated an IRR of 15% over a 15-year life. Expan-sion of the refinery will be commissioned in 1988 and is expected toincrease its refining capacity by 34,000 bd to 90,000 bd. The plannedAmazonas refinery (US$23 million) has a very good return on investment(35-471) due to savings in pipeline transportation costs from Oriente-Esmeraldas-Quito and road transportation costs. Tt will be located inthe Oriente region with a capacity of 10,000 bd. The mission agrees withthe present informal position of the GOE to postpone indefinitely theproposed Atahualpa refinery (75.000 bd) because of its nigh investmentcost and negative rate of return (paras. 3.45-3.47).
Natural Gas
11. From a preliminary analysis, the mission does not considernatural gas an investment priority for the short run. Although the gasfrom the Gulf of Guayaquil has a potential market, there are manyuncertainties which must be resolved first regarding the size ofreserves, geology, market and legal exploitation rights. Utilization ofnatural gas for power generation in the Guayaquil area is the mostattractive option in terms of gas utilization, but its economic meritdepends on the generation policy of the Ecuadorian ElectrificationInstitute (INECEL). Since hydropower will be available, the expansion ofINECEL's transmission system in the next five years will reduce the needfor gas in the power sector. The mission recommends that reliable gasreserve estimates be estabLished, a comprehensive gas utilization studybe carried out before any large investment is undertaken in the area andthe LegaL uncertainties about exploitation rights be clarified.(paras. 4.8-4.20).
12. Historically, the associated natural gas in the Oriente hasbeen flared, with only nominal volumes utilized as fuel and for gas liftoperations. Much of the gas has been flared as a result of: low gas/oilratios, remote production areas, low concentration of population andlarge distances to consumption centers, and lack of infrastructure.CEPE's current program is now oriented to improve gas utilization andmaximize the recovery of condensates. In a preliminary analysis themission has found that the gas used to replace diesel and centrifugedcrude oil in petroleum operations is economically attractive and well
i lv -
justified to be implemented. Although power generation and recovery ofcondensates may be economically attractive, they must be analyzed indetail because of the scattered power demand potential and constraintsmentioned above (paras. 4.21-4.31).
Electric Power
13. Investment priorities recommended by the mission include thefollowing: (a) to finalize the consLrsction of the Agoyan hydroelectricproject; (b) to maintain INECEL's tra.smission expansion program; (c) tocontinue with INECEL's distribution expansion program; and (d) to con-tinue with the preparation of various feasibility studies.
14. rhe Agoyan project (156 MW), which is scheduled to be tinishedin 1987, will assure enough generating capacity to satisfy demand until1993. The mission concludes that since the project is well advanced,finishing the project according to its present schedule is completelyjustified (para. 5.35).
15. Expansion of the Transmission System. INECEL's transmissionexpansion program can be considered reasonable and should be maintained,altbough some deferral is possible in view of the recommended postpone--ent of some of the hydrogeneracion investments (Paute C and Daule Peripa- see para. 18 below). The system's expansion will improve reliabiltiy,reduce losses and make energy available for further electrification(paras. 5.38-5.39).
16. Distribution and Rural Electrification. The mission considersthat the amount of investment allocated for distribution and rural elec-trification is well justified. In view of Ecuador's low electrificationrate (61%), there is a need to stimulate the demand for electricity, as away of promoting economic growth (para. 5.40).
17. Feasibility studies. The mission considers that the amountbudgeted for studies is adequate. Studies included in INECEL's invest-ment plan will provide the basis for planning and will be used in therevision of the master plan. In particular, feasibility studies forprojects such as CardenilLo and Sopladora are crucial for the definitionof the Paute River complex which is the backbone of hydropower develop-ment in Ecuador. Furthermore if studies are to be ranked in order ofpriority, the mission suggests that emphasis be placed on "small" proj-ects (100-300 MW) that allow greater planning flexibility than the largerand riskier plants that ultimately can be more expensive for a countryfacing serious macroeconomic and financial constraints (para. 5.41).
18. The P*utte C (500 KW) and Daule-Peripa (130 NW) projects whichare included in INECEL's investment program should be postponed. 2/Given the complexity of the sedimentation problem in developing the PauteRiver, it would be advisable to postpone civil works on the Paute Cproject until more informaticn about sediments, including proposals forhandling them, becomes available. Even if Paute C is not initiatedbefore 1986 or 1987. it would still be finished before 1994, which is theearliest date it migl.t be needed. In view of the present resource con-straint and the fact that installed capacity would suffice to meet peakdemand in 1993, it would be advisable to defer construction of the Daule-Peripa hydropower component two years and start construction in 1989(paras. 5.36-5.37).
Fuelwood
19. From a preliminary analysis, the missioz. does not considerinvestments in reforestation for energy purposes to be a priority for theshort term. It has been found that the opportunity cost of fuelwood(when energy efficiency is taken into account) is more than twice that ofkerosene. This is due to high reforestation costs in Ecuador associatedwith poor terrain and harsh climate in the deforested areas such as inthe southern Sierra. The mission considers that before any majorreforestation program for energy purposes is undertaken, a detailed bene-fit/cost analysis both of a reforestation program and kerosene utili-zation program should be carried out (para. 6.15).
Energy Demand Management
Energy Pricing
20. Energy pricing in Ecuador has been a highly sensitive, poli-tical issue, with past increases leading to riots and strikes. Effectiveenergy conservation and appropriate fuel choices will be diffic-xlt toimplement until prices refl-,t their actual costs of supply.
21. Petroleum pricing policy involves heavy subsidies (retailprices are roughly 50Z of opportunity cost); the total subsidy in 1984was over UEJ600 milLion, comprising an implicit (economic) subsidy ofUS$515 million and an explicit (financial) subsidy of US$93 million con-sisting of losses incurred by CEPE. In addition, low domestic prices forpetrolei .products have encouraged illegal interfuel substitution in theindustriaL and transport sectors, and large-scale smuggling of theseproducts to Colombia and Peru resulting in financial losses estimated atUS$57 million in 1984. the Ecuadorian Energy Institute (INE) estimates
2/ The GCE has already started the civil-works in Paute C and theirrigation stage of Daule-Peripa which is a multi-purpose project.
- vi -
that the volume of these illegal petroleum product exports representstwo-thirds of those imported by Ecuador and about 102 of Ecuador's totalconsumption. The Ecuadorian Government should adopt the concept ofopportunity cost as the pricing principle for all petroleum productsexcept kerosene, and prices should be pegged to the dollar and increasedgradually at a rate higher than internal inflation. The GOE may considermaintaining the subsidy on kerosene for low-income households since kero-sene remains the most economic cooking-fuel option for Ecuador, takinginto account a system which would avoid fraudulent use (paras. 2.3-2.7).
22. Taking into consideration the price-ceilings provided in theHydrocarbon Law which cover only the costs of production and distribu-tion, in the absence of changing the law, the mission recommends someparallel actions such as: (a) analyzing the implementation of asubsidized public transport system while still being able to raise theprice of gasoline to its opportunity cost; and (b) reducing fraudulentblending of products.
23. Electricity Tariffs. INECEL's tariffs are exceedingly low whencompared to marginal cost. The mission has estimated that the marginalcosts vary from USC5.7 to UC9.7/kWh, depending on voltage level; thisc-ompares to an average tariff level of USC3.4/kUh. Taking into accountthe political constraints that prevent substantial readjustment ofelectricity tariffs, the mission considers that power tariffs should beadjusted gradually towards their long-run marginal cost level, byperiodic increases at a rate higher than internal inflation (paras. 2.8-2.11). 3/
Energy Conservation
24. An efficient allocation of resources will be realized inEcuador only when prices are increased to reflect their opportunitycosts. Until then, the mission has identified various possibilities inthe household, transport and industrial sectors. In the household sec-tor, a benefit/cost analysis of reforestation versus kerosene utilizationshould be carried out. Although Ecuador's industry is predominantlylight and small, substantial energy savings could be achieved by im-proving efficiency in refineries and in cement plants, reducing fuel oiland diesel oil consumption in sugar mills by using surplus bagasse moreefficiently, and replacing the diesel oil used in power generation withavailable hydropower. The transport sector, which is the single mostimportant user of energy in Ecuador (50Z of commercial energy), canachieve energy conservation in two ways: (a) interfuel substitution; and(b) increasing transport system efficiency. Maintenance of equipment andincentives to improve freight transport by increasing back-hauls, wouldintroduce energy efficiency standards (paras. 2.13-2.40).
3/ Presently (Dec/85), tariffs are being increased by 3% per month,exceeding the inflation rate.
- vii -
Institutional Issues
25. Overall coordination of the energy sector by the Ministry ofNatural and Energy Resources (MRNE) is sound. However, much improvementis required in the major institutions in the energy sector for efficientfunctioning.
26. The major issue for the petroleum subsector concerns redefiningthe role of CEPE. CEPE is operating under deep-seated legal rigiditiesand bureaucratic delays. In addition, the Hydrocarbons NationalDirectorate (DNH) is duplicating some activities carried out by CEPE.CEPE's autonomy should be ensured and solutions to Drocurement bottle-necks should be provided. A very clear distinction should be madebetween executing national hydrocarbon policies under DNH, and the actualoperations by CEPE and private companies within the Government'spetroleum policies.
27. CEPE's ability to operate as an oil company is seriouslyimpeded by its lack of financial autonomy. CEPE should have enoughresources to finance a sound investment program developed jointly withDNE. The mission concluded that a detailed financial analysis of CEPEand an analysis on the distribution of oil revenues within the country'smacroeconomic context should be carried out. The mission recomends thata financial strategy for CEPE should be defined, including investment andresource requirements linked to an overall policy in the medium and long-term. (paras. 3.27-3.36)
28. The power subsector has been facing serious financial diffi-culties for a number of years. These only became apparent at the turn ofthe decade, after the subsector had started on an ambitious investmentprogram designed to replace thermal with hydroelectric generation and tointerconnect the country's isolated regional systems to a national powergrid. The investment program was to be financed mostly by oil revenuesat a time when Ecuador was enjoying unprecendented prosperity arisingfrom the increase in oil prices-and its incipient role as an oil export-ing country. The power subsector should define a financial strategy thatwill increase net internal cash generation, reduce its dependence on oilrevenues and external borrowings.
29. INECEL suffers from two institutional problems, one internal tothe company and the other external. The internal problems which obstructefficient management of the company mainly concern the abundance of con-cessionaires, even after an effort to group the companies together. Atpresent INECEL's management is seeking solutions to these problemsthrough an institutional development program. The mission considers thisof high priority for INECEL.
30. The external problems mainly concern legal requirements whichcreate obstacles to the effective functioning of the company, especiallywith respect to imports, bidding, and contracts. Resolution of these
- viii -
legal problems, especially as they relate to the Contraloria, wouldrequire substantial modification of the basic electricity law. Never-theless, in the short term, groups could be formed to improve managementoperations in INECEL. In addition, the Manager of the Company should beauthorized to purchase equipment for amounts in excess of the unrealisticlimit of US$10,000 (paras. 5.27-5.32 and 5.42-5.45). 4/
31. Lack of coordination, plus insufficient funding and manpower,have prevented the National Forestry Program (PRONAF) from having aneffective impact on the fuelwood subsector, especially in the area ofreforestation. PRONAF should be reorganized in such a way that the needsof the forestry sector can be met in a cost effective manner andaccording to priorities. There are manpower constraints both in PRONAFheadquarters and in district offices; the situation is aggravated by theinefficient institutional organization of PRONAF (para. 6.11).
32. INE, as the national energy planning center, appears to haveplaced much emphasis on areas with low pay-off on a national scale. Thiscan be a.tributed to political sensitivities surrounding the main energyissues in petroleum and electric power. A redefinition of its role andreorganization is required. Greater emphasis is needed on priorities,intrasector analysis, demand management -- particularly energy pricing -and economic feasibility work for specific projects (paras. 7.29-7.33).
Technical Cooperation Requirements
33. The ¶ sessment mission recommends the following as priorityareas in which -ollow-up technical cooperation studies would be useful inresolving some of the problems in the energy sector in Ecuador.
Subsector Priority Areas Requiring Technical Cooperation
Petroleum - Petroleum product pricing analysis (paras. 2.3-2.7).
- Prefeasibility study on the implementation of asubsidized transport system which would permitpublic transport fares to remain at a low levelwhile raising the price of gasoline to itseconomic cost (para. 2.7).
- Prefeasibility study on increasing petroleumproduction in existing fields (paras. 3.15-3.17).
4/ This limit has been recently extended to US$100,000.
- ix -
- Design and implementation of an integratedplanning system for CEPE, including refineries,pipelines and terminals as an aid to investmentplanning (paras. 3.48-3.49).
- Identification of new areas for future petroleumexploration activities (para. 3.9).
- Analysis of CEPE's legal and organizationalframework (paras. 3.27-3.33).
- Analysis of CEPE's financial situation and thedistribution of oil revenues within the country'smacroeconomic context (paras. 3.34-3.36).
Natural Gas - Prefeasibility study on the market potential forthe naturaL gas from the Gulf of Guayaquil (para.4.9).
Electric Power - Marginal cost and tariff analysis (paras. 2.8-2.12).
Institutional development of INECEL and itssubsidiaries (paras. 5.39-5.42).
-Technical services in updating and revising theexisting generation and transmission models inINECEL's planning unit (para. 5.20).
Operation of the Interconnected System (paras.5.25-5.26).
Loss reduction study (para. 5.26).
Prefeasibility study on rural electrification -second phase (para. 5.40).
Fuelwood - Prefeasibility study on comparison of reforesta-tion for energy purposes and kerosene utiLization(para. 6.15).
Geothermal - Reevaluation of the Valle de los Chillos geother-mal project for industrial use (paras. 7.7-7.8).
I. mint IN TME 3scUmKY
Country Background
1.1 Ecuador has a land area of 284,000 km2 and is divided intothree distinct geographic zones (IBRD Map No. 18179). The westerncoastal lowlands, which extend from the Pacific Ocean to the Andes,embrace one-fourth of the country's total area and have about one-half ofthe country's population. Guayaquil, on the Pacific coast, is Ecuador'slargest city and the country's most important port. The high AndeanMountains, which run essentially north-south through the center of thecountry - and have slightly under one-half of its population - housethe capital of Ecuador, Quito. The third geographic zone is the low-lying eastern, or Oriente region, which is jungle covered and drained bytributaries of the Amazon River and contains nearly all of Ecuador'sproven oil reserves. The Oriente constitutes about one-half of. thecountry's total area, but has less than 3% of the country's population.Ecuador's 1983 population was estimated at 8.2 million (45% urban) with a2.5Z rate of growth in the period 1974-1982.
Economic Situation
1.2 Ecuador entered the 1970s as one of Latin America's poorestcountries, but an unprecedented boom in the economy began in 1972,spurred by large oil exports. The discovery and exploitation of petro-leum in the Oriente initiated this boom in 1972. Ecuador became a memberof OPEC in 1973. From 1972 to 1978, real GDP growth averaged about 9%annually. However, the country became overwhelmingly dependent on oilrevenues and foreign borrowings. Between 1979 and 1981, GDP growthslowed to 5% p.a. because of the influence of the world economy, domesticpolitical uncertainty, stagnating export earnings, particularly for oil,and lower rates of domestic investment. In 1982, GDP growth fell to1.4Z, and declined by approximately 3.5Z in 1983. In 1984, reaL GDP grewby about 3.4% owing to the recovery of the agricultural sector from thefloods that ravaged the countryside in 1982-83. Per capita GDP in 1984was US$1,170.
1.3 Several problems that had been masked by high oil prices cameto the fore in 1983, as the shaky foundation of Ecuador's seeminglystrong balance of payments position became evident. Although thecountry's commodity exports increased from US$585 milLion in 1973 toUS$2,365 million in 1983, this was a reflection of rising world oilprices rather than an increase in the absolute volume of exports.Petroleum exports actually declined between 1973 and 1983 - from about71.85 MMbbl to about 49.83 HMbbl. Petroleum imports, on the other hand,increased from about 0.189 MNbbl in 1973 to 6.84 MMbbl in 1983. The oilbonanza, however, allowed Ecuador to borrow abroad to finance its current
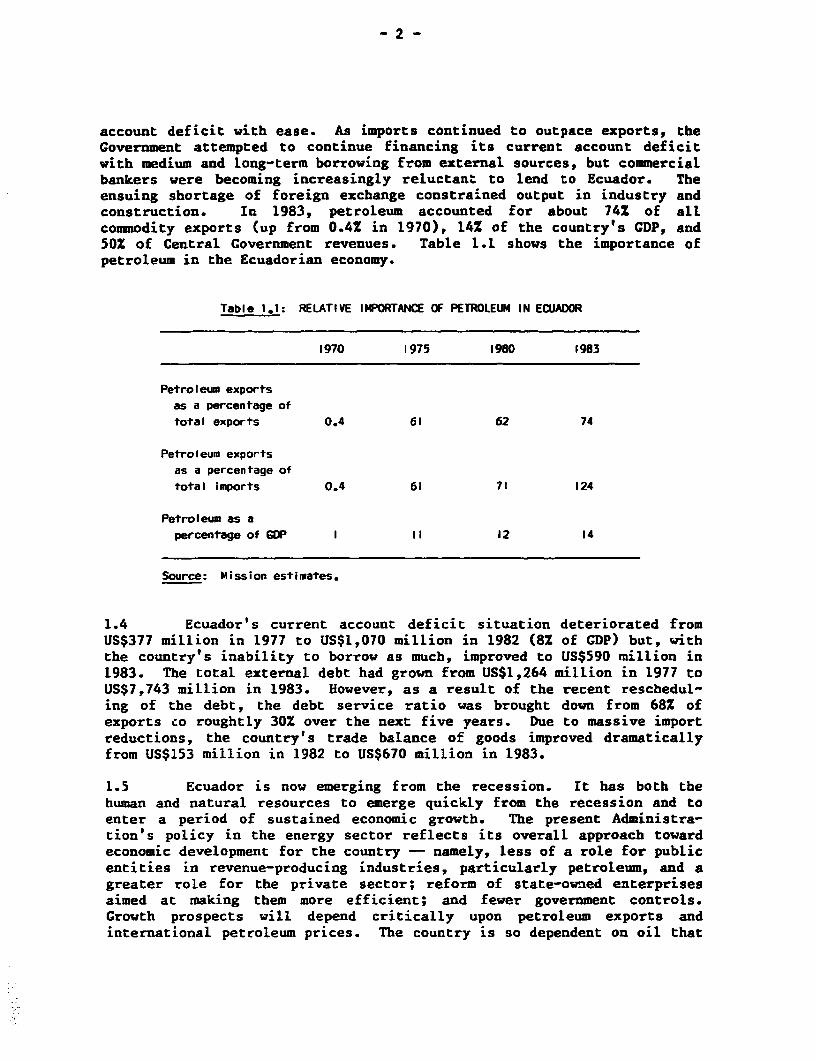
account deficit with ease. As imports continued to outpace exports, theGovernment attempted to continue financing its current account deficitwith medium and long-term borrowing from external sources, but commercialbankers were becoming increasingly reluctant to lend to Ecuador. Theensuing shortage of foreign exchange constrained output in industry andconstruction. In 1983, petroleum accounted for about 74% of allcommodity exports (up from 0.4% in 1970), 142 of the country's GDP, and50Z of Central Government revenues. Table 1.1 shows the importance ofpetroleum in the Ecuadorian economy.
Table 1.1: RELATIVE IMPORTANCE OF PETROLEUM IN ECUADOR
1970 1975 1980 1983
Petroleum exports
as a percentage of
total exports 0.4 61 62 74
Petroleum exports
as a percentage of
total imports 0.4 61 71 124
Petroleum as a
percentage of GOP I I1 12 14
Source: Mission estimates.
1.4 Ecuador's current account deficit situation deteriorated fromUS$377 million in 1977 to US$1,070 million in 1982 (8% of CDP) but, withthe country's inability to borrow as much, improved to US$590 million in1983. The total external debt had grown from US$1,264 million in 1977 toUS$7,743 million in 1983. However, as a result of the recent reschedul-ing of the debt, the debt service ratio was brought down from 68% ofexports co roughtly 30% over the next five years. Due to massive importreductions, the country's trade balance of goods improved dramaticallyfrom US$153 million in 1982 to US$670 million in 1983.
1.5 Ecuador is now emerging from the recession. It has both thehuman and natural resources to emerge quickly from the recession and toenter a period of sustained economic growth. The present Administra-tion's policy in the energy sector reflects its overall approach towardeconomic development for the country -- namely, less of a role for publicentities in revenue-producing industries, particularly petroleum, and agreater role for the private sector; reform of state-owned enterprisesaimed at making them more efficient; and fewer government controls.Growth prospects will depend critically upon petroleum exports andinternational petroleum prices. The country is so dependent on oil that

whatever happens to the volume of oil production, or to oil prices,overshadows developments in the rest of the economy. The devaluations ofthe sucre and the recent unification of the exchange rate are expected tobring about a major shift in relative prices, increasing the relativeimportance of petroleum in the economy.
Energy Resources
1.6 Ecuador is richly endowed with energy resources. Its longestknown resource is hydropower, (21,000 MW) of which less than 5% of thetotal potential has been developed. Hydrocarbon resources are repre-sented by about 1.5 billion barrels of oil (928 million proven and 586million probable) and about 550 BCF of natural gas (360 BCF non-associated gas in the Gulf of Guayaquil and 190 BCF associated gas in theOriente). Ecuador also has abundant forest resources in the thinlypopulated selva region.
Energy Balance, 1984
1.7 Petroleum is the main element in the Ecuadorian energy balance.In 1984, the domestic production .-f primary energy amounted to 14.8million toe, of which 91% was crude oil, 7% biomass and 2X hydropower.Two thirds of the petroleum production was exported in the form of crudeoil. Although the country's refineries processed 4.5 million toe ofcrude oil, the country had to import gasoline, diesel oil and LPG (atotal of 0.5 million toe), as a consequence of the imbalance between therefinery's production and domestic demand. At the same time, Ecuadorexported 1.1 million toe of fuel oil. Concerning final consumption;petroleum products met around 74% of the total final energy demand, whilebiomass accounted for 19% and electricity 7%. Table 1.2 shows a summaryof the estimated 1984 energy balance and a breakdown of the balance ispresented in Annex No. 1.
Table 1.2: SUMMARY ENERGY BALANCE, 1984(Thousand toe)
Biomass Oil Electricity Total
Domestic Supply 1002 13475 363 14840Exports a/ - (10057) (10057)Imports - 512 - 512De-and 1002 3930 363 5295
a/ It includes crude oil and petroleum products.
Sources: INE and mission estimates.
-4-
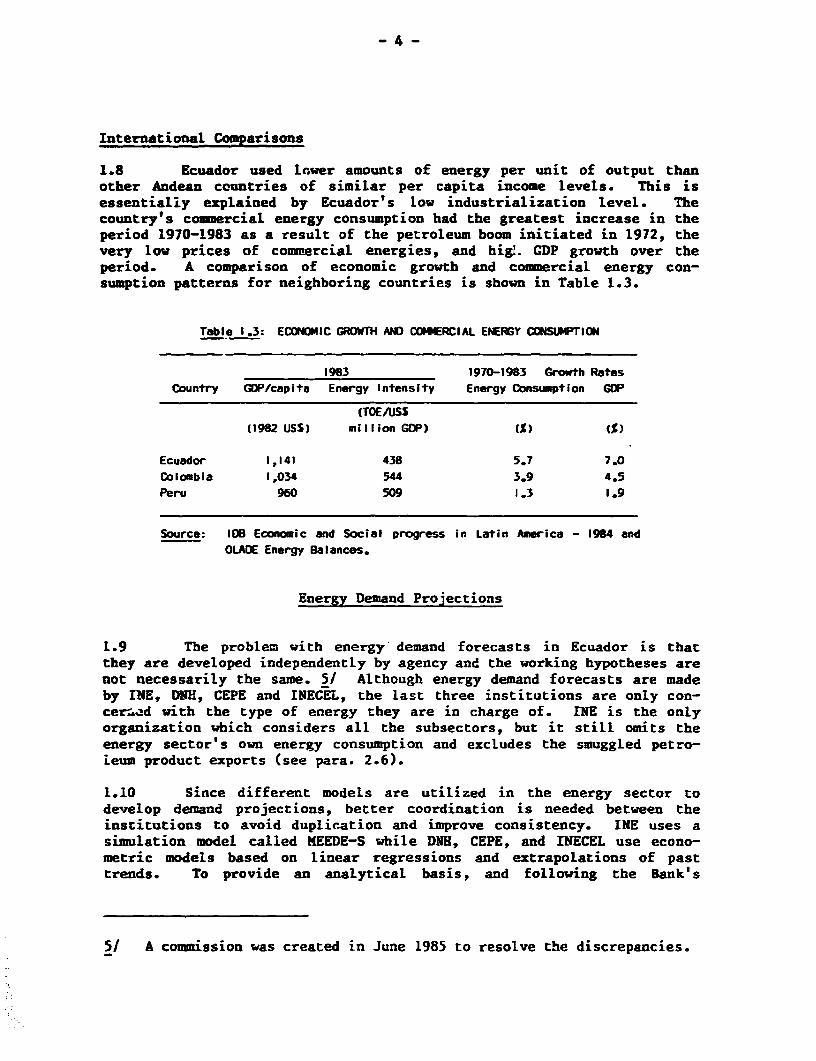
International Comparisons
1.8 Ecuador used lower amounts of energy per unit of output thanother Andean countries of similar per capita income levels. This isessentialiy explained by Ecuador's low industrialization level. Thecountry's commercial energy consumption had the greatest increase in theperiod 1970-1983 as a result of the petroleum boom initiated in 1972, thevery low prices of commercial energies, and higl. GDP growth over theperiod. A comparison of economic growth and commercial energy con-sumption patterns for neighboring countries is shown in Table 1.3.
Table I.3: ECONOMIC GROWTH AND COMMERCIAL ENERGY CONSUMPT ION
1983 1970-1983 Growth Rates
Country GDP/capita Energy Intensity Energy Consumption GDP
(TOE/USS
(1982 US$) milIion GDP) (M)
Ecuador 1,141 438 5.7 7.0
Colombia 1,034 544 3.9 4.5
Peru 960 509 1.3 1.9
Source: lDH Economic and Social progress in Latin America - 1984 and
OLADE Energy Balances.
Energy Demand Projections
1.9 The problem with energy demand forecasts in Ecuador is thatthey are developed independently by agency and the working hypotheses arenot necessarily the same. 5/ Although energy demand forecasts are madeby INE, DNH, CEPE and INECEL, the last three institutions are only con-cer-d with the type of energy they are in charge of. INE is the onlyorganization which considers all the subsectors, but it still omits theenergy sector's own energy consumption and excludes the smuggled petro-ieum product exports (see para. 2.6).
1.10 Since different models are utilized in the energy sector todevelop demand projections, better coordination is needed between theinstitutions to avoid duplication and improve consistency. INE uses asimulation model called MEEDE-S while DNH, CEPE, and INECEL use econo-metric models based on linear regressions and extrapolations of pasttrends. To provide an analytical basis, and following the Bank's
5/ A commission was created in June 1985 to resolve the discrepancies.
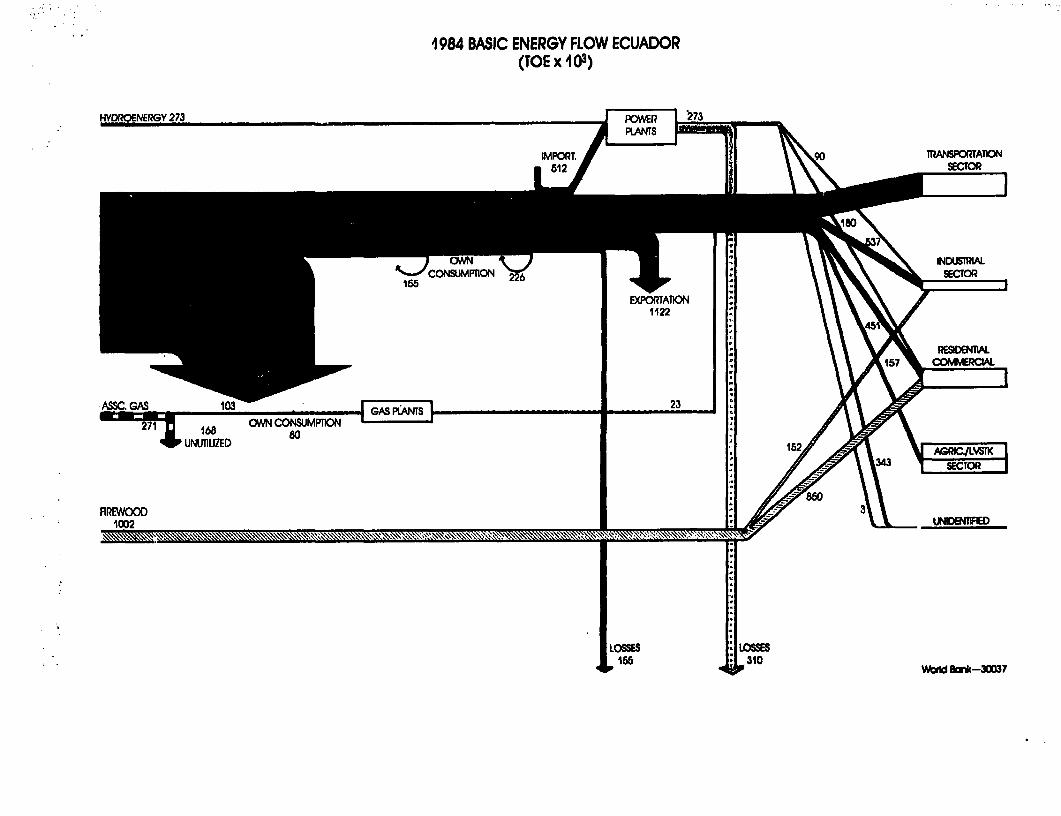
1984 BASIC ENERGY FLOW ECUADOR(TOE x 103)
IO2ROENERGY 273 _ _2,
IMPORT. TRANSPORTATION
512 SECTOR
OWN INDUSTRLAL
E)XPORTATKON1122
ASSC. GAS 103 23
27i 168 OWN CONSUMPTION L..-J
_UNUTIUZED Me8-
FIREWOOD1002 \ d2Ž>>>$ P\ L. UNIDENTFED
LOSWES : LOSES166 : S 310 td B*-30037
-5-
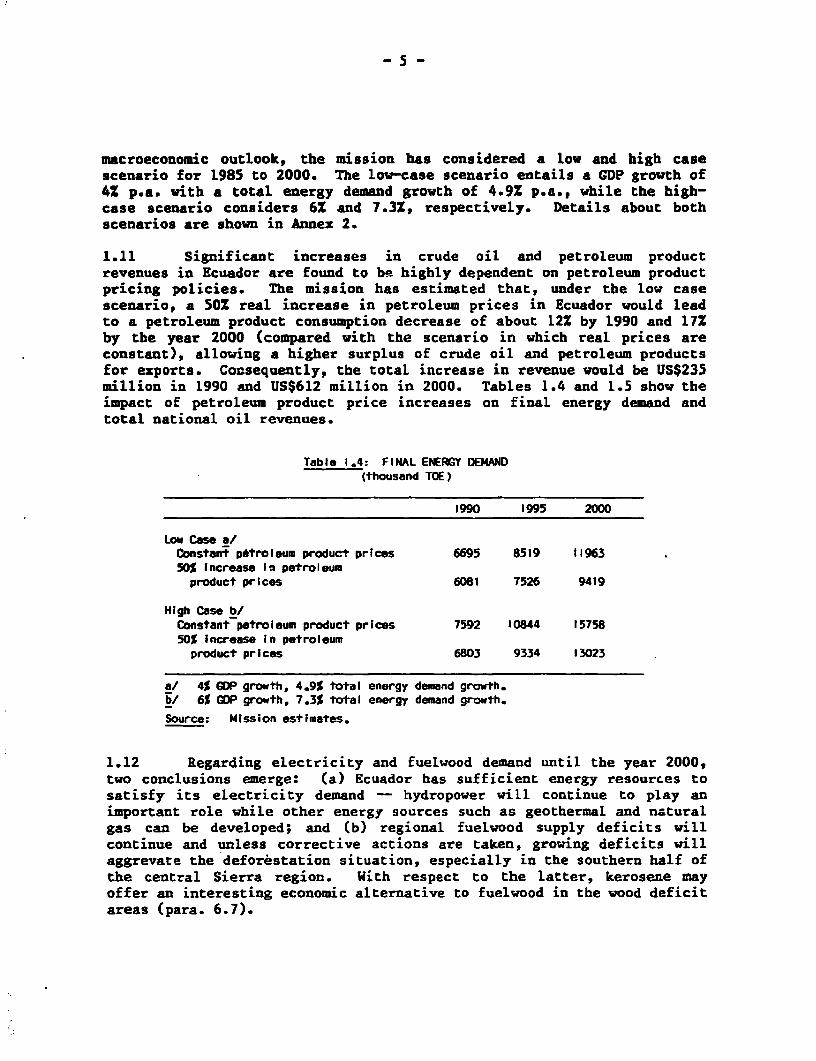
macroeconomic outlook, the mission has considered a low and high casescenario for 1985 to 2000. The low-case scenario entails a GDP growth of4X p.a. with a total energy demand growth of 4.9Z p.a., while the high-case scenario considers 6Z and 7.3Z, respectively. Details about bothscenarios are shown in Annex 2.
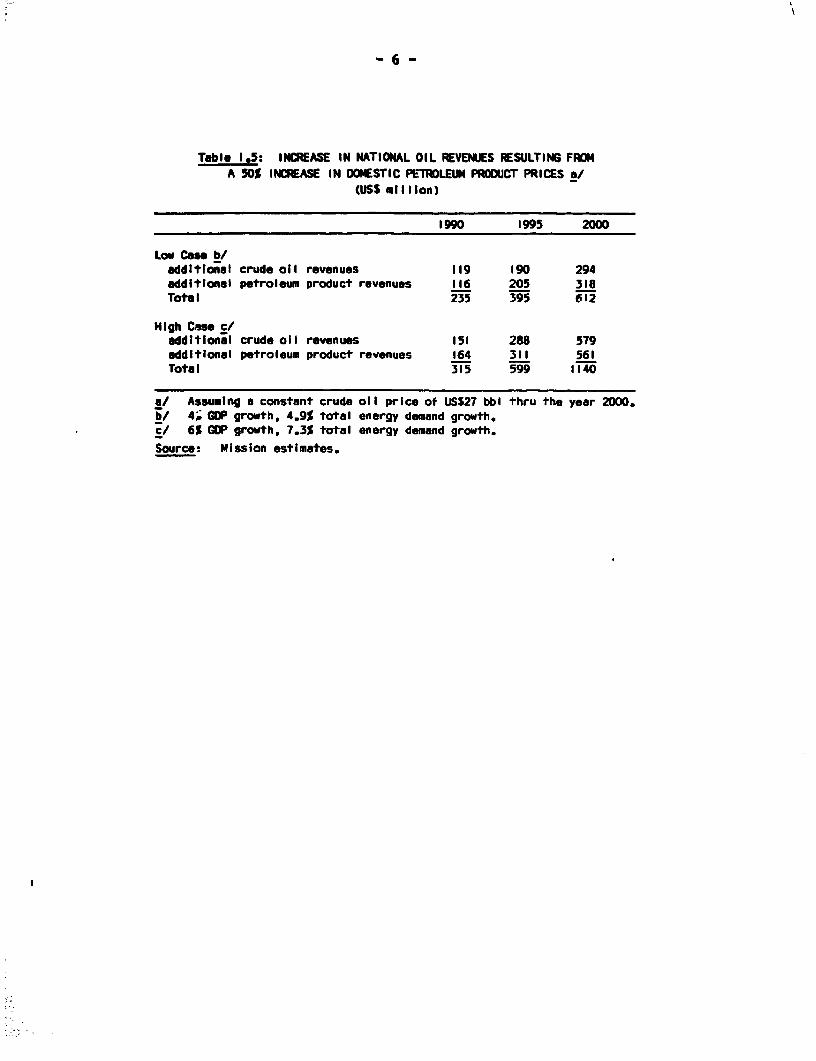
1.11 Significant increases in crude oil and petroleum productrevenues in Ecuador are found to be highly dependent on petroleum productpricing policies. The mission has estimated that, under the low casescenario, a SOZ real increase in petroleum prices in Ecuador would leadto a petroleum product consumption decrease of about 12% by 1990 and 17%by the year 2000 (compared with the scenario in which real prices areconstant), allowing a higher surplus of crude oil and petroleum productsfor exports. Consequently, the total increase in revenue would be US$235million in 1990 and US$612 million in 2000. Tables 1.4 and 1.5 show theimpact of petroleum product price increases on final energy demand andtotal national oil revenues.
Table 1.4: FINAL ENERGY DEMAND(thousand TOE)
1990 1995 2000
Low Case a/Constant petroleum product prices 6695 8519 1196350% increase in petroleumproduct prices 6081 7526 9419
High Case b/Constant petroleum product prices 7592 10844 1575850% Increase in petroleum
product prices 6803 9334 13023
a/ 4% GDP growth, 4.9% total energy demand growth.b/ 6% GDP growth, 7.3% total energy demand growth.Source: Mission estimates.
1.12 Regarding electricity and fuelwood demand until the year 2000,two conclusions emerge: (a) Ecuador has sufficient energy resources tosatisfy its electricity demand -- hydropower will continue to play animportant role while other energy sources such as geothermal and naturalgas can be developed; and (b) regional fuelwood supply deficits willcontinue and unless corrective actions are taken, growing deficits willaggrevate the deforestation situation, especially in the southern half ofthe central Sierra region. With respect to the latter, kerosene mayoffer an interesting economic alternative to fuelwood in the wood deficitareas (para. 6.7).
-6-
Table 1.5: INCREASE IN NATIONAL OIL iREVENUES RESULTING FROMA 50% INCREASE IN DOMESTIC PETROLEUiM PRooUCr PRICES a/
(USS million)
1990 1995 2000
Low Case b/additional crude oil revenues 119 190 294additional petroleum product revenues 116 205 31JTotae 235 395 612
High Case csadditional crude oil revenues 151 288 579additional petroleum product revenues 164 311 561Total 315 599 1140
a/ Assuming a constant crude oil price of USS27 bbl thru the year 2000.b/1 4, GOP growth, 4.9% total energy demand growth.c/ 6% GOP growth, 7.3% total energy demand growth.Source: Mission estimates.
-7-
II. MMHDCY DEIAND N9UAUNKCET
Energy Pricing
2.1 In a mixed economy such as Ecuador's, energy pricing is themost important policy instrument available to encourage energyconservation and appropriate fuel choices. The energy pricing policy inEcuador which relies heavily on subsidies does not provide the rightsignal for efficient use of energy resources. This results in twonegative effects in the country. The first refers to the absolute pricelevel which determines the income of CEPE and INECEL and their capabilityto remain in business (paras. 3.34 - 3.36). The second relates to therelative prices of the various energy forms which must be structured soas to give the right incentive to shift demand towards the more economicsources (paras. 2.13 - 2.40).
2.2 In the opportunity cost analysis, fuelwood used in thehousehold sector is the most economic source of energy, as shown inTable 2.1. However, when the energy efficiency correction factor istaken into account, kerosene and Low octane gasoline are the mosteconomic while fuelwood is about twice as expensive as kerosene. Even ifkerosene is subsidised it remains the best option to Ecuador incomparison with fueLwood produced by reforestation. In the transportsector, diesel oil is the most economic source of energy, followed byregular and premium gasoline. With respect to the industrial sector,fuel oil is the most economic source of energy! followed by diesel oiland kerosene, while electricity is two and a half times more expensivethan fuel oil.
Petroleum Products
2.3 Domestic pricing of petroleum products is one of the mostsensitive political questions in Ecuador. Past increases have led toriots and general strikes. Therefore, petroleum pricing policy in thepast has involved heavy subsidies, with the prices of petroleum productsin Ecuador being among the lowest in the world. From 1959 to early 1981prices remaining unchanged (in absolute sucres). Since then, the Govern-ment has moved cautiously toward a more realistic pricing policy. Theweighted average for all products nas increased from 37Z of internationalprices in 1983, to 40% in 1984, and to 50% in 1985 as a consequence ofthe latest price increase in December 1984. Table 2.2 shows the retailprices and opportunity tosts of petroleum products as of January 1985.
-s ~ ~ ~ ~ ~ ~ 8
Table 2.1: COWARISCN OF ENERGY PRICES IN ECUADOR, JANUARY 1985
Efficiency Relationship toOpportunity Correction Cost of Useful Cheapest Fuel
Cost Factor Energy in the Sector
CUSS/toe) (M) (USS/toe)
Household SectorElectricity 1,128 40 2,820 2.63Fuelwood a/ 117 5 2,340 2.18Charcoal 302 15 2,013 tJ8aLPG 291 25 1,164 1.09Kerosene 269 25 1,076 1.00Gasoline 268 25 1,072 1.00
Transport SectorGasoline 268 20 1,340 1.29Diesel Oil 260 25 1,040 1.00
Industrial SectorElectricity 663 80 829 2.48Diesel Oil 260 50 520 1.56Kerosene 269 50 538 1.61Fuel Oil 167 50 334 1.00
a/ Based on investment of USS2.6 mill¶pn/year with no return for 15years, Plantation productivity 7.5 m /ha per year, 9,000 ha plantedand 12% of capital cost.
Source: INE, CEPE and mission estimates.
Table 2.2: PETROLEUM PRODUCT RETAIL
PRICES AND OPPORTUNITY COSTS
JULY 1985
Share of Retail Opportunity RetailFuel 1984 demand Prices Cost Prices
(S) (S/gal) (S/gal) as S of oppor-tunity cost)
Gasoline a/Premium 1.3 0.67 0.83 81Regular 31.7 0.52 0.83 63
Diesel Oil 22.5 0.41 0.85 48Jet Fuel 3.4 0.26 1.32 20Fuel Oil 24.9 0.26 0.47 55Kerosene 7.9 0.14 0.84 17LPG 6.3 0.22 0.66 33
Weighted Average 100.0 0.369 0.735 SO.2
a/ The same opportunity cost is used because Ecuador imports only regulargasoline and obtains premium and low-octane by mixing in the country.
Source: CEPE; and mission estimates.
-9-
2.4 The legal basis for official price setting of petroleum pro-ducts represents a major problem for the Government. The Hydrocarbon Lawlimits these prices to covering only the costs of production and distri-bution. These are obvious flaws in this arrangement in that no con-sideration is given to opportunity costs, nor does the law includedepletion allowance as a cost component. Moreover, increasing productprices by taxing sales at the retail level is apparently not possibleunder the law (para. 3.29).
2.5 The mission has estimated that explicit and implicit subsidiesin the domestic sale of petroleum products total more than US$600 millionper year (23Z of Ecuador's commodity exports and 5% of GDP). In 1984 thedirect subsidy (losses occurred by CEPE), defined as the cost of importedproducts minus their retail prices, amounted to around US$93 million andthe implicit subsidy, defined as the opportunity COSL minus the retailprice, amounted to almost US$515 miliion. Table 2.3 shows the estimatedsubsidies for 1984.
2.6 Low petroleum product prices in Ecuador also have allowed thedevelopment of illegal activities in th2 domestic market 6/ and largescale smuggling of these products in the direcLiua of neighboring coun-tries. In 1984, INE estimated that about 360,000 toe of petroleum pro-ducts were illegal exports to Colombia and 'e?u. INE estimates that thevolume of these illegal petroleum product exports represents two-thirdsof those imported by Ecuador and about 101 of Ecuador's total consump-tion. Due to domestic subsidized product prices, the financial loss wasestimated at US$57 million in 1985, or 61% of Ecuador's direct subsidy(see Annex 3).
Recommendations
2.7 To obtain a rational pricing policy in the petroleum subsector,the mission recommends that:
(a) The Ecuadorian Government adopt the concept of opportunity costas the pricing principle for all petroleum products, withprices pegged to the dollar and increased gradually at a ratehigher than internal inflation.
Taking into consideration the internal constraints (para. 2.3) thatprevent the policy implementation mentioned in (a) above, some parallelactions are recommended by the mission.
61 Mixing of low octane gasoline with regular gasoline in the transportsector and kerosene with diesel oil in the industrial sector.

- 10 -
Table 2.3: ESTIMATE OF PETROLEUM PR0DUCT SUBSIDIES IN 1984
1. Direct Subsidy: (Cost of Imported products less retail price).
Cost Quantities
of Imports a/ Retail Price Difference Imported Subsidy
($/gal.) (S/gal.) (S/gal.) (IOP gal.) (lop USS)
LPG 0.67 0.22 0.45 31.4 14.3
Rag. Gasoline 0.78 0.31 0.47 91.1 42.8DIesel Oil 0.86 0.22 0.64 53.0 33.9Total 175.5 93.4
2. Implicit Subsidy: (opportunity cost less retail price).
Opportunity Volume
Cost a/ Retail Price Difference of Sales b/ Subsidy
(S/gal.) (S/gal.) (S/gal.) (100 Gal.) (I0° USS)
GasollnePremium 0.78 0.41 0.37 12.2 4.5Regular 0.78 0.31 0.47 296.9 139.5Low-Octane 0.78 0.21 0.57 18.7 10.7
LPS 0.67 0.;2 0.45 59.0 26.6Kerosene 0.85 0.14 0.71 74.0 52.5Jet Fuel 1.33 0.26 1.07 31.8 34.1Diesel O I 0.86 0.42 0.64 210.7 134.9Fuel Oil 0.6! 0.13 0.48 233.2 111.9Total 936.5 514.7
a/ All costs except fuel oil are CIF Guayaquil plus inland storage and
distribution costs.
b/ Excluding Imports.
Source: MRNE; CEPE; and mission estimates.
(b) Since the strongest opposition to petroleum price increases iscoming from the users of public transport, the COE should studythe implementation of a subsidized system which would permit itto maintain public transport fares at a low level while raisingthe price of gasoline to its opportunity cost.
(c) In order to avoid the fraudulent blending of kerosene withdiesel oil and low octane gasoline with regular gasoline, adifferent coloring agent should be added to kerosene and theproduction of low-octane gasoline should be discontinued.
- 11 -
Residential users should utilize kerosene as the substitute forlow-octane gasoline.
Electricity Tariffs
2.8 The level and structure of Ecuador's electricity tariffs do notreflect the real cost of this public service. The mission has estimatedthat marginal costs for the electric sector vary between USC9.7IkUh andUSC5.7/kIh according to voltage level, compared to an average tariff ofUSe3.4/kfh. Consumer tariffs are structured by blocks and each of the 16INECEL subsidiaries has a different tariff level. The main difference isbetween the Sierra and the Coast. Except for kWh and kW charges forblock deliveries and some industrial users, all tariffs are on a straightkWh basis with no allowance for peak/off-peak costs. Table 2.4 comparesaverage bills in the Sierra with those in the Coast.
Table 2.4: COMPARISON OF AVERAGE BILLSIN THE SIERRA AND THE COAST
Sierra Coast(USf,kWh) (USF/kWh)
Residential RatesR-1 (60 kWh/month) 1.1 1.7R-2 (200 kWh/month) 3.6 4,2
Coumercal8 RatesC-1 (60 kWh/month) 1.8 2.1C-2 (350 kWh/month) 4.0 4.2C-3 (2000 hours/year) 4.7 4.7
Industrial Ratesi-i (10 kW) 3.2 3.81-2 (50 kW, 2000 hours/year) 3.7 4.01-3 (a - 2400 hours/year) 4.1 4.4
lb - 48O0 hours/year) 3.5 3.8(c - 5500 hours/year) 3.3 3.6
Source: INECEL.
2.9 INECEL's tariffs are exceedingly low when compared to marginalcost. As a first preliminary step to tariff analysis, marginal costswere estimated for INECEL's system. Reference tariffs based on marginalcosts yield the values shown in Table 2.5. At high voltage levels,capacity charges are 202 of marginal costs, peak energy charges 25Z, andoff-peak energy charges 59%. At medium voltage levels, peak energycharges are half while off-peak energy charges are about equal tomarginal costs. At low voltage levels energy charges are about 40X ofmarginal costs. Annex 4 shows the marginal cost and tariff analysisprovided by the mission.
- 12 -
Table 2.5: ELECTRICITY REFERENCE TARIFFS BASED ONMARGINAL COSTS ANALYSIS
EnergyPeak Off-Peak Capacity
(USf/kWh) (SAW per year)
(a) Double meter consumers:
HV block sales 6.4 2.7 119MV loads 6.7 2.8 164
Eneg(b) Single meter consumers: US AWh
Industry 5.7Commercial off-peak users 5.5Low Voltage users a/ 9.7
a/ Mainly residential.
Source: INECEL and mission estimates.
2.10 It appears that the substantir' readjustments to tackle thepresent tariff distortions would be difficult to implement in the shortterm due to political constraints. Tariffs based on marginal costanalysis would provide a pricing signal that correctly reflects to theEcuadorian economy the cost of developing additional hydro and trans-mission lines. However, such a measure can only be taken as part of anational energy strategy that would bring substitute fuel costs (fueloil, diesel) in line with their opportunity costs; otherwise, there wouldbe perverse incentives to continue using present thermal facilities atsubsidized fuel prices instead of replacing them with INECEL's hydro-plants.
2.11 A more feasible approach to implementing a tariff reform seemsto be based on gradual increases. Present pLans for tariff adjustmentscall for raises of 2% per month in nominal (sucre) terms. Due to certaincategories that are excluded from this raise, the real rate of increaseis about 1.8Z per month (24% per year). If a target date (Jan. 1989) isset to reach marginal cost levels, rate increases in real terms wouldhave to average around 2.6Z per month for residential users and 1.5% formedium voltage supplies. Given that inflation is assumed to be at least16% per year, the nominal monthly increases would have to be 3.9Z and2.4%, respectively. Tariff reforms should be seen as a concerted effortto seek efficiency within the energy sector as a whole. If consumerrates are readjusted without readjusting block sales tariffs, end-useconsumption would presumably become more efficient but the extra incomewould only benefit INECEL's subsidiaries and wouldn't reach thegeneration level that requires most of the investment.

- 13 -
Recommendations
2.12 To obtain a rational pricing policy in the power subsector, themission recommends that INECEL take the following actions:
(a) Adjust power rates gradually towards their long run marginalcost level, by means of periodic increases at a rate higherthan internal inflation.
(b) Seek to unify consumer tariffs insofar as (i) utilities areinterconnected with INECEL's main grid and (ii) costdifferences between utilities at the subtransmission andIistribution level are not significant.
(c) Introduce double metering for larger industrial and commercialusers connected at MV levels, eliminating present blockstructures.
Energy Conservation and Substitution
The Structure of Energy Demand
2.13 In 1984, Ecuador consumed 4.5 million toe of energy. Percapita energy consumption was 533 kgoe, compared with a world average of1,500 kgoe and an average for Latin America of 1,000 kgoe. Petroleumproducts met 72X of to.al demand, electricity 6Z, and biomass 7/ theremaining 22% (see para. 1.6).
2.14 Commercial energy consumption amounted to 3.46 million toe inL984, represented by: gasoline 35%, fuel oil 20%, diesel oil 18%, otherpetroleum products 19%, and electricity 8%. The transport sector is themost important consumer of commercial energy (50%), followed by industry(18Z) and households (18%).
2.15 Biomass energy consumption in Ecuador totaled one million toein 1984, represented by fuelwood 85% (including a minimal amount ofcharcoal), and bagasse 15%. Fuelwood accounted for 57% of the energyconsumption in the household sector and bagasse supplied 20Z of theenergy consumption in the industrial sector.
The Household Sector
2.16 Energy Consumption. The household sector consumes about athird of all the energy used in Ecuador and its share remained roughlyconstant over the 1979-1984 period. The most important source of energy
7/ Fuelvood, bagasse and charcoal.
- 14 -
for the sector is fuelwood, which supplied 57% of the total in 1984,followed by petroleum products 302, 8/ and electricity 13Z. Kerosene isthe second most important source of energy for the household sector inEcuador, although its contribution is dropping, and that of LPG andelectricity is increasing.
2.17 Urban Sector. The urban sector has to a great extent switchedover to modern fuels; only an estimated 140,000 toe of fuelwood wasconsumed in 1984. This .represents about 10 of the total householdenergy consumption while the urban population makes up about one-half ofthe total population. The best conservation initiative consists ofraising prices for the modern fuels; however, the price increases shouldtake into consideration the impact on fuelwood demand - particularly onthe diminishing tree resources surrounding urban areas.
2.18 Rural Sector. The rural sector relies primarily on fuelvood asthe household energy source. Although it has been estimated by INE that42% of all the rural households now have a stove capable of burning kero-sene or low octane gasoline, free collection of wood and cultural biaseshave inhibited widespread implementation thus far. Given the pervasiveuse of fuelwood and the long-run supply problems to be faced,conservation of this resource should be pursued further. Since woodstoveimplementation programs have had difficulties, a critique of pastprojects must be realized now in order to properly direct the program.
The Industrial Sector
2.19 Structure of the Sector. The Ecuadorian industrial sector isa relatively small component of the country's economy. Ecuadorianindustry is characterized by predominantly light and small manufacturingactivities and contributed only 17% to the GDP in 1982. Majorindustries, by value added in L982 are: food, beverage and tobacco(47%); textiles (21%); and mineral products (11.0%); followed by smallercontributors such as: paper and printing (5X); wood products (5) andchemicals (5%). More than 80Z of manufacturing employment and valueadded in industry is located in the Provinces of Guayas and Pichincha.Past development plans called for rapid industrialization, but thecurrent outlook is not as optimistic as it was during the oil boom in the1970s.
2.20 Energy Consumption. In 1984, the industrial sector was thethird largest consumer of energy in Ecuador (17%), after the transportand household sectors. Major consumers of energy are the agroindustries(42Z) and the mineral industries (25Z) (mainly cement). DNH assigns aquota of petroleum fuels to industrial consumers as a measure to avoidexcessive consumption of subsidized petroleum.
8/ Kerosene 15Z, LPG 9%, and low octane gasoline 3%.
- 15 -
2.21 As a consequence of the sharp increase in petroleum supply inthe early 1970s and low domestic prices, the share of petroleum productsused in industry increased from 501 in 1970 to 681 in 1984. Parallelingthis evolution, the share of non-commercial energy in industry fell from42Z in 1970 to 20% in 1984. Electricity oscillated in the range of 7Z to12% during the same period. The heavy dependence of the industrialsector on hydrocarbons is reflected in the fuels utilized: fuel oil(43Z), diesel oil and kerosene (25%), bagasse (20%) and electricity(12Z). Table 2.6 shows energy consumption by select industries inEcuador.
Table 2.6: ESTIMATED ENERGY CONSUMPTION OFSELECTED INDUSTRIES IN ECUADOR, 1984 (KTOE)
. .. Diesel FuelIndustry Bagasse Electricity LPG Kerosene Oil Oil
CementLCN - 13.9 - - - 157.3Selva Alegre - 4.7 - - n.a. 32.0Chiiborazo - 3.0 - - n.a. 32.7
Sugar -
San Carlos 34.0 - - - n.e. 0.9Valdez 29.2 - - - n.a. 3.0Aztra 24.1 - - - n.a. 1.3
TextileContinental - 0.2 - - 0.2 1.1
OtherCRI0ESA (glasscontainers) - 1.9 1.3 3.0 0.1 5.8
INCASA (paper) - 0.4 - 0.6 0.6 3.3ANDINA (brewery) - 0.01 - - 0.002 0.2
a/ Includes 150 t/d cement capacity based on wet process.b/ 1983 data.
Source: Mission estimates and DECON study.
2.22 Possibilities for Encrgy Conservation. Mission visits toselected plants representative of the cement, sugar, textiles food andbeverage and other industries suggest that there is considerable room forincreasing efficiency in the use of commercial and biomass fuels inEcuadorian industry. Although pricing remains the essential tool inconservation, specific cases have shown that with modest investments --mainly in the form of expert advice at the plant, considerable amounts ofenergy could be saved.
2.23 The two major consumers of petroleum products are refineriesand cement industries. Changes in refinery operations could save diesel
- 16 -
oil used in fuel oil dilution by consuming mostly residual oil at highertemperatures. Potential savings of 20 ktoe per year (roughly US$3.9million per year at US$27 per bbl.) could be achieved with an investmentrequirement of US$4 million. 9/ Cement industries have a range of fueloil conswr tion in their kilns of 850-1300 kcal/kg-clinker. Overall, ifthe energy consumption of the three largest cement companies (96X oftotal output) could be reduced to 850 kcal/kg-clinker, savings of about28 ktoe could be achieved. Typical investment requirements are aroundUS$300/toe/year; thus, the above savings require some US$8 million. Themission analysis also suggests an opportunity to save fuel oil in theChimborazo cement plant (150 tpd) by discontinuing the energy intensivewet process.
2.24 With regard to steam raising for industrial purposes, byreducing the direct use of diesel oil/kerosene as a boiler fuel and afuel oil dilutant, a potential saving of 116 ktoe per year (roughly US$22million per year at US$27 per bbl.) could be achieved with an investmentrequirement of US$11.6 million. 10/ A high potential exists (about 192MW) for replacing diesel in power generation with hydro in Cuayaquil, andits implementation will be carried out by INECEL within the next fiveyears.
2.25 The major consumers of biomass fuels in Ecuadorian industriesare the sugar mills. The operating regime of the mills depends on theavailability of. cane, and therefore of bagasse, and on equipmentfailures. Since there are practical uncertainties associated with bothfactors, fuel oil is employed as a backup fuel. By reducing fuel oilconsumption in sugar mills to 0.1 gal/ton of sugarcane through (a) theuse of surplus bagasse resulting from an improved cane supply, (b) burn-ing dryer bagasse, and (c) improving the bagasse boiler, a potentialsaving of 4.7 ktoe per year (roughly US$1 million per vear at US$27 perbbl.) could be achieved with an investment requirement ranging fromUS$3.3-5.8 million. ll/
The Transport Sector
2.26 Highways are the predominant and fastest growing mode of trans-port in Ecuador. The extension of paved roads is about 6,000 km with atotal highway network, including gravel and earth roads, of about 35,000
9/ Estimated at 151 of petroleum fuels used by the refineriesthemselves at US$200/toe.
10/ Estimated at 40Z of diesel/kerosene fuels used in industry withminimum investment (US$100/toe).
11/ Range estimated on the basis of the cash flow generated by thesavings of fuel, for project lifetimes of 10-20 years, discountrates of 12-20% p.a.
- 17 -
km. Water transport (mainly maritime) is the second largest mode oftransport, and rail transport is of limited significance and has beendeclining. As a net oil exporter, Ecuador moves the bulk of its crudeoutput via the Transecuadorian pipeline.
2.27 Reliable vehicle fleet statistics are lacking in Ecuador. Itis estimated that the vehicle fleet grew at 12% per annum during 1972-1982, to about 264,000 vehicles by 1982. Light vehicles seem to predomi-nate, accounting for almost 90% of the fleet. Heavier vehicles areevenly split between buses and trucks, each with approximately 5Z of thetotal fleet. Most of the vehicles (65-70%) are registered in theprovinces of Pichincha and Guayas.
2.28 Energy Consumption. The transport sector is the single mostimportant user of energy in Ecuador (consuming 1751 ktoe in 1984).Liquid fuels used in transport consumed 502 of commercial energy and 54Zof total liquid hydrocarbon fuels. It is estimated that road transportconsumes 66% of the energy used by the sector (gasoline 86Z and dieseloil 14Z), waterways 23%, air transport 72, the pipeline 3%, and therailway system 1%.
2.29 Energy consumption in road transport is dominated by freighttransport (including pipelines) with 43% of total volume, light vehicles(predominantly for private passenger transport) with 29Z, buses wiLh L9%(interurban 13%, urban 6Z) and taxis with 9Z. Overall public passengertransport (taxis plus buses) consumed 28% of the total volume of fuelused in the transport sector.
2.30 Energy Conservation Possibilities. Energy conservation in thetransport sector can be attained in two ways: (a) through inter-fuelsubstitution, and (b) by increasing the efficiency of the transportsystem.
2.31 Substitution of Diesel Oil for Gasoline. Dieselization oftransport in Ecuador is very limited compared with what it would be ifthe prices of gasoline and diesel oil reflected their econouic value andthe higher efficiency of diesel engines were recognized. Analyses ofprospects for intensified dieselization of the Ecuadorian vehicle fleethave been conducted by INE under various technical cooperacion programssuch as with the EEC and the French Energy Agency (AFME).
2.32 The INE/EEC study revealed that savings of 14-35% in thetransport sector could be achieved during 1981-2000 by adopting variousmeasures of energy conservation, including dieselization. The studyanalyzed two scenarios: (a) a high consumption case based on a "statusquo" situation and (b) a low consumption case which includes intensifieddieselization and other measures. Details about this study are presentedin Annex 5.

- 18 -
2.33 The INE/AFME study suggests that the structural changes in thevehicle fleet in the low consumption scenario - essentially a diesel-ization of the gasoline-fueled fleet - have very strong economicmerit. The highest IRRs are obtained for the public passenger transportfleet (microbus and bus) at 59Z per year; trucks follow with an IRR of39-50Z per year, and taxis showed the lowest IRk with 21% per year.Table 2.7 shows details on-the economics of dieselization.
Table 2.7: ECONOMICS OF DIESELIZATION(Switching from gasolIne to dIesel powered vehicles)
Vehicle Vehicle Annual Incremental NPV atType Lifetime Mileage Capital Cost 20% p.a. iRR
(months) (km) US (USS) (: p.m.)
Taxi 84 51,600 900 16 20.6Microbus (Buseta) 120 57,600 2,000 3,075 58.8Bus 120 57,&)0 2,700 4,123 58.6AverageTruck 120 57,600 1,800 1,232 38.6HeavyTruck 108 63,360 2,700 2,929 49.5
Source: French Energy Agency (AFME) study and uission estimates.
2.34 Substitution of CNG for Gasoline and Die.sel Oil. Compressednatural gas could play a small but important role in gasoline and dieseloil conservation in Ecuador in the future (see para. 4.7). The gasnetback value and NPV of a potential project to convert some 3,500 publictransport vehicles (taxis and buses) in GuayaquiL confirmed, on apreliminary basis, the economic merits of the concept. The INEW/FMEstudy also suggested that a limited experimental program for CNG intransport could begin based on associated natural gas from the Oriente.This would expedite the CNG learning process in Ecuador, therebyfacilitating the implementation of any future CNG transport program at alater date, such as the prospective Guayaquil project.
2.35 Substitution of Electricity for Liquid Fuels in Transport. Theidea of implementing electric urban transport systems in Guayaquil andQuito has been discussed for some time. Interest in these schemes islikely to be rekindled as new hydroelectricity capacity becomesavailable. Analysis conducted under the auspices of INE correctlyassesses these schemes by indicating that the liquid fuel savingsachieved would not justify the high investment required. Uncertaintiesand obstacles to electrification of urban transport in Ecuador include:the electricity tariff, the high capital cost and foreign exchangerequirements, and the current socioeconomic organization of publictransport in Guayaquil and Quito. Consequertly, electrification of urbantransport systems in- Ecuador does not seem to be a priority item in thecountry's list of energy initiatives.
- 19 -
2.36 Increasing Transport Systems Efficiency. The currentdisorganized system of predominantly individual operators, along withother factors, is not conducive to energy efficiency in transport. Theproper coordination of transport companies would result in more efficientenergy use.
2.37 Freight Transport System Management. Measures to promote back-hauls should be implemented through systems for gathering and dissemi-nating freight information which could involve a clearinghouse of freightneeds in Ecuador, and to other countries. Freight consolidation termi-nals could also be implemented in Ecuador to improve freight load manage-ment. Thus, the current capacity utilization of freight transport wouldincrease from 5OZ (i.e. empty back-hauls) to a more energy/economicallyefficient level of at least 7OZ.
2.38 Public Transport System Management. Besides the coordinationproblem mentioned above, the public transport system is characterized bygasoline fueled and low unit capacity buses. These should be replaced byhigh unit capacity buses operating with high loads and using dieselfuels. Another measure which could improve system efficiency is in busdesign improvements. New bus body designs could include: 12/ (a) lessweight with new, lighter materials; (b) two doors, as opposed to thesingle door bus design which currently predominates in the fleet;(c) more room for passengers to move in and out of the bus; and (d) afixed seat for the fare collector, and the introduction of fare collec-tion by a person other than the bus driver.
2.39 Rationalization of urban and inter-urban passenger trafficcould contribute much to improving energy efficiency in the publictransport sector. This could be accomplished through a combination ofinitiatives, such as: (a) service planning, including better routeplanning; (b) extension of the staggered working schedule that alreadyproved its worth with civil servants' single work journey, to otherworkers' categories; (c) promotion of shift from private to publictransport by offering a better service to middle class residentialdistricts/suburbs, charging higher tariffs, if necessary; (d) promotionof a certain measure of standardization of private passenger vehicles,including energy efficient vehicles, via import duty discrimination andother measures; (e) recovery of urban congestion costs via parkingcharges, zonal fees, etc.; (f) prohibition of private passenger trafficin certain urban areas (e.g. core of major cities) and other physicalrestrictions of traffic; and (g) improvement in toll gate operations(e.g. higher tolls or no tolls to avoid traffic congestion).
12/ In this context the experience of the double deck buses operated bythe municipality of Quito should provide useful information.
- 20 -
2.40 Another measure to increase energy efficiency in freight andpublic transport relates to improved maintenance of equipment. A com-bination of well equipped, well staffed repair shops jointly utilized byvarious companies or cooperatives should be implemented.
Recommendations
2.41 Besides changes in the pricing policy, the mission considersthat the GOE should take the following actions to optimize energy use inEcuador:
Household
(a) Analyze and compare the relative merits of (i) subsidizingkerosene and (ii) a reforestation program for energy purposes.
Industry
(a) Revise the current quota system provided by DNH for petroleumfuel consumers. The revision should be based on energy auditsof requesting industries conducted by accredited organizationsand supervised by INE.
(b) Finance energy conservation audits and energy measuring andsavings equipment via national and multilateral sources.
(c) The Ministry of Industry should use the results obtained in theaudits in order to assign the benefits included in the Ley deFomento.
(d) Promote the Non-Conventional Energy Resources Law whichcontains fiscal and credit measures for the financing of energysavings and conservation.
(e) Review INE's role and past efforts in industrial energyconservation to reorient its training efforts toward directservices to industry, and assess its promotional campaign tofully and effectively utilize its resources.
Transport
(a) By using fiscal, credit, and other regulatory measures, promotestructural changes in fleet composition favoring end-use energyefficiency in transport, improve freight system organizationand management, improve public transport system organizationand management.
(b) Improve institutional coordination and execution of energyefficiency measures in the transport sector, among theProvincial Councils, MOP, DNH, INE and other bodies involved.

- 21 -
III. PETROLEUM
Background
3.1 The key issues in the petroleum subsector for Ecuador are:declining oil reserves, establishing an appropriate development andproduction strategy, the supply/demand imbalance of petroleum products,determining the future role of the State Petroleum Corporation (CEPE),and petroleum product pricing (analyzed in Chapter II).
3.2 The principal institutions and companies active in the petro-leum industry in Ecuador are the State Petroleum Corporation (CEPE), theDepartment of Hydrocarbons (DNH) of the Ministry of Natural EnergyResources (MRNE), and the Ecuadorian subsidiary of Texaco, which operatesin a consortium with CEPE. The Hydrocarbon Law, the Law of CEPE, and thelaw of bidding and contracting are the principal documents of petroleumlegislation that affect the administration and exploitation of hydro-carbons. The MRNE is responsible for implementation of hydrocarbonpolicies and the DNH is the technical-administrative branch of MRNE thatcontrols all hydrocarbon operations.
3.3 CEPE is the owner of 62.5Z of the consortium with Texaco, whichproduced over 85Z of total oil output in Ecuador in 1984; it is alsoowner of 50% of the Transecuadorian pipeline 13/ - together with Texacountil the end of 1985 - and associated storage and export terminalfacilities. By the end of 1985, CEPE will become the sole owner of thepipeline and Texaco will continue operating it under an exi-:ing agree-ment. Most of the country's refining capacity (95,000 bbl per streamdays) is owned by CEPE, and it also owns all of the gas-processingplants, product pipelines, and distribution terminals. CEPE has amonopoly on internal marketing of petroleum products but contracts *ithothers for most product transport other than by pipeline. i% sells itsown share of crude oil production, and the refinery's surplus of refinedproducts in international markets. IBRD Map No. 18930R sh -s the oilpipelines network as well as other modes of petroleum transport.
3.4 City Ecuadorian Production Co., a small, U.S.-based privateholding company, produces in consortium with CEPE from three fields inthe Oriente. City, which is operator of these fields, currently producesabout 1.8% of the total Ecuadorian oil production (4740 bd).
13/ This line, which was completed in 1972 and has a present capacity of300,000 bd, starts at an elevation of 299 m and reaches a maximumheight of 4,064 m where it crosses the Andes near Quito. It isapproximately 500 km long, reaching from the Oriente pumping stationat Lago Agrio to the Balao terminal, on the coast near Esmeraldas.
-22 -
3.5 Exploration for hydrocarbons in Ecuador began in the early1900s along the Pacific coast. The first significant discovery was madeby Anglo-Ecuadorian Oilfields Ltd. ir the 1920s near the tip of the SantaElena Peninsula (see IBRO Map No. 18930R) where good quality oil of about35° API was 'ound. From more than 100 million bbl of oil from SantaElena produced to date, current production is less than 1,000 bd fromsome 480 wells combined; this output is probably not economic due to highoperating costs 141 (US$28.63/bbl in Santa Elena vs. US$0.62/bbl in theOriente as a result of low production (less than 3 bbl per day per well)and old producing equipment which is expensive to maintain in operatingcondition. Nevertheless, the effect of continued oil production from thePeninsula fields is now negligible compared to that from the Orientewhere almost all of Ecuador's petroleum production originates.
3.6 Hydrocarbon exploration studies were performed as early as 1921in the Oriente. But it was not until 1967 that the first well wasdrilled by Texaco-Gulf (Lago Agrio 1) leading to the discovery of oil incommercial quantities. Discoveries in the Sacha and Shushufindi. oilfields in the Oriente followed in 1969. Between 1967 and 1984, a totalof 105 exploration wells were drilled, of which 50 exploration wellsresulted in discoveries of commercial quantities of cil, indicating thevery high success rate of 4i.5Z. The most common gravity of crude oilfound in the Oriente is 280 API, a moderate grade of crude.
Petroleum Exploration and Development Activities
Current Reserves
3.7 Ecuador's petroleum reserves are virtually all located in theOriente region, where proved reserves amount to nearly one billionbarrels. As of January 1, 1985, the ratio of proved reserves to 1984 oilproduction resulted in a reserves/production ratio of almost 10 years.If probable reserves are considered along with proved reserves, thereserves/production ratio is sufficient for over 16 years' .3upply. Abreakdown of the proved and probable petroleum re erves is shown inTable 3.1. DNH will change the probable reserves volume by 218 milliUnbbl obtained from secondary recovery in Shushufindi/Aguarico to tbecategory of proved reserves at the time of its next reserves revisionwhich is still undetermined. When secondary recovery begins in Sacha inJuly 1986, 167 million bbl of probable reserves will be changed to provedreserves.
14/ These are direct lifting costs and do not include any depreciation,administration, or crude oil transportation costs.
- 23 -
Table 3.1: ORIENTE OIL RESERVES (as of 01/01/85)(MMBBL)
CEPE-Texaco CEPE-CIty CEPE TOTAL
Proven 697.526 12.440 217.949 927.915Probable 529.979 a/ 2.691 53.784 586.454Total 1227.505 15.131 271.733 1514.369
a Includes 385 MMbbl sowondary recovery.
Source: CEPE.
Petrolaum Exploration
3.8 The legislation revising the Hydrocarbon Law in August 1982 toattract private investors has been successful. This is evidenced by thrrecent signing of exploration service contracts with Occidental PetroleumCompany, Exxon and Belco, and negotiations with BP, Conoco and Texaco.The combined minimum exploration obligations of Occidental, Exxon andBelco, however, are sufficient to replace Ecuador's reserves. The GOEshould continue to attract private capital companies in exploration andexpand to more area service contracts. Exploration in the Sur-Oriente,south of the Oriente producing fields, has been very spotty despite theimpressive successes of Occidental i;.:.ediately adjacent to the border inPeru under what appears to be identical geological conditions. This isto a large extent because most of the Sur-Oriente lacks infrastructure inthe area. However, the GOE is considering opening these areas to foreigninvestors.
3.9 Although the Government's position in encouraging privateinvestors *n exploration by offering attractive CEPE areas, monitoringCEPE's investment closely, and insisting on elimination of wildcatdrilling by the Corporation is commendable, the mission concluded thatCEPE should continue in Low risk exploratory work. In view of CEPE'sgood discovery rate (62.5X from 1975 thru 1984), and since productionresulting from private company exploration investment may not start untilthe early 1990s - assuming further commercial discoveries -- theGovernment should support sufficient exploration investment by CEPE inknown structures so as to help ensure an adequate reserves/productionratio, and sufficient oil supplies and exports in the short to mediumterm. In addition, Ecuador will have to reduce its oil exports by 1989unless new discoveries are made (see para. 3.13). CEPE has the means andcapability to conduct an exploration program and as a result will gainmore experience and strength with private companies. CEPE can alsoconduct seismic surveys, geochemical prospecting, and geological studiesincluding evaluation of possible sedimentary traps, in relatively unknownbut attractive areas, to assist in the promotion of new service contracts

- 24 -
in these areas by private companies. The continuation of an adequatelevel of exploration activity by CEPE will also provide the company withea core of experienced exploration staff when foreign companies completetheir exploration programs.
3.10 Declining Oil Reserves. The mission estimates that roughly 15new exploration wells per vear must be drilled in the Oriente in order tomaintain Ecuador's reserves/production rate. Instead, CEPE is limited todrilling only one well in 1985 with a combined minimum exploration obli-gation from Occidental, Exxon and Belco of only nine exploratory wellswithin a period of four years. Just to hold the future reserve/produc-tion ratio constant during the next ten-year period demands that roughly90 to 100 million bbl of new oil reserves be discovered each year.
3.11 Assuming the same discovery rate as in the Oriente, CEPE shoulddrill 18 exploration wells during the next five years just to replacetheir depleted oil reserves. As a minimum program, CEPE should be drill-ing four exploration wells each year during 1985 and 1986. During 1987and thereafter, a minimum of five exploration wells per year should bedrilled by CEPE. The GOE limit on one exploratory well in 1985 by CEPEis a result of fiscal policy and the government's attitude on leaving allexploration in the hands of foreign investors. The mission concludesthat with some reorganization and adequate contracted assistance, CEPEcan effectively conduct an exploration program of this magnitude.
Petroleum Production and Secondary Recovery
3.12 Production of crude oil in Ecuador increased from 3,700 bd in1971 to 208,800 bd in 1973, and remained relatively steady thereafter, to266,700 bd in 1984. From 1985 thru 1988, oil production rates are pre-dicted to be higher than the average 1984 daily rate, reaching roughly300,000 bd by the end of 1985.
3.13 Unless new discoveries are made immediately or new fields arefound economic for secondary recovery, Ecuador will have to start reduc-ing its oil exports by 1989. After 1989, a serious decline in productionrates is indicated, even with constant production rates being maintainedin Shushufindi-A&uarico and Sacha as a result of water injection intothose fields. If the growth of internal demand for petroleum productscontinues at its present rate of 5.5% p.a., 15/ the mission considersthat projected crude production will not be sufficient to maintain crudeexports beyond 1988 at the conservative 1983 levels of about 50.8 millionbbl p.a. Table 3.2 compares the internal demand growth effect, based onactual 1983 volumes of internal market and export crude oil, with theprediction of future production from existing fields. Annex No. 6provides a production profile to the year 1994.
15/ DNH considers a demand growth rate of 3.5 to 4% more realistic.
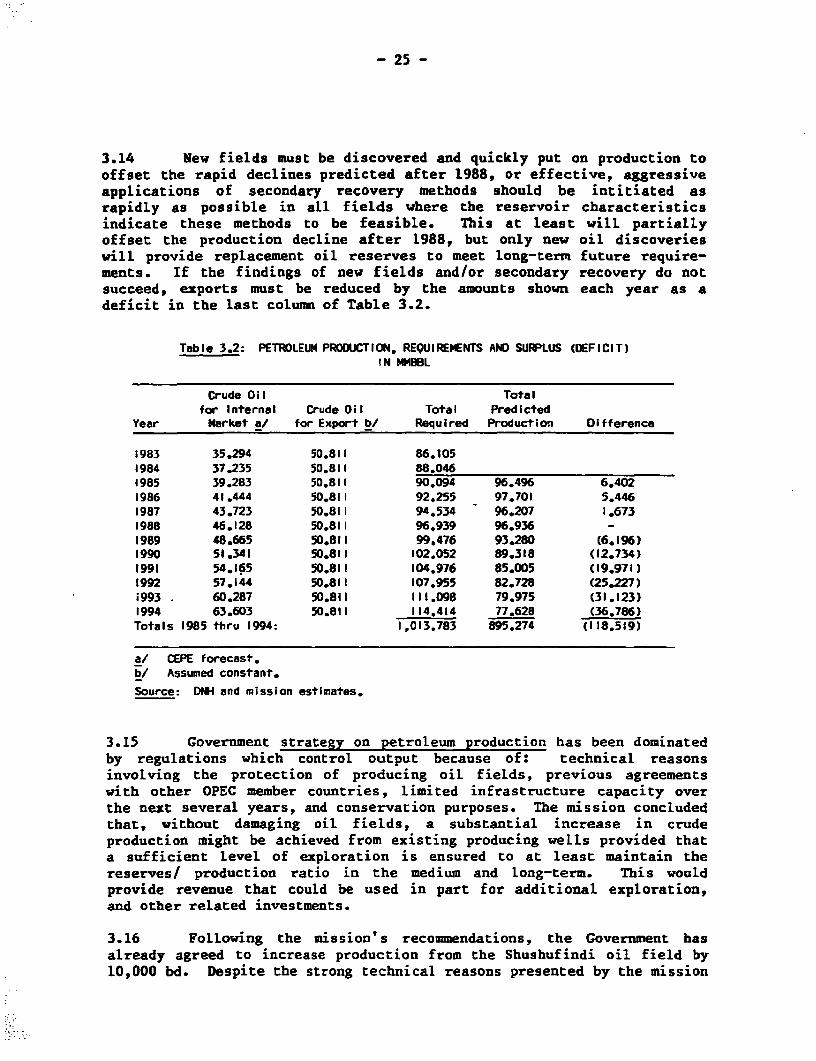
- 25 -
3.14 New fields must be discovered and quickly put on production tooffset the rapid declines predicted after 1988, or effective, aggressiveapplications of secondary recovery methods should be intitiated asrapidly as possible in all fields where the reservoir characteristicsindicate these methods to be feasible. This at least will partiallyoffset the production decline after 1988, but only new oil discoverieswill provide replacement oil reserves to meet long-term future require-ments. If the findings of new fields and/or secondary recovery do notsucceed, exports must be reduced by the amounts shown each year as adeficit in the last column of Table 3.2.
Table 3.2: PETROLEUM PRODtUCTION, REQUIREMENTS AND SURPLUS (DEFICIT)IN MMBBL
Crude Oil Totalfor Internal Crude 0il Total Predicted
Year Market a/ for Export b/ Required Production Difference
1983 35.294 50.811 86.1051984 37.235 50.811 88.0461985 39.283 50.811 90.094 96.496 6.4021986 41.444 50.811 92.255 97.701 5.4461987 43.723 50.811 94,534 96.207 1.6731988 46.128 50.811 96.939 96.936 -1989 48.665 50.811 99,476 93.280 (6.196)1990 51.341 50.811 102.052 89.318 (12,734)1991 54.165 50.811 104.976 85.005 (19.971)1992 57.144 50.811 107.955 82.728 (25.227)i993 60.287 50.811 111.098 79.975 (31.123)1994 63.603 50.811 114.414 77.628 (36.786)Totals 1985 thru 1994: 1,013.783 895.274 (118.519)
a/ CEPE forecast.b/ Assumed constant.
Source: DNH and mission estimates.
3.15 Government strategy on petroleum production has been dominatedby regulations which control output because of: technical reasonsinvolving the protection of producing oiL fields, previous agreementswith other OPEC member countries, limited infrastructure capacity overthe next several years, and conservation purposes. The mission concludedthat, without damaging oil fields, a substantial increase in crudeproduction might be achieved from existing producing weLls provided thata sufficient level of exploration is ensured to at least maintain thereserves/ production ratio in the medium and long-term. This wouldprovide revenue that could be used in part for additional exploration,and other related investments.
3.16 Following the mission's recommendations, the Government hasalready agreed to increase production from the Shushufindi oil field by10,000 bd. Despite the strong technical reasons presented by the mission
- 26 -
and the consortium engineers, the Government has not yet authorized anincrease of 20,000 bd from the Cononaco oilfield, claiming this wouldexceed the accepted practice of limiting the field reserves/productionratio. The limit on production set for the Cononaco field implies aforegone income of about US$200 million per year to CEPE.
3.17 Production from fieLds operated by CEPE will increase by about10,000 bd by end 1985 due to the recent discovery of an extension of thereserves of the Libertador oil field and the planning of additional wellswhich could be equipped rapidly with materials available in stock.Installation of artificial lift equipment should be initiated as soon aspossible in Cononaco and in fields where most of the investment requiredhas already been made.
Heavy Crudes
3.18 Since the petroleum reserves have been declining steadily,heavy crudes offer a possible long-term alternative for Ecuador. Petro-Canada experts estimate Pungarayacu heavy oil reserves at some 3.5billion bbl of 8-15' API oil, adjacent to the town of Tena in the Oriente(see IBRD Map No. 18930R). It is clear, however, that large-scaledevelopment of heavy oil would not be feasible in the short or medium-term, mainly because of the high cost of infrastructure development.From a field visit in October 1982, Petro-Canada concluded that miningmethods were not feasible and in situ recovery methods employing heatwould be very expensive. CEPE plans only limited drilling of six shallowwells during the current year to determine whether an inexpensive methodcan be found for producing from some of the wells. Due to limited fundsand greater priorities in the petroleum subsector, future activities hereshould only be taken in conjunction with private companies. The missionagrees with the Ministry and CEPE position that only limited experimenta-tion should be continued to determine costs and to anticipate anyproblems for future commercial exploitation.
Petroleum Supply
3.19 Refinery Strate. Ecuador does not plan to emulate the largerOPEC nations in attempting to refine on a large scale for exports. Thisappears to be a prudent decision, considering the uncertainty of therefineries in the Caribbean, unstable petroleum market, the great excessof refining capacity worldwide and competition for export markets.Ecuador's policy is only to expand refining capacity as required tobalance local production with demand.
3.20 The country's strategy to develop the three existing refiningcenters in parallel is a sound policy decision. Each refinery is wellplaced to supply a specific market and at the same time, there arelinkages between these prin:ipal market areas. However, it should benoted that available capital has priority needs in oil exploration and
- 27 -
development where it has a much higher return. Consequently, the GOEshould promote joint ventures in refinery investments.
Refining Facilities
3.21 Ecuador has four refineries yielding a total capacity of 95,000barrels per operating day which are located in three refining centers:the Santa Elena Peninsula, Esmeraldas, and in the Oriente. The largestone (capacity 56,000 bd) is at Esmeraldas and is wholly owned by CEPE;the three older refineries are operated by Anglo-Ecuadorian and Repetrolin the Santa Elena Peninsula (combined capacity 38,000 bd) and Texaco inthe Oriente (capacity 1,000 bd). The Esmeraldas refinery receivesOriente crude through the Transecuadorian Pipeline operated by CEPE,while the others are located near the oil fields (see IBRD Map No.18930R).
Supply/Demand Imbalance
3.22 Despite the increase in refining capacity that came about withthe commissioning of the Esmeraldas refinery in the mid-1970s, mostrefined products (except fuel oil) are in deficit. Because of this im-balance in product mix, the low-value surplus fuel oil is being exportedwhile higher-value light and middle distillates (gasoline, diesel, jetfuel, kerosene) are being imported.
3.23 Currently, the major shortfall that must be made up by importsis in gasoline, as shown in Table 3.3. Kerosene/jet fuel is close tobeing in balance, but diesel and LPG also fall short. The 1990 situa-tion, with the Esmeraldas refineries expanded to 90,000 bd and the pro-posed new Amazonas refinery (para. 3.47) in operation, shows a reduced --but still positive -- shortfall in gasoline and diesel, and an increasedshortfall in LPG. Beyond 1990, the light product shortfalls are exacer-bated as demand grows.
3.24 After the expansion of Esmeraldas and completion of Amazonas,the next logical step in refinery development will 'e to modernize theSanta Elena Peninsula refineries. Although increases in petroleum pricesmay result in reductions in future demand, it is unlikely that such areduction would be sufficient to justify modification of plans now indevelopment. Plans for further refinery expansion should be consideredvery carefully, taking into consideration the perspective of the worldrefinery industry, and investment priorities in the petroleum subsector.
Storage
3.25 Considering that all crude deliveries to Esmeraldas are made bypipeline and backed up by nearly 3 million bbl of export crude tankage,the 18 days of crude oil storage at Esmeraldas is adequate. Likewise, 30days of distillate storage is adequate, but 28 days of fuel oil storageis tight since deliveries depend on ship arrivals.

- 28 -
3.26 Major storage additions are being made at many of the terminalsas pa-t of future refinery expansion. In particular, increases in fueloil storage for the Esmeraldas and Santa Elena refineries. The totalstorage planned will consist of about 2.3 MM bbl at refineries and 1.9 MMbbl at terminals. This would be sufficient supply for 1 month at eachsite.
Table 3.3: SURPLUS (DEFICIT) OF PRODUCTION OVER DEMAND IN BBLS
!980 1985 a/ 1990 b/ 1995 b/ 2000 b/
LPG Demand 1,157 2,200 3,395 5,256 7,373Production 844 1,285 1,949 1,949 1,949Surplus (Deficit) (313) (915) (1,446) (3,307) (5,424)Gasoline Demand 10,612 9,960 12,921 14,710 16,206Production 8,415 7,630 11,861 11,861 11,861Surplus (Deficit) (2,237) (2,360) (1,060) (2,849) (4,345)Kerosene Demand 2,588 2,390 3,249 4,161 4,964Production 2,267 2,390 3,560 3,560 3,56CSurplus (Deficit) (321) - 311 (601) (1,404)Diesel Demand 6,138 6,380 9,892 13,104 16,170Production 5,605 4,899 8,685 8,685 8,685Surplus (Deficit) (533) (1,481) (1,207) (4,419) (7,485)Fuel Oil Demand 5,678 6,700 10,184 14,673 20,404Production 14,876 13,397 18,326 18,326 18,326Surplus (Deficit) 9,198 6,697 8,142 3,653 (2,078)Jet Fuel Demand 1,140 1,100 1,35i 1,659 2,044Production 1,098 930 1,553 1,553 1,553Surplus (42) (170) 202 (126) (49)
Total Fuels Demand 27,313 28,730 40,990 53,582 67,160Distillate Fuel Deficit 3,446 4,926 3,713 11,302 20,785
a CEPE operating plan.b/ CEPE demand forecast with expansion of Esmeraldas and commissioning of
Amazonas refinery.
Source: CEPE and mission estimates.
Institutional Issues
Petroleum Legislation and the Role of CEPE
3.27 The role of CEPE must be redefined and the Government must takeactions to implement its decision. CEPE is not able to function as anefficient oil company mainly because of constraints such as price ceil-ings, limited exploration involvement, and insufficient autonomy per-mitted by the petroleum legislation. Under these legal stipulations, itwill be very difficult for CEPE to develop experienced, dedicated indi-viduals at all levels who will strive to improve the efficiency of CEPEand make it competitive with other companies in similar businesses. As aconsequence, CEPE may lose its most qualified staff in considerable

- 29 -
numbers to the benefit of private companies planning to participate inEcuador's petroleum production. The Government of Ecuador will have codepend more and more on private capital companies to find and produce theoil which Ecuador will need in the years to come unless drastic changesare made in existirg petroleum legislation, especially in pricing andCEPE's autonomy to function as an efficient oil company.
3.28 The Covernment is keenly aware of the need to improve CEPE'soperating efficiency. Thus far, however, it has limited its actions tocontrolling the scope of CEPE's activities by curtailing the Corpora-tion's investments, especially in exploration and seeking ways to sur-mount the problem of procurement delays.
3.29 A serious constraint in the development of Ecuador's petroleumsector is the fact that the Hydrocarbon Law stipulates that domesticpetroleum product prices have a production cost ceiling (see para. 2.4).Depletion allowances are not included in the formula provided for in theLaw, and opportunity costs are not considered either. The MRNE estab-lishes prices for sales to consumers of all hydrocarbon products, takinginto account the cost of refining, cost of tranport, storage and dis-tributing all taxes that apply, and a resonable profit for distribution.These prices will be revised whenever modifications in costs justify suchrevision.
3.30 The efficiency of CEPE's operation is hampered by conflicts inday-to-day matters, and its autonomy to function as a petroleum corpora-tion should be assessed. According to the Law of CEPE, the General!4anager of CEPE can authorize expenditures or investments only up toabout US$5,000 equivalent. The Minister can authorize up to US$10,000,and beyond that point it must be presented to the Board of CEPE. 16/
3.31 The deep-seated legal rigidities under which CEPE and otherstate enterprises operate, and the bureaucratic delays -- aggravated inCEPE's case by the politicaL acdivities of a large number of unions thatoperate within the Corporation -- prevent CEPE from operating effi-ciently. These, rather than quality of personnel, are the main problemsfacing CEPE, as evidenced by the fact that many of it's staff membershave held similar positions in the CEPE-Texaco consortium and have oper-ated efficiently there. Consideration ought to be given to achievingoperational improvements by applying the joint venture concept - as inthe CEPE-Texaco consortium -- to CEPE's existing operations in its ownblocks. The consortium which operates mainly as a private company is notaffected by the legal rigidities that inhibit CEPE's efficiency.
16/ Since the Assessment Mission, this limit has been extended toUS$150,000.

- 30 -
3.32 MRNE and CEPE are tackling institutional problems, some ofwhich might require changes in the Hydrocarbon Law. They are also seek-ing improvements in procedures -- especially in procurement, where delaysare causing enormous costs to CEPE and the economy. Officials indicate,however, that, since the situation has becom.- institutionalized over along period, basic reforms will not be achieved quickly. The missionbelieves that if at least the main procurement bottlenecks can beeliminated, significant progress will have been made. 17/
3.33 The organization of DNH, the technical and administrativebranch of MRNE responsible for hydrocarbon activities within Ecuador. isessentially duplicating activities carried out by CEPE. In effect, theDNH has technical groups doing the same studies, technical investiga-tions, financial analyses, and statistical reports that CEPE does. MRNEshould make a vety clear distinction between establishing nationalhydrocarbon policies, and the actual operations by CEPE and othercompanies within the Government's petroleum policies, but allowing themthe freedom of decision to operate in the most efficient manner. DNHshould concentrate on executing policy while CEPE should increase itsautonomy to concentrate on petroleum operations effectively.
CEPE's Finances
3.34 CEPE's ability to operate as an oil company is seriouslyimpeded by its lack of financial autonomy. Its investment resources havecome mainly from earmarked oil tax revenues. The Corporation's share ofthese revenues has averaged the equivalent of about US$48 million p.a.over the past six years; its sources of investment funds have beenlargely restricted to this source and to internal generation of funds.The mission concluded that the Government should outline a financialstrategy for CEPE that would include investment and resource requirementslinked to an overall policy guiding CEPE's role in the medium- and long-term.
3.35 CEPE shold have enough resources to finance a sound investmentprogram developed jointly with DNH (paras. 3.37 - 3.44). The missionconsiders that a detailed financial analysis of CEPE and an analysis onthe distribution of oil revenues within the country's macroeconomiccontext should be carried out.
3.36 There are 14 different taxes on petroleum and petroleumroyalties and 21 different recipients. The main petroleum tax recipientsare the Central Government Budget, INECEL, CEPE, the National Defense
17/ Since the Assessment Mission, the GOE has taken steps to identifythese procurement bottlenecks. In addition, the World Bank isbecoming directly involved in helping in the area of institutionalreforms through a recently approved loan for a public sector manage-ment project.
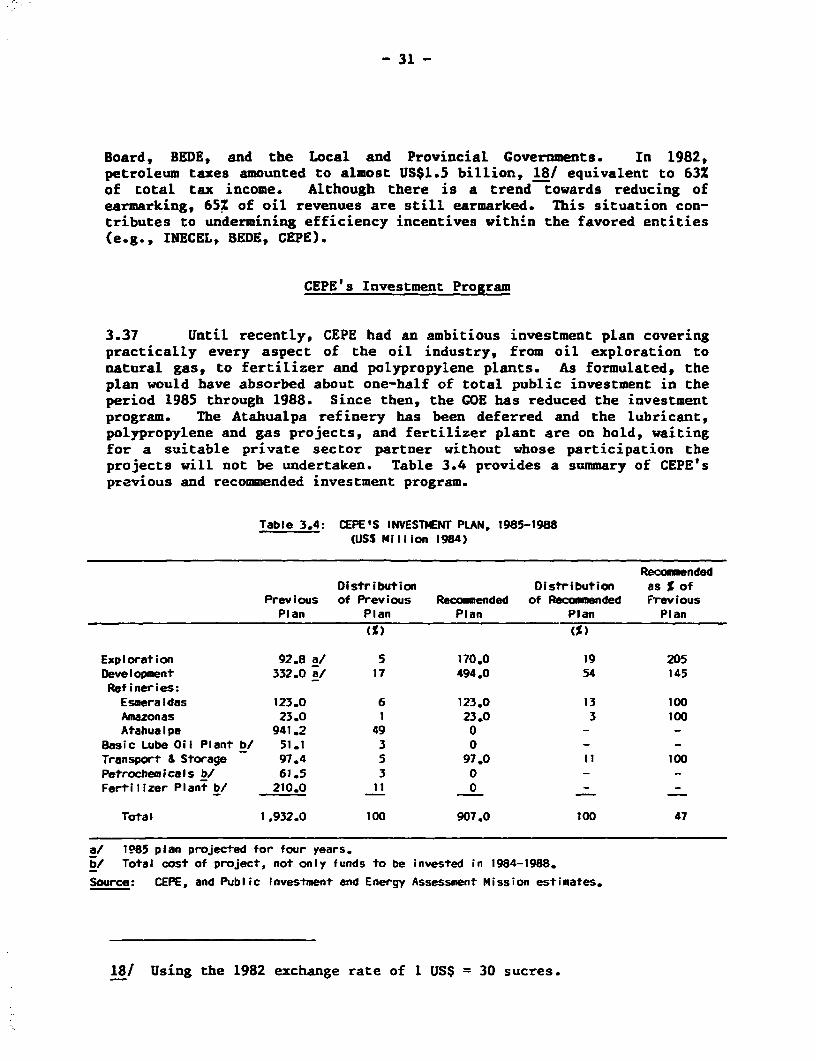
- 31 -
Board, BEDE, and the Local and Provincial Governments. In 1982,petroleum taxes amounted to almost US$1.5 billion, 18/ equivalent to 63%of total tax income. Although there is a trend towards reducing ofearmarking, 65% of oil revenues are still earmarked. This situation con-tributes to undermining efficiency incentives within the favored entities(e.g., INECEL, BEDE, CEPE).
CEPE's Investment Program
3.37 Until recently, CEPE had an ambitious investment plan coveringpractically every aspect of the oil industry, from oil exploration tonatural gas, to fertilizer and polypropylene plants. As formulated, theplan would bave absorbed about one-half of total public investment in theperiod 1985 through 1988. Since then, the GOE has reduced the investmentprogram. The Atahualpa refinery has been deferred and the lubricant,polypropylene and gas projects, and fertilizer plant are on hold, waitingfor a suitable private sector partner without whose participation theprojects will not be undertaken. Table 3.4 provides a summary of CEPE'sprevious and recommended investment program.
Table 3.4: CEPE'S INVESTMENT PLAN, 1985-1988(USS Million 1984)
RecommendedDistribution Distribution as % of
Previous of Previous Recommended of Rieommended FreviousPlan Plan Plan Plan Plan
(%) (%)
Exploration 92.8 a/ 5 170.0 19 205Development 332.0 a/ 17 494.0 54 145Refineries:Esmeraldas 123.0 6 123,0 13 100Amazonas 23.0 1 23.0 3 100Atahualpa 941.2 49 0 - -
Basic Lube Oil Plant b/ 51.1 3 0 - -
Transport & Storage 97.4 5 97.0 11 100Petrochemicals bl 61.5 3 0 - _Fertilizer Plant b/ 210.0 11 0 - -
Total 1,932.0 100 907.0 100 47
a/ 1385 plan projected for four years.b/ Total cost of project, not only funds to be invested in 1984-1988.
Source: CEPE, and Public Investment and Energy Assessment Mission estimates.
18/ Using the 1982 exchange rate of 1 US$ = 30 sucres.

- 32 -
Exploration and Oil Field Development
3.38 During the transition period in which the Government is takinga hard Look at the role of CEPE, the Corporation is being limited topreparing an investment program of US$106 million just for 1985. Of thistotal, only about US$23 million is allocated for exploration and US$83million toward oil field development. Annex 7 provides a detailedbreakdown of the exploration and production investment program for 1985.
3.39 Exploration. CEPE is allocated only a small fraction forexploration drilling. The Corporation is spending most of its 1985exploration allocation on seismic surveys, and only US$2.4 million forexploration drilling -- one well by CEPE, and CEPE's participation in onewell to be drilled by Texaco. This is a drastic reduction from the CEPEexploration program contained in the Five-year Plan 1984-1988 that wasprepared in October 1983, in which twelve exploration wells had beenprojected to be drilled by CEPE during 1985. Although CEPE has notprepared a program for development after 1985, it is anticipated that thenumber of development wells to be drilled and the overall developmentbudget during each of the next few years will be similar to that for1985. This is a sharp drop from the 5 exploration wells per yearrecommended by the mission to replace the CEPE oil reserves to beproduced (see par8. 3.11).
3.40 Which CEPE's previous exploration plan may have been tooambitious, its current plan is too modest. Unless CEPE continues with areasonable level of exploration activity, it cannot develop and maintaina reliable exploration staff. The Company's exploration program needs tobe increased by about US$20 million per year and redirected to thenorthern Oriente region where CEPE's previous efforts have been success-ful.
3.41 Oil Field Development. Development of existing oil fields isclearly the most profitable investment that the Government can under-take. A previous World Bank mission investigated three possible invest-ment scenarios to the year 1990 and estimated the possible benefits asso-ciated with each one. 19/ Total investments for every year from 1985 to1990 and petroleum production as a function of investment levels appearin Annex 8. The cash outlays of the low case amount to US$245 million(1984 prices); the expected output to 541 million barrels. The totaloutlays of the high case amount to US$716 million (1984 prices), thetotal production of the high case to 779 million barrels, implying thatroughly one dollar invested would provide one barrel. Therefore, atUS$27 per barrel, each additional dollar of investment would provide net
19/ IBRD Report No. 5094-EC "Ecuador: An Agenda for Recovery andSustained Growth," October 1984.
- 33 -
revenues of US$11. 20/ This is by far the investment with the highestexpected rate of return in Ecuador, the quickest pay-off, and the mostdramatic impact on exports.
3.42 It is crucial to increase output in certain CEPE oil fields inthe Oriente by means of artificial lift equipment, where about US$40million in capital expenditures already have been made in developing thefields involved. At this time, the 34 wells that have been drilled arenot producing, mainly because the reservoir pressure is below that neces-sary for natural flow. A forecast should be made by CEPE to estimate thedates when other wells wilL require artificial lift installations so thenecessary actions can be taken to have such equipment available for eachwell when needed to avoid the major constraints resulting from procure-ment bottlenecks.
3.43 With respect to the rehabilitation of the Santa Elena oilfields, the World Bank is financing a study which would define a long-term rehabilitation program for the Santa Elena fields. The study willreview available information on all existing wells (about 2,800) andidentify wells for rehabilitation and new wells to be drilled; evaluatethe feasibility of secondary recovery; and optimize well-spacing anddrilling costs. In addition, studies presently carried out by CEPE areexpected to define to what extent renovation is justifiable, and anyother investments that can be made to make these fields economicallyproductive again. The Government agrees with the mission that the SantaElena Rehabilitation Project should be carried out under a joint-ventureoperation with an international private oil company because of the higherrisk of the area and the low priority given by CEPE to developing fieldsin this area.
3.44 Included in development investments are provisions for drillingtwelve development wells by CEPE and participation by CEPE in drillingnine development wells by the consortium. Were CEPE to continue invest-ing in oil field development at the 1985 planned pace, its investmentover the period to 1990 would be about 70 percent of the investment esti-mated by the World Bank to be necessary to achieve the production of 779MMbbl. Preliminary estimates indicate that such a high case productioncould be achieved if investment in oil field development is stepped up toabout US$120 million per year from the present US$83 million.
Refineries
3.45 Until recently, there was strong political pressure to startbuilding a new 75,000 bd refinery -- Atahualpa - at Guayaquil. Themission agrees with the GOE's present informal position to postpone thisproject indefinitely because of its very high investment cost (US$1
20/ The GOE receives US$13 per barrel (roughly 50% of price) and theadditional cost of producing a barrel of oil in Ecuador is US$2.
- 34 -
billion) and negative rate of return. With the present refinerystructure in Ecuador, there is no need for such an investment.
3.46 The expansion of the Esmeraldas refinery is justifiablealthough upstream investments may provide a far greater return toEcuador. The Esmeraldas expansion project which has been under develop-ment for about six years is reaching the final stages of the biddingprocess. The expansion, which will cost an estimated US$125 million,will continue the existing refinery configuration 21/ and will also beaccompanied by energy conservation measures. Although it is an inte-grated refinery including both catalytic and thermal cracking of feed-stocks derived from the vacuum distillation unit, it notably lackspolymerization and alkylation units to maximize gasoline yield. This,however, allows a relatively high yield of LPG to help satisfy the mostrapidly growing demand. The mission has estimated an internal rate ofreturn of about 15% over a 15-year life, based on the current value ofOriente crude average 1984 product replacement costs, and a 10 capitalcost overrun. 22/
3.47 With a potentially rapid growth of demand in the Orienteassociated with both expanded exploration and production and relatedpopulation growth, CEPE has decided to install a new Amazonas toppingrefinery of 10,000 bd in the area. The Amazonas refinery project is ex-pected a give a good return on investment, in the range of 35-47%. 23/The good return is basically attributed to savings in pipeline trans-portation costs from Esmeraldas to Quito and in road transport costs fromQuito to the Oriente area. The project will also more fully use theexisting, underutilized pipeline from Shushufindi to Quito. In addition,due to the proximity of the existing Shushufindi gas treatment plant tothe new Amazonas refinery, integration of these two will improve effi-ciency in each of these two plants. The Amazonas refinery will have atotal investment cost of US$23 million and will require an operating cost
21/ The yield structure is reasonably well suited to domestic demand andthe planned expansion will bring it closer to the demand pattern.
22/ When using a least cost analysis, the EsmeraLdas expansion remainsattractive (US$256 million with refining versus US$258 million inimporting) using prices of June 1985 and a discount rate of 12% withamortization of 10 years.
23/ Due to the recent sharp decline in international fuel oil prices andthe fact that the Amazonas refinery produces a large amount of fueloil (42Z), the mission recalculated the IRR using June 1985 prices.Although a much lower IRR of 14% was found, the mission stillsupports the commissioning of this refinery which is also attractiveunder the least cost analysis (US$68 million, :.n refining versusUS$69 million in importing) with a discount ratb of 12% and amorti-zation of 15 years. /
- 35 -
(ex-fuel) of US$4.2 million per year. The justification for thisrefinery therefore is based both on satisfying local demand in theOriente, and helping supply the Quito markct, reducing the load onEsmeraldas and the Esmeraldas-Quito pipeline.
Transportation and Storage
3.48 The mission fully supports the expansion of the Transecuadoriancrude pipeline and storage capacity. The Transecuadorian pipeline had arated capacity of 240,000 bd with three pump units in each station until1984 whea a fourth pump was installed, increasing capacity to280,000 bd. A fifth was recently installed, boosting capacity to 300,000bd. The next expansions (additional pumping capacity) up to the uLtimatelive capacity of 400,000 bd will be scheduled depending on the size andtiming of future discoveries which result from current explorationefforts by oil companies.
3.49 Petroleum products are transported by three existing majorpipelines (Duran-Quito, Esmeraldas-Quito, Shushufindi-Quito), coastaltankers, and road tankers. CEPE is also planning three new productpipelines: Libertad-Pascuales, Libertad-Manta, and Pascuales-Cuenca-Machala (see Map IBRD No. 18930R). Libertad-Pascuales will link therefining areas in the Santa Elena Peninsula with Pascuales, the majortermin.al in the GuayaqLil area, which represents the greatest market con-centration. This link is important and should have priority considera-tion. The GOE should start constructing economic models on optimizingthe integrated petroleum supply system for the medium to long-termperiod.
3.50 The pipelines Libertad-Manta and Pascuales-Cuenca-Machala donot appear to be economically justified. In the case of Libertad-Manta,marine transport in coastal tankers now being used is much less costlythan pipeline transport (US$0.91/bbl 24/ compared to US$1.78/bbl).Similar arguments apply to the Pascuales-Cuenca-Machala pipeline, theeconomics of which are complicated by the leg inland to Cuenca. Thetransport costs of the proposed Libertad-Manta pipeline, compared withmarine transport for the year 1988 (start-up of pipeline) are shown inTable 3.5.
24/ Using the international price of fuel oil at US$0.61/gal thatapplied during the assessment mission. Due to the sharp recentdecline in international fuel oil prices (US$0.54/gal), the marinetransport cost is reduced to US$0.84/bbl.
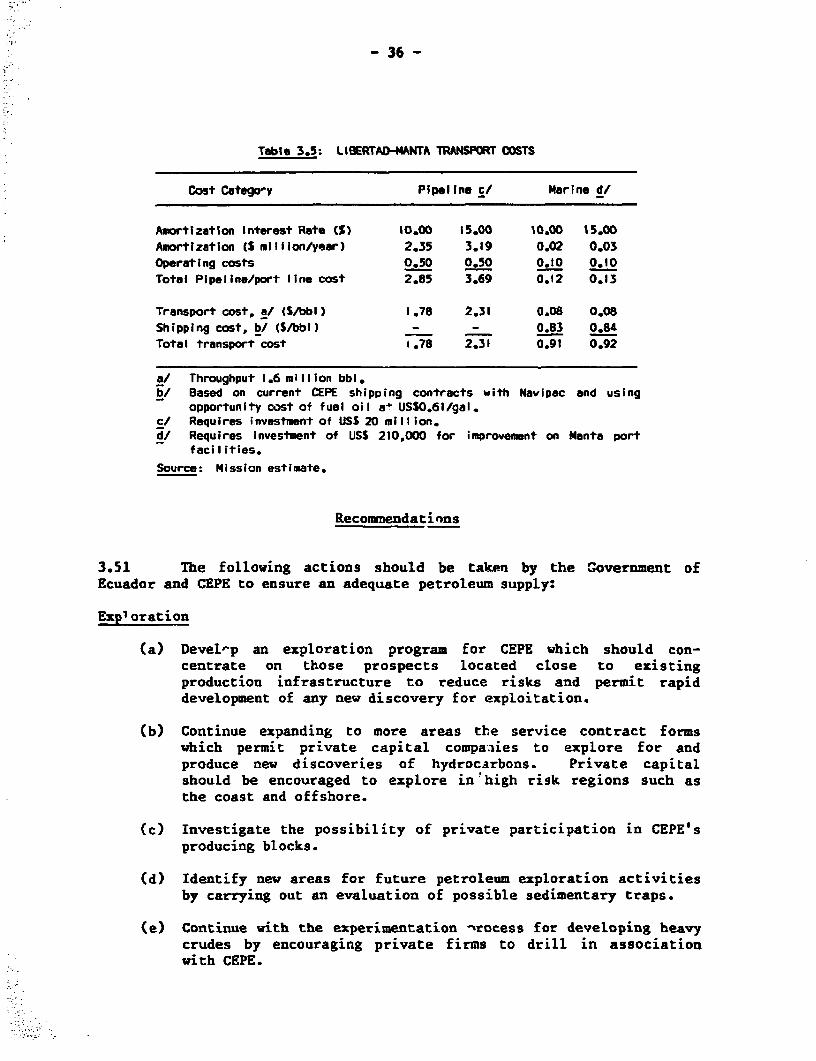
- 36 -
Table 3.5: LIBERTAD-MANTA TRANSPORT COSTS
Cost Catego-y Pipeline C/ Marine d/
Amortization Interest Rate (S) 10.00 15.00 10.00 15.00Amortization (S million/year) 2.35 3.19 0.02 0.03
Operating costs 0.50 0.50 0.10 0.10
Total Pipeline/port line cost 2.85 3.69 0.12 0.13
Transport cost, a/ (S/bbl) 1.78 2.31 0.08 O.0oShipping cost, b/ (S/bbl) - - 0.83 0.84
Total transport cost 1.78 2.31 0.91 0.92
S/ Throughput 1.6 million bbl.b/ Based on current CEPE shipping contracts with Navipac and using
opportunity cost of fuel oil a~ USSO.61/gal.c/ Requires investment of USS 20 million.d/ Requires Investment of USS 210,000 for improvement on Manta port
facilities.
Source: Mission estimate.
Recommendatinns
3.51 The following actions should be taken by the Government of
Ecuador and CEPE to ensure an adequate petroleum supply:
Exploration
(a) Devel-p an exploration program for CEPE which should con-
centrate on those prospects located close to existing
production infrastructure to reduce risks and permit rapid
development of any new discovery for exploitation.
(b) Continue expanding to more areas the service contract forms
which permit private capital compa-.ies to explore for and
produce new discoveries of hydrocarbons. Private capital
should be encouraged to explore in!high risk regions such as
the coast and offshore.
(c) Investigate the possibility of private participation in CEPE's
producing blocks.
(d) Identify new areas for future petroleum exploration activities
by carrying out an evaluation of possible sedimentary traps.
(e) Continue with the experimentation -rocess for developing heavy
crudes by encouraging private firms to drill in association
with CEPE.
- 37 -
Petroleum Production
(a) Due to good discovery prospects, increase current production inareas such as Cononaco and, wherever feasible, throughsecondary recovery and use of artificial lift equipment. Thiswould enhance production which would generate extra revenue forCEPE to use in financing exploration.
(b) Continue studies on defining to what extent renovation of theSanta Elena oil fields is justifiable to make them economicallyproductive again.
Refineries and Transport
(a) Proceed with expansion of the Esmeraldas refinery andconstruction of the Amazonas refinery.
(b) Analyze how to optimize the integrated petroleum supply systemby constructing economic models of the overall system includingrefineries, crude and product pipelines and terminals to use asan aid in investment planning.
(c) Carry out detailed studies on the need for and timing of thenext expansions of the Transecuadorian crude pipeline.
Institutional Issues
(a) Redefine the future role of CEPE! especially in petroleumexploration taking into account the increased participation ofprivate investors.
(b) Instead of duplicating CEPE's act.;ities, D1'H should con-ce:itrate on policy while CEPE should concentrate on operations.
(c) Analyze the petroleum legislation giving special emphasis topricing and investigation of CEPE's autonomy so as to ensureCEPE functions in a timely and efficient manner. Immediateaction should be taken to provide solutions to CEPE's pro-curement bottlenecks.
(d) Analyze CEPE's financial situation and distribution of oilrevenues within the country's macroeconomic context.
- 38 -
IV. NATURAL CAS
Background
4.1 Known reserves of natural gas in Ecuador exist in the Gulf ofCuayaquil and in the Oriente. The key issues in Ecuador's natural gassubsector concern market uncertainties for the Gulf of Guayaquil non-associated gas and more efficient use and recovery of the Orienteassociated gas. The potential domestic market for gas in Ecuador isshown in Table 4.1 below.
Table 4.1: POTENTIAL DOMESTIC MARKET FOR GASUTILIZATION IN ECUADOR
(MMCFD)
Non-Associated Gas Associated Gasin Guayaquil Area in the Oriente
Power Generation 0 - 50 2.5 - 3.0
Industrial Use 10 - 40 4.0 - 8.1
Residentlal/Coumercial Use 0 - 5 -
Chemical Feedstock 0 - 40 _
Transport 0 - 5
Recovery of condensablehydrocarbons a/ - (7.8 - 18.2)
Total 6.5 - 11.1
a/ This is only the amount which is processed rather than consumed.Source: Mission estimates.
4.2 Gulf of Guayaquil. The main constraints that need to beresolved before exploitation of the Gulf of Guayaquil gas can begin are:the unreliability of gas reserve estimates, the complex geology and thelegal uncertainties relative to the Amistad structure. Initialexploration of the reserves was made by ADA Petroleum, which, in 1973,was forced to leave by the Government. ADA claimed rights in interna-tional courts and Acuador believes it has a right to the reserves. Inaddition, dense faulting systems are present which makes it difficult toaccurately determine the extent of the existing reserves.
4.3 To date, no hydrocarbon bearing structures besides the Amistadhave been identified in the Gulf, and no production has been realizedfrom the gas discovery. Proven reserves in the Amistad structure con-sidered to be reliable range between 200 and 280 BCF with 80-90 BCF asprobable (see Annex 9), and minor quantities of associated natural gasproduced on the Santa Elena Peninsula. Reserves in the Amistad structureare expected to support a flow of some 50 MMCFD for at least 15 years.

- 39 -
4.4 The emphasis of exploration in the Gulf of Guayaquil has beenin the search for oil. A total of 11 potential hydrocarbon-bearingstructures have been identified and tested with exploratory wells. Pastexperience has placed future exploration in the high-risk category.
4.5 CEPE has called for bids, under exploration contracts, for fourexploration blocks within the Gulf of Guayaquil (See IBRD Map No.18930R), with a minimum requirement of 1,500 km of seismic survey, and 4exploratory wells, within each block over a four-year period. Since theblocks were offered in Late 1984, BELCO has signed contracts on Blocks 1and 2, located adjacent to the Santa Elena Peninsula. Discussions withCEPE have revealed that no bids were received on Blocks 3 and 4.
4.6 The Amistad structure which contains the only proven reserves,has been set aside for CEPE. A proposal from Braspetro/Petrofertil iscurrently being considered for a three-phase program of exploration,production, and fertilizer plant development utilizing the Amistadnatural gas reserves.
4.7 Oriente. The only associated gas reserves of any significanceare in the oil-producing fields in the Oriente. The Oriente regioncontains recoverable reserves of approximately 195 BCF of associatednatural gas, which is being produced at a rate of approximately 45 NMCFDscattered throughout the region as a by-product of the crude oil pro-duction. Probable output therefore depends on the oil output strategy.In addition to the increased recovery of condensable hydrocarbons fromwet gas in the Oriente, the main issues to be considered are substitutionof dry gas for other fuels in thermal and power applications and dry gasas a prospective transport fuel (CNG). An improvement in the use of drygas in the Oriente is expected soon with the proposed new Amazonasrefinery depending on this source as a fuel. Optimization of the liquidsrecovery facilities might well enable Ecuador to become self-sufficientin LPC in the foreseeable future while CNC utilization has the potentialto reduce gasoline imports.
Gas Development in the Gulf of Guayaquil
4.8 The Gulf of Guayaquil is considered to be a gas short area,indicating the potential gas availabiLity (50 MMCFD) is projected not toexceed the potential demand for it. Selection of the optimal configur-ation of gas utilization projects therefore constitutes the main issue.Based on current estimates of reserves and sustainable flow rates, atotal fuel substitution of 50 MMCFD of non-associated gas equivalentcould be realized.

- 40 -
Table 4.2: SUMMARY OF ECONOMIC ANALYSIS OF GAS UTILIZATION PROJECTSIN GUAYAQUIL
(10%-20S discount rate per year)
Investment a/Project/Package [Flow rate) Gas Netback NPV b/
1o6 uss USSnM BTU ,o6 ussIMMCFDI (negative) (negative)
1. Power Generation 9.6 - 19.2 6.11 - 6.43 100.7 - 299.8[501
11. Industrial fuel 8 4.92 - 5.04 32.2 - 94.2[401
Residential/CrxmercIal fuel 2.5 7.04 - 7.15 24.7 - 41.8
151
Transport fuel 3.5 6.30 - 6.48 18 - 31.5151
Package total 14 5.29 - 5.40 74.9 - 167.5
lll* Ammonia/Urea 320 (0.14) - 0.83 (203.0) - (193.7)[401
Industrial fuel 2 6.11 - 6.39 21.0 - 37.6[101
Package total 322 1.11 - 1.94 (182.0) - (156.1)
IV. Methanol 102 (2.43) - (1.53) (431.2) - (317.0)1401
Industrial fuel 2 6.11 - 6.39 21.0 - 37.6[101
Package total 104 (0.72) - 0.05 (410.2) - (279.4)
a/ Excluding exploration development and transport costs.b/ Based on fuel oil equivalent value of natural gas at USS4.19/MMBTU.Source: Mission estimates.
4.9 Power generation is the most attractive choice for utilizationof the Gulf of Guayaquil gas. However, the expansion of INECEL's trans-mission and distribution system within the next five years will reducethe need for gas in power generation. Industry also is a potentiallylarge volume user of gas in Ecuador, but the netback value of gas ingeneral would be lower because of the fuel oil displaced. Attractivelow-volume, high value markets are the residential/commercial and trans-port sectors. The utilization of gas as chemical feedstock for fer-tilizers is not attractive in the foreseeable future because of the smallsize of the local market as well as depressed international market con-ditions. All of the above are mainly constrained by legal argumentsdealing with the exploitation rights of the Amistad structure explained
- 41 -
before, and the high investment cost required (shown in Annex 10). Table4.2 summarizes the results of the preliminary economic analysis of gasutilization in Guayaquil. A prefeasibility study on the market potentialof gas should be carried out dealing in detail with the factors mentionedbeLow.
Economic Analysis
4.10 Econom!.c Price of Gas. As a prospective gas-short area, theeconomic price of gas from the Gulf of Guayaquil would follow that offuel oil on an energy equivalent basis. The first step is the calcu-lation of gas netback values which are compared with the price of gas.The economic price of gas in this case is US$4.19/MMBTU, which is theopportunity cost of the cheapest fuel replaced (fueL oil).
4.11 For the purpose of the economic analysis, the following projectpackages have been cons :e.i for utilization in: (a) power generation;(b) industrial, residential and transport purposes; (c) chemical feed-stock for a fertilizer plant and industrial use; and td) chemical feed-stock for a methanol plant and industrial use. Table 4.3 presentsspecific details about the four packages.
Table 4.3: PROJECT PACKAGES - GULF OF GUAYAQUIL GAS
End Use Demand
(MMCFD)
1. Power Generation 50
HI. Industrial 40
Residential 5
Transport 5
Ill. Fertilizer Plant 40
and Industrial Use t0
IV. Methanol Plant (1,000 TPD) 40
and Industrial Use 10
Source: Mission estimates.
4.12 Infrastructure requirements. Development of the Amistadnatural gas requires additional investments in exploratory and productiondriLling, gas production platforms and transport infrastructure. Thetotal capital cost for infrastructure has been estimated at US$230.7million for the project packages I, II, and IV. The package III -- whichis related to the Atahualpa fertilizer complex, 25/ -- needs an estimatedinvestment for infrastructure of US$227.8 million.

- 42 -
4.13 Power Generation. Although utilization of natural gas forpower generation is the most economically attractive option, its imple-mentation highly depends on INECEL's generation policy since theexpansion of INECEL's transmission system in the next five years willreduce the need for gas in the power sector. Project package I refers tothe production and transport of gas from the Amistad structure to thearea near the ciLy of Guayaquil where EMELEC and INECEL thermal plantsare located. The gas would replace diesel oil as fuel for electricitygeneration where a total effective capacity of 192 MW would beinvolved. Netback values on replacing diesel oil with gas in powergeneration, as shown in Annex 10, vary from US$6.11 to US$6.43 permillion BTU according to project lifetime (5 to 15 years), discount rate(10 to 20Z/yr) and retrofit investment (US$9.6 or 19.2 million). NPV'svary for the same set of parameters, from US$100.72 million to US$299.77million.
4.14 If package I could be implemented right when Guayaquil gasbecomes available, it would provide the necessary time for the industrialfuel market to develop. Later on, the combined demand in the industrial,residential/commercial and transport sectors could take over gas demandentirely from the power sector as the latter switches to hydroelec-tricity. In that case, timing would be the essential criterion.
4.15 Project package II, which is economically sound, refers to theproduction and transport of gas from the Amistad structure to the areanear the city of Guayaquil where it would be consumed in industry (40MMCFD), in the residential/commercial sector (5 MMCFD), and in transport(5 MMCFD). However, besides the constraints mentioned in para. 4.9,there is also a difficulty in coordinating the industrial market.
4.16 For industrial use, gas netback values vary betweenU$4.92-5.04/MMBTU and NPV's vary from US$32.2 million to US$94.2 million,depending upon discount rates and project duration, and according to theconsumption of 40 MMCFD of gas as an industrial fuel. The fuelsdisplaced are a combination of fuel oil, diesel oil and kerosene, theopportunity cost of which is estimated at US$5.11/MMBTU. Annex 10 showsthe breakdown of gas netback and NPV of gas as an industrial fuel forvarious discount rates and project lifetimes.
4.17 For residential/commercial use, the gas netback values rangefrom US$7.04 - 7.15/MMBTU and NPV's vary from US$24.7 million to US$41.8million, depending on the discount rates used and based on the consump-tion of 5 MMCFD of gas as fuel. The fuel displaced is LPG, the oppor-tunity cost of which is estimated at U$7.33/MMBTtJ. The demand in itselfwould not justify the development of gas infrastructure in Guayaquil, but
25/ It recently has been reported that the Government is reconsideringthe fertilizer complex as was recommended during the assessmentmission.
- 43 -
once the pipeline is built to meet power/industrial demand, the house-hold/commercial market, although small, can become very attractive.
4.18 For transport, gas netback values range from US$6.30-6.48/MMBTUand NPV's vary from US$18 million to US$31.5 million, depending upon thediscount rates adopted, and assuming 5 MMCFD of gas is consumed in theform of CNG as transport fuel. The fuel displaced is gasoline which hasan opportunity cost of US$6.71/MMBTU.
4.19 Fertilizer Plant and Industrial Use. Package III, which refersto the production and transport of gas from the Amistad Structure in theGulf of Guayaquil to Atahualpa where the gas would feed a fertilizerplant with capacities of 1,000 TPD of ammonia and 1,650 TPD of urea, isnot an economically attractive option for gas utilization. 26/ While thesize of the plant is considered economic by international standards, inview of the small size of the nitrogen fertilizer market in Ecuador, thebulk of its production should be placed in the depressed internationalfertilizer market which is expected to continue for quite some time intothe future. By 1990 the export requirements would be on the order of 900TPD or 60Z of total urea production. Annex 11 explains the assumptionsunderlying the economic analysis of the ammonia/urea option for gasutilization.
4.20 Methanol Plant and Industrial Use. Package IV, which has notturned out to be economically attractive, refers to the production andtransport of gas from the Amistad structure to the area near the city ofGuayaquil, where it would be consumed in a prospective 1,000 TPD methanolplant (40 MMCFD) and as industrial fuel (10 MMCFD). Methanol would beconsumed in the local, domestic market as a gasoline component servingthe dual function of gasoline extender and octane booster. Since theprice of methanol is historically correlated with gasoline, methanol isvalued at 60X of the economic value of gasoline, namely US$4.82/MMBTU.It is unlikely that under current and foreseeable conditions this projectever will be implemented.
Oriente - Efficient Use and Recovery of Gas
4.21 Historically, natural gas produced in the Oriente has beenflared (62% in 1984), with only nominal volumes utilized as fuel gas andfor gas lift operations associated with the crude oil production. Whileflariz.. of gas is wasteful, two factors should be noted: (a) the pro-duction areas are extremely remote from populated and/or industrializedareas and completely lacking in any utilization infrastructure, otherthan those of the crude oil production facilities; and (b) the gas/oil
26/ World commodity prices projected by the World Bank Economic Analysisand Projection Department (EPD).
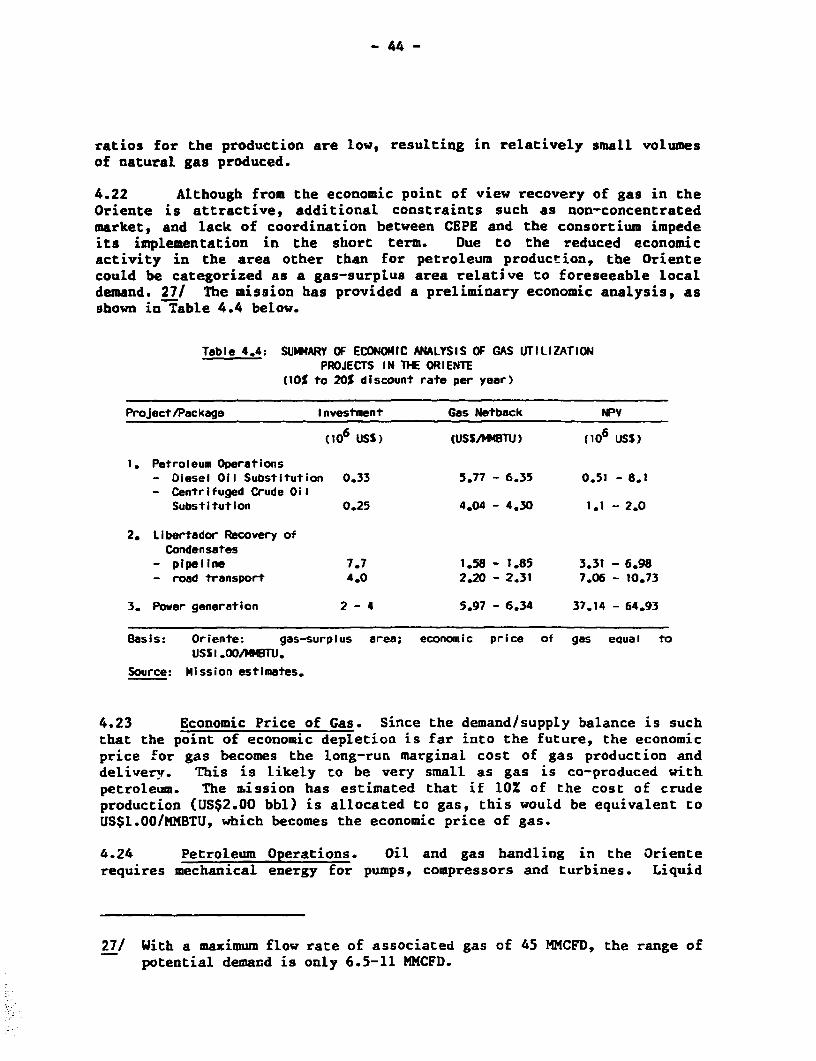
- 44 -
ratios for the production are low, resulting in relatively small volumesof natural gas produced.
4.22 Although from the economic point of view recovery of gas in theOriente is attractive, additional constraints such as non-concentratedmarket, and lack of coordination between CEPE and the consortium impedeits implementation in the short term. Due to the reduced economicactivity in the area other than for petroleum production, the Orientecould be categorized as a gas-surplus area relative to foreseeable locaLdemand. 27/ The mission has provided a preliminary economic analysis, asshown in Table 4.4 below.
Table 4.4: SUMMARY OF ECONOMIC ANALYSIS OF GAS UTILIZATIONPROJECTS IN THE ORIENTE
(10% to 20% discount rate per year)
Project/Package Investment Gas Netback NPV
(106 USS) (USSA44BTU) (106 USS)
1. Petroleum Operations- Diesel Oil Substitution 0.33 5.77 - 6.35 0.51 - 8.1- Centrifuged Crude Oil
Substitution 0,25 4.04 - 4.30 1.1 - 2.0
2. Libertador Recovery ofCondensates
- pipeline 7.7 1.58 - 1.85 3.31 - 6.98- road transport 4.0 2.20 - 2.31 7.06 - 10,73
3. Power generation 2 - 4 5.97 - 6.34 37.14 - 64.93
Basis: Oriente: gas-surplus area; economic price of gas equal toUSS I .OO/MMBTU.
Source: Mission estimates.
4.23 Economic Price of Gas. Since the demand/supply balance is suchthat the point of economic depletion is far into the future, the economicprice for gas becomes the long-run marginal cost of gas production anddeliver"r. This is likely to be very small as gas is co-produced withpetroleum. The mission has estimated that if 10% of the cost of crudeproduction (US$2.00 bbl) is allocated to gas, this would be equivalent toUS$1.00/MMBTU, which becomes the economic price of gas.
4.24 Petroleum Operations. Oil and gas handling in the Orienterequires mechanical energy for pumps, compressors and turbines. Liquid
27/ With a maximum flow rate of associated gas of 45 MMCFD, the range ofpotential demand is only 6.5-11 MMCFD.
- 45 -
fuels such as diesel fuel and centrifuged crude oil are convenient fuelsfor such applications. Although the amounts consumed are small, theutilization of gas in petroleum operations could provide a high economicreturn on the modest investments required to convert existing machineryto burn gas. Consequently, the mission recomnends the implementation ofthis substitution.
4.25 For diesel oil substitution, in the oil fields of Sacha andLago Agrio, the range of gas netback values is US$5.77-US$6.35/MMBTU.For centrifuged crude oil substitution, in the Auca oil fieLd, the gasnetback range is lower at US$4.04-4.30/MMBTU, but still well above theeconomic price of gas in the Oriente. Annex 12 includes the economics ofindustrial utilization of gas in petroleum operations in the Oriente.
4.26 Recovery of Condensates. Since 1984, the Shushufindi treatmentplant has been functioning well below its design capacity of 25 MMCFD.It has been reported that the volumes processed by the natural gas plantrose to a maximum of approximately 10 MMCFD by the end of 1984, as aresult of a lack of feedstock. The two short term solutions which arefeasible and capable of increasing the gas supply to the treatment plantare: better coordination with the consortium, and bringing in the gasfrom CEPE's Libertador oil field.
4.27 The consortium retains significant volumes of wet gas for gaslift purposes instead of transporting it to the treatment plant andreturning dry gas for its operations. It does this because the priorityof the consortium is in oil production and it does not want the naturalgas production to interfere with its emphasis. Thus, the consortiumprovides to the gas plant only its surplus. The mission does notconsider that the use oi dry gas from the plant will interfere with theconsortium's operation and recommends improving the coordination withCEPE in order to optimize the utilization of natural gas. 28/
4.28 The proposed Libertador project is only marginally attractivefrom the economic viewpoint due to: the reduced voLume of liquids pro-duced; the valuation of natural gasoline as crude oil, since it isblented wih the latter; the flaring of the residual gas; the relativelyhigh investment costs, particularly at Libertador; and the decrease ingas flow rate from 7 MMCFD by a factor of 3 in only 10 years. 29/ Gasnetback values are slightly higher when considering road transport ofcondensates from Libertador to the Shushunfindi treatment plant becauseof the reduction in investment cost from US$7.7 million with pipeline toUS$4 million with road. Cas netback values range from US$2.20-2.31/MMBTUwith road transport of condensates to US$1.58-1.85/MMBTU with pipeline.
28/ The COE has already taken measures to improve the coordination.
29/ Since the assessment mission, the GOE no longer considers theLibertador gas project.
- 46 -
NPVs range from US$7.06-10.73 million (road transport) to US$3.31-6.98million (pipeline). The economics would improve drastically if theresidual gas in Libertador could find an economic use as a fuel such asCNC for transport. However, even this use is limited by the lack ofroads and low demand. On the positive side, the recovery facilities(Shushufindi gas plant) and transportation network (the condensatespipeline to Quito) are in place to ensure that the LPC and naturalgasoline reach suitable marketing centers. Annex 12 provides a breakdownof the Libertador project investment cost including pipeline.
4.29 Power Generation. The power potential required by petroleumoperations is around 40-45 MW, most of which depends on diesel fuel. Gashas already penetrated this market, particularly at Shushufindi, butcould expand its share of the power generation market if processed priorto burning to obtain a steady and adequate composition.
4.30 The sparsely populated Oriente depends on diesel generators tosupply electricity to the residential, commercial and public sectors.Given the high cost of diesel fuel delivered to the villages, the latterare supplied with electricity for only 10 hours daily. The amount of gasrequired to substitute diesel fuel would be quite small given the limiteddemand, but costly diesel would be saved for just a small investment inadapting the diesel generators to gas use.
4.31 From the economic point of view, utilization of natural gas inpower generation is an excellent alternative. However, due to the largearea covering the potential demand, implementation of a full scale gasrepLacement program is not feasible in the short term. Gas netbackvalues vary within the range of US$5.97-6.34/MMBTU -- depending on thediscount rate used (10-20%) -- which is much higher than the economicprice of gas. The net present values of the retrofit program vary in therange of US$37.14-64.93 million. This was calculated by considering theenergy replacement value of gas when substituting diesel oil atUS$6.51/MMBTU and a power production cost equal to 1.25 times theeconomic price of gas. Annex 12 provides a breakdown of the gas netbacksand NPVs from substituting gas for diesel oil.
Recommendations
4.32 Specific recommendations for gas development in Ecuador are thefollowing:
Gulf of Guayaquil
(a) Remove legal uncertainties resulting from past exploration ofthe Amistad structure.
(b) Establish reliable gas reserve estimates, by resorting to jointventures in exploratory drilling.

- 47 -
(c) While carrying out renewed exploration work, undertake a com-prehensive gas market study which should consider a selectionof project packages focussing on power generation, industrialfuel, and in the residential/comercial, and transport markets.
Oriente
(a) Improve coordination between CEPE and the consortium to processwet gas from the consortium at the Shushufindi plant.
(b) Initiate long-range planning studies to ensure adequate feed-stocks are available to the Shushufindi gas plant and investi-gate the feasibility of establishing satellite gas plants innew fields at remote locations; including evaluation of trans-port methods to ship the liquids to suitable collection/proces-sing installations.
(c) Substitute dry residual gas for other petroleum fuels used inpower generation and thermal applications, expanding on what isalready being done by the Shushufindi gas plant.
(d) Use dry residual gas for gas lift operations as supplies of drygas increase and become more dependable. Use of wet gas shouldbe allowed only where dry gas supplies are interrupted forshutdowns or breakdowns, to avoid curtailing crude oilproduction activities.
4 $8 -
V. LECTRICITY
Background
5.1 The principal issues confronting the electric power sector inEcuador are: (a) the adequacy of present generation and transmissionexpansion plans in the light of reduced demand growth and the avail-ability of alternative energy sources (gas, geothermal); (b) short-termgeneration expansion problems stemming from unforeseen technical dif-ficulties in the Paute River basin; (c) institutional problems related toINECEL's organization and financial difficulties, and determining thefuture of EMELEC -- the private company that serves the major load centerof Guayaquil; (d) operational problems associated with minimization ofpeneration cost, reliability and quality of service, and distributionlosses.
5.2 The electric power sector in Ecuador is organized around theInstituto Ecuatoriano de Electrificacion (INECEL) which operates as aplanning agency as well as a generation and transmission company. Itsells energy to 18 distribution companies over which it exerts nominalcontrol through ownership of the majority of their shares. However, thelargest market in the country (Guayaquil) is supplied by a privateforeign company (EMELEC) which has operated since 1926 under a concessionthat expires in October, 1985. In a1.dition, a number of municipalcompanies distribute electricity locally by purchasing power from INECELsubsidiaries.
5.3 The electric pow;-r sector has gone through three distinctphases over the past three decades. In the 1960s, 30/ eLectric utilitiesoperated either independently or with minimal interconnections, andINECEL which had very limited resources, acted as a government regulatoryagency. In the 1970s, Ecuador's oil boom endowed INECEL, with abundantresources proceeding from petroleum royalties, resulting in INECELconsolidating its control over subsidiaries and becoming a generation andtransmission enterprise. During this period, a phenomenal growth inelectric power consumption cccurred; per capita consumption increasedfrom 110 kWh in 1970 to 311 kWh in 1980 (11% average growth rate). Inthe 1980s, there has been a complete reversal from thermal to hydrogeneration, mostly as a result of the commissioning of Paute A and Bhydro plants, and INECEL has become the main power suppLier. However,the 1982-1983 recession and reduced oil export revenues combined toreduce demand and availb!. financial resources.
30/ INECEL was created in 1961.

- 49 -
Basic Resources and Existing Facilities
Generation
5.4 Ecuador has three main economic sources of primary energy forpower purposes: hydro, natural gas, and geothermal. Hydropower,Ecuador's most important commercial energy resource, is estimated atabout 93,000 MW, of which 30,000 MW have been identified in 11watersheds. The identified economical potential to date is 21,000 MW,distributed among 39 projects. Unit costs for these projects fluctuatebetween 18 and 63 mills/kwh (1983 price levels). Natural gas (non-associated), from the Gulf of Guayaquil is another alternative for powergeneration (see para. 4.28-4.29); proven reserves are estimated between200 and 280 billion cubic feet (BCF). Surface manifestations of geo-thermal energy sources can be found in many different places in the Andesmountains. However, none of these have been investigated thoroughly, andonly the Tulcan-Chiles region in the Carchi province is being prospectedin detail with assistance provided by the Italian Government. Geothermalreserves are roughly estimated by INE to be as high as 60,000 NW.
5.5 Ecuador at present has a total installed capacity of 1628 MW(45% hydro) for serving a load of 810 MW. Once Agoyan (156 MI) isfinished, there will be enough generating capacity to satisfy demanduntil 1993. Although there are 903 MW in thermal units, most of the loadis served by hydro units and the apparent excess capacity is due to thecommissioning of hydro facilities for the purpose of substituting oil-based fuels. Of the total hydro capacity, the Paute A-B complex accountsfor 69% and supplies most of the system's load. Thermal substitution hasbeen highly successful with hydro accounting for 76Z of cotal generationin 1984. Of the latter, 80% corresponded to INECEL plants.
Transmission and Distribution
5.6 The backbone of the transmission system consists of the 230-kVPaute-Guayaquil-Quito double circuit lines (510 ton). Major loads areserved through 138 kV extensions (590 km) that also interconnect otherhydro plants (e.g. Pisayambo). The 230 kV transmission system is alsothe main structural weakness regarding supply reliability -- outages ofthe Paute-Guayaquil lines produced three total blackouts in 1984. Trans-mission reinforcements, due to be in service by 1988, consist of a Paute-Ambato-Quito line that will create a 230 kV ring, thus improvingreliability. A number of 69-kV radial lines complement the grid toprovide service to the transfor-ier stations which feed the distributionnetwork. Total connections are 951,000. Table 5.1 provides the basiccharacteristics of the Ecuadorian power system. IBRD Map No. 19042 showsthe country's power system.
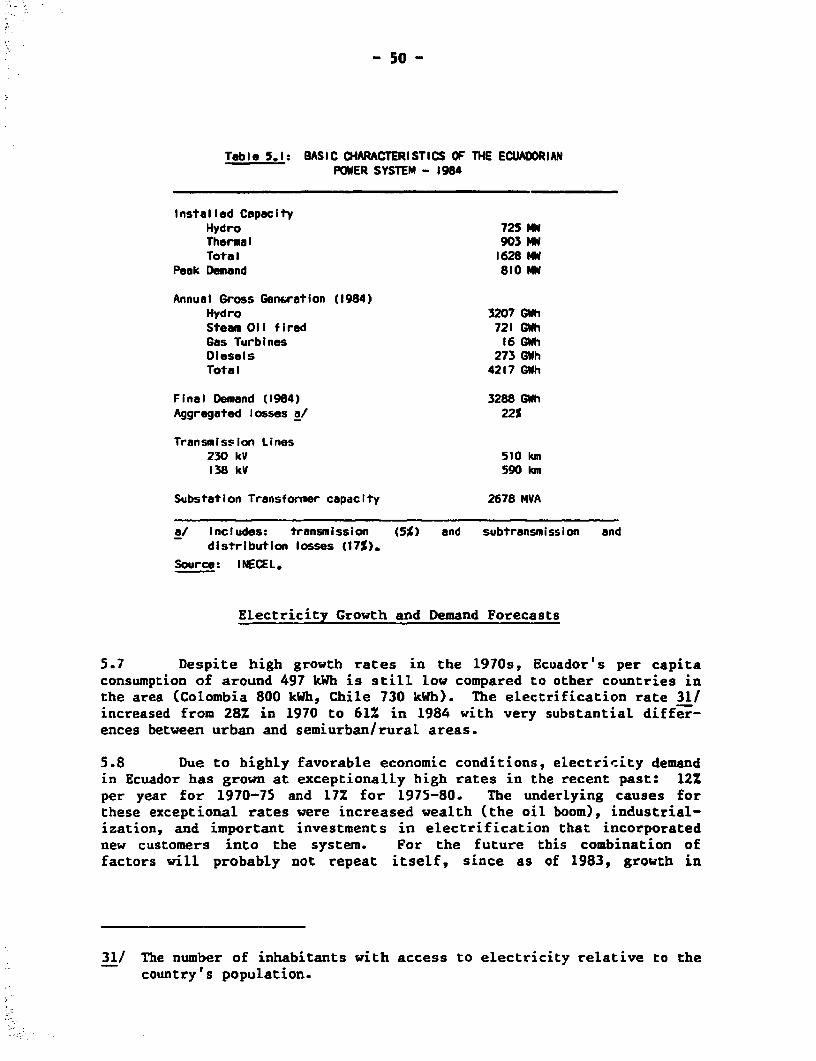
- 50 -
Table 5.1: BASIC CHARACTERISTICS OF THE ECUADORIANPOWER SYSTEM - 1964
Installed CapacityHydro 725 MWThermal 903 MWTotal 1628 MW
Peak Demand 810 MW
Annual Gross Gencration (1984)Hydro 3207 GWhSteam Oil fired 721 GWhGas Turbines 16 GWhDiesels 273 GWhTotal 4217 Gth
Final Demand (1984) 3288 GWhAggregated losses a/ 22S
Transmission Lines230 kV 510 km138 kV 590 km
Substation Transformer capacity 2678 MVA
a/ Includes: transmission (5%) and subtransmission anddistribution losses (17%).
Source: INECEL.
ELectricity Growth and Demand Forecasts
5.7 Despite high growth rates in the 1970s, Ecuador's per capita
consumption of around 497 kWh is still low compared to other countries in
the area (Colombia 800 kWh, Chile 730 kWh). The electrification rate 31/
increased from 28% in 1970 to 61% in 1984 with very substantial differ-
ences between urban and semiurban/rural areas.
5.8 Due to highly favorable economic conditions, electricity demand
in Ecuador has grown at exceptionally high rates in the recent past: 12%
per year for 1970-75 and 17% for 1975-80. The underlying causes for
these exceptional rates were increased wealth (the oil boom), industrial-
ization, and important investments in electrification that incorporated
new customers into the system. For the future this combination of
factors will probably not repeat itself, since as of 1983, growth in
31/ The number of inhabitants with access to electricity relative to the
country's population.
- 51 -
consumption had decelerated to 7% per year and preliminary data for 1984indicate a demand growth rate of only 2%.
5.9 INECEL's demand forecasts, which are based upon an econo-metric model relating consumption to CDP and sales, show the short-termgrowth rates at 6.2% for 1985-1990, 6.9% for the medium term (1990-1995)with improvements in the economy, and 8.52 for the long-term (1995-2005). 32/ The overall estimates seem reasonable for planning purposesgiven past experience and the inherent uncertainty that surrounds suchforecasts. Under these conditions, the demand of public utilities isexpected to grow from the current 808 MW to 1600 MW in 1995, and 3600 MWin 2005. Annex 13 shows INECEL's demand projections.
Short Term Expansion Plans
5.10 Generation. The 1985-1995 decade will witness four hydroprojects: Agoyan, Daule Peripa, Paute C and Paute Mazar. Agoyan(156 MW) is under construction and should come on line by 1987; DaulePeripa (130 MW), which is a multi-uurpose project, has completed designsand work is expected to start in 1987; Paute C (500 MW) is underway andcivil works have been already contracted; and Paute Mazar (174 NW) isstill under study.
5.11 Problems with the Mazar project are related to the Pautsdevelopment. The Paute-Amaluza dam is silting at about 3.5 million mper year; the dead st rage volume of the existing Paute-Amaluze cservoiris about 36 million m and would silt in about 10 years, after which timeturbine operation might become difficult. Paute C is the third phase ofa hydropower complex constructed in the Paute River. This complex con-sists of an existing 160-meter dam and a 500-NW hydropower station thatis already in operation. The Paute C project would consist of an addi-tional tunnel and another hydropower plant, using the existing Paute-Amaluza reservoir to feed the new plant. Because the project makesbetter use of an existing dam, it appears very attractive, as it wouldcost only about US$250 million and would have an installed capacity of500 MW, for a cost of US$500/kW.
5.12 Possible solutions to the silting problem, identified by INECELin January 1985, include: (a) constructing the upstream Paute Mazar damand reservoir; (b) installing a conventional dredging system 331 (c) de-veloping a new intake structure that would operate at variable levelsaccording to the rise in the sediment level; and (d) constructing asediment trap and a diversion tunnel that would take the sediments from
32/ Since INECEL recentLy indicated that the long-term forecast could betoo high, a periodic review should be carried out.
33/ This would not be a definitive solution but would help to reduce thesilting rate.

- 52 -
upstream of the reservoir and carry them to a place located downstream ofthe Paute Amaluza dam. IBRD map No. 19295 illustrates the alternativesto the Paute silting problem. 34/
5.13 Paute Mazar consists of a large multi-annual reservoir upstreamfrom the existing Paute plant. Associated to the reservoir is a rela-tively small hydro plant (174 MW). The benefits from the Mazar projectcan be sumnarized as follows: (a) regulation of the Paute River, there-fore benefitting the Paute A, B, C and other future downstream projectssuch as Sopladora (500 MW) and Cardenillo (840 MW); (b) sedimentationcontrol, thus preventing the silting of the existing Paute reservoir.The benefits and estimated costs of Paute Mazar are shown in Table 5.2:
Table 5.2: PAUTE MAZAR BENEFITS AND ESTIMATED COSTS
BENEFITS (Firm Gwh/year)
Paute Mazar 520Paute A, B, C +782Sopladora +443Cardenillo +595TOTAL 2340
COSTS (MS of Jan '84)Interest Rate 8%Direct Cost 617DoC 204TOTAL 821
Annual Cost 69
GENERATING COSTSUSf/kWh a/ 2.9USf/kWh b/ 5.3
a/ If Sopladora and Cardenillo are undertaken.b/ If Sopladora and Cardenillo are not undertaken.
5.14 If the Mazar plant is to be judged simply on energy terms, itcan only be concluded that a decision to proceed with its development iscontingent on further information with respect to the feasibility ofdownstream plants. The unit costs calculated above are reasonable whencompared to other projects in the expansion plan (e.g. Chespi-USc2.8/kWh,Chambo - USC2.9/kWh - at 8% discount). However, the conclusion thatMazar could be justified on this basis is based upon the assumption thatthe Sopladora and CardeniLlo plants are undertaken. If, due to resultsof feasibility studies and/or designs, these developments prove to be
34/ Since the assessment mission, INECEL considers alternative (b) to bethe optimum solution and alternative (d) to be too costly.

- 53 -
uneconomical, the corresponding costs of Hazar increase to USC5.3/kWh, avalue that is excessive if compared to other developments.
5.15 Apart from its energy implications, Paute Mazar must beconsidered as a long-.erm solution to the sedimentation of the existingPaute reservoir. If no measures are taken, Paute A, B and C would haveto operate as purely run-of-the-river plants with no regulation. As aresult there would be a loss of 140 MW in Paute A, B, C due to the lowerhead, in addition to higher operating costs.
5.16 Civen the complexities of the problem, and taking into accountthat other technical alternatives (such as a dredging system, a newintake and a sediment trap) should be analyzed in detail, the missionrecommends the following course of action: (a) complete the list ofpossible technical alternatives to solve the silting problem; (b) eval-uate the least-cost solution under two possible scenarios: (i) assumingthat Sopladora and Cardenillo projects are undertaken, and (ii) assumingthat these projects ar? postponed; (c) accelerate as much as possible thefeasibility studies for Sopladora and Cardenillo in order to make adecision with respect to Mazar in 1986-87.
5.17 At this point it is important to analyze, expost, whether theMazar problem points out a planning deficiency in INECEL, or whether thedifficulties can be attributed to chance. In this respect, the Pautecomplex and Mazar were designed and conceived as an integral devel-opment. The original site for Mazar proved inadequate due to geologicaldifficulties after Paute A and B were commissioned. As a result, the damhas been relocated upstream with negative consequences; i.e., its sizeand cost have increased, its regulating capacity is smaller and it doesnot receive the influx from the Mazar River that originally flowed intothe reservoir. Given these events it can be said that the Hazar problemis more a result of insufficient information rather than poor planning.However, the problem does point out the need to count on feasibiliLystudies for the crucial projects of a given river basin before startingmajor developments on it.
5.18 Transmission. Definite transmission expansion plans exist for1985-1991. They consist of (a) transmission reinforcements in order tocomplete the 230-kV ring encompassing Quito and Cuayaquil, (b) transmis-sion lines that connect generating plants to the main ring, and (c) 138-kV radial in order to incorporate new regions to the system. All theseplans contribute to (a) deliver all Paute A-B energy to the system,(b) increase reliability (considering that most of the supply shouldoriginate in Paute), and (c) open up markets for hydra energy that willsubstitute present bunker or diesel plants. These benefits should makethe reinforcement of the transmission system (including substations) oneof the highest priority items on the investment agenda.
5.19 Subtransmission and Distribution. The total budget forsubtransmission and distribution is around US$137 million for 1985-1988. Additionally, US$66 million are budgeted for rural electri-
- 54 -
fication. In physical terms, projected investments call for 808 MVA innew substations or expansions thereof. Of these additions, 412 MVAcorrespond to areas outside Quito or Cuayaquil.
Long Term Expansion Plans
5.20 INECEL's methodology for long-term planning consists of a well-structured set of models that enable them to formulate least cost plansfor a given demand forecast. These models could be strengthened withadditional programs that would take into account the stochastic nature ofhydro energy in greater detail than the present ones. As is customary inthese studies, generation plans are formulated first, with a relativelylarge horizon (20 years), and tranmission plans are adjusted according tothe resulting location of generating facilities. In this respect, INECELplans to continue development of 230 kV lines; higher voltages are notnecessary given the size of the system. INECEL has a capable planningstaff for developing models; however, they could be strengthened throughtechnical assistance and, in particular, with the advice of those consul-tants who helped in developing the existing models.
5.21 The long term plans (1996-2010) call for a predominantly hydrodevelopment. Most of the projects have studies at the prefeasibility orassessment stage. Given that all the projects are in the Andes mountainrange, problems (geological ones in particular) are to be expected.Thus, one of the main efforts to be made in the short-term is to advancethese projects to the feasibility stage in order to take advance measuresif some of them do not prove economical. Between 1985-1990, INECEL plansto invest around US$100 million for studies of all the projects includedin the long-term plan. This should provide ample lead time to change thelong-term plan if major difficulties are found.
5.22 Long-term plans should take into account other resources suchas geothermal or natural gas. Concerning geothermal, INECEL shouldclosely monitor the pilot project being developed with ICEL, theColombian utility, in order to confirm whether the resource is compe-titive with hydro plants. With respect to gas, once reserves in the Gulfare assessed, INECEL should coordinate with CEPE a pipeline feasibilitystudy in order to determine whether the resource can be economically usedfor thermal generation. In order for CEPE to be able to assess theinvestment in additional exploration, INE-EL should conduct a study toprovide CEPE with the electrical sector's demand for naturaL gas atdifferent delivery prices.
System Operations
5.23 INECEL at present is the major source of generation for thecountry and it is conscious of the need to minimize thermal costs.Perverse incentives induced by low retail prices for petroleum productscreate contradictions between the need to replace fuels (fuel oil and
- 55 -
diesel oil) and the need to reflect long-run marginal costs -- fuel-oilbased generation costs around USCl.5/kWh compared to a long-run cost ofUSc2.6/kWh. INECEL therefore has implemented agreements that induce itssubsidiaries to purchase energy instead of generating it. However, thistype of measure translates into low block sales tariffs that adverselyaffect INECEL's finances.
5.24 As seen by INECEL staff, the utility's major operating problemconsists of the lack of flexibility in procurement: a ciear example isthe transformer lacking in a Guayaquil substation that would save US$1million/month for a cost of US$0.75 million. Although operations staffhave clamoured for action in this respect, red tape has held up deliveryby a year or more. Procurement is further complicated by limitations onexpenditures the company can authorize: by law, all expenses above aboutUS$10,000 have to be approved by the Board of Directors. 35/ Thiscreates congestion in decision-making that in practice involves the Boardin the daily running of the company.
5.25 The quality of service has deteriorated 3ince the Paute plantwas commissioned: three major contrywide blackouts have occurred in thelast two years. The causes have been associated with: (a) startupproblems and (b) the reliance on a single double circuit, 230-kV line forPaute production. These problems should be solved once the Agoyan plantcomes on line and the 230 kV ring is closed.
5.26 While subtransmission and distribution losses on a nationalscale average 17Z, they are quite variable within the system. Forexample, the Santo Domingo system has losses on the order of 27%, whereasEMELEC has losses of about 9%. However, it is necessary to distinguishbetween technical losses and losses caused by invoicing errors and theft.The mission considers that this is a case in which an analysis must bemade on a company-by-company basis; initially, concentration should befocused on invoicing and theft probLems rather than on placing too muchemphasis on technical losses, which could be reduced later. 36/
Sector Finances
5.27 The Ecuadorian power subsector has been facing seriousfinancial problems for a number of years. These problems only becameapparent at the turn of the decade, after the se-or had started on anambitious investment program designed to replace -hermal with hydro-electric generation and to interconnect the country'_. isolated regionalsystems to a national power grid. At the time, the country was enjoying
35/ This limit has been extended to US$100,000.
36/ The analysis has recently been initiated.
- 56 -
unprecedented prosperity arising from the increase in oil prices and itsincipient role as an oil exporting country. In this context it wasdecided that the costs of the investment program were to be funded by oilrevenues and not by consumers through tariffs. The subsequent decline inoil prices and the concurrent Latin American debt crisis found the sectorill-prepared to face financial realities. Since other sectors are seento have a higher priority, INECEL and its subsidiaries should seek toidentify and use some of their own resources for financing the expansionprogram.
5.28 Past tariff policy resulted in negative operating incomes for1983 and 1984, although some improvements occurred in 1984 because ofreduced fuel expenses associated with the starting of the Paute hydro-electric plant. Net internal cash generation also has become increas-ingly negative over the period. In 1984, it was about -US$67 million andwould have been more negative but for the rescheduling of a portion ofthe debt amortization that had become due.
5.29 The large diferences between present rates and marginal costsshow up dramatically in the financial situation. If the sector is tobecome self-reliant by 1988 it should seek an average rate increase onthe order of 85% by that date. However, INECEL's own projectionsindicate that they propose to continue relying on oil royalties by up toUS$129 million for 1988. This divergence of views should be cleared upwithin the government by making a formal agreement with INECEL concerningtariffs and contributions which would establish a consistent policy.
5.30 The sector should define a financial strategy that willincrease net internal cash generation, reduce its dependence on oilrevenues and external borrowing. Government contributions through theNational Electrification Fund should be maintained over the next yearsbut on a level compatible with the country's priorities. The financialsituation of the sector has to be assessed in relation to economicconditions by considering the following: (a) macroeconomic problemssuggest that the sector should abandon its almost total reliance on theGovernment to fund its needs; (b) difficult access to foreign borrowingmakes this financing sc..rce unrealistic, with the possible exception ofsome supplier's credits; and (c) fuel price subsidies will have to bereduced significantly in the next few years in accordance with thecountry's fiscal requirements.
5.31 Within the sector there is a lack of financial discipline thattranslates into excessive accounts receivable by INECEL. The currentdebt for energy sales from INECEL to its subsidiaries is equivalent tonine months billing, and INECEL shows correspondingly unfavorableliquidity ratios.
5.32 Despite its poor financial evolution, the debt structure of thesector is good, as government contributions have allowed it to limit thereliance on borrowings as a source of funiing. The sector's debt/equityratio of December 31, 1983, was around 34:66, and INECEL's ratio was28:72 by the end of 1984, which is quite low by normal sector standards.
- 57 -
The Power Sector Investment Program
5.33 In order to meet energy demand, take advantage of economies ofscale in generation, and reduce distribution losses during the comingyears, INECEL and its subsidiaries have prepared generation, transmissionand distribution construction programs for 1985-1988. The specificobjectives of the power sector expansion plan are: (a) to finalize theconstrue;tion the Agoyan hydroelectric project; (b) to initiate the con-struction of the third phase of the Paute generating complex (Paute C)and the Daule-Peripa hydropower component; (c) to add transmission andsubtransmission lines; and (d) to conduct feasibility studies. INECEL'sinvestment program would amount to about US$800 million (1984 prices) --and would absorb about 20Z of available public sector investment funds.Table 5.3 presents INECEL's investment program in the power sector for1985-1988.
Evaluation of INECEL's Investment Program
5.34 Short term economic conditions are such that a reduction inpublic investment will be necessary in the 1985-88 period. Taking intoaccount the Public Investment Review requested by the GOE and conductedby the World Bank in May of 1985, the mission reviewed the electricalsector's proposed investment program with the purpose of seeking anoverall reduction of one third. In formulating an alternative investmentplan, the mission has sought to postpone lower-priority projects. Thefollowing specific considerations were taken into account: Agoyan willenter into operation in 1988 and that new generating capacity will not beneeded before 1993; Paute C should be deferred (one or two years) untilmore information on sediments and ways to handle them is available; andDaule-Peripa hydroelectric project is not needed until the early 1990sand could be delayed one or two years. 37/ The deferment of investmentsin new hydro projects could entail an economic cost due to the need for amore intense use of existing thermal facilit.es (bunker-fueled plants inparticular); moreover, given the large reserve capacity of the system,supplies would not be jeopardized by this measure. Table 5.4 shows theinvestment program recommended by the mission.
5.35 The Agoyan project, started in 1982, is scheduled to befinished in 1987. This project is a priority for the generationexpansion program. The civil works are substantially aevanced and theequipment has already been ordered. To finish the project would requireabout US$80 million (1984 prices). The mission considers that theproject should be finished according to INECEL's schedule.
371 The GOE has already decided to implement Paute C and Daule-Peripa.

- 58 -
Table 5.3: INECEL'S INVESTMENT PROGRAM1985-88
Installed ConstructionInvestment Category Capacity Total Cost Period
(MW) (millionUSS 1984)
Generation 960 345.7Agoyan 156 78.8 a/ 1982-88Paute "C" 500 183.3 1985-91Daule-Peripa 130 60.5 1988-90Paute mazar 174 23.1 1988-95
Transmission &Substations - 119.2 ongoing
Subtransmission &Distribution - 202.8 ongoing
Studies - 95.3 -ongoing
Other - 16.2 ongoing
Total - 779.2
a/ Costs to finish the project. Total costs estimated at USS250million.
Source: INECEL and Ecuador Public Investment review, World Bank -June 1985.
Table 5.4: RECOMMENDED INVESTMENT PROGRAMIN THE POWER SECTOR, 1985-1988
(Million 1984 USS)
I ECEL'S RecommendedInvestment as % of
Project Program Recommended a/ Proposed
Generation 345.7 156.1 45Agoyan 78.b 78.8 100Paute "C" 183.3 58.4 32Daule-Peripa 60.5 11.5 19Paute-Mazar 23.1 0.0 0Rehabilitation Thermal - 7.4 -
Transmission & Substation 119.2 93.1 76
Subtransnlssion aDistribution 202.8 202.8 100
Studies 95.3 40.0 42
Other 16.2 8.0 49
Total 779,2 500 64
a/ By the Public Investment and Energy Assessment Missions.
Source: INECEL and World Bank.
- 59 -
5.36 Paute C. Civen the complexity of the sedimentation problem inthe development of the Paute River (paras. 5.11-5.16), it would beadvisable to postpone civil wore-s on the Paute C project until moreinformation about sediments, including proposals for handling them,becomes available. 38/ To generate this information it would benecessary to engage experts in sedimentation, erosion, and hydraulics tofind a solution to extend the economic Life of the Paute-Amaluza reser-voir. INECEL has ample time to assess the sediment problem, startconstruction of Paute C in 1986 or even in 1987, and still finish theproject before 1994, when it might be needed.
5.37 Daule-Peripa is a multiple-purpose project with a hydroelectriccomponent. The cost of the hydroelectric component, which is to be con-nected to the dam, would be about US$108 million (1984 prices); it wouldhave an installed capacity of 130 MW (75 MW firm capacity) and an averageenergy output of about 400 GWh per year. This energy output, if producedin a thermal power plant, would require about 663 thousand barrels ofbunker C. At a price of US$28.37/bbl. (i°84 average price), the savingsin fuel cost could be about US$19 million per year. In view of thepresent resource constraint and the fact that installed capacity wouldstill suffice to meet peak demand in 1991, it would be advisable to deferconstruction of the hydropower component two years and start constructionin 1989. Results of economic analysis have shown that the economic dis-advantages of such a deferment would be marginal.
5.38 Transmission. Considerable transmission improvements areexpected in the National Interconnected System (SNI) with the con-struction of the last section of the transmission ring (230 kV trans-mission line between Paute and Ambato) which is part of the expansionprogram for 1985-1989. Some 300 kms of 138 kV transmission lines arealso included in the .985-1989 expansion program. Those lines areexpected to provide the links between the main transmission ring andother centers of consumption.
5.39 INECEL plans to invest US$130 million during 1985-1989 in theexpansion of its transmission facilities. In view of their importancefor fuel substitution, further electrification, improvement in systemoperation and loss reduction, these investments can be consideredreasonable and should be maintained. In considering a reduction oftransmission investments, the principal cuts therefore have concentratedon those lines and substations associated with deferred generation plans.
5.40 Subtransmission and Distribution. Plans are to integrate allisolated systems into the main SNI network through subtransmission linesof 69 and 34.5 kV. The responsibility for carrying out the expansion and
38/ Even if the construction has started, the project could still bedelayed according to the power demand requirements, INECEL'sfinancial situation, and the country's priorities.
- 60 -
connection of the subtransmission and distribution systems, includingrural electrification, lies mostly with the regional electric companiesunder the supervision of INECEL. With the exception of EMELEC inGuayaquil, aLl other 16 regional electric companies are subsidiaries ofINECEL. The amount of investment allocated for subtransmission, dis-tribution and rural electrification during the years 1985-1988 isestimated to be in the range of about US$200 million, a reasonable amounttaking into consideration the low electrification rate in Ecuador.
Studies
5.41 INECEL's investment plans include various feasibility studies,mostly for new hydroelectric projects. Most of these studies are alreadyur-der preparation or committed. They would also provide the basis forplanning. It should be emphasized that certain studies are of thehighest priority (i.e. Cardenillo and Sopladora) due to their effects oncurrent decisions and should be maintained. Furthermore, if studies areto be ranked in order of priority, the mission suggests that emphasisshould be placed on "small" projects (i.e. in the 100-300 MW range) thatcould provide for greater planning flexibility than the larger and risk-ier plants that ultimately can be more expensive. This is particularlyimportant in Ecuador with its limited financial resources and macro-economi- constraints. An amount of about US$40 million, to be inve;tedin studies during 1985-1988, would be adequate.
Institutional Problems
5.42 The sector has tried to implemenc a rational institutionalstructure by grouping together companies serving adjoining sections ofthe country. In practice, the new company has been formed but the oldcompanies continue to exist. As a result, more concessionaires exist atpresent than when reorganization began.
5.43 INECEL is currently studying this problem and one of the majorpoints on its agenda concerns the operational impediments discussed inpara. 5.24. An alternative under study is to reorganize INECEL'soperations so it would be able to circumvent a large amount of the legalconstraints that bind INECEL at present. At the subsidiary level, plansfor integrating companies into stronger units face political oppositionat the local level and a solution is feasible only if the Governmentdecides to back INECEL in its negotiations for liquidating the smallenterprises.
5.44 In the early 1990s, INECEL's plans call for the simultaneousexecution of up to four hydro projects. Given their present organizationsuch a situation would tax management's capabilities above the level theycould reasonably cope with. To control the execution of the expansionprogram it would be desirable to explore alternative types oforganization for successfully managing the projects.
- 61 -
5.45 EMELEC's status is being negotiated and the future entity thatwould distribute power in Guayaquil could be either an INECEL-type ofsubsidiary with local investment, or an autonomous organization similarto the Guayaquil Port Authority. The latter possibility would create autility that would be practicalLy independent from INECEL and would notcontribute to the efficiency of the sector.
Recommendations
5.4o The mission recommends that INECEL should take the followingactions:
(a) Continue the analysis of the Paute Mazar project by taking intoaccount all feasible alternatives to solve the silting problem;
(b) Execute as soon as possible the feasibility studies forSopladora and Cardenillo to adequately assess the downstreambenefits of Paute Mazar;
(c) Seek a solution to the sector's financial problems through acomprehensive agreement between INECEL, its subsidiaries andthe Government. Such an agreement should contemplate (i) aplan for government contributions to the sector based uponcountry-wide priorities, (ii) a plan for tariff increases basedon marginal cost analysis and consistent with the sector'sfinancial plans, and (iii) a plan for exerting influence onINECEL subsidiaries to encourage them to comply with theirobligations for supplementing INECEL supplies;
(d) Carry out a loss reduction study focussing initially oninvoicing and theft problems;
(e) Proceed with the survey to determine institutional problems inthe power sector and in INECEL itself. The survey wouldinclude a recommendation for a rationalization of the presentfunctional structure and improvements of INECEL's presentinformation systems.
(f) Seek a solution to INECEL's operating difficulties by organiz-ing the present operational divisions in such a way thatprovisions for procurement are taken opportunely (i.e., largerstocks of spare parts);
(g) Analyze with anticipation the problems that may arise inmanaging several construction contracts for hydro plants andseek alternatives that will allow INECEL to execute theprojects efficiently;
(h) Seek greater coordination between INECEL and INE in demandproiections and with CEPE in relation to gas availability.
- 62 -
VI. FUHLWOOD
Background
6.1 Although deforestation is not a major national issue inEcuador, real and growing regional fuelwood supply deficits occur,especially in the southern half of the central Sierra region. Thecurrent GOE forestry program has no direct energy component to addressthis supply problem, and the small existing remedial programs funded byvarious international aid donors are too small and not coordinated at thenational level. Because of the low cost of alternative fuels and therelative abundance of fuelwood, there have been no major conservationinitiatives in this sector. While the presence of a regional supplyproblem can be acknowledged, it has not yet been adequately quantified.
6.2 The predominant use of fuelwood in Ecuador is in the householdenergy sector. The overall contribution of fuelwood to the total 1984national energy demand is approximately 20Z. This contribution hasdropped significantly from 48% in 1970 and 35Z in 1975 because of theinfiltration of low-cost convenience fuels (kerosene, bottle gas, low-octane gasoline, and electricity) into the sector in both urban, and to amore limited extent, rural areas.
Fuelwood Consumption
6.3 A breakdown of the residential consumption by geographic sectorwas calculated by INE as 2.1 kg per person per day in the Sierra, 1.9 kgper person per day in the Coastal region, and 2.9 kg per person per dayin the Oriente. The heavy consumption in the Oriente must be prefaced bythe facts that population is very low -- about 3% of the country's total,and that fuelwood from native foresta far exceeds the populationdemands. A small difference is obscrved between consumption in tb- hotcoastal region and the cool Sierra region, where wood is used forhousehold heating and cooking. The narrow spread would appear to be anindicator that while needs are greater in the Sierra, supplies areextremely scarce in some areas, holding down the average consumptionvalue. The coastal region is assumed to have a reasonable supply-demandbalance for the near term.
6.4 In 1984, Ecuador consumed 854,000 toe of fuelwood of which theresidential consumption of fuelwood was estimated at 680,000 toe (80%),concentrated in the rural areas. The demand for fuelwood for industrialusers, including charcoal production, was estimated at about 170,000 toefor 1984. As the market for charcoal has evolved into the specialtymarket of restaurants and others, its contribution to the total nationalenergy consumption has been estimated at not more than 12 of the total.
- 63 -
6.5 A large industrial fuelwood user in Ecuador is the brick in-dustry. There are about 300 wood-b rning brick kilns in Ecuador thatconsume, at full capacity, 108,000 m p.a. 40/ 41/ The balance of theindustrial demand is made up of small bakeries, small farmer crop drying,and fuel supplementation in the sugar industry. 42/
6.6 The average price for fuelwood in Ecuador is about 1 sacre perkg. Fuelwood and charcoal prices in Ecuador show a great discrepancy.Industrial users pay as little as 0.75 sucres per kg, while suburbanQuito homeowners can pay as much as 3.5 sucres per kg to burn wood infireplaces. Charcoal shows an equivalent spread in prices witb retailprices in Quito being as high as 10 sucres per kg and prices in the morerural areas being as low as 3 sucres per kg.
6.7 When using the cost of useful energy, kerosene becomes thelowest cost fuel in Ecuador (see Table 2.1). However, the free col-lection of fuelwood is a major constraint to the use of kerosenestoves. A reversal may occur since now roughly 50Z of household fuelwoodusers have to purchase wood, up from 24Z in 1979. Kerosene stoves arenow increasing in urban and wood deficit areas. As a result, the missionrecomends an economic analysis to compare a woodstove program withkerosene stoves.
Projected Demand
6.8 The level of absolute demand for fuelwood is expected to remainrelatively stable until 1990 and then to drop at an estimated 12 peryear. Fuelwood demand for the next ten years will be determined by themagnitude of further price increases for petroleum based fuels, 43/ theoverall race of population growth, and urban migration. Fuelwood demandbeyond 1995 will be a function of reforestation activities which to dateare not well defined for energy purposes.
40/ Assuming 15 m3 of fuelwood per kiln per cycle, and 24 cycles peryear.
41/ Based on an INE survey of 43 brick makers in the Quito area, thebrick industry is presently operating at one-third capacity or less.
42/ The sugar factories are also consumers of heavy fuel oil; onefactory burns exclusively fuel oil and exchanges bagasse for fueloil with a paper making processor.
43/ INE has estimated that at least 42Z of the rural inhabitants nowpossess a stove capable of burning kerosene, LPC, or gasoline.
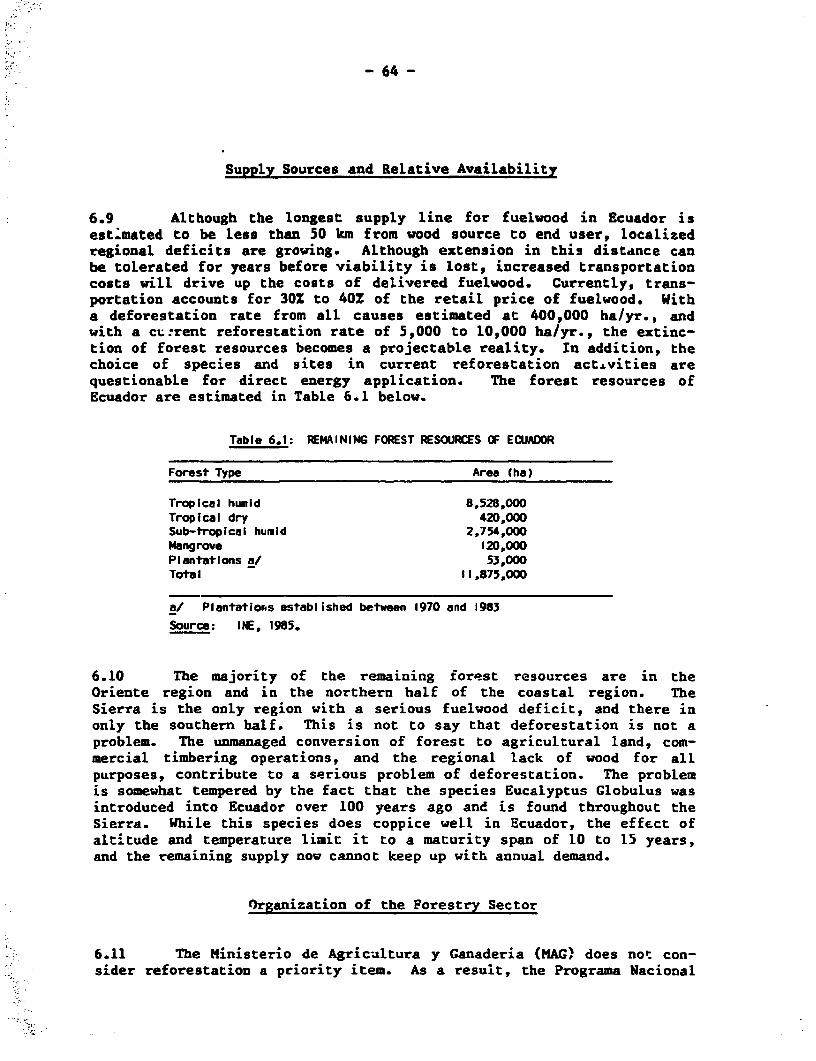
- 64 -
Supply Sources and Relative Availability
6.9 Although the longest supply line for fuelwood in Ecuador isest;mated to be Less than 50 km from wood source to end user, localizedregional deficits are growing. Although extension in this distance canbe tolerated for years before viability is lost, increased transportationcosts will drive up the costs of delivered fuelwood. Currently, trans-portation accounts for 30X to 40X of the retail price of fuelwood. Witha deforestation rate from all causes estimated at 400,000 ha/yr., andwith a cu rent reforestation rate of 5,000 to 10,000 ha/yr., the extinc-tion of forest resources becomes a projectable reality. In addition, thechoice of species and sites in current reforestation act-vities arequestionable for direct energy application. The forest resources ofEcuador are estimated in Table 6.1 below.
Table 6.1: REMAINING FOREST RESOURCES OF ECUADOR
Forest Type Area (ha)
Tropical humid 8,528,000Tropical dry 420,000Sub-tropical humid 2,754,000Mangrove 120,000Plantations a/ 53,000Total 11,875,000
a/ Plantatiorns established between 1970 and 1983Source: INE, 1985.
6.10 The majority of the remaining forest resources are in theOriente region and in the northern half of the coastal region. TheSierra is the only region with a serious fuelwood deficit, and there inonly the southern half. This is not to say that deforestation is not aproblem. The unmanaged conversion of forest to agricultural land, com-mercial timbering operations, and the regional lack of wood for allpurposes, contribute to a serious problem of deforestation. The problemis somewhat tempered by the fact that the species Eucalyptus Globulus wasintroduced into Ecuador over 100 years ago and is found throughout theSierra. While this species does coppice well in Ecuador, the effect ofaltitude and temperature limit it to a maturity span of 10 to 15 years,and the remaining supply now cannot keep up with annual demand.
Organization of the Forestry Sector
6.11 The Ministerio de Agric-ultura y Ganaderia (MAGC does not con-sider reforestation a priority item. As a result, the Programa Nacional
- 65 -
Forestal (PRONAF) does not obtain adequate support from MAC. PRONAF wasestablished to manage the forestry sector and government forest lands.Hoever, lack of coordination, plus insufficient funding and manpower, hasprevented PRONAF from having an effective impact on the sector, espe-cially in the area of reforestation. While both INE and PRONAF aredirectly involved in small projects to conduct species trials and estab-lish small plots at altitudes up to 3,500 m where trees of any kind areextremely scarce, there is no coordination betwen the two organizations.In addition, the executive director of PRONAF has no direct access to theMinister and the district chiefs cannot get directly to decision-makerswithin PRONAF. The mission has recommended a reorganization of PRONAF asshown in Annex 14.
Reforestation Programs
6.12 The reforestation history in Ecuador is one of little success,and has not incldded any direct energy component. Since 1970, governmentreforestation programs have resulted in no more than 60,000 ha beingplanted, with private efforts achieving about half that amount. Thecurrent five-year plan for reforestation is optimistic based on pastperformance. 44/ With three major components encompassing 64,500 ha ofproduction forest, 30,000 ha of environmental protection, and 25,000 haof highway buffer, the only energy component in this program is indirectin terms of hydro watershed protection. There are manpower constraintsboth in PRONAF headquarters and in district offices which are aggravatedby the inefficient institutional organization of PRONAF. The FONAFORfunds must be filtered through the Central Bank or Development Bank,making access to the funds potentially difficult. Private sectorinvolvement is critical, especially in the forestry production area.Table 6.2 presents a breakdown of the FONAFOR/PRONAF program on aprovincial basis. This optimistic progrxm, which requires a replantingrate of about 5 to 6 times that achieved over the past 14 years, facesmany obstacles in the course of fulfillment.
6.13 Private sector reforestation activities are currently estimatedat 4000 to 6000 ha per year. The private enterprise association,Asociacion Industriales Madereros, is very active in trying to promotereforestation activities and could provide sufficient motivation andpressure to meet the reforestation goal.
6.14 There are small internationally-funded reforestation programsunder way that have energy components; however, most projects are aimedat high value species such as Pine, and have markets other than fuelwoodin mind.
44/ It is financed by a tax on petroleum exports.
- 66 -
Table 6.2: FIVE-YEAR FONAFOR REFORESTATION PLAN; 1984-1988
Production Plantations Environmental Protection Plantations
Project Hectares Cost Province Hectares Cost
(106 Sucres) (106 Sucres)
Carchi-imbabura 10,00W 250.0 Carchl 520 13.0
Pichincha-Cotopaxi 21,000 525.0 Imbabura 4,200 105.0
Chimborazo-Tungu-
rahua-Bolivar 15,000 375.0 Pichincha 9,100 231.0
Loja 9,000 225.0 Tungurahua 1,620 40.5
Canar 1,000 25.0 Chimborazo 1,350 31.0
El Oro 1,000 25.0 Bolivar 600 15.0
Los Rios l,000 30.0 Caiiar 2,500 62.5
Esmeraidas 500 7.5 Azuay 3,500 87.5
Napo 1.500 22.5 LoJa 1,620 48.0
Pastaza 1,000 15.0 El Oro 1,500 45.0
Morona Santiago 1,500 22.5 Los Rios 1,200 36.0
EsmeraIdas-Manabi-
Guayas 2,000 30.0 Esmeraidas 2.290 35.0
Subtotal 64,500 1,957.5 Subtotal 30,000 749.5
Highway Buffer Plantings complete the reforestation along 2000 km of rLeds, covering
an area of 25000 ha. Total cost of the program 3358 million sucres.
Source: "Informe a las Bases", Hugo de Caicedo.
Investment Priorities
6.15 From a preliminary analysis, the mission does not considerinvestments in reforestation for energy purposes to be a priority for theshort term. It has been found that the opportunity cost of fuelwood(when energy efficiency is taken into account) is more than twice that ofkerosene. This is due to the high reforestation costs in Ecuador asso-ciated with poor terrain and harsh climate in the deforested areas suchas in the southern Sierra. The mission considers that before any majorreforestation program is undertaken, a detailed benefit/cost analysisshould be made comparing a reforestation program for energy purposes withkerosene utiLization.
- 67 -
Recommendations
6.16 The mission recommends that INFOR and PRONAF should take thefollowing actions:
(a) Determine the magnitude of the fuelwood deficit in the Sierra.
(b) Update the 1979 INE report on fuelwood consumption in the ruralsector, but with a focus only on the southern Sierra region.The local supply-demand balance must be defined using fieldsurveys and census data.
(c) Include energy components in the nation's reforestation programtc ensure long-term fuelwood supply in the deficit areas.
(d) Reorganize PRONAF to ensure proper coordination and comuni-cation at all levels.

- 68 -
VII. NO*-_COVENTIOMAL RElGY SOURCES
7.1 This chapter analyzes the compLementary non-conventional energysources of interest for Ecuador, concentrating on geothermal, small hydrofor rural areas, solar energy, wind energy, biogas, bagasse, other cropresidues, and small wood-fired electric systems. The greatest constraintto the development of these non-conventional resources in Ecuador is thelow subsidized prices of alternative comuercial fuels found in thecountry.
Geothermal
7.2 There are two sectors which could benefit from geothermaldevelopment in Ecuador: the power sector, normally requiring high tem-perature fluid sources; and the industrial process heating sector, whichcan use lower fluid temperatures. Initiatives are underway in bothsectors with OLADE and INECEL focusing on the power sector, and INEcoordinating work for the industrial sector.
Power Applications
7.3 Given the largely untapped hydroelectric potential in Ecuador,a preliminary analysis would normally rate tlhe geothermal potential assecond priority. However, this may not necessarily be the case inEcuador as a result of the siltation problem (see paras. 5-11-5.12),which can severely rceduce the working life of any given sized reservoirunless costly remedial actions are taken. When the costs of all theremedial adjustments are considered (secondary dams, protection refores-tation, water intake protection), the true cost of production for thehydro projects can be substantially higher. In this context, the use ofgeothermal energy for power applications becomes an interesting alter-native.
7.4 Ecuador has good potential for developing geothermal energy forthe power sector, and further feasibility activities are warranted. TheItalian government, in cooperation with the GOE, is financing a prefeasi-bility study for an eventual 50-LOO MW 45/ power station in the Tulcan-Chiles region in Carchi province. The prefeasibility work 46/ willcomplete extensive geophysical analysis and also undertake the drillingof' some small diameter, shallow test wells of up to 400 m. Assumingsatisfactory findings with the test wells, a full feasibility study couldcommence shortly after completion of the current work.
45/ INECEL's plans call for a 10 MW plant as a first step.
46/ Scheduled to be completed by end of 1985.
- 69 -
7.5 INECEL is also considering prefeasibility studies in two otherSierra provinces, Imbabura and Cotopaxi. While the Japanese governmenthas expressed interest in funding such work near Cotacachi in theImbabura province, no outside funds have yet been committed to eithersite. Based on the superficial evidence available, the overall goe-thermal power potential has jeen estimated by INE around 60,000 MW. How-ever, geothermal can not be considered as a firm resource until theprefeasibility study is completed for the Tulcan-Chiles region.
7.6 As no geothermal wells yet have been drilled and the characterof fluids revealed, accurate cost of production figures for geothermalplants cannot be estimated. Given this uncertainty, it would appearappropriate to carry the current Tulcan-Chiles geothermal evaluation allthe way through feasibility confirmation. Tre feasibility study outputwould include sufficient resource definition and characterization toallow an accurate estimate of cost, and provide the opportunity toproceed directly to project implementation if the cost of the projectmade it competitive with further hydro development.
Industrial Process Heat Applications
1.7 The seccnd option for using geothermal energy in Ecuador is inindustrial process heat where lower temperature fluids, which are notnormally suited for power production, can be directly substituted forprocess heat now produced by electricity or the combustion of petroleumfuels. Because of the low prices of the competing f;els, an objectiveprogram evaluation will be needed by end 1985 to determine the merit ofany further spending in this area; this is included in para. 30 under thetechnical assistance requirements. INE, using EEC funded energy plannersand additional study funds from organizations such as USAID, hasdeveloped a program for industrial process heat substitution in the fivemajor industrial areas. Thus far, only the Quito and Cuenca areas havebeen evaluated and reported in detail. For both, some geophysicalevaluations have been performed and an industrial survey completed. INEis focusing on the area of the Valle de los Chillos, about 15 km fromQuito, in trying to promote a demonstration project. With USAID funding,INE hopes to identify an appropriate site, possibly near La CerveceriaAndina (brewery), where a shallow test well can be drilled in 1985.While the potential for substituting geothermal heat for oil in the Vallede los ChilLos could approach 4,000 toe per year, there are significantobstacles to overcome. The industrial base in the Valle de los Chillosis not concentrated, and the dispersed nature inhibits development.
7.8 The low price of diesel and fuel oil currently provides nofinancial motivation for the heat users to convert to geothermal, aspreliminary estimations for paybacks are 7 years if 500m wells can beused, and 14 years if 1,500 m wells are needed to obtain the desiredfluids temperature of 95°C. However, when compared to the opportunitycost for fuel oil of US$0.61/gal., the above paybacks fall to 2.65 and5.3 years -- a more reasonable commercial case. The well costs are esti-mated at about US$500,000 for a 500 m well and US$1 million for a 1,500 m
- 70 -
weil. By the end of 1985, the prefeasibility efforts should be completedfor the Valle de los Chillos, and an objective evaluation can be madeeither to proceed with demonstration or terminate the activity. 47/
Small Hydro For Rural Areas
7.9 The existing small hydro program coordinated by INE has meritfor extending the availability of electricity in rural areas where gridextension is not technically or financially feasible. The development oflow-cost, made-in-Ecuador hydro turbines and control systems is importantfor making these items competitive with the diesel systems normally usedfor remote rural electrification. Assuming a plant is scheduled to bebuilt, the substitution of such a program for diesel oil will be smallbecause of the small unit size. The perceived social impact of ruralelectrification programs is, however, large. USAID funds have been, andare, wisely used for this program. The resulting successful 50-kW Apuelademonstration plant has provided the design basis for a standard line ofturbines to be manufactured locally in eight sizes from 20 kW to 150 kW.
7.10 While the current INECEL rural electrification program has onlylimited applications planned, there are probably more than 150 feasiblesites in Ecuador, according to INE. INE could survey the sites anddevelop a proposal for an accelerated implementation, and even solicitdonor funds for such a rural development program.
Economic Comparison
7.11 Fifty 100-kW systems could be installed for about US$2 mil-lion. 48/ The capital cost required to install the same capacity insmall diesels would approach US$4 million so that US$2 million less wouldbe required to implement the small hydro program based on in-countrymanufacture of turbine and controls. With a combined use factor 491 of40Z, 17.52 million kWh could be generated per year. Comparable dieselplants at 25Z efficiency would produce 10.4 kWh per gallon of diesel.Therefore, the fifty small hydro plants would represent 1.68 milliongallons of diesel oil per year valued at US$1.46 million at the oppor-tunity cost of the diesel oil and US$622,000 at the retail price ofdiesel.
47/ Sufficient criteria for making a decision will not be availableuntil at least late 1985 when geophysical studies will have beeninterpreted by experts, and fluids obtained from a test well willhave been thoroughly analyzed.
48/ Assuming US$400/ki as in the Apuela (50 kW) experience.
49/ Average load factor and down-time considered.
- 71 -
7.12 INE's performance in this program has been good, and it canserve as a model for INE's efforts in other technology areas, and as amodel for scaling up this low cost hydro option to, possibly, 300 kW inunit size. The program is cost effective in Ecuador for a relativelywell-defined technology area. INE has searched internationally for theright technology application to pursue, modified it appropriately for thecountry context, and demonstrated it successfully.
Solar Energy
7.13 Solar radiation in Ecuador is an available resource technicallysuitable for thermal and photovoltaic applications. A major drawback toits use in thermal applications is that conventional methods of producinghot water are very inexpensive in Ecuador, from the viewpoint both ofcapital investment and operating expense. Photovoltaics are also tooexpensive compared to the competing sources.
7.14 Radiation data in Ecuador has been reasonably well monitored,and sufficient information is available for purposes of designing com-mercial systems. Annual average radiation values vary regionally (and toa certain extent, seasonally) from 2,800 watt hours/m2 per day to 4,700watt hours/m2 per day.
Thermal Applications
7.15 Although there are nine private firms in Quito and five inGuayaquil that are offering solar thermal systems comercially, theirpenetration of the market is inhibited by price competition with com-peting technologies. While the main product line is for domestic waterheating, applicatins for industrial process and crop drying products arealso available. For the past five years, the national domestic solarwater heating market has been about 100 units per year. The unitsavailable are either totally produced from local materials, or assembledlocally from imported components. Both thermo-syphon and pumped typesystems are offered. The typical domestic water heating system sold has60 gallons of water storage and 2.8 m2 of collector surface, and costsbetween US$500 and US$600.
7.16 As diesel oil and fuel oil are relatively low priced, both thehousehold water heating and industrial process heating markets are firmlyentrenched in the use of traditional energy sources and no real marketexists in this area for solar technology. While diesel oil has a unituseful energy cost of US1.6/kWh, a thermosiphon solar water heatingsystem rates at USC10.9/kWh, as shown in Tables 7.1 and 7.2. Therefore,there is insufficient financial incentive for either existing householdsto switch over or for new home builders to provide solar hardware underthe current circumstances.
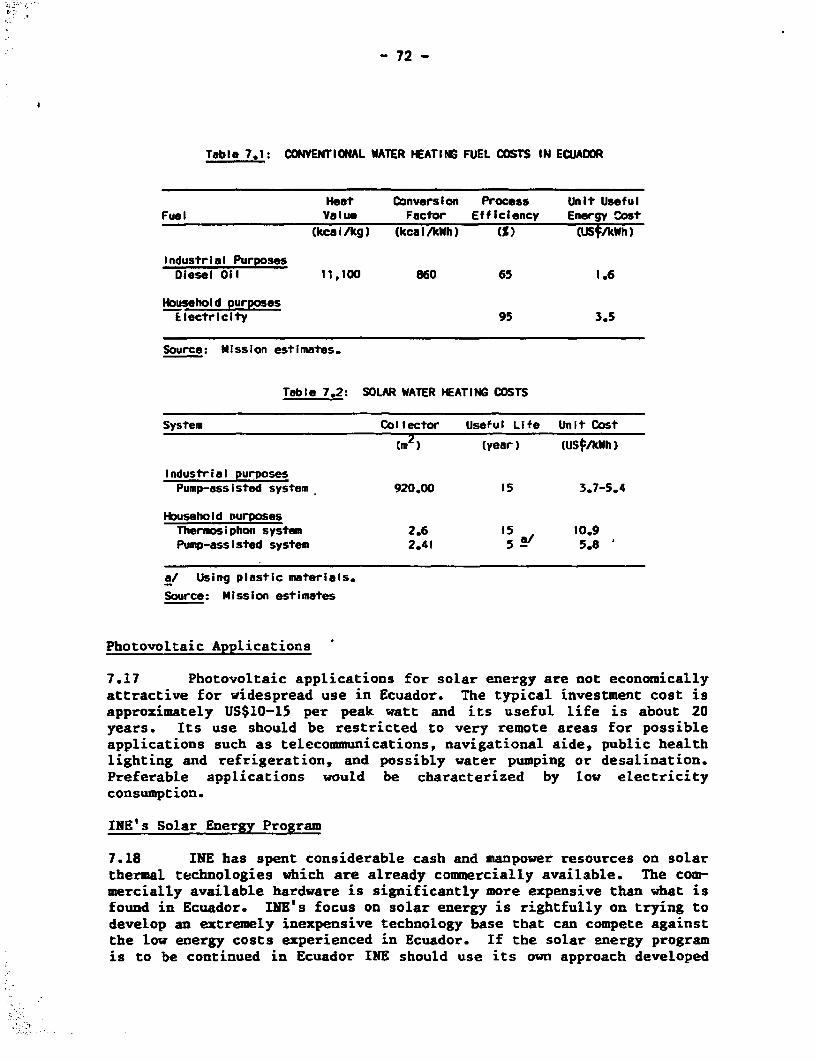
- 72 -
Table 7.1: CONVENTIONAL WATER HEATING FUEL COSTS IN ECUADOR
Heat Conversion Process Unit UsefulFuel Value Factor Efficiency Energy Cost
(kcalIkg) (kca IkWh) [S) (US¶/kWh)
Industrial PurposesOiesel Oil 11,100 860 65 1.6
Household purposesElectricity 95 3.5
Source: Mission estimates.
Table 7.2: SOLAR WATER HEATING COSTS
System Collector Useful Life UnIt Cost
(m') (year) (USMAkWh)
Industrial purposesPump-assisted system 920.00 15 3.7-5.4
Household ourposesThermosiphon system 2.6 15 10.9Pump-assisted system 2.41 5a/ 5.8
a/ Using plastic materials.
Source: Mission estimates
Photovoltaic Applications
7.17 Photovoltaic applications for solar energy are not economically
attractive for widespread use in Ecuador. The typical investment cost is
approximately US$10-15 per peak watt and its useful life is about 20
years. Its use should be restricted to very remote areas for possible
applications such as telecommunications, navigational aide, public health
lighting and refrigeration, and possibly water pumping or desalination.
Preferable applications would be characterized by low electricity
consumption.
INE's Solar Energy Program
7.18 INE has spent considerable cash and manpower resources on solar
thermal technologies which are already commercially available. The com-
mercially available hardware is significantly more expensive than what is
found in Ecuador. INE's focus on solar energy is rightfully on trying to
develop an extremely inexpensive technology base that can compete against
the low energy costs experienced in Ecuador. If the solar energy program
is to be continued in Ecuador INE should use its own approach developed
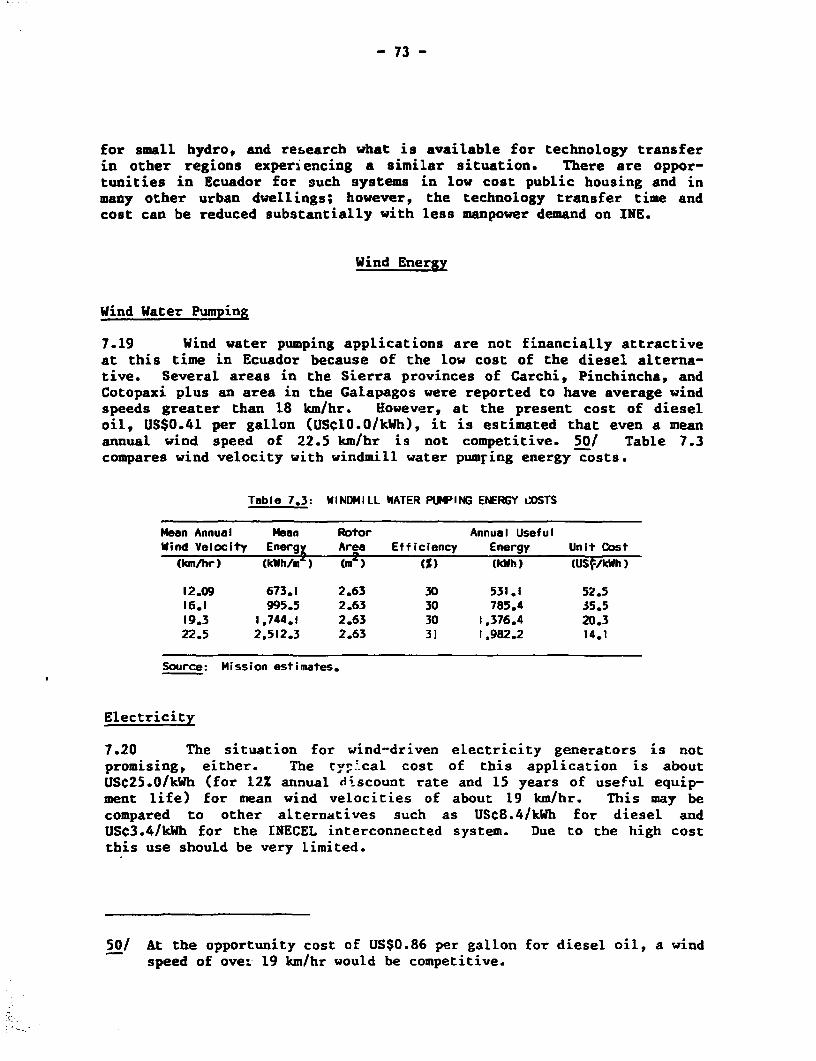
- 73 -
for small hydro, and research what is available for technology transferin other regions experiencing a similar situation. There are oppor-tunities in Ecuador for such systems in low cost public housing and inmany other urban dwellings; however, the technology transfer time andcost can be reduced substantially with less manpower demand on INE.
Wind Energy
Wind Water Pumping
7.19 Wind water pumping applications are not financially attractiveat this time in Ecuador because of the low cost of the diesel alterna-tive. Several areas in the Sierra provinces of Carchi, Pinchincha, andCotopaxi plus an area in the Galapagos were reported to have average windspeeds greater than 18 km/hr. However, at the present cost of dieseloil, US$0.41 per gallon (USC0.0/kWh), it is estimated that even a meanannual wind speed of 22.5 km/hr is not competitive. 50/ Table 7.3compares wind velocity with windmill water pumring energy costs.
Table 7.3: WINOMILL WATER PUWING ElERGY COSTS
Mean Annual Mean Rotor Annual UsefulWind Velocity Energg Area Efficiency Energy Unit Cost
2~(kan/hr) (kWh/um ) (m ) ) (kWh) (USfAlWh)
12.09 673.1 2.63 30 531.1 52.516.1 995.5 2.63 30 785.4 35.519.3 1,744.1 2.63 30 1,376.4 20.322.5 2,512.3 2.63 31 1,982.2 14.1
Source: Mission estimates.
Electricity
7.20 The situation for wind-driven electricity generators is notpromising, either. The try cal cost of this application is aboutUSc25.0/kWh (for 12% annual discount rate and 15 years of useful equip-ment life) for mean wind velocities of about 19 km/hr. This may becompared to other alternatives such as USC8.4/kWh for diesel andUSC3.4/kWh for the INECEL interconnected system. Due to the high costthis use should be very limited.
50/ At the opportunity cost of US$0.86 per gallon for diesel oil, a windspeed of ove:- 19 km/hr would be competitive.
- 74 -
Biogas
7.21 At an average cost of US$125 per m3 digester\capacity, the useof biogas is not competitive in Ecuador with diesel o:l, kerosene, orelectricity. Nevertheless, the work of INE, OLADE and others in biogasproduction in Ecuador has made a significant technology b.se available.There are currently 28 units 51/ in operation (at least, installed),averaging 12 m3 in size. The majority of the units are designed onIndian technology using cattle manure as the feedstock, altbough unitsfor other animal and/or crop residues have been attempted. The primarymarket would appear to be those farmers with 15-50 head of cattle whoperceive the decontamination and fertilizer production value, of theprocess to be as important as the energy production. However, it isunlikely that biogas will play a significant role in the energy zector.Since the commercial fuels are heavily subsidized, the dispersion ofagricultural activity in Ecuador is great, and the cost of collectingvegetable and animal wastes is high.
Other Biomass Energy Sources
Bagasse
7.22 The depressed world sugar market and the low cost of fuel oiland diesel oil are effectively inhibiting the further exploitation ofbagasse in Ecuador. Bagasse has traditionally been a significant con-tributor to Ecuador's industrial energy sector. In 1978 it represented32X of that sector's energy consumption, at 186,000 toe. By 1984 thecontribution dropped to 20%, at 152,000 toe. This 1984 value is somewhatmisleading as the total bagasse production of the largest sugar producer,San CarLos, is delivered to its neir%hbor, Papeleria Nacional, for papermaking and is not available as an energy source. Therefore, the trueenergy contribution of bagasse is lower. As a compensation, San Carloscurrently receives 1 kg of fuel oil from the Papeleria Naciot'al for each3.6 kg of bagasse it delivers, which is the thermal equivalent.
7.23 The Ecuadorian sugar industry is also a net user of commercialfuel to supplement its use of bagasse. In 1984 it is estimated that thesugar industry consumed an additional 8,000 tons of fuel oil and 1,000tons of fizelwood. This suggests that the efficiency of the industry isfar from optimum. Conservation initiatives and processing improvementscould result in making the sugar plants become not only energy self-sufficient but also net exporters of energy in the form of electricityor, possibly, even bagasse briquettes. Under current conditions and forthe foreseeable future, bagasse is not expected to make any increased
51/ Tncluding four large units, of which the largest is 180 m3.
- 75 -
contributions to the energy sector as no motivation exists to make thenecessary investments.
Other Crop Residues
7.24 The agricultural sector of Ecuador produces signiifcantquantities of residues which under diferent conditions, such as highernational energy prices, could be considered as alternative fuelresources. Table 7.4 shows the relative availability of crop residues in1980.
Table 7.4: AVAILABILITY OF CROP RESIDUES IN 1980
Crop Res idue
(Tons per Year)
Rice 428,000Barley 123,000Wheat 106,000Corn 2,205,000Cacao 82,000Coffee 62.000
Tota I 3,006,000
7.25 Approximately one half of the total, or 1.5 million tons, couldreasonably be considered as an energy source, leaving the other half foranimal feed, soil protection, etc. At a calorific value of 13,500 MJ perton, this represents an energy input value potential of about 500,000toe. While this is an impressive number, there are many inhibitingfactors in pursuing it as an energy source. The harvesting, grinding andbriquetting needed to get it into a transportable and useable form areestimated to cost at least US$30 per ton, making it very expensive comr-pared to current options. The agricultural production is also verydispersed, where a concentrated producing area would be the ideal. Thenecessary conclusion is that, although the resource is there, it is notfinancially viable enough to be considered as a usabLe energy source. Nosignificant contribution to the energy sector can be expected in theforeseeable future in Ecuador.
Small Wood-Fired Electric Systems
7.26 For small popultion centers in remote areas, where gridextension is not feasible and no hydro resources exist, small wood-firedpower systems could be economically attrative in the Oriente region wherean abundant fuelwood resource is found. The wood-fired option can nor-mally produce power for about half the price of competing diesel fired
- 76 -
systems, if world market prices are being paid for diesel fuel. Comparedat the retail price of diesel in Ecuador, however, wood-fired systemswould be at best a breakeven option.
7.27 The GOE is currently investigating the use of gasifier-internalcombustion engine systems for this application. The small scale evalua-tion of the gasification technology is warranted at this time, althoughconsideration of any program for widespread commercial implementation ispremature. With INE coordination, a small 20-kW system has been in-stalled and operated at the Escuela Politecnica in Guayaquil. For remoteinstallations in Ecuador, gasification technology can only be consideredas having very high risk for current applications, but good potential forthe future. Gasification offers the potential avantage of relativelyhigh efficiencies in small size ranges, above 20% overall for 100 kW andabove, compared to the normally used wood-fired steam power systems whichwould be below 10Z at this size. The efficiency difference narrows assize increases, and steam plants become cost competitive with gasifi-cation systems at plant capacities somewhere between 500 and 700 kW. Forapplications above 1 MW, wood-fired steam systems appear to have definitefinancial advantages.
7.28 The negative side of using wood-fired power systems is thatsuch uSE could be considered counter-productive to forest conservationinitiatives that are necessary to stop rampant deforestation, even in theOriente. The ideal application is a managed one where residues such ascommercial logging or sawmill wastes are utilized as the fuel for thepower plant. In a resource-abundant area, these normally go to waste.Here the application will be cost competitive with even the low pricedEcuadorian diesel fuel, and easily can be proven as not environmentallydetrimental.
Role of INE
7.29 INE, as the national energy planning center, has the organi-zational responsibility for energy planing and for coordinating research,development, demonstration and technology transfer activities with afocus on nonconventional energy resource applications and conservation.
7.30 INE, as the national energy planning center, appears to haveplaced much emphasis on areas with low pay-off on a national scale. 52/INE's performance can be attributed directly to the politicalsensitivities surrounding the major energy issues such as energy pricingand increased exploration activities, and the political vulnerability of
52/ INE has recently shifted its main emphasis to more important energyissues, i.e., studies on expansion of the refineries and energypricing.
- 77 -
the institution. In practice, the role of INE depends largely on thepersonal relations established between its staff and people that work inthe rest of the energy sector rather than on institutional links.
7.31 Activities such as small hydro have been worthwhile. The smallhydro program coord.nated by INE has great potential for extending therural electricity availability in the most cost effective means pos-sible. This is a well structured and well carried out program that INEitself should analyze for applying its methodology to other areas such assolar energy. INE can now focus on an implementation program for smallhydro units in close coordination with INECEL and regional governmentalauthorities.
7.32 The program being carried out by INE for geothermal processheat applications using EEC technical advisors and some USAID funding isideally directed at substituting geothermal fluid heat for process heatderived from combustion, and as such could have positive nationaleconomic implications. The problem remains that low competing energyprices remove any incentive for the private industries to incorporategeothermal fluids in their process heat systems. Without addressing themajor issue of energy pricing, the geothermal activity can only result ina dead-end, with a technically implementable alternative that is notfinancially viable, even though it would produce economic benefits to thecountry.
7.33 INE needs to change its perspective. INE, as the nationalenergy planning organization, should put its major focus on the mostimportant energy issues of the country. In order to provide greaterstability to INE personnel and to allow more continuity in the works andstudies realized by this organism, INE's wages should be brought up tothe average of the rest of the energy sector.
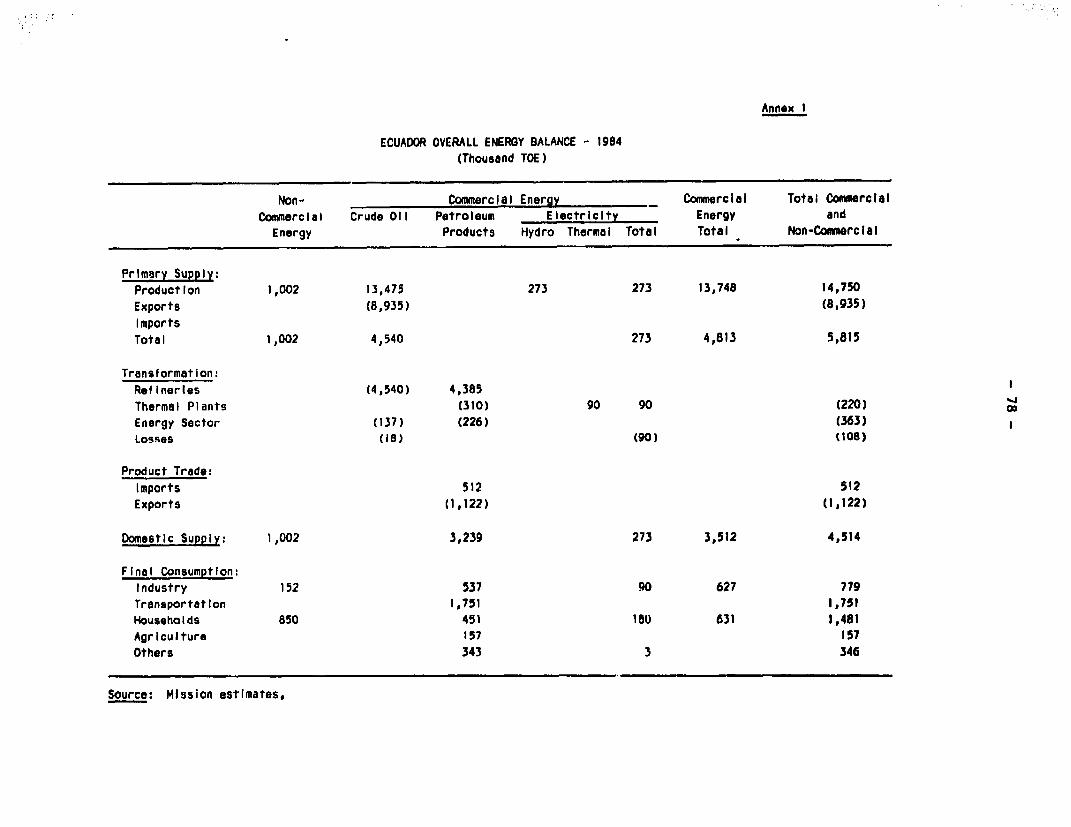
Annex I
ECUADOR OVERALL ENERGY BALANCE - 1984(Thousand TOE)
Non- Commercial Energy Commercial Total CommercialCommercial Crude Oil Petroleum Electricity Energy andEnergy Products Hydro Thermal Total Total Non-Commercial
Primary Supply:Production 1,002 13,475 273 273 13,748 14,750Exports (8,935) (8,935)ImportsTotal 1,002 4,540 273 4,813 5,815
Transformation:Refineries (4,540) 4,385Thermal Plants (310) 90 90 (220) GoEnergy Sector (137) (226) (363)Losses (i8) (90) (108)
Product Trade:Imports 512 512Exports (1,122) (1,122)
Domestic Supply: 1,002 3,239 273 3,512 4,514
Final Consumption:Industry 152 537 90 627 779Transportation 1,751 1,751Households 850 451 180 631 1,481Agriculture 157 157Others 343 3 346
Source: Mission estimates,
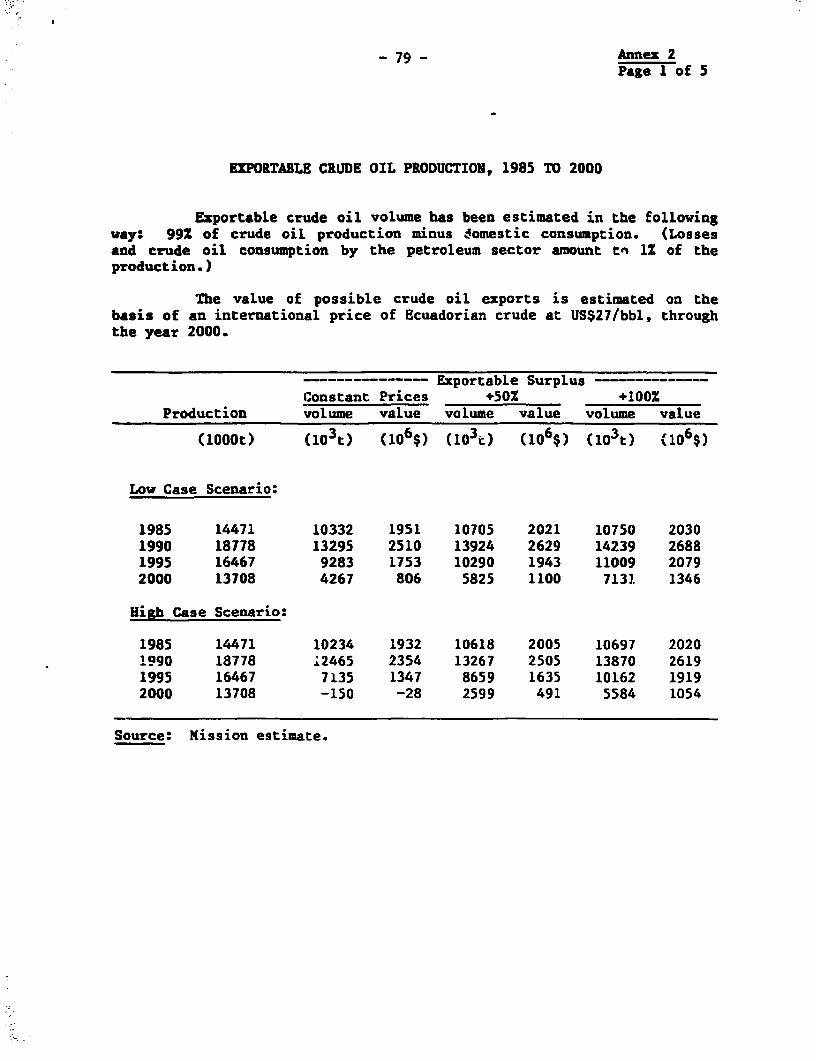
-79 Annex 2Page 1 of 5
EXPORTABLE CRUDE OIL PRODUCTION, 1985 TO 2000
Exportable crude oil volume has been estimated in the followingway: 99X of crude oil production minus d4omestic consumption. (Lossesand crude oil consumption by the petroleum sector amount to 12 of theproduction.)
The value of possible crude oil exports is estimated on thebasis of an international price of Ecuadorian crude at US$27/bbl, throughthe year 2000.
-- Exportable Surplus - ----------Constant Prices +50% +100%
Production volume value volume value volume value
(1000t) (103t) (106$) (103c) (106$) (103t) (106$)
Low Case Scenario:
1985 14471 10332 1951 10705 2021 10750 20301990 18778 13295 2510 13924 2629 14239 26881995 16467 9283 1753 10290 1943 11009 20792000 13708 4267 806 5825 1100 7131. 1346
High Case Scenario:
1985 14471 10234 1932 10618 2005 10697 20201990 18778 ;2465 2354 13267 2505 13870 26191995 16467 7135 1347 8659 1635 10162 19192000 13708 -150 -28 2599 491 5584 1054
Source: Mission estimate.
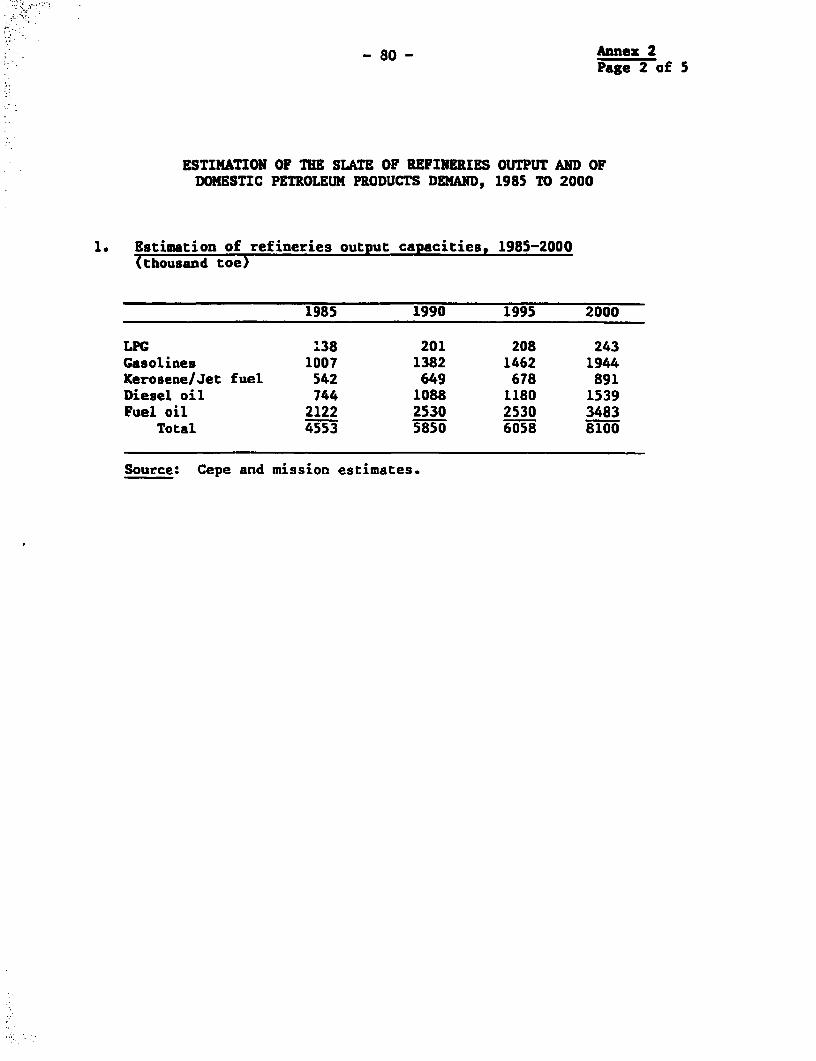
80- Annex2Page 2 of 5
ESTIMATION OF THE SLATE OF REFINERIES OUTPUT AND OFDOMESTIC PETROLEUM PRODUCTS DEMAND, 1985 TO 2000
1. Estimation of refineries output capacities, 1985-2000(thousand toe)
1985 1990 1995 2000
LPC 138 201 208 243Gasolines 1007 1382 1462 1944Kerosene/Jet fuel 542 649 678 891Diesel oil 744 1088 1180 1539Fuel oil 2122 2530 2530 3483
Total 4553 5850 6058 8100
Source: Cepe and mission estimates.
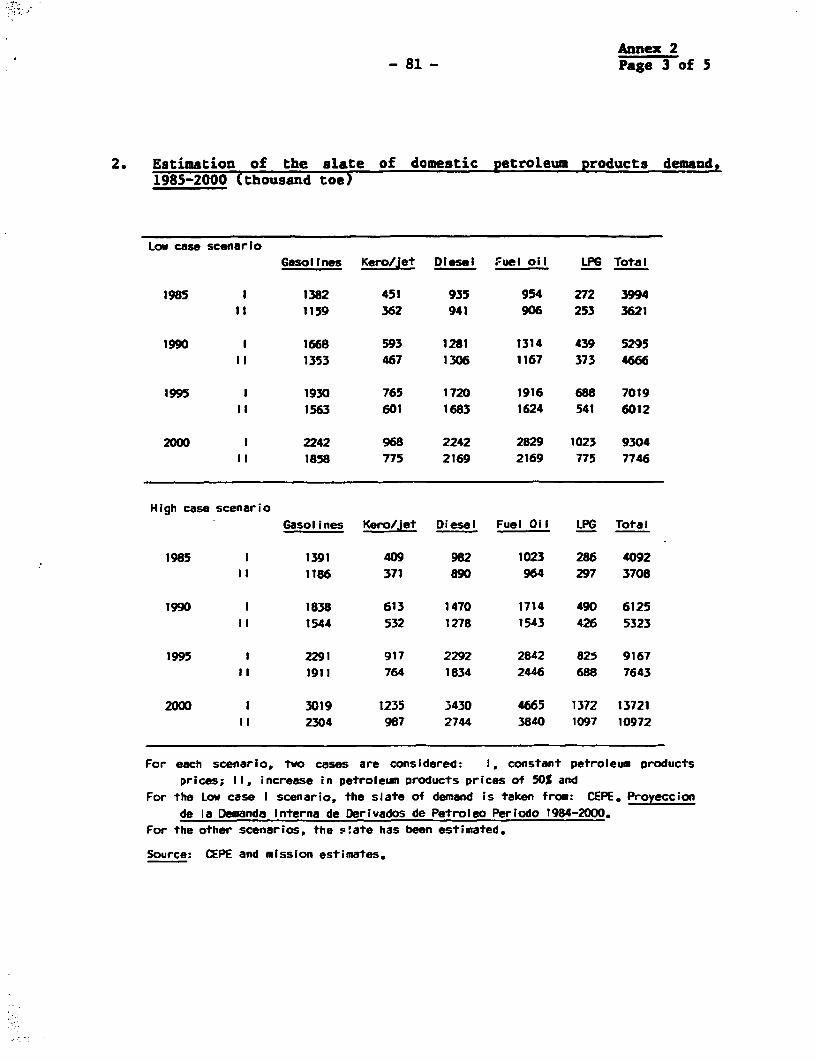
Annex 2-81 - Page 3 of 5
2. Estimation of the slate of domestic petroleum products demand,1985-2000 (thousand toe)
Low case scenarioGasolInes Kero/jet Diesel Fuel oil LPG Total
1985 I 1382 451 935 954 272 3994I1 1159 362 941 906 253 3621
1990 1 1668 593 1281 1314 439 5295I1 1353 467 1306 1167 373 4666
1995 1 1930 765 1720 1916 688 7019'I 1563 601 1683 1624 541 6012
2000 1 2242 968 2242 2829 1023 9304i1 1858 775 2169 2169 775 7746
High case scenarioGasolines Kero/jet Diesel Fuel Oil LPG Total
1985 1 1391 409 982 1023 286 4092I1 1186 371 890 964 297 3708
1990 1 1838 613 1470 1714 490 612511 1544 532 1278 1543 426 5323
1995 1 2291 917 2292 2842 82S 9167II 1911 764 1834 2446 688 7643
2000 1 3019 1235 3430 4665 1372 137211 2304 987 2744 3840 1097 10972
For each scenario, two cases are considered: I, constant petroleum productsprices; II, increase in petroleum products prices of 50% and
For the Low case I scenario, the slate of demand is taken from: CEPE. Proyeccionde la Demanda Interna de Derivados de Petroleo Periodo 1984-2000.
For the other scenarios, the s!ate has been estimated.
Source: CEPE and mission estimates.
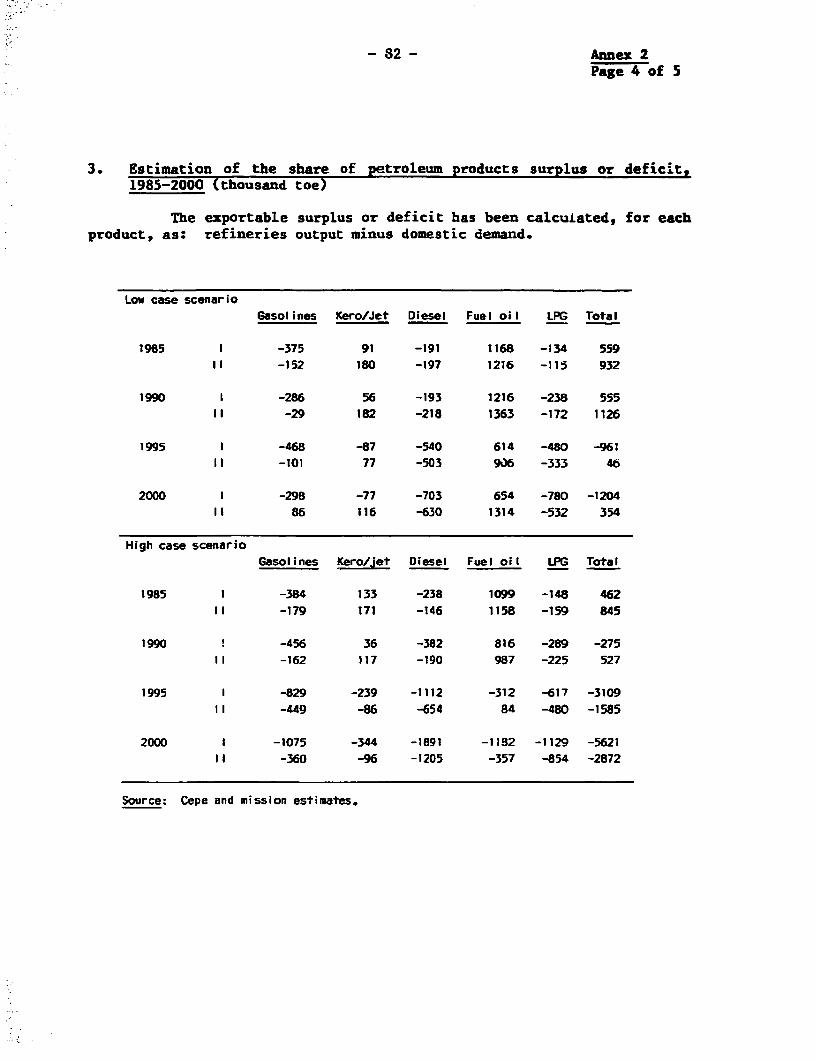
-82- Annex 2Page 4 of 5
3. Estimation of the share of petroleum products surplus or deficit,1985-2000 (thousand toe)
The exportable surplus or deficit has been calculated, for eachproduct, as: refineries output minus domestic demand.
Low case scenario
Gasolines Kero/Jet Diesel Fuel oil LPG Total
1985 1 -375 91 -191 1168 -134 5591I -152 18O -197 1216 -115 932
1990 1 -286 56 -193 1216 -238 5551I -29 182 -218 1363 -172 1126
1995 1 -468 -87 -540 614 -480 -9611I -101 77 -503 906 -333 46
2000 I -298 -77 -703 654 -780 -12041I 86 116 -630 1314 -532 354
High case scenarioGasolines Kero/jet Diesel Fuel oil LPG Total
1985 1 -384 133 -238 1099 -148 462!I -179 171 -146 1158 -159 845
1990 -456 36 -382 816 -289 -2751I -162 117 -190 987 -225 527
1995 1 -829 -239 -1112 -312 -617 -3109II -449 -86 -654 84 -480 -1585
2000 1 -1075 -344 -1891 -1152 -1129 -5621II -360 -96 -1205 -357 -854 -2872
Source: Cepe and mission estimates.
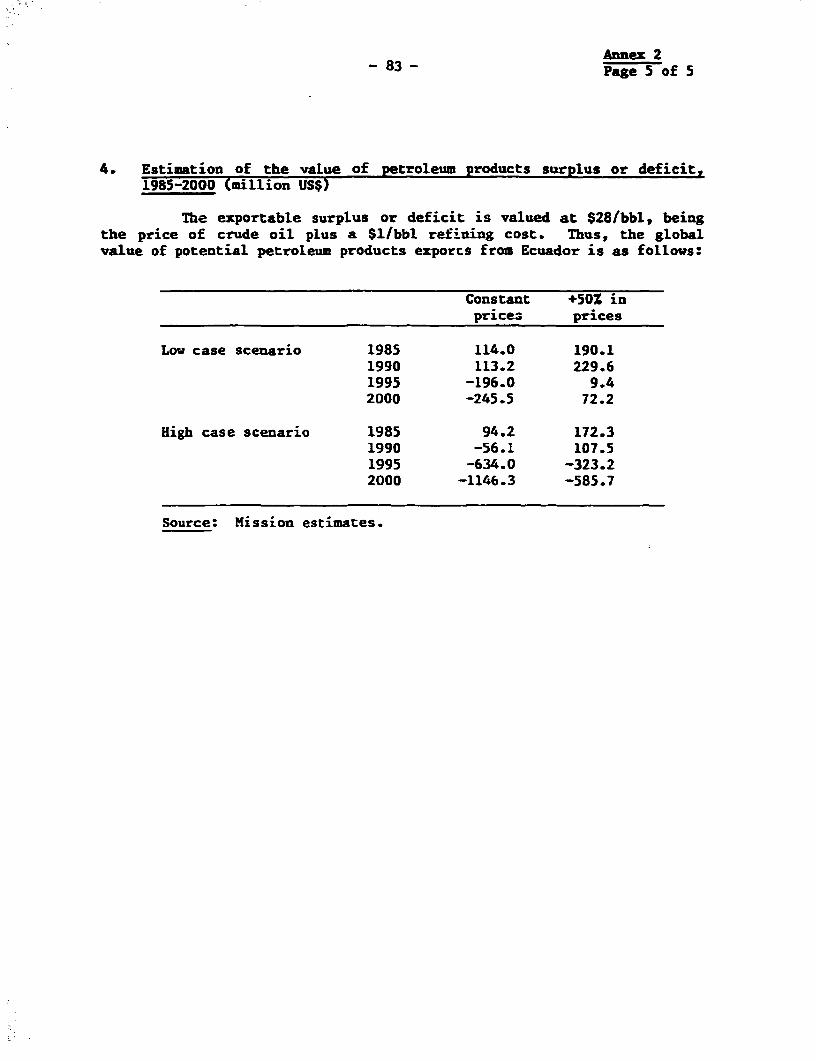
Annes 2-83 - Page 5 of 5
4. Estimation of the value of petroleum products surplus or deficit,1985-2000 (million US$)
The exportable surplus or deficit is valued at $28(bblp beingthe price of crude oil plus a $l/bbl refining cost. Thus, the globalvalue of potential petroleum products exporEs from Ecuador is as follows:
Constant +50% inprice3 prices
Low case scenario 1985 114.0 190.11990 113.2 229.61995 -196.0 9.42000 -245.5 72.2
High case scenario 1985 94.2 172.31990 -56.1 107.51995 -634.0 -323.22000 -1146.3 -585.7
source: Mission estimates.

- 84 -
Annex 3
ESTIMATION OF THE COSi OF PETROLEUM PRODUCT MOTRABAND IN 1984
Income fromDomestic domestic Income from
Volume of prices International sales exports Losses from
Contraband 1984 pri es (1) x (2) (1) x (3) Contraband
(1) (2) (3) ( (5) (5) - (4)
(106 gal.) (S/Cal.) (S/gal.) (106 S) (106 S) (106 S)
Gasolines 78.4 n.31 0.78 24.3 61.2 36.9
Kerosenb 10.7 0.14 0.85 1.5 9.1 7.6
Diesel oil 8.8 0.22 0.86 1.9 7.6 5.7
Fuel oil 14.3 0.13 0.61 1.9 8.7 6.8TOTAL 112.2 29.6 86.6 57.0
Source: INE and Mission estimates.
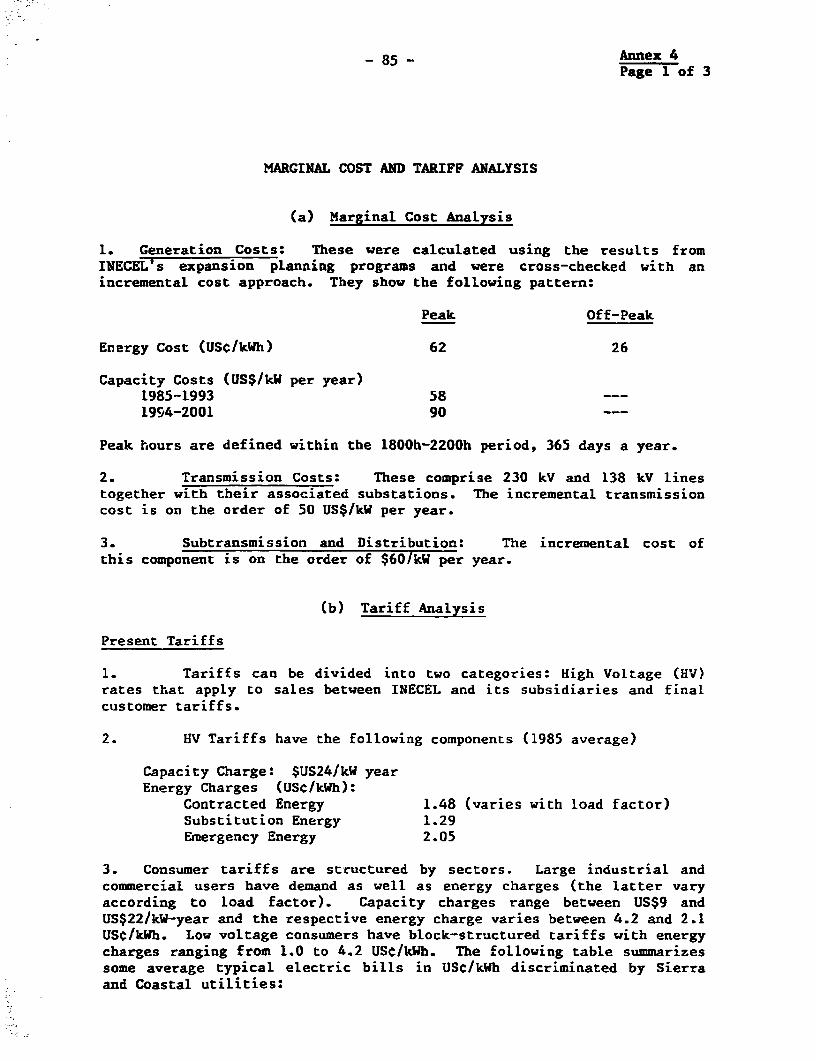
-85- Annex 4Page 1 of 3
MARGINAL COST AND TARIFF ANALYSIS
(a) Marginal Cost AnaLysis
1. Generation Costs: These were calculated using the results fromINECEL's expansion planning programs and were cross-checked with anincremental cost approach. They show the following pattern:
Peak Off-Peak
Energy Cost (USC/kWh) 62 26
Capacity Costs (US$/kW per year)1985-1993 58 -1994-2001 90
Peak hours are defined within the 1800h-2200h period, 365 days a year.
2. Transmission Costs: These comprise 230 kV and 138 kV linestogether with their associated substations. The incremental transmissioncost is on the order of 50 US$/kW per year.
3. Subtransmission and Distribution: The incremental cost ofthis component is on the order of $60/kW per year.
(b) Tariff Analysis
Present Tariffs
1. Tariffs can be divided into two categories: High Voltage (HV)rates that apply to sales between INECEL and its subsidiaries and finalcustomer tariffs.
2. HV Tariffs have the following components (1985 average)
Capacity Charge: $US24/kW yearEnergy Charges (USC/kWh):
Contracted Energy 1.48 (varies with load factor)Substitution Energy 1.29Emergency Energy 2.05
3. Consumer tariffs are structured by sectors. Large industrial andcommercial users have demand as well as energy charges (the latter varyaccording to load factor). Capacity charges range between US$9 andUS$22/kW-year and the respective energy charge varies between 4.2 and 2.1USC/kWh. Low voltage consumers have block-structured tariffs with energycharges ranging from 1.0 to 4.2 USC/kWh. The following table summarizessome average typical electric bills in USC/kWh discriminated by Sierraand Coastal utilities:

Annex 4-86- Page 2 of 3
Typical Average Bilis (USC/kWh)
Small LV Consumers kih/mo. Sierra Coast
Residential 60 1.1 1.7200 3.6 4.2
Commercial 60 1.8 2.1350 4.0 4.2
Industrial 3.2 3.8
Large Industrial and Coomercial Users:
Load Factor (Z) Sierra Coast
Commercial 23 4.7 4.7Industrial 23 3.7 4.0
63 3.3 3.6
Reference Marginal Cost Tariffs
4. Based oa the marginal cost analysis, the following tariff structurewere calculated as benchmarks for suggesting policy changes:
Energy (USC/kWh) Capacity (US$/kW-year)
A - INECEL TariffsPeak 6.4 107Off-Peak 2.7 -
B - MV Customers withdouble metering
Peak 8.1 40Off-Peak 4.2
C - LV Customers
Predominantly Off-peak Users 5.5Residential Users 9.7
5. If the reference rates are compared to present tariffs, the faststraight forward change that could be implemented consists of offering arate based on time of day metering, together with a difference accordingto voltage level deliveries; this would apply mainly to industrial usersand would provide incentives for better energy use. For low voltageconsumers, block structures do not reflect marginal costs and should beeliminated except, possibly, for a first block that could benefit verylow income users.

-87- Annex 4Page 3 of 3
6. Tariff level readjustments - a comparison of the typical averagebills with the reference tariffs is summarized in the following table:
Present ReferenceUSC/kWh USC/kWh Adjustment (Z)
Large Industrial 3.7 5.7 + 54
Low Voltage:Industrial 3.2 5.7-9.7 + 72 to + 200Commercial 4.0 5.5-9.7 + 38 to + 140Residential (200 kWh) 3.6 9.7 + 170Residential ( 60 kWh) 1.1 9.7 + 780
High Voltage INECEL Subsidiaries: The capacity charge would need anincrease of 300Z, the off-peak energy charge would have to be increased80% and the peak energy charge would need a 300Z adjustment.
7. Income Ef'ects: If tariffs are readjusted to the marginal costlevel, consumption can be expected to decrease and the power sector'srevenue can be expected to increase. The present overall rate of 3.4USC/kWh would have to be increased around 100% in order to reach themarginal cost level. Present consumption is on the order of 3600GWh/year; assuming a price-elasticity of 0.5, demand would be reduced by50% in the long run, i.e. it would decrease by 1800 GWh. The situationis shown in the following diagram:
USC/kWh
Additional Power Sector IncomeSubsidy
LRMC 6.6 ___,^ Cost
Present Rate 3.4
A____ __________GWh
1800 3600
The welfare gain of having marginal cost tariffs at present would beUS$29 million/year (i.e. the subsidy cost) and the additional powersector income would be about US$ 86 million/year (59% of power sectorrevenues in 1984.)
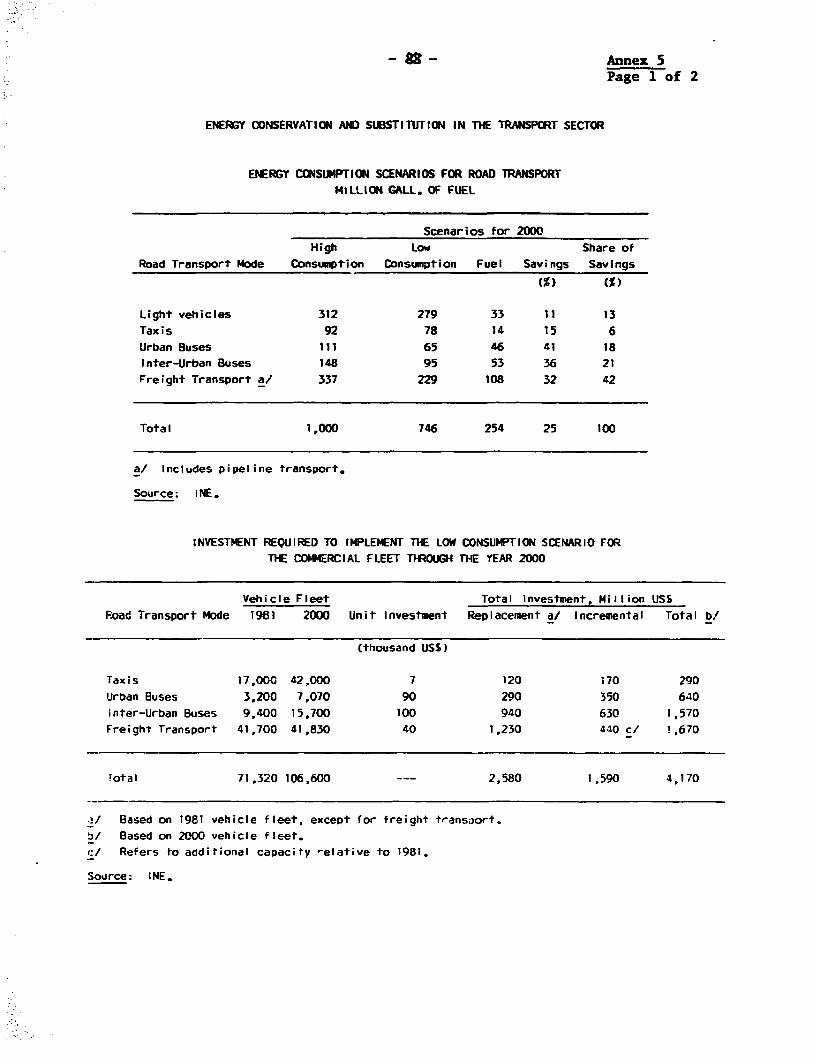
- 82- Annes 5Page 1 of 2
ENERGY ODNSERVATION AND SUBSTITUTION IN THE TRANSPORT SECTOR
ENERGY CONSUMPTION SCENARIOS FOR ROAD TRANSPORT
MILLION GALL. OF FUEL
Scenarios for 2000High LoW Share of
Road Transport Mode Consumption Consumption Fuel Savings Savings.~~~~~~~~~~~~~~~ W(%) (S)
Light vehicles 312 279 33 11 13
Taxis 92 78 14 15 6
Urban Buses 111 65 46 41 18
Inter-Urban Buses 148 95 53 36 21Freight Transport a/ 337 229 108 32 42
Total 1,000 746 254 25 100
a/ Includes pipeline transport.
Source: [NE.
INVESTMENT REQUIRED TO IMPLEMENT THE LOW CONSUMPTION SCENARIO FORTHE COMMERCIAL FLEET THROUGH THE YEAR 2000
Vehicle Fleet Total Investment, Million USS
Poad Transport Mode 1981 2000 Unit Investment Replacement a/ Incremental Total b/
(thousand USS)
Taxis 17,000 42.000 7 120 170 290
Urban Buses 3,200 7,070 90 290 350 640inter-Urban Buses 9,400 15,700 100 940 630 1,570Freight Transport 41,700 41,830 40 1,230 440 cl !,670
!otal 71,320 106,600 --- 2,580 1,590 4,170
.!/ Based on 1981 vehicle fleet, except for freight transoort.b/ Based on 2000 vehicle fleet..i Refers io additional capacity -elative to 1981.
Source: INE.
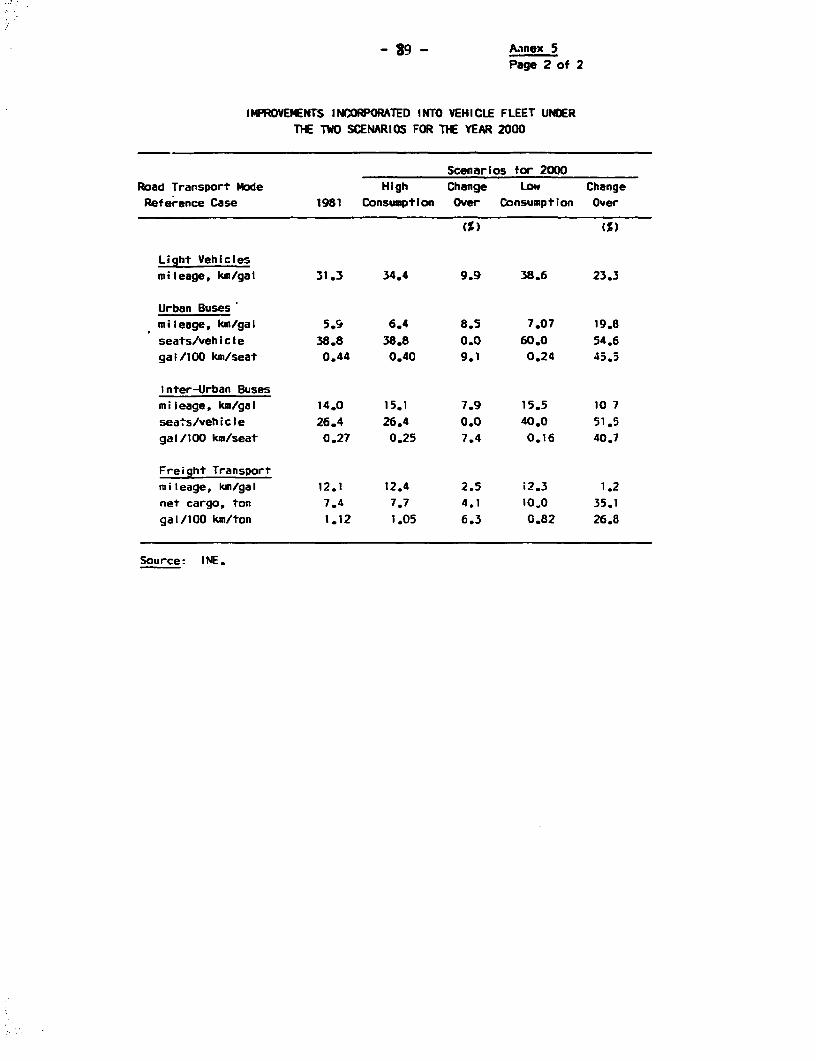
-9 - A.nex 5Page 2 of 2
IMPROVEMENTS INCORPORATED INTO VEHICLE FLEET UNDERTHE TWO SCENARIOS FOR THE YEAR 2000
Scenarios for 2000Road Transport Mode High Change Low Change
Reference Case 1981 Consumption Over Consumption Over
(S ) (%)
Light Vehiclesmileage, km/gal 31.3 34.4 9.9 38.6 23.3
Urban Buses'mileage, km/gal 5.9 6.4 8.5 7.07 19.8
seats/vehicle 38.8 38.8 0.0 60.0 54.6
gal/100 km/seat 0.44 0.40 9.1 0.24 45.5
Inter-Urban Buses
mileage, km/gal 14.0 15.1 7.9 15.5 10 7
seats/vehicle 26.4 26.4 0.0 40.0 51.5gal/100 km/seat 0.27 0.25 7.4 0.16 40.7
Freight Transport
mileage, km/gal 12.1 12.4 2.5 i2.3 1.2
net cargo, ton 7.4 7.7 4.1 10.0 35.1
gal/100 km/ton 1.12 1.05 6.3 0.82 26.8
Source: INE.
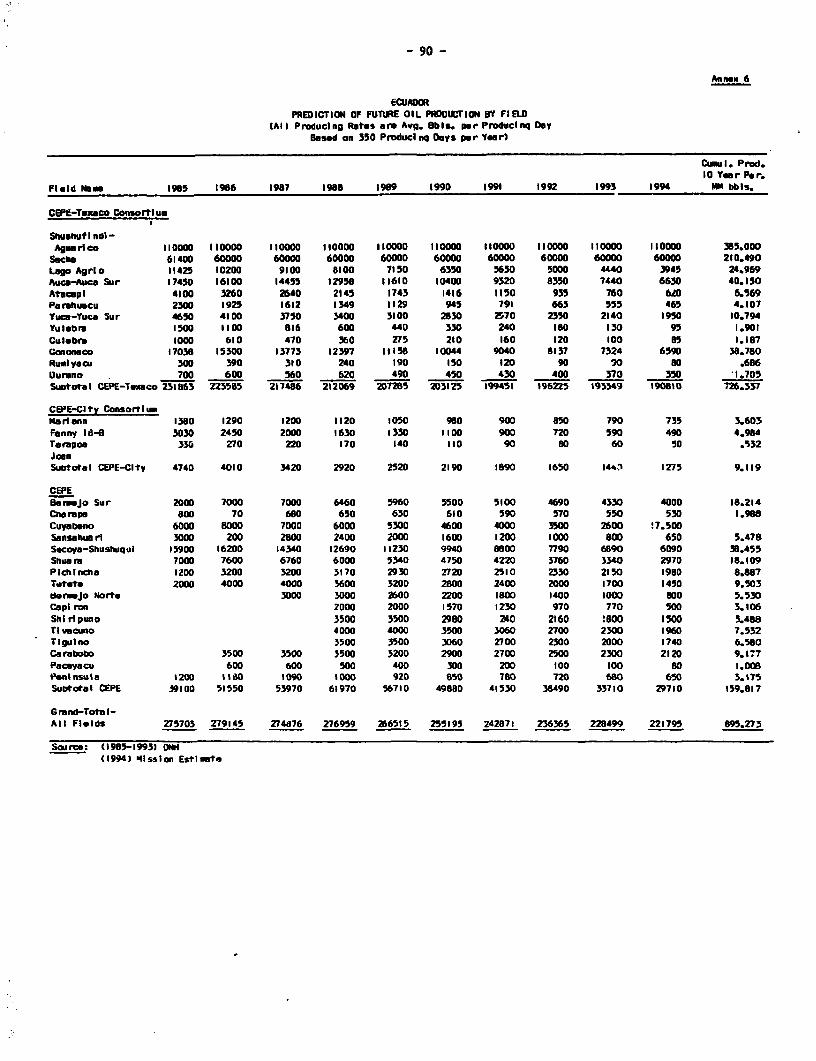
- 90 -
Annex 6
ECUANRPREDICTION OF FUTURE OIL PROOUCTION BY FIELD
(All Produclng Rates are Avq. 8b i e pe r Produci nq DaeBased on 350 Product nq Onys per Yeer)
Cumu l. Prod.10 Year Per.
Field Now 1985 1986 1987 1988 1989 5990 1991 1992 5993 1994 4 bbls.
CEPE-Texeco ConsortSur
Shushut I ndt -Agu rico 0IO0O0 110000 110000 110000 110000 110000 110000 110000 510000 110000 385.000
SeChe 61400 60000 60000 60000 60000 60000 60000 60000 60000 60000 210.490Lago Agrio 11425 102W 9100 8600 7150 6350 5630 5000 4440 3945 24.969Auce-Auca Sur 17450 16100 14455 12958 11610 104W 9520 8350 7440 6630 40.150Atarapl 4100 3260 2640 2145 1745 1416 1150 955 760 620 6.569Pamrhuacu 2300 5925 1612 1549 1129 945 791 663 555 465 4.107Yuca-Yuca Sur 4650 4100 3750 5400 3100 2830 2570 2350 2140 1950 10.794Yulebre 1500 1100 816 600 440 330 240 ISO 150 95 1.901Culebra 1000 610 470 360 275 210 160 120 100 8s 1.187Canoneo 17056 15500 13773 12397 11158 10044 9040 8137 7324 6590 38.780Rulyacu 300 590 310 240 190 150 120 90 90 so .686Oureno 700 600 560 620 490 450 430 400 370 350 1.705Subtotal CEPE-Telaco 251863 223585 257486 2)2069 2 57265 205525 199451 596225 195549 o90850 726.537
CEPE-CIty ConsortiumMa rl enn 1380 1290 1200 1120 1050 960 900 850 790 735 5.603fPnny I" 3030 2450 2000 1630 1330 11 W 900 720 590 490 4.984Tarpoa 330 270 220 170 140 110 90 80 60 so .532JanSubtotal CEPE-Clty 4740 4010 3420 2920 2520 2190 1890 1650 14*n 1275 9.119
CEPBenajo Sur 2000 7000 7000 6460 5960 5500 5100 4690 4330 4000 18.214Cheompe 800 70 680 650 630 650 590 570 550 530 1.968Cuyaebno 6000 80w 7000 6000 5300 4600 4000 500 2600 !7.500Sansahuarl 50W 2W 280 2400 2000 16W 5200 000 800 650 5.478Secoya-Shushuqul 159W 56200 14340 12690 11230 9940 8800 7790 6e90 6090 38.455StuatM 7000 7600 6760 6000 5340 4750 4220 3760 3340 2970 18.109Plchincha 1200 3200 3200 5170 2930 2720 2510 2350 2150 1980 8.887Tqtate 2000 40W 4000 3600 5200 2800 2400 2000 1700 1450 9.503Serejo Norte 5000 5000 2600 2200 l800 1400 1000 800 5.530Cap ran 2000 2000 1570 1230 970 770 500 3.106
Shiripuno 3500 3500 2980 240 2160 8oo 1500 5.488TIwecuno 4000 4000 3500 5060 27W 2300 1960 7.532rIgutno 3500 3500 3060 2700 2500 20oo 1740 6.580Carabobo 3500 3500 500 5200 290 2700 2500 2300 2120 9.177Pacayacu 600 600 500 400 300 200 0oo 100 80 1.008Peninsula 5200 58 0 1090 5000 920 850 780 720 680 650 5.175Subtotal CEPE 39100 51550 53970 65970 5671D 49880 45530 38490 33710 29710 159.817
G rand-Total-All FIelds 275703 279145 274076 276959 286555 255195 242871 236365 228499 221795 895.273
Scurce: (1985-1995) 01H(59943 MissIon Estlnto
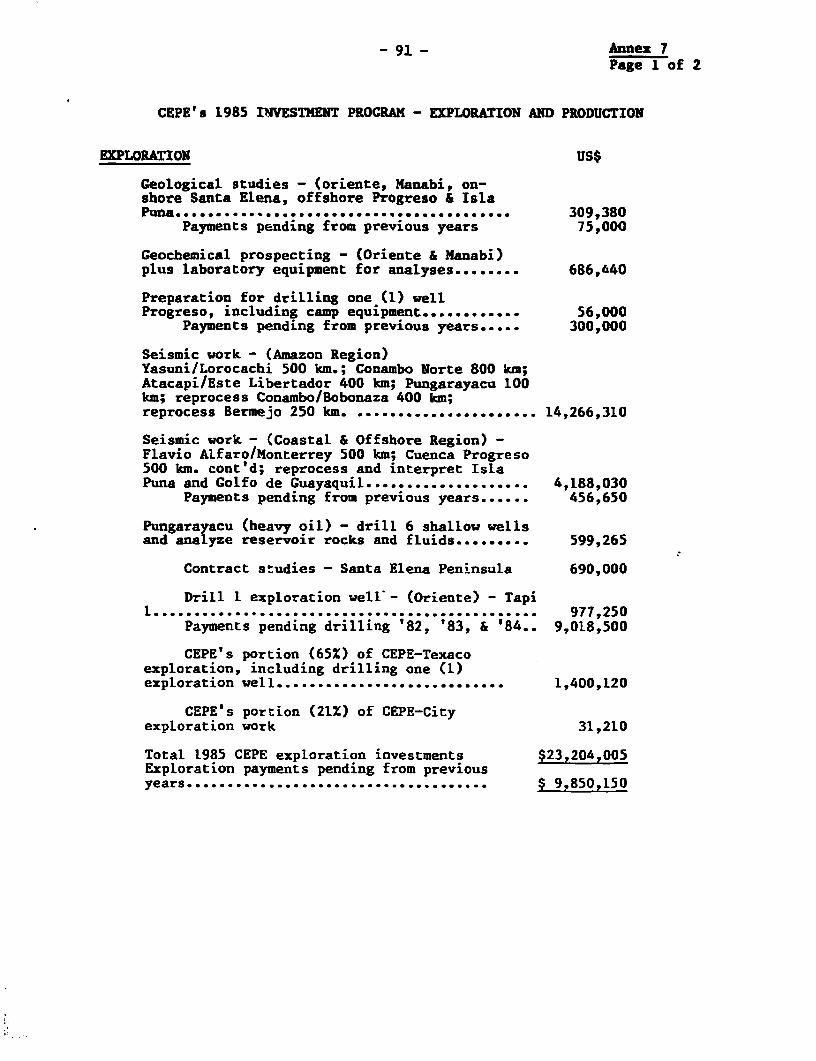
-91 - Annex IPage 1 of 2
CEPE's 1985 IWESTMENT PROGRAM - EXPLORATION AND PRODUCTION
EXPLORATION US$
Geological studies - (oriente, Manabi, on-shore Santa Elena, offshore Progreso & IslaPuna ............................................... 309,380
Payments pending from previous years 75,000
Geochemical prospecting - (Oriente & Manabi)plus laboratory equipment for analyses ........ 686,440
Preparation for drilling one (I) wellProgreso, including camp equipment ............ 56,000
Payments pending from previous years..... 300,000
Seismic work - (Amazon Region)Yasuni/Lorocachi 500 km.; Conambo Norte 800 km;Atacapi/Este Libertador 400 km; Pungarayacu 100km; reprocess Conambo/Bobonaza 400 km;reprocess Bermejo 250 km. ...................... 14,266,310
Seismic work - (Coastal & Offshore Region) -Flavio Alfaro/Monterrey 500 km; Cuenca Progreso500 km. cont'd; reprocess and interpret IslaPuna and Golfo de Guayaquil .................... 4,188,030
Payments pending from previous years ...... 456,650
Pungarayacu (heavy oil) - drill 6 shallow wellsand analyze reservoir rocks and fluids ......... 599,265
Contract studies - Santa Elena Peninsula 690,000
Drill 1 exploration well'- (Oriente) - TapiI..........................................9...... 977,250
Payments pending drilling '82, '83, & '84.. 9,018,500
CEPE's portion (65%) of CEPE-Texacoexploration, including drilling one (1)exploration well ................. 1,400,120
CEPE's portion (21%) of CEPE-Cityexploration work 31,210
Total 1985 CEPE exploration investments $23,204,005Exploration payments pending from previousyears ..................................... $ 9,850,150

92 Annex 7Page 2 of 2
DEVELOPMENT USS
Libertador FieldDrill 6 development wells 3,912,000Roads and well location 650,000Drilling se.vices and well equipment 12,445,200Floy station, flowlines, electrical.ystem, transfer station iaL;ialiation 9,000,000
Bermejo Norte Fieldioads and well locations 600,000Separators, manifolds, tubing 1,170,000Road to Bermejo qur 1,500,000
Cuyabenc FieLdDriLl 3 development wells 1,953,200Drilling services and well equipment 1,170,000Road to Bermejo Sur A. ,500,000
Tetete FieldDrill 3 development wells 2,410,000Drilling services and well equipment 7,666,800Flowlines 2,250,000
Tiquino FieldRoads and locations 200,000Separators, manifolds, tubing, materials 930,00Road to Cononaco 1,500,000
Sansahuari FieldFloWIines 1,300,000Road to Cantagallo 700,000
Bermejo Sur FieldAEr 7ift equi,ment, flowlines, flowstation, high ?ressure tubing 4,300,000
Guarumo Camwareiouse and ,eological storage 65,000Laboratory and data bank services 121,500
Cuayaquil Operational Base - PosoriaFor logistical support of drilling 200,000
CErE-Texaco (CEPE 65%)DrLl 9 development wells 3,200,760Plant and other equipment requirements 12,796,240Miscellaneous 3,478,200Transecuatoriano pipeline 1,075,080
CEPE-CITY (CEPE 21Z)-eneral exploitation 27,140
Total CEPE i985 development investments $82,994,620Remaining payments due from 1984 investments $-530,300
Source: CEPE.
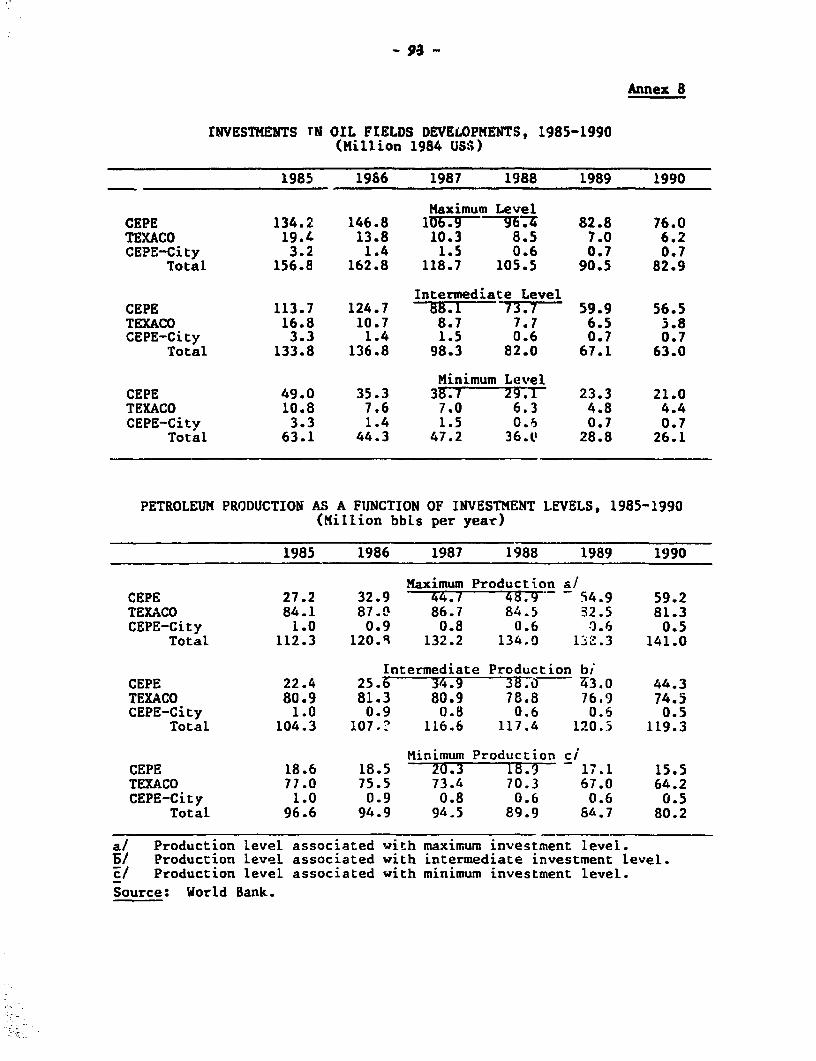
_ 93 -
Annex 8
rNVESTMENTS iN OIL FIELDS DEVELOPMENTS, 1985-1990(Million 1984 USS)
1985 1986 1987 1988 1989 1990
Maximum LevelCEPE 134.2 146.8 1U6 E7[ 82.8 76.0TEXACO 19.4 13.8 10.3 8.5 7.0 6.2CEPE-City 3.2 1.4 1.5 0.6 0.7 0.7
Total 156.8 162.8 118.7 105.5 90.5 82.9
Intermediate LevelCEPE 113.7 124.7 88.1 73.7 59.9 56.5TEXACO 16.8 10.7 8.7 7.7 6.5 5.8CEPE-City 3.3 1.4 1.5 0.6 0.7 0.7
Total 133.8 136.8 98.3 82.0 67.1 63.0
Minimum LevelCEPE 49.0 35.3 38.7 29.1 23.3 21.0TEXACO 10.8 7.6 7.0 6.3 4.8 4.4CEPE-City 3.3 1.4 1.5 0.6 0.7 0.7
Total 63.1 44.3 47.2 36.(' 28.8 26.1
PETROLEUM PRODUCTION AS A FINCTION OF INVESTMENT LEVELS, 1985-1990(Million bbLs per year)
1985 1986 1987 1988 1989 1990
Maximum Production a!CEPE 27.2 32.9 44.1 48.9 54.9 59.2TEXACO 84.1 87." 86.7 84.5 32.5 81.3CEPE-City 1.0 0.9 0.8 0.6 3.6 0.5
Total 112.3 120.R 132.2 134.0 132.3 141.0
Intermediate Production biCEPE 22.4 25.6 34.9 38.0 43.0 44.3TEXACO 80.9 81.3 80.9 78.8 76.9 74.5CEPE-City 1.0 0.9 0.B 0.6 0.6 0.5
Total 104.3 107.? 116.6 117.4 120.5 119.3
Minimum Production ciCEPE 18.6 18.5 20.3 1B.T - 1i.1 15.5TEXACO 77.0 75.5 73.4 70.3 67.0 64.2CEPE-City 1.0 0.9 0.8 0.6 0.6 0.5
Total 96.6 94.9 94.5 89.9 8&.7 80.2
a! Production level associated with maximum investment level.a/ Production Level associated with intermediate investment level.El Production level associated with minimum investment level.
Source: World Bank.

- 94 -
Annex 9
GULF OF GUAYAQIJIL - AMISTADNOM-ASSOCIATED GAS RESERVE ESTIMATES
Recovery Reserves In BCFSource Date Factor (%) Proven Probable Possible Totel
CEPE Sept 1975 81.3 350.1 558.0 - 908.1
CEPE Dec 1975 81 259.8 1914.6 1676.4 3850.8
DEGOLYER &McNAUGHTON May 1976 77 296.0 290.0 340.0 926.0
CEPE Apr 1977 78 237.0 203.0 396.0 836.0
CEPE Jul 1981 70 202.4 93.7 - 296.1
BRASPETRO-PETROFERTIL May 1984 80 281.8 87.5 72.1 440.7

95 Annez 10Page 1 of 2
GULF OF GUAYAQtIL ECONOMIC ANALYSIS
GUAYAUIIL GAS PARDJECT INVESTMENT BREAKDOWN
Project Packages 1, 11, III, Project Package IV
capital operating Capital Cost
Investment Item cost cost million ISS
Exploration drilling 34.6 - 34,5Production drilling 42.5 - 42.5
Completions 15.9 - 15.9
Platforms 78.7 I.05 78.8Offshore pipelines 36.8 1.10 41.4
Onshore pipelines 22.2 0.37 14.7
Total 230.7 2,52 227.8
Source: CEPE and Mission estimates.
GAS NETBACK AND NPV OF GAS SUBSTITUTION FOR
DIESEL OIL FOR POWER GENERATION IN THEGUAYAQUIlL AREA
Discount Rate Gas Netback Value NPV
C% per year) (UsS/MM3Tu) (million USS)
Project Lifetime, years
5 10 15 5 10 15
Retrofit Investment: USS9.6 million
10 6.36 6.42 6.43 144.36 240.25 299.79
15 6.33 6.39 6.41 126.25 194.14 227.90
20 6.31 6.37 6.38 111.28 160.24 179.92
Retrofit Investment: US$19.2 million
10 6.21 6.32 6.36 134.28 230.17 289.71
15 6.16 6.27 6.31 115.93 183.82 217.58
20 6.11 6.22 6.25 100.72 149.68 169.36
Basis: - 192 MW of diesel and gas turbine retrofitted for gas burning,at 0.9 load factor
- 48,100 MMBTU/D of gas consumption
- Di esel oil replacement value of gas: USS6.51 A48TU
- Economic price of gas: USS4.19AMMBTU
Source: Mission estimates.
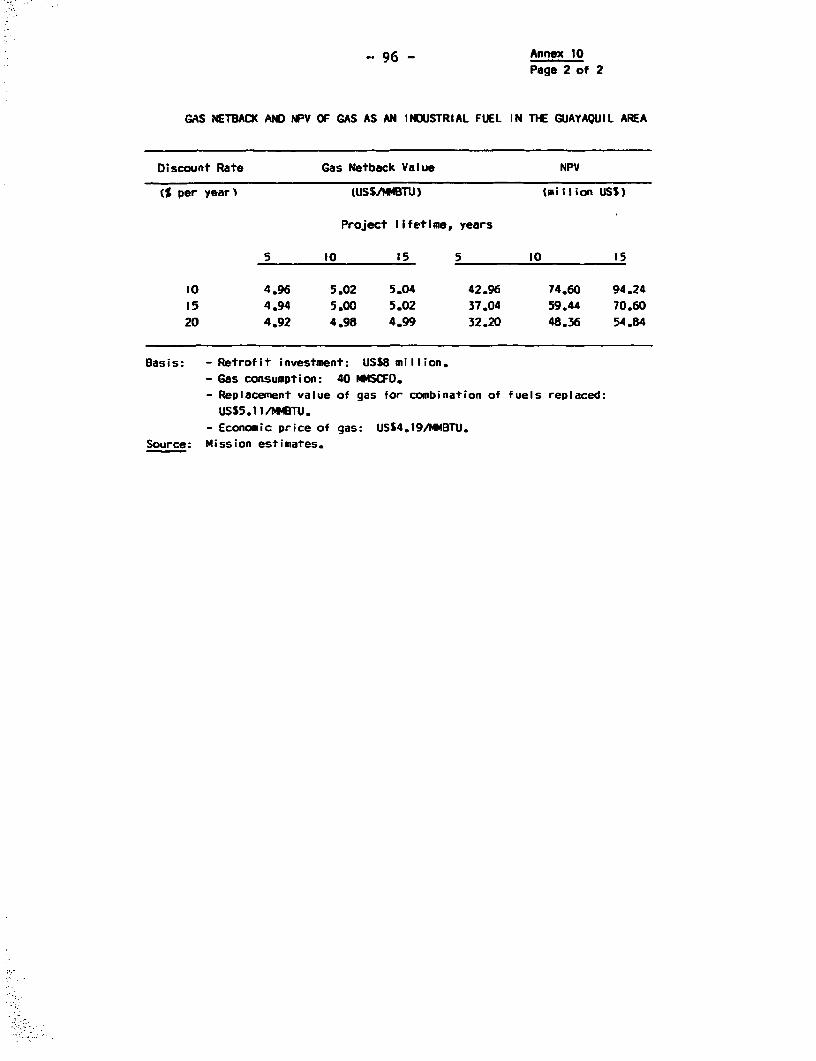
96 - Annex 10Page 2 of 2
GAS NETBACK AND NF'V OF GAS AS AN INDUSTRIAL FUEL IN THE GUAYAQUIL AREA
Discount Rate Gas Netback Value NPV
(% per yearl (USS/M4BTU) (million USS)
Project lifetime, years
5 10 15 5 10 15
10 4.96 5.02 5.04 42.96 74.60 94.24
15 4.94 5.00 5.02 37.04 59.44 70.60
20 4.92 4.98 4.99 32.20 48.36 54.84
Basis: - Retrofit investment: USS8 million.
- Gas consumption: 40 MMSCFD.- Replacement value of gas for combination of fuels replaced:
US$5.1 1/MBTU.
- Economic price of gas: USS4.19/MMBTU.
Source: Mission estimates.
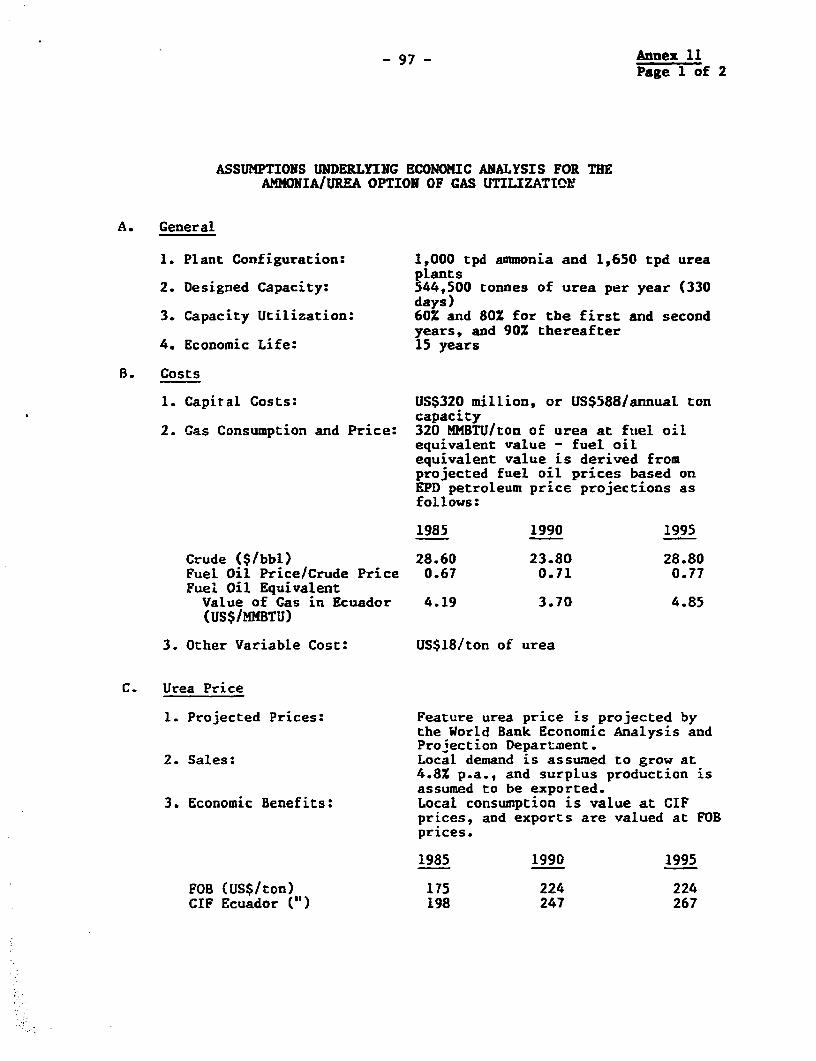
97 Annex 11Page 1 of 2
ASSUMPTIONS UNDERLYING ECONOMIC ANALYSIS FOR THEAMMONIA/UREA OPTION OF GAS UTILIZATTOW
A. General
1. Plant Configuration: 1,000 tpd ammonia and 1,650 tpd ureaplants
2. Designed Capacity: 544,500 connes of urea per year (330days)
3. Capacity Utilization: 60% and 80Z for the first and secondyears, and 90Z thereafter
4. Economic Life: 15 years
B. Costs
1. Capital Costs: US$320 million, or US$588/annual toncapacity
2. Gas Consumption and Price: 320 MMBTU/ton of urea at fuel oilequivalent value - fuel oilequivalent value is derived fromprojected fuel oil prices based onEPD petroleum price projections asfollows:
1985 1990 1995
Crude ($/bbl) 28.60 23.80 28.80Fuel Oil Price/Crude Price 0.67 0.71 0.77Fuel Oil EquivalentValue of Gas in Ecuador 4.19 3.70 4.85(US$/MMBTU)
3. Other Variable Cost: US$18/ton of urea
C. Urea Price
1. Projected Prices: Feature urea price is projected bythe World Bank Economic Analysis andProiection Deparu-zent.
2. Sales: Local demand is assumed to grow at4.8% p.a., and surplus production isassumed to be exported.
3. Economic Benefits: Local consumption is value at CIFprices, and exports are valued at FOBprices.
1985 1990 1995
FOB (US$/ton) 175 224 224CIF Ecuador (") 198 247 267

- 98 - Annex IIPage 2 of 2
AMDONIAAJURA PRODUCTION OPTION FOR GAS UTILIZATION
Economic cost and Benefit Streams
Other Benefits NotCapital Working Natural Variable Fixed Import a/ Benefit
Year Cost Capital Gas Cost Cost Substitution Exports Flow
1 (32.0) (32.0)2 (96.0) (96.0)3 (112.0) (112.0)4 (80.0) (5.O) (85.0)5 38,7 5.9 27.5 49.2 28,7 5.86 54.5 7.8 27.5 47.6 51.9 9,7
7 64,6 8.8 27.5 55.5 63}.1 17.78 68.2 8.8 27.5 60.2 61.7 17.4) 72.0 8.8 27.5 63.1 60.1 14,910 76.0 8.8 27.5 67.1 58.2 13,011 76.0 8.8 27.5 70.3 55.4 .13,412 76.0 8.8 27.5 73.6 52.5 13.813 76.0 8.8 27.5 77.2 49.7 14.614 76.0 8.8 27.5 80.8 46.8 15.315 76.0 8.8 27.5 84.7 43.9 16,3
16 76,0 8.8 27.5 88.8 41.1 17.617 76.0 8.8 27.5 93.0 38.2 18.9i8 76,0 8.8 27.5 97.4 35.4 20.519 (5.0) 76.0 8.8 27.5 102.1 32.5 27.3
Net Present Value: -USS193.7 million 8 discount rate of 10%-USS203.0 million I discount rate of 20%
Gas Netback: 4USSO.83/MMBTU I discount rate of 10%-USSO.14/MMBTU I discount rate of 20%
a/ Local demand for nitrogen fertilizer is assumed to grow at 4.8% p.a.
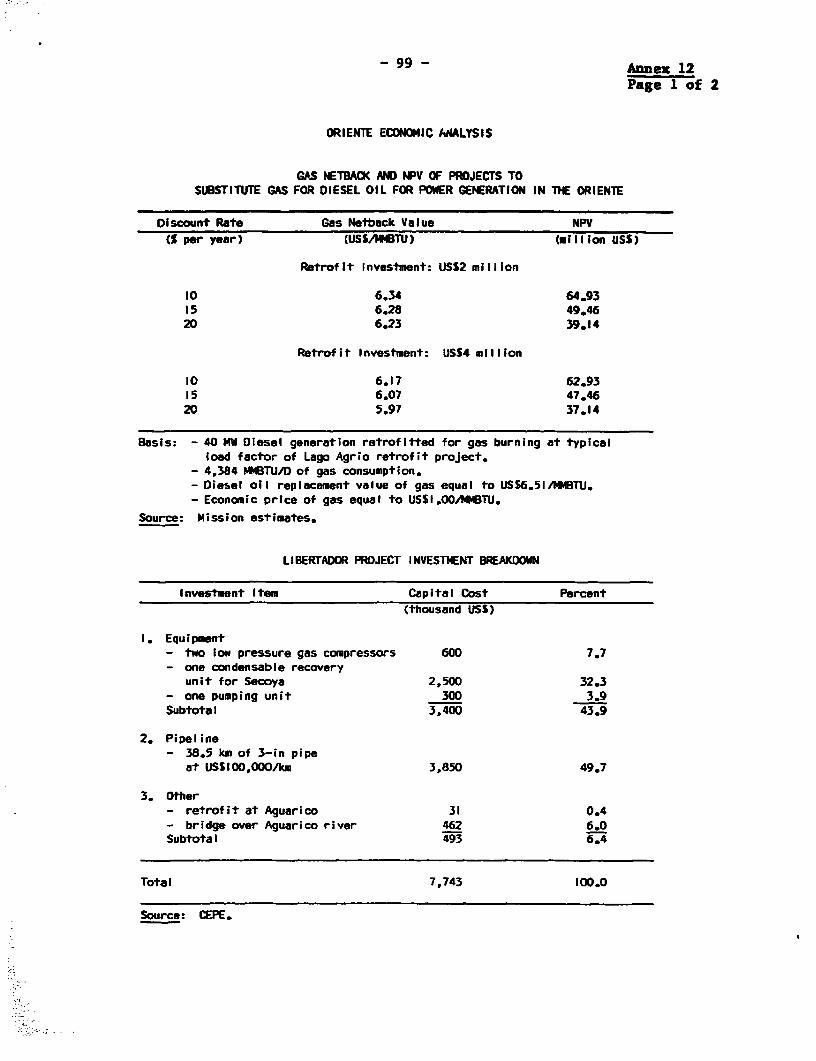
-99 - Annex 12Page 1 of 2
ORIENTE ECONOMIC MAhLYSIS
GAS NETBACK AND NPV OF PROJECTS TOSUBSTITUTE GAS FOR DIESEL OIL FOR POWER GEiERATION IN THE ORIENTE
Discount Rate Gas Netback Value NPV
CS per year) (USS/MMBTU) (million USS)
Retrofit Investment: USS2 million
10 6.34 64.9315 6.28 49.4620 6.23 39.14
Retrofit Investment: USS4 million
10 6.17 62.9315 6.07 47.4620 5.97 37.14
Basis: - 40 MW Diesel generation retrofitted for gas burning at typicalload factor of Lago Agrio retrofit project.
- 4,384 MMBTU/D of gas consumption.- Diesel oil replacement value of gas equal to USS6.51/MMBTU.- Economic price of gas equal to USSI.O0fMMBTU.
Source: Mission estimates.
LI ERTADOR PROJECT INVESTMENT BREAKDOWN
Investment Item Capital Cost Percent
(thousand USS)
I. Equipment- two low pressure gas compressors 600 7.7- one condensable recovery
unit for Secoya 2,500 32.3- one pumping unit 300 3.9Subtotal 3,400 43.9
2. Pipeline- 38.5 km of 3-in pipe
at USSIOO,000/k 3,850 49.7
3. Other- retrofit at Aguarico 31 0.4- bridge over Aguarico river 462 6.0Subtotal 493 6.4
Total 7,743 100.0
Source: CEPE.
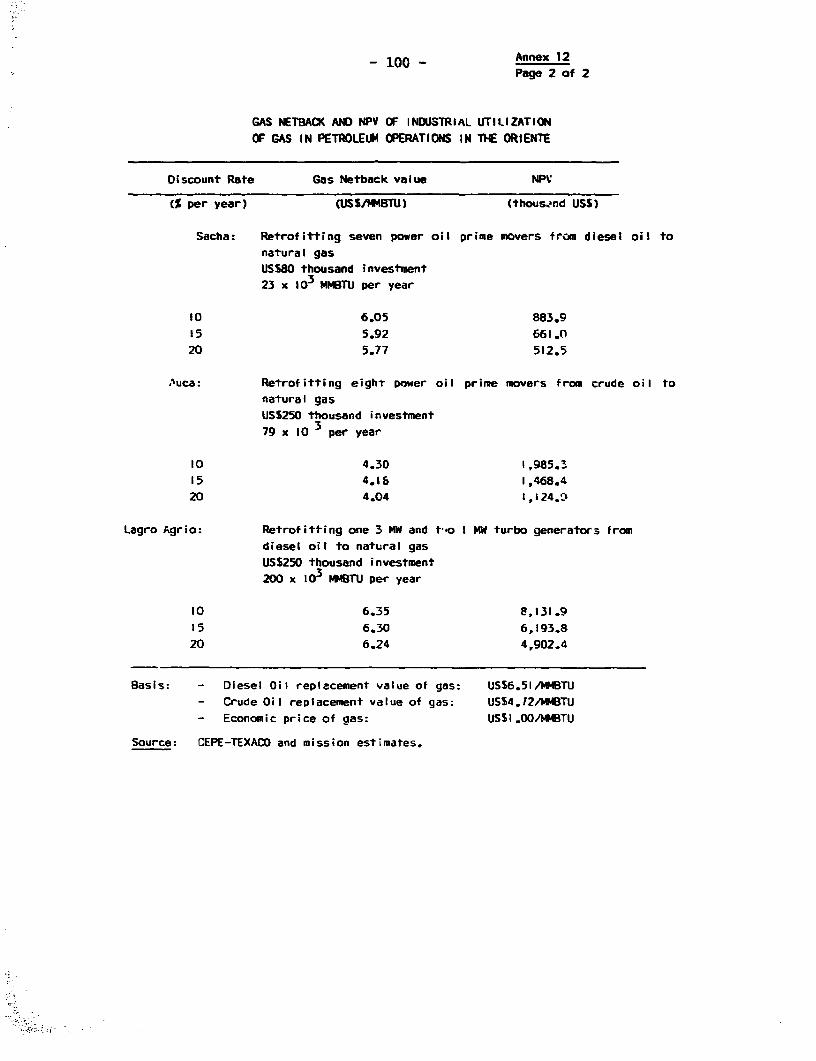
- 100 - Annex 12Page 2 of 2
GAS NETBACK AND NPV OF INDUVTRIAL UTILIZATION
OF GAS IN PETROLEUM OPERATIONS IN THE ORIENTE
Discount Rate Gas Netback value NPV
(% per year) (USS/MMBTU) (thous.und USS)
Sacha: Retrofitting seven power oil prime movers from diesel oil to
natural gas
USS80 thousand investment23 x 103 MMBTU per year
10 6.05 883.9
15 5.92 661.0
20 5.77 512.5
.uca: Retrofitting eight power oil prime movers from crude oil to
natural gas
USS250 thousand investment
79 x 10 ; per year
10 4.30 1,985.3
15 4.16 1,468.4
20 4.04 1, 24.9
Lagro Agrio: Retrofitting one 3 MW and t.o I NW turbo generators from
diesel oil to natural gas
USS250 thousand investment
200 x 1o0 MMsTU per year
10 6.35 E,131.9
15 6.30 6,193.8
20 6.24 4,902.4
Basis: - Diesel Oil replacement value of gas: USS6.51/MMBTU
- Crude Oil replacement value of gas: USS4.12/MMBTU
- Economic price of gas: USSI.0O02MMBTU
Source: CEPE-TEXACO and mission estimates.

- 101 - Annex 13Page 1 of 2
POWER DEMAND PROJECTIONS
1. Due to favorable economic circumstances, electricity demand inEcuador gew at very high rates until recently: 72% per year in 1970-75and 17X per year during 1975-80.
2. Recent years have been affected by an economics recession: as of1983, load growth had decelerated to 7% and preliminary data for 1984show a growth of only 2%.
3. For forecasting purposes, INECEL has therefore adopted aneconometric model that relates consumption of electricity to CDP. Themodel can be consicered somewhat crude, specially because it does notinvolve sectoral di7.ferences not tariff policies. The resultingforecasts are summari-ed in table below.
4. Qualifying these estimates is difficult due to:
(a) recent trends that tend to overwhelm perceptions of futuregrowth;
(b) uncertainty related to the unserved population and itsconsequent market potential;
(c) uncertainty with respect to demand in regions that will shortlybe connected to the central grid and have had generationconstraints in the past; and
(d) weakness in the sector's finances that could prevent INECEL'ssubsidiaries from extending service as much as they could.
5. INECEL's forecasts show yearly growth rates between 6X and 7% for1984-1995. These figures appear somewhat conservative given the demandpotential of the country. However, considering recent trends and thesector's constraints, they would appear to be appropriate for planningpurposes.
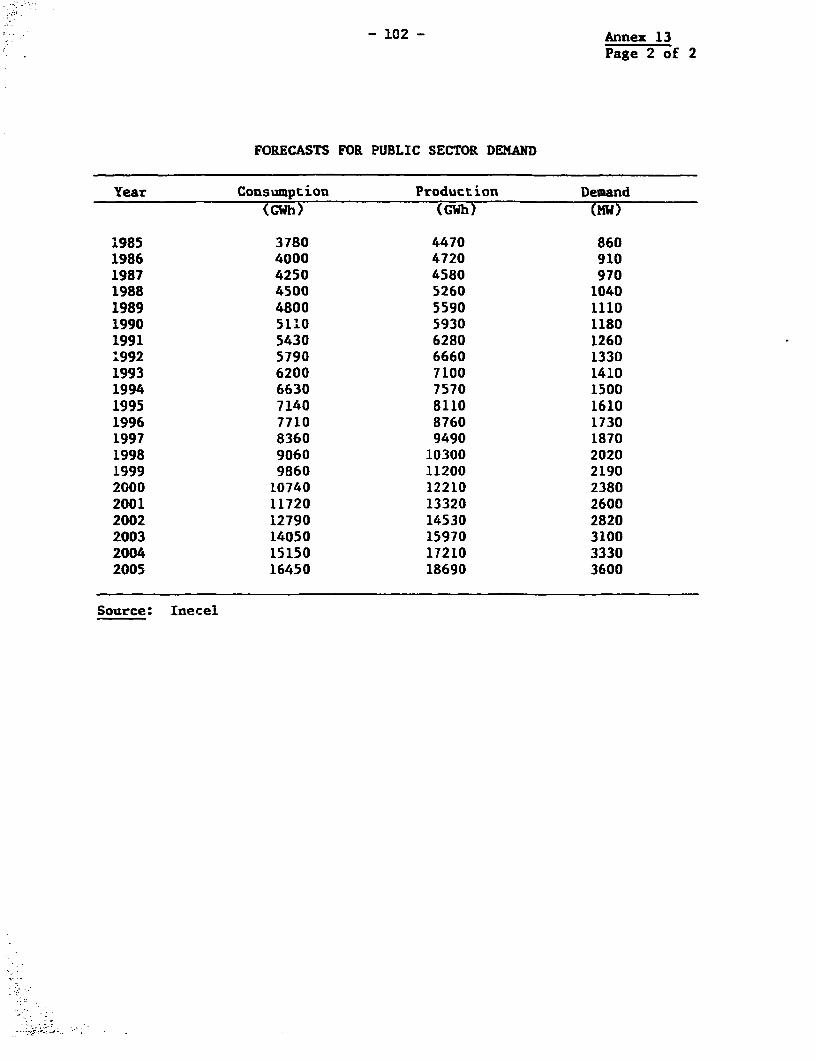
- 102 - Annex 13Page 2 of 2
FORECASTS FOR PUBLIC SECTOR DEMAND
Year Consumption Production Demand(GWh) (GWh) (MW)
1985 3780 4470 8601986 4000 4720 9101987 4250 4580 9701988 4500 5260 10401989 4800 5590 11101990 51'10 5930 11801991 5430 6280 12601992 5790 6660 13301993 6200 7100 14101994 6630 7570 15001995 7140 8110 16101996 7710 8760 17301997 8360 9490 18701998 9060 10300 20201999 9860 11200 21902000 10740 12210 23802001 11720 13320 26002002 12790 14530 28202003 14050 15970 31002004 15150 17210 33302005 16450 18690 3600
Source: Inecel
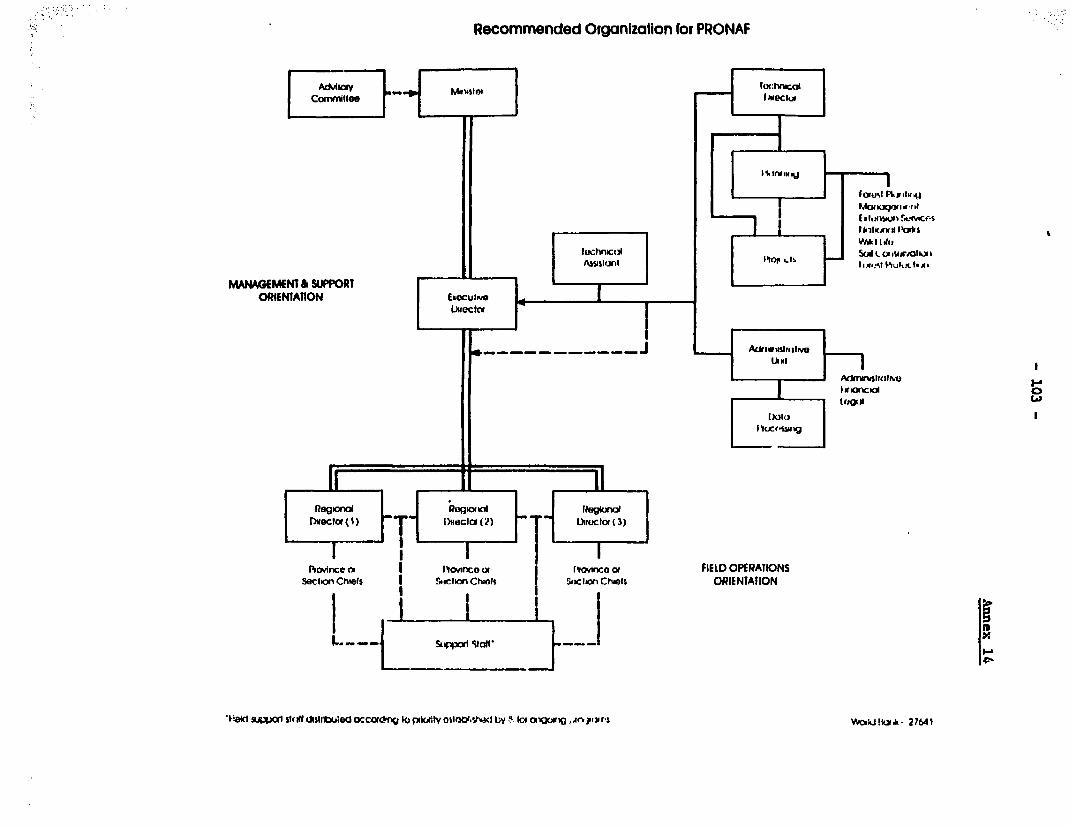
Recommended Organizalion for PRONAF
I~~~~~~~~~~~~~~~~~~~~~~~~~~~~~~~~~~~~~~~~~~~~~W Ia IF_Ei if3
luchnmcill 41to1.jl
l ~~~~~Ass9slani ltosZ . s _11Z^ ̂l..t1
M,GEMENT & SUPPORTORIENTATION ExOCUIM
L-a
leg ncna 7giIleba
Dlleclf(l) T-iulc tlca2 __* na(3)
RPince a I lsncnc alxrovinco of FIELD OPERATIONSSecl*onChrels | StcIionChron s j Sclion Chiels ORIENTATION
I iS I_I WV s
Xl8~ II4t 1 st'ffi dISIiujed oCCctI*1-J c rxIlty osl-slul by ~. Ici ang , .r5 s WcikJ IIr 27t41

19* ~~~~~~~~~~~~~~~~~~~~~~~~~~~so.I~~~~~~~~~~~~~~~~~~~~~~~~~~~I
Z~~7~N~- ~'*~ ' ESMEREALERA
(I~~~~~~~~~~~~~I
,0 IAw, ~ ~ ~ , n~~nco o
CZ.~~~~~~~~~~~~~~~~~~~~~~~~~~~~~~~~~~~~~~~~~~~~~~~~~~~~~~~~3.
BCtot LMato.
Jotomijo cofu.t.~~~~~~~~~~~ba-c
Ayocucho 'hanci. wk. "i
n Vicente NVntoos A .-P -
e .~~~~~~~~~~~~~~~~~ I. I .-. ,O
-~~~~~~~~~~~~~~~~~~ T7' P~~urouw .a ,*e arnd~h

4.)~ ~ ~~~~~~~j Jaa Q*i4,, AZGUSj V-o I asz
| ,,.. Csuoyaqu8/ln:_,> > t' > 7 t oe
L~~~~~~~~~~~~~~~LS7
Ployas -~~'~" CAN R AmolPASTAZ
M .o ng,/TageIoE aoi*lGotco
Pt°~~~~~~ «oi!R'iaa } 1 sb o SECONDARY ROADS:
(S iUuquiios Sio0Rog ... nl Golqio -- Goe
~~~~~~iI; 5OW P os %\ , H6 >de Mb F /;Oo
Nao Nagro'
/ t aGuore \ | g f .tRio PHYSICAL REGIONS
F ~ ~Cazador_.'~ O J / La L'A 'i
\' {o-' _J' Gton¢bcot ' iZAMORA~ ~~~~~~~~~~~~- -- In?ernolionol Boundaries
orGllo¢/f ara angono 0 .LO co Macol -* x./ o 20 40 0 so w
'-~ ~ ~ ~ ~~~" A7 1.JUbI -- ' \ I 1CCIiI LOETERS
reso~~~~~~~~~~~~~~~~~~~~~~~~~~~~~~~~~~~~~~~~~~~On ~~~~~~~~c D eedrr o anbEr ja oTl B od h_
Tongir~ ~ I, UADO e bJo y mr t d~o R pd JL j O2umbo r 4>,06 5; _~~~~~~~Es. Cmb
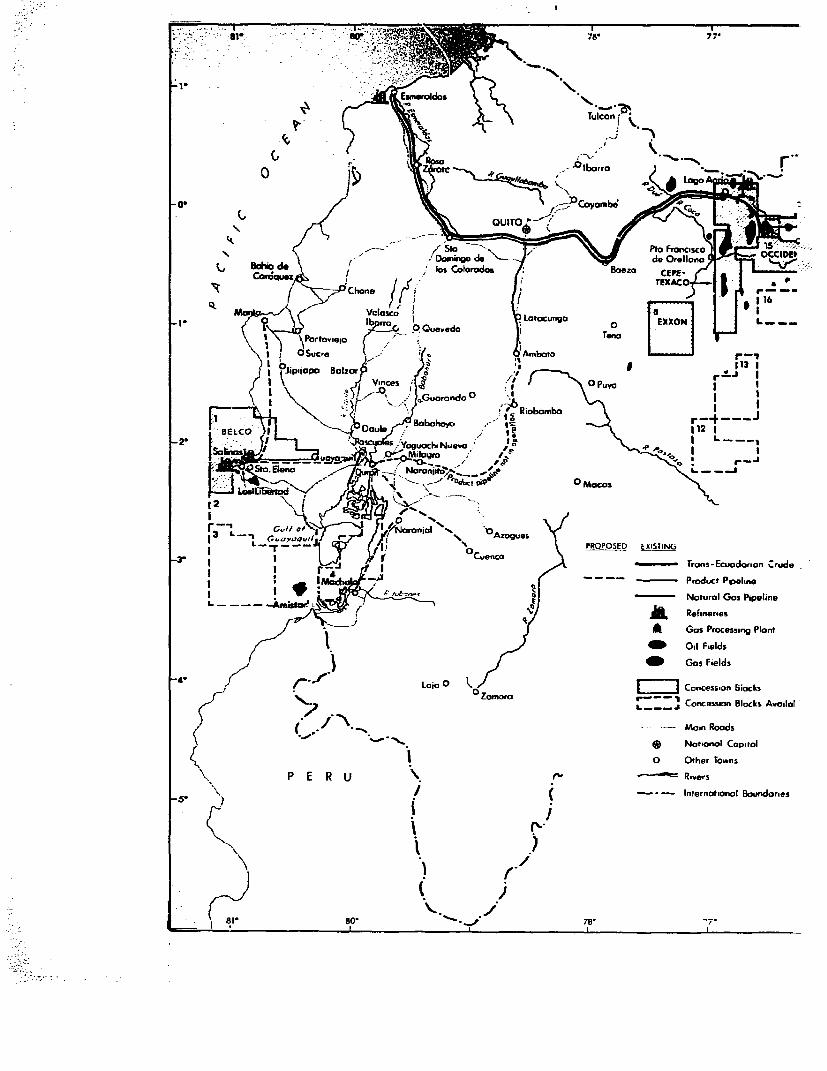
s sx8s'SIw."8 75 77
1*~~~~~~~~~~~~~~~~~~~~~~~~~~~~~~7
Tuicon .
- *lb--rro r; KLogo %--
-0. f.-;~~~~~~~~~Coyornbe ~ ~ ~ .
/ Sic ~~~~~~- ~Pta Francisc OCCIDE t -N Domingo ~~~~de do OrollrnIoCIIt" doa los Colrodo / Boezo wE-
Car ' I . TEXACO
"It t Chone / il
Volosco iIXIN
-1' t ¶Z, OQuevedo L0tocung_I Portoviep j Tana
\ I { OSucre Amboto
g °ipiioPo Bolzor6 61 r
{ i V /f 5. ;0,>Guoronda0 'tbliibomboI '~~~~~~~~~~~~~~~~~~~~~~~~~~0
I <° ol/J°°° YaguacleNue'.
t F * G>e>-eevgli({>l! > X _ ~~~~~~~~~~~~~Trons-Ecuodorian Crud.-
, ~~~~Is, f -_-_ Product Pipeline
L---- °v~~~~~~~~~~~~~~ N)~~~i Refineri<es
/ y ~~~~~~~~~~~~~~~~~a Gos Processing Plant
1 '} Oile F,elds
/ j X *~~~~~~~~~~~~~~ Gas Fields
4 r -t LojsJ O k r |Zomoa ~, Concession blackss7 Zonoro > w~~~~~~~~ Concession lBlocks Availor
X X / _ ~~~~~~~~~~~~~~~~~~- -- -~- Moin Roads
\ -> '~~~~~~~~~~~ ' ~ ~ ~ ~ ~ ~ @~~ Notional Capitol
2;~~~~~~~~ 0 Olher Towns
< ~~P E R U \.>Riverss- ,> !~~ ~ ~~~ ( _ *- International Boundaries
A ) rof
.~~~~~~~~~~~~~~~~ /,81 SO' /8'
.~~~~~~~~~~~~~~~~~ .1 11,
,,~ ~ ~ ~~~2
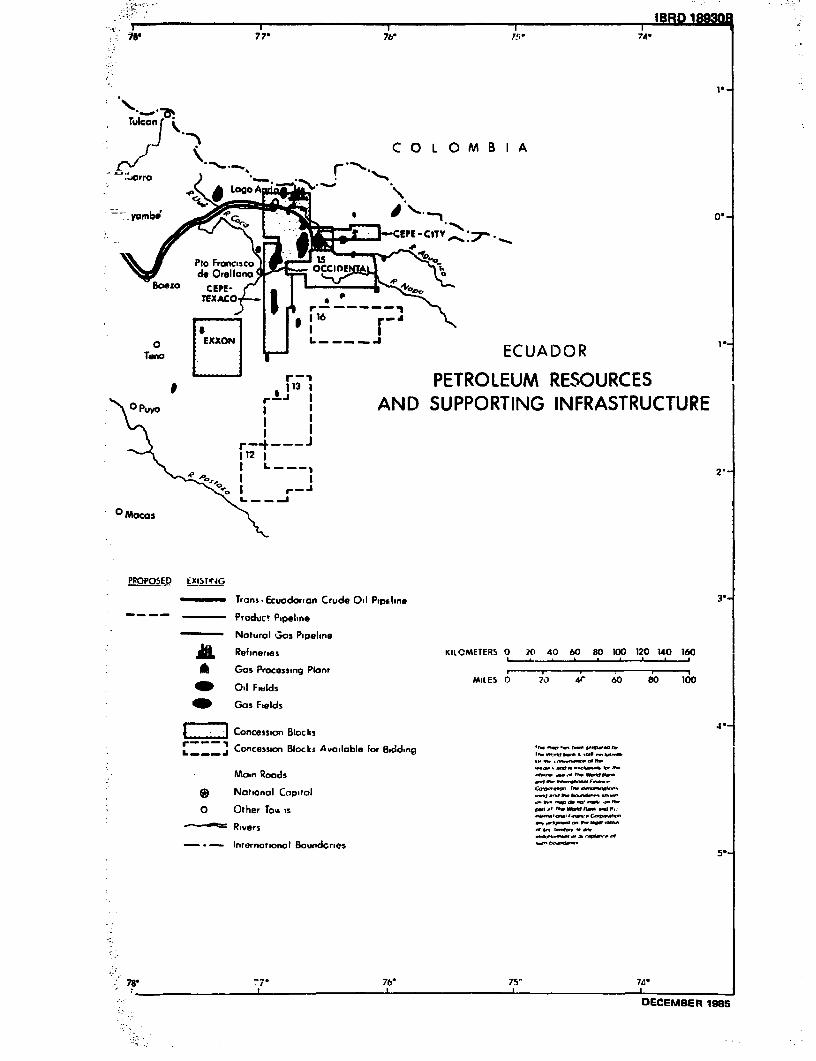
79' 77- 7b Z!i- 7A.
f ~~~~~~~~~~~~~~~~~~~~~~~~~~~~~~~~~~~~~~~~~~~~~1
Tulcof I OL M I
- PETMC O L O M B I A
.- orro '._ rogo A
-- yomnbe' 0F .\ '
AND SUPPORTING INFRASTREE - CITY
0 J ~~~de Ore10la OCCIDE
TEXAC0£
112 I 11
I6 r
0 L~~~
Teno _E; pEC UA DO R# § ~~113 1 PETROLEUM RESOURCES
0 °Puy I AND SUPPORTING INFRASTRUCTURE
\-ol ~ ~ 0~ I 112 1
-- ---! c-2
0Maa
PROPOSED EJISTING
Trans Ecuadorian Crude Oil Pipeline
___- Product Pipeline
Noturol Gos Pipeline
AL Refineries KILCMETERS 0 20 40 60 80 100 120 140 160
: A1l Gas Processing PlantOil Fields ~~~~~MILES 0 70 4" 60 s0 100
_ Oil Fwslds
-_ Gas Fields
r J - ,Concession Blocksi ; Concession Blocks Available for Bidding .,,,.i.,
L -. 1~~~~~~~~~~~~~~i,- .
:---- M Aon Roods r _
* National Capital o.. _.ZZZ_0 Other Toweis rsfnr rs
: - - Rivers "
-.- Internationol Bounidcries5--
7g -7 76- 75" 74-
DECEMBER 1985
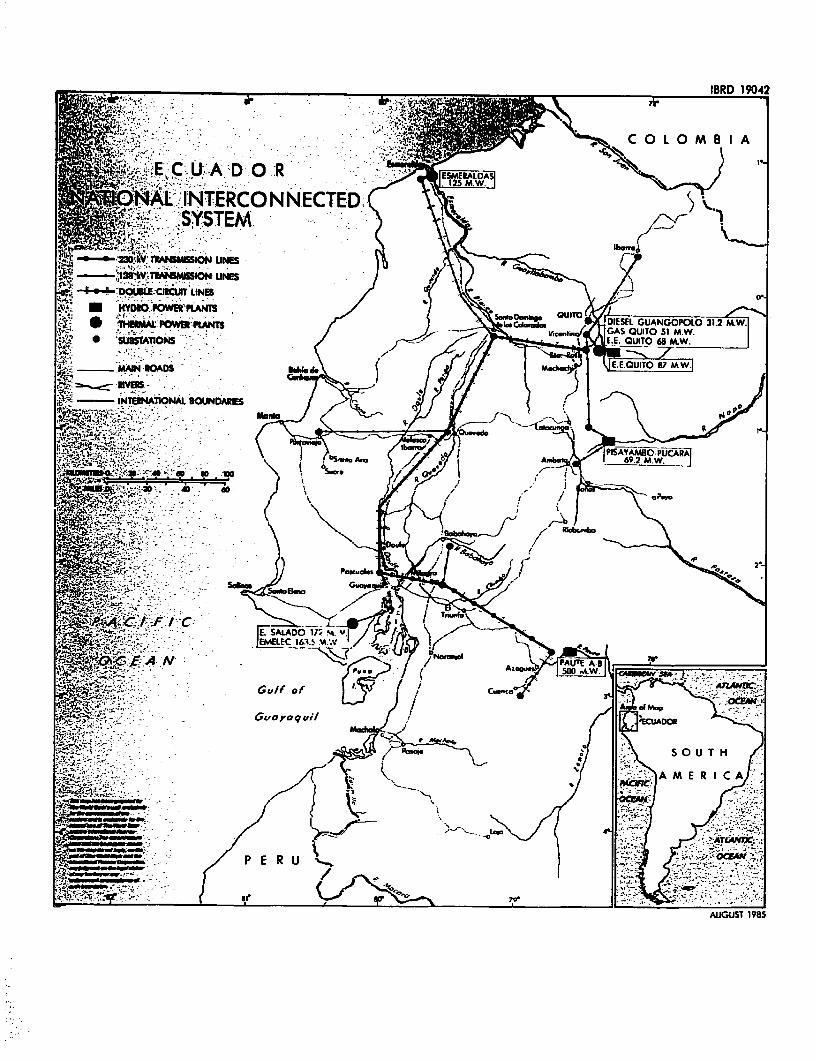
2 >S UA: ~~~~~~~~~~~~~~~~~~~~~~~~BD 10:4200|
ONAL INTERCONNECTED
g -_-lr*vTRANsmI UNUES+C-.!-DOtIBLE- Ca UliN LINES
INVA POErtK ImCakI LGUANGOPtOO31.2 MW|
no &< N K LogoouroN-MOW.S
6-sINTENTONAL BOUNDARIESf J
a-~~~~~~~~~~~~~ur
rE_ SALADO 172 M ~ ~ ~ ~ ~ ~ ~~~~~~~AUUS 18
Gv/r~~~~~ ~~~~~~~~ of U TH/
m ̂ , t ' < S t- S O ~~~~~~~~~~~~~~~~~~~~~~~~~AIUST 198
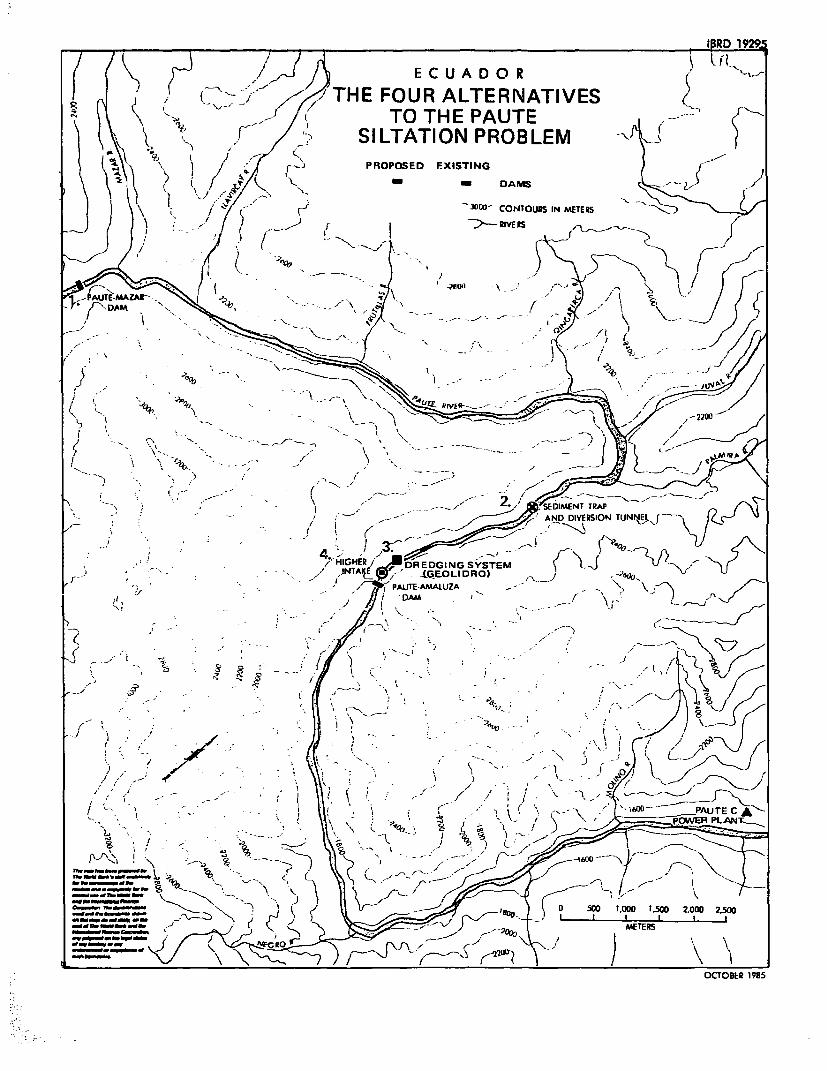
IORD 1929
/ /v 4 E ECUADOR
,1 ' !--, / THE FOUR ALTERNATIVESTO THE PAUTE
K t i o /. SILTATION PROBLEMPROPOSED EXISTING
\ - l W|, -- DAMS
3 i00' CONTOURS IN METERS
j ~ ~ I -RIVE RS
N,~ ~ ~ ~~~~~~~~~~~~-
,,~~~~~~~~~~~~~~~~~~~SO TUN. , ' - Y N :
L * -- / -! AND DIVERSION TUNtE(J 4
Lr - , ~ ~~~ - / f 1/ ~~~LQEOLIDRO) _ ,_Ox
f~~~~~~~~~~~~~~~
-j~~~jU'
) - - i gw -; x, * _4 - -
PAUTE-AMALUZA N -~~AUE C
1-~~~~~~~~~A ,. s * , ;->g1
;-,'- p-WER PL T
X -5 +s n 8 eJ g ll - Jz , ) ( ~~Igo 0 So 500 D 1,00t500 2,000 2.500
S k>gpjvr g t < o or~~~~~~~~~~~~~- < t ~~~METERS
OCTOBER 1985
' ,I'