Public Disclosure Authorized Protection and Industrial ... Research W O \ WORKING PAPERS Country...
57
Policy Research W O ¶\ WORKING PAPERS Country Operations CountryDepartment The WorldBank October 1992 WPS990 Protection and Industrial Structurein India M. AtamanAksoy and Francois M. Ettori MakingIndia's industrial incentive scheme transparent requires making tariffs unifonmly low and eliminatingall quantitative restrictions on imports. Tariffs must be used only to provide protectionand incentivesignals,not to raiserevenues. PolicyRschWod&ngPapersdissminatoicrmdingsofwokin p.ogms and encogctheexchangeofideasnamngBankstaff and allothersin dIvdopmentissues.Thesepape, i tributedbytheResarchAdvisoryStaff,cMethenmesotheauthors,reflat onlydhirviews, and should boused and cited accordingly.Thefindings. intpretaions. and ceonclusionsaretheauithoreown.Theyshould not be attibuted to theWodd Bank. its Board of Directors, its managenent, or any of its menbr countries. Public Disclosure Authorized Public Disclosure Authorized Public Disclosure Authorized Public Disclosure Authorized Public Disclosure Authorized Public Disclosure Authorized Public Disclosure Authorized Public Disclosure Authorized
Transcript of Public Disclosure Authorized Protection and Industrial ... Research W O \ WORKING PAPERS Country...

Policy Research W O ¶\
WORKING PAPERS
Country Operations
Country DepartmentThe World BankOctober 1992
WPS 990
Protection and IndustrialStructure in India
M. Ataman Aksoyand
Francois M. Ettori
Making India's industrial incentive scheme transparent requiresmaking tariffs unifonmly low and eliminating all quantitativerestrictions on imports. Tariffs must be used only to provideprotection and incentive signals, not to raise revenues.
PolicyRschWod&ngPapersdissminatoicrmdingsofwokin p.ogms and encogctheexchangeofideasnamngBankstaff andallothersin dIvdopmentissues.Thesepape, i tributedbytheResarchAdvisoryStaff,cMethenmesotheauthors,reflatonly dhirviews, and should boused and cited accordingly.Thefindings. intpretaions. and ceonclusionsaretheauithoreown.Theyshouldnot be attibuted to the Wodd Bank. its Board of Directors, its managenent, or any of its menbr countries.
Pub
lic D
iscl
osur
e A
utho
rized
Pub
lic D
iscl
osur
e A
utho
rized
Pub
lic D
iscl
osur
e A
utho
rized
Pub
lic D
iscl
osur
e A
utho
rized
Pub
lic D
iscl
osur
e A
utho
rized
Pub
lic D
iscl
osur
e A
utho
rized
Pub
lic D
iscl
osur
e A
utho
rized
Pub
lic D
iscl
osur
e A
utho
rized

Policy llesearch
Counlry Operations
WPS 990
This paper-ajoint product of the Southem Africa Department and of the Industry and Energy OperationsDivision, Middle East and North Africa Country Department I - is part of a larger study of India's traderegime undertaken by the South Asia Country Department III. Copies of the paper are available free fromthe World Bank, 1818 H Street NW, Washington, DC 20433. Please contact Rose Matenda, room J 1 1-217,extension 35055 (October 1992, 51 pages).
Effective protection rates in India are so high and The proportion of projects with a positive profitvary so greatly that anything short of low margin would triple, from 20 percent to 63uniform tariffs and the complete elimination of percent.quantitative restrictions would not make the Among import-substituting projects that areindustrial incentive scheme transparent, as it not candidates for export under the present tradeneeds to be. regime, under the proposed new regime half
Aksoy and Ettori produce evidence to show would be candidates for export if they wouldthat there is ample scope for reducing tariffs and procure their inputs at intemational prices.quantitative restrictions and that most industries Lower tariffs would fulfill their primarycould coexist with much less protection than purpose more effectively: providing protectionthey now have. and incentive signals. The function of generating
By eliminating all surcharges on inputs public revenues, another critical issue in India,(tariffs on imported inputs, price differentials on should be fulfilled not through tariffs but throughlocal inputs, nondeductible excise taxes) - even more efficient and protection-neutral instrumentswithout correcting for the effects of high invest- - in particular, direct taxation (income tax) andment costs - most projects (including import- nontariff indirect taxation (neutral excise taxes,substitution projects) would earn from current MODVAT, and preferably the value-added taxintemational prices a positive profit margin on on consumption).theirmarginal as well as full production costs.
T'hePolicy ResearchWorking Produced by athe Policy Research dis of workder way in ienBane Anrobjectiveof theseiesis to get thtese findings out quickly, even if presentaions are less than fully polished. The fmdings, interpretations, andconclusions in these papers do not necessarily represent of ficial Bank policy.
Produced by the Policy Research Dissenmmation Center

PROTECTION MD INDUSTRIAL STRUCTURE IN INDIA
BY
M. ATAKAN AKSOY AND FRANCOIS N. ETTORI*
* Principal Economist, Southern Africa Department, Africa Region, and DivisionChief, Industry and Energy Operations Division, Country Department I, Niddle Eastand North Africa Region, World Bank. This Paper is based on a larger study ofrndia's trade regime undertaken by the India Department. This study does notreflect the major changes that have taken place in Indian Trade Regime after July1991. We would like to thank Michael Gould, Woldal Futur, Pradeep Nitra andDelfin Go for their coments.

Table of Contents
Incentives and Protection in Indian Industry 1
A. Nominal and Effective Protection in Manufacturing 2
B. Simulating Free Trade 9
C. Developments in Selected Subsectors 1 4
a) Iron, Steel, and Ferro-Alloys 18b) Petrochemical Industry 23c) Capital Goods Industries 31
D. Conclusions 48
References 51

INCENTIVES AND PROTECTION IN INDIAN INDUSTRY
1. India's industrial policy environment has gone through major cycles oftightening and relaxation over the last few decades. These policy shifts havebeen caused primarily by balance of payments crises. The adjustments to the
BOP crises have to a large extent been made (a) on the import side by increa-sing tariffs and restricting imports via various QRs and (b) by increasingregulations on industrial investment, output adjustment and placing otherrestrictions on the ability of firms to adjust to changing economic condi-
tions. The policy apparatus that has been created as a result of these crises
have not been dismantled when the policy regimes have been relaxed. Instead,
ad hoc adjustments and exemptions have been introduced as special schemes to
ease the restrictions and resulting bottlenecks. As a result, a very compli-cated policy environment has been created with overlapping layers of control,
riddled with special exemptions and schemes. In the 1980s significant reformswere implemented in areas of industrial regulation and export policies that
eased the magnitude of bottlenecks that firms and exporters face. However,
the reforms in the import regime have been more modest and the complex and
restrictive structure of the regime has continued to date.
2. Net effect of the import regime has been a gradual shrinkage of inter-
national trade as a proportion of domestic output (Aksoy and Tang, 1991).High protection given by QRs and increasing tariffs have led to indiscriminate
import substitution and very high product prices in India compared to
international prices. On the other hand, specific exemptions, administered
pricing of key inputs and uneven domestic competition have led to certain
product groups enjoying very high effective protection while other productgroups having low or negative effective protection. Furthermore, very hightariffs and taxes levied on investment goods to protect the domestic producershave eroded the competitiveness of even otherwise efficient industries and
require modifications in the interpretation of effective rates of protection.
3. This paper tries to estimate the structure of incentives and effective
protection and its implication for Indian industry. First, the rates of
nominal and effective protection collected from various studies are analyzed.
These include effective protection estimates made by Pursell (1988), various

- 2 -
BICP reports and other firm level information collected by the World Bank for
its subsector studies and projects. Second, the effect of moving to a free-
trade environment on different subsectors is analyzed with the use of a multi-
sector computable general equilibrium model. The firm level effective
protection estimates are compared with the simulations obtained from the CGE
model. The CGE shows that the higher effective protection a subsector enjoys,
the more negatively this subsector is effected by moving to free trade. In
the third section of the study, a detailed analysis of the protected
subsectors are undertaken to highlight more precisely the sources and
structure of these inefficiencies.
A. NOMINAL AND EFFECTIVE PROTECTION IN MANUFACTURING
4. There are serious problems in estimating effective protection rates in
India. Many industries are effectively autarkic where, depending on the
degree of domestic competition, domestic prices might be below or above landed
prices of imports (inclusive of tariffs). In this context, deregulation has a
very important effect on domestic prices. Easing of entry barriers in many
subsectors lead to a rush of investments and eventually to the creation of
excess supplies. These excess supplies lead to lower prices than the tariff
inclusive prices of imports. Thus for many product groups, domestic prices
are much lower than landed (inclusive of tariffs) import prices.
5. Another reason for non-equalization of domestic and import prices is the
implicit or explicit price controls and canalization. Public sector supplies
a large portion of intermediate goods (especially in metals and chemicals) and
thus either directly controls their prices, or controls the prices of imports
through public sector canalizing agencies. Supplies of many of these
commodities are also rationed to actual users. Thus, firms needing more
inputs (both imported and domestic) than supplied by the rationing system have
to import the difference (either directly or through REP licenses) at a higher
landed price. In other products, Government agencies import the products at
high tariffs and sell at a price that is lower than the landed price, thus
cross subsidizing the imports through charging other levies on domestic
production (Pursell, 1988; Aksoy, 1991). This is prevalent in many
petrochemical products.

6. EPRs In India change dramatically over time because of the pricing
policies of the Government for major intermediate products. By the nature of
world markets, international prices of intermediates (metals, chemicals, etc.)
a-e substantially cyclical. In the name of price stability, the Government
adjusts tariffs on these products such that the International price fluctu-
ations are not passed on to the domestic prices. Since ERP estimates are
based on comparisons of domestic and international prices, certain sectorswould show widely varying ERP estimates depending on when they are made.
7. Nominal Protection. The overall effects of trade, protection and
regulatory policies for industry are ultimately reflected in the comparative
prices of industrial products (domestic ex-factory prices relative to inter-
national prices, before taxes charged to the users, i.e., realized
protection). Some 500 price ratios between domestic ex-factory prices and CIF
import prices, (nominal protection coefficients NPC) covering the period 1987-1989, assembled from a multiplicity of sources (BICP reports, Bank subsectoral
analyses, DFI-financed sub-projects) are presented in Table 1. These priceratios provide a reasonably comprehensive picture of the level of
competitiveness of Indian industry in the late 1980s.

- 4 -
TABLE 1:I NOMINAL PROTECTION COEFFICIENS IN MANUFACTURING
PMOdI.qE 191§-19A1 9 I 9 8 Overall Landed Ilport Prices /aEdible Oils 1.57 2.32 --- 2.11Miscellaneous Food Products 1.13 2.26 (1989)Total Food Industries 1.82
Cotton Textiles 1.10 1.10Synthetic Textiles 2.53 2.09 1.73 2.16Total Textiles 1.77
Rubber Products 1.80Plastics Products 1.57
Heavy Chemicals 1.87 1.96 1.82 1.84 2.27 (1988)Petrochems Intermediates 2.31 2.47 1.98 2.19 2.30 (1989)Synthetic Fibers/Resins 2.17 3.38 1.68 2.32 2.23Other Chemicals 1.56 1.47Total Chemical Industries 2.04 2.14
Iron/Steel Products 1.51 2.08 2.01 1.74 1.89 (87-88)Castings/Forgings 1.34 2.17 (87-88)Non-Ferrous Metals (Aluminum) 1.23/b 2.09 (1987)Total Basic Metals 1.54 2.08
Machine-Tools 1.57Non-Electrical Machinery 1.72 1.97 1.80Electrical Machinery 1.35Total Machinery 1.67
Electronics and Parts 1.58 1.19 1.37 1.49 1.63 (1988)
Motor Vehicles and Parts 1.39 0.84 1.26
La Coefficient of Landed (inclusive of tariffs) to CIF prices for imported goods.Lb Mostly Aluminum products.
Note 1: Subsectoral NPCs are unweighted averagesNote 2: Seven other subsectors with less than 6 observations each are not included in the table.
8. Some products groups have a sufficiently .arge number of price compar-isons to permit the estimation of annual averages for 1986-87, 1988 and 1989separately. The trends suggested by the annual averages confirm other indi-cations derived from specific subsector knowledge: - slightly decliningrelative prices for synthetic textiles, synthetic fibers and resins, andpetrochemical intermediates and stable relative prices for heavy chemicals andmachinery. The increasing trend for iron/steel products is due to the shift
in the sample's product-mix over the period 1987-1989 from mild steel to

-5-
special steels and alloys which have much higher tariffs. Table 1 also shows
clearly the tremendous variability of relative prices in India compared to
international prices. Despite significant real devaluation since 1986, Indian
ex-factory prices in key subsectors such as metals, machinery, chemicals and
other engineering products, are still between 50% to 100% above international
prices. While part of this can be attributed to higher taxes and tariffs on
inputs, it also probably reflects the very high protection given to theseindustries through tariffs and/or QRs.
9. Another characteristic of the trade regime is that the tariffs are set
to keep the landed price of imports above the domestic prices. Comparison of
landed import prices (inclusive of tariffs) to domestic ex-factory prices
shows that landed import prices are between 20% to 50% higher than the domes-tic prices. This "water in the tariff" allows domestic producers to sell
their products first (imports take place only if the domestic supply is not
sufficient to meet the domestic demand)l/ and also permits them to invest in
import substitution without any fear of import competition, even if their
investments are inefficient. However, these high tariffs on many
intermediates and capital goods increase the production costs of user
industries substantially.
10. Effective Protection. The combined effect of realized protection on
inputs and outputs, and the low value added content of Indian industry
(averaging about 25% in domestic prices) have generated effective protection
rates (EPR) that vary widely between and within subsectors and are generally
high. The EPRs also fluctuate significantly over time due to changes in
international prices which are not fully reflected in domestic prices. Given
the low value added content of Indian industry, small deviations between
domestic and international prices lead to large changes in EPRs. For this
reason, an attempt has been made to mention the year in which a particular EPR
estimate is made. Table 2 presents some 210 effective protection rates (EPRs)
from various sources grouped into 16 product categories.
1/ This also means that the firms which are growing rapidly and/or needmore inputs than what is allocated to them at lower prices, end uppaying higher prices for their inputs.
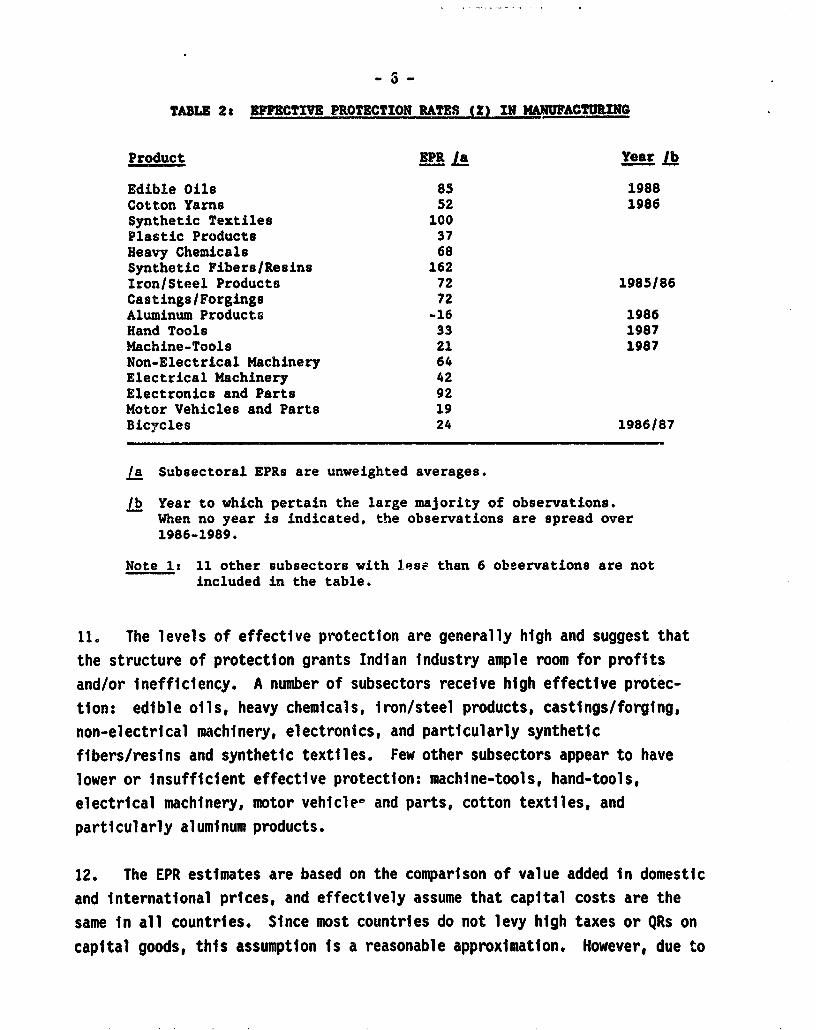
TABLE 2 EFmCTIVE PROTECTION RATES (Z) IN MNUFJACTURING
Product EPR La Lear lb
Edible Oils 85 1988Cotton Yarns 52 1986Synthetic Textiles 100Plastic Products 37Heavy Chemicals 68Synthetic Fibers/Resins 162Iron/Steel Products 72 1985/86Castings/Forgings 72Aluminum Products -16 1986Hand Tools 33 1987Machine-Tools 21 1987Non-Electrical Machinery 64Electrical Machinery 42Electronics and Parts 92Motor Vehicles and Parts 19Bicycles 24 1986/87
/a Subsectoral EPRs are unweighted averages.
jb Year to which pertain the large majority of observations.When no year is indicated, the observations are spread over1986-1989.
Note 1: 11 other subsectors with lese than 6 obeervations are notincluded in the table.
11. The levels of effective protection are generally high and suggest that
the structure of protection grants Indian industry ample room for profits
and/or inefficiency. A number of subsectors receive high effective protec-
tion: edible oils, heavy chemicals, iron/steel products, castings/forging,
non-electrical machinery, electronics, and particularly synthetic
fibers/resins and synthetic textiles. Few other subsectors appear to have
lower or insufficient effective protection: machine-tools, hand-tools,
electrical machinery, motor vehiclee and parts, cotton textiles, and
particularly aluminum products.
12. The EPR estimates are based on the comparison of value added in domestic
and international prices, and effectively assume that capital costs are the
same in all countries. Since most countries do not levy high taxes or QRs on
capital goods, this assumption is a reasonable approximation. However, due to

- 7 -
the high capital costs in India, the observed effective protection rates needto be interpreted with caution. India is almost unique in levying such hightaxes and tariffs on capital goods. Most other countries usually exemptmachinery from import duties and domestic taxes. For example, in Brazil whichhas had very high protection for the domestic capital goods Industry, thetariff collection rate in 1984 was 17% in non-electrical and 11% in electricalmachinery. In Korea, the tariff collection rates on machinery for domesticuse was about 9% during the late 1970s and early 1980s. Tariff collectionrates on machinery for export use was negligible. Even in Pakistan (which hasthe second highest overall tariff collection rate after India), the tariffcollection rate on machinery was 15% in 1987/88. In comparison, the averagetariff collection rates on machinery in India were about 75% in 1983/84 and67% in 1987/88. Higher prices for capital goods (domestic or imported) paidby Indian firms imply that their value added should include a larger return tocapital (interest, depreciation and return on equity). This contributes,ceteris paribus, to domestic value added exceeding the value added ininternational prices, and to positive EPRs. That is, the firms in India whichmay be as efficient as the foreign firms, will nevertheless, show higherprices and EPRs. Thus, to make EPR estimates in India comparable to othercountries, the effects of higher capital costs have to be taken into account.
13. Ettori (1990), has collected data on 60 appraisal reports for newinvestments prepared by ICICI and IDBI during 1988 and 1989. The data onthese project appraisals have been reestimated to separate the effect ofcapital costs on EPRs. This data should be interpreted with caution for thefollowing reasons. First, the parameters and data used in project appraisalreports tend to be favorable to comparative prices (domestic versus CIF) forthe projects' outputs. Second, the projections implicitly assume that theprojects will be operated efficiently to minimize production costs (inputs,labor, capacity operating ratio, ... ). In practice, actual production costsare often higher than projected during -ppraisal, and domestic ex-factoryprices are then increased as much as permitted by domestic competition and thedegree of protection provided by the QRs and tariffs. Third, in many casesexcise (or CVD) taxes on inputs that are reimbursed under MODVAT, could not beseparated from input prices. So the input prices are overestimated. Forthese reasons, actual effective protection rates are underestimated (seeEttori, 1990 for the details of estimation).

- 8 -
14. The level of EPR just sufficient to compensate the firms for highercapital costs (sufficient to earn a return on investment equal to that underfree trade) is termed compensatory effective protection rate (CEPR). Itshould be mentioned that CEPR is not affected by the data problems mentionedabove. Table 3 presents the EPRS and CEPRs for different subsectors. Thedifference between the actual EPR and the compensatory EPR is termed Net EPRand measures the protection given to firms above the level necessary tocompensate for higher capital costs.
TABLE St COMPENSATORY AND ACTUAL EFFECTIVE PROTECTION BY SUBSECTOR la
No. of Actual NetSubsector Firms CEPR (X) EPR EPR
Heavy Chemicals 9 41 69 28Light Chemicals 3 49 -6 -55Synthetic Yarns 3 60 77 17Basic Steel Products 7 46 72 26Electronics 8 24 95 71Food Products 4 41 52 11Other Engineering 14 49 -11 -60Miscellaneous (Tires, Paper) 5 37 61 24Total 53 42 46 4
/a The averages are unweighted averages.
Sourcet Ettori, 1990.
15. Table 3 shows that a large portion of the high observed EPRs areactually a compensaltion for the high investment costs in India. Between 20-60 percentage points of observed EPRs are just a compensation for high capita'costs. Since the estimates of EPRs for the overall manufacturing sector arearound 40X, most of that protection is just a compensation for high capitalcosts (World Bank, 1989). The protective system on average does not givehigh net protection to the industrial sector. However, the variability of netEPRs among different firms is so large that about half of the firms receive

excessive protection, while the other half receive negative net protection.
In the process, the average ex-factory price of output in this sample is
higher than international prices by more than 40%.
16. Table 3 also shows that sectors producing basic intermediates have
generally higher net EPRs than downstream products. For example, basic
chemicals, basic steel products, synthetic yarns and miscellaneous products
(which are also basic inputs such as tires, paper, etc.) have high and
positive net EPRs while downstream firms in engineering, machine tools, light
chemice:s have low or negative net EPRs. Again these subsectoral averages
have large variations. The only exception is the electronics industry which
was recently deregulated and is meeting a pent-up demand for its products.
More recently the prices and EPRs in electronics have started coming down as
these demands are satisfied.
17. In conclusion, the multiplicity of tariff and tax rates, special
exemptions, special schemes and varying degrees of domestic competition have
created a structure of effective protection which has large variability across
firms and industries. However, it is a structure that gives, on average, much
lower net protection to the firms while substantially increasing the average
cost of production.
B. SIMULATING FREE TRADE
18. The EPRs sunmnarized in the previous sections indicate that the
production of key intermediates are relatively more inefficient and tend to
have higher EPRs. This conclusion, however, is based on a sample of products
and may not generalize if the whole economy is taken into account. To observe
the economy-wide effects of protection, input-output tables are usually used
to estimate effective protection rates. These static estimates, however, do
not take into account the macroeconomic adaustments that accompany changes in
the level of protection. Moving to a free trade environment (i.e., elim-
ination of protective tariffs and QRs) will effect individual subsectors
through two channels. First is the effect of changes in relative prices
caused by the changes in protection. The secotid effect is caused by
macroeconomic adjustments that are required to compensate for the tariff and
QR changes and maintain internal and external balances. The Indian Government

- 10 -
receives close to one-third of its revenues from import tariffs and lowering
of tariffs and QRs would effect external and internal balances requiringadjustments in public expenditures, other taxes and exchange rates. Ideally,the simulation of reduced protection should assume that all trade taxes are
removed and compensating fiscal adjustments are made through lump-sum taxes.
In this study, a more realistic and therefore theoretically less correct
adjustment is assumed. First, the protective tariffs are assumed to be
lowered to a uniform 20% rather than to zero. This is because, for a
considerable amount of time, the revenue from tariffs will be required in
India. Second, the QR premium is assumed to be a uniform 25% and all QRs are
assumed to be eliminated. Third, MODVAT is extended to allow those sectors
registered under MODVAT to claim full credit for excise and CVD paid on
capital goods against their output tax liability.
19. This simulation is made using a 72-subsector general equilibrium model
developed by Mitra and Go (1991) using the database for 1987/88. The modelhas an integrated macro-fiscal and micro-sectoral perspective and attains
micro and macro equilibrium simultaneously. It is capable of tracing the
effects of policy changes on the major macroeconomic aggregates and deriving
the impact of tax, tariff and expenditure changes on output, value added,
prices and real rates of return on the disaggregated sectors of the economy.
(See Mitra and Go, 1991 for details of the model.)
20. These adjustments are simulated to achieve balance of payments
neutrality, i.e., maintaining the existing current account deficit. Foreign
savings is therefore given and domestic savings must adjust to ensure equality
between total savings and investment. Domestic savings may be raised either
by cutting public expenditure or by increasing tax revenue with fixed public
expenditure. Maintaining the current account deficit with tariff cuts
requires a tightening in the management of domestic demand. While this can in
practice be brought about through a range of instruments including monetary
policy and administered prices, the focus here is on fiscal adjustment. The
first alternative is to raise excise taxes-cum-CVD while keeping government
expenditure constant in real terms. In the second alternative, the government

- 11 -
reduces domestic demand by cutting its own expenditures, both currentconsumption and public sector investment.2/
21. Table 4 summarizes the industry specific effects of moving to lower anduniform tariffs and eliminating QRs. The magnitude of the output changessummarized below should be treated with caution since the model does notincorporate the effects of endogenous technological improvements that would beinduced by greater openness to the world economy. Changes in output,therefore, should be treated as illustrative, indicating the direction ofchange and highlighting the sub-sectors that will be affected.
2/ Both alternatives are potentially contractionary. The price deflationcaused by fiscal contraction must be accompanied by a reduction ofnominal wages in order to keep real wages from rising to valuesincompatible with the maintenance of base year levels of employment.Since nominal wages of many workers are, however, sticky downwards, anexchange rate devaluation is required to raise prices and hence preventan increase in real wages inconsistent with equilibrium In the labormarket. The latter equilibrium would have been brought about withoutpolicy intervention if wages were flexible downwards.

- 12 -
TABLE 4: SUBSECTORAL EFFECTS OF FREER TRADE(1 Change)
Expenditure Adjustment Tax AdiustmentGross Rate of Gross Rate ofOutput Return La Output Return la
AGRICULTURE 0.8 0.8 0.0 0.0
ENERGY 0.7 0.7 -2.8 -2.8
MANUFACTURING -2.6 -1.9 -4.8 -4.1
Food, Beverages and Tobacco -0.8 0.0 -2.6 -1.8Leather and Textiles 7.1 7.1 2.1 2.2Petroleum and Coal Products 1.6 0.8 -0.4 -1.6Chemicals -6.7 -5.0 -8.9 -7.2Non-Metallic Mineral Products 6.9 6.9 6.6 6.7Metals -15.3 -13.9 -15.7 -14.2Metal Products 0.3 0.4 -1.3 -1.2Machinery -16.6 -14.9 -16.4 -14.5Electrical Appliances -4.4 -4.5 -7.4 -7.5
and ElectronicsTransport Equipment -1.8 -1.0 -2.9 -2.2Other Manufacturing -5.4 -3.8 -6.5 -4.9
CONSTRUCTION -1.1 -1.1 0.9 0.9
SERVICES 2.0 1.7 0.7 0.4
TOTAL -1.0 0.0 -2.2 -1.3
Source: Mitra and GO (1991).
/a Gross profit margin on output.
22. The results suggest that the manufacturing sector as a whole contracts.
Part of this contraction is due to the fact that the manufacturing sector is
highly protected and this protection is removed. An equally important part is
that most of the indirect taxes are levied on the manufacturing sector. In
agriculture, for example, lower protection is coupled by high subsidies that
are not eliminated in these simulations.3/ Despite the limitations of the
simulations, the results presented in Table 4 on manufacturing subsectors are
quite consistent with the conclusions of the firm-level EPRs. The three
3/ In India, the manufacturing sector is both protected and taxed, whileagriculture is disprotected and subsidized. In this experiment,protection is removed but taxes and subsidies are left intact.

- 13 -
hardest hit sectors are machinery, metals, and chemicals, indicating that
these subsectors have the greatest inefficiencies and are highly protected by
the existing trade regime. Export oriented industries such as textiles and
leather and non-metallic mineral products (gems) expand as a result of changes
in relative prices.
23. Table 4 also shows that the type of compensatory fiscal adjustment (tax
increases or expenditure cuts) make a significant difference on what happens
to different industries. Public expenditure cuts primarily fall on
construction. The excise tax increases, on the other hand, fall primarily on
the manufacturing sector. This is because government expenditures are
concentrated on services and construction while central excise taxes are
mainly levied on manufactured goods. Therefore, the reduced protection and
fiscal adjustment through tax increases penalize the manufacturing sector in
two ways. Intermediates and capital goods are affected through lowered
protection while consumer goods are penalized by higher excise tax rates.
This is the reason overall profitability of the manufacturing sector declines
by 4.1% under tax increases but declines only 1.9% under expenditure cuts.
24. These simulations, despite their limitations, supply additional evidence
that the trade regime protects basic intermediate products and capital goods.
The consumer goods, which are also highly protected both by tariffs and import
bans seem to have lower protection. The uneven subsectoral impact of reducing
protection can be traced both to the structure of external protection and to
the uneven impact of deregulation in the domestic industry. In many
instances, despite high external protection, greater domestic competition and
ability to modernize production facilities have allowed firms to be more
competitive and not utilize the full protection afforded by the tariffs and
QRs. Ah'luwalia (1991) shows that the total factor productivity (TFP) growth
in the 1980s has been highly uneven. While TFP has grown at 6.0% p.a. for
consumer goods, it has grown 3.4% p.a. for capital goods and only 1.4% p.a.
for intermediate goods. These numbers are again consistent with higher EPRs
observed on basic intermediate goods producing sectors.

- 14 -
D. DEVELOPMENTS IN SELECTED SUBSECTORS
25. Industrial regulatory reforms during the 1980s have introduced morecompetition between domestic firms by relaxing regulations on capacity
licensing, production levels, and prices. These reforms have had important
effects in a number of subsectors where realized protection has been lower
than that afforded by the trade regime. At the same time, both the firm level
EPRs and model simulations outlined in the previous sections indicate that the
core input supplying sectors of the economy are highly protected and
relatively inefficient. This section first presentr " few examples where
liberalization of the regulatory environment has led to increasing efficiency.
In the second part, a more detailed analysis of the core sectors, i.e., steel,
petrochemicals and capital goods is undertaken to identify more precisely the
sources of inefficiency in these subsectors. It should be pointed out that
the information for these subsectors is highly uneven across different productgroups. Therefore, the analyses are partial and focus on product groups wherethe information is available.
26. One successful example of liberalization has been the cement subsector.Prior to 1982, this subsector was highly regulated, ex-factory prices were
controlled, and plants were obliged to sell a part of their production to the
public sector at a below-market "levy" prices. As levy prices failed to keep
pace with rising input costs (e.g., energy), the price controls had an adverse
impact on the subsector's profitability. Moreover, investments in cement were
constrained by restrictive capacity licensing policies, particularly towards
MRTP companies, and by the levy sale exemptions granted to mini cement plants.
In addition the freight equalization scheme, introduced in 1956 to permit
uniform cement prices throughout the country, distorted decisions regarding
plant location.
27. The reforms adopted in 1982 included gradual reduction and elimination
of the levy cement obligation, a concomitant complete decontrol of prices,
elimination of the freight equalization scheme, significant relaxation of
Investment licensing and entry of MRTP firms, and easing in foreign technology
transfers and collaborations. The response of the cement subsector to liber-
alization was impressive. Investment and production accelerated, price
increases in deficit regions brought further investments in these regions, and

- 15 -
the domestic market become very competitive. In response to these reforms,
the relative price of cement increased markedly between 1982 and 1985 to first
reestablish the industry's profitability, and then continuously declined by
about 18% relative to the wholesale price index. Although imports of cement
are restricted and no imports have taken place since 1986, the price of cement
in India is presently competitive with world prices, and some exports are
taking place.4/
28. Liberalization also took place in a number of subsectors producing
finished goods, such as Electronics and Motor Vehicles (including 2-Wheelers).
In these two subsectors investments were largely delicensed including 'broad-
banding" of the product-mix, and foreign technology transfers and collab-
orations were made easier after 1984. Competition between numerous domestic
firms grew, substantial amounts of resources were attracted in these sub-
sectors for investment, and production growth accelerated in conjunction with
more liberal policies for imports of components. Tariffs were rationalized
and reduced for electronic industries (30% on raw materials and 45% on compon-
ents, both on OGL, and 75% on finished products, mostly restricted). The
liberalization and enhanced competition had a beneficial impact on prices in
these two subsectors, where prices declined not only relative to overall manu-
facture prices but also in absolute terms during a couple of years in 1984 and
1985. The impact of liberalization of domestic production and imports was
particularly visible in the electronic industries. Table 5 summarizes a few
key indicators in the electronics subsector.
4/ It should be noted, though, that liberalization of this subsector wasfacilitated by the small amount of imports and the natural protectionenjoyed by cement due to transportation costs.

- 16 -
TABLE 5: TRENDS IN ELECTRONIC INDUSTRIEI
1981 Am M8 nu
- Number of Firms 179 467 590
- 4-Firm Concentration Ratio (%):
Computers 90 43 52
Black 6 White Televisions 32 29 41
Printed Circuit Boards 83 S0 54
- Value Added Index (1980/81 prices) 100 143 393
- Share of Public Sector (%) 43 n.a. n.a. 32
- Imports as percentage of Output 36.7 50.8 45.8
- Price Index: Overall 100 102.5 95.7 82.6
Consumer Products 100 85.0 76.5 80.0
Personal Computers n.a. L/ 100 La 41.7 16.7
Components 100 97.5 106.5 97.5
a PCs were manufactured in 1984 for the first time.
Source: Joseph (1989).
29. As a result of the liberalization, output in this sector has grown more
than 25X p.a. in real terms in the 1980s. Relative prices have declined due
to domestic competition, and the share of imports, which first increased due
to import liberalization, has started to decline over the last few years.
Similarly, high rates of effective protection enjoyed by this sector in the
late 1980s started to decline recently.
30. In the automotive subsector, too, competition enhancement through deli-
censing and the entry of modern cars by Maruti (a public enterprise) forced
enterprises to improve their products, with a focus on quality, and to fight
for market shares. However, the absolute protection given to automotive prod-
ucts (imports are practically banned) and the absence of minimum efficient
scale (MES) thresholds permitted excessive entry of new firms and plants with
inefficient sizes and investments too small to ensure competitive productivity
and quality. Rationalization of under-sized inefficient producers, especially

- 17 -
in 2-Wheelers and light commercial vehicles, has emerged in recent wears. This
is expected to continue until the structure of the automotive industry and its
capacity are rationalized by market forces.
31. By contrast with the subsectors analyzed above, a number of important
subsectors providing critical raw materials and intermediates, such as iron
and steel and heavy chemical industries, did not receive significant liberal-
ization. Three subsectoral groups, basic metals, heavy chemicals and machin-
ery, (a) provide a significant share (14%) of all inputs consumed by other
subsectors of the economy; (b) constitute a substantial share of fixed invest-
ment (26%); and (c) absorb a large share of imports (39%). The share of these
three subsectors in inputs of some key industries is given in Table 6.
TABLE 6: 3-SUBSECTOR INPUT SHAU IN TOTAL INPUTS
Input Coefficients (1 of output) 3-SubsectorsHeavy Basic Machinery as X of
Output Subsector Chemicals Metals and Parts Total Inputs
Synthetic Textiles 17.4 0.2 1.5 27.0Plastic Products 31.7 1.0 0.4 46.3Pesticides 20.5 1.5 0.8 30.9Paints 33.5 1.5 1.2 48.6Drugs 18.5 1.4 1.2 31.1Hardware 0.4 36.4 1.4 61.5Metal Products 0.8 42.5 0.4 66.8Electronics 1.7 3.4 20.9 42.7Rail Equipment 0.4 26.2 3.9 50.9Motor Vehicles 0.5 25.4 3.0 45.1Bicycles 1.5 21.9 1.6 39.7Other Transport Equipment 1.2 24.3 1.5 38.9Miscellaneous 1.8 18.2 1.7 37.5
32. Table 6 shows that the share of these three subsectors in total input
use of some important sectors range from 27% in synthetic textiles, to 45% in
motor vehicles and 67% in metal products. Efficiency and pricing of these key
input supplying sectors will essentially determine the cost structure of the
rest of the manufacturing sector. Unfortunately, it is exactly these three
subsectors that have the highest tariff rates, highest relative prices, and
also have very high rates of effective protection. Furthermore, it is these
three subsectors that have received bulk of the public investment funds and

- 18 -
have increased their share of output substantially. The issues confronting
these subsectors are discussed below.
(a) Iron. Steel and Ferro-Alloys
33. Iron and steel is India's most important manufacturing subsector,
accounting for about 10% of manufacturing output and value added. It has two
different segments; one segment produces mild steel and consists mainly of
integrated steel plants (ISP), and the second segment produces special steels
and alloys primarily by mini-steel plants (MSP). The ISP segment is dominated
by public enterprises Steel Authority of India Limited (SAIL) and its
affiliates, and the private Iron and Steel Company Limited (TISCO). The
prices of mild steel products are regulated through the Joint Plant Committec.
User prices of domestic mild steel which were competitive in the early 1980s
shot up substantially (by about 50-60%) above international prices during the
period 1982-1987. This was due to the appreciating currency, declines in
international prices of steel, inefficiencies in public sector steel plants
and various taxes and levies placed on steel products. Price increases in
steel jeopardized the competitiveness and export potential of major downstream
industries, in particular engineering and capital goods. Recent favorable
developments; modernization investments and increased efficiency in public
ISPs, price restraint, depreciation of the exchange rate, and increasing
international prices of steel as of 1988, reversed the trend of comparative
prices, and domestic prices of most mild steel products regained some
international competitiveness in 1988-1989. By contrast, high protective
tariffs for special steels and alloys (110% to 345% nominal tariffs and 50-
60% tariff collection rates) and quantitative restrictions on imports of such
steels have permitted inefficient MSPs to sell their products at prices more
than 100% above international prices and still survive despite high production
costs stemming from their suboptimal capacities. In view of the negative
impact of such prices on downstream industries (automotives, capital goods),
the Government has introduced minimum efficient scales (MES) of 50,000 tons
p.a. for MSPs. About half of the 50 existing special steel MSPs have
capacities above this MES. Table 7 shows the structure of production in iron
and steel subsectors.

- 19 -
TABLE 7t IRON AND STEEL - STRUCTURE OF PRODUCTION
Nild Steel Special Steels/AlloysNo. Produc- No. Produc-
Plants Capacity tion Plants Capacity tion-----(OOOT) --------- (OOOT)-----
Integrated Steel Plants (ISPa)
SAIL (Public Sector) La 6 8,600 6,800 2 130 120TISCO (Private) 1 2,000 2,170 1 75 80
Mini-Steel Plants (MSPs) 150 3.000 2,760 50 1,800 800
Total 157 15,600 11,730 53 2,005 1,000
/a Including IISCO's two plants, which are managed by SAIL.Notes Capacity and Production are expressed in terms of saleable steel.
34. International Trade in steel is now confined just to imports, which
totalled 1,660,000 tons in 1988/89 including about 100,000 tons of special
steels and ferro-alloys. Exports peaked in the late 1970s (up to 5% of
output) when India was a low cost producer of steel, and vanished after 1982
when domestic production costs became uncompetitive. The bulk of imports are
canalized through SAIL and other public bodies while a small share (about 10%)
is available under Limited Permissible licenses.
35. Protective tariffs in this subsector range between 25% (metal scraps) to
110% for alloys and 345% for stainless steel, with a weighted average of 40%.
The actual collection rate for protective tariffs and excise taxes were 34%,
and 2% respectively. These collections rates were respectively 24% and 9% in
1973/74, illustrating the trend of increasing tariffs and decreasing excise
taxes.5/
36. Prices of mild (basic) steel have been regulated by the Joint Plant
Committee (JPC), which comprises the secretary of the Steel Department,
representatives of all steel producers, and a representative of the Railways
Department. Since the early 1980s, when steel price regulations were liber-
alized, the JPC has set the steel prices for ISP's major products without the
5/ The collection rates vary depending on the type of product. For metalsas a group, the protective and total tariff collection rates are 71% and81% respectively. In ferrous metals, these rates are 66% and 73%respectively.

- 20 -
Government's formal approval. The JPC-set prices comprise a retention(producer) price, and various taxes and levies (for the Steel DevelopmentFund, the Freight Equalization Fund, and the Engineering Goods ExportAssistance Fund) which increase user prices 30-35% above producer prices. Theproducer prices are determined on a cost-plus basis to allow for a reasonablereturn on investment. Such administered prices have not given adequateincentives for improved performance and modernization, and have diluted thecompetition. Despite pressures from major steel consumers like railways,steel prices experienced a rapid increase over 1975-1985 (11% p.a.) whichslowed down slightly in recent years (8.5% p.a. over 1986-1987).
37. Prices of domestic mild steel, which were competitive up to the early1980s, increased markedly above international prices in the mid-1980s. Due toincreased efficiency and price restraint, real depreciation of the exchangerate, and increasing international prices of steel, Indian prices of most mildsteel products now appear to be closer to international prices. The priceratios (ex-factory to FOB prices) are presented in Table 8.
TABLE 6t NPC. FOR STEE PROUDCTSMlId Steel Sgecial St ll/Al loyv
Product 1980 1985 198S 1989 Product Mid-1988Wire Rods 0.7 1.88 1.06 0.91-1.00 Cutting Steel 2.6-2.7Plates 0.64 1.50 1.04-1.11 0.92-1.18 Stainless Steel 1.6-2.9HR Coll* 0.88 1.69 1.05-1.10 1.09-1.14 Spring Stool 2.64CR Coils 0.98 1.72 1.02-1.16 0.94-0.95 Ball-Baring Steel 2.24Galvanized Plates 0.98 1.84 0.92 N.A. Alloy Steels 2.2-2.8
Sources: - Industrial Costs and Prices, CEI Study (August 1988).- International Competitiveness of Indian Steel Industry, Arvind Pande (1989).- Economic Time, August 12, 1988.
38. On the other hand, prices of non-ISP producers, (in particular mini-steel plants) and special steels/alloys, are unregulated and determined by theconditions of highly competitive domestic markets (except for ferro-chrome);
taking into account the import restrictions (canalization) and the highprotective tariffs for special steels and alloys (110% to 345% nominal
tariffs, and 50% to 160% tariff collection rates). Given the permanent
shortage of special steels on the market, domestic prices have been driven by

- 21 -
landed prices (after duties) of imports and have generally been more than 100%
above international prices. One exception is Ferro-Silicon, where the recent
doubling of inteinational prices (from US$500 to US$1,000 per ton) made Indian
prices competitive.
39. As a result, the profitability has been high for mini-steel plants,
particularly for those with production capacities above 50,000 tons p.a.
Financial results for a sample of 9 MSPs indicate net profit to net worth
rates ranging between 12% to 52% and dividend rates of 3 to 15%. On the other
hand, most MSPs with small furnaces and obsolete technologies have mediocre
financial results.
40. The analysis of the production cost structures presented in Table 9
indicates high efficiency of raw materials use and good profits in TISCO (the
only private ISP) as compared to SAIL and MSPs. Among mini steel plants, the
efficiency and cost structures vary greatly depending on the capacity
utilization which in turn is dictated largely on availability of power, a
critical input for MSPs.
TABLE 9: PRODUCTION COST STRUCTURES
SAIL TISCO MSPs (1988/89)(1987/88) (1988/89) Range (in t) Average (1)
Raw Materials 43 3 40 25-62 46Energy 9 ] 15-46 18Labor 14 ] 40 3-12 9Other Inputs 23 ] 9-28 20Interest/Depreciation 11 20 5-19 7Total Costs 100 100 100 100Gross Profit (1 Output) -1.0 11.0 6-11 9.5

- 22 -
41. Effective Protection also varies widely between the types of plants
(ISPs versus MSPs), products (flat versus long prodiucts) and steel quality
(mild versus special steels/alloys). Table 10 assembles the fragmentary, and
largely outdated, available data on EPRs.
TABLE 10: EFFECTIVE PROTECTION RATES
Product Year NPC EPROutput Input a )
ISP: SAIL (public) 1985 1.30 0.89 74ISP: TISCO (private) 1985 1.31 1.11 51MSPs (Mild Steel) 1985 1.43 1.35 32CR Coils 1985 1.61 0.89 112CR Coils (MSP) 1987 1.70 1.52 174Galvanized Plates/Sheets 1988 1.68 1.66 93
Sources: Pursell (for 1985) - DFI subproject appraisal reports.
The value added content in ISPs is high, averaging about 50%. It should be
noticed that the EPR for SAIL is higher than for TISCO, due to the former's
access to inputs (coal, iron ore) at preferential prices. The value added
content is quite low in MSPs. For example, the basic production parameters
and prices for an MSP project to produce cold rolled (CR) coils in the late
1980s are as follows:
Prices (Rupees Per ton)Domestic CIF NPC
Output: CR Coils 14,750 8,950 1.65
Inputs: HR Coils (Local) 8,380 5,710 1.47HR Coils (Imported) 10,700 5,710 1.87Value added share in output at international prices: 16Z
42. It is quite likely that effective protection has decreased in the mild
steel ISPs during recent years with the increased competitiveness of steel
prices. Prices for the major inputs (iron ore, coke) expressed in foreign
exchange (US$) have remained largely constant. On the other hand, prices of
major mild steel products (rods/bars, plates/sheets, HR coils) expressed in
foreign exchange have come down. Under such circumstances, the EPR of SAIL
may presently be about 30% and that of TISCO around 10%. In view of the high
protection and prices of their output, effective protection in special
steel/alloy producing MSPs most probably remains high. However, the

23 -
information base on special steels and alloys is incomplete and does not allow
more precise analysis.
43. Conclusions. These results indicate that in mild steel products,
protective tariffs can be reduced to 20-30% range without significant effects
on the viability of most of the existing enterprises. Furthermore, theirimports can also be placed under OGL.6/ The information on special steels isless clear, but, except for very inefficient MSPs, about half of the firms cansurvive with much lower tariffs. Given the small amount of labor and capitalin a special steels and their importance in engineering and especially capitalgoods production, exit of the very inefficient producers can be seriouslyconsidered. Furthermore, special rehabilitation packages can be introducedfor the more efficient firms.
44. In non-ferrous metals, the situation is also mixed and the informationis not available on a consistent basis. Aluminum, which has the biggestshare, is now produced at very close to world prices. However, in items suchas copper, domestic prices are significantly higher than the internationalprices. In other products, India is a net large importer and most of thetariffs are purely for revenue purposes.
45. Casting, forging and foundry subsectors have not been analyzed indetail. However, the existing firms in these subsectors will probably havemore serious problems than the mild steel producers. The protective tariffcollection ratio for this subsector is around 80%, and many firms operate withoutdated technologies.
(b) Petrochemical Industry
46. Though relatively small within manufacturing (about 1.5 to 2% ofmanufacturing output and value added), this complex subsector is important fora number of reasons. First, it has been growing very fdst during the pastdecade and is attracting large investments. Second, its products have a wide
6/ In 1989 SAIL proposed to reduce the tariffs to 30 percent and place allmild steel items on OGL. It was rejected by Department of Steel.

- 24 -
variety of applications as intermediates in many other industries.
Petrochemical products can be broadly categorized as follows:
(a) primary Intermediates/aromatics, such as ethylene, propylene,
benzene, toluene, styrene, xylenes, monoethylene glycol (MEG),
acrylonitrile (ACN), PTA, DMT, caprolActam, which in turn are used
to manufacture secondary products;
(b) polyolefins ("plastics") comprising principally low density and
high density polyethylenes (LDPE and HDPE), polypropylene (PP),
polystyrene (PS) and polyvinyl chloride (PVC);
(c) synthetic rubbers, such as styrene butadiene rubber (SBR) and
polybutadiene rubber (PBR); and
(d) synthetic fibers such as nylon, acrylic staple (ASF) and polyester
staple (PSF).
47. Existing structure of production, and ownership are presented in
Table 11:
TABLE 11: PETROCHEMICAL INDUSTRY: STRUCTURE OF PRODUCTION
Product Group Capacity Output Imports Ownership Pattern(OOOT) Public Jt/Prvt
Polyolefins 610 270 290 90? 10oAromatics/a 395 295 n.a. 12Z 88Z
Resins/Rubbers 50 35 25 60? 40?Fibers 18O0b 150 5 -- 100?Detergents 195 n.a. n.a. 152 85Z
/a Including benzene/toluene capacity and output of steel plants.Tb Includes only the major producers, which account for about 85? of
total capacity.
48. Government regulations are pervasive in this subsector. Although the
first two Indian petrochemical plants (naphtha crackers) were set up by the
private sector in 1960s, the industry's strategic plants providing the
critical 'building blocks" (intermediates and aromatic products) is dominated
by the public sector. Currently, large private investments are entering the

- 25 -
industry. The sector is not deregulated and licenses are needed for new
investments. Moreover, the initial policy for the subsector's development was
for import-substitution aimed at serving a small domestic market. As a
result, most existing plants have had capacities markedly below MESs and
consequently uncompetitive production costs.7/ In addition, the Government
has established a complex and ad-hoc system of tariffs, input pricing and
regulations governing most intermediates and semi-finished products (e.g.,
benzene, styrene, xylenes, caprolactam, DMT, PTA, PSF,...). Imports of many
products affecting the sector are subject to QRs, especially canalization.
The canalization agencies adjust import to the demand gaps unmet by domestic
production and supply the local demand for many products at regulated prices
(i.e., weighted averages of import and cost-plus domestic prices). These
regulated prices have a loose and erratic relationship with CIF and landed
(including tariffs) prices.
49. The situation is further complicated by Government charging high prices
for the basic inputs of the industry (60-80% above international prices for
naphtha). Existing petrochemical plants have been based on naphtha but the
new ones are to be based on both naphtha and gas. Debate has been going on
for the last two years on the price of gas to be charged for petrochemical
plants. Recently, agreements have been reached to charge a price close to
international energy equivalent levels.
50. Imports of petrochemical products have been determined primarily by
shortfall in domestic production. These shortfalls have been substantial for
those products where domestic capacity is still insufficient to meet domestic
demand (e.g., polyolefins), and represent now about 23% of domestic output
(51% in value after duties). Petrochemicals are thus one of the few product
groups for which imports constitute a substantial share of the Indian market.
Import regimes range from OGL (e.g., polyolefins, synthetic rubbers, MEG) to
canalized (e.g., naphtha, benzene, p-xylenes), and restricted (e.g., ACN, PA,
DMT). Imports have been effectively banned for products with sufficient or
7/ In order to avoid the recurrence of past investment patterns andcreation of sub-optimal capacities, the Government now imposes minimumefficient scales for new investment. Furthermore, many of thesuboptimal plants have been expanding their capacities to the specifiedMESs.

- 26 -
excessive domestic capacity (e.g., PSF, linear Alkyl benzene (LAB) as of
January 1988). Substantial progress has, however, been made in rationalizing
the import regime for polyolefins (commodity plastics) which have been placed
on OGL and tariffs lowered and made more even.
51. Protective tariffs as a rule are variable and high. After declining in
the 1970s, the tariff and excise collection rates increased markedly from 87%
and 15% in 1978/79 to 117% and 24% in 1987/88 respectively and are now among
the highest. Petrochemical products are considered "luxury" products and
taxed according to Government's revenue needs. Protective tariffs presently
are about 50% for plastics, 65% for styrene, about 85% for synthetic rubbers
and resins and benzene, about 90-100% for xylenes and caprolactam, 150% for
basic building blocks (ethylene, propylene and butadiene) and MEG, and 195%
for PTA and DMT. There are numerous ad-hoc rates as well as exemptions.
Since international prices of petrochemicals are highly volatile, Government
tries to adjust the tariffs to maintain domestic price stability and the level
of protection.8/ However, there are usually lags and delays in these
adjustments. In any case, these adjustments usually affect either some
segments of industry or downstream users.
52. Profitability of petrochemical companies, both in public and private
segments, has tended to vary with international prices: profitability was
relatively low in the early 1980s but has been relatively high in the second
half of the decade. IPCL, the leading public sector firm in petrochemicals
and the dominant one in the sector, has recorded high profit rates (11% of
sales and 16.5% of capital employed in 1987/88); significantly above those of
other public sector firms. The same pattern has prevailed in the private
sector (Table 12). Profitability ratios of private petrochemical firms have
been significantly above industry averages.
8/ For example, p-xylene tariffs were lowered in 1988; plastics tariffswere lowered in 1988 and 1989 and increased again in 1990.

- 27 -
TABLE 12s PETROCHEMICALS: PRIVATE SECTOR PROFITABILITY RATIOS
1982-83 1985-86 1987-88Basic Petrochemicals:Gross Profit to Sales(Z) 6.7 14.7 13.0Return on Capital(Z) 8.8 21.7 20.1
Plastics:Gross Profit to Sales(Z) 11.0 12.9 13.3Return on Capital(Z) 13.9 20.3 22.7
All Industries:Gross Profit to Sales(Z) 10.5 10.5 9.6Return on Capital(Z) 16.7 16.0 13.3
Source: Financial Performance of Private Companies, ICICI.
53. Other sources confirm the high profitability of private petrochemical
firms. For a different sample of 9 large companies in 1988/89, the gross
profit to sales and return on capital ratios were 18% and 22.3% respectively,
yielding a net profit to net worth ratio of 27.3%.
54. Effective Protection granted to the industry by the complex system of
import quota management and price administration has been high, ranging mostly
between 60% and 177%. Table 13 summarizes the available EPR estimates for
petrochemicals. EPRs relating to IPCL are based on actual price data of 1987
(Pursell, 1988). The other EPRs are derived from appraisal reports of DFIs
for their 1988/89 projects.

- 28 -
TABLE 13: PETROCEEHICALS - EFFECTIVE PROTECTION RATES
Product Year Nominal Protection Rate EffectiveProtection
Output Inputs Rate(Z)
IPCL: PS 1987 144 217 64LDPE 1987 102 116 90PBR 1987 66 135 17LAB 1987 67 50 177DMT 1987 227 113 428
Overall 1987 110 41 225
EPDM Rubber 1988 67 47 121ABS 1989 77 73 86Nitrile Rubber 1989 77 82 68Alpha-Olefins 1989 77 111 25MA 1989 61 61 61PA 1989 100 59 101PO/PG/Polyols 1989 83 n.a. 135
Source: Pursel_ (1988), DFIs.
55. Existing firm level data has been reestimated to separate the effect of
higher prices of inputs and capital, and the required level of nominal
protection to compensate for these high prices is termed "compensatory
protection." Table 14 compares the official tariffs with the realized nominal
protection (ratio of domestic to international prices) and the level of
nominal protection required to compensate the firms for the high costs of
investment and inputs (compensatory protection) in India.

- 29 -
TABLE 14: PETROCMDI[CALS - NOMIRAL PROTECTION RATES
RealizedProtective Import Protection Compensatory
Product Tariff Resime (NPR.Z)a ProtectionCl)
Intermediatesp-xylene 115 Canalized 110 42MEG 148 OGL 64 36PTA 208 Restricted 75 31DMT 210 Restricted 75 24ACN 110 Restricted 70 28Caprolactam 72 Canalized 68 16ABS/b 145 Canalized 77 55Alpha-OlefinsXb 95 OGL 77 82MALb 115 OGL 81 47PA/b 115 Canalized 110 32
PolyolefinsLDPE/LLDPE 57 OGL 14 43HDPE 65 OGL 10 48PP 50 OGL 20 32PS 50 OGL 28 31PVC 40 OGL 11 15
Synthetic RubberPBR 100 OGL 66 19Buta Rubber /b 85 Canalized 77 68EPM Rubber /b 85 Canalized 67 44
Synthetic FibersASF 180 n.a. 137 24PSF 213 Restricted 192 32
La These price ratios, valid for one point of time (generally in 1988), areonly indicative, given the volatility of domestic and internationalprices in recent years.
/b Projected parameters for DFI subprojects.
56. The domestic prices given by realized protection are generally lower
than the landed prices (CIF plus protective tariffs) and in turn higher than
the protection required to compensate for the extra costs of capital and
inputs (compensatory protection). Tariffs contain substantial amounts of
Nwaterw introduced largely for the purpose of generating public revenue from

- 30 -
the imports. Despite this, domestic prices, resulting from the regulatory andpricing framework, have permitted local firms to earn high profit margins.The cost of high protection has been passed on to the downstream industries,especially to the synthetic textiles industry.
57. Conclusions. In 1988, BICP, at the request of Government prepared areport on aromatics subsector giving its recow-mendatfons on future tariff andimport policy (BICP 19__). The BICP recommendations on the basic buildingblocks of petrochemicals are:
* The existing canalization of naphtha and fuel oil imports shouldcontinue but the domestic price should be aligned to CIF pricesplus a 25% import duty.
Depending on the long-term price of naphtha, tariffs on benzeneand toluene should be changed from 0 and 85% respectively to arange of 40% to 55%. These commodities should be moved from thecanalized to OGL-stock and sale list.
P-xylene and o-xylene tariffs should be reduced from 120% and 125%respectively to a range of 55% to 70%. They should be shiftedfrom OGL-actual user to OGL-stock and sale list.
58. The proposed tariff revisions for these basic intermediates should bepart of a tariff and policy reform for the downstream products (e.g., DMT/PTA,caprolactam, PSF, PFY, NFY,...) to ensure that the resulting reduction inprices of aromatics are reflected in a corresponding decline in the prices ofthese downstream products.
59. According to the estimates, the existing polyolefin plants are totallynaphtha based and their capital costs are almost fully depreciated. There isa very large investment program being undertaken for the basic petrochemicalindustry based on naphtha and natural gas. Even with naphtha prices at 60-80% higher than CIF prices, the bulk of the existing industry can coexist withaverage protective tartffs of about 40%. Replacing the high naphtha price

- 31 -
differential by an equivalent excise tax and including it within the MODVAT
scheme would allow the Government to reduce the protective tariffs even
further. For new gas based plants, if the natural gas prices are set at
international energy equivalent levels, even with high capital costs, the
amount of protective tariff required is about 30%.9/ If capital costs are
also reduced, the protective tariffs could be reduced even further.
60. In other chemical based industries, the situation is not so clear. In
inorganic chemicals, the existing average protective tariff collection rate is
quite low (about 32%) and for many acids, there are significant natural
protection due to high transportation costs. However, the low tariff
collection rate in this subsector is due to low tariffs on phosphoric acid and
ammonia which are inputs into fertilizer production. The average protective
tariff collection rate for other inorganic chemicals is about 100%. The
fertilizer subsector operates with very low tariffs but the retention price
system for each enterprise and the canalization system effectively subsidize
the inefficient producers.
(c) Capital Goods Industries
61. This cluster of subsectors producing machinery and equipment (bothelectrical and non-electrical), excluding consumer goods and durables (motor
vehicles, electrical appliances, and electronic goods), have traditionally
fulfilled a central role in India's development planning and policies. Indianplanners, who had initially identified this set of subsectors to be strategicin their quest for economic self-sufficiency, have promoted their development,notably through the creation of new public enterprises (PEs) and the take-over of failing private engineering firms.
16/ At this level, the firms (IPCL) still have a profit rate 60% higher thanthe manufacturing sector average.

- 32 -
62. Capital goods industries are defined herein to comprise the followingthree groups of subsectors:
Non-Electrical Machinery Electrical Machinery
- Agriculture Machines - Electrical Industrial Machinery- Food/Textile Machinery - Electrical Cables/Wires- Other Industrial Machinery - TeleCommunications Equipment- Machine-Tools - Other Electrical Machinery- Other Non-Electrical Machinery
Transport Equipment
- Ship Building- Rail Equipment
These subsectors, representing 10% to 13% of manufacturing output and valueadded, constitute the largest group of industries in India.
63. Structure. The production structure of the capital goods industry ispresented in Table 15:
TABLE 15s CAPITAL GOODS: STRUCTURE OF INDUSTRY
PublicStructure (2) Growth (Z p.a.) Sector
1980181 1987188 1981-1984 1985-1988 Share(X) /a
Non-Electric Machinery 46 48 6.3 5.9 19Electrical Machinery 39 43 10.4 23.9 59Transport Equipment 15 9 7.1 6.9 36TOTAL 100 100 8.0 13.1 37
as 2 of Manufac- 12.5 10.6 5.7 9.0turing Sector
/a In 1984/85.
Growth of the capital goods industry accelerated in the late 1980s faster thanthat of the overall manufacturing due primarily to rapid growth in theelectrical machinery sector, especially electronics (computers, telecom-munications equipment). Growth decelerated in the more traditional sectors ofnon-electrical machinery and transport equipment.
64. Role of Public Sector. About 40 central government public enterprises(CPEs) have been operating in capital goods industries, where they have played

- 33 -
a preeminent role (particularly in electrical machinery). Most CPEs have been
in competition with their private counterparts, except in a few capital-
intensive products (power generators and turbines, shipbuilding, large
telephone exchanges).
65. CPEs have been markedly different from the private firms in following
respects:
(a) CPEs absorb a large share of the sector's investments (10-12%
above their output share), due to their higher capital intensity;
(b) labor productivity is higher in CPEs, however, both wages and
labor cost per unit of output is also higher; and
(c) CPEs have been reputed for poor management of their inventories.
This, combined with their higher labor costs, has eroded the CPEs'
profitability well below that of private firms.
66. CPEs can be divided into two groups. First is the CPEs that were set up
by the Government. Second is the sick private firms that have been taken over
by the Government. Some 20 CPEs (half of which are "taken over" firms) have
been incurring cash losses (before depreciation), which are met by Government
advances and subsidies. There has been no cash-losing CPE in the electrical
machinery subsector. The cash-losing CPEs represented about 20% of CPEs
output, and the Government subsidies and advances represented between 20 and
25% of the output of cash-losing CPEs. The profitability of public and
private firms is presented in Table 16:
TABLE 16: PROFIT RATE IN CAPITAL GOODS INDUSTRIES In 1984185(I Of Output)
Non-Electrical Electrical Transport TotalMachinery Machinery EZuiDment Cagital Goods
CPEs -0.1 8.1 -4.1 -3.2Taken-Over Firms -2.7 2.9 -12.7 -7.7Others (Private) 7.9 19.6 -0.7 10.4Overall 6.4 12.7 -1.9 6.4

- 34 -
Profitability Trends
67. Despite the low profitability of the CPEs, capital goods industries as a
whole have had higher profitability than the manufacturing sector as a whole.
The profitability ratios for capital goods industries are presented in
Table 17.
TABLE 17: INDEX OF RELATIVE PROFITABILITY OF CAPITAL GOODS INDUSTRIES /a
1980/81 1982/83 1984/85 1985/86 1987/88
RBI Survey: Gross Profit to Net Assets n.a. 1.31 1.08 0.88 1.30Net Profit to Net Worth n.a. 1.36 1.04 0.97 1.61
CMIE Survey: (Private Sector):- All Capital Goods:Profit to Sales 1.59 1.56 0.94 0.92 1.27Net Profit to Net Worth 1.76 1.65 0.63 0.71 1.19
-Electrical Machinery:Profit to Sales 1.66 1.26 0.80 0.61 1.20
La Ratio of capital goods industries profit rate to average profit rate in othermanufacturing industries.
68. The decline in relative profitability in 1984/85 and 1985/86 was due to
a drastic reduction in machinery tariffs to 45% and 55% respectively. These
tariffs were increased to 90% in 1987/88. However, even with these drastic
tariff reductions, the profitability of capital goods only declined to about
the manufacturing industry average. Since then, further real devaluation and
tariff increases have increased the profitability of domestic capital goods
producers above the overall manufacturing industry average.
69. Protection and Trade. QRs on capital goods appear to have been
significantly liberalized during the 1980s. More than 1,000 items have been
put on the OGL list. However, the industry is still highly protected. First,
most of these OGL items represent products not manufactured locally, and OGL
imports represented only about 30% of total capital goods imports in 1987/88.
Second, most imports of capital goods continue to require the clearance of the
Capital Goods Committee. Third, the increasingly high tariffs levied on
imported capital goods (official tariffs in 1987/88 averaged 90%, and actual
collection rates averaged 62.5%) have successfully substituted for the

- 35 -
reduction in QRs in ensuring that domestic production would supply anincreasing share of total demand for capital goods. Table 18 presents thegeneral trends in foreign trade for capital goods.
TABLE 18: TRENDS IN FOREIGN TRADE OF CAPITAL GOODS (X)
1973174 1978179 1980/81 1984185 1986/87 1987/88
CIF Imports as --- --- 14.4 13.3 18.6 16.6X GFCF in Hachinery
Duties as X Imports 37.4 49.4 49.1 75.2 59.8 65.4Imports as Z Output 35.9 17.1 17.4 20.5 -- 24.9Exports as Z Output 5.9 6.2 4.4 3.8 --- 2.8Excise as Z Output 1.5 3.2 --- --- --- 7.4Distribution of Imports by Regime:
- OGL 27.0- Limited Permissible 21.0- Restricted 52.0
70. Table 19 shows the trends in foreign trade for disaggregated componentsof capital goods. The table shows that the structure of trade in 1978/79indicated the beginning of specialization along the lines of comparativeadvantage and technological achievement. For example, import and exportshares were respectively 43% and 13% for machine tools and 82% and 15% forgeneral electrical machinery. In these two groups, India was importing whatit could not produce adequately, and was exporting products where it had acomparative advantage. In most countries with developed capital goodsindustries, shares of both imports and exports are very large. India in1978/79 was closer to these countries. However, this tentative and partialspecialization disappeared during the 1980s as the result of policies forincreased self-sufficiency which lowered not only imports but also exports.

- 36 -
TABLE 19: PATTERII OF EXTERNAL TRADE FOR CAPITAL GOODS(as X of Dmomtic Output)
1978179 1980/81 1984185 1987188Import EZDort Imaort Ezvort Imvort ExPort ImDort Export
Non-Electrical Machin. 27.5 6.2 30.3 5.9 34.2 5.6 22.3 3.9Machine-Tools 43.2 13.3 35.8 8.4 28.2 4.0 17.5 5.8
Electrical Machinery 9.4 6.3 4.5 2.1 6.9 1.8 7.1 1.2General Machinery 81.7 14.8 44.4 0 25.6 0 31.1 5.5
Transport Equipment 3.7 1.6 8.6 2.8 6.5 1.0 12.8 1.2
TOTAL Capital Goods 17.1 5.4 17.4 4.0 20.5 3.6 14.9/a 2.5
/a Excluding Project Importp. If included, this ratio would increase to 24.92.
In conclusion, India increased its self-reliance in capital goods by
increasing its protection, but it lost the advantages of specialization and
most of its export potential.
71. Nominal and Effective Protection. Price comparisons (NPRs) for capital
goods and machinery indicate that the tariff levels exceed what would be
required to provide protection to the domestic industry.17/ Tables 20 and 21
show the nominal protection rates for a sample of 60 capital goods.
TABLE 20s NOMINAL PROTECTION RATES (NPRs) FOR CAPITAL GOODS/a
Product Group X Sample Overall 1989 1987Non-Electrical Machinery 54 180 197 172Machine-Tools 24 157Electrical Industrial Machinery 14 135Electrical Cables/Wires 3 120Small Telecommanications Equip 5 121Overall (1t60 NPRs) 100 163
/a Plain averages.
17/ The samples are biased towards non-electrical machinery.

- 37 -
These tables also show the wide variation in nominal and effective protection
rates. The range and medians of nominal protection for output and inputs and
of effective protection are given below. The median NPR for output is 40%,
and the median NPR for inputs is 70%. Effective protection ranges from -20%
to 585%, with the median at about 30%.
TABIE 21s RANGE AND MEDIAN FOR NOMINAL AND EPPECTIVE PROTECTION(NPRs and EPRs, in Z)
Range Median
Nominal Protectiont Output 13 to 317 40Input 25 to 226 70
Effective Protection -20 to 585 30
The distribution of output nominal protection is largely bimodal, with its
peak in the 30-50% range. By contrast, the distribution of effective
protection rates is unimodal, with a first peak in the [-10,+10%] range and a
second peak in the [30,50%] range. This suggests the presence of at least two
different groups of capital goods industries, a first group receiving low or
negative protection and a second group receiving effective protection similar
to other manufacturing subsectors.
72. Within each product-group, variations in nominal and effective
protection can be wide as well. In the machine-tools subsector, for example,
there are two district groups. Standard lathes and machine-tools have output
price ratios (NPRs) ranging typically between 1.15 and 1.50, with the median
at 1.30. High-technology products, such as CNC machine-tools and NC machining
centers, have domestic prices which are 100% or more above international
prices (NPR above 2.0).
73. There appears also to be some positive correlation between the level of
technological complexity and the degree of inefficiency as measured by the
Effective Protection rates (EPR), at least for those product-groups where
transfers of technology and foreign collaborations for technology up-dating
have been low. When moving from steel structures (simple technology) to
platework structures (pressure vessels, exchangers) and to mining equipment,

- 38 -
the EPR ranges increase by 30-40 percentage points. On the other hand, EPRs
appear to decline when moving to product-groups requiring higher levels oftechnology such as machine-tools and heavy electrical power machinery. These
latter two subsectors have been among those which Government policies have
allowed to maintain an open access to foreign technologies and collaborations
for continuous modernization and technology updating.
TABLE 22: RANGE OF EFFECTIVE PROTECTION. BY TECMNOLOGICAL LEVEL
Product-GrouD Range of EPR (S)
Platework -10 to +77Mining Equipment +33 to +135Machine-Tools -20 to +83Electrical Machinery 0 to +32
A few products with low EPRs, such as steel structures or standard machine-
tools of stable technology, are produced at competitive prices (output NPRs
range between 1 and 1.10), and are exported whenever inputs are supplied at
world prices.
74. Firm Efficiency and Effective Support Rates. A significant share of the
products analyzed above are produced by CPEs from the non-electrical machinery
subsector. Some of these CPEs have in fact incurred chronic cash losses
(before depreciation) covered by Government advances and subsidies, which have
permitted them to sell at market prices (dictated by the competitive domestic
market) which are below their short-term marginal costs (STMCs). For this
reason, effective protection rates do not provide a representative measure of
their operating efficiency.18/ A more adequate measure of efficiency is
provided by effective support rates (ESRs), which add to the value added
permitted by the trade regime the amount of subsidies supporting the
18/ Another reason why EPRs would not adequately measure the operatingefficiency would be the presence of high profit margins reflectingmonopoly rents or other privileged positions. None of the analyzedenterprises has such profit margins.

- 39 -
production of the capital goods.19/ Consequently, the data above have been
adjusted to reflect more adequately the efficiency of the firms operating
under the common incentive framework of the capital goods sector. EPRs of
cash-loss CPEs were converted into ESRs by incorporating an estimated cash-loss subsidy.20/
75. The results are summarized by the distributions of ESRs in Figure 1.
The median effective rate of support is about 40%. Again, the distribution of
ESRs is bimodal, with a first peak in the -10, +10% range and another peak in
the 30-50% range. However, part of the distribution has shifted to the right
towards higher ESRs.
19/ By definition, ESR = (value added in domestic prices plus subsidies)/valueadded in international prices minus 1. Given that some CPES of the samplehave been incurring chronic losses and that the policy of the Governmenthas been to keep CPEs operating despite their losses, the subsidies havede facto represented additional incentive. Adding cash-loss subsidiesto output value and to value added at domestic prices permits to computenominal support rates (NSRs) and ESRs based on short-term marginalcosts. A more correct methodology would be to estimate ESRs based onlong-term marginal costs by adding to cash-loss subsidies theopportunity costs of the capital employed.
20/ Ideally, the ESR should incorporate a cash-loss subsidy specific to eachproduct. Such product-specific subsidies are not available. Assumingthat selected products are representative of the enterprises' product-mix and operating efficiency, the average cash-loss to output ratio forthe whole enterprises was taken as a first proxy.

- 40 -
FIG. .1
CAPITAL GOODS0.28 Distribution of NPRs, EPRs, ESCs0.26 0.24-0.22-0.2 0.18a0.16 0.14-
S0.12-
0.1 0.08-0.050.040.02
Below-10-10to+10 10to30 30toM0 5to70 70to9O Above 90Legend
ENPC (Nuial Protectlon Pate) *EPC (Effective Protection Iate) 0 ESC (Effective Stwort Rate)
76. Structure of Production Costs, by Enterprise Groups The analyses madeabove indicate that the capital goods sector, or at least its largestsubsector of non-electrical machinery, comprises three broad groups ofenterprises:
(a) enterprises receiving incentives for operating along international
standards of practice, with EPRs in the [-10O, +10%] range;
(b) more protected enterprises, enjoying EPRs in the [30%, 50%] range;
and
(c) CPEs requiring cash subsidies for survival and operating with high
effective support rates.
The basic characteristics of the three groups of enterprises, as sumnarized in
Tables 23 and 24, indicate that each of these groups is fairly homogeneous
(particularly the first two groups) and has its own distinct parameters.

- 41 -
TABIZ 233 BASIC PARAMETERS OF CAPITAL GOODS ENTPRISES
NPC Support Coefficients VA/Output (I)Inout Output EPC Nominal Effective Int. Prices Dom. Prices
t Groups Average 1.69 1.31 1.01 n.a. 56 43Median 1.65 1.33 1.02 n.a. 55 42
2nd Group Average 1.79 1.58 1.40 n.a. 55 58Median 1.76 1.56 1.42 n.a. 56 51
d Group Average 1.77 1.56 1.61 1.89 2.43 46 41Median 1.76 1.47 1.22 1.72 1.62 40 39
TABLE 248 STRUCTURE OF VALUE ADDED IN CAPITAL GOODS ENTERPRISES(in Z of Output Value in Domestic Prices)
Enterprise GroupsComponents First Second Thirdla
Labor 15.0 20.0 29.0Depreciation 5.0 4.0 4.0Interest 6.5 8.5 13.5
/a Average structure for cash-losing CPEs in Capital Goods.
77. The combination of these various sets of parameters leads to thefollowing three basic enterprise models which represent reasonably well thethree groups identified earlier.

- 42 -
TABLE 25: PRODUCTION COST STRUCTURES OF CAPITAL GOODS ENTERPRISES(in X of Output in World Prices)
let Group/a 2nd Group/a 3rd Group/aEnterprise I.P. D.P. NPC/EPC I.P. D.P. NPC/EPC I.P. D.P. NPC/EPC
Output 100 131 1.31 10J 157 1.57 100 150 1.50Inputs: Materials 35 63 1.80 33 64 1.95 48.5 85 1.75
Services 10 13 1.30 45 16 1.30 11.5 15 1.30Total Inputs 45 76 1.70 45 80 1.78 60 100 1.75
Value Added 55 55.0 1.00 55 77.0 1.40 40 50.0 1.25Labor 19.5 31.5 43.5Interest 8.5 13.5 20.5Depreciation 6.5 6.5 6.0Pre-Tax Profit 20.5 25.5 -20.0(Cash-Flow Subsidy) N.A. N.A. (14.0)
/a NPCs for inputs and outputs and EPCs for value added.Notes: I.P.: in International Prices, D.P.: in Domestic Prices.
Table 25 shows the stylized cost structures of the three groups of enter-
prises in both domestic and international prices. The major difference
between the first group of efficient firms and the other two groups is in
labor and interest costs. Labor cost difference is partially caused by
inefficient technologies and partially (especially in CPEs) by overstaffing.
Higher interest costs, especially in the third group, reflect the accumulated
losses of these enterprises.
78. Impact of Trade Reform on Profitability of Capital Goods Industries.
The liberalization of capital goods imports and the progressive dismantling of
the uneven tariff structure will have different impacts on the viability and
profitability of the sector's enterprises, depending on the type of
enterprises and their present level of efficiency. The impact of trade
liberalization is dictated primarily by: (a) the level of effective
protection/support enjoyed by the enterprise, and (b) the breakdown of the
enterprise's value added between different cost components (labor, interest,
depreciation) and gross profit.
79. Assuming a general trade reform, i.e., removal of QRs and progressive
reduction of tariffs to free-trade over five periods (which could be five
years), the nominal protection for capital goods and the resulting output

- 43 -
price ratios which the three enterprise groups would have to compete with, aregiven in Table 26.21/
TABLE 26t EVOLUTION OF CAPITAL GOODS RELATIVE PRICES UNDER FREE-TRADE REGIME
Present Year 1 Year 2 Year 3 Year 4 Year 5Average Actual Tariff (Z) 75 50 37.5 25 12.5 0Relative Output Prices:1st Group 1.31 1.31 1.25 1.25 1.125 1.002nd Group 1.57 1.50 1.375 1.25 1.125 1.003rd Group 1.50 1.50 1.375 1.25 1.125 1.00
It is assumed that: (i) the average tariffs actually collected on importedcapital goods would be unified and, after an initial reduction of 25percentage points in the first year, reduced over 5 years to zero: and11) that the present conditions of local competition would continue toprevail, thus keeping current prices at their present levels until the loweredtariffs start "biting" and force enterprises to adjust prices downwards tointernational levels. It is also assumed that protective tariffs on materialsand other physical inputs would, under the general tariff reform, be graduallyreduced to zero, and reduction on input costs would begin in the first year ofreform program. Table 27 presents the likely outcomes of the reform program,on the three groups of enterprises, without any enterprise structuring orefficiency improvements.
21/ The sequencing presented here is purely illustrative. It is possible todesign alternative phasing options.

- 44 -
TABLE 273 TRADE REFORM SCENARIO FOR THREE GROWUPS OF CAPITAL GOODS PRODUCTS(in Z of World Output Prices)
Present Year 1 Year 2 Year 3 Year 4 Year 5GROUP 1
Output 131 131 131 125 112.5 100Inputs: Materials 63 57.5 52 46.5 41 35
Services 13 13 13 13 13 13Total 76 70.5 65 59.5 54 48
Value Added 55 60.5 66 65.5 58.5 52Labor 19.5 ----------------Unchanged---------------Interest 8.5 ----------------Unchanged--Depreciation 6.5 ----------------Unchanged---------------Pre-Tax Profit 20.5 26.0 31.5 31.0 24.0 17.5(as X of Output' 15.6 19.8 24.0 24.8 21.3 17.5
GROUP 2
Output 157 150 137.5 125 112.5 100Inputss Materials 64 58 52 46 40 33
Services 16 16 16 16 16 16Total 80 74 68 62 56 49
Value Added 77 76 69.5 63 56.5 51Labor 31.5 ----------------Unchanged---------------Interest 13.5 ----- Unchanged---------------Depreciation 6.5 ----------------Unchanged---------------Pre-Tax Profit 25.5 24.5 18.0 11.5 5.0 -0.5(as I of Output) 16.2 16.3 13.1 9.2 4.4 -0.5
GROUP 3
Output 150 150 137.5 125 112.5 100Inputst Materials 85 77.5 70 62.5 55 48.5
Services 15 15 15 15 15 15Total 100 92.5 85 77.5 70 63.5
Value Added 50 57.5 52.5 47.5 42.5 36.5Labor 43.5 -- - Unchanged---------------Interest 20.5 ----------------Unchanged---------------Depreciation 6 ----- -Unchanged---------------Pre-Tax Profit -20.0 -12.5 -17.5 -22.5 -27.5 -33.5
Memo Item: Cash-Flow Subsidy (14.0) (6.5) (11.5) (16.5) (21.5) (27.5)
80. Due to the one-two year time lag between the binding impact of the
respective tariff reductions on output and inputs, the profitability of
*unprotected* firms (Ist Group) increases during the first three years before
reaching a level that is higher than they currently enjoy/. Similarly, the

- 45 -
cash-losing enterprises (3rd Group) see a temporary decrease in their lossesduring the first two years before their losses and the corresponding subsidiesincrease markedly; they should use this two-year respite for restructuring
purposes. The second group of enterprises has its high profitability eaten up
as of the first year by the lowering of its output protection, down to a
slightly negative profitability. The following table summarizes the results
of Table 27.
TABLE 28s PROFITABILITY OF CAPITAL GOODS ENTERPRISES UNDER TRADE REFORM(Pre-Tax Profit to Output Value, In 2)
Present Year 1 Year 2 Year 3 Year 4 Year 5
1st Group 15.6 19.8 24.0 24.8 21.3 17.52nd Group 16.2 16.3 13.1 9.2 4.4 -0.53rd Group -13.3 -8.3 -12.7 -18.0 -24.4 -33.5(Cash Subsidy) (9.3) (4.3) (8.4) (13.2) (19.1) (27.5)
81. Restructurina Scenarios for Maintained Production22/ The existingenterprises of the 2nd and 3rd groups would have to undertake restructuring
measures, focused primarily on their labor costs and on and interest charges,
if they are to restore their profitability rates (2nd group) or at leastoperate without Government cash subsidies (3rd group). Achieving a profitrate of 17.5% in the 2nd group, (the profitability level of the 1st group)
would require cutting down primarily on labor costs. In order to alleviate
somewhat the socially painful labor adjustment, interest charges could also be
reduced to a level similar to that in the 1st group enterprises. The
resulting production cost structure would evolve as follows:
22/ The following paragraphs are considering restructuring scenarios inthose cases where separate enterprise-specific diagnoses have concludedabout the economic undesirability to expand or diversify the productioncapacity of the enterprise under review. In many cases, however, thediagnosis would be to expand some of the existing production linesand/or open new ones, with additional investments to be carefullyidentified and assessed by enterprise restructuring programs. Such casesof expanded/diversified production fall outside the purpose of thisnote, which addresses essentially the case of enterprises which are in aposition to consider only two options: (a) How to keep their existingproduction lines operating profitably under the new protectionframework, without substantial new investments; (b) or close down.

- 46 -
TABLE 29s RESTRUCTURING SCENARIO FOR EtISTING XNTRRPRISES OF THE 2ND GROUP(in Z of World Output Price)
Present Year 1 Year 2 Year S Year 4 Year 5Value Added 77 76 69.5 63 56.5 51Labor 31.5 31.5 28.7 24.9 21.0 19.5Depreciation 6.5 -----------------Unchanged---------------Interest 13.5 13.5 11.5 10.5 9.5 8.5Pre-Tax Profit 25.5 24.5 22.8 21.1 19.5 17.5(asZ Output Value) 16.2 16.3 16.6 16.9 17.2 17.5
Interest charges need be reduced by about one-third, and labor costs wouldhave to be cut by more than one-third (about 38% of their present level). Theadjustment costs for these enterprises would be substantial, but manageable.
82. The cash-losing CPEs constitute a more difficult case for restructuring.Firstly, an in-depth and targeted approach should be taken, whereby acomprehensive diagnosis of each enterprise/plant situation and potential23/should be carried out and lead to enterprise-specific restructuring plansconsidering three alternative decisions:
(a) invest for long-term rehabilitation and/or capacity expansion;
(b) keep open and operate in the short-run with working capital; or
(c) disinvest/close unproductive assets through simplified bankruptcy andexit procedures.
Those units assessed to remain potentially uneconomic should exit. Restruc-turing plans for the other units would be developed, which would involvestrategic decisions on trimming unprofitable product lines, physical andfinancial restructuring, labor shedding and improved management.
23/ The diagnosis and restructuring plans should assess over the short andmedium-term each enterprise's situation and prospect regarding markets,competitiveness, product-mix, organizational and corporate structure,labor force, investments, financial structure, and financial andeconomic viability.

- 47 -
83. The minimal objective of achieving a zero ofit in those units to bekept open for continuing operation (without major new investments) would
require:
(i) financial restructuring at the outset with a view to reduce
financial charges to a level close to that in other enterprises,
primarily through partial write-off of the debt owned to the
Government; and
(1t) substantial reduction of labor costs through early retirement
schemes and other means of shedding excess labor.
The restructuring scenario could be as follows:
TABLE 30s RESTRUCTURING SCENARIO FOR CASH-LOSING ENTERPRISES (3rd GROUP)(as X of World Output Price)
Present Year 1 Year 2 Year 3 Year 4 Year 5Value Added 50 57.5 52.5 47.5 42.5 36.5Depreciation 6 ---- Unchanged----------------Interest 20.5 15.5 14.0 12.5 11.0 9.5Labor 43.5 39.0 34.5 30.0 25.5 21.0Pre-Tax Profit -20.0 -3.0 -2.0 -1.0 0 0Cash Subsidy 14.0 -- -- -- Cash-Flow -14.0 3.0 4.0 5.0 6.0 6.0
Interest charges would be reduced initially by one-fourth (through a first
debt write-off) and subsequently by another one-third. Labor costs would haveto be reduced by more than half to about 48% of their present level. The
restructuring programs would have to balance and arbitrate between debt write-off and labor shedding: the more debt written-off, the less labor shedding
required.
84. These results clearly indicate that significant restructuring isnecessary to achieve a competitive and efficient capital goods industry. Thescenarios developed here have focused primarily on the negative effects oftrade reform and on enterprises that are likely to be negatively affected. Itis equally likely that most of the efficient enterprises would expand their
markets, both internal and external. Furthermore, domestic demand for capital
goods would expand with the decrease in its relative price. Real devaluations

- 48 -
that are likely to accompany the proposed reforms would also minimize some of
the adjustment costs. Therefore, the net effects are likely to be less
negative than outlined above.
E. CONCLUSIONS
85. The policy of high taxes and tariffs on capital goods and key
intermediates have escalated the costs of production in India across a wide
spectrum of industries. At the same time, this structure of protection has
led to much lower net average protection to the industrial sector as a whole.
However, it has created tremendous unplanned variance in net EPRs where half
the industry receives highly positive while the other half receives highly
negative net EPRs. The policy of keeping landed price of imports (especially
for intermediates) higher than domestic prices also has induced domestic firms
to enter these areas irrespective of considerations of comparative advantage
and international competitiveness. These uneconomic investments in turn
generate further tariff escalation5 and higher costs of production for all
downstream Industries. On the other hand, the deregulation of industry
through excess entry and creation of supply surpluses has tended to lower the
EPRs. The deregulation seems to have greater impact primarily on some
consumer and capital goods. However, in intermediates and other capital
goods, domestic competition does not seem to have achieved the same
results.24/ First, India is still a large net importer of these products and
will be so for some time to come. Second, rapid growth in manufacturing (due
to deregulation and excessive domestic demand) have led to growing imports
despite rapid growth of domestic supply of intermediates. Third, these
sectors are highly capital intensive which makes entry more difficult and many
of these products are licenced tightly and/or reserved for public sector.
What is needed in these sectors is more import competition and across the
board tariff and tax reductions; which would lower the costs of production for
all downstream industries.
24/ Recent productivity growth studies have corroborated this observation.According to these estimates, total factor productivity (TFP) growth hasincreased dramatically during the 1980s. However, the TFP growth hasbeen lowest for intermediates; 1.4X p.a. for intermediate goods versusabout 6X p.a. for consumer goods and 3.4X for capital goods (Ahluwalia,1991).

- 49 -
86. Import substitution in intermediates has been complicated by the
response of Government to international price fluctuations. By the nature of
world markets, international prices of intermediates such as steel orchemicals, are highly cyclical. In the name of price stability, the Indian
Government adjusts tariffs and QRs to maintain the high protection in the
economy. When international prices rise, the tariffs are sometimes maintained
for revenue purposes; leading to the ratcheting up of tariffs. On the other
hand, when world prices decline, tariffs are raised. This leaves theexporters (which are mostly downstream industries) with much higher costs than
their foreign competitors that have access to cheaper raw materials.21/ Thisis what happened to engineering industries in the early 1980s when world steel
prices collapsed. More recently, decline in international aluminum prices
have led to a similar adjustment where aluminum was moved from OGL to theRestricted list; leading exporters of aluminum products to ask for IPRS
benefits. A similar danger awaits users of petrochemical products if theexisting high world prices decline. It is very important that domestic
producers of key intermediates be induced to adjust to international price
fluctuations to maintain the competitiveness of the rest of the economy.
87. It also appears literally impossible to bring Indian prices closer to
world levels without substantially lowering the costs of investment. Most of
Indian industries are in need of modernization and would need significant
investments to expand exports and meet growing domestic demand. Investments
made with existing high capital costs will permanently handicap these
industries relative to their competitors.
88. Given the magnitude and variance of effective protection rates it is
clear that anything short of low and uniform tariffs and complete elimination
of QRs would not bring transparency to the incentive regime faced by the
industrial sector. The evidence suggests that there is ample scope for
significant reductions in tariffs and QRs and most industries can coexist with
much less protection than currently given. The elimination of all surcharges
on inputs (tariffs on imported inputs, price differentials on local ones, non-
deductible excise taxes) indicates that, even without correcting for the
21/ In theory, export compensation systems should automatically adjust forprice differentials, but this rarely happens in practice.

- 50 -
effects of high investment costs, most projects (including the import-
substitution ones) would earn from the current international prices a positiveprofit margin on their marginal as well as full production costs. The propor-tion of projects with such a positive profit margin would triple from 20% to63%. Among the import-substituting projects which have no prospects norpotential for export under the present trade regime, this proportion wo:'ldincrease dramatically from 0 to 50% if they could procure their inputs atinternational prices (Ettori, 1990).
89. The lower tariffs would fulfill more effectively their primary purposeof providing protection and incentive signals, and disregard their secondaryfunction of public revenue generation which in India has become predominantand introduced pervasive distortions in prices and incentives. The functionof public revenue generation, which is currently another critical issue inIndia, should be fulfilled by other more efficient and protection-neutral
instruments, in particular direct taxation (income tax) and non-tariffindirect taxation (neutral excise taxes, MODVAT, and preferably the
consumption VAT).

REFERENCES
Ahluwalia, I.J. (1991). Productivity Trends in Indian Manufacturing,Forthcoming, New Delhi.
Aksoy, M.A. and Tang H. (1991). NImports, Exports and Industrial Performance inIndia:. 1970-88," World Bank, Processed (April).
Ettori, F.M. (1990). "The Pervasive Effects of High Taxation of Capital Goods inIndia," PRE Working Paper 433, World Bank.
Hansen, J.R. et. al. (1989). India: An Industrializing Economy in Transition.Washington, D.C.: The World Bank.
Joseph, K.J. (August 19,1989). "Growth Performance of Indian Electronics underLiberalization," Economic and Political Weekly.
Mitra and Go (1992). "Trade Liberalization, Fiscal Adjustment and Exchange RatePolicy: A Methodological Illustration using Indian Data," The World Bank,Forthcoming.
Pursell, G. (1988). Trade Policies and Protection in India, World Bank, Draft,August, Washi ngton, D.C.

Policy Research Working Paper Series
ContactTitle Author Date for paper
WPS963 Growth and WeHfare Losses from Charles R. Blitzer August 1992 WDR OfficeCarbon Emissions Restrictions: R. S. Eckaus 31393A General Equilibrium Analysis Supriya Lahirifor Egypt Alexander Meeraus
WPS964 Toxic Releases by Manufacturing: Robert E. B. Lucas August 1992 WDR OfficeWorld Patterns and Trade Policies 31393
WPS965 Coping with the Disappointing Rates William Ascher August 1992 WDR Officeof Return on Development Projects 31393That Affect the Environment
WPS966 Trade and the Environment: A Survey Judith M. Dean August 1992 WDR Officeof the Literature 31393
WPS967 Transition Problems in Economic Santiago Levy August 1992 M. StroudeReform: Agriculture in the Mexico- Sweder van Wijnbergen 38831U.S. Free Trade Agreement
WPS968 Biomass David 0. Hall August 1992 WDR Office31393
WPS969 Imports, Exports, and Industrial M. Ataman Aksoy August 1992 M. ShorePerformance in India, 1970-88 Helena Tang 31129
WPS970 Political Models of Macroeconomic Alberto Alesina August 1992 E. KhinePolicy and Fiscal Reform 39361
WPS971 The Effects of Democratic Milan Vodopivec August 1992 CECTMDetermination of Wages: Theory and 37188Evidence from Self-Managed Firms
WPS972 Commercial Energy Efficiency and Robin W. Bates September 1992 WDR Officethe Environment Edwin A. Moore 31393
WPS973 How Changes in the Former CMEA Refik Erzan September 1992 G. llogonArea May Affect International Christopher Holmes 33732Trade in Manufactures
WPS974 How Minilateral Trading Arrangements C. A. Primo Braga September 1992 J. JacobsonMay Affect the Post-Uruguay Round Alexander Yeats 33710World
WPS975 Techniques for Improving Client George B. Simmons September 1992 0. NadoraRelations in Family Planning Sara Koerber 31091Programs Ruth Simmons
WPS976 Strategic Management of Family Cynthia P. Green September 1992 0. NadoraPlanning Programs 31091

Policy Research Working Paper Series
ContactTitle Author Date for paper
WPS977 Income Security for Old Age: Estelle James September 1992 D. EvansConceptual Background and Major 37489
WPS978 How Restricting Carbon Dioxide Charles R. Blitzer September 1992 WDR Officeand Methane Emissions Would Affect R. S. Eckaus 31393the Indian Economy Supriya Lahiri
Alexander Meeraus
WPS979 Economic Growth and the Dennis Anderson September 1992 WDR OfficeEnvironment 31393
WPS980 The Environment: A New Piritta Sorsa September 1992 WDR OfficeChallenge for GATT 31393
WPS981 After Socialism and Dirigisme: Andres Solimano September 1992 S. FalonWhich Way? 37947
WPS982 Microeconomics of Transformation Brian Pinto September 1992 S. Husainin Poland: A Survey of State Marek Belka 37139Enterprise Responses Stefan K-ajewski
WPS983 Legal Reform for Hungary's Private Cheryl W. Gray October 1992 R. MarticSector Rebecca J. Hanson 39065
Michael Heller
WPS984 Barriers to Portfolio Investments Asli DemirgOq-Kunt October 1992 W. Patrawimolponin Emerging Stock Markets Harry Huizinga 37664
WPS985 Regional Integration, Old and Jaime de Melo October 1992 D. BallantineNew Claudio Montenegro 37947
Arvind Panagariya
WPS986 The Administration of Road User Roy Bahl October 1992 J. FranciswO'ConnorTaxes in Developing Countries 35205
WPS987 How the Epidemiological Transition Jose Luis Bobadilla October 1992 0. NadoraAffects Health Policy Issues in Cristina de A. Possas 31091Three Latin American Countries
WPS988 Economic Valuation and the David Pearce October 1992 WDR OfficeNatural World 31393
WPS989 The Indian Trade Regime M. Ataman Aksoy October 1992 R. Matenda35055
WPS990 Protection and Industrial Structure M. Ataman Aksoy October 1992 R. Matendain India Francois M. Ettori 35055