Public Disclosure Authorized Indonesia: Urban Poverty and · Komunitas (PLBK) Neighborhood...
40
POLICY NOTE JANUARY 2013 Indonesia: Urban Poverty and Program Review Public Disclosure Authorized Public Disclosure Authorized Public Disclosure Authorized Public Disclosure Authorized Public Disclosure Authorized Public Disclosure Authorized Public Disclosure Authorized Public Disclosure Authorized
-
Upload
nguyenmien -
Category
Documents
-
view
216 -
download
0
Transcript of Public Disclosure Authorized Indonesia: Urban Poverty and · Komunitas (PLBK) Neighborhood...

POLICY NOTE
JANUARY 2013
Indonesia: Urban Poverty and Program Review
Pub
lic D
iscl
osur
e A
utho
rized
Pub
lic D
iscl
osur
e A
utho
rized
Pub
lic D
iscl
osur
e A
utho
rized
Pub
lic D
iscl
osur
e A
utho
rized
Pub
lic D
iscl
osur
e A
utho
rized
Pub
lic D
iscl
osur
e A
utho
rized
Pub
lic D
iscl
osur
e A
utho
rized
Pub
lic D
iscl
osur
e A
utho
rized
WB456288
Typewritten Text
79895


Indonesia: Urban Poverty and Program ReviewJanuary 2013
POLICY NOTE

Policy Noteii
Abbreviations and Acronyms
Abbreviations Bahasa Indonesia English
ASKESKIN Asuransi Kesehatan Masyarakat Miskin Health insurance for the poor
Bappenas Badan Perencanaan Pembangunan Nasional National Development Planning Body
BIA Analisa Insiden Manfaat Benefit incidence analysis
BLM Bantuan Langsung Masyarakat Community Block Grants
BLT Bantuan Langsung Tunai Unconditional cash transfer
BOP Biaya Operasional Operational Funds
BPS Badan Pusat Statistik Statistics Indonesia
BSM Beasiswa untuk Siswa Miskin Scholarships for the poor
CCT Bantuan Sosial Tunai Bersyarat Conditional Cash Transfer
CDP Program Jangka Menengah Program Penanggulangan Kemiskinan (PJM Pronangkis)
Community Development Plan
GDP Produk Domestik Bruto (PDB) Gross Domestic Product
GFC Krisis Keuangan Dunia (mulai musim gugur 2008) Global Financial Crisis (starting Fall 2008)
GOI Pemerintah Republik Indonesia Government of Indonesia
Jamkesda Jaminan Kesehatan Daerah Local level health insurance for the poor
Jamkesmas Jaminan Kesehatan Masyarakat Health Insurance Scheme for the Population
JPS Jaring Pengaman Sosial Social Safety Net
JSLU Jaminan Sosial Lanjut Usia Social cash transfer for the elderly
JSPACA Jaminan Social Penyandang Cacat Berat Social cash transfer for the disabled
Kemendiknas Kementerian Pendidikan Nasional Ministry of National Education, MONE
Kemenag Kementerian Agama Ministry of Religious Affairs, MORA
Kemenkes Kementerian Kesehatan Ministry of Finance, MOF
Kemensos Kementerian Sosial Ministry of Social Affairs, MOSA
ND Pembangunan Lingkungan Permukiman Berbasis Komunitas (PLBK)
Neighborhood Development
NTS Sistem Penargetan Nasional National Targeting System
OPK Operasi Pasar Khusus Program for sale of subsidized rice for the poor
PAPG Program Penanggulangan Kemiskinan Terpadu (PAKET) atau Program Penanggulanan Kemiski-nanan berbasis Kemitraan
Poverty Alleviation Partnership Grant (PAPG)
PK Permukiman Kelurahan Kelurahan Settlement
P2KP Proyek Penanggulangan Kemiskinan di Perkotaan Urban Poverty Project (UPP)
PKH Program Keluarga Harapan Hopeful Family Program
PL Garis Kemiskinan Poverty Line
PNPM-Mandiri Program Nasional Pemberdayaan Masyarakat Mandiri
National Community Empowerment Program
PPP Keseimbangan Daya Beli Purchasing power parity

Indonesia: Urban Poverty and Program Review iii
Abbreviations Bahasa Indonesia English
Raskin Beras Miskin Program for sale of subsidized rice for the poor
Rp Rupiah Indonesian Rupiah
SA Bantuan Sosial Social Assistance
SD Sekolah Dasar Elementary School
SMP Sekolah Menengah Pertama Junior Secondary School
SP Perlindungan Sosial Social Protection
SSN Jaringan Pengaman Sosial Social Safety Net
SUSENAS Survei Sosio-Ekonomi Nasional National Socio-Economic Survey
TKPKD Tim Koordinasi Penanggulangan Kemiskinan Daerah
Regional Poverty Reduction Coordinating Team
TNP2K Tim Nasional Percepatan Penanggulangan Kemiskinan
National team for accelerating poverty reduction
UCT Transfer Uang Tunai tak Bersyarat Unconditional Cash Transfer
UPP Proyek Penanggulangan Kemiskinan Perkotaan/P2KP
Urban Poverty Project (P2KP)

Policy Noteiv
Table of Contents
Abbreviations and Acronyms .................................................................................................................................................................iiAcknowledgments ........................................................................................................................................................................................vExecutive Summary ......................................................................................................................................................................................vi
Section 1: Introduction and Approach .....................................................................................................................................11.1 Introduction ...........................................................................................................................................................................................11.2 Approach .................................................................................................................................................................................................2
Section 2: Indonesia Urban Poverty Analysis ......................................................................................................................32.1 Trends and Patterns in Urban Poverty ...................................................................................................................................32.2 Characteristics of the Urban Poor ............................................................................................................................................52.3 Poverty Transitions .............................................................................................................................................................................62.4 Vulnerable Subgroups .....................................................................................................................................................................72.5 Perceptions of Urban Poverty .....................................................................................................................................................7
Section 3: Review of Urban Poverty Programs and Incidence of Benefits ...................................................93.1 Overview of Programs .....................................................................................................................................................................93.2 The Distribution of Program Benefits ....................................................................................................................................13
Section 4. Implications for Policy ..................................................................................................................................................15
References ...........................................................................................................................................................................................................21Annex: Methodology ..............................................................................................................................................................................24A.1 Data Source for Poverty Analysis and Benefit Incidence ...........................................................................................24 SUSENAS ..................................................................................................................................................................................................24 Indonesian Family Life Survey ....................................................................................................................................................25A.2 Qualitative Analysis of Urban Poverty ...................................................................................................................................26 Site Selection .........................................................................................................................................................................................26 Qualitative Methodology ..............................................................................................................................................................28

Indonesia: Urban Poverty and Program Review v
Acknowledgments
This study was carried out by a team led by Judy L. Baker, Lead Economist, World Bank. The policy note is based on a report, “Indonesia Urban Poverty Analysis and Program Review” prepared by a team at the RAND Corporation including Nicholas Burger, Peter Glick, Francisco Perez-Arce, Lisa Rabinovich, Yashodhara Rana, Sinduja Srinivasan and Joanne Yoong. The management of the field work was carried out by SurveyMeter, notably Bondan Sikoki, Wayan Suriastini and Dani Alfah.
The work benefitted greatly from inputs by Evi Hermissari, Kumala Sari, Fatima Shah (co-TTL through Sep-tember, 2011), George Soraya, Zoe Trohanis, and Jan Weetjens. The team is grateful to peer reviewers, Daniel Hoornweg, Jon Jellema, Victoria Beard, and Suahasil Nazara, as well as helpful inputs and discussions at vari-ous stages of the work from Vivi Alatas, Ana Maria Arriagada, Shubham Chaudhuri, Amri Ilmma, Yulia Imma-jati, Victor Vergara, Matt Waipoi, and Michael Woolcock. The work was carried out under the overall direction of Franz Drees-Gross and Stefan Koeberle.
Participants at two workshops held in Jakarta, one in March, 2011 and a second in November 2011, includ-ing key members of GOI, Indonesian researchers, NGOs, and donors provided invaluable input on the study design and on early findings. Funding for this study was made possible through the PNPM Support Facility (PSF).

Policy Notevi
Executive SummaryKey FindingsIndonesia has demonstrated substantial gains in economic and social indicators over the past decade with gradual declines in poverty in both urban and rural areas. Despite these impressive achievements, 13 per-cent of the population continues to live in poverty with another 40 percent of all households just above the poverty line and vulnerable to falling into poverty. In cities, approximately 18 percent of the population are poor or near poor, representing some 20 million people. As the country urbanizes, this number is expected to increase, surpassing rural poverty by the year 2020.
The urban poor in Indonesia have characteristics similar to other countries – they tend to have low education levels, work in the informal sector with low wages, live in low quality housing, lack tenure security, and have lower access to basic services than the non-poor. Subgroups among the urban poor that are particularly vul-nerable include recent urban migrants, child laborers, street children and those living in informal settlements. By region, some two thirds of all urban poor live in Java, though the poverty rate in NT is substantially higher.
Focus groups carried out in a sample of poor urban communities across Indonesia identified a number of key challenges for residents. Those most frequently mentioned were inadequate incomes, difficulty in find-ing jobs, and expenses related to schooling. Other themes that came up were poor infrastructure and lack of capital.
The Government of Indonesia has a comprehensive poverty reduction strategy with a number of large social assistance programs as well as the PNPM community driven development program delivered in both rural and urban areas. Key social assistance programs include the Raskin rice subsidy, the Jamkesmas health in-surance program, a Conditional Cash Transfer program for the extremely poor (PKH), and the Cash for Poor Students program (BSM). The overall package of programs aimed at the urban poor covers most basic needs, though there are substantial issues of program design, efficiency and the quality of services being delivered which have emerged from this and other studies, particularly for the large Raskin and Jamkesmas programs.1
With regard to targeting, there is much scope for improving efficiency and reducing leakages to the non-poor. There are also problems related to undercoverage for the urban poor, particularly for those living in informal settlements who may be among the poorest, though ineligible for some GOI benefits.
The PNPM-Urban program operates in all urban areas of Indonesia with the overall development objec-tives of improving local level governance and service delivery. The majority of resources are spent on small scale infrastructure improvements at the community level. The program, evaluated in depth in a companion policy note, Indonesia, Evaluation of the Urban CDD Program, PNPM-Urban (World Bank, 2012) was found to be an effective approach for community participation and for addressing basic infrastructure at the com-munity level. Independent assessments of infrastructure quality show it to be high, and community orga-nizations are perceived to be working relatively well, independent of Government programs and structures. The evaluation also identified a number of areas where the program could be improved to further enhance efficiency and impact. These areas include efforts to strengthen project activities for social and economic activities which may have a greater impact on household welfare, to ensure more participation by women and the poorest in communities, further capacity building of facilitators, improvements to the MIS, and more systematic program alignment with the local government budgeting processes. There is also much scope for extending the role of the PNPM in the context of urbanization.
1 See World Bank, 2012, Protecting Poor and Vulnerable Households in Indonesia, Jakarta, Indonesia.

Indonesia: Urban Poverty and Program Review vii
Policy PrioritiesBased on the analysis of urban poverty and a review of main programs as well as recent studies carried out by the World Bank on urbanization and on social assistance, a number of policy priorities emerge for an urban poverty reduction strategy, particularly in view of the growing numbers of urban poor.2 These can be categorized under 2 broad areas of: economic and urbanization policies; and social policies and are consis-tent with global evidence on poverty reduction strategies. As Indonesia urbanizes, proactively managing the urbanization process can further leverage growth and poverty reduction. Policies that encourage efficient urban spatial structures, sustainable land use planning, investments in critical infrastructure, and the provi-sion of basic services including for those in informal settlements will foster growth and ultimately contribute to poverty reduction. Concomitantly, social assistance programs are needed to help poor households escape destitution and reduce the likelihood that vulnerable households will fall into poverty. Implementing such policies is highly achievable given the successes that Indonesia has achieved to date, but will require proac-tively doing so to effectively prepare for the urban transition.
I) ECONOMICANDURBANIZATIONPOLICIES
Improving economic returns from urbanization. Compared to other Asian countries, Indonesia has not lev-eraged the benefits of urbanization to achieve increases in economic productivity as well as other countries. A more comprehensive strategy that focuses on ensuring greater consistency between spatial planning and investment priorities between the different tiers of government, investing in agglomerating metropolitan and medium sized cities to enhance productivity, and institutional reforms to improve the business climate and reduce the costs of doing business in Indonesia will foster growth and poverty reduction.
Ensuring Basic Urban Infrastructure for the Poorest and Preparing for Urbanization. As Indonesia urban-izes, there will be new demands for basic infrastructure and services particularly for low income urban resi-dents. Proactively planning for urban growth and expansion can prevent the future growth of informal settle-ments and minimize the potentially harmful impacts of rising exposure to natural hazards as people and assets concentrate in cities. Proactive policies such as land use planning, housing programs, and transport planning are also consistent with fostering growth. Past examples of sites and services projects provide many important lessons as well as a prospective approach for some cities and towns. The PNPM-Urban Program, currently operating in all kelurahans in Indonesia, potentially has an important role to play in further provid-ing basic infrastructure, though better linking such investments to local government planning will be impor-tant in ensuring consistency for sustainable growth. Addressing land policy related to informal settlements will also be important as the program currently does not operate in such areas.
Improving Access to Credit. Very few urban households, a large portion of which are engaged in own ac-count activities, appear to receive business credit from existing programs. Credit for creating or expanding enterprises was the most highly ranked program need in focus groups of urban poor—for both men and women. Under the original UPP Program, a revolving loan fund was set up to help the urban poor grow busi-nesses, thus becoming more bankable. The program, however, had a number of problems and is currently being phased out. A key issue was a lack of understanding among many community members about the objectives of the program.3 With many perceiving funds are ‘grants’ rather than ‘loans’, repayment perfor-mance was low. Other problems are related to the lack of a clear strategy for ensuring the proper institutional development and sustainability of the RLFs. As the program phases out, it is unclear if the private sector or NGOs will step in to fill this gap. There is much scope for exploring other models, and gaining additional un-derstanding on which programs work well and which don’t in an urban context given the existing demand.
2 See, World Bank, 2012, Indonesia, The Rise of Metropolitan Regions: Towards Inclusive and Sustainable Regional Development, Jakarta, and World Bank, 2012, Protecting Poor and Vulnerable Households in Indonesia.
3 See Micro-Credit Ratings International Limited, 2012, Revolving Loan Funds in Indonesiafor their financial performance and capacity building needs, mimeo.
Executive Summary

Policy Noteviii
ii) SOCIALPOLICIES
Extending Access to Education and Health for the Urban Poor. Education is an important factor in helping families to break the intergenerational transfer of poverty. It is clear from the focus groups and interviews that poor people highly value education for their children but find the costs of schooling highly burdensome, possibly related to the timing and discrete nature of school fees and related costs. Health costs may not be recurrent but when illness strikes, health expenses can be catastrophic for the poor. While there are existing programs aimed at providing much needed education scholarships (BSM), school operational assistance (BOS), health insurance (Jameskas), and cash transfers conditional on health visits and school attendance through the PKH, there is much scope for extending assistance. There are significant gaps at the post second-ary school level for the urban poor, with only 40 percent net enrollment for the poorest quintile. Extending benefits would have significant benefits for children and struggling households. This would be reliant on significant changes in program design and targeting to improve cost effectiveness.
Improving targeting efficiency and program redesign. The challenges related to targeting efficiency are well recognized by the GOI with plans underway to rationalize the system by establishing a National Tar-geting System (NTS) for all social protection programs directed at households. In order to best meet the needs of the urban poor it may also be necessary to redesign some existing programs such as the BSM and Jameskas to improve efficiency and better align the package of services with needs. The Raskin rice subsidy is currently an expensive and largely inefficient approach to reaching the poor given substantial leakages and high operating costs. For the PNPM-Urban program, there is much scope for strengthening social and economic activities to address priorities raised by the urban poor in the context of this study. The presence of the PNPM-Urban in all kelurahans provides an opportunity for some possible design changes to accom-modate such needs, as well as using program facilitators to help the poor access social assistance programs as is done through the Generasi program model (under the PNPM-Rural).
Insuring Households Against Income Shortfalls. During times of economic crises in recent years, the GOI has done fairly well in cushioning the impacts of systemic or macroeconomic risk, in the form of the uncon-ditional cash transfer programs of 2005 and 2008-9 through the BLT (cash transfer) program. The analysis of poverty trends, however, suggests that vulnerability to idiosyncratic changes or shocks continues for many, even during times of economic growth, with substantial movement of households into and out of poverty. This is underscored by responses in focus groups and interviews which refer to problems of losing an income source or having unsteady work, as well as a general lack of jobs. More generally, the qualitative data make clear that temporary shortfalls of income to meet basic needs exist for many urban poor. This suggests there is scope for extending the safety net to include some type of assistance from loss of employment, illness, or other temporary shocks.
Looking ahead, as Indonesia continues to urbanize, there is enormous potential for shaping that urbanization to improve on the returns for growth and poverty reduction. The country also has an opportunity to avoid the mistakes that other countries have made in neglecting to plan for new urban residents in a proactive way. This has led to sprawling slums on marginal lands which lack basic services. The cost of retroactively up-grading such areas is substantially more expensive over the long term leading to high inefficiencies. Recom-mended improvements to social programs will also result in benefits to the poor, ultimately enhancing their human capital, living conditions and productivity over the long run to help break the cycle of poverty. Such policy choices will require a sustained and focused effort -- Indonesia cannot afford to miss this opportunity.

Indonesia: Urban Poverty and Program Review 1
1 . 1 IntroductionIndonesia has emerged as a vibrant middle income country which has achieved significant progress in eco-nomic growth and poverty reduction over the past decade. Gross national income per capita has steadily risen from $2,200 in the year 2000, to $3,720 in 2009. The economy demonstrated its resilience during the re-cent global economic crisis (2008-2009), being substantially less affected by the downturn than most coun-tries. Poverty rates have been falling steadily in both rural and urban areas, and social indicators have equally shown gradual improvements.
Beyond these impressive achievements, an estimated 31 million people still live below the poverty line (2011) and 40 percent of all households live just above the national poverty line of US$21 per month and remain vulnerable to falling into poverty. The number of urban poor in cities is on the rise, largely because the country is rapidly urbanizing. Currently about 54 percent of the population lives in cities (2010), this is projected to rise to 67 percent by 2025.4 The rapid increase can be attributed to all three causes of urban growth; expansion of cities into the rural fringe (30-40 percent), natural growth (35-40 percent) and rural-urban migration (25-30 percent) World Bank Poverty Study, 2006). Accordingly, urban poverty is projected to surpass rural poverty by 2020.
Urbanization brings many opportunities, but also a set of challenges for new residents and local govern-ments. Low income migrants in search of jobs and access to better services settle in locations that are afford-able, often in sprawling settlements in peri-urban areas or on marginal lands that are at high risk to natural hazards (e.g. flooding or landslides), or near hazardous waste sites or industrial sites. Extending basic services to these areas is often difficult and costly, adding new challenges to already stretched local government institutions.
4 BPS, 2010.
Section 1: Introduction and Approach

Policy Note2
This policy note provides a summary of extensive analysis carried out on urban poverty in Indonesia today and a review of main urban poverty programs, with the objective of providing the basis for an urban poverty reduction strategy. A second policy note, “Indonesia: Evaluation of the Urban CDD Program – Program Nasional Pemberdayaan Masyarakat (PNPM)” summarizes a more detailed process evaluation that was car-ried out of this important program in parallel to the urban poverty analysis and program review. The PNPM-Urban evaluation covers issues related to internal efficiency, distills lessons learned, and identifies options for improving program effectiveness. The two pieces together provide context for the review of existing programs and strategic directions for addressing urban poverty, as well as more specific operational recom-mendations for enhancing impact of the PNPM-Urban Program.
Section 1 includes this introduction and the analytical approach of the study, Section 2 covers the analysis of poverty trends and characteristics, Section 3 includes the review urban poverty programs and benefit incidence analysis, and section 4 discusses policy implications for urban poverty reduction. The complete background study, prepared by RAND, is available as a companion to this policy note with inclusion of de-tailed analysis and data tables.
1 . 2 ApproachThe study uses a mixed-method approach including analysis of the National Socio-economic Survey (SUSE-NAS), 2002-2010, for analysis of urban poverty, the Indonesian Family Life Survey (IFLS) to examine long run dynamics of poverty among urban households (2000-2007), and both data sets to examine participation in social assistance programs and access/use of basic services.
To complement the quantitative analysis of poverty, a qualitative study of the urban poor was carried out in 16 communities across Indonesia during May-June 2011. The field work was carried out together with the PNPM Urban Process Evaluation in the same communities. The communities were selected to reflect broad geographical representation as well as variation in the level of poverty. For the evaluation, an additional ef-fort was made to include 3 sites that participated in the Neighborhood Development Project. Communities were chosen from the sample communities included in the Indonesia Family Life Survey, stratified on com-munity wealth. The final selection included 3 sites from West Java, 3 from East Java, 3 from Central Java, 2 from North Sumatra and 2 from South Sulawesi. The Neighborhood Development sites included 2 sites from central Java and one in West Java. See Annex I for full details.
In each community a rapid survey of poor households was carried out in conjunction with a uniform screen-ing procedure designed to recruit the appropriate participants for focus groups and in depth interviews. The main criterion for respondent selection in both studies was that individuals be from poor households. In each community 2 focus groups on poverty/programs were carried out – one for men and one for women - in addition to one in-depth interview. The protocols were designed to assess:
• Respondents perceptions of poverty, causes and barriers to moving out of poverty • Strategies for coping with inadequate resources• Gender differences in the causes and impacts of poverty • Perceived needs including types of government assistance• Participation and perceptions of assistance programs

Indonesia: Urban Poverty and Program Review 3
2 . 1 Trends and Patterns in Urban PovertySteady, modest declines in poverty in recent years in both urban and rural areas, at a rate of about .63 percent per year, have brought the rate of urban poverty from 15% in 2002 (when poverty still exceeded pre-Asian financial crisis levels) to just under 10% in 2010 using the national poverty line.5 The depth and severity of poverty has also declined.6
This trend is consistent with previous studies of poverty in Indonesia. Reductions in urban poverty were attributed initially to a substantial growth in public sector employment in the 1970s that led to positive ben-efits throughout the urban areas, as well as investments in physical and social infrastructure which allowed urban income earners to take greater advantage of expanding economic opportunities. Indonesia faired the recent financial crisis relatively well with strong and continued growth. While urban poverty rates are relatively low and well below the rate in rural areas (16%), they still represent 11 million people or more than one third (37%) percent of total poor. Those defined as ‘near poor’, households with per capita consumption between the poverty line and 20 percent above the line, are considered vulnerable to becoming poor and thus together with the ‘poor’ form the target population for GOI poverty reduction and social protection policies. This group comprises a further 8.2 percent of the urban population - almost as large as the share of the poor (10%).
The poor and near poor together represent about 18 percent of the population, or approximately 20 million people using the national poverty line. Using international standard poverty lines, 8 percent of urban resi-dents fall below the US$1.25 PPP per day, and 33% fall below the US$2 PPP per day which is more typically used in urban areas. It is important to note that the IFLS and Susenas samples during this period are based on the 2000 census which is outdated particularly for urban areas which are growing rapidly. Informal mar-ginal settlements are likely to be undersampled thus information on poverty and access to services is likely to be underrepresented. It is not possible, however, to determine by how much.
5 Poverty estimates are calculated using the March Susenas data series, a nationally representative annual household survey (panel) collected by the In-donesian national statistics agency, BPS. The welfare measure is based on per capita household consumption, and the poverty line is that used by BPS using the food energy intake method. Using the $2 PPP per day standard, the urban poverty rate is substantially higher at 33 percent.
6 During the period 2002-2010, the Poverty Gap has declined from 14.4 to 9.87 and Poverty Severity has gone from .69 to .40 in urban areas (Susenas).
Section 2: Indonesia Urban Poverty Analysis

Policy Note4
Regardless of which poverty line is used, the absolute number of urban poor will continue to increase as the country urbanizes from its current level of 45 percent urbanization to a projected 70 percent by 2030 and thus is an increasingly important target group in Indonesia’s poverty reduction policies.
The urban poor are concentrated in highly urbanized and densely populated Java, accounting for more than two thirds of the country’s urban poor. Rates of urban poverty vary substantially across regions -- under 10% in Java, higher in Sumatera (12%), and generally high in smaller and less urbanized Eastern regions, particu-larly NT (24%) (Table 1). Declines in urban poverty have occurred since 2002 in almost all regions.
RegionUrban
Poverty rate (%)
Regional share of all urban poor
(%)
Urbanization rate (%)
Urban share of regional poor (%)
Mean daily per capita expenditures
(Rupiah)
Java 9.6 67.6 56.7 42.9 16,980
Sumatra 11.6 20.4 39.1 34.1 14,895
NT 24.0 6.0 30.3 32.7 13,850
Sulawesi 6.2 2.9 30.7 13.7 17,980
Kalimantan 4.7 2.4 40.2 25.7 18,365
Maluku 6.8 0.4 27.6 9.4 13,770
Papua 5.6 0.3 22.8 3.5 12,545
AllUrban 9.9 100 48.3 35.8 16,480
Source: Susenas survey, 2010
TABLE 1. URBAN POVERTY BY REGION, 2010
Non-monetary indicators of well-being such as school enrollments, vaccinations, and access to improved water and sanitation, have also generally shown improvements over the last decade, sometimes substantial, in both urban and rural areas. For example, the share of young children getting all four immunizations (BCG, Polio, DPT and measles) in urban areas rose from 42% to 67% (2004-2009), with even larger proportional gains in rural areas. These improvements are encouraging particularly given that human development indicators in Indonesia have tended to lag behind income growth.
Home Industry
Photo: World Bank

Indonesia: Urban Poverty and Program Review 5
2 . 2 Characteristics of the Urban PoorThere are several key differences between poor and non-poor urban households related to education, em-ployment, household size, access to services, tenure security and housing conditions. Heads of poor urban households are more likely to rely on self-employment and less likely to be wage or salaried employees than are heads of non-poor households, indicating a greater importance of informal sector work by the poor. The urban poor also have less schooling than the non-poor with about one third having less than a primary edu-cation. These findings are fully consistent with the profile of the urban poor in most developing countries.7
Poor urban households are larger than non-poor, by about 1 person on average (approximately 5 versus 4), primarily reflecting the negative association of fertility and income. These correlations are confirmed through multivariate models with a notable difference being the finding for female headship with is negatively as-sociated with per capita household consumption after controlling for other factors. There are also substantial regional differences controlling for household characteristics implying that otherwise similar urban house-holds are better off in Java than Sumatera but less well off than in Kalimantan and Sulawesi. Interestingly, the characteristics of the extreme poor differ very little from those of the rest of the urban poor.
When comparing characteristics with the rural poor, key differences are unsurprisingly around occupational patterns with the rural poor relying much more on agriculture/extraction work, less on industry and services, more likely to be self-employed and less likely to be wge-employed. Overall the rural poor are somewhat less educated than their urban counterparts, though mean household size is the same.
Data on access to basic services is mixed with some major differences by source and definition, though overall show lower access by the urban poor relative to the non-poor. Urban infrastructure on the whole has not been able to keep up with rapid urbanization, particularly in informal settlements where many of the poor live. Bappenas reports the proportion of households with sustainable access to an improved water source in urban areas at 49.8 percent in 2009, and the proportion of households with sustainable access to improved sanitation at 69.5 percent in 2009.8 The UNICEF/WHO Joint Monitoring Program (JMP) report 92 percent access to total improved water in urban areas, and only 36 percent access to piped water for 2010.9
For sanitation access, the JMP report improved sanitation at 73 percent in urban areas, and 14 percent relying on open defecation. The differences in estimates are attributed to the different assumptions made in defini-tions, (i.e. inclusion or non-inclusion of non-PDAM piped water (local government water utilities), number of people served per connection, etc.).10 At the national level, some 80 million people lack access to electricity and half of all households still rely on solid fuels for cooking. While the data are not broken out by urban and rural areas, modern energy access in urban areas is a still a challenge for many, particularly for those living in informal settlements that are off-grid.11
The number of slum residents using the UN Habitat definition was estimated at 23 percent of the urban population in 2007.12 While more recent estimates are not available, this number is likely to have grown given urbanization rates. Though not all urban poor live in slums, nor are all slum dwellers below the poverty line, there is a very high correlation. Slums (and kampongs – informal settlements) in Jakarta and other In-donesian cities are typically very densely populated inner city neighborhoods that are often located along riverbanks, canals, or railways, often in flood zones. In the case of Jakarta, much of the city lies below sea level and is vulnerable to tidal flooding, storm surges, and changes in sea level due to climate change. In North Jakarta both poverty and flooding rates are highest in the city exacerbating the risk for those in slums. Frequent flooding means disruption and possible loss of livelihoods, loss of assets, contamination of drinking water, and spread of disease.
Indonesia Urban Policy Analysis
7 See Baker, 2008, “Urban Poverty: A Global View,” World Bank Working Paper, Washington, D.C.8 Bappenas, 2010, Report on the Achievement of the MDGs, Indonesia in 2010. 9 UNICEF/WHO JMP, 2012, Progress on Drinking Water and Sanitation. JMP Definitions: An improved drinking-water source is defined as one that, by na-
ture of its construction or through active intervention, is protected from outside contamination, in particular from contamination with faecal matter; An improved sanitation facility is defined as one that hygienically separates human excreta from human contact.
10 World Bank, 2012, Indonesia, Water Engagement Strategy Note. 11 World Bank, 2012, Indonesia, Energy Engagement Strategy Note.12 UN-Habitat, UrbanInfo database 2006. Slum resident estimates are based on the share of households lacking improved water and sanitation, adequate
living area and other facets of housing.

Policy Note6
2 . 3 Poverty TransitionsDuring the measurement period 2000-2007 for which there is panel data, there was substantial movement in and out of poverty throughout Indonesia -- 26% of the 2000 national (rural and urban) sample experienced a change in poverty status from 2000 to 2007, with an approximately equal number becoming poor as be-came non-poor.14 Among urban residents, a third of the sample changed status, with 60% more people be-coming poor than moving out of poverty.15 The analysis confirms the need for policy to focus on those who are vulnerable to becoming poor, not just those who are poor. At the same time, it suggests that a large share of people and households who are poor will move out of poverty over time. Correlates of movement in and out of poverty find that those who complete junior secondary schooling and those that live in a household whose head was a business owner or was a full time employee have a higher probability of escaping poverty and a lower probability of becoming poor. Individuals’ own occupational transitions were not significantly associated with becoming poor or becoming non-poor though shifting from self-employment to wage em-ployment was associated with a fall in consumption.
Migration to urban areas is a very important factor in transitions out of poverty. Among poor households in 2000, those who migrated were 18.8 percentage points more likely to escape poverty by 2007. In general, the per capita consumption of migrants increased by 20 percentage points more than that for the average Indo-nesian in the sample. This very large effect might come as a result of individuals migrating because of a job or other economic opportunity. It is also important to note that migration may be highly selective on traits that would lead to greater growth in incomes and consumption, which is not controlled for in the models.
Households with: Q1 Q2 Q3 Q4 Q5 All Urban
Pipedwater/brandedbottlewater 36 46 53 59 66 52
Householdlivesincommunitywith:
Sewagesystem 69 70 73 74 76 72
Mainroadtypeisasphaltorcement 90 89 88 88 90 89
Source: Susenas, 2010
TABLE 2: ACCESS TO BASIC INFRASTRUCTURE BY QUINTILE, URBAN AREAS*
13 Chomistriana (2011). This study estimates that only about 45% of the total demand for water in Indonesia’s urban slums is met though the source of this figure is not provided.
14 This analysis is based on the available panel data from the Indonesian Family Life Survey, 2000-2007.15 Part of the observed mobility reflects measurement error, but analysis of consumption mobility, which can correct for measurement error, suggests that
there is still significant real mobility.
Many of these settlements are unplanned and unregulated, with poorly defined legal status that leads to insecurity of tenure for residents. In Jakarta, more than 50 percent of the land parcels are unregistered with the government and do not have title, leaving residents vulnerable to eviction (World Bank, 2011).
Studies of slum conditions in Indonesia identify poor housing facilities and lack of access to water, sanitation, drainage, and electricity as the main concerns.13 Those in informal settlements tend to have the lowest cover-age. With limited government service provision in slum areas, residents often access basic services through personal connections or unregulated intermediary service providers to whom they typically must pay higher fees for lower quality services. Corruption and crime is also a problem in some slums areas, in part due to the lack of government services including security. As noted by the ADB (2010) unregulated service provision in informal settlements is often in the hands of local mafias or other powerful groups, with residents having few mechanisms for reporting grievances.

Indonesia: Urban Poverty and Program Review 7
2 . 4 Vulnerable Subgroups There are a number of subgroups in the urban population that are not explicitly captured in household sur-veys such as recent urban migrants, child laborers, street children, and for some surveys, informal workers. In 2005, it was estimated that approximately 24 percent of the total urban population were migrants, meaning that their current residential location was different from where they were born and another 5 percent were recent migrants.16 Hence, nearly one in every four urban residents has migrated from a rural area during his or her lifetime. Java and Sumatra are the two provinces that absorb the largest number of long-term rural-urban migrants, primarily to Jakarta in Java, and Medan and Batam in Sumatra. In other regions, Samarinda and Balikpapan in Kalimatan and Makassar in South Sulawesi also draw large numbers of immigrants from rural areas.17 While the information on this subgroup is limited, research suggests that migrants do better in economic terms as a result of having migrated. Migration has also been found to have a positive effect on the educational attainment and health outcomes of children of migrants in Indonesia (Resosudarmo and Suryadarma, 2010). Evidence for health effects, particularly for adults is however, more mixed, with possibly deleterious effects on adult migrants’ health.
Informality is high among the urban poor, with informal workers being more vulnerable to loss of work, shortfalls in household income, and lack of access to job related benefits. A survey of informal workers found that 80 percent did not have social security, 60 percent were unaware of government provided social security schemes and 80 percent did not have any formal insurance (ILO, 2010). In contrast, half of all formal employ-ees had these benefits. While few studies have considered the different kinds of informal workers, specific categories of workers such as street vendors may be particularly disadvantaged.
Only a very small proportion of informal workers, less than 3 percent, transition into the formal sector annu-ally. Slow growth of the formal sector limits job availability. The new entrants to the job market tend to be better educated and more urbanized than before. Informal workers who are young, urban and male are the most successful at breaking into the formal job market. It is more common for formal workers to move into informal jobs. From 2000 to 2007, an average of 4.4 percent of formal workers moved into informal jobs an-nually, higher than the level seen in 1993-2000. Although women are more likely to be found in the informal sector, men are slightly more likely to move from formal to informal jobs (World Bank, 2010).
Child labor is estimated to affect 2.4 million boys and 1.6 million girls aged 10-17 in Indonesia (BPS, 2010). Interviews of working age children in Jakarta show that almost half had moved from rural or smaller urban areas in search of economic opportunities (some with and some without their families). The cost of educa-tion was a significant factor in these children leaving school, and a significant number of them worked to add to the minimal earnings of their families (Bessell, 2009). Among this subgroup, street children and children who work as domestic workers are the group most at risk. In Jakarta, it is estimated that there are more than 4000 children living and working on the streets (Jakarta Social Affairs Agency cited by Primanita, 2010).
2 . 5 Perceptions of Urban Poverty Focus groups and interviews carried out in the 16 urban communities sampled reflect key challenges per-ceived by poor residents. The challenges most frequently mentioned (in descending order) include:
• inadequate incomes (relative to expenses and the price of basic necessities); • difficulty in finding jobs (and especially secure employment); and • expenses related to schooling.
Indonesia Urban Policy Analysis
16 Intercensal Population Survey (Suspas), 2005.17 Resosudarma, et. al, 2009

Policy Note8
The lack of income and burden of school expenses points to significant vulnerability to economic or unem-ployment shocks, and the inadequacy of the level and perhaps timing of the benefits under the current assis-tance program. The problem of high and increasing school expenses was frequently noted by both men and women. Many respondents singled this expenditure item out from the household’s overall expenses. When asked about temporary shocks, respondents referred to specific educational expenses and health expenses (e.g., accidents, surgery, medicines). To deal with income shortfalls, the most common strategy used is bor-rowing from moneylenders or family/neighbors. Other methods include selling or pawning belongings, reducing the number or quality of meals, and working odd jobs.
The complaints related to the lack of jobs and lack of long term employment were most frequently noted by youth and heads of households. While some suggested the lack of education as a main factor, many also noted that even when young people have managed to complete their studies, they often cannot find jobs.
Participants in focus group discussions and interviews overwhelmingly felt that the community’s economic situation had worsened over the last 5 years. Many of those who felt poverty increased attributed this to a rise in the cost of living, while others felt that limited opportunities and loans for business were also to blame. This perception is somewhat surprising given the steady declines found in the overall poverty rates based on national surveys. The contradiction could reflect a certain subset of the poor who have suffered stagnant or declining real incomes in the last several years, or that people tend to notice rising costs of living more than rising incomes.
Although views were mixed as to whether men or women are more vulnerable to poverty, a number of respondents (generally women) noted that the impact of household poverty is more significant for women who have the most responsibility for meeting the daily needs of the family. That being said, some respon-dents reported that it was easier for women to find jobs and engage in income generating activities than a few years ago.
Two other themes that came up, though with less frequency than those mentioned above, were poor in-frastructure and lack of capital. With regard to infrastructure, for example, the women of Jakarta Barat, D.K.I. provided a number of concerns -- damaged roads, poor housing, lack of solid waste collection, and drainage problems. Men in Cirebon, West Java also discussed infrastructure problems in their communities -- lack of wells and thus no access to clean water, uncovered ditches, no lighting on walkways, and damaged roads.
Finally, a subset of respondents talked about lack of capital for business as an important obstacle to increased welfare for themselves and their families. A man in Surakarta, Central Java explained: “The problem is we want to improve ourselves, … we want to make a business…, but we lack funds.” Another man, in Tana Toraja, South Sulawesi commented on the adequacy of loans: “For example, we [were supposed to] have 10 million [Rp] as capital from the government. But the fund given is only 1 or 2 million. I actually have an idea to run a business but the capital is not enough. It is not even enough to buy the desk, and not enough to buy the other instruments. So, the loan would be in vain.”
In terms of coping strategies, borrowing money was the most widely cited way to cope with income short-falls. Participants were broadly divided between those who said they would borrow from a usurer, and those who said they would borrow from family or neighbors. Many participants noted that because loans from usurers incur very high interest, the loans often end up making them more poor than they were initially, even if the money helps them deal with temporary shocks or crisis. Coping mechanisms that were mentioned somewhat less frequently were selling or pawning belongings, reducing the number or quality of meals, and working odd jobs.
When individuals were asked what they or their communities needed most in terms of assistance from gov-ernment, both men and women ranked credit for business the highest. Also highly ranked were support for daily needs, assistance with education expenses, cash assistance (women) and jobs (men). This is consistent with the expressed concern regarding the high cost of daily life as well as challenge in affording education.

Indonesia: Urban Poverty and Program Review 9
3 . 1 Overview of Programs Indonesia’s poverty reduction strategy, developed and coordinated since 2010 through TNP2K (National team for accelerating poverty reduction) includes a comprehensive three part framework for categorizing programs and policies. Cluster I includes social assistance programs such as subsidized rice (Raskin), health service fee waivers for the poor (Jamkesmas), scholarships for elementary and junior secondary school stu-dents from poor families (BSM), a temporary unconditional cash transfer program that was used to offset rising prices in 2005, and again in 2008-2009 (BLT), as well as a conditional cash transfer program for very poor households (PKH) which provides cash if the mother attends pre and post natal health checkups, has childbirths attended professionally, brings young children to professional health check-ups and enrolls older children in school. Cluster II focuses on empowerment and primarily includes PNPM. Cluster III which is substantially smaller in terms of resource allocation, includes a number of small programs for increasing incomes in the longer term through credit for micro and small scale enterprises.
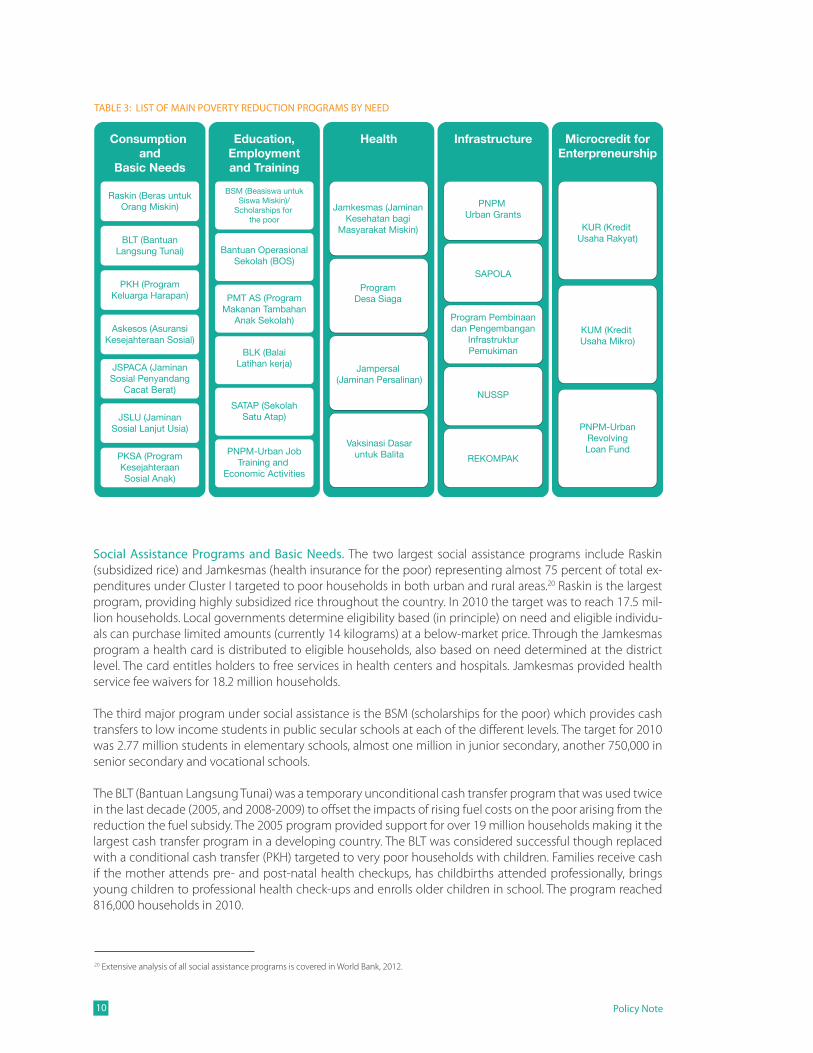
In total, the government spent around Rp 42,000 billion on poverty alleviation in 2010, equivalent to 6 per-cent of total government expenditures and 0.6 percent of GDP. Of this, 63 percent went to Cluster I and 35% went to Cluster II. A majority of spending is for rural areas.18 The remaining 2-3 percent is spent on Cluster III which is spread across 15 small programs in 6 ministries. Subnational governments also allocate resources to social assistance, but the majority of these resources go for staff salaries and general administration in sup-port of the national programs. See Rand, 2012 for a full list of programs and Table 3 for a list of main poverty programs by need.19
18 World Bank, Public Expenditure Review Summary, Social Assistance Program and Public Expenditure Review I. 19 Rand, 2012, “Indonesia Urban Poverty Analysis and Program Review”
Section 3: Review of Urban Poverty Programs and Incidence of Benefits
Policy Note10
Social Assistance Programs and Basic Needs. The two largest social assistance programs include Raskin (subsidized rice) and Jamkesmas (health insurance for the poor) representing almost 75 percent of total ex-penditures under Cluster I targeted to poor households in both urban and rural areas.20 Raskin is the largest program, providing highly subsidized rice throughout the country. In 2010 the target was to reach 17.5 mil-lion households. Local governments determine eligibility based (in principle) on need and eligible individu-als can purchase limited amounts (currently 14 kilograms) at a below-market price. Through the Jamkesmas program a health card is distributed to eligible households, also based on need determined at the district level. The card entitles holders to free services in health centers and hospitals. Jamkesmas provided health service fee waivers for 18.2 million households.
The third major program under social assistance is the BSM (scholarships for the poor) which provides cash transfers to low income students in public secular schools at each of the different levels. The target for 2010 was 2.77 million students in elementary schools, almost one million in junior secondary, another 750,000 in senior secondary and vocational schools.
The BLT (Bantuan Langsung Tunai) was a temporary unconditional cash transfer program that was used twice in the last decade (2005, and 2008-2009) to offset the impacts of rising fuel costs on the poor arising from the reduction the fuel subsidy. The 2005 program provided support for over 19 million households making it the largest cash transfer program in a developing country. The BLT was considered successful though replaced with a conditional cash transfer (PKH) targeted to very poor households with children. Families receive cash if the mother attends pre- and post-natal health checkups, has childbirths attended professionally, brings young children to professional health check-ups and enrolls older children in school. The program reached 816,000 households in 2010.
KUM (Kredit Usaha Mikro)
PNPM-UrbanRevolvingLoan Fund
Consumption and
Basic Needs
Education,Employmentand Training
Health Infrastructure Microcredit forEnterpreneurship
KUR (Kredit Usaha Rakyat)
Raskin (Beras untukOrang Miskin)
BSM (Beasiswa untukSiswa Miskin)/
Scholarships for the poor
BLT (BantuanLangsung Tunai) Bantuan Operasional
Sekolah (BOS)
Jamkesmas (JaminanKesehatan bagi
Masyarakat Miskin)
PNPM Urban Grants
SAPOLA
Program Pembinaandan Pengembangan
InfrastrukturPemukiman
NUSSP
REKOMPAK
ProgramDesa Siaga
Jampersal (Jaminan Persalinan)
Vaksinasi Dasaruntuk Balita
PMT AS (ProgramMakanan Tambahan
Anak Sekolah)
BLK (BalaiLatihan kerja)
SATAP (SekolahSatu Atap)
PNPM-Urban JobTraining and
Economic Activities
PKH (ProgramKeluarga Harapan)
Askesos (AsuransiKesejahteraan Sosial)
JSPACA (JaminanSosial Penyandang
Cacat Berat)
JSLU (JaminanSosial Lanjut Usia)
PKSA (ProgramKesejahteraanSosial Anak)
TABLE 3: LIST OF MAIN POVERTY REDUCTION PROGRAMS BY NEED
20 Extensive analysis of all social assistance programs is covered in World Bank, 2012.

Indonesia: Urban Poverty and Program Review 11
A number of other smaller programs also exist to address special needs of specific groups administered by a range of ministries. Among these are a program offering mobile classes for street children and student drop-outs, a program for children at greatest risk combining conditional cash transfers with service provision, and programs for the elderly and disabled.
Urban Infrastructure Programs. The GOI and donors have funded a number of ambitious infrastructure pro-grams over time that have contributed to improving the living conditions of millions of poor urban residents in Indonesia thus playing an important complementary role to the other poverty reduction programs reviewed. These include large scale, city wide investments, as well as small neighborhood upgrading investments in drain-age, water supply, or roads such as the works delivered through the PNPM program. City level programs contrib-ute to economic growth thus indirectly benefiting the poor. At the neighborhood level when targeted to the poor, such programs can result in improved health outcomes, increased economic opportunities, and for com-munity driven development programs such as PNPM, empowered communities and improved governance.
The PNPM Urban Program which operates in all urban areas of Indonesia has the overall development objec-tive of improving local-level governance and service delivery. The program incorporates a community driven approach which relies on community decision making and has empowerment as a key goal. It encompasses all three clusters of the current TN2PK framework within a CDD approach: social protection; infrastructure investment to promote pro-poor growth; and credit for small and micro enterprises. The infrastructure com-ponent is the largest, focusing on small scale infrastructure improvements identified through a participatory decision making process at the community level. A new program, Neighborhood Development, is being piloted under the PNPM in urban areas which also includes spatial planning, and larger investments targeted to the poorest communities.
Relatively few other programs have been directed at slum improvement. The Neighborhood Upgrading and Shelter Sector Project (NUSSP) was funded by the Asian Development Bank and ran from 2005-2010 in 32 cities. This program was very similar in design to the PNPM, also using a CDD approach for investments in basic infra-structure and access to housing improvements facilitated through a housing microfinance program. A project completion report found that the upgrading component was implemented successfully, though it could have been more efficient and effective if; a focused geographic approach was taken, and if spatial planning and the integration of community-driven neighborhood upgrading into overall city spatial planning was incorporated. The housing finance component suffered from poor demand for housing credits attributed to; (i) difficulty in identifying suitable local financial institutions (LFIs) in some participating cities, (ii) relatively high interest rates (15.5%) put forward by the National Fund for Small and Medium Scale Investments (PNM) to LFIs, (iii) subse-quently high interest rates for housing microcredits (30%– 40%) offered by LFIs to poor families, and (iv) limited awareness of microcredit schemes among potential LFIs and poor communities.21
A few other smaller slum upgrading programs are being carried out at the local level such as the Healthy Places, Prosperous People (HP3), supported by Mercy Corps, Indonesia which operates in North Jakarta.
Informal settlements typically do not have full legal title and are not registered with the National Land Board. Settlements located along railways, right of ways, riverbanks, under bridges, and along green paths and parks are considered illegal and existing law prevents residents GOI from granting citizenship rights and access to basic infrastructure and services. This greatly limits what existing programs can do in these areas where needs are often greatest. As Indonesia urbanizes and land becomes increasingly scarce, such informal settle-ments are likely to grow and if not proactively addressed will only contribute to problems of urban poverty. Settlements in high risk areas leave residents open to exposure to the impacts of climate change and natural hazards such as flooding, resulting in damage or destruction to ones’ home, assets, disruption of economic activity, contamination of water supply, spread of disease and displacement of residents. Programs that pro-actively plan for urban growth and expansion including housing for the poor can prevent the future growth of slums and can minimize the potentially harmful impacts of rising risk to natural hazards (see Section 4).
Review of Urban Poverty Programs and Incidence of Benefits
21 ADB Project Completion Report, Neighborhood Upgrading and Shelter Sector Project, ADB Project http://www2.adb.org/documents/PCRs/INO/35143-013-ino-pcr.pdf

Policy Note12
BOX 1 : A HISTORY OF SLUM IMPROVEMENT PROJECTS IN INDONESIA
Indonesia has a long history of programs of municipal and slum improvement efforts, dating back to the 1960s. The Kampung Improvement Program (KIP), started in 1969 in Jakarta and heavily sup-ported by the World Bank and other donor agencies, is considered one of the most important and successful slum upgrading projects in the world. Over its 25-year duration, some 15 million kampung residents in urban areas across the country benefited from improved footpaths, roads and drainage, garbage bins and collection vehicles, safe drinking water through public taps, public washing and toi-let facilities, neighborhood health clinics, and primary school buildings. The project is widely viewed as having had significant overall impacts in terms of quality of life as well as poverty reduction and im-proved health (Buckley and Kalarickal 2006, World Bank 2005). The success of KIP has been attributed to strong political commitment as well as community support, though the actual degree of local par-ticipation has been questioned (Setiawan 1998). Despite its successes, sustainability and maintenance were problems with KIP projects, which generally had a short term focus. KIP was also not concerned with broader, larger scale infrastructure needs of kampungs, and in some cases led to displacement of some poor residents due to increases in land values (Supriatna 2011; Agrawal 1999).
In the 1980s the focus of the Government shifted toward a broader, city-wide approach to upgrading, an approach that coalesced into the Integrated Urban Infrastructure Development Program (IUIDP). While IUIDP absorbed the KIP, the focus of IUIDP, unlike KIP, was not exclusively on slum upgrading. Further, IUIDP projects typically had components covering many sectors such as water supply, sanitation, roads, and housing, rather than standalone projects along one of these dimensions. The program also empha-sized improved city level management and coordination across sectors and agencies (ADB 2000).
After 1999, programmatic approaches shifted fundamentally once more, this time reflecting the broader transition toward decentralization as well as community driven development (CDD). The Neighborhood Upgrading and Shelter Sector Project (NUSSP), financed by the Asian Development Bank, included both slum upgrading projects and new housing development components and was essentially modeled on the UPP, predecessor to PNPM Urban, and included local project identifica-tion, a community-based organization and/or community self-help group (BKM) as well as facilitators to assist the communities and the BKM. Access to housing improvement was facilitated through a housing micro finance program. The ADB’s review of its spending indicates that the NUSPP improved more than 6,800 hectares of urban slum areas in 803 neighborhoods and benefited about 800,000 poor urban households (ADB 2011).
Currently, government policies toward upgrading are organized under the Indonesia Slum Allevia-tion Policy and Action Plan (SAPOLA) funded by World Bank, UN Habitat, and Aus-AID forming Cities Alliance (Cities Without Slums). This project supports the development of a National Slum Upgrading Policy and a National Slum Upgrading Action Plan, which have as a focus the enabling of local govern-ments to improve living conditions in urban slums.
Credit Programs. Cluster III programs include those aimed at providing credit to poor households and include the Urban Development Project PKK and the P2KP (PNPM Urban). Overall, very few households (less than 1%) reported getting credit through either the Kecamatan (subdistrict) Urban Development Project (PKK) or P2KP (PNPM Urban) which is not surprising given that the Revolving Loan Fund under the program is very small. Credit from other government programs such as KUBE, KUM-LTA or Kredit Usaha Micro Layak Tanpa Agunan play a much larger role than these sources, accounting for 56% of credit from all public sources. All government sources in turn account for about half of enterprise loans received in the last year by urban households.
Education and Health Services. Government education and health services are not explicitly targeted to the poor but have important impacts on poverty and welfare. In education, primary school enrollment is close to universal across quintiles in both urban and rural areas, a measure of the successful expansion of education in Indonesia over time. However, gaps emerge at post primary levels. In urban areas, 66% of junior secondary

Indonesia: Urban Poverty and Program Review 13
age children in the poorest urban quintile are enrolled compared with 77% in the richest. For upper second-ary the difference is very large: 40% vs. 69%. Enrollment at post-secondary levels is very low overall and is especially heavily skewed toward well off households. The gaps are even larger in rural areas. Therefore, while Indonesia has made impressive strides in achieving close to universal primary enrollment, significant deficits persist for higher school levels.
Health coverage as measured by births attended by a medical professional is high even for the poorest urban quintile with 85 percent of recent births attended by a medical professional (compared with close to 100% for the top two quintiles). Immunization rates for children, however, show notable differences across urban quintiles in shares of children receiving vaccinations for Polio, measles, BCG and DPT, with 60% complete vac-cinations for children in the poorest urban quintile compared with 74% in the wealthiest. At the same time, perhaps most striking is that fully one quarter of the wealthiest did not get all four vaccinations.
3 . 2 The Distribution of Program BenefitsIn order to assess the extent to which public spending is pro-poor, benefit incidence analysis is carried out for several poverty programs in urban areas including the Raskin, Jamkesmas, business credit through gov-ernment programs, and maternal and child health services. The findings for urban corroborate those in the recent study, “Protecting Poor and Vulnerable Households in Indonesia” (World Bank, 2012) which looks at social assistance programs from a national perspective.
The analysis shows that on the whole, while social protection programs do reach many poor and near poor in urban areas, leakages to better off households are significant and problems of undercoverage exist for all programs. Raskin (subsidized rice) covers 70 percent of those in the first quintile (roughly equivalent to the poor and near poor) in urban areas, though overall, leakages of spending to non-poor households are substantial -- about 60 percent of the total subsidized rice benefit goes to those who are neither poor or near poor. Use of the health card under Jamkesmas (health insurance for the poor program) and the BLT (unconditional cash transfer program, discontinued) are also relatively low by the poor, with under 40 per-cent of the poor (quintile one) receiving benefits. Significant resources are going to non-poor households. Undercoverage rates for Raskin and Jamkesmas are similar in both urban and rural areas, though leakages to the non-poor are sharply different for Raskin. In urban areas leakages are well below rural areas.
Education at the primary level is progressively distributed with nearly universal across quintiles in both urban and rural areas. Gaps however emerge at post primary levels, with enrollment at the post-secondary level low overall and spending regressive. Health care (beyond Jamkesmas) and other benefits through employ-ment are very low for the urban poor – only 14% of urban wage earners in the poorest quintile get any kind of health related benefits compared with over half in the highest quintile.
Incidence analysis is not possible for the PNPM as benefits are not captured in the available household survey data. For the infrastructure component this would be difficult to capture in surveys as it is harder to define an individual’s benefit from a public infrastructure improvement such a new road than for receiving a specific benefit such as subsidized rice or health care. It is noteworthy, however, that in the focus groups on PNPM, residents did not complain that funds and projects were going to better off areas or tending to benefit better off residents at the expense of the poor. This is in sharp contrast to perceptions of unfairness in allocations of the main social assistance programs, suggesting that PNPM Urban infrastructure projects are relatively well directed at the poor or at poor neighborhoods.
Geographical Distribution of Benefits. Participation and targeting performance of these programs varies significantly across locations. Where a poor (or a near poor) person lives does affect the likelihood that he or she receives benefits. For Raskin, participation is very high among the urban poor and near poor in Java—almost 80%--far higher than in other regions with the exception of much less populated Nusa Tenggara. In Sumatera, Sulawesi, and Kalimantan the shares are 49%, 57%, and 46%, respectively. A key driver of regional differences in how well the poor and near poor are covered is differences in the overall level of benefits avail-able to the urban population in each region (whether poor, near poor, or not).
Review of Urban Poverty Programs and Incidence of Benefits

Policy Note14
There is less variation in participation of the poor and near poor in Jamkesmas. There is also very significant province-level variation in the share of poor/near poor getting these benefits, though again the variation is stronger for Raskin. However, whether a poor/near poor person lives in a wealthy or poor province matters relatively little for the chances that the person will benefit from Raskin or Jamkesmas. This pattern is reflective of the fact that social assistance programs which currently are managed by different ministries, use different targeting approaches (combinations of means testing, community-based targeting and geographical target-ing), rely on separate recipient databases, and sometimes use different definitions of poverty (Alatas 2010). Leakages to the non-poor arise not just from inaccuracies in poverty definitions but from local decisions on allocations of benefits that reflect pressure from non-poor groups, social norms of sharing, or corruption (World Bank 2010, Sumarto and Bazzi 2011).22
Perceptions of Social Programs. Respondents in the focus groups and interviews generally praised social assistance programs such as Raskin, Jamkesmas, and BLT as being helpful to them, but voiced several seri-ous criticisms about how the programs were operated related to poor or unfair allocation of benefits (poor targeting), inadequate levels of assistance, bad service, and poor access to services. Dissatisfaction with tar-geting procedures and outcomes was especially apparent, with complaints of corruption, nepotism, and politicization of the distribution process for different programs. These complaints are consistent with other, mostly rural-based studies of distribution mechanisms and perceptions of the poor. They are also very con-sistent with the large leakages of benefits measured in the analysis of household survey data.
Perceptions of PNPM-Urban. Overall the findings of the evaluation of the PNPM-Urban program are quite positive. Feedback from beneficiaries generally indicate that the program provides important and needed services. It was clear from the responses that PNPM-Urban infrastructure programs are well-received and beneficial to the community, and viewed as being well chosen and targeted. Community organizations are also perceived to be working relatively well, independent of Government programs and structures. BKM rep-resentatives, RT leaders (the smallest neighborhood unit) and RW leaders (one level up from RT) regularly at-tend KSM meetings in all sites. The issues and challenges that emerged from the interviews and focus groups were related to socialization of the program, the responsibilities of the BKM (community organization/Board of Trustees), KSM (community voluntary contribution group), relatively low participation rates by community members, and the extent to which the needs of the poor are met.
22 Previous finding on these practices come largely from rural areas.

Indonesia: Urban Poverty and Program Review 15
The analysis above provides a profile of the urban poor and trends of urban poverty highlighting a growing number of urban poor as the country urbanizes. The main challenges expressed by the poor include low incomes, difficulty in finding jobs, and expenses related to schooling. Data on living conditions also point to needs related to housing quality, basic infrastructure and social services. When this profile is coupled with the program review, a number of issues arise related to the suitability of the overall package of programs, allocation of funding, and issues of targeting efficiency which are relevant to Indonesia’s poverty reduction strategy.
Extensive global evidence has shown that any strategy aimed at sustained reductions in urban (and national) poverty will rely on policies that foster strong economic growth, invest in human capital, ensure access to basic services, and provide social protection for vulnerable groups. In most countries, urbanization has helped to foster economic growth and thus can play an important role in reducing urban poverty over the long-term.
As Indonesia urbanizes, proactively managing the urbanization process can further leverage growth and pov-erty reduction. Policies that encourage efficient urban spatial structures, sustainable land use planning, invest-ments in critical infrastructure, and the provision of basic services including for those in informal settlements will foster growth and poverty reduction. Concomitantly, social assistance programs are needed to help poor households escape destitution and reduce the likelihood that vulnerable households will fall into poverty.
Priorities for achieving these goals identified by this study and other recent analytical work carried out by the World Bank on urban development and poverty reduction in Indonesia can be categorized under 2 broad categories of economic and urbanization policies, and social policies.
Section 4: Implications forPolicy
Policy Note16
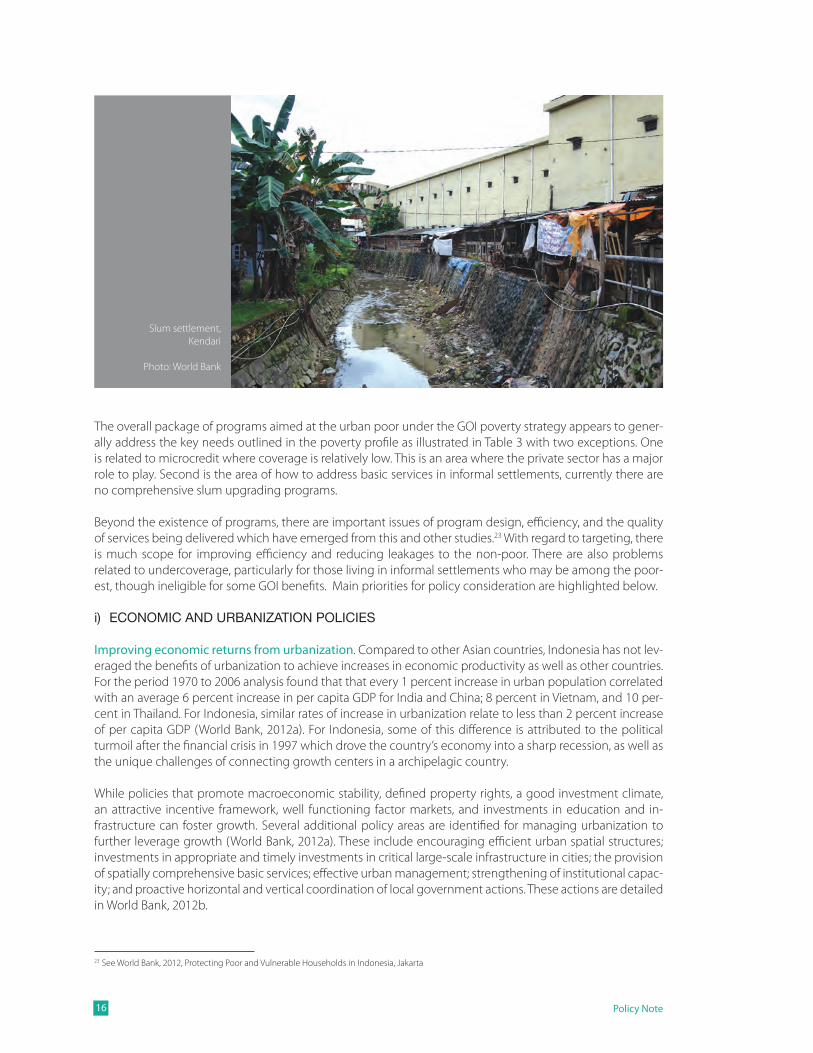
The overall package of programs aimed at the urban poor under the GOI poverty strategy appears to gener-ally address the key needs outlined in the poverty profile as illustrated in Table 3 with two exceptions. One is related to microcredit where coverage is relatively low. This is an area where the private sector has a major role to play. Second is the area of how to address basic services in informal settlements, currently there are no comprehensive slum upgrading programs.
Beyond the existence of programs, there are important issues of program design, efficiency, and the quality of services being delivered which have emerged from this and other studies.23 With regard to targeting, there is much scope for improving efficiency and reducing leakages to the non-poor. There are also problems related to undercoverage, particularly for those living in informal settlements who may be among the poor-est, though ineligible for some GOI benefits. Main priorities for policy consideration are highlighted below.
i) ECONOMICANDURBANIZATIONPOLICIES
Improving economic returns from urbanization. Compared to other Asian countries, Indonesia has not lev-eraged the benefits of urbanization to achieve increases in economic productivity as well as other countries. For the period 1970 to 2006 analysis found that that every 1 percent increase in urban population correlated with an average 6 percent increase in per capita GDP for India and China; 8 percent in Vietnam, and 10 per-cent in Thailand. For Indonesia, similar rates of increase in urbanization relate to less than 2 percent increase of per capita GDP (World Bank, 2012a). For Indonesia, some of this difference is attributed to the political turmoil after the financial crisis in 1997 which drove the country’s economy into a sharp recession, as well as the unique challenges of connecting growth centers in a archipelagic country.
While policies that promote macroeconomic stability, defined property rights, a good investment climate, an attractive incentive framework, well functioning factor markets, and investments in education and in-frastructure can foster growth. Several additional policy areas are identified for managing urbanization to further leverage growth (World Bank, 2012a). These include encouraging efficient urban spatial structures; investments in appropriate and timely investments in critical large-scale infrastructure in cities; the provision of spatially comprehensive basic services; effective urban management; strengthening of institutional capac-ity; and proactive horizontal and vertical coordination of local government actions. These actions are detailed in World Bank, 2012b.
23 See World Bank, 2012, Protecting Poor and Vulnerable Households in Indonesia, Jakarta
Slum settlement,Kendari
Photo: World Bank

Indonesia: Urban Poverty and Program Review 17
Implications for Policy
Ensuring Basic Urban Infrastructure for the Poorest and Preparing for Urbanization. The findings of the qualitative assessment related to the needs of the urban poor suggest that infrastructure is not a top priority in terms of greatest challenges facing themselves or their communities. Similarly it was not mentioned as a priority in terms of needs from the Government. Some of this may reflect the classic public goods problem, in that individuals tend to undervalue projects that provide collective benefits in favor of direct assistance that provide clear or immediate benefits to them. It is also possible that because of the presence of programs addressing these needs residents perceive that they are being met and thus are a lower priority. That being said, the data show some shortfalls in basic infrastructure for the urban poor, particularly for housing, water, sanitation and drainage, and with increasing urbanization, these needs will grow substantially.
The largest urban infrastructure program aimed at the urban poor is the PNPM-Urban Program. Numerous studies have been carried out on the PNPM Urban, including the process evaluation carried out in parallel with this study. Findings overall have been positive, with the CDD approach seen as a cost-effective ap-proach for delivering community infrastructure. There have also been more intangible elements of collective community empowerment, strengthening of social networks and promoting more open communication between communities and government institutions. Specific implementation issues related to increasing social and economic activities, gender, community participation, the role of facilitators, and strengthening relationships between local governments and the program have been identified and are being addressed. There are also some gaps in implementation in that the program currently does not operate in informal settlements where infrastructure needs tend to be greatest.
The PNPM Urban program is also piloting a Neighborhood Development (ND) program which aims to pro-mote more comprehensive urban upgrading by significantly increasing the size of the grant (to 1 billion IDR per kelurahan) and introducing spatial planning and area prioritization. Early indications from the limited implementation of this pilot suggest that in some communities the approach offers an innovative model for community driven urban upgrading based on spatial planning, however, there are currently a number of implementation challenges that could affect its scale up and need to be addressed. In general, the project appears to be most successful in locations that have a strong BKM, an engaged local government and gener-ally do not have complex infrastructure needs.24
24 World Bank, 2012, Rapid Appraisal of PNPM Neighborhood Development,(and Poverty Alleviation Partnership Grant Mechanism).
Some urban poor have limited access to
clean water
Photo: World Bank
Policy Note18
In more complex urban environments where the priority issues may involve land issues, the spatial plan-ning process has been successful in identifying the community needs and issues (often related to market improvements, sanitation and drainage). Implementation, however, is often constrained due to complexity and time required of proposed activities which are deemed too difficult and involving too many stakeholders to be implemented within the ND timeframe and are often abandoned before implementation (and simpler investments are implemented).
For such communities, more traditional slum upgrading programs may be more appropriate. While there are no known studies comparing traditional slum upgrading programs with the CDD approach, most slum upgrading programs now involve community participation in the decision making process. Such programs are also increasingly including social components. Recent World Bank projects in Brazil, Jamaica, Vietnam and elsewhere are designed to address problems of employment, crime and violence, youth, health care and other social sector concerns as well as basic infrastructure and service delivery needs. This is happening to a certain extent under the PNPM, though there is much scope for expanding spending on social and eco-nomic needs as identified by the urban poor as top priorities. Specifically, there is much scope for using the extensive PNPM Urban structure to deliver social assistance programs, social services, training, and possibly micro finance through a restructured design.
Going forward, a priority for the GOI is to further develop policies and programs that proactively plan for urban growth and expansion to prevent the future growth of informal settlements and minimize the poten-tially harmful impacts of rising exposure to natural hazards as people and assets concentrate in cities. Proac-tive policies include land use planning, housing programs, and transport planning. Past examples of sites and services projects provide many important lessons as well as a prospective approach for some cities and towns. In cities with land constraints, investing in affordable and efficient transport can open up new areas on safe land and reduce land prices, improving overall housing options. Such policies, however, must be well managed through urban planning, or can otherwise result in urban sprawl.
Improving Access to Credit. Very few urban households, a large portion of which are engaged in own ac-count activities, appear to receive business credit from existing programs. Credit for creating or expanding enterprises was the most highly ranked program need in focus groups of urban poor—for both men and women. Under the original UPP Program, a revolving loan fund was set up to help the urban poor grow busi-nesses, thus becoming more bankable. The intent was to bridge the gap in credit availability and ultimately encourage commercial banks to become more active in serving the productive poor. The PNPM Urban is in the process of phasing out the RLFs for communities where it is not performing well. A recent study of the Revolving Loan Funds (RLFs) identified several problems with the revolving loan funds.25 A key problem with operations has been that there is a lack of understanding among many community members about the objectives of the program. In particular, a misperception that the funds are ‘grants’ rather than ‘loans’ which affects repayment performance. Other problems are related to the lack of a clear strategy for ensuring the proper institutional development and sustainability of the RLFs. It is unclear if the private sector or NGOs will step in to fill this gap. There is much scope for exploring other models, and gaining additional understanding on which programs work well and which don’t in an urban context given the existing demand.
ii) SOCIALPOLICIES
Further Extending Access to Education and Health for the Urban Poor. Indonesia has made good progress in its human development indicators, particularly in education with near-universal access to primary school-ing. Gaps, however, still remain with regard to enrollment at higher levels. It is clear from the focus groups and interviews that poor people highly value education for their children but find the costs of schooling highly burdensome, possibly related to the timing and discrete nature of school fees and related costs. Greater assistance to cover education expenses was a highly ranked need for both poor men and women. These
25 See Micro-Credit Ratings International Limited, 2012, Revolving Loan Funds in Indonesiafor their financial performance and capacity building needs, mimeo.

Indonesia: Urban Poverty and Program Review 19
perceptions suggest that current approaches including BSM (scholarships for the poor) and BOS (school operational assistance program) are not adequate. BSM in particular suffers from timing problems (disburse-ments coming months after enrollment) that limit its usefulness to households that are strapped for cash at the time of school enrollment. Redesign of BSM to address these shortcomings would have significant benefits for children and struggling households.
With regard to health, the analysis focused only on the distribution of benefits for child vaccinations and at-tendance of medical professionals at birth. While GOI has implemented universal vaccination and delivery care programs, the low rate of complete vaccinations among children in the poorest quintile is of particular concern and points to the need for better outreach, possibly including programs that go beyond access and directly address parents’ motivation and incentives such as the PKH.
Improving targeting efficiency and program redesign. The challenges related to targeting efficiency are well recognized by the GOI with plans underway to rationalize the system by establishing a National Target-ing System (NTS) for all social protection programs directed at households. The NTS will create of a unified database of poor households from which implementing agencies can draw lists of beneficiaries eligible to receive different social programs. Under this system, a poor household should be automatically enrolled in all programs for which it is eligible. In implementing the NTS, it will be important to ensure that all poor urban households, including those living in informal settlements, are eligible. Other improvements in targeting and the overall implementation of social protection programs are included in World Bank (2012).26
In order to best meet the needs of the urban poor it may also be necessary to redesign some existing pro-grams. In the case of BSM, improving the timing of benefits, and in the case of Jameskas, revising the mix of free medical services, improving facilitation and outreach to better reach poor households, and revising the medical benefit package itself so that it is more cost effective. The Raskin rice subsidy is currently an ex-pensive and largely inefficient approach to reaching the poor given substantial leakages and high operating costs. For the PNPM-Urban program, there is much scope for strengthening social and economic programs to address priorities raised by the urban poor. The presence of the PNPM-Urban in all kelurahans provides an opportunity for some possible design changes to accommodate such needs, as well as using program facili-tators to help the poor access social assistance programs as is done thorugh the Generasi program model (under the PNPM-Rural).
During the focus groups for this study and the PNPM-Urban review some of the priorities mentioned by the urban poor, such as social and economic programs, are not covered by existing programs. The presence of the PNPM-Urban in all kelurahans provides an opportunity for some possible design changes to accommo-date such needs through increasing support for social and economic programs, and perhaps using the Gen-erasi program model (under the PNPM-Rural) whereby facilitators help the poor access safety net programs, help with school fees, etc. Similarly redesign of the BSM to address timing problems as mentioned above could substantially improve program impact. Additional research is underway to better understand these needs and how to best meet them under existing programs.
Insuring Households Against Income Shortfalls. The GOI has done fairly well in cushioning the impacts of systemic or macroeconomic risk, in the form of the unconditional cash transfer programs of 2005 and 2008-9 through the BLT. The program was designed to compensate poor households for large increases in kerosene prices, though this program has been instituted only on an ad hoc basis and is not a current part of the social safety net. The analysis of poverty trends, however, suggests that vulnerability to idiosyncratic changes or shocks continues with substantial movement of households into and out of poverty. This is underscored by responses in focus groups and interviews which refer to problems of losing an income source or having un-steady work, as well as a general lack of jobs. More generally, the qualitative data make clear that temporary shortfalls of income to meet basic needs exist for many urban poor.
Implications for Policy
26 World Bank, 2012, Protecting Poor and Vulnerable Households in Indonesia, Jakarta, Indonesia.

Policy Note20
As noted by World Bank (2012), despite the numerous assistance programs, very few currently exist to protect households against idiosyncratic risks from loss of employment (or from illness or other shocks). The initial JPS package of measures to offset the impacts of the Asian Financial Crisis included a range of temporary employment programs. These appear to have been successful at raising household incomes as well as being well targeted but are no longer in place (Sumarto and Bazzi 2011), suggesting there is scope for extending the safety net to include some type of assistance for temporary household shocks.
In conclusion, this study points to a number of policy areas for reducing urban poverty that the GOI can ad-dress in the near to medium term. The GOI is well placed to proactively address existing and emerging needs that will come with rapid urbanization with careful planning and strong commitment. This is an opportunity that many countries do not have and cannot afford to be missed.

Indonesia: Urban Poverty and Program Review 21
References
ADB, 2010. Project Completion Report, Neighborhood Upgrading and Shelter Sector Project, ADB Project http://www2.adb.org/documents/PCRs/INO/35143-013-ino-pcr.pdf
Baker, Judy L. (2008). “Urban Poverty: A Global Overview.” World Bank, Washington D.C. January, 2008.
Bappenas, 2010, Report on the Achievement of the MDGs, Indonesia in 2010.
Buckley, R. M., & Kalarickal, J. (2006). Thiry Years of World Bank Shelter Lender: What Have We Learned. Wash-ington, DC: The World Bank.
Burger, N. P. Glick, F. Perez-Arce, L. Rabinovich, Y. Rana, S. Srinivasan, and J. Yoong, 2012, Indonesia Urban Pov-erty Analysis and Program Review. RAND Corporation.
Chomistriana, Dewi, 2011. Inclusive Cities. Urban Development Series. Eds. Lindfield, Michael and Florian Steinberg. Manila: Asian Development Bank, April 2011.
Primanita, Arientha, 2010. "Jakarta Enlists Help to Get Kids Off the Streets". 2010. Jakarta Globe.
Resosudarmo, Budy P., and Daniel Suryadarma, 2010. The Effect of Childhood Migration on Human Capital Ac-cumulation: Evidence from Rural-Urban Migrants in Indonesia: Australian National University, 2010.
Sumarto, Sudarno, and Samuel Bazzi, 2011. Social Protection in Indonesia: Past Experiences and Lessons for the Future, Paper presented at the 2011 Annual Bank Conference on Development Opportunities (ABCDE) jointly organized by the World Bank and OECD, Paris.
World Bank, 2006. Making the New Indonesia Work for the Poor. Washington, D.C.
World Bank, 2010, Indonesia Jobs Report: Towards Better Jobs Security for All, World Bank, Jakarta, Indonesia.
World Bank, 2011. Jakarta, Urban Challenges in a Changing Climate, Mayor’s Task Force Report on Climate Change, Disaster Risk and the Urban Poor, Jakarta, Indonesia.
World Bank, 2012a. Protecting Poor and Vulnerable Households in Indonesia.
World Bank, 2012b. Indonesia: The Rise of Metropolitan Regions: Towards Inclusive and Sustainable Regional Development.
World Bank, 2012, Indonesia, Water Engagement Strategy Note.


Annex.Methodology

Policy Note24
A1. Data Sources for Poverty Analysis and Benefit IncidenceSUSENASThe main data source used in this report is the National Socioeconomic Survey (SUSENAS), a nationally representative annual household survey collected by the Indonesian national statistics agency Badan Pu-sat Statistik (BPS). There are two main SUSENAS surveys, a cross-sectional survey conducted in July and an annual panel survey carried out in March. The July surveys collect samples of about 250,000 house-holds. The size and design of the survey enables analysis at the kabupaten (district) level. A detailed consumption module is collected in 3-year intervals, the last time in 2008. Smaller consumption modules are administered in the intervening years but because of the difference in the questionnaire, consump-tion aggregates from these years are not comparable to (and less reliable than) those in the years with the full module. The March survey is an annual panel survey on a smaller number of households, first started by following 10,000 households in the 2002 July SUSENAS for three years. Two subsequent three-year panels have been drawn from the July survey samples. In 2007 the sample size for the March surveys was increased to 65,000 households to allow reliable estimates of poverty at the province (both rural and urban) level. The panel collects detailed consumption data on an annual basis, so also can be used to track poverty year to year.
While the July surveys with expanded consumption data initially appear most promising for this report, some inconsistencies preclude the use of this data for conducting disaggregated urban-rural analysis over time. As the March and July surveys are representative and just a few months apart, poverty rates in the two surveys for a given year should be generally be similar, particularly for years when the full consump-tion module was also administered in the July survey. National poverty rates generated from July surveys using BPS consumption aggregates, sampling weights, and poverty lines generally match the national poverty rates for March. However, with the exception of 2008, the urban poverty estimates from July and March are quite different, and rural poverty rates also differ (the July surveys show much lower urban, and somewhat higher rural poverty than the March survey). Discussions with World Bank staff in Jakarta as well as with BPS staff suggest that different weighting schemes and definitions for rural and urban popu-lations were applied during the collection and analysis of July and March surveys until 2008 (when the approaches were harmonized)27, leading to fundamental inconsistencies in the poverty rates prior to that date. Other issues also remain28 These consultations established that comparisons of July data pre- and post-2008 are not valid.
In view of this, the study relies on March surveys for the analysis of poverty. It should be noted that use of this panel for analyzing patterns and trends in urban poverty has some drawbacks. First, given the smaller samples, analysis can only be conducted at the province (and rural/urban) level. Second, there are some concerns about representativeness. When following the same households over time, changes in incomes or poverty due to economic conditions are difficult to distinguish from changes due to the life cycle (earnings
27 We are grateful to World Bank Jakarta staff, and especially to Amri Ilmma, for very helpful discussions about SUSENAS as well as for providing us with the data.
28 This still left some discrepancies unexplained, for example, in some years such as 2004 the urban population shares were the same (43.2%) for March and July, but urban poverty rates were still much lower in July (8.6% vs. 12.1%). A further problem identified by World Bank Jakarta staff is the presence of discontinuities in the per capita consumption distribution at or near the poverty line in the July 2008 data, such that for some districts there are few households just below the line while for others there are few just above the line. Our own examination of the data confirmed these discontinuities, which remain unexplained.
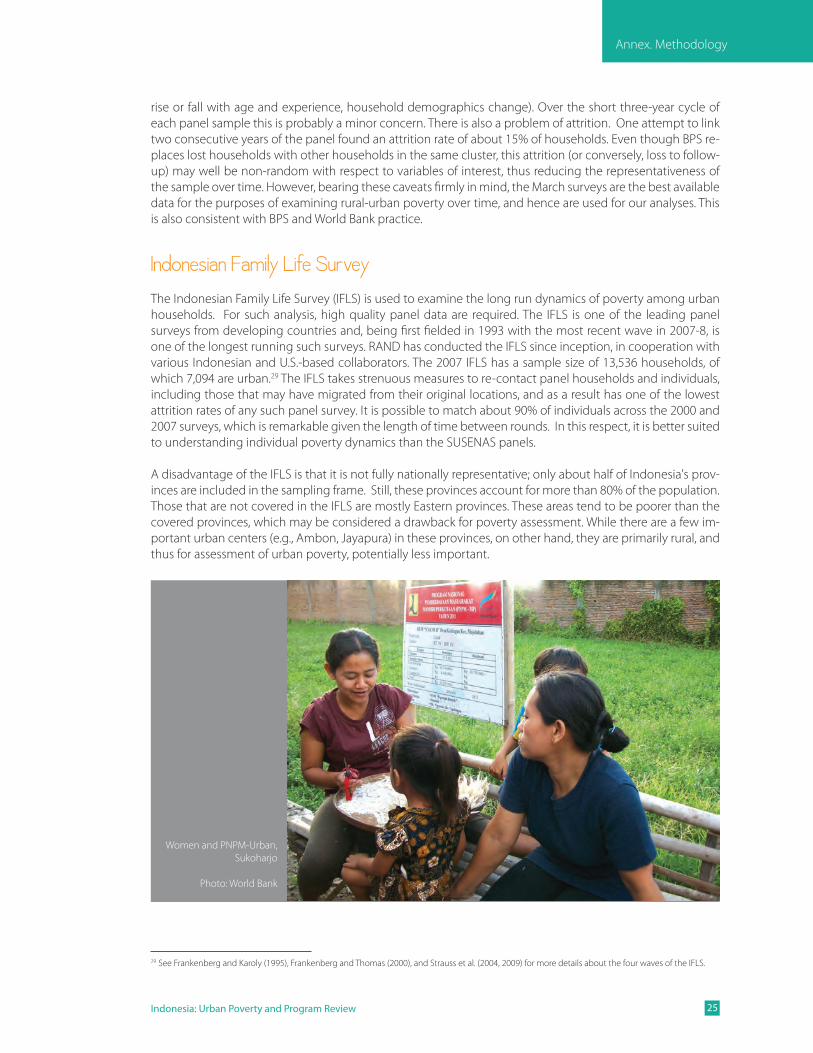
Indonesia: Urban Poverty and Program Review 25
rise or fall with age and experience, household demographics change). Over the short three-year cycle of each panel sample this is probably a minor concern. There is also a problem of attrition. One attempt to link two consecutive years of the panel found an attrition rate of about 15% of households. Even though BPS re-places lost households with other households in the same cluster, this attrition (or conversely, loss to follow-up) may well be non-random with respect to variables of interest, thus reducing the representativeness of the sample over time. However, bearing these caveats firmly in mind, the March surveys are the best available data for the purposes of examining rural-urban poverty over time, and hence are used for our analyses. This is also consistent with BPS and World Bank practice.
Indonesian Family Life SurveyThe Indonesian Family Life Survey (IFLS) is used to examine the long run dynamics of poverty among urban households. For such analysis, high quality panel data are required. The IFLS is one of the leading panel surveys from developing countries and, being first fielded in 1993 with the most recent wave in 2007-8, is one of the longest running such surveys. RAND has conducted the IFLS since inception, in cooperation with various Indonesian and U.S.-based collaborators. The 2007 IFLS has a sample size of 13,536 households, of which 7,094 are urban.29 The IFLS takes strenuous measures to re-contact panel households and individuals, including those that may have migrated from their original locations, and as a result has one of the lowest attrition rates of any such panel survey. It is possible to match about 90% of individuals across the 2000 and 2007 surveys, which is remarkable given the length of time between rounds. In this respect, it is better suited to understanding individual poverty dynamics than the SUSENAS panels.
A disadvantage of the IFLS is that it is not fully nationally representative; only about half of Indonesia's prov-inces are included in the sampling frame. Still, these provinces account for more than 80% of the population. Those that are not covered in the IFLS are mostly Eastern provinces. These areas tend to be poorer than the covered provinces, which may be considered a drawback for poverty assessment. While there are a few im-portant urban centers (e.g., Ambon, Jayapura) in these provinces, on other hand, they are primarily rural, and thus for assessment of urban poverty, potentially less important.
29 See Frankenberg and Karoly (1995), Frankenberg and Thomas (2000), and Strauss et al. (2004, 2009) for more details about the four waves of the IFLS.
Women and PNPM-Urban, Sukoharjo
Photo: World Bank
Annex. Methodology

Policy Note26
A2. Qualitative Analysis of Urban PovertyTo complement the quantitative poverty profile, a qualitative study of the urban poor in a number of locations across Indonesia is also carried out. The field work for the qualitative poverty analysis was conducted in tandem with the PPNP Urban process evaluation discussed in The work was carried out in collaboration with Survey Meter, a research and survey firm based in Yogyakarta, and the Indonesian partner implementing the IFLS.
Site Selection There are many potential criteria for choosing sites but several were key, namely to have broad geographical representation as well as variation in the level of poverty. Further, for the PNPM evaluation, it was desired to include several sites that participated in the pilot for the Neighborhood Development (ND) project commu-nities. 13 ‘non-ND’ kelurahan or urban wards were chosen from the sample of urban communities in the In-donesian Family Life Survey.30 Sampling from the IFLS sites made it possible to stratify on community wealth (reliable kelurahan-level data on poverty was otherwise difficult to obtain.) Given the coverage of the IFLS, the sample of communities chosen is reasonably representative of urban communities across the country.31
Regional stratification was performed based on discussions with the World Bank team in the U.S. and PNPM-Urban specialists at the World Bank in Jakarta, as well as other experts. The division of the 13 non-ND urban kelurahan by region was as follows: 3 from West Java, 3 from East Java, 3 from Central Java, including two field test sites in Yogyakarta and one from the province of Central Java, 2 from North Sumatra, and 2 from South Sulawesi. This distribution was chosen so as to achieve an appropriate geographical representation, based both on urban population and on the allocation of PNPM-Urban funds across regions.
30 We are grateful to John Strauss and Bondan Sikoki, PIs of the IFLS, for allowing us to sample from the IFLS community lists and providing access to the kelurahan IDs for this purpose.
31 We noted earlier that the IFLS does not cover all provinces. However, the small sample size as well as logistical considerations in any case prevented sampling in all provinces for this data collection activity
Kelurahan Kabupaten/Kota Province Wealthindex
Triharjo KulonProgo D.I.Yogyakarta High
Karo PematangSiantar NorthSumatra High
CengkarengTimur JakartaBarat Jakarta High
Tambakrejo Surabaya EastJava High
PancuranGerobak Sibolga NorthSumatra Moderate
Astana Cirebon WestJava Moderate
Kauman Surakarta CentralJava Moderate
Lirboyo Kediri EastJava Moderate
Antang UjungPandang SouthSulawesi Moderate
Ngestiharjo KulonProgo D.I.Yogyakarta Low
Wiroborang Probolinggo EastJava Low
Rantepao TanaToraja SouthSulawesi Low
HuluBantengLor Cirebon WestJava Low
ANNEX TABLE 1: LOCATIONS OF STUDY SITES

Indonesia: Urban Poverty and Program Review 27
To stratify on wealth within these regions, a community wealth index was created from the IFLS community survey32. To choose the West and East Java sites, kelurahan were categorized into three levels of wealth based on the value of this index: less than or equal to the 33rd percentile of the national distribution of the index for all urban kelurahan in the IFLS (i.e., ‘poor’); between the 33rd and 66th percentiles (`moderate’); and above the 66th percentile (‘wealthy’). One kelurahan was then randomly selected from each category in West Java, and one for each category in East Java. For Sulawesi and North Sumatra, from which two sites each were selected, a similar procedure was carried out that selected one kelurahan from below and one from above the 50th percentile of the wealth index (`wealthy’). In Central Java, one site was randomly included. Replacement sites were also chosen randomly within each region/wealth stratum.33
The site selection process ensured variation in wealth and geographic location, but the selected sites also varied along other dimensions. Although all kelurahan that participate in PNPM-Urban are designated of-ficially as urban environments, the degree of urbanicity varies substantially. For example, Cengkareng Timur in Jakarta is a highly urban environment with features typical of a large city: compact multi-story housing, a substantial commercial sector, and high population density. In contrast, other sites were less urban. Pancuran Gerobak is a hillside kelurahan in a relatively small coastal city while Karo, is a low-density urban neighbor-hood at the edge of a relatively large inland city. Some kelurahan even appear rural: Triharjo, in particular, has low population density, a substantial agriculture sector, many unpaved roads, and few shared basic services (e.g., toilets, springs for washing/bathing). The other kelurahan we selected in Kulon Progo is also relatively ‘rural’, although it is less agrarian and has a somewhat higher density of homes.
Two kelurahan within the kabupaten of Cirebon in West Java exemplify the diversity of areas where PNPM-Urban operates. Hulu Bateng Lor is a mainly agricultural area on the edges of the kabupaten while Astana is very close to the center of the city. Despite being on the outskirts of a large city, Hulu Bateng Lor retains a small-village, rural feel. Although some residents travel to work in the city, most of the economic activity re-volves around agriculture. Astana, though close in to the city center, does not have the density of other urban areas. Most families live in houses (single-story) rather than in multi-story buildings, and there are small canals next to sidewalks, so cars do not pass next to most houses. However, the edge of the kelurahan yields directly onto one of the busiest avenues of the city of Cirebon. Although some residents work within the kelurahan (primarily attending small shops), most of them work all around the city.
In East Java, the three selected sites showed strong variation in degrees of urbanicity and in differences between the poor and non-poor. In Probolinggo, Wiroborang has a moderately dense urban population living in small, single-family homes, many of which were rented, and some proximate heterogeneity among poor and non-poor households. Tambakrejo, Surabaya, showed a strong contrast between the poor and non-poor: the non-poor live in a low density urban neighborhood characterized by multi-story, single-family houses on wide, well-drained streets, many with cars parked inside the gate; many of the poor squat on rail-road company land alongside the tracks in high density slums with limited basic services. Lirboyo, Kediri, is a large peri-urban area characterized by low population density, mixture of agriculture and small businesses. Roads are generally paved but there are few shared basic services beyond electricity.
In South Sulawesi, the sites showed dramatic differences in levels of urbanicity. Antang, Ujung Pandang, is a highly urban environment with a mix of poor and near-poor living in moderately dense conditions (small, single family homes built up against one another) with limited basic services. In contrast, Rantepao, Tanah Toraja, is a peri-urban/rural area with low population density, a mixture of agriculture and small businesses, and few shared basic services beyond electricity.
32 The index is based on the following variables from the IFLS community survey: an indicator of whether the predominant road type in the kelurahan is ce-ment/asphalt, the percentage of homes with electricity, an indicator of whether there is a sewage system in place, the percentage of homes that receive water from a pipe, and the share of households receiving the rice ration. These variables were standardized and summed to create the index.
33 The selection process itself worked in the following way: within each combined region/wealth stratum, we assigned a random number to each kelurahan and then ranked the kelurahan in the stratum by that number. The site with the highest number in each was selected. The site with the second highest was chosen as a “replacement” site.
Annex. Methodology

Policy Note28
Finally, in consultation with World Bank Jakarta staff, three more sites were chosen from the Neighborhood Development pilot sites with the objective of having a subsample with a range of experience (relative suc-cess) of the program. Two sites were in Central Java and one in West Java. All of the sites were within medium or large-sized cities, including a kelurahan within Bandung, one of the three largest cities in Indonesia.
Qualitative MethodologyIn each community a rapid survey of poor households was conducted in conjunction with a uniform screen-ing procedure designed to recruit the appropriate participants for the focus groups and in depth interviews. The primary criterion for respondent selection for both this study and a second set of PNPM-oriented focus groups conducted during the same site visits was that individuals be from poor households. The selection of households for the screening was based on the communities’ lists of poor households developed as part of the PNPM-Urban implementation. Separate groups of participants for focus groups and interviews were recruited for the PNPM study and the poverty study. In each community there was a poverty focus group for men and one for women, in addition to one in depth interview.
The focus group and in depth interview protocols for the poverty analysis were designed to address the fol-lowing areas:
• Respondents’ perceptions of their own poverty and its causes, and barriers to moving out of poverty; • Strategies for coping with inadequate resources (both permanent and temporary shortfalls); • Differences in the causes and impacts of poverty for men and women• Perceived needs, including forms of government assistance.• Participation in and perceptions of assistance programs (including efficiency, fairness, value of benefits,
convenience, corruption, etc.)
Protocols as well as the screening procedure were extensively revised based on the findings of pilot test-ing. Note-takers for the focus groups and interviews later expanded their notes using a prepared form with the help of audio recordings. These detailed notes were input directly on laptops and subsequently were translated by SurveyMeter and sent to RAND. The coding team at RAND used the text management software Atlas.ti to code the transcripts along the key themes outlined above. The output of this process was used for the analysis. Further details of the field work procedures and data analysis can be found in Burger et al (2011).


THE WORLD BANK