Public Disclosure Authorized EX-ACT - The World...
15
EX-ACT QUICK GUIDANCE FOR USERS Estimating and Targeting Greenhouse Gas Mitigation in Agriculture Public Disclosure Authorized Public Disclosure Authorized Public Disclosure Authorized Public Disclosure Authorized
-
Upload
nguyenliem -
Category
Documents
-
view
239 -
download
3
Transcript of Public Disclosure Authorized EX-ACT - The World...
EX-ACT QUICK GUIDANCE FOR USERS
Estimating and Targeting
Greenhouse Gas Mitigation in
Agriculture
Pub
lic D
iscl
osur
e A
utho
rized
Pub
lic D
iscl
osur
e A
utho
rized
Pub
lic D
iscl
osur
e A
utho
rized
Pub
lic D
iscl
osur
e A
utho
rized
Abstract
As part of the new World Bank Group Environment Strategy (2012), all World Bank (WB) investment projects must undertake Greenhouse Gas (GHG) emissions accounting (‘carbon footprinting’) starting in fiscal year FY14 (July 2013). The EX-ACT tool will be the primary tool for GHG emissions accounting in the agriculture sector.
EX-ACT is a land-based accounting system, estimating carbon (C) stock changes (i.e. emissions or sinks of CO2) as well as GHG emissions per unit of land, expressed in equivalent tonnes of CO2 per hectare and year. EX-ACT can be applied to a wide range of development projects from all AFOLU sub-sectors, including projects involving climate change mitigation, livestock, forest management, land use change watershed development, intensification of production systems, and food security. EX-ACT helps project designers to estimate and prioritize project activities with high benefits in economic and climate change mitigation terms.
This Quick Guidance on EX-ACT provides an overview and explanation of methodology, results and data needs for the application and final use of the Ex-Ante Carbon-balance Tool (EX-ACT). It complements the more comprehensive EX-ACT User Manual and it is targeted at leading World Bank users to proficiency in the independent use of the tool.
EX-ACT Website: www.fao.org/tc/exact
Free Tool Access: www.fao.org/tc/exact/carbon-balance-tool-ex-act
EX-ACT User Manual & EX-ACT Quick Guidance: www.fao.org/tc/exact/user-guidelines
Table of Contents
Abstract: .......................................................................................................................................................................... 1
1) Overview .................................................................................................................................................................... 3
2) The Ex-Ante Carbon-balance Tool ....................................................................................................................... 3
A. What is EX-ACT? ....................................................................................................................................... 3
B. Targeted users .............................................................................................................................................. 3
C. Basic structure of EX-ACT ....................................................................................................................... 3
D. Scenario building ......................................................................................................................................... 4
3) EX-ACT results ........................................................................................................................................................ 5
A. Interpreting results ...................................................................................................................................... 5
B. Utilizing results ............................................................................................................................................ 7
4) EX-ACT data needs ................................................................................................................................................. 8
A. Selecting which modules are relevant for a proposed project ............................................................. 8
B. Overview of data needs .............................................................................................................................. 9
5) Building the baseline scenario ............................................................................................................................... 11
6) Brief guide to data entry ........................................................................................................................................ 11
A. Where to download, how to start ........................................................................................................... 11
B. Navigation bar ........................................................................................................................................... 11
C. EX-ACT color codes ................................................................................................................................ 12
D. Description module .................................................................................................................................. 12
E. Data entry in the topic modules ............................................................................................................. 13
1) Overview1
In November 2012, a group of international financial institutions, including the World Bank, agreed to a harmonized approach to project-level GHG accounting that follows established methodologies that are consistent with international best practice. The World Bank’s Environment Strategy includes GHG accounting as a means to inform the institution with a clearer and more complete understanding of the impacts its lending portfolio have on GHG emissions. The Strategy, which was endorsed by the Board in spring of 2012, prescribed that GHG accounting be introduced beginning during the period from FY14 to FY16. The Ex-Ante Carbon-balance Tool (EX-ACT) will be the primary instrument for GHG emissions accounting in the agriculture sector.
This document provides a how-to-use reference for EX-ACT users. It is divided into 8 sections, including this overview. Section 2 briefly explains the essentials of EX-ACT. Section 3 provides the main results of EX-ACT and shows how to utilize them as part of the project document design process and to prioritize selected investment decisions. Section 4 discusses the advantages of engaging in a carbon-balance appraisal and how using EX-ACT serves this purpose. Section 5 describes the methodological background of EX-ACT. Section 6 describes the Tool’s data requirements. Section 7 explains the steps of scenario building. Section 8 is a short guide on data entry for task team leaders.
2) The Ex-Ante Carbon-balance Tool
A. What is EX-ACT?
The EX-Ante Carbon-balance Tool (EX-ACT) is a land-based accounting system used to measure and to project changes to the carbon balance over time. This carbon balance, or “carbon footprint,” refers to the amount of carbon released into the atmosphere through emissions, relative to the amount of carbon stored in the soil and plant material of an area, and relative to the carbon that soil and plant material is actively removing or “sequestering” from the atmosphere. Emissions of GHGs, which differ dramatically in the intensity of their effects on the atmosphere, are measured in terms of carbon dioxide-equivalence. The measurements are expressed in terms of tons of carbon dioxide-equivalent per hectare over a period of one year (a volume that is ordinarily abbreviated to “tCO2-e”). In addition to spatial, area-based measurement, EX-ACT can also be used to measure changes to the carbon balance per unit of produce. Ex-ante estimations of how this balance will change as the result of human activities associated with land use change in development projects are particularly valuable in sectors that use a great deal of land, such as agriculture, forestry, pastoral livestock, watershed management, and of course climate change adaptation and mitigation. EX-ACT is cost-effective to use, requires a relatively small amount of data, and offers a variety of resources that users can refer to in finding information they need. While EX-ACT was principally designed for use at the project level, it is readily scalable to program and sector-wide levels, and can be used for policy analysis.
B. Targeted users
The primary use of EX-ACT is in the area of project design. Development practitioners at the World Bank who need to estimate the GHG-balance of investment proposals in the agriculture, forestry and land use sector are therefore the principal intended audience. The main target users should be involved during the project design stage and pursue the objective of aligning ex-ante programme and project documents in accordance with the results obtained from the EX-ACT appraisal.
C. Basic structure of EX-ACT
EX-ACT consists of a set of six linked modules, which are Microsoft Excel spreadsheets covering different activity areas of the agriculture, forestry, and other land use sectors. They allow users to specify
1 For more detailed information, a glossary of terms and the complete bibliography, please refer to the EX-ACT User Manual.
information concerning a few geographical, climatic, and agro-ecological variables and a wider set of information regarding land-use change activities and agricultural management practices. The modules in EX-ACT are:
1. General description of the project (geographic area, climate and soil characteristics, duration of the project);
2. Land use change
(deforestation, afforestation/reforestation, non-forest LUC)
3. Crop production and management (agronomic practices, tillage practices, water & nutrient management, manure application)
4. Grassland and livestock
(grassland management practices, livestock feeding practices)
5. Land degradation (forest degradation, drainage of organic soils, peat extraction)
6. Inputs and further investments (fertilizer and agro-chemical use, fuel consumption, electricity use)
The wide coverage of these six topic modules enables EX-ACT to analyse a wide range of agricultural and forestry development projects, such as:
- Livestock development - Crop production intensification - Rural development - Food security - Climate change mitigation (forestry,
etc.)
- Forest protection and management - Watershed development - Land rehabilitation - Bio-energy
Depending on the specific project, data collection and model completion is only necessary in the modules relevant to the project. The main data needs occur only in the focal areas of the project. Rather than choosing modules according to project type, the modules are chosen in regards to project impacts i.e. what is affected by the project.
This flexibility allows for the adequate consideration of multi-segment projects and leads the project designer to think of possible indirect impacts on in-directly impacted areas, e.g. increased pressure for deforestation or grassland degradation.
D. Scenario building
Scenario building enables designers to make projections about the impacts that a prospective project or intervention is most likely to have, and to compare this With-Project Scenario to the alternative business-as-usual Without-Project Scenario in which the project never took place. This ex-ante evaluation of two alternative theoretical scenarios requires data on a real-world baseline situation – something which is very familiar to ex-ante economic analysis in general.
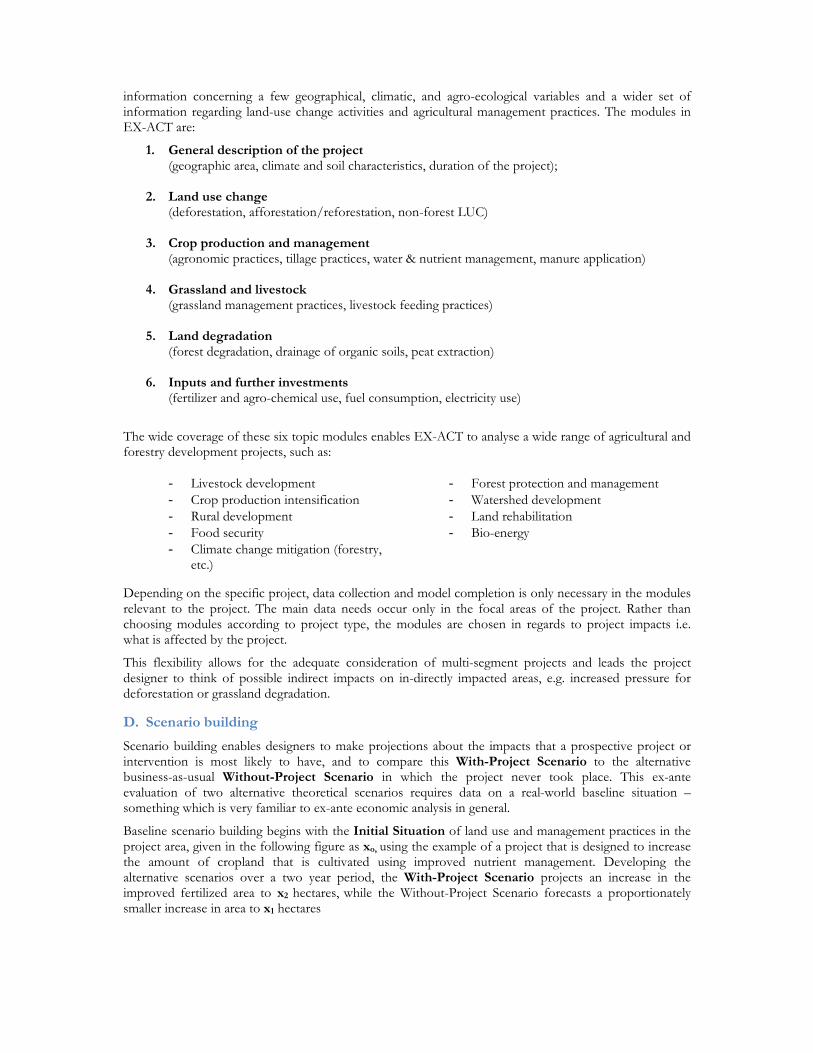
Baseline scenario building begins with the Initial Situation of land use and management practices in the project area, given in the following figure as xo, using the example of a project that is designed to increase the amount of cropland that is cultivated using improved nutrient management. Developing the alternative scenarios over a two year period, the With-Project Scenario projects an increase in the improved fertilized area to x2 hectares, while the Without-Project Scenario forecasts a proportionately smaller increase in area to x1 hectares
Building development scenarios for the use in EX-ACT
EX-ACT differentiates between two time periods. The implementation phase defines the time period in which active project activities are carried out and lasts from t0 until t1. Thereby the period covered by the analysis does not necessarily end with the termination of the active project intervention. Even after the point that a new equilibrium in land use and practices is reached in t1 further changes may occur, for instance changes in soil carbon content or in biomass, that are extended results of the intervention following the lifespan of the intervention itself. This period defines the capitalization phase which lasts from t1 until t2.
The difference in activity data between With- and Without-Project scenarios serves then later as the input data for calculating the carbon-balance of the project.
Some practical principles for the easy use of EX-ACT
Only modules that are directly impacted by project activities have to be filled
Sophisticated main data needs occur only in the focal areas of the project
It is normal that many data entry cells will not be used
Information is entered on changes occurring With-Project vis-a-vis Without-Project situation.
3) EX-ACT results
A. Interpreting results
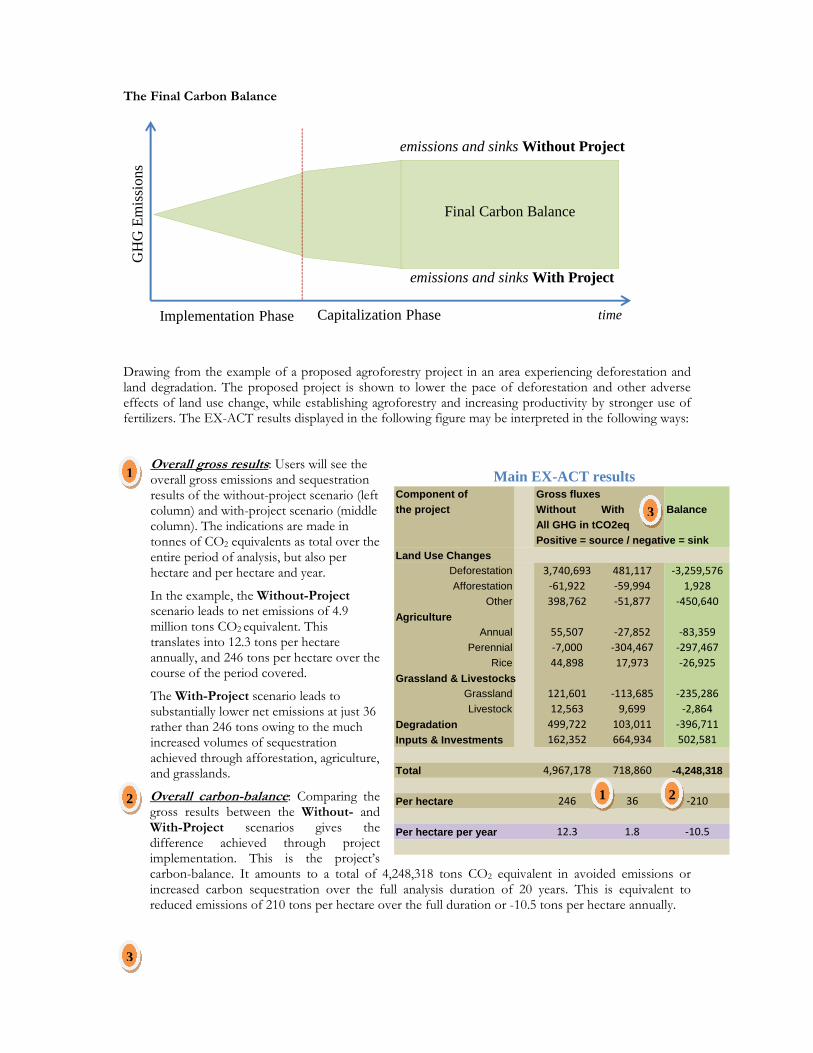
The specific agro-ecological conditions and activity data in all of the EX-ACT modules lead to the calculation of GHG emissions and carbon stock changes. The comparison of the net emissions from With-Project and Without-Project scenarios constitutes the marginal difference in GHG emissions and carbon sequestration due to project implementation which defines the overall carbon balance.
Main EX-ACT results Component of Gross fluxes
the project Without With Balance
All GHG in tCO2eq
Positive = source / negative = sink
Land Use Changes
Deforestation 3,740,693 481,117 ‐3,259,576
Afforestation ‐61,922 ‐59,994 1,928
Other 398,762 ‐51,877 ‐450,640
Agriculture
Annual 55,507 ‐27,852 ‐83,359
Perennial ‐7,000 ‐304,467 ‐297,467
Rice 44,898 17,973 ‐26,925
Grassland & Livestocks
Grassland 121,601 ‐113,685 ‐235,286
Livestock 12,563 9,699 ‐2,864
Degradation 499,722 103,011 ‐396,711
Inputs & Investments 162,352 664,934 502,581
Total 4,967,178 718,860 -4,248,318
Per hectare 246 36 ‐210
Per hectare per year 12.3 1.8 ‐10.5
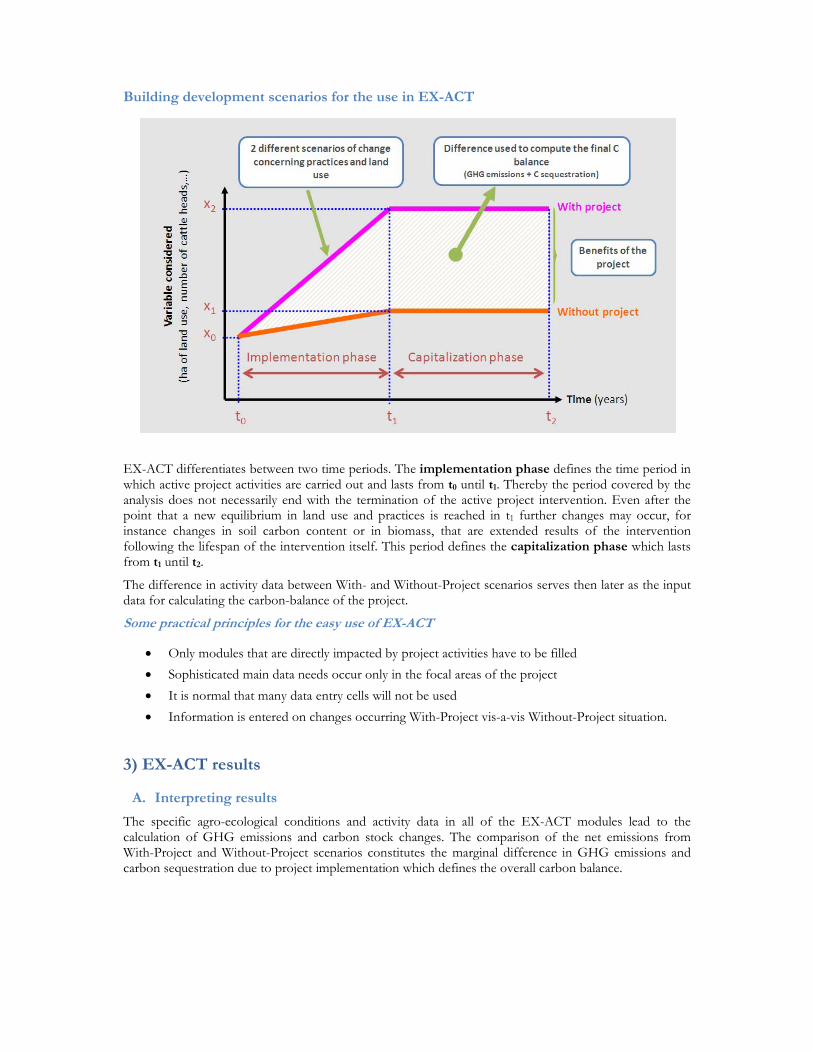
The Final Carbon Balance
Drawing from the example of a proposed agroforestry project in an area experiencing deforestation and land degradation. The proposed project is shown to lower the pace of deforestation and other adverse effects of land use change, while establishing agroforestry and increasing productivity by stronger use of fertilizers. The EX-ACT results displayed in the following figure may be interpreted in the following ways:
Overall gross results: Users will see the overall gross emissions and sequestration results of the without-project scenario (left column) and with-project scenario (middle column). The indications are made in tonnes of CO2 equivalents as total over the entire period of analysis, but also per hectare and per hectare and year.
In the example, the Without-Project scenario leads to net emissions of 4.9 million tons CO2 equivalent. This translates into 12.3 tons per hectare annually, and 246 tons per hectare over the course of the period covered.
The With-Project scenario leads to substantially lower net emissions at just 36 rather than 246 tons owing to the much increased volumes of sequestration achieved through afforestation, agriculture, and grasslands.
Overall carbon-balance: Comparing the gross results between the Without- and With-Project scenarios gives the difference achieved through project implementation. This is the project’s carbon-balance. It amounts to a total of 4,248,318 tons CO2 equivalent in avoided emissions or increased carbon sequestration over the full analysis duration of 20 years. This is equivalent to reduced emissions of 210 tons per hectare over the full duration or -10.5 tons per hectare annually.
Implementation Phase Capitalization Phase
Final Carbon Balance
GH
G E
mis
sion
semissions and sinks Without Project
emissions and sinks With Project
time
1
2
3
3
21
Gross results and carbon-balance by module: Differentiating the gross emissions effects of the With- and Without-Project scenarios identifies the components that lead to the greatest impacts: the most important sources of emissions and the most important sources of sequestration or “sinks.”
In this example, the establishment of perennial crop land and the rehabilitation of degraded grassland are the largest sinks, sequestering 304,467 tons and 113,685 tons carbon equivalent respectively. The leading sources of emissions become the use of fertilizers and other inputs at 664,934 tons carbon equivalent and the still ongoing deforestation at 481,117 tons. The largest impact achieved in this With-Project scenario is attributable to the projected reduction in the rate of deforestation, which in turn reduces the rate of net emissions by 3,259,576 tons carbon equivalent. This component alone accounts for 75 percent of the project’s carbon impact. This is followed by the project’s non-forest land use change activities (-450,640 tCO2e), and the rehabilitation of degraded land (-396,711 tCO2e).
B. Utilizing results
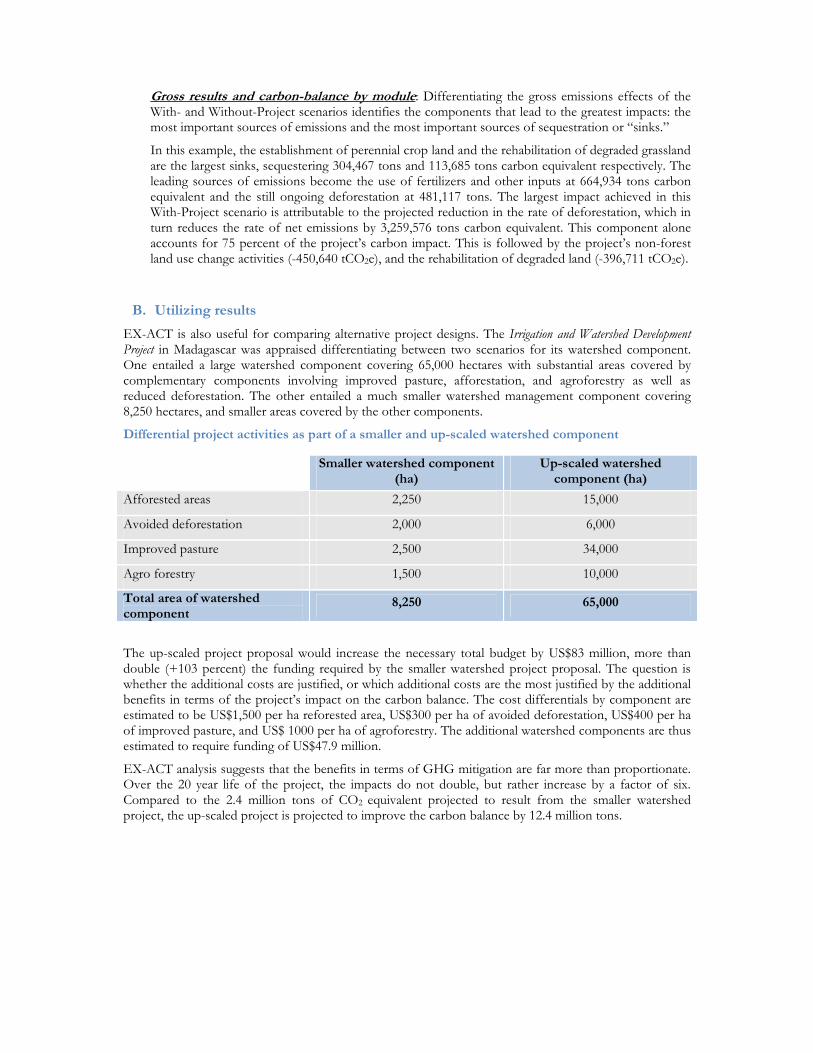
EX-ACT is also useful for comparing alternative project designs. The Irrigation and Watershed Development Project in Madagascar was appraised differentiating between two scenarios for its watershed component. One entailed a large watershed component covering 65,000 hectares with substantial areas covered by complementary components involving improved pasture, afforestation, and agroforestry as well as reduced deforestation. The other entailed a much smaller watershed management component covering 8,250 hectares, and smaller areas covered by the other components.
Differential project activities as part of a smaller and up-scaled watershed component
Smaller watershed component (ha)
Up-scaled watershed component (ha)
Afforested areas 2,250 15,000
Avoided deforestation 2,000 6,000
Improved pasture 2,500 34,000
Agro forestry 1,500 10,000
Total area of watershed component
8,250 65,000
The up-scaled project proposal would increase the necessary total budget by US$83 million, more than double (+103 percent) the funding required by the smaller watershed project proposal. The question is whether the additional costs are justified, or which additional costs are the most justified by the additional benefits in terms of the project’s impact on the carbon balance. The cost differentials by component are estimated to be US$1,500 per ha reforested area, US$300 per ha of avoided deforestation, US$400 per ha of improved pasture, and US$ 1000 per ha of agroforestry. The additional watershed components are thus estimated to require funding of US$47.9 million.
EX-ACT analysis suggests that the benefits in terms of GHG mitigation are far more than proportionate. Over the 20 year life of the project, the impacts do not double, but rather increase by a factor of six. Compared to the 2.4 million tons of CO2 equivalent projected to result from the smaller watershed project, the up-scaled project is projected to improve the carbon balance by 12.4 million tons.
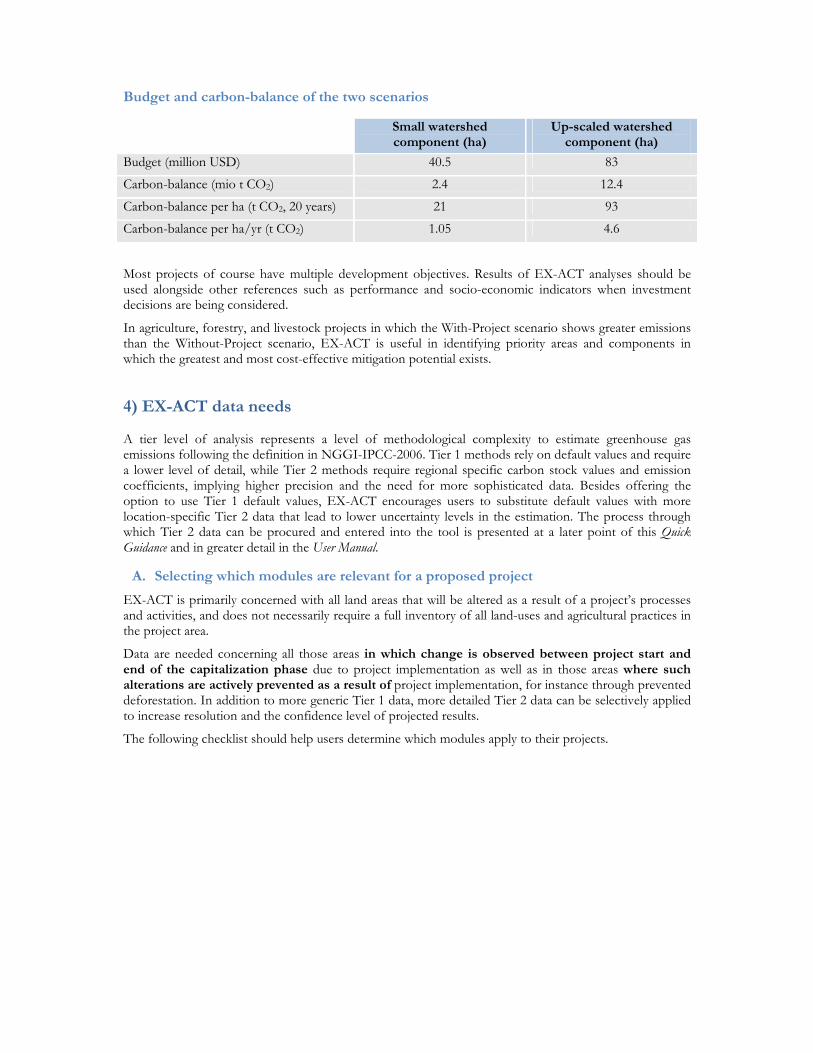
Budget and carbon-balance of the two scenarios
Small watershed component (ha)
Up-scaled watershed component (ha)
Budget (million USD) 40.5 83
Carbon-balance (mio t CO2) 2.4 12.4
Carbon-balance per ha (t CO2, 20 years) 21 93
Carbon-balance per ha/yr (t CO2) 1.05 4.6
Most projects of course have multiple development objectives. Results of EX-ACT analyses should be used alongside other references such as performance and socio-economic indicators when investment decisions are being considered.
In agriculture, forestry, and livestock projects in which the With-Project scenario shows greater emissions than the Without-Project scenario, EX-ACT is useful in identifying priority areas and components in which the greatest and most cost-effective mitigation potential exists.
4) EX-ACT data needs
A tier level of analysis represents a level of methodological complexity to estimate greenhouse gas emissions following the definition in NGGI-IPCC-2006. Tier 1 methods rely on default values and require a lower level of detail, while Tier 2 methods require regional specific carbon stock values and emission coefficients, implying higher precision and the need for more sophisticated data. Besides offering the option to use Tier 1 default values, EX-ACT encourages users to substitute default values with more location-specific Tier 2 data that lead to lower uncertainty levels in the estimation. The process through which Tier 2 data can be procured and entered into the tool is presented at a later point of this Quick Guidance and in greater detail in the User Manual.
A. Selecting which modules are relevant for a proposed project
EX-ACT is primarily concerned with all land areas that will be altered as a result of a project’s processes and activities, and does not necessarily require a full inventory of all land-uses and agricultural practices in the project area.
Data are needed concerning all those areas in which change is observed between project start and end of the capitalization phase due to project implementation as well as in those areas where such alterations are actively prevented as a result of project implementation, for instance through prevented deforestation. In addition to more generic Tier 1 data, more detailed Tier 2 data can be selectively applied to increase resolution and the confidence level of projected results.
The following checklist should help users determine which modules apply to their projects.
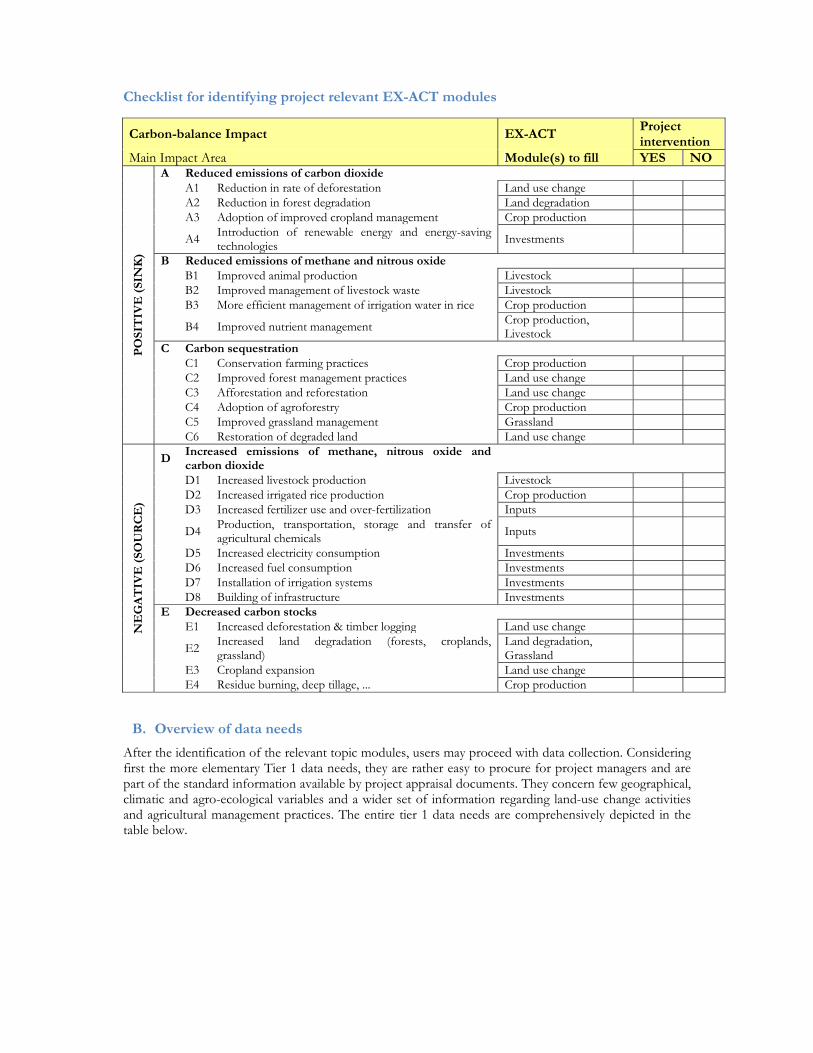
Checklist for identifying project relevant EX-ACT modules
Carbon-balance Impact EX-ACT Project intervention
Main Impact Area Module(s) to fill YES NO
PO
SIT
IVE
(SI
NK
)
A Reduced emissions of carbon dioxide A1 Reduction in rate of deforestation Land use change A2 Reduction in forest degradation Land degradation A3 Adoption of improved cropland management Crop production
A4 Introduction of renewable energy and energy-saving technologies
Investments
B Reduced emissions of methane and nitrous oxide B1 Improved animal production Livestock B2 Improved management of livestock waste Livestock B3 More efficient management of irrigation water in rice Crop production
B4 Improved nutrient management Crop production, Livestock
C Carbon sequestration C1 Conservation farming practices Crop production C2 Improved forest management practices Land use change C3 Afforestation and reforestation Land use change C4 Adoption of agroforestry Crop production C5 Improved grassland management Grassland C6 Restoration of degraded land Land use change
NE
GA
TIV
E (
SOU
RC
E)
D Increased emissions of methane, nitrous oxide and carbon dioxide
D1 Increased livestock production Livestock D2 Increased irrigated rice production Crop production D3 Increased fertilizer use and over-fertilization Inputs
D4 Production, transportation, storage and transfer of agricultural chemicals Inputs
D5 Increased electricity consumption Investments D6 Increased fuel consumption Investments D7 Installation of irrigation systems Investments D8 Building of infrastructure Investments E Decreased carbon stocks E1 Increased deforestation & timber logging Land use change
E2 Increased land degradation (forests, croplands, grassland)
Land degradation, Grassland
E3 Cropland expansion Land use change E4 Residue burning, deep tillage, ... Crop production
B. Overview of data needs
After the identification of the relevant topic modules, users may proceed with data collection. Considering first the more elementary Tier 1 data needs, they are rather easy to procure for project managers and are part of the standard information available by project appraisal documents. They concern few geographical, climatic and agro-ecological variables and a wider set of information regarding land-use change activities and agricultural management practices. The entire tier 1 data needs are comprehensively depicted in the table below.
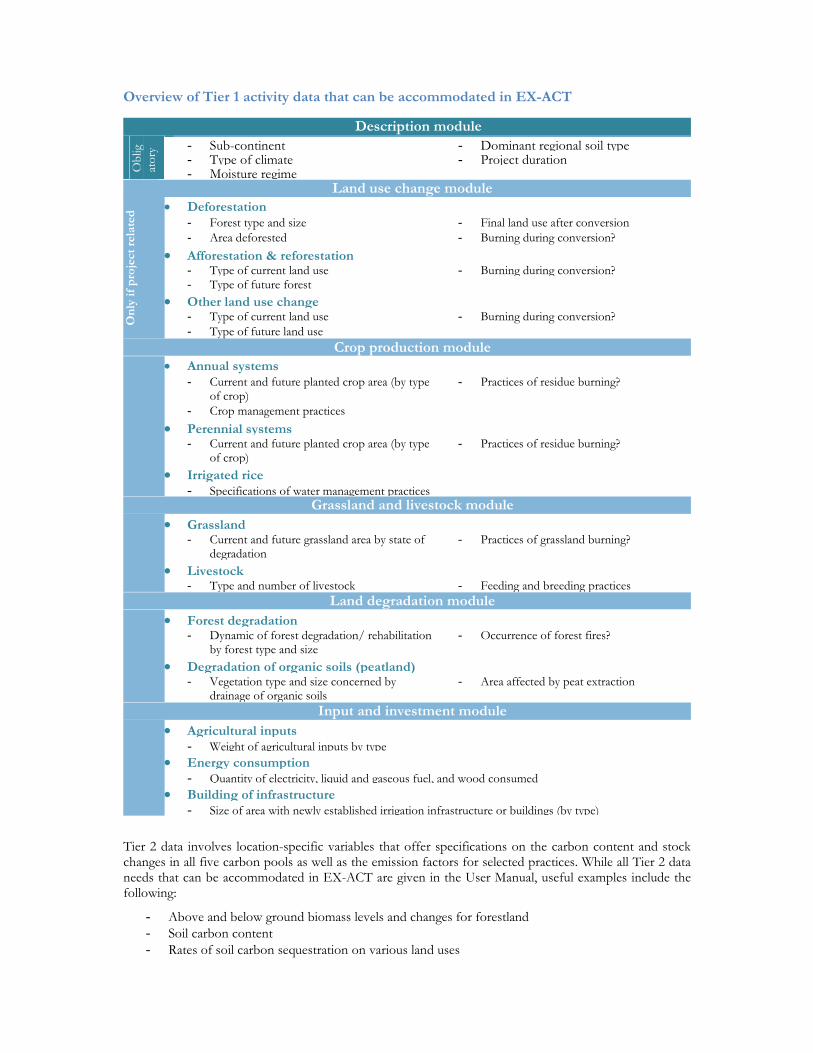
Overview of Tier 1 activity data that can be accommodated in EX-ACT
Description module O
blig
ator
y - Sub-continent - Dominant regional soil type - Type of climate - Project duration- Moisture regime
Land use change module
On
ly if
pro
ject
rel
ated
Deforestation - Forest type and size - Final land use after conversion - Area deforested - Burning during conversion?
Afforestation & reforestation- Type of current land use - Burning during conversion? - Type of future forest
Other land use change - Type of current land use - Burning during conversion? - Type of future land use
Crop production module
Annual systems - Current and future planted crop area (by type
of crop) - Practices of residue burning?
- Crop management practices
Perennial systems - Current and future planted crop area (by type
of crop) - Practices of residue burning?
Irrigated rice - Specifications of water management practices
Grassland and livestock module
Grassland - Current and future grassland area by state of
degradation - Practices of grassland burning?
Livestock - Type and number of livestock - Feeding and breeding practices
Land degradation module
Forest degradation - Dynamic of forest degradation/ rehabilitation
by forest type and size - Occurrence of forest fires?
Degradation of organic soils (peatland)- Vegetation type and size concerned by
drainage of organic soils- Area affected by peat extraction
Input and investment module
Agricultural inputs - Weight of agricultural inputs by type
Energy consumption - Quantity of electricity, liquid and gaseous fuel, and wood consumed
Building of infrastructure- Size of area with newly established irrigation infrastructure or buildings (by type)
Tier 2 data involves location-specific variables that offer specifications on the carbon content and stock changes in all five carbon pools as well as the emission factors for selected practices. While all Tier 2 data needs that can be accommodated in EX-ACT are given in the User Manual, useful examples include the following:
- Above and below ground biomass levels and changes for forestland - Soil carbon content - Rates of soil carbon sequestration on various land uses
- Amount of biomass burnt during land conversion and crop residue management - N2O and CH4 emissions from manure management - Emissions from enteric fermentation - Emissions associated to the construction of agricultural, road and building infrastructure
The collection of Tier 2 data is especially advised for core project components that are expected to be larger sources or sinks of GHGs. This logic may be understood as a good practice leading to a reasonable combination of Tier 2 and Tier 1 data. Data collection of Tier 2 variables is thereby often difficult and it will for this reason it will never be possible to collect Tier 2 information for all considered variables.
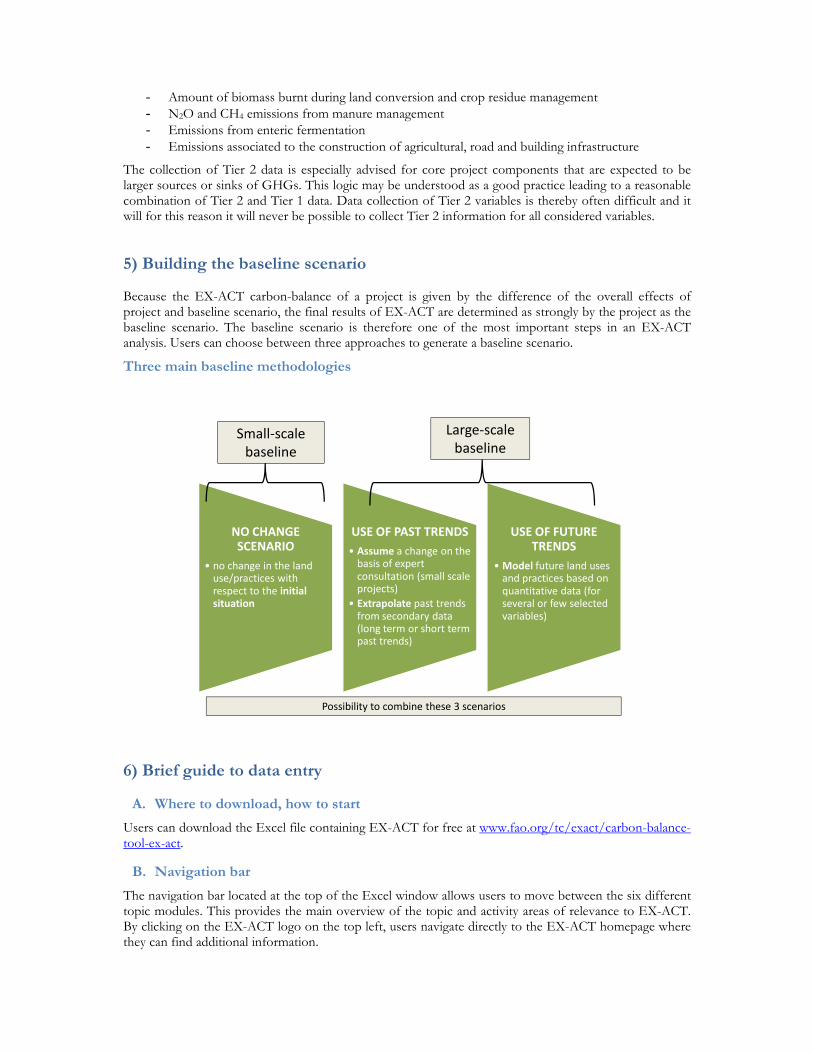
5) Building the baseline scenario
Because the EX-ACT carbon-balance of a project is given by the difference of the overall effects of project and baseline scenario, the final results of EX-ACT are determined as strongly by the project as the baseline scenario. The baseline scenario is therefore one of the most important steps in an EX-ACT analysis. Users can choose between three approaches to generate a baseline scenario.
Three main baseline methodologies
6) Brief guide to data entry
A. Where to download, how to start
Users can download the Excel file containing EX-ACT for free at www.fao.org/tc/exact/carbon-balance-tool-ex-act.
B. Navigation bar
The navigation bar located at the top of the Excel window allows users to move between the six different topic modules. This provides the main overview of the topic and activity areas of relevance to EX-ACT. By clicking on the EX-ACT logo on the top left, users navigate directly to the EX-ACT homepage where they can find additional information.
NO CHANGE SCENARIO
• no change in the land use/practices with respect to the initial situation
USE OF PAST TRENDS
• Assume a change on the basis of expert consultation (small scale projects)
• Extrapolate past trends from secondary data (long term or short term past trends)
USE OF FUTURE TRENDS
•Model future land uses and practices based on quantitative data (for several or few selected variables)
Small‐scale baseline
Large‐scale baseline
Possibility to combine these 3 scenarios
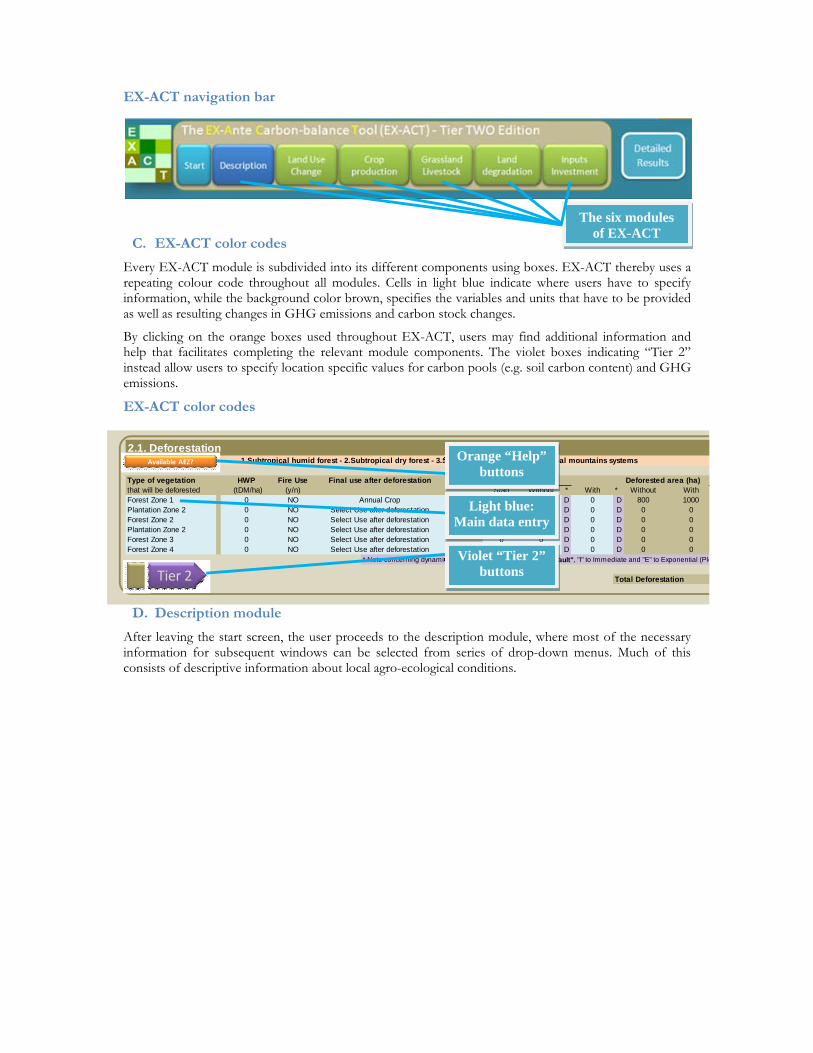
EX-ACT navigation bar
C. EX-ACT color codes
Every EX-ACT module is subdivided into its different components using boxes. EX-ACT thereby uses a repeating colour code throughout all modules. Cells in light blue indicate where users have to specify information, while the background color brown, specifies the variables and units that have to be provided as well as resulting changes in GHG emissions and carbon stock changes.
By clicking on the orange boxes used throughout EX-ACT, users may find additional information and help that facilitates completing the relevant module components. The violet boxes indicating “Tier 2” instead allow users to specify location specific values for carbon pools (e.g. soil carbon content) and GHG emissions.
EX-ACT color codes
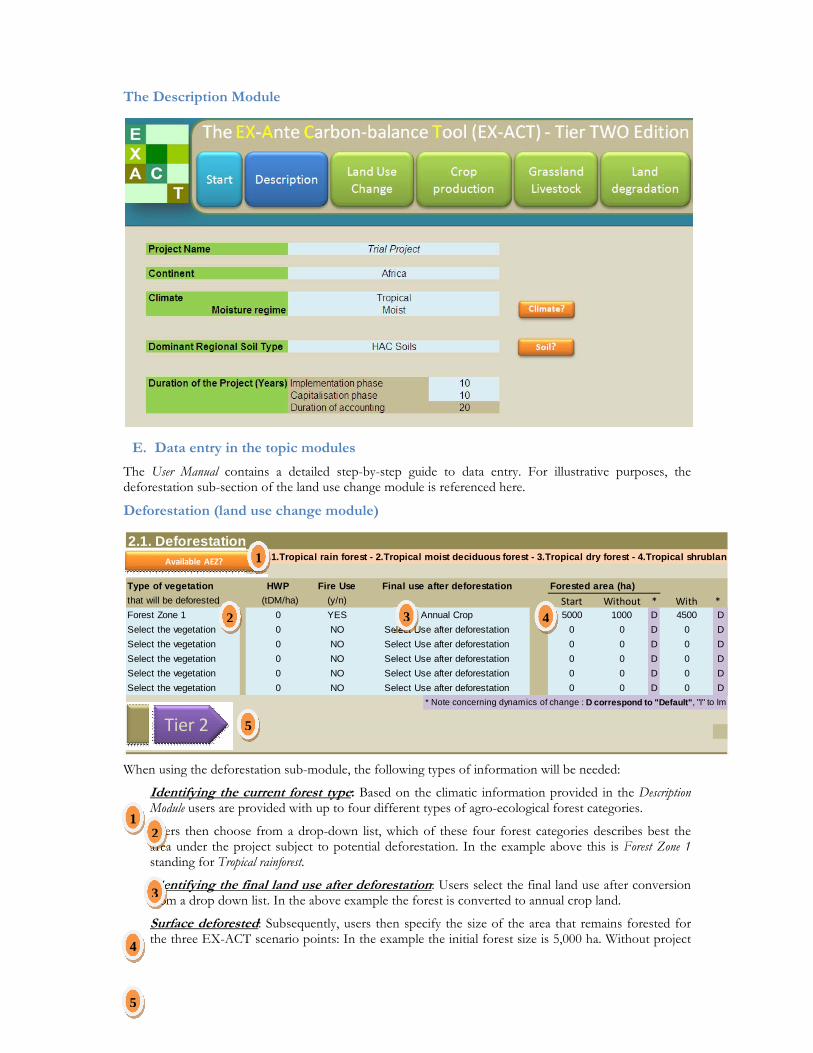
D. Description module
After leaving the start screen, the user proceeds to the description module, where most of the necessary information for subsequent windows can be selected from series of drop-down menus. Much of this consists of descriptive information about local agro-ecological conditions.
2.1. Deforestation 1.Subtropical humid forest - 2.Subtropical dry forest - 3.Subtropical steppe - 4.Subtropical mountains systems
Type of vegetation HWP Fire Use Forested area (ha) Deforested area (ha)that will be deforested (tDM/ha) (y/n) Start Without * With * Without WithForest Zone 1 0 NO 1000 200 D 0 D 800 1000Plantation Zone 2 0 NO 0 0 D 0 D 0 0Forest Zone 2 0 NO 0 0 D 0 D 0 0Plantation Zone 2 0 NO 0 0 D 0 D 0 0Forest Zone 3 0 NO 0 0 D 0 D 0 0Forest Zone 4 0 NO 0 0 D 0 D 0 0
* Note concerning dynamics of change : D correspond to "Default", "I" to Immediate and "E" to Exponential (Ple
Total Deforestation
Annual CropSelect Use after deforestationSelect Use after deforestation
Select Use after deforestation
Final use after deforestation
Select Use after deforestationSelect Use after deforestation
Available AEZ?
Tier 2
The six modules of EX-ACT
Orange “Help” buttons
Light blue: Main data entry
Violet “Tier 2” buttons
The Description Module
E. Data entry in the topic modules
The User Manual contains a detailed step-by-step guide to data entry. For illustrative purposes, the deforestation sub-section of the land use change module is referenced here.
Deforestation (land use change module)
When using the deforestation sub-module, the following types of information will be needed:
Identifying the current forest type: Based on the climatic information provided in the Description Module users are provided with up to four different types of agro-ecological forest categories.
Users then choose from a drop-down list, which of these four forest categories describes best the area under the project subject to potential deforestation. In the example above this is Forest Zone 1 standing for Tropical rainforest.
Identifying the final land use after deforestation: Users select the final land use after conversion from a drop down list. In the above example the forest is converted to annual crop land.
Surface deforested: Subsequently, users then specify the size of the area that remains forested for the three EX-ACT scenario points: In the example the initial forest size is 5,000 ha. Without project
2.1. Deforestation 1.Tropical rain forest - 2.Tropical moist deciduous forest - 3.Tropical dry forest - 4.Tropical shrubland
Type of vegetation HWP Fire Use Forested area (ha)
that will be deforested (tDM/ha) (y/n) Start Without * With *Forest Zone 1 0 YES 5000 1000 D 4500 D
Select the vegetation 0 NO 0 0 D 0 D
Select the vegetation 0 NO 0 0 D 0 D
Select the vegetation 0 NO 0 0 D 0 D
Select the vegetation 0 NO 0 0 D 0 D
Select the vegetation 0 NO 0 0 D 0 D
* Note concerning dynamics of change : D correspond to "Default", "I" to Imm
Select Use after deforestation
Select Use after deforestation
Final use after deforestation
Annual Crop
Select Use after deforestation
Select Use after deforestation
Select Use after deforestation
Available AEZ?
Tier 2
2
3
4
1
5
1
2 3 4
5
implementation it will diminish due to deforestation to a final size of 1,000 ha, while with project implementation still 4,500 ha will remain forestland.
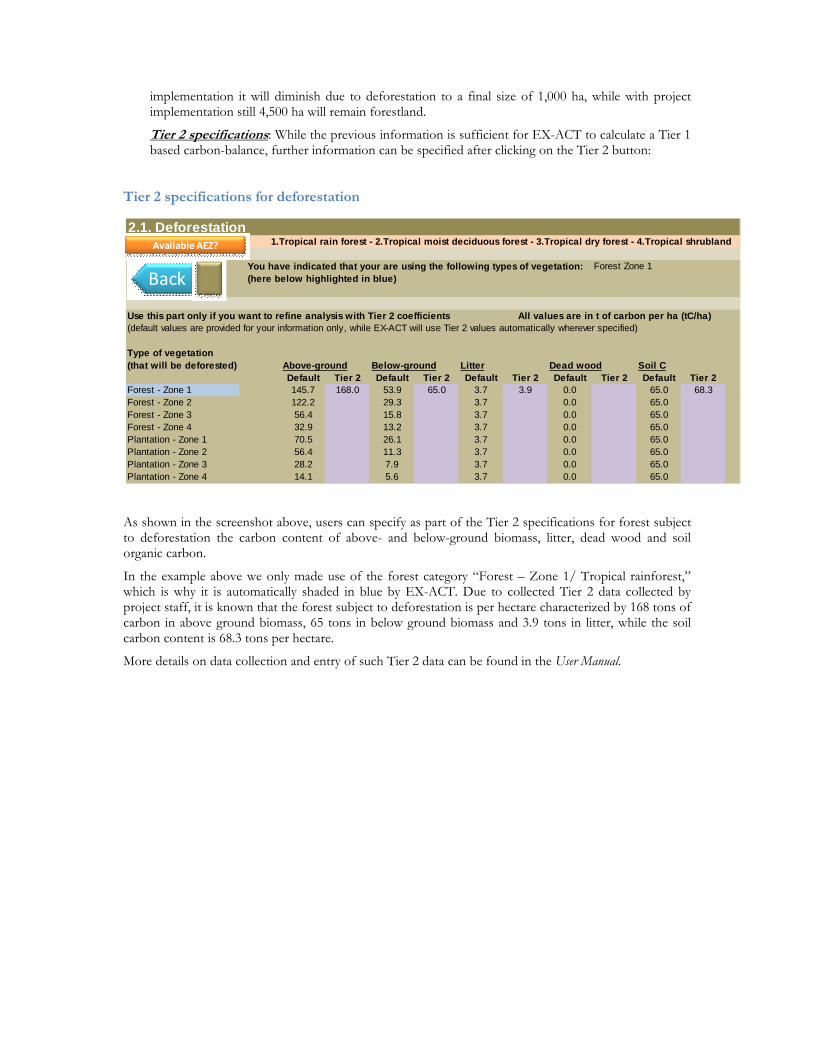
Tier 2 specifications: While the previous information is sufficient for EX-ACT to calculate a Tier 1 based carbon-balance, further information can be specified after clicking on the Tier 2 button:
Tier 2 specifications for deforestation
As shown in the screenshot above, users can specify as part of the Tier 2 specifications for forest subject to deforestation the carbon content of above- and below-ground biomass, litter, dead wood and soil organic carbon.
In the example above we only made use of the forest category “Forest – Zone 1/ Tropical rainforest,” which is why it is automatically shaded in blue by EX-ACT. Due to collected Tier 2 data collected by project staff, it is known that the forest subject to deforestation is per hectare characterized by 168 tons of carbon in above ground biomass, 65 tons in below ground biomass and 3.9 tons in litter, while the soil carbon content is 68.3 tons per hectare.
More details on data collection and entry of such Tier 2 data can be found in the User Manual.
2.1. DeforestationAvailable Ecological zone 1.Tropical rain forest - 2.Tropical moist deciduous forest - 3.Tropical dry forest - 4.Tropical shrubland
You have indicated that your are using the following types of vegetation: Forest Zone 1(here below highlighted in blue)
Use this part only if you want to refine analysis with Tier 2 coefficients All values are in t of carbon per ha (tC/ha)(default values are provided for your information only, while EX-ACT will use Tier 2 values automatically wherever specified)
Type of vegetation(that will be deforested) Above-ground Below-ground Litter Dead wood Soil C
Default Tier 2 Default Tier 2 Default Tier 2 Default Tier 2 Default Tier 2Forest - Zone 1 145.7 168.0 53.9 65.0 3.7 3.9 0.0 65.0 68.3Forest - Zone 2 122.2 29.3 3.7 0.0 65.0Forest - Zone 3 56.4 15.8 3.7 0.0 65.0Forest - Zone 4 32.9 13.2 3.7 0.0 65.0Plantation - Zone 1 70.5 26.1 3.7 0.0 65.0Plantation - Zone 2 56.4 11.3 3.7 0.0 65.0Plantation - Zone 3 28.2 7.9 3.7 0.0 65.0Plantation - Zone 4 14.1 5.6 3.7 0.0 65.0
Back
Available AEZ?