Public Disclosure Authorized Equity in Enrolment and ...documents.worldbank.org/curated/en/...GER in...
54
Discussion Paper Series Report No. 4 South Asia Human Development Sector December, 2003 Equity in Enrolment and Completion in Elementary Schooling in India Evidence from recent household surveys 37835 Public Disclosure Authorized Public Disclosure Authorized Public Disclosure Authorized Public Disclosure Authorized Public Disclosure Authorized Public Disclosure Authorized Public Disclosure Authorized Public Disclosure Authorized
Transcript of Public Disclosure Authorized Equity in Enrolment and ...documents.worldbank.org/curated/en/...GER in...

Discussion Paper Series
Report No. 4
South Asia Human Development Sector
December, 2003
Equity in Enrolment and Completion inElementary Schooling in IndiaEvidence from recent household surveys
37835
Pub
lic D
iscl
osur
e A
utho
rized
Pub
lic D
iscl
osur
e A
utho
rized
Pub
lic D
iscl
osur
e A
utho
rized
Pub
lic D
iscl
osur
e A
utho
rized
Pub
lic D
iscl
osur
e A
utho
rized
Pub
lic D
iscl
osur
e A
utho
rized
Pub
lic D
iscl
osur
e A
utho
rized
Pub
lic D
iscl
osur
e A
utho
rized
�
������� ��� ���� ��� �������� ���� ��
�� � ����� �������� ��� ������
���������������� �����������������
��������� ������� ��� ����� ��!������ �"�������� �#��� �
����� �$��� %����� " & ��� ��� � ��
�� � '��� (��)
" � �* � +,,-

��(��������������
Executive Summary 11
Introduction 13
The Framework For Analysis
Data Sources
Structure of the Note
Section 1 Overview 16
Rules of the Game
Trends in Education
Expenditures on Education
Outcomes in Literacy, Enrollment and Completion
Section 2 Equity Across Space 23
Regional Disparity in Literacy
Spatial variations in Enrollment
Variations across states
Urban-Rural Disparities
Special Variations in Enrollment
Spatial variations in PCRs and UPCRs
Urban-Rural Differences in Primary Completion
Urban-Rural Differences in Upper Primary Completion
Section 3 Equity Across Sexes 28
Gender Disparity in Literacy
Gender Disparities in Enrollment
Primary Completion Rates Across Gender
Upper Primary Completion Across Gender
Section 4 Social Inequities 33
Social Disparity in Literacy
Disparities in ASAR
Disparities Across Social Groups in Primary Completion
Disparities Across Social Groups in Upper Primary Completion
Section 5 Inequities Across Economic Classes 37
Disparities in Primary and Upper Primary Across Income Quintiles
Disparities in Completion Across Income Quintiles

�
Section 6 Private and Public Expenditures on Schooling 42
Private Expenditures on Schooling
Public Spending on Education
Appendix- A note on the Benefit Incidence analysis
Section 7 Summary 51
REFERENCES 55
�������������
Fig. Description Page
1. Expenditure on Education in India 18
2. Share of Expenditure on Elementary, Secondary and Higher Sectors in the total 18
Education Expenditure in the Five Year Plans
3. Center-State Shares in Education Expenditures 18
4. Number of Recognized Primary and Upper Primary Schools in India 19
5. State wise percent of villages served With Schools 19
6. Percent of Rural Habitations with Primary schools within and a Distance of 1km 19
7. Literacy Rates for Selected Years (1881-2001) 20
8. GER in Elementary Education 1950-51 to 2000-2001 20
9. Primary Net Enrollment Rate for 6-10 years 21
10. Upper Primary Enrollment-ASAR-11-13 years 21
11. Primary Completion Rates (12 years) 21
12. UP Completion Rates (for 16 years) 21
13. Literacy Rates Across Indian States, 2001 23
14. Rural-Urban differences in ASAR-6-10 years:1999 24
15. Rural-Urban differences in ASAR -11-13 years-1999 25
16. PCR and UPCR - 1999 26
17. PCR-12 years old-Rural –Urban differences 26
18. UPCR-16 years old 1995-96-Rural-Urban differences 27
19. Number of Non-Literates by Gender (1981-2001) 28
20. Literacy Rates by Gender (1951-2001) 28
21. Enrollment Rates- Girls and Boys 29
22. Gender disparities in ASAR in 6-10 age groups-1999 29
23. Gender disparities in Upper Primary enrollment-1999 30
24. Primary ASAR, CR and Actual CR – Boys 31
25. Primary ASAR, CR and Actual CR – Girls 31
26. Social disparities in ASAR-6-10 years-1999 34
27. Social disparities in ASAR-11-14 years-1999 34

�
28. Social disparities in PCR of 12 year olds –1999 35
29. Social disparities in UPCR of 16 year olds –1999 36
30. Primary Enrollment Rate-6-10 years – Expenditure quintile wise 37
31. ASAR (6-10 years)- Rural Across Income groups 38
32. ASAR (6-10 years)- Urban Across Income groups 38
33. ASAR 6-10 years across the lowest and highest groups of expenditure quintiles 39
34. PCR – Income group wise- Rural 39
35. PCR – Income group wise –Urban 40
36. UPCR – Income group wise – Rural 40
37. UPCR – Income group wise – Urban 41
38. Income intensified gender differences in PCR 41
39. Per student yearly average household spending on elementary education 43
40. Per student yearly average expenditure on elementary education by School type 43
41. Per student yearly average household spending – Rural Boys 43
42. Per student yearly average household spending – Rural Girls 44
43. % of students enrolled in government Primary schools 44
44. % of students enrolled in government Upper Primary schools 44
45. Public Spending in Education as percentage of GSDP 46
46. Per student subsidy for primary education – across income groups-1996 47
�����
1. Intra-Sectoral allocation of Plan Expenditure in Education in India in the Five Year Plans
(Rs. In 10 million) 16
2. Percentage Distribution of Public subsidies to rural Primary schools 47
3. Equity Study - Summary 52-53

This report was co-authored by Deepa Sankar and Venkatesh Sundararaman, with inputs from VandanaSipahimalani-Rao, in her capacity as task-manager. The work was initiated by Sajitha Bashir under abroader set of proposed studies on “Critical Issues in Reforming State Education Systems”. RenuGupta and Karthika Nair provided the necessary logistical support. Much of the background analysiswas completed even before the two principal authors came on task and we gratefully acknowledge thecontributions of Professor A.B.L. Shrivastava, and of Laveesh Bhandari and Peeyush Bajpai of IndicusAnalytics. The authors acknowledge the comments, suggestions and encouragement received fromChristine Allison, Sadia Chowdhury, Amit Dar, Anil Deolalikar, Charles Griffin, Venita Kaul, QaiserKhan, Madhu Raghunath, Michelle Riboud, Kin Bing Wu, and Nobuo Yoshida. We are also grateful toZafiris Tzannatos and Robert Prouty for being the peer reviewers and for their insightful comments andsuggestions on the study.
��.��'��"! ����
AP Andhra Pradesh
ASAR Age Specific Attendance Rate
ASM Assam
BIA Benefit Incidence Analysis
BIH Bihar
CG Center Government
CR Completion Rates
CSS Centrally Sponsored Scheme
DPEP District Primary Education Program
EFA Education for All
GDP Gross Domestic Product
GER Gross Enrolment Rates
GOI Government of India
GUJ Gujarat
HAR Haryana
HP Himachal Pradesh
JNV Jawahar Navodaya Vidyalayas
KAR Karnataka
KER Kerala
KV Kendriya Vidyalayas(Central Schools)
MDMS Mid Day Meal Scheme
MH Maharashtra
MHRD Ministry of Human ResourceDevelopment
MP Madhya Pradesh
MS Mahila Samakhya
NER Net Enrolment Rate
NFHS1 National Family Health Survey 1
NFHS2 National Family Health Survey 2
NPE National Policy of Education
NSS42 National Sample Survey 42nd round
NSS52 National Sample Survey 52nd round
NSSO National Sample Survey Organization
OBB Operation Black Board
OR Orissa
PA Private Aided Schools
PCR Primary Completion Rates
PNJ Punjab
PUA Private Un-aided Schools
RAJ Rajasthan
SDP State Domestic Product
SG State Government
SSA Sarva Shiksha Abhyan
TN Tamil Nadu
UEE Universal Elementary Education
UP Upper Primary Schools
UP Uttar Pradesh
UPCR Upper Primary Completion Rates
WB West Bengal
�((��/�������� ��"� �����# �

��

��
�0�����/�� �� ��#
This policy note analyses the evidence on the variousequity issues relating to the participation and completionof elementary school education in India is based on thedata collected by the National Sample Survey (NSS)and National Family Health Surveys (NFHS), the latestyear being looked at is 1998-99. This documentationof state-wise regional, community, gender and incomeinequities therefore do not take into account theprogress made by states in reducing the inequities underthe District Primary Education Program (DPEP)program for the last 8 years. In fact, some of theissues which comes out of this study and needs attentionis probably already addressed under some of the newprograms already being undertaken by the MHRD, suchas the Sarva Shiksha Abhiyan (SSA). However, byfiling these issues in a systematic manner, we hope todraw continued attention to the status of these issuesin the programs.
The participation and completion of elementaryeducation here is analysed using a few standardindicators derived from the household surveys such asthe Age Specific Attendance Rate (ASAR) for bothprimary and upper primary and Primary and UpperPrimary Completion Rates (PCR and UPCR).Analysing the data from both the conglomerativeperspective (captures the advances made by the societyas a whole) and deprivational perspective (assess thestatus of the deprived in the society, such as SC, ST,females, rural poor etc), it is evident that the gender,regional, community and income disparities are stillserious issues in elementary education participation andattainments. However, all these disparities aredeepened by the state-level differences since the stateswhich are at the lower end of the education attainmentsare the ones where the disparities were also a seriousproblem.
While participation in schooling have increased, thosewho complete the expected levels have not increasedas fast as the participation rates, mainly due to the lesssignificant success in reducing the drop outs. Thedisaggregated analysis of elementary education intoprimary and upper primary shows that participation inupper primary education is still a serious concern inmany states, even though there has been considerable
progress in primary education participation andcompletion in most of the states. Not only the currentlevel of participation in upper primary education is notup to the desirable level and below that of primaryeducation, the progress made during 1987- 99 periodhas also been not satisfactory and not kept with thepace of that primary education. However, this isunderstandable since only those who complete primaryeducation can go to upper primary education and theprogress and level at the upper primary level mainlyrests upon the primary education participation andcompletion rates at a period prior to that. Same is thecase with primary and upper primary completion rates.States which had already achieved higher levels ofschool participation and completion rates showed lesserprogress during the decade under study, as they havealready reached the near optimal level in educationaldevelopment such as Kerala and Himachal Pradesh.On the other hand, though states like Andhra Pradesh,Madhya Pradesh and Rajastan showed greaterprogress in educational attainments from their lowerlevels in mid-1980s, they have a lot more to go beforereaching the desirable levels. However, the states onthe Gangetic belt such as Bihar and UP are still laggardsin spite of their progress which is well below thedesirable levels.
Another major aspect examined in this policy note isthe rural-urban disparities. While the developed stateshave negligible differences between their rural andurban areas, the poorer performing states had themaximum disparities. In some progressing states, thedisparities got deepened mainly because of their fasterimprovements in education participation in urban areascompared to rural areas. Similarly, the participationand completion of schooling among girls have increased,however, in many states, the increase has been notenough to catch up the pace of increase in boys’schooling outcomes, thus resulting in a gender gap ineducational outcomes. While this problem is less severein urban areas, in rural areas, there is much to beimproved. The story of socially disabled communitiesand those in the lower strata of economic hierarchiesalso do not differ much from such deepened inequityproblems. The social and economic disparities arefurther complicated by the distribution of educational

��
investments among the beneficiaries by governmenteducational spending.
The importance of this analysis is mainly at theacademic level, that they address the educationaloutcomes in terms of participation and completion inschooling at the disaggregated level. The analysisshows that educational reforms should be aimed at
removing inequalities at all levels of economic, socialand regional strata in order to improve educationaloutcomes. Further, the documentation of the equitydisparities from household survey data during 1980sand 1990s would facilitate a comparison with theprogress made during the current decade as and whenthe latest household survey data are made available.
��
Education is recognized as a driving force for humandevelopment, through the creation of choices andopportunities for people. It acts as a catalyst for socialmobility and aids in the upliftment of weaker sectionsof society by providing them with a set of useful andmarketable skills that help in increasing employmentopportunities, and thereby reducing an individual’svulnerability to poverty. Traditionally, education hasbeen given high importance in Indian societies, althoughin these societies access to educational opportunitieswere defined along lines mirroring the ethnic and societaland religious fragmentation of that time, whether forBrahmin children through agraharas (communitygroups for religious learning) or for Muslim childrenthrough madrassas (Islamic religious schools), or forother children belonging to other groups through theirown societal and skill based guilds, education has beenemphasized in historical India. There is amplearchaeological to support the claim that India has beena center of learning for much of history, with subjectsas diverse as mathematics to drama being taught atvarious institutions, the most famous of which are theBuddhist institutions at Takshashila and Nalanda.English education was introduced with the arrival ofEnglish missionaries and has since taken a firm root inthe Indian system.
India has made steady progress in education since itsindependence in 1947. Growth in literacy rates sincethen has been impressive, particularly the gains inliteracy that have been achieved in the nineties. Thenumber of children enrolled and attending school, boysand girls, rich and poor, and upper caste and lowercaste children, has increased significantly over the yearsand India is poised to achieve universal literacy andprimary enrollment in the future if successivegovernments continue to exert concerted effort in thisdirection. Governments, both at the Center and in thestates, have enacted policy reforms, increased resourceflows into all levels of education. India’s new flagship
�����"������
“Education, in the present day context, is perhaps the single most important means for individuals toimprove personal endowments, build capability levels, overcome constraints and in the process, enlargetheir available set of opportunities and choices for a sustained improvement in well-being……….”
Human Development Report, India. 2002
program to achieve universal elementary education(UEE), Sarva Shiksha Abhiyan, specifically increasesresource flows into primary and upper primaryeducation. This is further evidence of the government’sdetermination to achieve universalization of basiceducation in a time bound manner. Many of these goalshave been pursued by the government sinceindependence in 1947, unfortunately they have provento be elusive. Many factors determine the literacyrates1, enrollment or attendance, and completion ratesin India.
Today, while India can boast of having one of theworld’s largest pools of technical manpower, it is alsohome to the world’s major pool of illiterates. Althoughschooling standards for Indian children in many of themajor metropolitan cities are some of the highest in theworld, the quality of schooling, teacher effectivenessand academic content for the vast majority of India’schildren leaves a lot to be desired. While the countryhas one of the largest school networks in the world, itis also true that many of these schools lack even basicfacilities. These discrepancies have led to significantand persistent gaps in literacy levels, enrollment andcompletion at all levels of schooling, across manydifferent socio-economic dimensions of the population,including gender, space and geography, social andeconomic classes.
India is a land of tremendous diversity and contrastsbecause of the range of its people, languages, culturesand religions. This diversity that defines India, is alsoreflected in its social indicators. There remaintremendous disparities in the provision of, access to,and participation in or utilization of key social servicesin health and education, as in the case of the distribution
1 Literacy rate is a very crude indicator to use in India. Literacyfigures as obtained from decadal national population censuses, isobtained by asking the main respondent in each household as tothe number of members in the household who are literate, andnot based on any tests of reading proficiency.

��
of economic resources. The eradication of thesediscrepancies and contrasts in the socio-economicstatus of the population is a fundamental objective ofthe Government of India (GOI). Many studies haveinvestigated the factors contributing to the currentposition of education indicators. For example, Jabbi andRajyalakshmi (2001) state that “a review of the existingliterature shows that the important gaps in education inIndia are due to caste/tribe status, gender and poverty”.
The key objective of the study is to document trendsand achievements in enrolment and completion ofprimary and upper primary schooling in the major statesof India, specifically, to present an analysis of thedisparities across space, gender, social and economicgroups. While doing this, the study also aims todocument changes in the sector over time and the gapsin education participation and attainment ofdisadvantaged groups (such as, rural girls, childrenbelonging to back classes, and children of poorhouseholds across these major states). By identifyingthose regions and groups for which progress has beenslow, and by assessing the extent to which publicspending on education has benefited the poor andsocially disadvantaged groups, we will be able to furtherrefine existing policies to achieve the desired objectives.A key aspect of this note is therefore to present a benefitincidence analysis of public expenditures.
�������������������������
The framework of this analysis is broadly based on theequity issues related to various aspects of education.The equity issues looked at are: (a) regional or spatialequity (b) gender equity, (c) socio-cultural equity issuesand (d) Income equity.
Regional or Spatial Equity refers to the disparities ineducational opportunities available and availed off bythe disadvantaged and underdeveloped regionscompared to better-endowed regions. This could belooked at across states, across districts within the states,and across rural and urban areas within the States.The issues related to regional equity also addressesthe question of physical access to schools, whichimplies looking at whether certain regions are betterendowed with schooling facilities than are other regions.
Gender-Equity refers to the disparities in opportunitiesof the traditionally disadvantaged gender group, i.e.,females, compared to males, in their literacy levels,
access to various levels of schooling, participation andcompletion.
Socio-cultural equity addresses the disparities ineducational opportunities available to the sociallydisadvantaged groups. The historical biases in providingeducational access to specific social groups has led tosignificant and persistent discrepancies in literacy,enrollment and completion of different levels of schoolingin India.
Income Equity refers to the differences in schoolingenrollment and attainment in India due to differencesin access to economic resources and incomes.
The equitable distribution of schooling aspects acrossspecial, gender, social and income classifications areinvestigated by observing various educationalparameters such as literacy rates, the Gross EnrollmentRates (GER) and the Age Specific Enrollment Rates(ASARs)2,3. GERs address enrollment rates withouttaking into account age-specificity, while ASARs lookat enrollment ratios within an certain age groups.Completion Rates refers to the completion of a certainlevel of education in terms of number of yearscompleted (I-V grades in the case of primary educationcompletion and VI-VIII grades in the case of upperprimary education). ASAR is computed as thepercentage of children of age 6-10 attending schoolcompared with the total population in age group 6-10.GERs also capture this statistic to a certain extent,except that they include students enrolled in school whoare not in the 6-10 age group. GERs presents a pictureon current enrollment that includes both overage andunderage enrolment, and hence, very often GERs canbe greater than 100 percent in value.
�����������
Four different data sets are primarily used for theanalysis in this note. These include two National SampleSurveys, the 42nd and the 52nd Rounds4 and two FamilyNational Family Health surveys5. The NSS-42 and
2 Similar to Net Enrollment Rates (NERs), the difference beingthat net enrollment rates looks at (primary) school aged childrenenrolled in (primary) school, while ASARs presents the ratio of(primary) school aged children enrolled in any class to the totalnumber of primary school aged children in the population.3 ASAR is computed as shown here: ASAR = [No. of children ofage 6-10 attending school/Population in age group 6-10]*1004 Henceforth referred to as NSS42 and NSS52.5 Henceforth referred to as the NFHS1 and NFHS2.

��
the NSS-52 were conducted in 1986/87 and 1995/96respectively and are carried out by the National SampleSurvey Organisation (NSSO). The NFHS1 and theNFHS2 were conducted in 1993/94 and 1998/99respectively. Furthermore, secondary data from thevarious government documents have also been used.With these four surveys, we have information onschooling and completion of 6-14 year olds for fourtime points from 1986-87 to 1998-99.6
�������������������
The structure of the note is as follows. The paper looksat equity issues in school participation and completionacross different time points, gender, income groups,social groups and states. Section 1 provides a briefhistorical overview on the progress that has been madewith regards to literacy, enrolment, completion and theprovision of schooling services in India. Although theprimary aim is to look at schooling enrollment and
completion rates, each section also provides a glimpseat other indicators whenever appropriate, such as,literacy, drop outs and repetition, expenditures, etc. Inmany ways, the disparities in literacy, enrollment,attendance and completion, witnessed among thepopulation, are closely correlated to factors such asbetter access to primary schooling, gender, caste groups,birth order, parental education background andoccupation, region of residence, etc. The remainingsections are presented according to regional or spatialdisparity, gender disparity, social class disparity andeconomic class disparity. Each of these will bepresented in Sections 2, 3, 4 and 5 respectively. Section6 will present an overview of the financing of education,and the private and public expenditures on educationand this section we will also present the results of thebenefit incidence analysis of public expenditures onschooling. Section 7 will present some conclusions andquestions that need to be addressed further.
6Greater emphasis is also placed on NSS52 round on Education for the purpose of analyzing the determinants of schooling enrollmentand completion.

��
Basic education is a catalyst to social change, and itcan be considered as an important ingredient to buildinghuman capabilities (as advocated by Dreze and Sen;1995), which is essential for any society’s economicgrowth. The government has a role and duty in theprovision of basic education, as it is a merit good, sothat the both public and private returns are maximized.The Directive Principles of State Policy of the IndianConstitution assures the citizens of India that they areentitled to the “provision of free and compulsoryeducation” and the “promotion of education andeconomic interests of the Scheduled Castes, ScheduleTribes and other weaker sections”. Furthermore, Indianlawmakers of the time, through Article 45 of theConstitution, further committed themselves to ensuringthat universal elementary education will be achievedwithin the first ten years of the drafting of theConstitution.
In the early years after independence, emphasis waslaid on the development of schools that provided “basiceducation” and in the area of higher education as thiswas seen as the avenue towards the country’s selfsufficiency. Table 1 presents the outlays for educationunder the First and Second Five Year Plans.Considerable focus was placed on tertiary education,and specifically, technical education.
While significant improvements in the primary andupper primary sectors have taken place since then,many of the concerns that were raised four decadesago mirror the concerns of today and have yet to bedealt with adequately. For example, the 2nd FiveYear Plan raises concerns over (i) inadequacy ofschooling facilities, (ii) drop outs in the primary cycle,(iii) social and cultural factors that inhibit girl’seducation, (iv) lack of qualified teachers and womenteachers in particular and (v) considerable disparitiesacross gender, regions and socio-economic groups.Many of these issues continues to plague theeducation system today7.
Consecutive Five-Year-Plan documents havehighlighted concerns related to enrollment andcompletion, and have flagged the grave disparitiesacross gender, regions, social and economic classesfor marked attention. However, the goal of providinguniversal basic education has proven to be difficult toattain, and as the Tenth Plan admits, concrete plans ofaction, gained greater momentum only after theNational Policy of Education (NPE), 1986, (and modifiedin 1992) and the World Declaration on Education forAll (EFA) adopted in Jomtien in 1990, which broughtinto focus basic education in all its facets (including the
�������� 1� ���/��/��'
��*� � 1�� ����2� ����� ��������� 3� 4���� �5� ����� � ����������� ��� ������ ��� �� � ��& � # �� 4���$6�$7� ��� 1,�������8
�������� �� � ���� ��� � � � ����� %��� � ������� !���� ���� 9� 3� �������� 4���� �����
� ������� ����� ����� ����� ����� ���� ���
� � ������� ���� ����� ������ ������ � ��� ����
� � � ������ ������ ����� � ���� ������ ����� ���
������� ���� ������ � ������ ����� ������ ����� ����
� ������� ���� ����� ������� ����� ���� �� ���
� ����� ������ ��� �� ������� ���� ���� ���
� ������� ������ ������� ������ ������ ������ ��
� � ��������� � ���� �������� ����� ������ ���� ���
������� ���� ������� � �� �� ����� ������ ������� ����� ���
� � � ��������� ������ �������� ��� �� � ������ �� �� ���
Source: Five year Plans, Annual Plans, Analysis of Annual Plan, Education Sector (Various years) of GOI and Tilak (2002)
��
equity and quality considerations). These internationalevents, coupled with many developments on thedomestic front, recognized basic education as afundamental right of every citizen, and the most crucialinvestment in human development to the center stage8.The thrust areas in the Ninth plan included UniversalElementary Education (UEE), girls education, and onceagain, the issue of literacy. Numerous schemes andprogrammes aimed at achieving these goals, such as,the Operation Black Board (OBB), the MahilaSamakhya (MS), the Mid-day meal scheme, and theDistrict Primary Education Program wereoperationalized during the Ninth Plan period. Thisinitiative for UPE has recently received another boostthrough a Constitutional Amendment Bill (2001), forenacting the Fundamental Right To Free AndCompulsory Education for children in the age group of6-14 years.
����������������
According to the Constitution, matters pertaining toeducation fall under the concurrent jurisdiction of boththe Central and the State Governments. Historically,the two authorities have played fairly distinct roles inthe education sector with the Central Governmentfocusing more on tertiary, particularly, technical andmedical education, and leaving primary, secondary andnon-technical tertiary education to the States.However, given that the States’ are unable to raisetaxes in accordance with their spending, the Centerprovides support through a complex system of fiscaltransfers (Bashir, 2000). These transfers are also fairlywell mandated in the IC.
While the states are largely responsible for primary,upper primary and secondary education, the Centerdoes enhance and promote policy reforms throughcentrally sponsored schemes and programs. Thenumber of centrally sponsored schemes in the area ofbasic education has increased considerably since theearly nineties. The induction of external financing in asubstantial way into the elementary education sectorwas also a fairly radical exercise that began in thenineties. Under the CSS, the entire activity may bedriven by the Center or there may be some statecontributions in a share that is decided through mutualconsultation between the Center and the States. Manyof the recently initiated primary education schemes atthe national level, such as, Operation Blackboard,
District Primary Education Program (DPEP) and thecurrent Sarva Shiksha Abhyan (SSA), have all beenunder the CSS category. Through the use of theseprograms, the CG can influence to some extent SGpriorities so as to achieve national policy goals. Otherexamples of similar programs, would include publicworks, child nutrition, and other poverty alleviationschemes.
�����������������
The status and conditions of access to, and demandfor, primary education in India is so heterogeneous, thatany unique action plan for providing universalelementary education needs to be contextualized bytaking into account equity considerations. Literacy ratesand schooling patterns vary substantially across gender,different regions, social and economic groups. Theextent of these disparities, and the manner in whichthey affect school participation and completion needsto be assessed for the reform of the systems in orderto be able to achieve the objectives of universal primaryeducation and completion. In this sub-section, wepresent some macro-trends in educational expenditures,physical access, and outcomes.
� !��������������������
Public expenditures on education both as a percentageof total government expenditure across all sectors, andas a percentage of GDP has increased since 1950-1951. This is quite evident from Figures 1 and 2 which
7 It is interesting that the target set for achieving compulsory andfree education under the Directive Principles of the Constitutionwas not only allowed to slip, but was endorsed in the SecondPlan as follows “it will be seen that the goal set in theConstitution about free, compulsory and universal education isyet far away… It is, however, necessary to make every possibleeffort to fulfill the directive of the Constitution within the next tento fifteen years.”8 The Supreme Court of India observed in the Mohini Jain casein 1992 that the Directive Principles, which are fundamental inthe governance of the country cannot be read separately from theFundamental Rights. The more notable part of the judgment wasits insistence that the right to education be read as an integralpart of the right to life guaranteed under Article 21, Part III. In1993, the Supreme Court reiterated in the Unnikrishnan vs. Stateof Andhra Pradesh case that the right to education indeed floweddirectly from the right to life; therefore, the state is under anobligation to provide basic education to all citizens during theirchildhood. The enactment of 93rd Constitutional Amendment Bill(2001), culminated in making free and Compulsory Educationfor children in the age group of 6-14 years a fundamental right.

�
depicts education expenditures in India between 1951-52 to 2000-2001 and across all the Plan periods.
The percentage of education and training expenditureto total expenditure across all sectors has increasedfrom about 8 percent to a little under 14 percent overthis period, or amounting to an annual growth rate ofabout 0.13 percent. Education and training expenditureas a percentage of GDP was below 1 percent in 1950-1951, and by 2000-2001 had reached a high of 4.11percent, though education expenditure as a percent ofGDP was much more volatile, with irregular increasesand falls over the years. Figure 2 illustrates the sharethat primary education has attracted over the variousFYPs. From here it is evident that there was a dip inthe emphasis on basic education across the plans assecondary and tertiary education gained in importance.
It is only in the Ninth Plan that the emphasis on primaryeducation was restored.
Expenditure shares on education by State and centralgovernments are shown in Figure 3. As stated earlier,the enter does make fiscal transfers aimed at helpingweaker states with their development goals9.
"��������������
Accessibility to education can be defined as physicalor spatial access, financial or economic access, social
���� � 1� �5� ����� � ���������� ��� �����
Source: Annual Financial Statistics, MHRD
���� � +� ��� � 3� �5� ����� � ��� � ����:� � ������ ���� ���� � $ ��$� ��
�� � ����� �������� 5� ����� � ��� �� ��& � # �� 4���$
���� � -� � � �� 2���� � ��� $� ��� ��������� �5� �����
Source: MHRD
9 These extent of these transfers is based on what is referred to asthe Gadgil formula. V.N. Gadgil, Former Deputy Chairman PC.Population and per capita income have a weight of 85 percentunder the Gadgil formula. The remaining 15 percent weight isequally divided on the basis of state performance in theachievement of priority national objectives and in addressingspecial problems of the states.

�
access or even access to quality education. We referto physical or spatial access to primary and upperprimary schooling infrastructure, and not to theparticipation of this infrastructure. Spatial access isperhaps most important since having these facilities isthe first step in availing of the services provided.
Between 1950-51 and now, the number of primaryschools in India has increased three-fold, from about210,000 to a little over 640,000 schools by the end ofthe last century and the number of upper primary schoolshas increased by almost 15 times from 13,600 to almost200,000 schools over the same period. Similarly, accessto Secondary and Tertiary institutions has also improvedover this time. Considerable successes have takenplace due to these efforts, particularly in the ninetieswhich has been referred to as a “watershed decade asfar as basic education is concerned” (PlanningCommission 2001). Figure 4 shows this trend inschooling infrastructure provision.
Across regions, however, this increase in infrastructurehas not been even. Standardizing the access across thestates in terms of area coverage, we find that some statesare better endowed and better served with school facilitiesthan others. We can see from Figures 5 and 6 that accessto primary schooling is quite substantial in most of thestates with 75 to 95 percent of villages across these stateshaving a primary establishment within the village itself.
Under the new school mapping exercise undertakenas part of the SSA framework, the norms suggest that
there should be a primary school within 1 km of anyhabitation with a population of 300 or more10 and thatthere should be an upper primary within 3 km of anyhabitation of 500 or more. In the mid-nineties, over 94percent of all habitations had a primary school within 1km of it. The two figures above depict the tremendousvariation across states in their coverage and accessibilityto primary and secondary schooling infrastructure.Many states have almost succeeded in meeting this 1
���� � ;� ���* � 3� � ����$ �� 4�������� ��� � 4����� ����$� ��� �����
Source: MHRD
���� � <� 4 � ��� 3� ����� %�*������$� =��������� $���$� =������ ���� �� ��$���� � 3� 1.�
���� � >� ��� =�$ � � � ��� 3� &����� $$ & �� =���� $���$
Source: MHRD
10 The SSA being a centrally sponsored scheme, while theconceptualization of the framework would have been prepared inconsultation with the states, it merely provides a framework withwhich the states can act, some states have used a norm of 200per habitation instead of the 300 stated above, for example,
Andhra Pradesh.

��
km norm, for example, Tamil Nadu, states that 98percent of its habitations of 300 or more are now servedwith a primary school within 1 km of the habitation.However, states like Uttar Pradesh, Bihar and WestBengal still seem to be a considerable distance fromreaching this target.
#������������������$���������������%��!������
Literacy rates in the country have increased from 18.30percent to 65.38 percent between 1951 and 2001 asshown in Figure 7. In the nineties alone, literacy ratesappear to have increased by about 13.51 percentagepoints.
Universal literacy, however, is still a distant dream, andthere continues to be sharp discrepancies acrossregions, and between gender, social and economic
groups. Notwithstanding the considerable successesthat have taken place, nearly 300 million people in the7+ age group are illiterate.
Figure 8 shows that GER has been increasing over theyears, and that GERs are higher in primary schoolsthan in upper primary schools. GERs were highestduring the late 1980s and early 1990s. However, aweakness with GERs as a measure is that both over-age, and under-age admissions are included in theestimates.
To address these concerns and to obtain a moredisaggregated picture of enrollment, Net EnrollmentRatios (NERs) or the Age Specific Admission Ratios(ASAR) are presented in Figures 9 and 10 for primaryand upper primary schooling respectively. ASARs havedefinitely increased between 1986/87 and 1995/96 (andbetween 1992/93 and 1998/99) at both the primary and
���� � ?� � ��� ���� ��� $� 3� � � �� �� # �$� 61@@1� 2� +,,18
���� � @� � !��� ��� �� � ����� ��������� 2� 1A>,2>1� 2� +,,,2+,,1
Source: MHRD
��
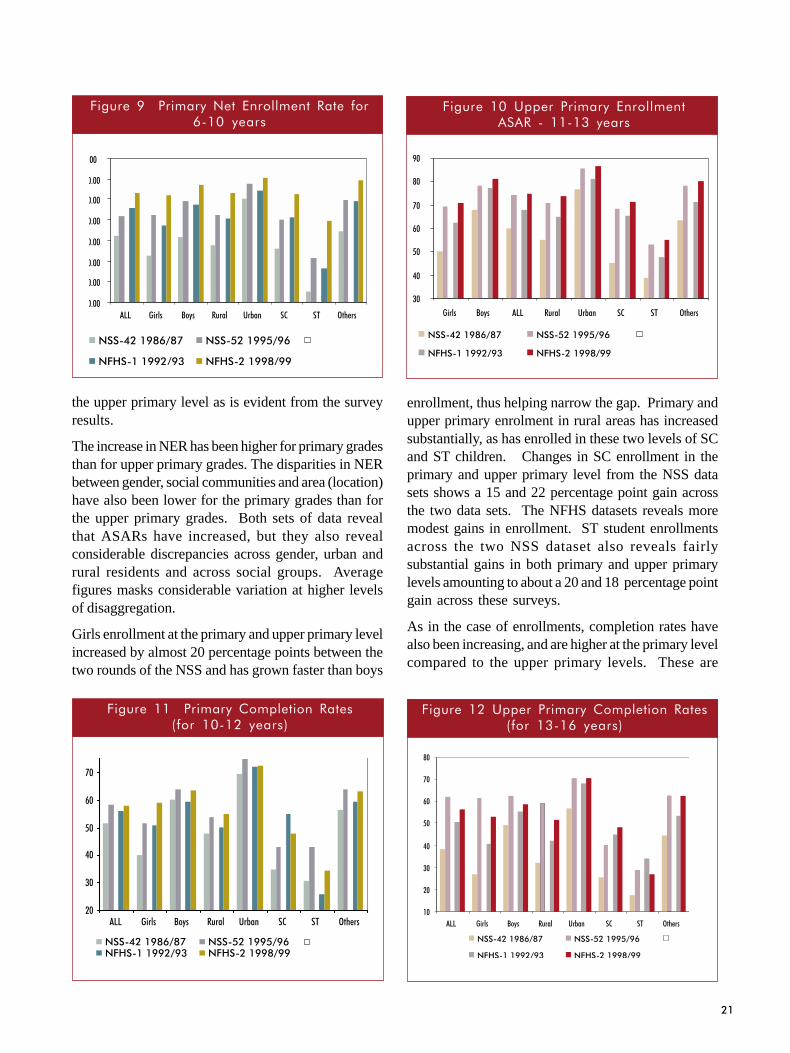
the upper primary level as is evident from the surveyresults.
The increase in NER has been higher for primary gradesthan for upper primary grades. The disparities in NERbetween gender, social communities and area (location)have also been lower for the primary grades than forthe upper primary grades. Both sets of data revealthat ASARs have increased, but they also revealconsiderable discrepancies across gender, urban andrural residents and across social groups. Averagefigures masks considerable variation at higher levelsof disaggregation.
Girls enrollment at the primary and upper primary levelincreased by almost 20 percentage points between thetwo rounds of the NSS and has grown faster than boys
enrollment, thus helping narrow the gap. Primary andupper primary enrolment in rural areas has increasedsubstantially, as has enrolled in these two levels of SCand ST children. Changes in SC enrollment in theprimary and upper primary level from the NSS datasets shows a 15 and 22 percentage point gain acrossthe two data sets. The NFHS datasets reveals moremodest gains in enrollment. ST student enrollmentsacross the two NSS dataset also reveals fairlysubstantial gains in both primary and upper primarylevels amounting to about a 20 and 18 percentage pointgain across these surveys.
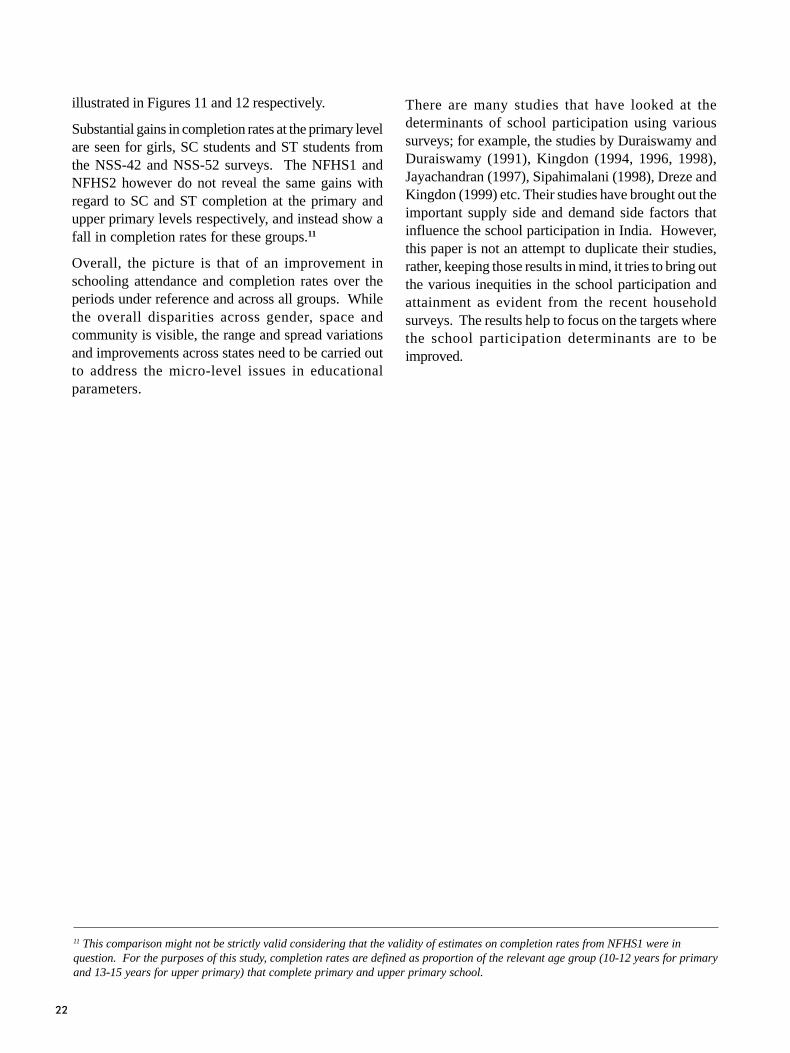
As in the case of enrollments, completion rates havealso been increasing, and are higher at the primary levelcompared to the upper primary levels. These are
���� � A� 4����� � �� ����� ��� ��� � 3<21,� � �$
���� � 1, ��� � 4����� ����� ������� 2� 1121-� � �$
���� � 11� 4����� ���� ���� ��� $63� 1,21+� � �$8
���� � 1+ ��� � 4����� ���� ���� ��� $63� 1-21<� � �$8
��
illustrated in Figures 11 and 12 respectively.
Substantial gains in completion rates at the primary levelare seen for girls, SC students and ST students fromthe NSS-42 and NSS-52 surveys. The NFHS1 andNFHS2 however do not reveal the same gains withregard to SC and ST completion at the primary andupper primary levels respectively, and instead show afall in completion rates for these groups.11
Overall, the picture is that of an improvement inschooling attendance and completion rates over theperiods under reference and across all groups. Whilethe overall disparities across gender, space andcommunity is visible, the range and spread variationsand improvements across states need to be carried outto address the micro-level issues in educationalparameters.
11 This comparison might not be strictly valid considering that the validity of estimates on completion rates from NFHS1 were inquestion. For the purposes of this study, completion rates are defined as proportion of the relevant age group (10-12 years for primaryand 13-15 years for upper primary) that complete primary and upper primary school.
There are many studies that have looked at thedeterminants of school participation using varioussurveys; for example, the studies by Duraiswamy andDuraiswamy (1991), Kingdon (1994, 1996, 1998),Jayachandran (1997), Sipahimalani (1998), Dreze andKingdon (1999) etc. Their studies have brought out theimportant supply side and demand side factors thatinfluence the school participation in India. However,this paper is not an attempt to duplicate their studies,rather, keeping those results in mind, it tries to bring outthe various inequities in the school participation andattainment as evident from the recent householdsurveys. The results help to focus on the targets wherethe school participation determinants are to beimproved.

��
Spatial equity can be broadly classified undertwo separate categories, (i) urban-ruraldisparities and (ii) disparities across regions,districts, taluks1, villages within a state andacross states. Spatial equity issues relate thegeographical access and achievement issues,and hence highly related to the provisions ofthe education facilities.
Although both the number of habitations, andthe population of the country has increasedsteadily over the years, by 1993/94 over halfthe villages in the country had a primary schoolwithin the village, and about 83 percent of allhabitations had a primary school within onekilometer of the habitation (PlanningCommission 2001). Although tremendousprogress has been made in the 9th FYP, thereare presently at least 100,000 habitations thatdo not have a school within the prescribednorms; there are still many out of school children inthese underserved communities; drop out rates are alsovery high in these areas and completion levels are muchlower.
�����������!�����������������
Any regional analysis of education should start with anunderstanding of the patterns of the literacy rates inthe regions since the literacy rates is an indication ofthe general education standards of a locality. Since thenationwide averages mask stark disparities acrossstates, and across districts, it is important to look atregional disparity in education. Bihar continues to bethe state with the overall lowest literacy rates in 2001,with a literacy rate of about 48 percent, while Keralacontinues to be on the other end of the spectrum with aliteracy rate of almost ninety percent. Furtherdisaggregating provides evidence of significant within-state variations. For example, the district of Dantevadain Chhattisgarh reports a literacy rate of only 30percent, while the district of Rajnandgoan (also inChhattisgarh) reports a literacy rate of 77.58 percent.Figure 13 presents a picture of the literacy rates acrossthe various states.
�������� +
�B���#� ������� �4���
Overall literacy increased unambiguously across allstates between 1991 and 2001, with the states ofRajasthan and Chhatisgarh, showing an increase of overtwenty percentage points during this period. In fourdistricts however, literacy rates seemed to have declinedduring the period, although these are in states very highinitial rates of literacy. These include districts in thestates/UTs of Kerala, Tamil Nadu (in fact, the capitalcity – Chennai), Daman and Diu and Pondicherry.
����&'��������!�������
Literacy rates also vary considerably across rural andurban locations. Across all rural and urban areas ofIndia, the literacy rate varies between about 50 percentand 70 percent respectively. Rural literacy rates inUttar Pradesh and Bihar are about 43 and 35 percentrespectively, while urban rates are about 60 and 61percent respectively. These wide discrepancies inliteracy across rural and urban areas often mirror thewide discrepancies in access to schools across theseregions as well.
���� � 1-� � ��� ���� ��� $� ��$$� ������� ���� $:� +,,1
Source: India Census 2001
1 An administrative unit like block consisting of many villages.

��
�!������(�����������������������
(����������������������
Coming specifically to the education indicators, it couldbe seen that there is considerable variation in ASARfor 6-10 year olds across the states. For example,Kerala, Tamil Nadu, Maharashtra, Punjab and Haryanahave almost achieved universal ASAR in this age group,while states like Uttar Pradesh, Bihar, Orissa andRajasthan are still lagging behind. Even these seemingenormous statewide variations are considerablynarrower than they were at the start of the nineties.The growth in ASAR has been slower in the betterperforming states like Punjab, Haryana, Tamil Naduand Kerala (due to the high ASAR base, there is limitedscope for improving ASAR over time), and higher inthe poorly performing states like Rajasthan, Bihar, UttarPradesh and Orissa (due to the low ASAR base tostart with, even a slight improvement has a greatergrowth value to it in these states). For example, theASAR for 6-10 year olds in Bihar more than doubledfrom 30 percentage points to 62 percentage pointsbetween 1985/86 and 1998/99, the two most extremesurveys temporally2. State-level variations in ASARare also evident for the 11-13 year old cohort. There isalmost a 35 percentage point difference between thebest and worst state-level ASAR in Kerala (97.59percent) and Bihar (64.28 percent) respectively. Gujaratis the only state that shows a decline in ASAR betweenthe NFHS1 and NFHS2, all other states show anunambiguous increase in ASAR between these twosurveys. From the NSS 42nd and NSS 52nd rounds, wefind that the difference between the best performing(Kerala) and the worst performing state (Bihar) interms of ASAR has reduced to almost 40 percentagepoints from an almost 50 percentage point differencebetween the same states in the 42nd NSS Round.
'�����)�����(���������
Figures 14 and 15 show ASAR for 6-10 year olds and11-13 year olds from the NFHS II by region ofresidence, i.e., urban and rural. Data from the two setsof surveys, suggests that ASARs across rural and urbanareas for the 15 major states, have narrowedconsiderably within the state and across states. In allstates the gap between ASAR in rural areas andASAR in urban areas in the 6-10 age group hasnarrowed considerably. Rural-urban differences in
ASAR across states are not uniform, the differencesin high performing states, like Kerala, Haryana, Punjaband Tamil Nadu, are markedly lower than thedifferences in lower performing states like UP,Rajasthan and Bihar. However, even in the states withwider regional disparities, the continued gap seems tobe more a function of their base line, as there has beena considerable narrowing of the urban-rural gap inenrollments. This therefore suggests greater thrust inon-going efforts to reduce and rationalize thesedisparities. For example, in Andhra Pradesh the urban-rural gap has declined for 6-10 year old enrolment fromabout 25 percentage points in the NFHS-1 round (1993/94) to a little less than 8 percentage points as per the1998/99 NFHS-2 datasets. In Bihar, across the sametwo datasets, the urban-rural gap has declined fromabout 30 percentage points to about 16 percentagepoints. The results in Orissa are quite staggering acrossthe two NFHS surveys with a decline in the urban-rural enrollment gap from about 15 percentage pointsto almost no statistical difference. The results clearlysuggests that the urban-rural gap has decreased in manystates although the decreased across states has notbeen uniform.
Enrollment in the 11-13 year old age groups also displayconsiderable narrowing of the gap between urban andrural regions, although the changes have not been asdramatic as the changes in the 6-10 year old category.Enrollment of 11-13 year olds has increased steadilyacross the two sets of data. The urban-rural gaps in
2 Though these surveys are not strictly comparable, there is anunambiguous rise in enrollment rates across the country acrossthese two sets of data.
���� � 1;� �� ����2�*��� "�33 �� � ��� ����3� <21,� � �$� ��� 2� 1AAA

��
11-13 year old enrollments have also diminished overthe same periods, although a sizeable and persistentgap remains in some of the states. The urban-rural gaphas closed much faster in the lower performing statesas compared to the higher performers. A similarexamination of older cohorts suggests that urban-ruraldisparities are higher for older cohorts. The fact thateven the 11-13 year old group displays relatively highurban-rural differentials, although this has narrowedconsiderably for the 6-10 year old cohort, suggeststhat the intensive focus of expanding access to primaryand upper primary education through a number ofrecent schemes finally appears to be providing results.
The successes at the primary level is increasing thepressure at the Upper Primary level and in the demandfor secondary and higher education. Why are theresuch discrepancies across districts and states? Thepossible reasons for such differential educationaloutcomes across and within states are numerous. Forexample, some of these factors could be classified as(a) historical, (b) political factors, and (c) economicand development factors. Historical factors includethe roles of previous rulers, the damages andcontributions made by the colonial legacy; the politicalfactors include the role of democratic governments,the focus of state governments in terms of social sectorssuch as health and education, and the level of statelevel spending; and finally, economic and development
factors includes the development of the state in termsof economy, industry, service sectors and equity in termsof rural-urban divide etc. These factors play a keyrole in improving participation rates as witnessedpositively in Kerala, Tamil Nadu, etc., and in pooroutcomes in states like Bihar and UP.
�!������(������������"������%��!�������������*"%��+�����'!!��"�������%��!�������������*'"%��+�,
There are significant differences in PCR and UPCRacross the states. This is illustrated in Figure 16.
���� � 1>� �� ����2�*��� "�33 �� � ��� ����1121-� � �$� ��$� 2� 1AAA
���� � 1<� �� � 4��� ���� �4��� 2� 1AAA
��
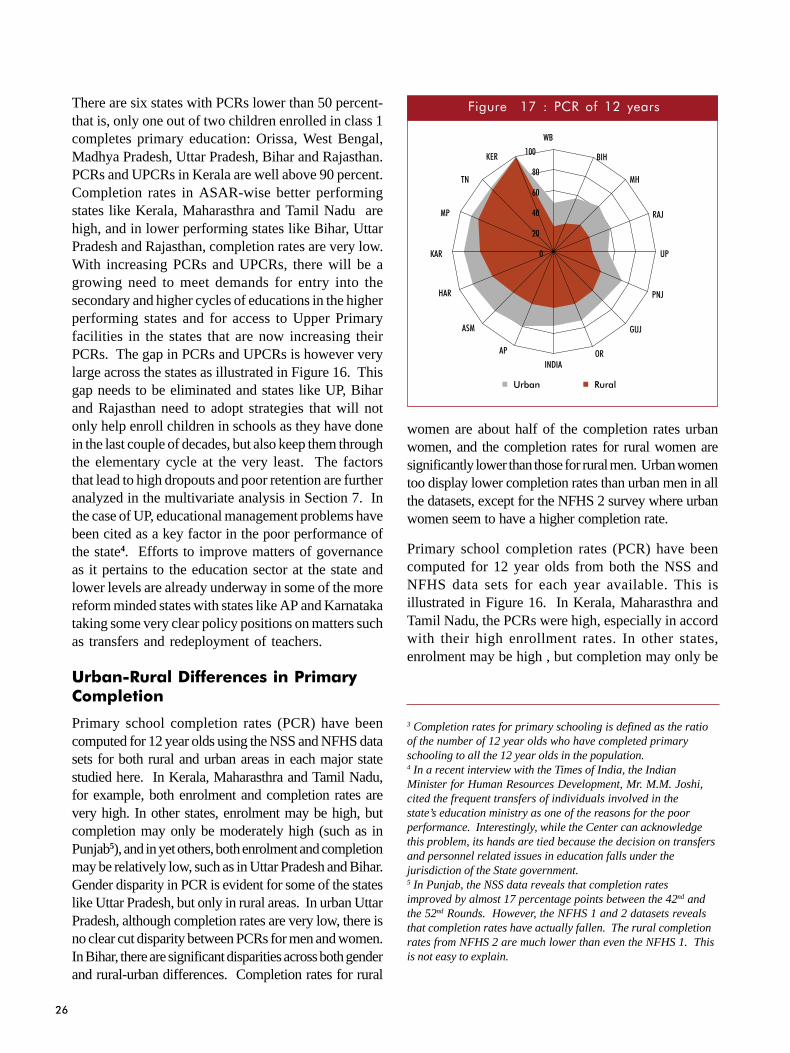
There are six states with PCRs lower than 50 percent-that is, only one out of two children enrolled in class 1completes primary education: Orissa, West Bengal,Madhya Pradesh, Uttar Pradesh, Bihar and Rajasthan.PCRs and UPCRs in Kerala are well above 90 percent.Completion rates in ASAR-wise better performingstates like Kerala, Maharasthra and Tamil Nadu arehigh, and in lower performing states like Bihar, UttarPradesh and Rajasthan, completion rates are very low.With increasing PCRs and UPCRs, there will be agrowing need to meet demands for entry into thesecondary and higher cycles of educations in the higherperforming states and for access to Upper Primaryfacilities in the states that are now increasing theirPCRs. The gap in PCRs and UPCRs is however verylarge across the states as illustrated in Figure 16. Thisgap needs to be eliminated and states like UP, Biharand Rajasthan need to adopt strategies that will notonly help enroll children in schools as they have donein the last couple of decades, but also keep them throughthe elementary cycle at the very least. The factorsthat lead to high dropouts and poor retention are furtheranalyzed in the multivariate analysis in Section 7. Inthe case of UP, educational management problems havebeen cited as a key factor in the poor performance ofthe state4. Efforts to improve matters of governanceas it pertains to the education sector at the state andlower levels are already underway in some of the morereform minded states with states like AP and Karnatakataking some very clear policy positions on matters suchas transfers and redeployment of teachers.
'����&��������������������"������%��!������
Primary school completion rates (PCR) have beencomputed for 12 year olds using the NSS and NFHS datasets for both rural and urban areas in each major statestudied here. In Kerala, Maharasthra and Tamil Nadu,for example, both enrolment and completion rates arevery high. In other states, enrolment may be high, butcompletion may only be moderately high (such as inPunjab5), and in yet others, both enrolment and completionmay be relatively low, such as in Uttar Pradesh and Bihar.Gender disparity in PCR is evident for some of the stateslike Uttar Pradesh, but only in rural areas. In urban UttarPradesh, although completion rates are very low, there isno clear cut disparity between PCRs for men and women.In Bihar, there are significant disparities across both genderand rural-urban differences. Completion rates for rural
women are about half of the completion rates urbanwomen, and the completion rates for rural women aresignificantly lower than those for rural men. Urban womentoo display lower completion rates than urban men in allthe datasets, except for the NFHS 2 survey where urbanwomen seem to have a higher completion rate.
Primary school completion rates (PCR) have beencomputed for 12 year olds from both the NSS andNFHS data sets for each year available. This isillustrated in Figure 16. In Kerala, Maharasthra andTamil Nadu, the PCRs were high, especially in accordwith their high enrollment rates. In other states,enrolment may be high , but completion may only be
3 Completion rates for primary schooling is defined as the ratioof the number of 12 year olds who have completed primaryschooling to all the 12 year olds in the population.4 In a recent interview with the Times of India, the IndianMinister for Human Resources Development, Mr. M.M. Joshi,cited the frequent transfers of individuals involved in thestate’s education ministry as one of the reasons for the poorperformance. Interestingly, while the Center can acknowledgethis problem, its hands are tied because the decision on transfersand personnel related issues in education falls under thejurisdiction of the State government.5 In Punjab, the NSS data reveals that completion ratesimproved by almost 17 percentage points between the 42nd andthe 52nd Rounds. However, the NFHS 1 and 2 datasets revealsthat completion rates have actually fallen. The rural completionrates from NFHS 2 are much lower than even the NFHS 1. Thisis not easy to explain.
���� � � 1?� �� 4��� 3� 1+� � �$
��
moderately high (such as in Punjab6), and in yet others,both enrolment and completion may be relatively low,such as in Uttar Pradesh and Bihar.
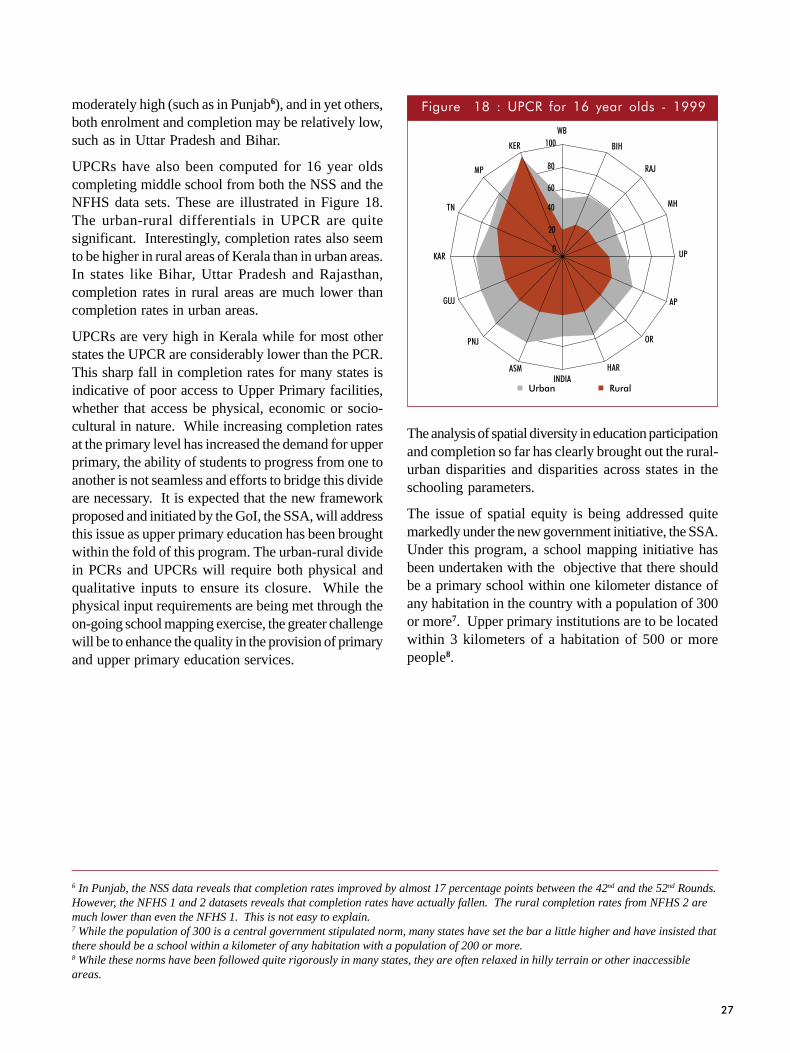
UPCRs have also been computed for 16 year oldscompleting middle school from both the NSS and theNFHS data sets. These are illustrated in Figure 18.The urban-rural differentials in UPCR are quitesignificant. Interestingly, completion rates also seemto be higher in rural areas of Kerala than in urban areas.In states like Bihar, Uttar Pradesh and Rajasthan,completion rates in rural areas are much lower thancompletion rates in urban areas.
UPCRs are very high in Kerala while for most otherstates the UPCR are considerably lower than the PCR.This sharp fall in completion rates for many states isindicative of poor access to Upper Primary facilities,whether that access be physical, economic or socio-cultural in nature. While increasing completion ratesat the primary level has increased the demand for upperprimary, the ability of students to progress from one toanother is not seamless and efforts to bridge this divideare necessary. It is expected that the new frameworkproposed and initiated by the GoI, the SSA, will addressthis issue as upper primary education has been broughtwithin the fold of this program. The urban-rural dividein PCRs and UPCRs will require both physical andqualitative inputs to ensure its closure. While thephysical input requirements are being met through theon-going school mapping exercise, the greater challengewill be to enhance the quality in the provision of primaryand upper primary education services.
���� � � 1@� �� �4��� 3� 1<� � �� ��$� 2� 1AAA
The analysis of spatial diversity in education participationand completion so far has clearly brought out the rural-urban disparities and disparities across states in theschooling parameters.
The issue of spatial equity is being addressed quitemarkedly under the new government initiative, the SSA.Under this program, a school mapping initiative hasbeen undertaken with the objective that there shouldbe a primary school within one kilometer distance ofany habitation in the country with a population of 300or more7. Upper primary institutions are to be locatedwithin 3 kilometers of a habitation of 500 or morepeople8.
6 In Punjab, the NSS data reveals that completion rates improved by almost 17 percentage points between the 42nd and the 52nd Rounds.However, the NFHS 1 and 2 datasets reveals that completion rates have actually fallen. The rural completion rates from NFHS 2 aremuch lower than even the NFHS 1. This is not easy to explain.7 While the population of 300 is a central government stipulated norm, many states have set the bar a little higher and have insisted thatthere should be a school within a kilometer of any habitation with a population of 200 or more.8 While these norms have been followed quite rigorously in many states, they are often relaxed in hilly terrain or other inaccessibleareas.

�
As stated earlier, gender equity refers to the disparities inopportunities of the traditionally disadvantaged gendergroup, i.e., females, compared to males, in their literacylevels, access to various levels of schooling, participationand completion. In this section gender-relateddiscrepancies in literacy, enrollment and completion arepresented. A persistent and significant gender gap is anunfortunate feature of the education sector in India and isevident in all indicators pertinent to education, such as,literacy, enrollment, retention, dropouts, and learningachievements. When combined with other factors, suchas, socio-economic classes or region of residence, thisgender gap typically tends to widen even further1.
����������!�����������������
The number of literates in the country has increasedby ten-fold, from 52 million to about 570 million literatessince 1950. However, during this time the number ofilliterates in the country in absolute numbers has alsoincreased. The number of illiterate males and femalesin India today stands at a staggering 191 million and269 million respectively. Figure 19 shows the maleand female illiterate population in the country between1981 and 2001. So while there have been considerableimprovements in literacy and the provision of education,population has increased at a faster rate, adding to thenumber of illiterates.
Provisional results from the National Population Census(2001) suggests that over three-quarters of the male
�������� -
�B���#� ������� ��0��
population today displays functional literacy, while abouthalf the women are said to be literate. In 1951, lessthan a tenth of the women were said to be literate andonly about a quarter of the men were consideredliterate. The gender gap widened initially and now witha concerted effort by the Central and StateGovernments, this gap has started to narrow towardsthe end of the last decade as illustrated in Figure 20. Alittle over a third of the non-literate population can befound in UP, Bihar and Orissa2. The gender gaps inliteracy are reflective of the poor base from whichefforts to improve this began, and is a function of thecontinued poor enrolment and completion of girls in theprimary cycle. Though the gender gaps in bothenrollments and completion have narrowed over theyears, they have not completely closed and particularlyin states like UP, Bihar and Rajasthan, which also havelarge populations.
����������!���������������������
The participation of girls in education in India has increasedunambiguously since independence across all levels ofeducation. This can be seen from Figure 21. Thepercentage of girl’s enrollment to total enrollment hasincreased from about 28 percent in 1951 to a little under
���� � 1A� � ���* � 3� ��2��� �� $� *�! �� � 61A@1� 2� +,,18
���� � +,� � ��� ���� ��� $� *�� ! �� 61A>1� 2� +,,18
1 The only exception is in high school pass rates in standardizedtests (10+2 examinations) in the major metropolises where girlsout-perform boys very consistently.2 Not taking into account Uttaranchal and Jharkhand.

�
44 percent in 2001 in primary schooling, and from 16percent to 41 percent in Upper Primary, from 13 percentto 39 percent in Secondary and Higher Secondary, andfrom 10 to 37 percent in higher education over the sameperiod. In terms of absolute numbers, girls enrolment hasbeen consistently lower than that of boys over this periodacross all levels of education.
By the late nineties most states had achieved GERs ofnearly 100 percent for boys, and for girls many hadexceeded GERs of 80. The two worst performingstates, Uttar Pradesh and Bihar, had girls GERs ofabout 49 and 59 percent respectively. While some stateswere close to achieving parity between boys and girls(for example, Tamil Nadu, Kerala, and Maharashtra)for many of the states there remains significant gapsbetween male and female enrollment. For example,GERs for boys in Bihar was around 90 percent, whileGERs for girls was about 59 percent, similarly the GERof boys in Uttar Pradesh was 75 percent in contrastwith the GERs for girls which was about 49 percent.
The gaps between boys and girls in ASAR for the 6-10 year old as evident from the recent most householdsurvey of NFHS II (1999) is illustrated in Figure 22.The gaps in enrollment are quite large for the states ofBihar, Uttar Pradesh, Rajasthan, Orissa, and MadhyaPradesh. On the other hand, Kerala for seems to showa higher girl’s ASAR than for boys. The differencesin enrollment between boys and girls for the states ofAndhra Pradesh, Gujarat, Haryana, Punjab,
Maharashtra, West Bengal and Tamil Nadu are notvery large. A key observation that needs to be madefrom this graph, is that the average discrepancy in allof India is considerably high amounting to almost 20percentage points. This almost entirely reflects thediscrepancies in the five poorly performing states listedabove, which also happen to be large states in terms oftheir populations, and thus the combination of poorperformance and large size in these states offsets anypositive developments in the other states and rendersthe overall performance as quite poor.
Figure 23 shows gender disparities in enrollment for anolder cohort of 11-13 year old children for UpperPrimary classes. The disparities across gender widens
���� � � +1� �� ���� ��� ��� $� 2� !��$� ���� (�$
Source: Ministry of Statistics and Programme Implementation
���� � ++� �� ! �� � ��$����� $� ��� ����� 3<21,� � �$� ��� 2� 1AAA

��
at this higher level enrollment suggesting that theretention rate among boys is higher than for girls, andthat more girls drop out of the educational system duringthe transition from Primary to Upper Primary classes.This is true in almost all states except for a few, suchas, Kerala, Punjab, Assam and Haryana. The disparitiesin Bihar, Rajasthan and Uttar Pradesh at this level aretremendous. The graph also illustrates that the girlsfind it more difficult to make a transition across thebarriers between Primary and Upper Primary schooling.
Further disaggregating the available information to lookat enrollments across different age groups, by genderand by the location of residence, i.e., urban or ruralresident, illustrates the vulnerable nature of girls ingeneral, and in particular the vulnerable nature of ruralgirls. Rural girls have the lowest ASAR across allpossible categories, viz., rural girls, rural boys, urbangirls and urban boys, across all four surveys. The soleexception is in Kerala from the NSS 52nd Round, whererural girls enrolment exceeds enrolment for urban girlsby 1 percentage point. For the better performing states,such as Kerala, Maharashtra, Punjab, Haryana, andTamil Nadu, the differences between ASAR for 6-10year old girls across urban and rural areas hasdecreased over the years. For example, the 1985/86NSS 42nd Round survey finds that about 85 percent ofthe girls aged 6-10 years old in urban areas of Punjab,attended primary school, while only about 62 percentof girls of the same age, living in rural areas of Punjabattended primary school, and in the 52nd Round, thesenumbers were 86 percent from urban areas and 83percent from rural areas. The NFHS also reveal asimilar trend. The gap between urban and rural boys
and girls decreases between the two rounds. Thissuggests a considerable expansion of schooling accessin rural areas relative to the expansion of access inurban areas in these well performing states. Amongthe poor performers also there is an unambiguousconvergence between rural and urban disparity bygender, although evidence from the NSSs 42nd and 52nd
rounds negate this for UP, Bihar and Rajasthan wherethe urban-rural gap in enrollment widens for girls. Thiswidening is a cause for concern and needs to be studiedmore carefully. Numerous attempts have and are beingmade with internal and external support to ensure thatgirls not only have equal access to schooling, but havepreferential access to schooling as a part of adisadvantaged group. The widening of the gap wouldsuggest that these efforts are not paying off and needthe design of these interventions need to be revisited.
"�������%��!�������������������������
Primary completion rates across gender varies widelyacross the states, and within the states across ruraland urban regions. The different surveys show thatthere are fairly wide discrepancies between thepercentage of boys and girls completing primaryschooling depending on the state where they live andon the region of residence.
West Bengal shows very poor completion rates in ruralareas in the NFHS 2 survey with just a fifth of allwomen reporting completion, while about a fourth ofall men, and of men and women combined, reportingthe same. The discrepancies across the rural-urbandivide are much greater than the discrepancies acrossgender. Across all four surveys, the difference betweenrural women and urban women in terms of primarycompletion varies between 13 and 30 percent, whilethe difference in primary completion between rural andurban males varies between about 15 and 30 percent.The differences between men and women on the basisof their region of residence varies between 2 and 14percent, including from the urban areas of the NSS42nd round and the rural areas of the NFHS 1, wherethe percentage of women completing primary schoolingis higher than that of men completing primary schooling.
In most of the poorly performing states, the discrepancyin completion rates across men and women is higher inrural areas than it is in urban areas. For example,discrepancies in completion rates between rural men and
���� � +-� �� ! �� � "�$����� $� ��� ����� 31121-� � �$� ��� 2� 1AAA

��
women in Bihar, Rajasthan and Uttar Pradesh variesbetween 11 and 30 percent, 20 and 28 percent, and 10and 28 percent respectively. The discrepancies betweenmale and female completion rates in urban areas of thesame states are between 3 and 20 percent, 2 and 24percent and 2 and 8 percent in Bihar, Rajasthan and UttarPradesh respectively. Gender disparity in PCR is evidentfor some of the states like Uttar Pradesh, but prominentlyin rural areas. In urban Uttar Pradesh, although completionrates are very low, there is no clear cut disparity betweenPCRs for men and women. In Bihar, there are significantdisparities across both gender and rural-urban differences.Completion rates for rural women are about half of thecompletion rates urban women, and the completion ratesfor rural women are significantly lower than those forrural men. Urban women too display lower completionrates than urban men in all the datasets, except for theNFHS 2 survey where urban women seem to have ahigher completion rate.
In the best performing states like Kerala, Tamil Naduand Maharashtra, there has been a convergence incompletion rates both across the sexes and acrossregion of residence. While in both Tamil Nadu andMaharashtra the earlier rounds of both data sets depictedfewer women completing primary schooling in ruralareas compared to the men from these areas, the morerecent surveys indicate near parity in male-femalecompletion in both urban and rural areas. In addition,the gap in completion between urban and rural residentshas also narrowed considerably.
'!!���"�������%��!�������������������
Upper primary completion rates are significantly lowerthan primary completion rates across the country,except in Kerala where both primary and upper primarycompletion rates are very high. Upper primarycompletion varies widely across gender in almost allthe states, and within the states across rural and urbanregions. The different surveys show that there arefairly wide discrepancies between the percentage ofboys and girls completing upper primary schoolingdepending on the state where they live and on the regionof residence. In Uttar Pradesh, for example, upperprimary completion rates in rural areas are low forwomen across all the data sets, and the urban-ruralgaps on female completion are high across all surveys.From the NFHS 2 a little over a fourth of all womenreporting completion, while more than half of all menreport the same. The gap across the rural-urban divideare much greater for women than for men. Across allfour surveys, the difference between rural women andurban women in terms of upper primary completionvaries between 27 and 36 percent, while the differencein upper primary completion between rural and urbanmales varies between about 2 and 11 percent. Thedifferences between men and women on the basis oftheir region of residence varies between 23 and 34percentage points in rural areas across all four surveys,and from 2 to 16 percentage points in urban areas acrossall four surveys. In fact, the NFHS 2 actually shows
���� � � +;� �� 4����� ����:� ��� ���������� ��� 2� (�$
���� � � +>� �� 4����� ����:� ��� ���������� ��� 2� !��$

��
that in urban areas of UP, the percentage of 16 yearold girls completing upper primary school is 4 percentagepoints higher than for men. While the UP data displaysa narrowing of the gap for men between urban andrural areas across all four surveys, in Bihar malediscrepancies in upper primary completion does notseem to change much across the surveys.
As already explained in the case of spatial completionrates among the children considered, there is also thecase of actual number of girls and boys enrolled andcompleted. Since the CR is measured on the basis ofthe GER, the actual CR among all children will be lessthan the CR as explained earlier in this note. Figure’s24 and 25 shows the CR and actual CR among boysand girls and it shows that the number and percentageof children who complete schooling are indeed low thatthe non-enrolled and drop outs are quite large.
As seen in an earlier section there are significantvariations in literacy across gender groups. Further,disaggregation of data on men and women by wherethey live, their social caste and their earning abilities,provides insight into how these factors work togetherto influence educational attainment. The factorscontributing to this continued disparity in literacy acrossgender are numerous and include the poor literacy basefrom which women started, the continued social,religious, cultural and economic biases against womenand their education. Historical factors also play a keenrole in the determination of the literacy and/or enrolmentstatus of populations. Economic factors and a lack ofinterest are often cited as key reasons for girls notbeing enrolled. The lack of interest is almost certainlya reflection of parental attitudes towards their children,and not the attitude of girls towards schooling. Thereis evidence from states in India that suggestsconsiderable difference in the attitude of parentstowards the education of their sons and daughters. Thedifferences in gender related outcomes stems fromdifferences in decisions on investment arrived upon inthe household, and on the value placed on the schoolingof boys and girls. Educating boys is seen as aninvestment since boys are the main source of old agesupport, while investment in girls’ education is seen asa benefit to the family into which she marries, and nother own family. Furthermore, the purpose and valueplaced in the education of boys is based on the expectedearnings or lifetime returns of the son(s) in the future,whereas the value of educating their daughters istraditionally seen on how it improves her likelihood of
marriage3. Other demand side correlates for lowenrollment and poor attendance include the number ofhours spent on housework, the household size, socialcaste, literacy status of the head and spouse of head,and main economic activity of the household.
Supply side factors are also very important in determiningfemale enrolment and attendance, and these includequantitative inputs as well as qualitative ones. Forexample, the proportion of female teachers has beenfound to be a significant correlate of female studentenrollment, the availability of single-sex schools, thedistance of the school from the home, and theavailability of separate amenities, such as, toiletsreserved for girls. This is particularly true for enrollmentand attendance for upper primary and middle schoolstudents. In addition to these factors, classroompractices are also important. The value placed on theeducation of girls at the household level (as mentionedabove) is also to some extent mirrored in classroompractices, with female students receiving less attentionfrom the teacher than male students.
Numerous programs have been initiated by thegovernments at the Center and State levels to enhancethe enrollment, attendance, retention and completion offemale students across all levels of schooling and amongall population groups. The results are mixed. While thereis no doubt that literacy, enrollment, retention andcompletion have improved across most states, there arestill pockets (fairly sizeable pockets) of tremendousdiscrepancies across gender. The GoI through itsProgramme of Action (PoA), 1992, acknowledges theimportance of girls education by stating “it is impossibleto achieve UEE unless concerted efforts are made toreach out to the girl child”. The strategies adopted haveincluded raising community awareness, provision of childcare support, transportation support for girls and residentialschools, increasing the proportion of female teachers,provision of amenities like a separate girl’s toilet in schools,and more direct forms of intervention such as financialsupport to the household for girls enrolment, notebooksand textbooks provision and uniforms. Different stateshave even adopted flexible schooling schedules to allowgirls to combine household chores with school work.
4 Anecdotally, this is true even for economically well-offhouseholds and to those belonging to forward castes.

��
Unlike many other countries of the world, where socialinequities in access to educational services usuallyrevolves around the access of such services to minoritygroups, social inequities in India are closely intertwinedwith the system of castes. Although members belongingto these groups of often lumped either as ScheduledCastes, Scheduled Tribes or Other Backward Castes,in reality there are almost 2000 Scheduled Castes andTribes in India. Discrimination against under-privilegedgroups in schooling inputs is endemic in India, althoughvarious governments in India have committedthemselves to eliminate discrimination across castelines1. Such discrimination manifests itself in manyways, for example, the kind of schooling to whichchildren have access, the physical infrastructure inschools based on student characteristics, and to eventhe direct discrimination of children that exists withinclassrooms and bureaucracies. This further impactsupon the achievement levels of disadvantaged groups.Given the large number of castes and tribes,intervention that is tailor-made for these sub-groupswould likely be needed to see appreciable changes inoutcomes.
����������!�����������������
India has always been identified with its social castesand caste is a fundamental institution of both traditionalas well as modern India. Furthermore, caste politicshave played an important part in determining the literacyand educational achievements of the country’spopulation to a large extent. The opportunities to attendschool and benefit from government programs arecritically influenced by social, cultural and traditionalperceptions. There is some evidence that literacy andeducation programs targeted at some of these groupsmay have had a positive impact, particularly on theparticipation of scheduled castes and scheduled tribesin schooling activities.
Although the literacy rates by caste groups are not yetavailable from the most recent census, the results fromthe 1991 Census reveals that while the overall literacyrate for the country was 52.2 percent, the literacy ratefor SCs and STs was only 37.4 and 29.6 percent
�������� ;
������� ���B������
respectively. The Census 1991 results however showthat this pattern cannot be generalized across all states.For the states of Arunachal Pradesh, Assam, Dadraand Nagar Haveli, and Daman and Diu the overallliteracy rates are lower than the literacy rates amongSCs. In all states except Mizoram and Sikkim, theliteracy rates among STs is lower than the nationalaverage. In Bihar, Uttar Pradesh, Meghalaya, Mizoram,and Sikkim, the literacy rates among STs tends to behigher than the literacy rates among SCs. Severalstudies have confirmed the existence of such wide gapsin educational outcomes across caste groups, like thestudy by Acharya (2001) on literacy in Maharashtra.Furthermore, districts with large SC and ST populationsalso show lower overall literacy. The differencebetween overall male literacy and ST female literacyis almost 50 percentage points.
The lowest literacy rate recorded from the 1991 Censuswas for ST women in Rajasthan with a little over 4percent of the women being literate. This comparedto a overall literacy rate of about 55 percent for men in1991. Similarly, ST women in Andhra Pradesh (9percent) and SC women in Bihar (7 percent) andRajasthan (8 percent) too show evidence of very lowliteracy. There is some evidence of students beingsegregated by castes into different schools. ThePROBE (1999) report mentions dalit students in somevillages of Mirzapur being sent to government schools,while most high-caste students attend private schools.This could also mean that higher caste families arericher, and spend more to send their children to privateschools, but there are signs that an even bigger problemcould be emerging on this front. In a short survey ofschools in different parts of the country, Ramachandran(2002) writes “there is a divide between the GovernmentPrimary School (GPS) located in the Dalit basti andthe GPS in the forward caste hamlet – only SC studentsattend the former school, while the latter have veryfew SC students.” This issue has also emerged infocus group interviews with households with membersbelonging to one of lower castes stating that they were
1 Tamil Nadu has had much success in eliminatingdiscriminatory practices against groups that were traditionallydisadvantaged.

��
openly advised against enrollment in particular schoolson account of their caste, although in household surveyspoverty is still identified as the key stumbling block andcaste status or tribe status being given much lessimportance.
Evidence from the PROBE report also suggests thatthere are considerable differences in schoolinginfrastructure quality across different regions dependingupon the proportion of scheduled caste or tribe membersin that population. The report also adds that even in acity like Delhi, there are significant differences in thequality of government schools depending on the socialcomposition of the neighbourhood in which thoseschools are found.
���!���������������
Evidence from the various population censuses, the NSSand the NFHS, all suggest that school participation byboth SCs and STs is significantly lower than those byother groups. Figure 24 illustrates the disparities acrosssocial groups in ASAR for 6-10 year olds from the52nd Round of the NSS.
As was seen in an earlier section, gender and regionrelated discrepancies can be seen in education andliteracy data from all over India. Gender and regionrelated discrepancies can also be viewed through alens on social differences. Literacy indicators,enrollment and completion indicators are systematically
higher for men than for women across all these socialgroups, with the disparities widening among SC andST populations. Similarly, across all social groups, thereare significant differences in urban-rural discrepanciesin literacy indicators and in enrollment and completion,but the discrepancy associated with the region ofresidence is higher for SCs and STs as compared tothe rest of the population.
While it is difficult to extract a common picture ofattendance ratios for SCs and STs in the states acrossall the different datasets, one clear trend does seem toemerge – the attendance ratios of both SCs and STsincrease unambiguously between the two NSS roundsand the two NFHS rounds for almost all fifteen states.Kerala again performs very well with very high SCand ST attendance of above 90 percent for 6-10 yearolds. Tamil Nadu and Maharashtra illustrate lowerattendance ratios for STs between 80-90 percent2.Andhra Pradesh shows the greatest disparity betweenSC and ST attendance rates for any state using theNFHS 2 data set, with attendance ratios for SCs beingin the high eighties and attendance ratios for STs fallingto about 50 percent. Bihar is the worst performerfrom among the fifteen states in terms of ASARs forSCs and STs. Tamil Nadu, Kerala and Maharashtrahave done extremely well in 6-10 years ASARs withreported attendance of over 90 percent from the NFHS2. Three states that are traditionally considered asweaker states, AP, Orissa and West Bengal according
���� � � +<� �� ������ "�$����� $� ��� �� � ����3� <21,� � �$� ��� 2� 1AAA
���� � � +?� �� ������ "�$����� $� ��� ����� 211� 2� 1-� � �$� ��� 2� 1AAA

��
to the NFHS 2 have 6-10 year old ASARs of above80 percent.
Figure 25 presents a picture of the gaps that exist inupper primary attendance rates from the NSS 52nd
Round. It is again difficult to establish any clear,coherent, picture at this higher schooling level acrossthe states. High performers, like Kerala, that havedone well continue to do so with attendance rates wellabove 90 percent for both SCs and STs. States likeBihar who have consistently done poorly, again farepoorly in upper primary attendance among socialgroups. There are significant discrepancies inattendance between SCs and STs in states like TamilNadu and Haryana and Andhra Pradesh, with gapsbetween SC and ST attendance in the order of 20-30percentage points. The caveat remains that somestates like Kerala, Haryana and Tamil Nadu have smalltribal populations and the number of observations inthe sample is very small.
���!�������������������������!����"�������%��!������
Primary completion rates vary starkly acrossdifferent social groups. In Kerala, PCRs are highacross all social groups (and for the population ingeneral) with more than 90 percent of all childrenand all SC children completing primary schooling,and more than 80 percent of all ST childrencompleting the primary level. In Tamil Nadu,completion rates are above 80 percent when lookingat the general population, and for SC children. Thesmall population of STs in the state, however, do notperform as well and display significantly lowercompletion rates3. Punjab, Karnataka, Gujarat andMaharashtra have similarly high completion rates inboth the NSS 52nd round and NFHS 1999 for theoverall population, and for SC populations. For STpopulations, the rates of completion are not so high.From the NSS 52nd round, Tamil Nadu, Haryana,West Bengal are seen to perform very poorly withcompletion rates lower than 10 percent. Surprisingly,this is one statistic where Bihar is not seen to be theworst performing state. There is a fairly consistenttrend when comparing the two NSS surveys witheach other and comparing the two NFHS surveyswith each other and one sees a trend wherecompletion rates are increasing across the surveys.
���!�������������������������!��-�'!!���"�������%��!������.
Differences across social groups in completion at theupper primary level reveals a smaller range acrossstates, with a clustering towards a lower average(except for Kerala). UPCRs are significantly lowerthan PCRs for most states. Kerala demonstrates veryhigh rates of upper primary completion across all socialgroups particularly from the latter rounds of the twosets of data.
The same is not true across other states, for example,in Tamil Nadu, while about two-thirds complete theupper primary level across all groups, and a similarproportion of SCs also complete upper primaryschooling. The completion rates for STs drops quiteprecipitously to about 39 percent in Tamil Naduhowever from the NFHS 2. For Tamil Nadu, the NSS
���� � � +@� �� ������ "�$����� $� ��� 4��� 31+� � �� ��$� 2� 1AAA
2 Haryana, Punjab, Kerala and Tamil Nadu have small STpopulations, and the sample on which the above claims are madeis very small as well and therefore does not really allow for anyconclusive observations.3 There is a tremendous discrepancy between the completionrates for all children and for all SC children compared with STfrom the NFHS 2 survey. While completion rates for all childrenand all SC children is above 80 percent, completion rates for STchildren is seen to be lower than 10 percent. The accuracy of thisinformation might be in some question. From the 52nd Round ofthe NSS, the differences in completion rates between the overallpopulation of children and all SC children is of the order of 15-20percentage points.

��
data reveals no improvement in UPCR across the bothrounds, while the NFHS data sets actually show adecline in UPCR. The difference between PCRs andUPCRs is very high across most states and is in theorder of 10 to 20 percentage points. For the worstperforming states, like Bihar, UP, and Rajasthan, theoverall UPCRs are between 20 and 50 percent, withno clear trend emerging across the four data sets. Forexample, in the case of Uttar Pradesh, while the UPCRsfor SCs are higher than the UPCRs for STs across thetwo NSS rounds, the reverse seems to hold true forthe two NFHS rounds.
���� � � +A� �� ������ "�$����� $� ��� �4��� 31<� � �$� ��� 2� 1AAA

��
Income poverty or lack of access to economicresources is often cited as the factor that most influencesliteracy and schooling attainment in India. Povertyimpacts upon educational attainment both at the levelof the household and at a more macro level. At boththese levels, poor educational attainment reinforcesincome poverty, thereby creating a vicious loop ofpoverty and low educational attainment. The role ofthe public sector in mandated elementary education isoften justified on the grounds that equity in enrollmentand completion would be inherently more difficult inless developed countries if the responsibility for theprovision of education services did not primarily involvethe government1.
Poverty has been seen to impact on educational attainmentin many ways including, (i) through the direct costs ofschooling (e,g, through tuition payments, costs of textbooks,uniforms, transportation costs and other direct and indirectcosts), (ii) through the indirect costs of schooling on poorfamilies (opportunity cost of child labor to poorer families),and (iii) lower expected benefits of elementary schoolingfor children of poorer families. Therefore, simply providingfree and universal primary education will not eliminatethe disparities that exist today in educational outcomesacross income classes in India today. Economic conditionshave often been cited by households as one of the keyfactors affecting their ability to send children to school.Even in areas where access to a free, governmentsupported public school system may be available,households face direct costs (such as, costs of uniforms,meals/lunches, transportation costs, etc.) and indirectprivate schooling costs (opportunity cost of child laborand household chores such as child care by young girls oftheir even younger siblings).
�������� >
���B������� ������� ����� ����������
���!�����������"�����������'!!��"�������������������������-�����/�������
Figure 30 illustrates the primary enrollment rates acrossurban and rural areas of India. The total populationhas been divided into five economic or income quintiles(Q1-Q5)2, using data from two different surveys, theNSS52 and the NFHS23. The graph shows that acrossboth the NSS52 and the NFHS2 surveys, enrolment atthe primary level increases unambiguously acrossincome quintiles from the poorest quintile (Q1) to therichest quintile (Q5). However, the enrolment rates inurban areas have always been higher than that of therural areas across all income quintiles. The increaseover the two survey periods have been higher for thelower quintiles, and across all quintile groups in ruralareas as their base levels are low,
Further disaggregating primary enrollment rate for 6-10 year olds across states and by rural-urbanclassification reveals that the disparities across incomequintiles were more prominent in rural areas than inurban areas and that across the same quintile levels,the urban children got enrolled more than the rural ones.For example, in Bihar, the ASAR of rural children in
���� � -,� �� 4����� ���� ��� �� � 2<21,� � �$� 2� �5� ����� � B����� � =�$
1 Of course, the same argument holds true for richer countries,with households found in pockets of poverty and deprivation,who would still it difficult to send their children to school withoutpublic assistance as in inner-cities of the United States.2 Q1-Q5 denotes the five income quintiles. The placing of an Ror U prior to the Q will denote Rural and Urban quintilesrespectively.3 For the NSS52, income quintiles are defined using consumptionexpenditure, and for the NFHS2, income quintiles are obtainedusing asset index.

�
the highest quintile groups were less than 70 percent,while that in the urban areas were more than 90 percent.This shows that the disparities in enrollment acrossincome groups is further deepened by their residentialstatus and the facilities in their locality. Similarly, not allchildren in the rural areas or lower quintiles in all statesare deprived of the schooling facility. In Kerala, theASAR or children in the lowest income quintile in therural areas is quite high, around 97 percent, as evidentfrom the graph, compared to the children belonging tothe highest income quintile in Bihar, whose ASAR isonly around 70 percent. So it is not only the incomeand residential profile, but the region they belong toalso matters in the enrolment rates. The discrepanciesacross quintiles are very high in states like Bihar, Orissaand Rajasthan amounting to about 40, 55 and 47percentage points. In Uttar Pradesh although thedifference between the enrollment rate of the highestquintile and lowest quintiles is about 30 percentagepoints, only about 70 percent of individuals in the highestquintile in rural areas are enrolled. Tamil Nadu andKerala are at the high end of the enrollment spectrumwith less than a 10 point difference in enrollment acrossthe highest and lowest income quintiles, and a very
high overall level of rural enrollment. These areillustrated in Figure 31. State-wise primary enrollmentrates for 6-10 year olds for urban areas reveals veryhigh enrollment rates for those in the highest incomequintiles. Only a fifth of the states, have enrollmentrates less than 60 percent for the lowest incomequintiles. The discrepancies across quintiles are verypronounced in states like Bihar, Uttar Pradesh and WestBengal amounting to about 55, 55 and 45 percentagepoints. Except for Kerala, in all other states the urbanASARs are unambiguously higher than rural ASARswith the difference being as little as 4 percentage pointsin Tamil Nadu to a little less than 30 percentage pointsin Rajasthan.
The range of disparity between the richest and poorestin terms of enrolment across rural-urban and stateshave been shown in graph 30. It substantiates ourargument that disparity is a cumulative factor, and thosestates where the disparities are prominent across therich and poor are the states where the disparities withinan income group across rural and urban areas also getdeepened.
���� � -1� �� ����� 6<21,� � �$8� 2� ����� ��$$� ���� � ���$
���� � -+� �� ����� 6<21,� � �$8� �*��� ��$$� ���� � ���$

�
For all states, ASARs are significantly larger for thehigher income quintiles than for the lowest quintiles.In Kerala, the gap between RQ1 and RQ5 is less thana percentage point for the NSS52. Very large disparitiesin ASAR between RQ1 and RQ5 are evident in stateslike Andhra Pradesh, Rajasthan and Bihar withdifferences between 35 and 42 percentage points,however, the overall ASAR in Andhra Pradesh fromthe NSS52 is about 72 percent compared with Rajasthanand Bihar, where the overall ASARs are 54.72 and43.85 percent respectively. These two latter stateshave the lowest ASARs in NSS52. Kerala and TamilNadu are on the other end of the ASAR spectrumwith the highest rural ASARs of 98.31 and 90.25percent from NSS52. Maharashtra, Punjab andHaryana have rural ASARs between 80 and 90percent, while Gujarat, Karnataka, Andhra Pradesh andAssam have rural ASARs in the range of 70 to 80percent, finally, Madhya Pradesh, West Bengal, Orissaand Uttar Pradesh have rural ASARs between 60 and70 percent.
It is of particular concern that for many states the gapbetween the NSS42 and NSS52 in ASAR hasincreased between RQ1 and RQ5, except for Gujarat,Tamil Nadu, Maharashtra, Punjab, Uttar Pradesh, andWest Bengal, where there was a decrease in the gapbetween the poorest and richest quintile. For thosestates where there was an increase in the gap betweenRQ1 and RQ5, the increases range from 5 to 26percentage points, and for those states that witnesseda decline in the gap between RQ1 and RQ5 betweenNSS42 and NSS52, the decline ranges from 1percentage point in Uttar Pradesh to 18 percentagepoints in Gujarat. Orissa displays the largest gapbetween RQ1 and RQ5 for NSS52 amounting to a littleover 54 percentage points.
In contrast to rural areas, where most states displayed awidening of the gap between RQ1 and RQ5 across NSS42and NSS52, in urban areas, most states show a decline inASAR across UQ1 and UQ5. The only states wherethe gap between UQ1 and UQ5 has increased are Assam,Uttar Pradesh, Gujarat, Kerala, and Madhya Pradesh fromabout 1 percentage point in Kerala to about 23 percentagepoints in Assam. The gap between UQ1 and UQ5 forboth NSS rounds is the highest in Bihar equal to about 50percentage points in each round.
In a couple of the states, viz., Karnataka and Rajasthan,within quintile increases have happened mostly in thehigher quintiles in rural areas, and within quintileincreases in urban areas have occurred mostly in thepoorest quintiles. What this might suggest is that whileaccess has increased in both rural and urban areas, thebenefits of increased access in rural areas are beingcaptured by the relatively more wealthy, and the benefitsof increased access in urban areas are being capturedby the relatively poorer quintiles.
���� � --� �� ����� <21,� � �$� ��$$� �� � �= $����� ���� $�� ���$� 3� 5� ����� � ������� $
���� � -;� �� 4��� ����� ���� � ���$� 2� �����
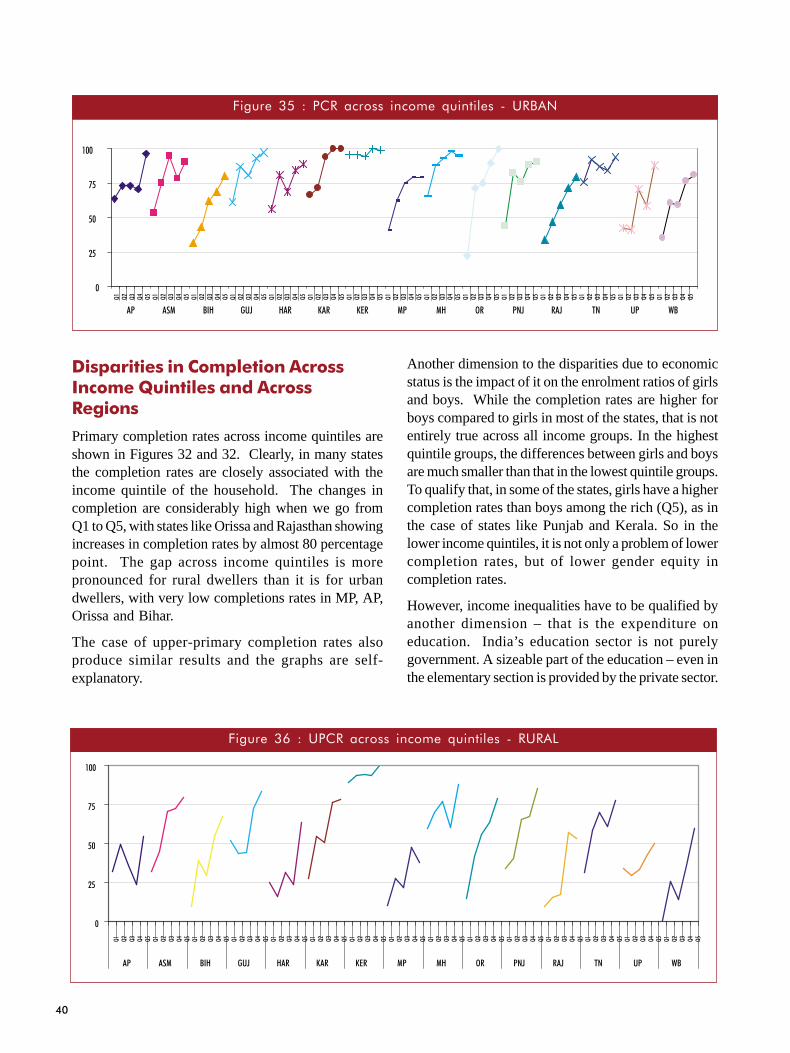
��
���!�����������%��!�������������-������/������������������������
Primary completion rates across income quintiles areshown in Figures 32 and 32. Clearly, in many statesthe completion rates are closely associated with theincome quintile of the household. The changes incompletion are considerably high when we go fromQ1 to Q5, with states like Orissa and Rajasthan showingincreases in completion rates by almost 80 percentagepoint. The gap across income quintiles is morepronounced for rural dwellers than it is for urbandwellers, with very low completions rates in MP, AP,Orissa and Bihar.
The case of upper-primary completion rates alsoproduce similar results and the graphs are self-explanatory.
Another dimension to the disparities due to economicstatus is the impact of it on the enrolment ratios of girlsand boys. While the completion rates are higher forboys compared to girls in most of the states, that is notentirely true across all income groups. In the highestquintile groups, the differences between girls and boysare much smaller than that in the lowest quintile groups.To qualify that, in some of the states, girls have a highercompletion rates than boys among the rich (Q5), as inthe case of states like Punjab and Kerala. So in thelower income quintiles, it is not only a problem of lowercompletion rates, but of lower gender equity incompletion rates.
However, income inequalities have to be qualified byanother dimension – that is the expenditure oneducation. India’s education sector is not purelygovernment. A sizeable part of the education – even inthe elementary section is provided by the private sector.
���� � ->� �� 4��� ��$$� ���� � ������� $� 2� ��(��
���� � -<� �� �4��� ��$$� ���� � ������� $� 2� �����
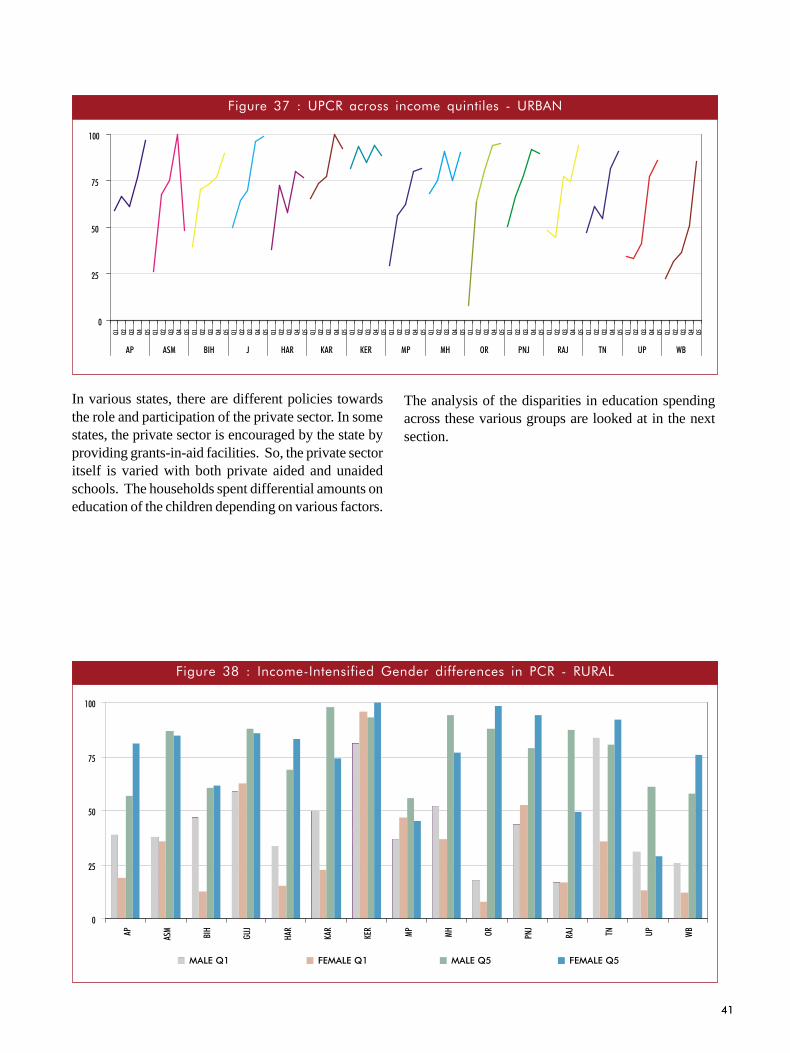
��
���� � -?� �� �4��� ��$$� ���� � ������� $� 2� ��(��
In various states, there are different policies towardsthe role and participation of the private sector. In somestates, the private sector is encouraged by the state byproviding grants-in-aid facilities. So, the private sectoritself is varied with both private aided and unaidedschools. The households spent differential amounts oneducation of the children depending on various factors.
���� � -@� �� ���� 2��� �$�3� �� ! �� � ��33 �� $� ��� 4��� 2� �����
The analysis of the disparities in education spendingacross these various groups are looked at in the nextsection.

��
Though elementary education is a public good thatmerits government provision, the private provision inthis social sector has been on the rise in India. Somestates in India facilitate the private provision in educationby providing grants-in aid, the unaided private sectorprovision, both recognized and unrecognized, are alsoflourishing in many developed areas of the country,especially in urban areas, notwithstanding the inequityquestions that surface due to their increasing presence.
At the outset, the Indian education structure iscomprised of five school types, these include (i) centralgovernment schools, (ii) state government schools, (iii)local government school, (iv) private aided schools and(v) private unaided schools. Centrally managed schoolsinclude the system of Kendriya Vidyalayas (KV) andthe Jawahar Navodaya Vidyalayas (JNV)1. Mostrecognized primary and upper primary schools are rundirectly by state and local governments, state schoolsare funded, managed and operated schools by the stategovernments and local government schools are funded,managed and operated by municipalities or panchayats.Private-aided schools (PA) are those that are managedby private educational societies, but receive fundingfrom the State governments for upto 95 percent ofrecurring expenditures. Private unaided schools (PUA)on the other hand, are privately funded, managed andoperated2. PA and PUA schools play a significantrole in providing access at the Primary level, althoughPUAs are not very relevant at the upper primary level.
Indian lawmakers have committed themselves toproviding all citizens with free primary (and recently,upper primary) education, and thus, theoretically,primary education should be accessible at no cost to allwho demand it. In reality, however, private expenditureson education is sizeable across all levels of schooling.Private expenditures on schooling are incurred on twocategories, fees expenditures and non-feesexpenditures3. This is true even in government schoolsthat do not charge a fee, and which in many cases alsoprovide free meals4, textbooks, and uniforms. Theseitems, such as, books, uniforms, transportation, are often
�������� <
"��4�������� ��� �%�� 4��/���� ��"� 4�(����04��"���������� ��%�����!
referred to as non-fee expenditures, and fees-expenditures are incurred on items, such as, tuition fees,examination fees5, fees for extra-curricular activities,informal payments to teachers, etc. These privateexpenditures on schooling vary by the level of schooling,by location and region of the schools, the type ormanagement of the school (i.e., PAs or PUAs) and bysocio-economic characteristics of the households whosechildren study in these schools. These payments canrestrict access for those unable to pay for participationand completion at different schooling levels.
Private household expenditures differ across schoolson the basis of the type of school the students attend,and within that they vary across states. The householdexpenditure on children attending schools have beengenerally high in rich states like Punjab and Haryanaand in education wise, traditionally well-ahead stateslike Kerala and Himachal. Parents spend slightly moreon the education of boys than in girls, which was foundto be a universal phenomenon.
Precisely, it is due to these private expenditure issuesthat the presence or absence of private sector schoolsand their locations becomes an equity issues. While 3/4th of the students in elementary education are enrolledin government and local body schools, around 15 %are enrolled in private aided schools and the rest, in
1 KVs are schools that were established across the countrylargely to cater to children of government employees to ensurethat transfers from one part of the country to another does notresult in a dislocation in the education of their children. JNVsare special residential schools aimed at poor children in ruralareas. These schools were set up to attract children from lessaccessible areas to a central location.2 PUAs are not fully included in government statistics oneducational institutions since a large number of PUAs areunrecognized by the government and thus do not figure in theoverall assessment of the size of private provision of educationservices.3 Sometimes fees and non-fees expenditures are also referred toas school and non-school expenditures respectively.4 Under the Mid–day meal schemes, the government schoolsprovide free meals to all its students.5 This is particularly true for students in unrecognized PUAs.

��
���� � -A� �� 4 � $��� ��� � ���� �& �� � ��$ ���� $� ������ �� �������
���� � ;,� �� 4 � $��� ��� �& �� � ��$ ���� $� ������ �� �������� *�� $���� ��� � 2� 3� ����� *�$
���� � � ;1� �� 4 � $��� ��� �& �� � ��$ ���� $� ������ 3� �������� *�$���� ��� � 2� 3� ����� ���$

��
unaided private schools. However, in rural areas, 86% of the students are enrolled in government schoolsas against 55 % in urban areas. The enrollment ofstudents in government schools also vary across thestates and in terms of their socio-economic status. Instates like Kerala, Punjab and Haryana, the enrollmentin government schools are less as the aided and unaidedprivate schools are attracting students for variousreasons – reasons relating to various types of accesses– geographical, economic, social and cultural – whichare not addressed in this paper.
It is also interesting to see that as expected, the studentswho hail from higher economic background mostly
attend private schools more than the students frompoorer background and this is true cutting across allstates. It is also true that students from the deprivedcommunities attend government schools more thanthose from the other communities.
"������!�����������������
Elementary education is a merit good. It has thecharacteristics of public good, at the same time, providesprivate benefit to individuals by enhancing theircapabilities. In the welfare paradigm of politicaleconomy, state has the responsibility and duty to provideeducation to the needy, thus facilitating universalisation
���� � � ;+� �� 9� 3� $��� ��$� ��� �� ��!& �� ��� 4����� $���$
���� � � ;-� �� 9� 3� $��� ��$� ��� �� ��!& �� ��� $���$� 2� ��� � �����
���� � � ;;� �� 9� 3� $��� ��$� ������� ��� �&�7� $���$� *�� 5� ����� � ������� $� 2� 4����

��
of education, at least at the elementary level. In India,education is placed in the concurrent list and the stategovernments are given the authority to decide howmuch to spend on their education budget, most oftensupported by the central grants. This is to facilitatestates at different levels to plan according to theirneeds. However, different states have placed educationat different levels of priority in their investment plansand this is visible in the state spending on elementaryeducation. The implication of such spending is alsonot unique or uniform across states, and the peoplewho benefit out of state spending on education variesin their socio-economic background. One of therationale for and expectations of public spending is thatit benefits the poor and socially disadvantaged in thesociety to participate and complete school education.However, as evident from the school enrolment andcompletion analysis, the states differ enormously in allaspects and with regard to different social andeconomic as well as gender groups.
Government can use the resources at its disposal inmany ways to achieve the education objectives throughits spending mechanism. Subsidies could be used as apowerful welfare augmenting instrument of fiscal policy(see GOI, 1997 for further details). Subsidies aim atreducing the price of the goods, so that they areavailable to larger sections of the population.Government of India (1997) identified in a White Papera large set of social and economic services, classifiedthem into public goods, merit goods and non-meritgoods, and proposed to reduce subsidies to non-meritgoods. In case of the education sector, education upto elementary level is considered as a merit good, andeducation beyond elementary level, i.e., secondary andhigher education, is labeled as a non-merit good, asfalling outside the ambit of merit category. Subsidiesin education are also advocated on the grounds ofproviding equality of opportunity. Ensuring equality ofopportunity in education to every one irrespective ofnot only social background, but also economicbackground is considered an important function of themodern State. Education is found to be an effectiveinstrument of equity. In the absence of public subsidies,only those who could afford to pay would enroll inschools. The concern for equality of opportunity hasled to almost universal agreement that the governmentshould subsidise education.
However, there are many who argue that publicsubsidisation of education produce perverse effectson distribution. It is argued that, public subsidisationof education, especially higher education, would beregressive, increasing income inequalities bytransferring the resources from the poor to the rich,as the education (particularly, but not exclusivelyhigher education) subsidies accrue more to the richthan to the poor (Psacharopoulos, 1977; Blaug, 1982,1992; Mingat and Tan, 1986a, b;Jimenez, 1987, 1994;World Bank, 2000, p.80). Reduction in educationsubsidies in general is also advocated arguing thateducation subsidies, including some specific subsidesin basic education, could be targeted to the pooronly (World Bank, 1994). The debate between thetwo sides, familiarly known as liberal versus neo-liberal groups,is intensifying in the recent years(Hinchliffe, 1993).
Trends in government expenditures on education ispresented in an earlier section. Figure 30 shows publicexpenditure by state as a percentage of GSDP. It isobvious that Himachal and Kerala spend the most as aproportion of their GDPs on education. Although thismight explain their success in achieving near universalliteracy (at least Kerala) and enrollment, the same isnot true for the other two big spenders, Orissa andBihar. These two states are characterized by pooroutcomes across most of the indicators that have beenlooked at. The problem with such a measurement ofpublic expenditure as percentage of GDP is that it isheavily dependent on the level of GDP and Biharobviously does not figure in the list of states with highincomes, and hence, actual levels of expenditure oneducation is low.
Public expenditures on elementary education in themajor states of India have also been assessed on thebasis of a benefit incidence analysis (BIA) or anassessment of the incidence of education expenditurerelative to the incomes of user households. For thepurpose of the BIA, information on public expenditureson education has been collected from the Analysis ofBudgeted Expenditure on Education6 by the Indicus
6 Published annually by the MHRD and contains information ongovernment expenditures on elementary and secondaryeducation.
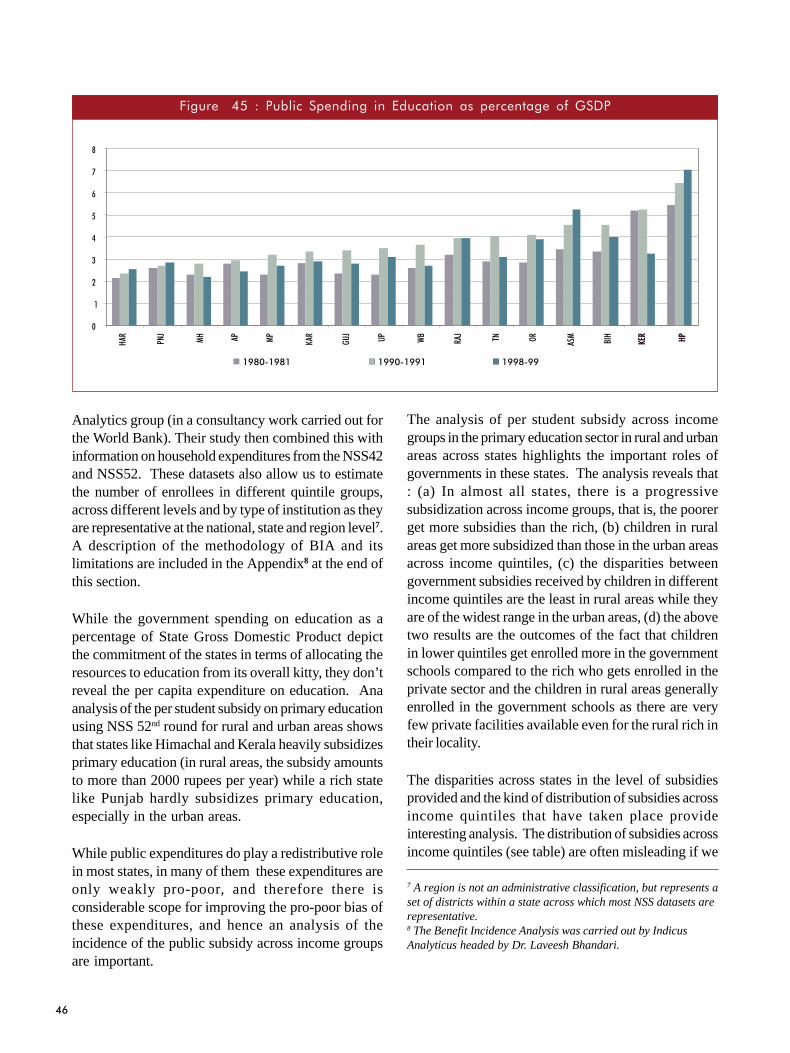
��
Analytics group (in a consultancy work carried out forthe World Bank). Their study then combined this withinformation on household expenditures from the NSS42and NSS52. These datasets also allow us to estimatethe number of enrollees in different quintile groups,across different levels and by type of institution as theyare representative at the national, state and region level7.A description of the methodology of BIA and itslimitations are included in the Appendix8 at the end ofthis section.
While the government spending on education as apercentage of State Gross Domestic Product depictthe commitment of the states in terms of allocating theresources to education from its overall kitty, they don’treveal the per capita expenditure on education. Anaanalysis of the per student subsidy on primary educationusing NSS 52nd round for rural and urban areas showsthat states like Himachal and Kerala heavily subsidizesprimary education (in rural areas, the subsidy amountsto more than 2000 rupees per year) while a rich statelike Punjab hardly subsidizes primary education,especially in the urban areas.
While public expenditures do play a redistributive rolein most states, in many of them these expenditures areonly weakly pro-poor, and therefore there isconsiderable scope for improving the pro-poor bias ofthese expenditures, and hence an analysis of theincidence of the public subsidy across income groupsare important.
The analysis of per student subsidy across incomegroups in the primary education sector in rural and urbanareas across states highlights the important roles ofgovernments in these states. The analysis reveals that: (a) In almost all states, there is a progressivesubsidization across income groups, that is, the poorerget more subsidies than the rich, (b) children in ruralareas get more subsidized than those in the urban areasacross income quintiles, (c) the disparities betweengovernment subsidies received by children in differentincome quintiles are the least in rural areas while theyare of the widest range in the urban areas, (d) the abovetwo results are the outcomes of the fact that childrenin lower quintiles get enrolled more in the governmentschools compared to the rich who gets enrolled in theprivate sector and the children in rural areas generallyenrolled in the government schools as there are veryfew private facilities available even for the rural rich intheir locality.
The disparities across states in the level of subsidiesprovided and the kind of distribution of subsidies acrossincome quintiles that have taken place provideinteresting analysis. The distribution of subsidies acrossincome quintiles (see table) are often misleading if we
���� � � ;>� �� 4�*���� �� ������ ��� ��������� �$� � � ���� � 3� !�"4
7 A region is not an administrative classification, but represents aset of districts within a state across which most NSS datasets arerepresentative.8 The Benefit Incidence Analysis was carried out by IndicusAnalyticus headed by Dr. Laveesh Bhandari.
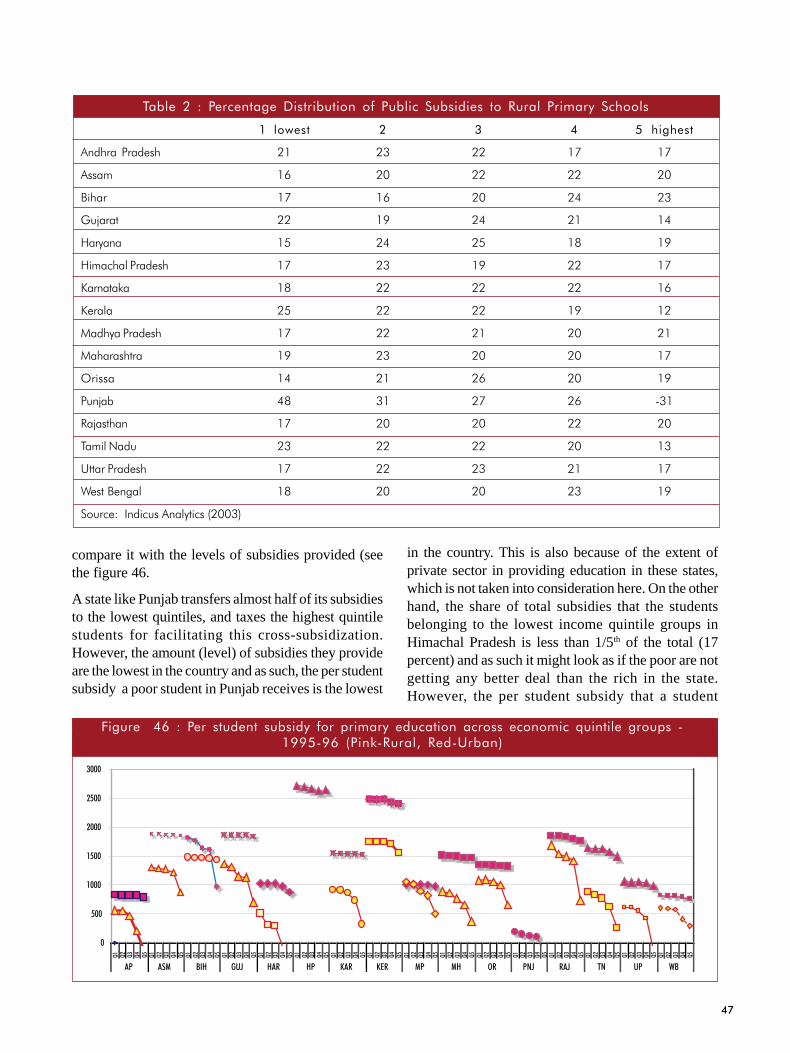
��
compare it with the levels of subsidies provided (seethe figure 46.
A state like Punjab transfers almost half of its subsidiesto the lowest quintiles, and taxes the highest quintilestudents for facilitating this cross-subsidization.However, the amount (level) of subsidies they provideare the lowest in the country and as such, the per studentsubsidy a poor student in Punjab receives is the lowest
in the country. This is also because of the extent ofprivate sector in providing education in these states,which is not taken into consideration here. On the otherhand, the share of total subsidies that the studentsbelonging to the lowest income quintile groups inHimachal Pradesh is less than 1/5th of the total (17percent) and as such it might look as if the poor are notgetting any better deal than the rich in the state.However, the per student subsidy that a student
��*� � +� �� 4 � ���� � "�$��*����� 3� 4�*���� ��*$��� $� �� ����� 4����� ����$
1� �= $� + - ; >� ���� $�
��������������� � �� ��
����� � � �� �� �
����� � � �� ��
������ �� � �� � �
!��"��� � �� �� � �
!���#��$�������� �� � ��
%���� �&� � �� �� �� �
%���$� �� �� �� � �
'���"��������� �� � � �
'������� �� � �� � �
(����� � � �� � �
�����) �� � � �� ��
*���� ��� � � �� �
+���$�,��� �� �� �� � �
- ���������� �� �� �
.�� ����/�$ � � � �� �
01��#�2��3���#������$" �#������
���� � � ;<� �� 4 � $��� ��� $�*$���� 3� ������ �������� ��$$� ������ ������� � ���$� 21AA>2A<� 64��)2����:� � �2�*��8
0
�
belonging to any income quintile groups in HimachalPradesh receives in an year amounts to more thanRs. 2500.
Even the weakly pro-poor expenditure patterns that isseen in both rural and urban expenditures on primaryschooling, vanishes at the secondary level. The shareof subsidy received by the lowest quintile is generallylow in all the states. Even at the secondary level, Keralatransfer to the poorest quintile the highest amount of14.04%, while West Bengal had the lowest share goingto the poorest quintile with an amount of 2.01%. Asubstantial portion of the subsidies went to the richestquintiles and clearly fails to meet the equity criteria.Kerala, which received the minimum share of subsidywas as high as 21.08%. The topmost quintiles in all the
other states received more than 30% of the totalsubsidy. In fact this is probably a result of the fact thatchildren who enroll in secondary school are typicallyfrom the higher income quintiles. In the urbansecondary school sector, Himachal Pradesh receivedmaximum share of subsidies (24.19%). Nine stateswhere the poorest quintile received less than 10% ofthe total subsidy. On the other hand Andhra Pradeshand Himachal Pradesh are the two states where therichest quintile received comparatively lower sharesof subsidies (less than 15%). The richest quintile inRajasthan received the maximum share among all thestates (31.15%). Overall, we find that states that areeconomically better off tend to have a more equitabledistribution of subsidies across quintiles. This might be
due to the fact that better economic status allows themto charge higher amounts from at-least the better off.
Welfare function of a government oblige them to spendon merit goods such as health and education. In India,social sectors like health and education are in theconcurrent list and the state governments are in chargeof providing most of the services, whether it is usingtheir own resources or using the funds that come tothem through a Centrally Sponsored program. In orderto make these services (which provide both public andprivate benefits) to the needy and the most vulnerable,who probably cannot “buy” the services in a marketsituation due to various causes (including theaffordability and accessibility questions), governmenthas to provide for them. Many times, it is not only inthe form of government expenditure, but a lot of directand indirect subsidies since the beneficiaries need notpay back the costs incurred. However, not all thosewho deserve gets all the benefits, nor do all thebeneficiaries are the one who are to be most concerned.Therefore it becomes important to know how thegovernment expenditures on education are utilized byvarious socio-economic groups and how many of thembenefit.
The major objective for arguing that government shouldprovide services which come under the public/ meritgoods category is that those who belong to the lowest
�!!����
��������������1�������-�����������������
socio-economic group should benefit mostly out of it –which means that the highest subsidies should go tothem. On the other hand, from the government’sfinancial management view, it is important that thegovernment generate some revenue to run theirmachinery for providing these services. This wouldmean that those who can afford to “buy” the servicesshould pay for it, hence, should be charged some fees.This basically involves the cross subsidy issues.
However, in reality, this need not happen, especially,different states have different expenditure levels andenrollment levels by socio-economic groups. And thedegree and magnitude of costs and subsidies, and hencebenefits vary across different states of India. Theanalysis here is aimed at providing some broad ideason this direction. This approach that has been adoptedto evaluate the distribution of government subsidies ineducation among students from different quintile groupsof population is referred here as “Benefit IncidenceAnalysis”.
The term ‘benefit’ to captures the enrollees who benefitfrom the ‘subsidies’, and incidence refers to as theamount of subsidy received. This paper studies thedistribution of both. This essentially involves allocatingthe subsidies to different quintiles groups based on theirutilization of the subsidies i.e. enrolment in those schoolshaving access to government subsidies. This will help

�
us analyze whether the subsidies are reaching thosewho require them the most. In this paper we haveconducted this analysis for 16 major states inIndia.
There are two broad categories of schools throughwhich subsidies are provided – government and localbody schools, and private schools that receive someaid from the government (henceforth referred to asprivate aided schools).
�������������
National Sample Survey Organization had conductedtwo large education based surveys in its 42nd and 52ndrounds conducted in 1986-87 and 1995-96 respectivelyin all the states of India. The datasets have been usedto calculate the number of enrollees across differentquintile groups and in different levels and types ofinstitutions specifically for three reasons. One, theseare large datasets with significant sample sizes andtwo, such fine break-ups on the characteristics of thestudents are not available in other data sources. Andthree, these datasets have information that will help usevaluate private expenditure on education that directlygoes to the school authority. For data on Governmentexpenditure on education we are using data containedin “Analysis of Budgeted Expenditure on Education”published by “Ministry of Human Resource andDevelopment, Government of India”. The publicationcontains government expenditure (revenue account)data on education separately for elementary andsecondary education across states every year. Thesame have been used for the years 1986-97 and 1995-96.
������������������
At the outset, it should be mentioned that the latestdata on education expenditures by householdsdisaggregated at the gender, and other socio-economicgroups could be made available latest for the year 1996and not after that due to the lack of education surveysthat are collected at household level. Though theconsumer expenditure surveys of the NSS collect dataon education expenditure at some aggregation, sincethey don’t really provide the information as to whetherthe children in the household are attending governmentor private schools, it is not possible to use the data forfinding out the incidence of government educationexpenditures.
Secondly, although we had similar data in both 42ndand 52nd rounds, the 42nd round does not provide abreak up for private aided and private unaided schools.The dataset contained only two broad categories forthe variable “Type of institution”, namely “Government”and “Private”. But as a considerable share of thegovernment subsidies goes to private aided schools aswell, this information is essential for the analysis. Inother words, since we are looking at how thegovernment subsidies are utilized by various quintiles itwill be incorrect if we only consider the subsidiesreceived by government schools. As a result, thecomparison of the subsidies as well as beneficiariesacross time could not be conducted.
2���������
Who are the beneficiaries?
All the enrollees in Government, Private-aided andLocal Body schools were combined into one group andwere considered to be the beneficiaries as wereaccessing the government subsidies because of the typeof institution they are enrolled in. This was done as wehave used the total budgetary expenditure on schoolsat this aggregate level. Enrollments are also availableseparately for elementary and secondary schools inrural and urban areas across quintiles and gender. Thequintile groups have been generated on the basis ofper capita household expenditure separately for ruraland urban areas in the individual level. There will notbe more number of people in the lower quintiles in ruralareas which would have been the case had wegenerated the quintiles in the household level. This ismainly because the household sizes tend to be larger inrural areas as compared to the urban areas. Thereforeequal number of individuals (not students) will be therein each of the quintile groups.
How is subsidy calculated?
The overall government subsidy was available fromgovernment state budget documents separately forelementary and secondary. The distribution of thesesubsidies were made according to the manner in whichthe distribution of enrollment of students belonging tothe different expenditure quintiles were in governmentand government aided schools. This distribution, asexplained earlier, was calculated using the NSSO 52ndround data. In other words, the Governmentexpenditure for elementary and secondary educationfor each state has been sub-divided across various
��
quintile groups, sector and gender using the samedistribution in which the beneficiaries are distributed.To calculate government revenue from education,private expenditure on tuition fees, examination fees,and other fees in the last academic year has been used.This data was also available from the 52nd round NSSOdata. This also allowed us to have a state, quintile, sector,and gender distribution of government revenues asreported by each respondent. The distribution of total
(respondent) reported government revenues istherefore not the same as the government expenditures(distributed purely on the basis of enrollment). Fromthe above two steps we get two similar tables forgovernment expenditure and revenues from educationsector. Subsidy is then calculated by subtracting revenuefrom expenditure in the corresponding category. Afterthat we have calculated the percentage distribution ofthe subsidies across all the quintiles in the respectivecategories.

��
The development of school education, participation andcompletion is characterized by disparities across socio-economic, gender and regional disparities. The equityissues are often masked due to the averages resultingfrom extreme inequalities in education indicators. Theefforts to reduce the disparities across gender, casteand economic classes are not met with uniform success;rather, the vicious circle of inequities and unequalprogress across various groups continue to haunt thestates with lower and higher education indices. Thehigher performing states have been continuously beenreducing most typical of inequities and the have beenmoving higher on education ladder while the efforts ofpoorer performing states are not enough to enable themto break the vicious circle of lower educationattainments and higher inequities and move ahead.Indeed, the growth of education sector in India hasbeen an inequitable one, one that is characterized byunbalanced growth. Now to facilitate the under-performing states to catch up with the better performingstates, a huge effort is needed,. To rectify these equitygaps, a “big push” to education in these disadvantagedregions/ gender/ community/ economic groups andmuch better targeting is necessary.
A summary table at the end of this paper summarisesthe findings from this study. The facts that come outof the summing up is as follows: (a) the level of ASARand the progress in ASAR are not synonymous. (b)The level as well as the progress (and the pace ofprogress) in ASAR in the primary stage and upperprimary stage are not of the same range. (c) It is easierto get children enrolled in school, but difficult to retainthem there to complete that level, as evident from therelatively lower completion rates, both at the primaryas well as upper primary levels. (d) As in the case ofASAR, the CR is better for primary level comparedwith UP. (e) rural –urban disparities still persists andrural areas are yet to catch with the ASAR (and PCRas well as UPCR) in the urban areas, especially in theupper primary stage of education (f) Though the ruralASAR is progressing fast, it needs further momentumto reach that of the urban ASARs. (g) PCR and UPCRprogress are less than that of the ASARs across allgroups (h) Gender disparities are also evident, with malechildren getting enrolled more than the female children,
especially in the upper primary stage. (f) the SC/STchildren are getting enrolled more, but still they areway behind the other general communities. (i) in allareas, in both gender and in all communities, childrenfrom a higher income background get enrolled as wellas complete schooling more than that of the lowerincome groups. (j) inter-stage disparities are wide andthe some states like Kerala, Maharashtra and Punjabdo better in most of the indicators while Bihar, UP andRajasthan lag behind others confirming their traditionallyheld status as “bimaru1” states. (k) the rural-urban,gender, caste and income disparities are least in betterperforming states while they are worst in the poorerperforming states.
Now given the current trends and patterns in schoolingattendance and completion rates, and also the disparitiesthat exist across states, and within states, across rural-urban, gender, social and economic classes, there aremany sets of questions that arises which needs to beanswered, either through governmental efforts, orprivate initiatives or community mobilization, or througha combination of all these. Though finding answers tothese questions or providing policy prescriptions willbe beyond the scope of this documentation, it isimportant to identify these gaps and follow up questionsso as to ensure that future efforts shall be directed orevaluated based on the progress made on these issues.
One important factor that comes out of the study isthat even though most children get enrolled in schools,there is a sizeable number of children who never gotenrolled, thus did not even have an opportunity to seewhat schooling is all about. It is important to identifythe size of these children and get details as to whatcould be the factors that prevent them from being inschool. Many times, the domestic and family factorsare reasons for their being out of schools. Socialdeprivations and gender factors within family oftenintensify the problem. Economic factors could beanother major reason. Many children are out of schoolsin order to supplement the family income by engagingin activities that fetch some wages. Other familyresponsibilities of helping in household duties and sibling
�������� ?� �� �� ��#
1 A term coined taking the first few alphabets of the states whowere really backward, and the term means “sick” in India.

��
care also have been important factors in preventingchildren attending schools or dropping out. Lack ofopportunities and access is hindering many a children’seducation and hence future. Physical disabilities andother health factors could be another hindering factor.
There are miscellaneous issues which are not directlyrelated to schooling participation trends and completionrates. However, they could be the most crucial aspects.
For example, the quality of education, which cannot becaptured through a household survey like NSS or NFHSas the perception and importance of quality in relationto availability and accessibility is a relative one.However, while addressing the question of lowcompletion rates and socio-economic disparities, thequality issues also become an important factor to belooked at
���������������$
4�5�$�16�0�*
��1/����� ���0�*
*���$���)�����7��� "����0�*
���������7��� "����0�*
��$$������ ����� ��
��!�/����� ��7�����"�$�5�$8�1 ��1���� ��-77���7�����"$�5�$�
������"��0�*������#������6�� ���#1�7���� 1�-77���������"�0�*
*���$�9��)�����7��� "����5���� ����)1 �7�����"����-77���7�����"�0�*8
:��7��� "�����/�������-77��������"��0�*
����������7��� "��/�$"�5���)$���� ���-77��
�� �����$$� $�& �$
���#������/�15�� ���"����8���/��61�7�����"��0�*#1�7����� 1-77���������"�0�*�
+����� ��16��#����������0�*��5��)�����66���� ��#�1�������5�"� ����71�� �
*���$��0�*�$1;�� ����-�)����0�*
��1/���������0�*����1����������$���������-�)���0�*������$����")����1����/�������#�������� �$1;���7�#��� �� �$�5�$
(5��� ���7���1�< ����0�*�16�)1 �)1"������/��$�
�� ���� ��$$$��� $
01���� � ���$�&��%���$���5���$����"����#�����/���0�*�;��$���1��� � �������$�//�����9$�&�������
3�#����������0�*���5�)������66���� ��#�1��� � ���9�� � ���� �$����"���/����$�5�$�16�0�*�����$� $�� 1��7�15��;��$�� ��� � ���� �)1 1����5���7�15��� ������0�*#1�������)$"<� �1�/� ��"�����"� � 1��#���5� ���������)$��$�5�$
*�/�1��$�5���� �1���������$���)����0�*�����5���� ����+�1�/�� ������$���)���/�7����5�)��������1;��/��1;����)� ���7��61����/� � ��<� ���/�7����)����1����#��������� � ���;� ��$1;��0�*��� ���7�1/����������)������������6�� ������������0�*�7�1/�����������$������������1 ��1�/�� 1�#� #���7;� �� �� �16� �����)��������
01���� � �����5�$������/���������7��� "����0�*� �����1��
( �� � 3����$��� $
%���$�<������)<+���$�,���<'������� ��
��<�'�����*���� ����� �� ���� $1;�$�5�$�������5���/���� ���16/�1; ������0�*
�0 � ���$�&��%���$�<����+,���5��$;�"������$���������$���)���/�7����0 � ���$�&��!��"������������)���5�)������##���6�$�������1;��/��1;� �������$���)��/�7��6�� ������ ��$�� � ;1���#�����
�%���$�<������)����+,���5��$�����/������/�7����
'$�� 3����$��� $
�����<�-�
�����<�-�����(������� �� ���� $1;�$�5�$�����"� 1��7�����7� ����7�#��16��0�*��#������
0 � ���� �����/�$�5�$�16��0�*���5�$1;���/�1; �����0�*�15��� �����5�"� ������� ��"��5��$� $�� 1��7�15�
����������-�������/������$���)�����7��� ���+����� � �����5���$�1)����$�����##���6�$�������#��/� �������$���)���/�7�15��� �� ;1���#�����16�����������
!�/��/������/�7���������'�#�� 1�)��������������������
��� � 3�� � �� ��� � �
3�#������$�5�$�16�0�*<���7�#��$$"��� ���-77��������"�$�5�$
,����61���7�#��$61#��� 1���#����� ������1$��� ���� � ���;� ��$1;$�5�$��16��0�*���;�$$����;���� �����#���������0�*�����1 ��7� 1 �����������$�5�$
,����61��61#�� 1���7�15��$�5�$����7�#��16�0�*����;1�� 7��61����/� � ��<���7�#��$$"��� ���������$������
,����61��61#��1��/��$����#� �1����
��*� � -7� ������� ������ C� ������

��
���������������$
��$$������ ����� ��
�� �����$$� $�& �$
�� ���� ��$$$��� $
( �� � 3����$��� $
'$�� 3����$��� $
��� � 3�� � �� ��� � �
=�� �����7��� "����0�*
:��7��� "�#�1��>#1�1��#?��� �$������0�*
=1�7$� �1�*� ��9�4�5�$
*���$���)�����7��� ������=*
������"��0�*#1�7���� 1� ���7�����"�0�*�
0#����$��+��)�@���0�*$1;��� ���� �� 16�0=<�;��#���� �������$1;�� ���� ���/�����$#1����� "
������"���1$��� ���7��� �������$������ �#�1���#1�1��#/�1�7�� ���� ���77���7�����"�0�*
41;�#1�7���� 1��0�*�-�=*)� ��� �����=*)�#����� ���������1��#��$��������1$$������=*�;�1���171� �
-�)���=*���)� ��� ���� ������$�=*�
��5��)�����#������/������$$"�1���)1"��/� ���1$$��� ���� ��/��$�+�����#���������0�*�16�/��$�����)1"����5���1 )�������61�������/� �����������
+�1�/�� ����0�*��#������15��� ��7���1�<� ���/�7)� ;������66���� /�1�7���1�@ �/� ����#��<� �1�/��� ���7�����"�$�5�$<� �����1 ��1�
(5��� ���"����<�0�*�16�#��$����6�1��$1;��?��� �$�������#�������6�� �� ���� �����/���?��� �$�<������/���?��� �$��#��$���������$����"�����/��0�*����� ��$1;���1����;���#� #���/��7�;� � ���
3�#������15�� ���8�)� � ����#�����������#��$1;��� ���� ���0�*�
3�#����������=*����-�=*�15�� ���������/��������)��������� ����������$������
1 ����� � ��
�0�*���1�/�0=A0+$1;�������1� �16� ��� � ���#1�7����� 1� ��/�����$�717�$� �1��01���� � �����5��)� ���?�� "���1�/��1#��$/�1�7������0�*
.������ ���� � �5���� �1������ ���$�5�$���;�$$�������7��� �������0�*�16� ����#1�1��#?��� �$��/�1�7����-�)����������5��/�$������?�� ����������/���$�5�$��16��0�*�61���$$?��� �$��/�1�7�#1�7����� 1�����$�
3� ���� � �����7��� �������;����� ���� �� �16 ����0�*���������$$"-�=*������/�������� � ��;������=*�����$�1���/��3��� � ���;������=*���� �����/����$�5�$<�-�=*���$���� �����=*<�������� � ���;������=*�$�5�$���$1;<��=*����)�$1;� ��-�=*�
3� ���� � �����7��� �������;�����61��-�=*#1�7����� 1��=*�
�0�*��!��"������������)<��$1�/�;� �'������*���� ���<��5��7�1/�������������#��/�/�����/�7��15��� ����#����
%���$������+,���5���/���0�*��� ���61�0=A0+�#�� ��/�1�7������$�1��1���?�� �)$���0�*�#�1���#�� ��/�1�7�
%���$��9�B� 1�B���5����/���0�*�:��7��� ��������$����+,�C������� �9���7��� ��������$����#�1���?��� �$�/�1�7�
%���$�<�+���$�,�������'������� ��
*���$���)�����7��� ��������$��� ���%���$������'!��D1���=*<�� ����$������+,����������)�$1�/�;� �� ����� � ���
�����16� ��7�1/�����������#��/�/�����/�7�
!��"������������)<��$1�/;� �������<�-�����*��� �����1;�$1;��0�*��1�/�0=A0+/�1�7�����;�$$���;�����#�� ����7��� "����0�*�
������9�B�B��0�*����;�$$)�$1;� ��������)$��$�5�$��+������7��� ���)� ;����B�B�����$�1�$��/���$�1<�$��/������$9��)����66����#���
*���� ���<����������-��
-�<�������(������61���=*������<�*���� �������!��"����61�-�=*
�1� �16� ���� � ��<��7�#��$$"���0 � ���;����� ��/���������7��� "����1�� ��&����� ��7�1/�������/�������?�� "����$1;
'1������#� �1�6�#�$� ����61�#��$�����)1��� 1������7��5�$�/��#1����� ��������7�#��$�/��� �A�#�1$�����7�<�6��;��5��/�� #������
*���# �1�������171� ��� ��8�)���/��/)�#&� ���#��$����;�1�������177��1�
3�#������ ���� �� �1���� ���������$������� 1)���/�� �������$���)���/�7����#�� ����� � �����=*�

��
�������� ��$$������ ��
�� �����$$� $�& �$
�� ���� ��$$$��� $
( �� � 3����$��� $
'$�� 3����$��� $
��� � 3�� � �� ��� � �
���������7��� "���=*
=�� �����7��� "���=*
>#1�1��##$������7��� "���=*
������$$"�)1"�=*�����1�� ����/��$����)1 ���=*����-�=*
0=A0+�� ���� �@=*����$1;#1�7����� 1 ���/�����$
�=*����7��� ������� $������#�1���#1�1��#/�1�7�� ���� ��-�=*
�������/�7���=*�����-�=*����#1���/�1;���������/�7���1��7�1�1��#���61� ���-�=*
=*���1�/�0=A0+������7�15��/15��� ���
(5��� ���"����<�=*�16�#��$����6�1��$1;��?��� �$�������#�������6�� ����� ���)����$���6�/�����;���7� �� �#�61� ���<�)� �;� ���� ����)$��661� �<���17�1� �� �����1�/� ��$1;��� ?��� �$�������1;�)���/����#���!1;�5��<�=*�� �����1�/�5��� �����/��� ?��� �$��<��7�#��$$"���� ������$������<����1 �����#1���/��/��� ���/�1; �����0�*�
�������/�7���#�1��� � ����E�� ����������/�7��������/������� � ���;����� �����E�� �1������/�$"��&�;������� � ���;����� ����E��� �1����6�51��16/��$�<� ���=*���1�//��$������)� ���
3���1���� � ��<� ��=*���1�/�0=A0+���)� ��� ����1 ���� � �����0 � ���;� �)� ���=*����/�����$��5���1���0=A0+=*���$�1�
.������ ���� � �5���� �1������ ���$�5�$���;�$$�������7��� �������=*���1�/� ���#1�1��#�?��� �$�/�1�7����-�)����������5��/�$�������?�� ���������/����$�5�$��16=*�61���$$�?��� �$�/�1�7��#1�7����� 1����$�
%���$�<�+,���������)�����$�����/���������7��� "���#1�7$� �1���� ���
%���$�<��������1�/� ���)�//��� � ������;�$$��� ���,1� ��>�� ���� � �����1 ���$"������������� ��$��;����� ��7�171� �1��16�0+�����/�������;�$$���;����� ���/�����$���#� �1�����#� 1��������$�1)� ��
%���$��9�B� 1B����5����/��=*�:��7��� �������$�����+,�C������� 9���7��� �������$�����#�1���?��� �$�/�1�7�
�����<�*���� �������-�
+���F������G� � ���;����� ��#1��� �1���16 ���0=A0+���/�����$�$��5����#�� 1�)����������$�1��5��$1;���=*��1�/� ��� � ��
������9�B�B�=*����;�$$)�$1;� ��������)$��$�5�$��+������7��� ���)� ;����B�B������$�1$��/����$�1<$��/������$�9��)����66����#���

��
Bashir, S. 2000. Government Expenditure onElementary Education in the Nineties, The EuropeanCommission, New Delhi.
Blaug, M. 1982. The Distributional Effects of HigherEducation Subsidies, Economics of Education Review2(3) (Summer): 209-31 [reprinted in M. Blaug, ed., TheEconomics of Education and the Education of anEconomist. Aldershot: Edward Elgar, 1987, pp. 204-26]]
Blaug, M.1983. Declining Subsidies to HigherEducation: An Economic Analysis, in H. Giersch (ed.)Reassessing the Role of Government in the MixedEconomy. Kiel: Instiut fur Weltwirtschaft, pp. 125-35[reprinted in Blaug, ed., The Economics of Educationand the Education of an Economist. Aldershot:Edward Elgar, 1987, pp. 227-43]
Bray, M. 2002. The Cost and Financing of Education:Trends and Policy Implications. Education inDeveloping Asia Vol.3. Asian Development Bank
Dreze J. and G.G. Kingdon. 1999. School Participationin Rural India, The Development Economics DiscussionPaper series No 18, LSE STICERD
Dreze, J. and A. Sen. 1995. India : EconomicDevelopment and Social Opportunity. OxfordUniversity Press, New Delhi
Duraisamy, P. 1992. ‘Gender, Intra-family Allocationof Resources and Child Schooling in South India’,Discussion Paper No. 667, Economic Growth Center,Yale University.
Duraisamy, P., and Duraisamy, M. 1991. ‘Impact ofPublic Programs on Fertility and Gender SpecificInvestment in Human Capital of Children in Rural India’,in Schultz, T.P. (ed.), Research in PopulationEconomics, 7.
GOI, 1997. Government Subsidies in India. NewDelhi: Ministry of Finance
GOI, 1998. Attending an Educational Institution in India:Its Level, Nature and Cost, NSS Fifty Second RoundJuly 1995-June 1996. National Sample SurveyOrganisation, Department of Statistics, New Delhi.
GOI, 2002. National Human Development Report ofIndia, Planning Commission, New Delhi.
����������
GOI, 2003. Education for All: National Plan of Action,India, Department of Elementary Education andLiteracy, MHRD
GOI: Analysis of Budgeted Expenditure on Education;Ministry of Human Resource Development, Planningand Monitoring Unit, New Delhi (Various Years)
GOI: Selected Educational Statistics, Ministry ofHuman Resource Development, New Delhi, (Variousyears)
Hinchliffe, K.1993. Neo-Liberal Prescriptions forEducation Finance: Unfortunately Necessary orInherently Desirable? International Journal ofEducational Development 13 (20): 183-87.
Jabbi M.K. and Rajyalakshmi. 2001, “Education of themarginalised social groups in Bihar” in Vaidyanathan,A. and P.R. Gopinathan Nair (ed): 2001. ElementaryEducation in Rural India: A Grassroots View, Sage,New Delhi.
Jayachandran, U. 1997. ‘The Determinants of PrimaryEducation in India’, M.Sc. thesis, Department ofEconomics, Delhi School of Economics.
Jimenez, E. 1994. Financing Public Education: Practicesand Trends, in T. Husen and T.N. Postlethwaite(eds.)The International Encyclopedia of Education.Oxford: Pergamon, pp.2310-18.
Jimenez, E.1987. Pricing Policy in the Social Sectors:Cost Recovery for Education and Health inDeveloping Countries. Baltimore: Johns HopkinsUniversity Press/World Bank.
Kingdon, G. G. 1994. ‘An Economic Evaluation ofSchool Management-Types in Urban India: A CaseStudy of Uttar Pradesh’, D.Phil. thesis, St Antony’sCollege, University of Oxford.
Kingdon, G. G. 1996, ‘Student Achievement andTeacher Pay’, Discussion Paper 76, DevelopmentEconomics Research Programme, STICERD, LondonSchool of Economics.
Kingdon, G. G. 1998. ‘Education of Females in India:Determinants and Economic Consequences: A CaseStudy of Urban Uttar Pradesh’, mimeo, McNamaraFellowships Office, Economic Development Instituteof the World Bank, Washington DC.

��
Mingat, A. and J. P. Tan, 1986a. Financing PublicHigher Education in Developing Countries, HigherEducation 15: 283-97.
Mingat, A., and J. P. Tan, 1986b. Who Profits fromPublic Funding of Education? A Comparison of WorldRegions, Comparative Education Review 30 (2): 260-70.
Musgrave, R.A. 1959. Theory of Public Finance.New York: McGraw Hill.
Psacharopoulos, G. 1977. The Perverse Effects ofPublic Subsidization of Education or How Equitable isFree Education? Comparative Education Review 21(February): 69-90.
Sipahimalani, V. 1997. ‘Education in the Rural IndianHousehold: A Gender Based Perspective’, mimeo,Department of Economics, Yale University.
Sixth All India Education Survey: National Tables,Volume I, II, III, IV & V, 1997. National Council ofEducational Research and Training, New Delhi
The Probe Team in Association with Centre forDevelopment Economics. Public Report on BasicEducation in India, Oxford University Press, Delhi
Tilak, J.B. G. 2001. Public Subsidies in Education Sectorin India, www.fiscalconf.org
Vaidyanathan, A. and P.R. G. Nair 2001. (ed).Elementary Education in Rural India: A GrassrootsView, Sage, New Delhi.
World Bank, 1986. Financing Education inDeveloping Countries. Washington DC.
World Bank, 1994. Higher Eructation: The Lessonsof Experience. Washington DC.
World Bank, 1995. Priorities and Strategies forEducation: A World Bank Review. Washington DC.
World Bank, 1997. Primary Education in India.Washington DC.
World Bank, 2000. Attacking Poverty: WorldDevelopment Report 2000/2001. New York: Oxford.