Public Disclosure Authorized ECONOMIC...
48
Selected Issue: Investing in Public Infrastructure and Services CAMBODIA ECONOMIC UPDATE STAYING COMPETITIVE THROUGH IMPROVING PRODUCTIVITY April 2017 Public Disclosure Authorized Public Disclosure Authorized Public Disclosure Authorized Public Disclosure Authorized
Transcript of Public Disclosure Authorized ECONOMIC...
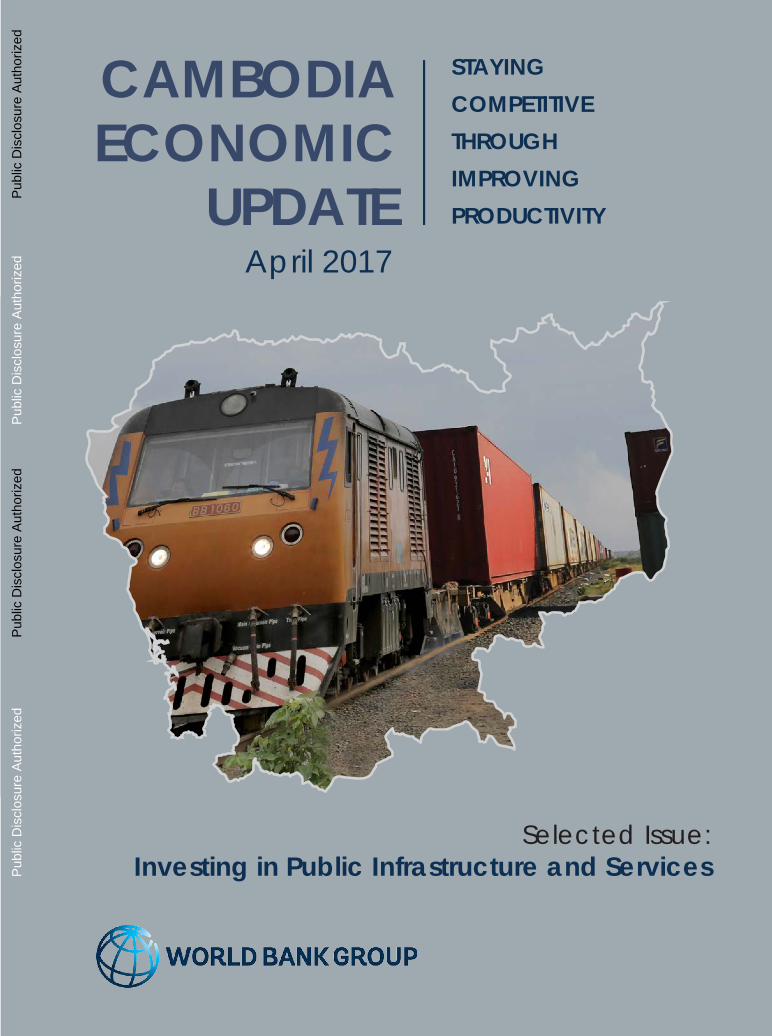
Selected Issue: Investing in Public Infrastructure and Services
CAMBODIA ECONOMIC
UPDATE
STAYING COMPETITIVE THROUGH IMPROVING PRODUCTIVITY
April 2017
Pub
lic D
iscl
osur
e A
utho
rized
Pub
lic D
iscl
osur
e A
utho
rized
Pub
lic D
iscl
osur
e A
utho
rized
Pub
lic D
iscl
osur
e A
utho
rized


3APRIL 2017 CAMBODIA ECONOMIC UPDATE
CAMBODIA ECONOMIC UPDATE
Staying competitive through improving productivity
April 2017
Selected Issue: Investing in public infrastructure and services
4 CAMBODIA ECONOMIC UPDATE APRIL 2017
The Cambodia Economic Update (CEU) is a product of the staff of the World Bank Group. It was prepared by Sodeth Ly and incorporates contributions by Miguel Eduardo Sánchez Martín, both at the Macroeconomics and Fiscal Management Global Practice (MFM GP). Linna Ky served as research assistant, while Runsinarith Phim, STC, provided comments, inputs and suggestions for the selected issue section. The section on Public Investment Management, part of the selected issue entitled “Investing in Public Infrastruc-ture and Services” was contributed by Tuan Minh Le (MFM GP) and Jay-Hyung Kim (Gov-ernance GP). The team worked under the guidance of Mathew A. Verghis, Practice Manager, MFM GP. The team is grateful for the comments, advice and guidance pro-vided by Ulrich Zachau, Country Director, Inguna Dobraja, Country Manager and Shabih Ali Mohib, Program Leader.
The CEU is produced bi-annually to provide up-to-date information on macroeconomic developments in Cambodia. It is published and distributed widely to the Cambodi-an authorities, the development partner community, the private sector, think tanks, civil society organizations and academia. The update is timed to coincide with the six-monthly publication of the East Asia and Pacific Economic Update by the East Asia MFM GP of the World Bank.
We received valuable inputs, comments and suggestions from Nikola L. Spatafora, East Asia and Pacific Chief Economist Unit, and Colleen Mascenik, Finance and Markets GP. The poverty section was contributed by Kimsun Tong, Poverty GP. The report also benefited from the advice, comments and views of various stakeholders in the Royal Government of Cambodia (RGC), the private sector, development partner institutions and academia. The team is very grateful for their time and inputs.
We are also grateful to the Cambodian authorities, in particular the Ministry of Economy and Finance and the National Bank of Cambodia for their cooperation and support in the preparation of this CEU.
The World Bank Cambodia Office Commu-nications Team, comprising Saroeun Bou and Sophinith Sam Oeun, prepared the media release, web display and dissemination.
For information about the World Bank and its activities in Cambodia, please visit our website at www.worldbank.org/cambodia.
To be included in the email distribution list of the CEU and related publications, please contact Linna Ky ([email protected]). For questions on the content of this publication, please contact Saroeun Bou ([email protected]).
PREFACE AND ACKNOWLEDGEMENTS
5APRIL 2017 CAMBODIA ECONOMIC UPDATE
PREFACE AND ACKNOWLEDGEMENTS ..................................................................................... 4A. EXECUTIVE SUMMARY .......................................................................................................... 7B. RECENT ECONOMIC DEVELOPMENTS ................................................................................. 13
The real sector .......................................................................................................................13a) Garment and footwear sector ................................................................................13b) Construction and real estate ...................................................................................15c) Tourism ........................................................................................................................16d) Agriculture ..................................................................................................................18
Poverty ....................................................................................................................................19The external sector ................................................................................................................20
a) Merchandise exports ................................................................................................20b) Transfer receipts – workers’ remittances .................................................................21c) Merchandise imports ................................................................................................21d) The current account .................................................................................................22
Inflation ...................................................................................................................................22The monetary sector .............................................................................................................23
a) Monetary aggregates, interest rates and exchange rates ..................................23b) The banking sector .....................................................................................................25c) Microfinance ..............................................................................................................26d) Indebtedness .............................................................................................................27
The fiscal sector .....................................................................................................................29a) Domestic revenue .....................................................................................................29b) Public expenditures ...................................................................................................30c) Fiscal balance ............................................................................................................30d) 2017 Budget ...............................................................................................................31
C. OUTLOOK AND RISKS ........................................................................................................... 33D. KEY MESSAGES AND POLICY OPTIONS ............................................................................... 36E. SELECTED ISSUE: INVESTING IN PUBLIC INFRASTRUCTURE AND SERVICES ......................... 39
Motivation ..............................................................................................................................39Public spending trends .........................................................................................................40Spending and allocation efficiency with regional comparisons ....................................41Public investment management (PIM) ...............................................................................44
a) Roles of capital investment ......................................................................................44b) Cambodia’s current PIM practices .........................................................................44c) Steps towards improving Cambodia’s PIM ............................................................45
Conclusions ............................................................................................................................46F. CAMBODIA: KEY INDICATORS ............................................................................................. 47
CONTENTS

6 CAMBODIA ECONOMIC UPDATE APRIL 2017
7APRIL 2017 CAMBODIA ECONOMIC UPDATE
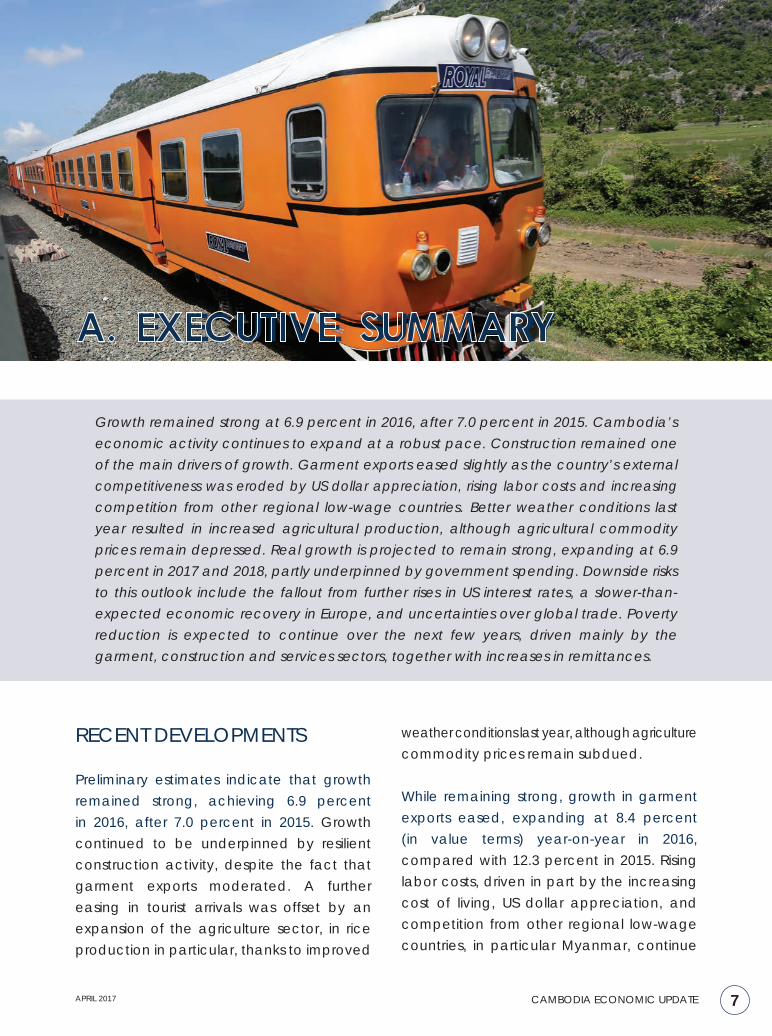
A. EXECUTIVE SUMMARY
Growth remained strong at 6.9 percent in 2016, after 7.0 percent in 2015. Cambodia’s economic activity continues to expand at a robust pace. Construction remained one of the main drivers of growth. Garment exports eased slightly as the country’s external competitiveness was eroded by US dollar appreciation, rising labor costs and increasing competition from other regional low-wage countries. Better weather conditions last year resulted in increased agricultural production, although agricultural commodity prices remain depressed. Real growth is projected to remain strong, expanding at 6.9 percent in 2017 and 2018, partly underpinned by government spending. Downside risks to this outlook include the fallout from further rises in US interest rates, a slower-than- expected economic recovery in Europe, and uncertainties over global trade. Poverty reduction is expected to continue over the next few years, driven mainly by the garment, construction and services sectors, together with increases in remittances.
RECENT DEVELOPMENTS
Preliminary estimates indicate that growth remained strong, achieving 6.9 percent in 2016, after 7.0 percent in 2015. Growth continued to be underpinned by resilient construction activity, despite the fact that garment exports moderated. A further easing in tourist arrivals was offset by an expansion of the agriculture sector, in rice production in particular, thanks to improved
weather conditions last year, although agriculture commodity prices remain subdued.
While remaining strong, growth in garment exports eased, expanding at 8.4 percent (in value terms) year-on-year in 2016, compared with 12.3 percent in 2015. Rising labor costs, driven in part by the increasing cost of living, US dollar appreciation, and competition from other regional low-wage countries, in particular Myanmar, continue
8 CAMBODIA ECONOMIC UPDATE APRIL 2017
to exert downward pressure on prices of exported garment products. As the completion phase of many modern high-rise residential and commercial construction projects that have fueled the construction boom is now approaching, imports of basic construction materials have softened. Steel imports (in volume terms) eased, growing at 28 percent year-on-year by end-2016, compared with 32.8 percent in 2015.
Agricultural production improved largely due to better weather conditions after the country experienced severe droughts for a number of years. Rainy season rice production expanded, rising to 7.3 million tons in 2016, or an 8.9 percent increase on 2015. However, agricultural commodity prices remain depressed, limiting growth in total agricultural exports. Tourist activity continued to ease, with arrivals growing 5.0 percent year-on-year in 2016, compared with 6.1 percent in 2015. So far, there has only been limited success in diversifying tourist attraction sites beyond the Angkor complex.
Rural households have increasingly diversified their livelihoods, tapping into both the rural off-farm economy and remittances to help sustain poverty reduction. Declining commodity prices, coupled with severe weather events in 2013 and 2015, has resulted in a slowdown and stagnation in agricultural GDP in recent years. By 2015, non-agriculture wage incomes made up more than one-third of rural incomes, compared with less than one-fifth in 2007. During the same period, agricultural incomes including agricultural wages declined to only 43 percent of total rural incomes from 63 percent.
Cambodia’s external position improved due to resilient export growth and depressed oil prices. The current account deficit (excluding official transfers) is estimated to have narrowed to 9.5 percent of GDP in 2016, compared with 10.6 percent in 2015, mainly financed by FDI inflows, which rose to 10.2 percent of GDP in 2016 versus 9.1 percent in 2015. As a result, gross international reserves accumulated further, reaching US$6.4 billion (or about 5.4 months of prospective imports) by end-2016, compared with US$5.6 billion in 2015.
Positive macro-financial developments include some easing in still strong credit growth, accompanied by an acceleration in private sector deposits. Supporting economic growth, broad money expanded, growing at 17.9 percent year-on-year by end-2016, compared with 14.7 percent in 2015, thanks to rising foreign currency deposits. However, domestic credit growth moderated, partly reflecting softer economic activity and, consequently, lower demand for credit from the wholesale, manufacturing and agriculture sectors. Macro-prudential measures introduced by the central bank last year may have also contributed towards slower domestic credit growth. As such, the banking sector’s credit growth decelerated to 25.8 percent year-on-year by end-2016, compared with 28.6 percent in 2015. Improved confidence in the banking sector has helped to attract private sector deposits, which accelerated to 19.3 percent year-on-year by end-2016, up from 16.6 percent in 2015. The non-performing loan (NPL) ratio rose slightly to 2.7 percent in 2016, up from 2.3 percent in 2015.
9APRIL 2017 CAMBODIA ECONOMIC UPDATE
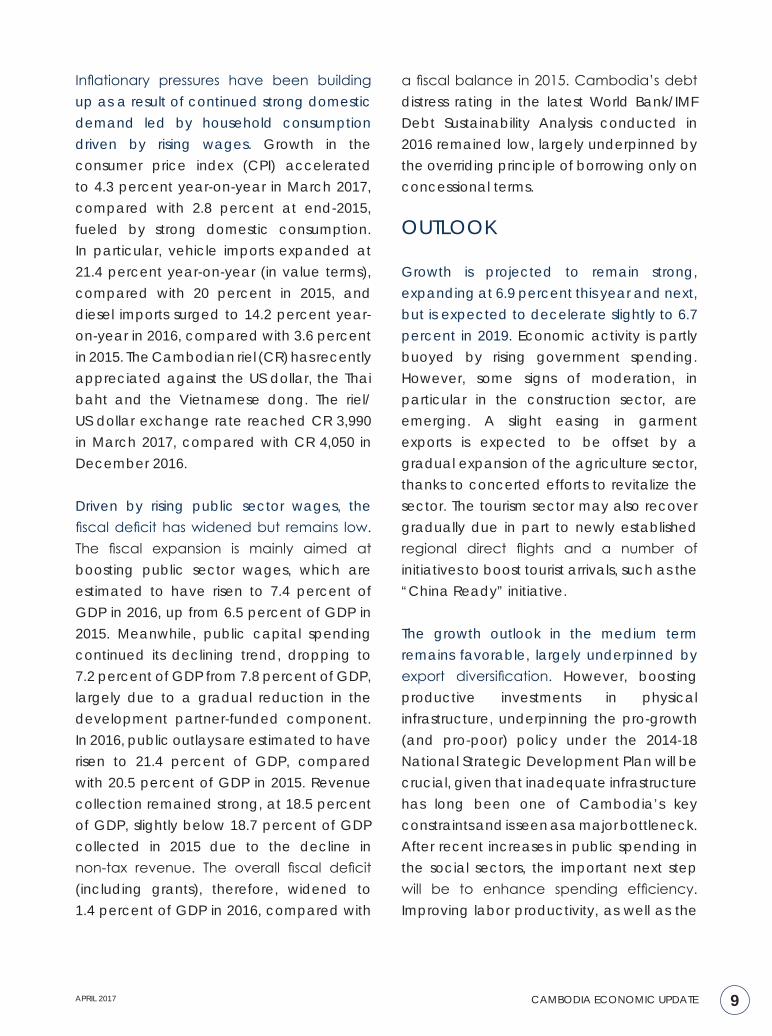
Inflationary pressures have been building up as a result of continued strong domestic demand led by household consumption driven by rising wages. Growth in the consumer price index (CPI) accelerated to 4.3 percent year-on-year in March 2017, compared with 2.8 percent at end-2015, fueled by strong domestic consumption. In particular, vehicle imports expanded at 21.4 percent year-on-year (in value terms), compared with 20 percent in 2015, and diesel imports surged to 14.2 percent year-on-year in 2016, compared with 3.6 percent in 2015. The Cambodian riel (CR) has recently appreciated against the US dollar, the Thai baht and the Vietnamese dong. The riel/US dollar exchange rate reached CR 3,990 in March 2017, compared with CR 4,050 in December 2016.
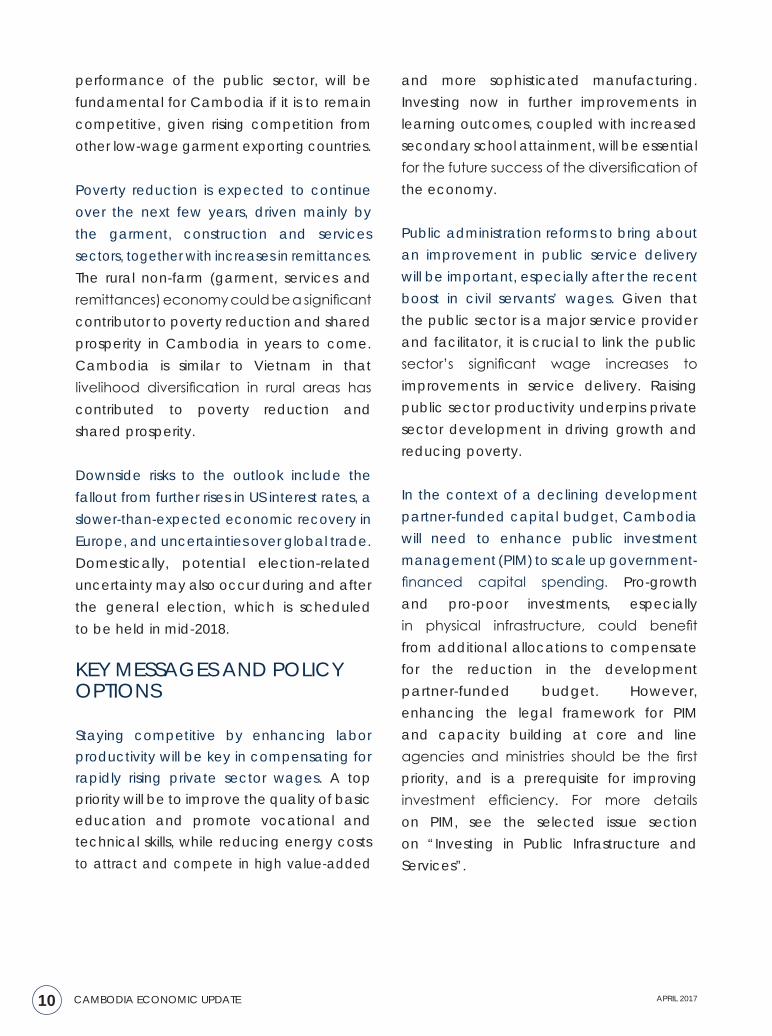
Driven by rising public sector wages, the fiscal deficit has widened but remains low. The fiscal expansion is mainly aimed at boosting public sector wages, which are estimated to have risen to 7.4 percent of GDP in 2016, up from 6.5 percent of GDP in 2015. Meanwhile, public capital spending continued its declining trend, dropping to 7.2 percent of GDP from 7.8 percent of GDP, largely due to a gradual reduction in the development partner-funded component. In 2016, public outlays are estimated to have risen to 21.4 percent of GDP, compared with 20.5 percent of GDP in 2015. Revenue collection remained strong, at 18.5 percent of GDP, slightly below 18.7 percent of GDP collected in 2015 due to the decline in non-tax revenue. The overall fiscal deficit (including grants), therefore, widened to 1.4 percent of GDP in 2016, compared with
a fiscal balance in 2015. Cambodia’s debt distress rating in the latest World Bank/IMF Debt Sustainability Analysis conducted in 2016 remained low, largely underpinned by the overriding principle of borrowing only on concessional terms.
OUTLOOK
Growth is projected to remain strong, expanding at 6.9 percent this year and next, but is expected to decelerate slightly to 6.7 percent in 2019. Economic activity is partly buoyed by rising government spending. However, some signs of moderation, in particular in the construction sector, are emerging. A slight easing in garment exports is expected to be offset by a gradual expansion of the agriculture sector, thanks to concerted efforts to revitalize the sector. The tourism sector may also recover gradually due in part to newly established regional direct flights and a number of initiatives to boost tourist arrivals, such as the “China Ready” initiative.
The growth outlook in the medium term remains favorable, largely underpinned by export diversification. However, boosting productive investments in physical infrastructure, underpinning the pro-growth (and pro-poor) policy under the 2014-18 National Strategic Development Plan will be crucial, given that inadequate infrastructure has long been one of Cambodia’s key constraints and is seen as a major bottleneck. After recent increases in public spending in the social sectors, the important next step will be to enhance spending efficiency. Improving labor productivity, as well as the
10 CAMBODIA ECONOMIC UPDATE APRIL 2017
performance of the public sector, will be fundamental for Cambodia if it is to remain competitive, given rising competition from other low-wage garment exporting countries.
Poverty reduction is expected to continue over the next few years, driven mainly by the garment, construction and services sectors, together with increases in remittances. The rural non-farm (garment, services and remittances) economy could be a significant contributor to poverty reduction and shared prosperity in Cambodia in years to come. Cambodia is similar to Vietnam in that livelihood diversification in rural areas has contributed to poverty reduction and shared prosperity.
Downside risks to the outlook include the fallout from further rises in US interest rates, a slower-than-expected economic recovery in Europe, and uncertainties over global trade. Domestically, potential election-related uncertainty may also occur during and after the general election, which is scheduled to be held in mid-2018.
KEY MESSAGES AND POLICY OPTIONS
Staying competitive by enhancing labor productivity will be key in compensating for rapidly rising private sector wages. A top priority will be to improve the quality of basic education and promote vocational and technical skills, while reducing energy costs to attract and compete in high value-added
and more sophisticated manufacturing. Investing now in further improvements in learning outcomes, coupled with increased secondary school attainment, will be essential for the future success of the diversification of the economy.
Public administration reforms to bring about an improvement in public service delivery will be important, especially after the recent boost in civil servants’ wages. Given that the public sector is a major service provider and facilitator, it is crucial to link the public sector’s significant wage increases to improvements in service delivery. Raising public sector productivity underpins private sector development in driving growth and reducing poverty.
In the context of a declining development partner-funded capital budget, Cambodia will need to enhance public investment management (PIM) to scale up government-financed capital spending. Pro-growth and pro-poor investments, especially in physical infrastructure, could benefit from additional allocations to compensate for the reduction in the development partner-funded budget. However, enhancing the legal framework for PIM and capacity building at core and line agencies and ministries should be the first priority, and is a prerequisite for improving investment efficiency. For more details on PIM, see the selected issue section on “Investing in Public Infrastructure and Services”.
11APRIL 2017 CAMBODIA ECONOMIC UPDATE
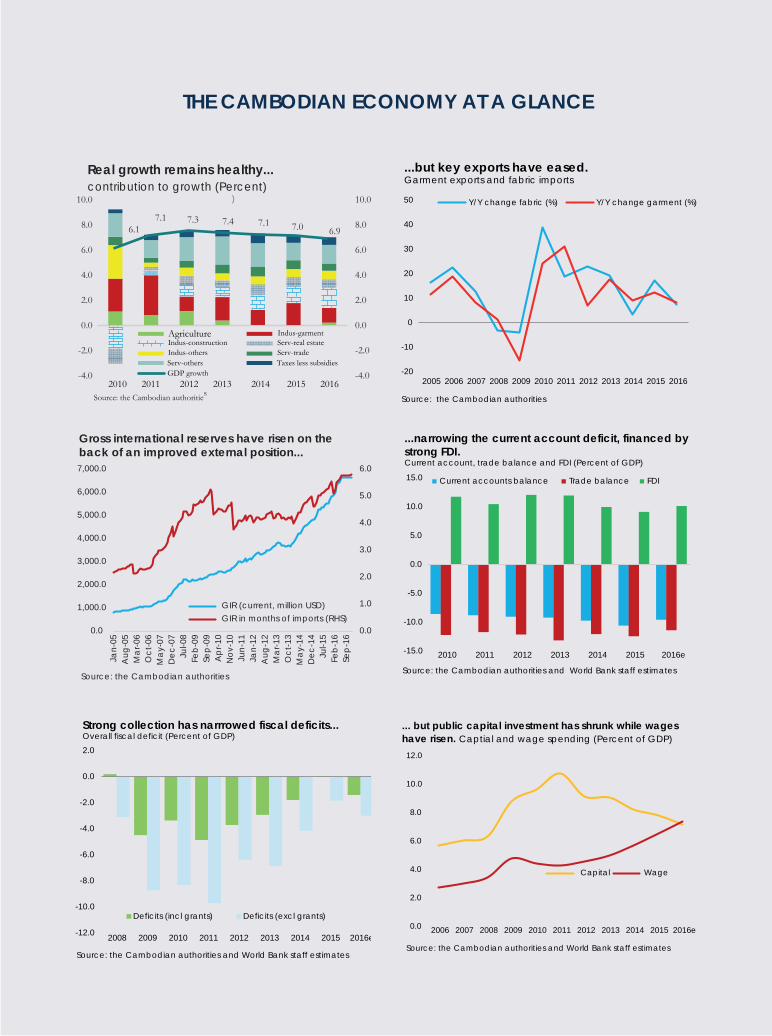
THE CAMBODIAN ECONOMY AT A GLANCE
0.0
1.0
2.0
3.0
4.0
5.0
6.0
0.0
1,000.0
2,000.0
3,000.0
4,000.0
5,000.0
6,000.0
7,000.0
Jan-
05A
ug-0
5M
ar-0
6O
ct-0
6M
ay-0
7D
ec-0
7Ju
l-08
Feb-
09Se
p-09
Apr
-10
Nov
-10
Jun-
11Ja
n-12
Aug
-12
Mar
-13
Oct
-13
May
-14
Dec
-14
Jul-1
5Fe
b-16
Sep-
16
GIR (current, million USD)GIR in months of imports (RHS)
Gross international reserves have risen on the back of an improved external position...
Source: the Cambodian authorities
-15.0
-10.0
-5.0
0.0
5.0
10.0
15.0
2010 2011 2012 2013 2014 2015 2016e
Current accounts balance Trade balance FDI
...narrowing the current account deficit, financed by strong FDI. Current account, trade balance and FDI (Percent of GDP)
Source: the Cambodian authorities and World Bank staff estimates
-12.0
-10.0
-8.0
-6.0
-4.0
-2.0
0.0
2.0
2008 2009 2010 2011 2012 2013 2014 2015 2016e
Deficits (incl grants) Deficits (excl grants)
Strong collection has narrrowed fiscal deficits... Overall fiscal deficit (Percent of GDP)
Source: the Cambodian authorities and World Bank staff estimates
0.0
2.0
4.0
6.0
8.0
10.0
12.0
2006 2007 2008 2009 2010 2011 2012 2013 2014 2015 2016e
Capital Wage
... but public capital investment has shrunk while wages have risen. Captial and wage spending (Percent of GDP)
Source: the Cambodian authorities and World Bank staff estimates
-20
-10
0
10
20
30
40
50
2005 2006 2007 2008 2009 2010 2011 2012 2013 2014 2015 2016
Y/Y change fabric (%) Y/Y change garment (%)
...but key exports have eased.Garment exports and fabric imports
Source: the Cambodian authorities s
AgricultureIndus-constructionIndus-othersServ-others
Indus-garmentServ-real estateServ-tradeTaxes less subsidies
GDP growth2010 2011 2012 2013 2014 2015 2016
10.0
8.0
6.0
4.0
2.0
0.0
-2.0
-4.0
10.0
8.0
6.0
4.0
2.0
0.0
-2.0
-4.0
6.17.1 7.3 7.4 7.1 7.0 6.9
)
Source: the Cambodian authoritie
Real growth remains healthy...contribution to growth (Percent)
12 CAMBODIA ECONOMIC UPDATE APRIL 2017
13APRIL 2017 CAMBODIA ECONOMIC UPDATE
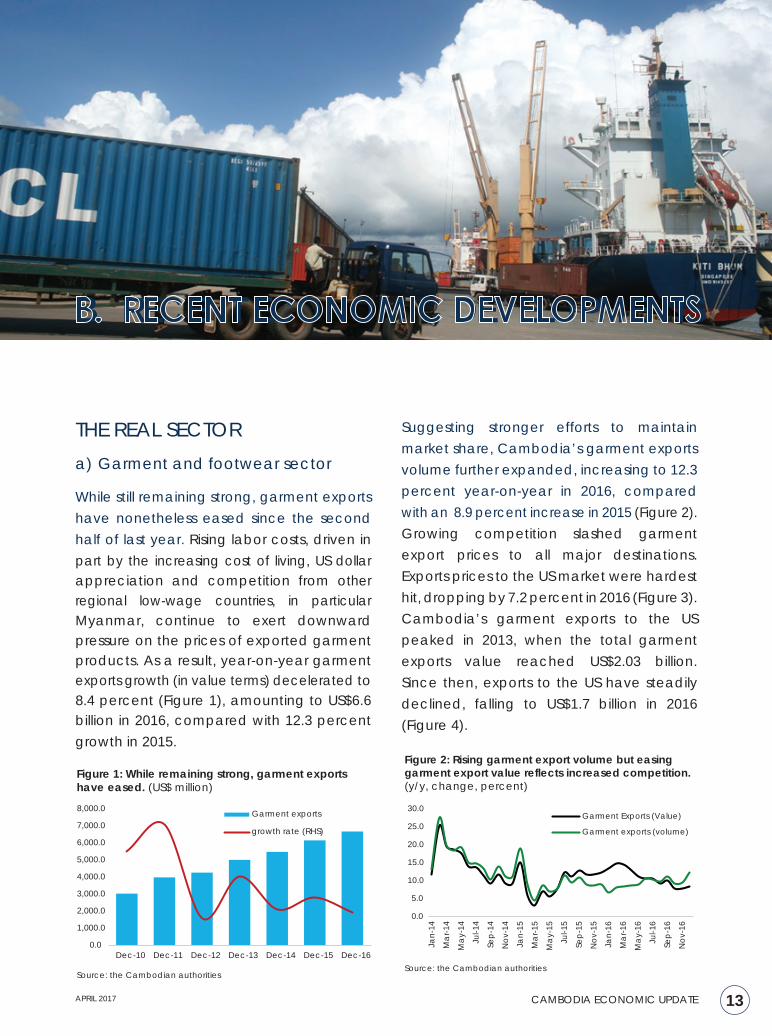
B. RECENT ECONOMIC DEVELOPMENTS
THE REAL SECTORa) Garment and footwear sector
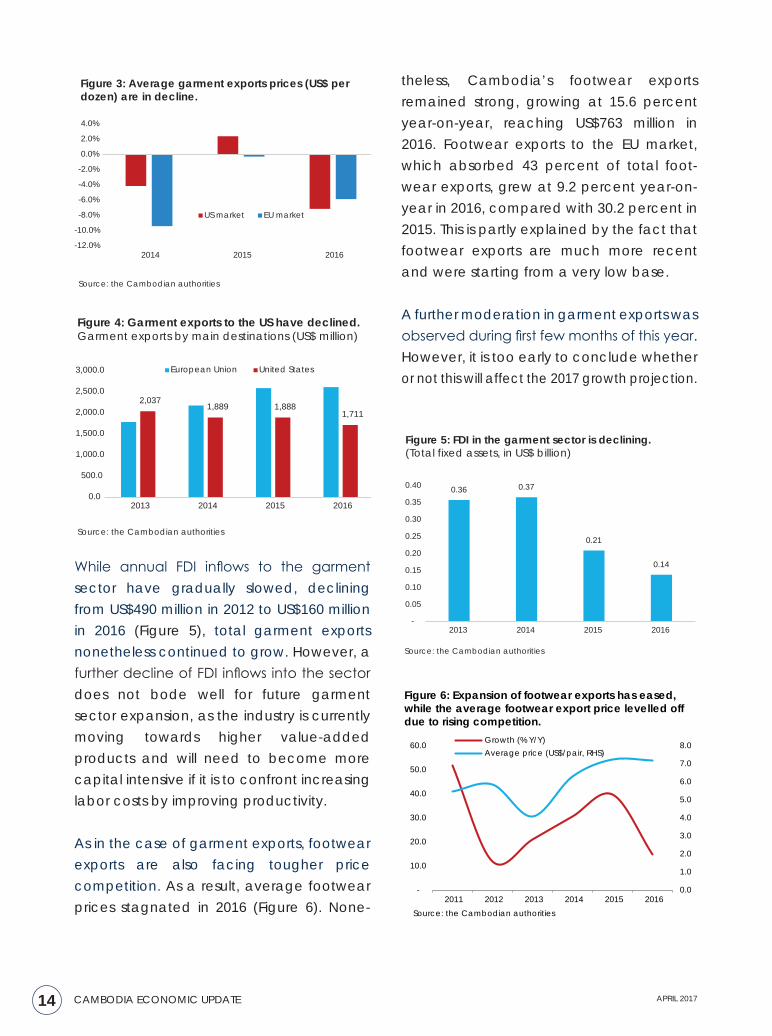
While still remaining strong, garment exports have nonetheless eased since the second half of last year. Rising labor costs, driven in part by the increasing cost of living, US dollar appreciation and competition from other regional low-wage countries, in particular Myanmar, continue to exert downward pressure on the prices of exported garment products. As a result, year-on-year garment exports growth (in value terms) decelerated to 8.4 percent (Figure 1), amounting to US$6.6 billion in 2016, compared with 12.3 percent growth in 2015.
0.0
1,000.0
2,000.0
3,000.0
4,000.0
5,000.0
6,000.0
7,000.0
8,000.0
Dec-10 Dec-11 Dec-12 Dec-13 Dec-14 Dec-15 Dec-16
Garment exports
growth rate (RHS)
Figure 1: While remaining strong, garment exports have eased. (US$ million)
Source: the Cambodian authorities
0.0
5.0
10.0
15.0
20.0
25.0
30.0
Jan-
14
Mar
-14
May
-14
Jul-1
4
Sep-
14
Nov
-14
Jan-
15
Mar
-15
May
-15
Jul-1
5
Sep-
15
Nov
-15
Jan-
16
Mar
-16
May
-16
Jul-1
6
Sep-
16
Nov
-16
Garment Exports (Value)
Garment exports (volume)
Figure 2: Rising garment export volume but easing garment export value reflects increased competition. (y/y, change, percent)
Source: the Cambodian authorities
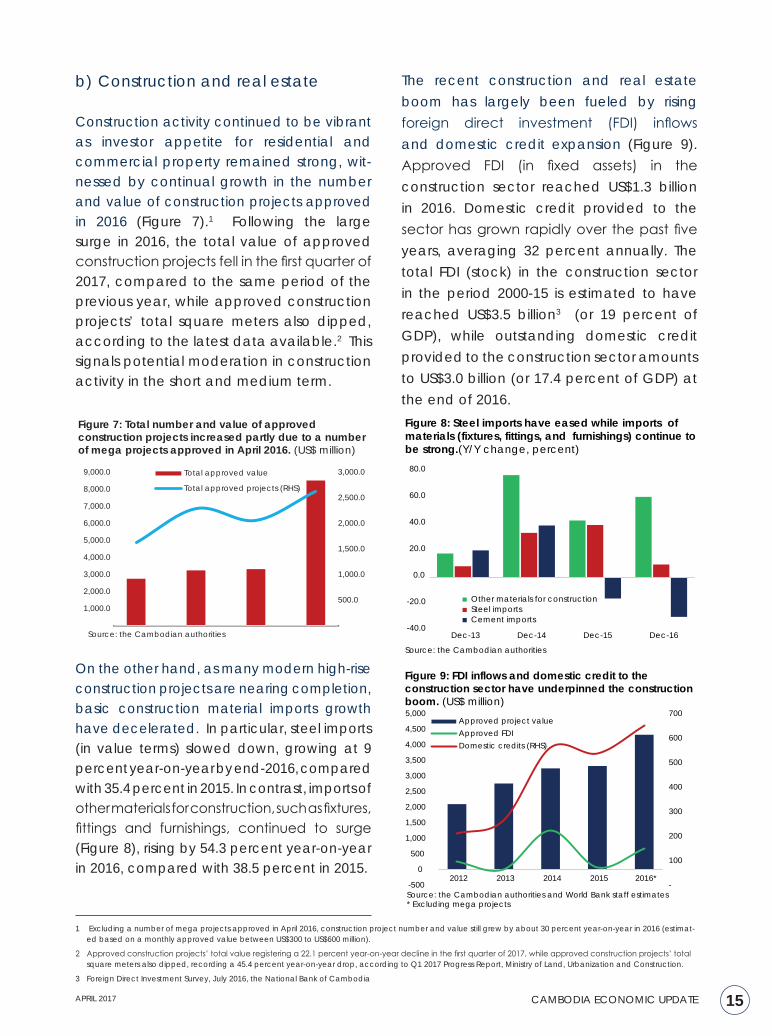
Suggesting stronger efforts to maintain market share, Cambodia’s garment exports volume further expanded, increasing to 12.3 percent year-on-year in 2016, compared with an 8.9 percent increase in 2015 (Figure 2). Growing competition slashed garment export prices to all major destinations. Exports prices to the US market were hardest hit, dropping by 7.2 percent in 2016 (Figure 3). Cambodia’s garment exports to the US peaked in 2013, when the total garment exports value reached US$2.03 billion. Since then, exports to the US have steadily declined, falling to US$1.7 billion in 2016 (Figure 4).
14 CAMBODIA ECONOMIC UPDATE APRIL 2017
theless, Cambodia’s footwear exports remained strong, growing at 15.6 percent year-on-year, reaching US$763 million in 2016. Footwear exports to the EU market, which absorbed 43 percent of total foot-wear exports, grew at 9.2 percent year-on-year in 2016, compared with 30.2 percent in 2015. This is partly explained by the fact that footwear exports are much more recent and were starting from a very low base.
A further moderation in garment exports was observed during first few months of this year. However, it is too early to conclude whether or not this will affect the 2017 growth projection.
-12.0%
-10.0%
-8.0%
-6.0%
-4.0%
-2.0%
0.0%
2.0%
4.0%
2014 2015 2016
US market EU market
Figure 3: Average garment exports prices (US$ per dozen) are in decline.
Source: the Cambodian authorities
0.36 0.37
0.21
0.14
-
0.05
0.10
0.15
0.20
0.25
0.30
0.35
0.40
2013 2014 2015 2016
Figure 5: FDI in the garment sector is declining. (Total fixed assets, in US$ billion)
Source: the Cambodian authorities
2,0371,889 1,888
1,711
0.0
500.0
1,000.0
1,500.0
2,000.0
2,500.0
3,000.0
2013 2014 2015 2016
European Union United States
Figure 4: Garment exports to the US have declined. Garment exports by main destinations (US$ million)
Source: the Cambodian authorities
0.0
1.0
2.0
3.0
4.0
5.0
6.0
7.0
8.0
-
10.0
20.0
30.0
40.0
50.0
60.0
2011 2012 2013 2014 2015 2016
Growth (% Y/Y)Average price (US$/pair, RHS)
Figure 6: Expansion of footwear exports has eased, while the average footwear export price levelled off due to rising competition.
Source: the Cambodian authorities
While annual FDI inflows to the garment sector have gradually slowed, declining from US$490 million in 2012 to US$160 million in 2016 (Figure 5), total garment exports nonetheless continued to grow. However, a further decline of FDI inflows into the sector does not bode well for future garment sector expansion, as the industry is currently moving towards higher value-added products and will need to become more capital intensive if it is to confront increasing labor costs by improving productivity.
As in the case of garment exports, footwear exports are also facing tougher price competition. As a result, average footwear prices stagnated in 2016 (Figure 6). None-
15APRIL 2017 CAMBODIA ECONOMIC UPDATE
b) Construction and real estate
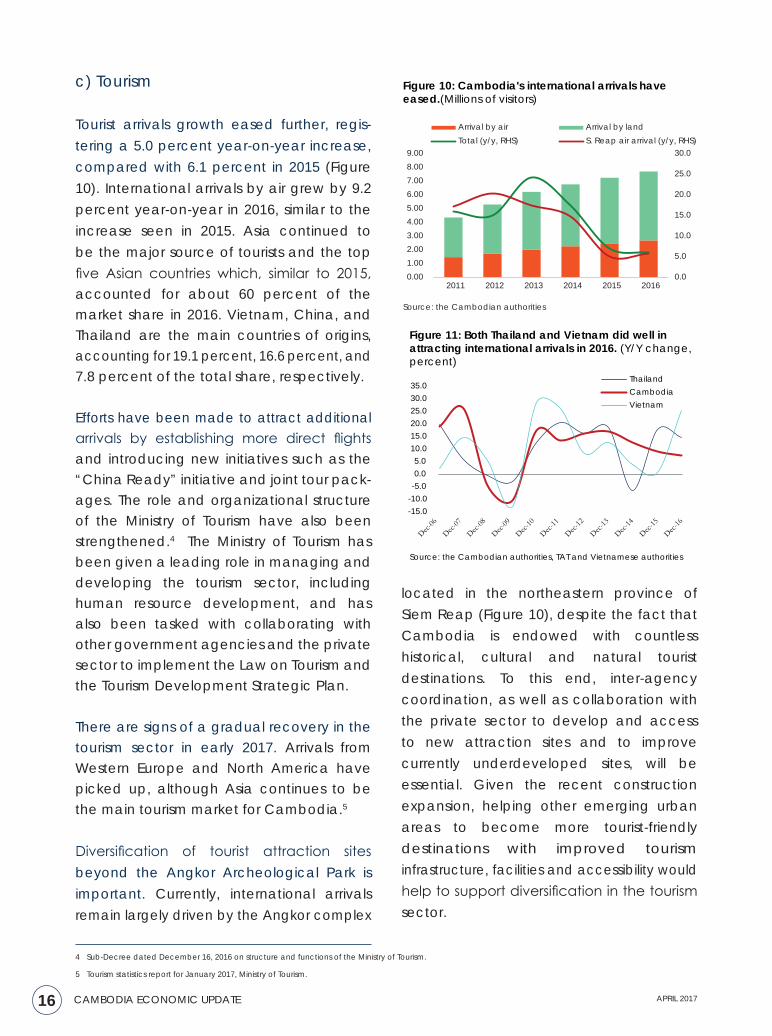
Construction activity continued to be vibrant as investor appetite for residential and commercial property remained strong, wit-nessed by continual growth in the number and value of construction projects approved in 2016 (Figure 7).1 Following the large surge in 2016, the total value of approved construction projects fell in the first quarter of 2017, compared to the same period of the previous year, while approved construction projects’ total square meters also dipped, according to the latest data available.2 This signals potential moderation in construction activity in the short and medium term.
On the other hand, as many modern high-rise construction projects are nearing completion, basic construction material imports growth have decelerated. In particular, steel imports (in value terms) slowed down, growing at 9 percent year-on-year by end-2016, compared with 35.4 percent in 2015. In contrast, imports of other materials for construction, such as fixtures, fittings and furnishings, continued to surge (Figure 8), rising by 54.3 percent year-on-year in 2016, compared with 38.5 percent in 2015.
1 Excluding a number of mega projects approved in April 2016, construction project number and value still grew by about 30 percent year-on-year in 2016 (estimat-ed based on a monthly approved value between US$300 to US$600 million).
2 Approved construction projects’ total value registering a 22.1 percent year-on-year decline in the first quarter of 2017, while approved construction projects’ total square meters also dipped, recording a 45.4 percent year-on-year drop, according to Q1 2017 Progress Report, Ministry of Land, Urbanization and Construction.
3 Foreign Direct Investment Survey, July 2016, the National Bank of Cambodia
500.0
1,000.0
1,500.0
2,000.0
2,500.0
3,000.0
1,000.0
2,000.0
3,000.0
4,000.0
5,000.0
6,000.0
7,000.0
8,000.0
9,000.0 Total approved value
Total approved projects (RHS)
Figure 7: Total number and value of approved construction projects increased partly due to a number of mega projects approved in April 2016. (US$ million)
Source: the Cambodian authorities-40.0
-20.0
0.0
20.0
40.0
60.0
80.0
Dec-13 Dec-14 Dec-15 Dec-16
Other materials for constructionSteel importsCement imports
Figure 8: Steel imports have eased while imports of materials (fixtures, fittings, and furnishings) continue to be strong.(Y/Y change, percent)
Source: the Cambodian authorities
The recent construction and real estate boom has largely been fueled by rising foreign direct investment (FDI) inflows and domestic credit expansion (Figure 9). Approved FDI (in fixed assets) in the construction sector reached US$1.3 billion in 2016. Domestic credit provided to the sector has grown rapidly over the past five years, averaging 32 percent annually. The total FDI (stock) in the construction sector in the period 2000-15 is estimated to have reached US$3.5 billion3 (or 19 percent of GDP), while outstanding domestic credit provided to the construction sector amounts to US$3.0 billion (or 17.4 percent of GDP) at the end of 2016.
-
100
200
300
400
500
600
700
-500
0
500
1,000
1,500
2,000
2,500
3,000
3,500
4,000
4,500
5,000
2012 2013 2014 2015 2016*
Approved project valueApproved FDIDomestic credits (RHS)
Figure 9: FDI inflows and domestic credit to the construction sector have underpinned the construction boom. (US$ million)
Source: the Cambodian authorities and World Bank staff estimates* Excluding mega projects
16 CAMBODIA ECONOMIC UPDATE APRIL 2017
0.0
5.0
10.0
15.0
20.0
25.0
30.0
0.001.002.003.004.005.006.007.008.009.00
2011 2012 2013 2014 2015 2016
Arrival by air Arrival by landTotal (y/y, RHS) S. Reap air arrival (y/y, RHS)
Source: the Cambodian authorities
Figure 10: Cambodia's international arrivals have eased.(Millions of visitors)
-15.0-10.0-5.00.05.0
10.015.020.025.030.035.0
ThailandCambodiaVietnam
Source: the Cambodian authorities, TAT and Vietnamese authorities
Figure 11: Both Thailand and Vietnam did well in attracting international arrivals in 2016. (Y/Y change, percent)
c) Tourism
Tourist arrivals growth eased further, regis-tering a 5.0 percent year-on-year increase, compared with 6.1 percent in 2015 (Figure 10). International arrivals by air grew by 9.2 percent year-on-year in 2016, similar to the increase seen in 2015. Asia continued to be the major source of tourists and the top five Asian countries which, similar to 2015, accounted for about 60 percent of the market share in 2016. Vietnam, China, and Thailand are the main countries of origins, accounting for 19.1 percent, 16.6 percent, and 7.8 percent of the total share, respectively.
Efforts have been made to attract additional arrivals by establishing more direct flights and introducing new initiatives such as the “China Ready” initiative and joint tour pack-ages. The role and organizational structure of the Ministry of Tourism have also been strengthened.4 The Ministry of Tourism has been given a leading role in managing and developing the tourism sector, including human resource development, and has also been tasked with collaborating with other government agencies and the private sector to implement the Law on Tourism and the Tourism Development Strategic Plan.
There are signs of a gradual recovery in the tourism sector in early 2017. Arrivals from Western Europe and North America have picked up, although Asia continues to be the main tourism market for Cambodia.5
Diversification of tourist attraction sites beyond the Angkor Archeological Park is important. Currently, international arrivals remain largely driven by the Angkor complex
located in the northeastern province of Siem Reap (Figure 10), despite the fact that Cambodia is endowed with countless historical, cultural and natural tourist destinations. To this end, inter-agency coordination, as well as collaboration with the private sector to develop and access to new attraction sites and to improve currently underdeveloped sites, will be essential. Given the recent construction expansion, helping other emerging urban areas to become more tourist-friendly destinations with improved tourism infrastructure, facilities and accessibility would help to support diversification in the tourism sector.
4 Sub-Decree dated December 16, 2016 on structure and functions of the Ministry of Tourism.
5 Tourism statistics report for January 2017, Ministry of Tourism.
17APRIL 2017 CAMBODIA ECONOMIC UPDATE
18 CAMBODIA ECONOMIC UPDATE APRIL 2017
d) Agriculture
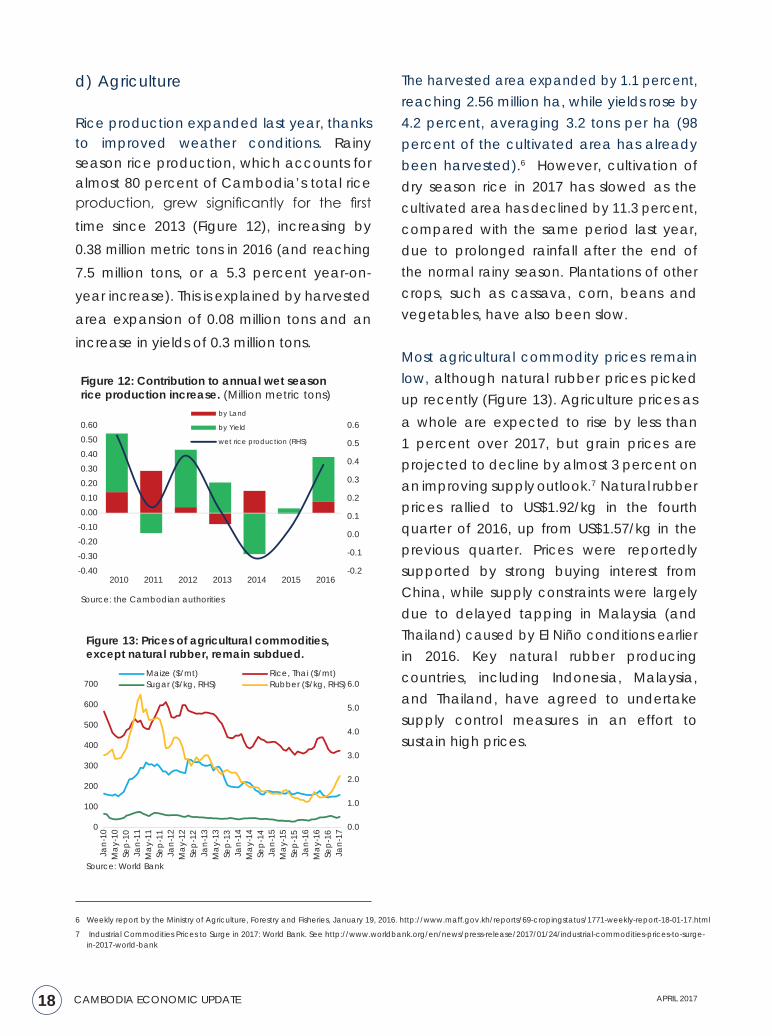
Rice production expanded last year, thanks to improved weather conditions. Rainy season rice production, which accounts for almost 80 percent of Cambodia’s total rice production, grew significantly for the first time since 2013 (Figure 12), increasing by 0.38 million metric tons in 2016 (and reaching 7.5 million tons, or a 5.3 percent year-on-year increase). This is explained by harvested area expansion of 0.08 million tons and an increase in yields of 0.3 million tons.
The harvested area expanded by 1.1 percent, reaching 2.56 million ha, while yields rose by 4.2 percent, averaging 3.2 tons per ha (98 percent of the cultivated area has already been harvested).6 However, cultivation of dry season rice in 2017 has slowed as the cultivated area has declined by 11.3 percent, compared with the same period last year, due to prolonged rainfall after the end of the normal rainy season. Plantations of other crops, such as cassava, corn, beans and vegetables, have also been slow.
Most agricultural commodity prices remain low, although natural rubber prices picked up recently (Figure 13). Agriculture prices as a whole are expected to rise by less than 1 percent over 2017, but grain prices are projected to decline by almost 3 percent on an improving supply outlook.7 Natural rubber prices rallied to US$1.92/kg in the fourth quarter of 2016, up from US$1.57/kg in the previous quarter. Prices were reportedly supported by strong buying interest from China, while supply constraints were largely due to delayed tapping in Malaysia (and Thailand) caused by El Niño conditions earlier in 2016. Key natural rubber producing countries, including Indonesia, Malaysia, and Thailand, have agreed to undertake supply control measures in an effort to sustain high prices.
6 Weekly report by the Ministry of Agriculture, Forestry and Fisheries, January 19, 2016. http://www.maff.gov.kh/reports/69-cropingstatus/1771-weekly-report-18-01-17.html
7 Industrial Commodities Prices to Surge in 2017: World Bank. See http://www.worldbank.org/en/news/press-release/2017/01/24/industrial-commodities-prices-to-surge-in-2017-world-bank
-0.2
-0.1
0.0
0.1
0.2
0.3
0.4
0.5
0.6
-0.40-0.30-0.20-0.100.000.100.200.300.400.500.60
2010 2011 2012 2013 2014 2015 2016
by Land
by Yield
wet rice production (RHS)
Figure 12: Contribution to annual wet season rice production increase. (Million metric tons)
Source: the Cambodian authorities
0.0
1.0
2.0
3.0
4.0
5.0
6.0
0
100
200
300
400
500
600
700
Jan-
10M
ay-1
0Se
p-10
Jan-
11M
ay-1
1Se
p-11
Jan-
12M
ay-1
2Se
p-12
Jan-
13M
ay-1
3Se
p-13
Jan-
14M
ay-1
4Se
p-14
Jan-
15M
ay-1
5Se
p-15
Jan-
16M
ay-1
6Se
p-16
Jan-
17
Maize ($/mt) Rice, Thai ($/mt)Sugar ($/kg, RHS) Rubber ($/kg, RHS)
Figure 13: Prices of agricultural commodities, except natural rubber, remain subdued.
Source: World Bank
19APRIL 2017 CAMBODIA ECONOMIC UPDATE
POVERTY
As a newly emerging sector, the construction sector has played an increasingly important role in providing an alternative source of income for workers migrating from rural households to be employed in urban areas. This is in addition to the income source from the traditional garment and footwear sector. Jobs created by the construction sector accounted for about 200,000 in 2016, a 33.3 percent year-on-year increase.8 This represents 10 percent of total employment in the industry sector, equivalent to about one-third of total employment generated by the garment and footwear sector. Wages of unskilled workers in the construction sector have risen to as high as US$200 a month, well above the garment and footwear industry’s minimum wage of US$153 a month, which represents a 9.2 percent year-on-year increase. Wages of skilled construction workers are twice as much as the minimum wage, ranging from US$300 to US$450 a month.
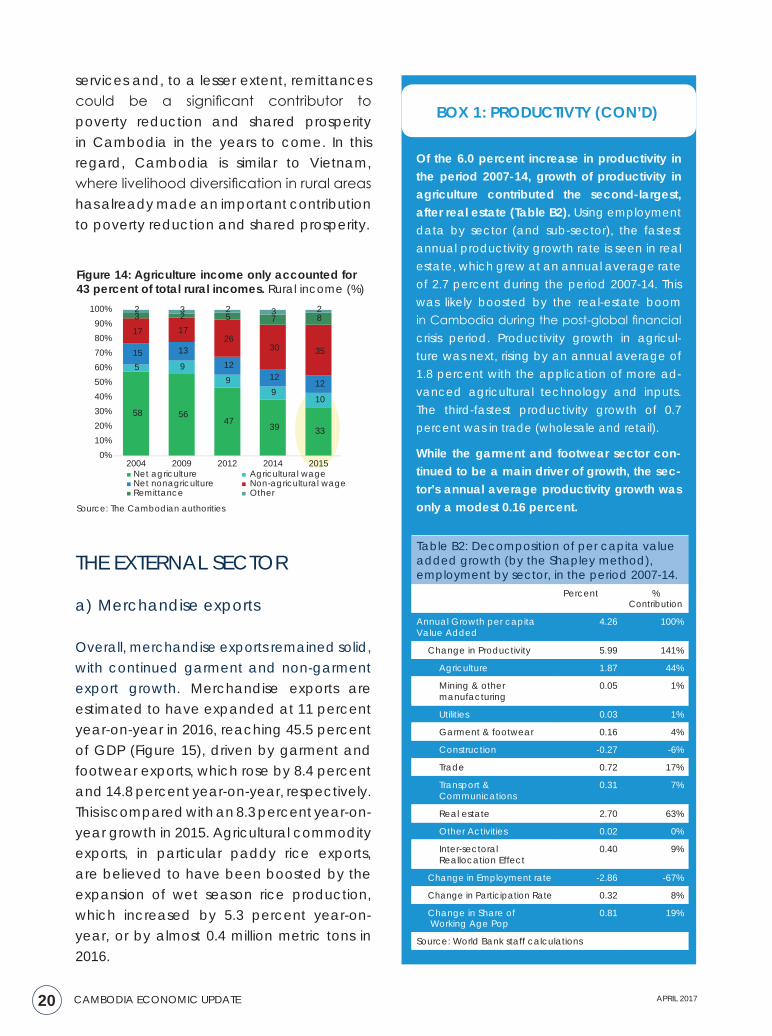
Diversification of livelihood portfolios is helping to sustain poverty reduction in Cambodia. By 2015, non-agriculture wage incomes made up more than one-third of rural incomes, compared with less than one-fifth in 2007 (Figure 14). During the same period, agricultural incomes including agricultural wages declined to only 43 percent of total rural incomes, down from 63 percent. Thus, poverty is expected to have continued to decline, despite agricultural growth stagnating, the sector that had driven poverty reduction until 2012. This trend means that the rural non-farm economic activity such as garment, construction and
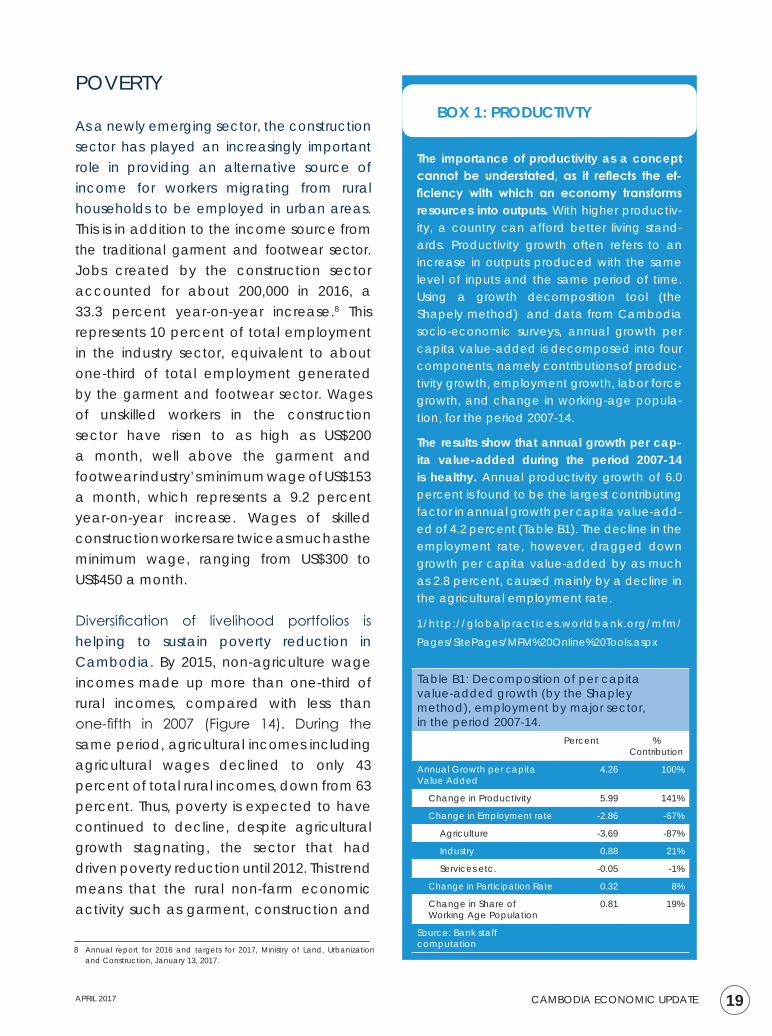
The importance of productivity as a concept cannot be understated, as it reflects the ef-ficiency with which an economy transforms resources into outputs. With higher productiv-ity, a country can afford better living stand-ards. Productivity growth often refers to an increase in outputs produced with the same level of inputs and the same period of time. Using a growth decomposition tool (the Shapely method) and data from Cambodia socio-economic surveys, annual growth per capita value-added is decomposed into four components, namely contributions of produc-tivity growth, employment growth, labor force growth, and change in working-age popula-tion, for the period 2007-14.
The results show that annual growth per cap-ita value-added during the period 2007-14 is healthy. Annual productivity growth of 6.0 percent is found to be the largest contributing factor in annual growth per capita value-add-ed of 4.2 percent (Table B1). The decline in the employment rate, however, dragged down growth per capita value-added by as much as 2.8 percent, caused mainly by a decline in the agricultural employment rate.
1/http://globalpractices.worldbank.org/mfm/
Pages/SitePages/MFM%20Online%20Tools.aspx
BOX 1: PRODUCTIVTY
Table B1: Decomposition of per capita value-added growth (by the Shapley method), employment by major sector, in the period 2007-14.
Percent % Contribution
Annual Growth per capita Value Added
4.26 100%
Change in Productivity 5.99 141%
Change in Employment rate -2.86 -67%
Agriculture -3.69 -87%
Industry 0.88 21%
Services etc. -0.05 -1%
Change in Participation Rate 0.32 8%
Change in Share of Working Age Population
0.81 19%
Source: Bank staff computation
8 Annual report for 2016 and targets for 2017, Ministry of Land, Urbanization and Construction, January 13, 2017.
20 CAMBODIA ECONOMIC UPDATE APRIL 2017
services and, to a lesser extent, remittances could be a significant contributor to poverty reduction and shared prosperity in Cambodia in the years to come. In this regard, Cambodia is similar to Vietnam, where livelihood diversification in rural areas has already made an important contribution to poverty reduction and shared prosperity.
Of the 6.0 percent increase in productivity in the period 2007-14, growth of productivity in agriculture contributed the second-largest, after real estate (Table B2). Using employment data by sector (and sub-sector), the fastest annual productivity growth rate is seen in real estate, which grew at an annual average rate of 2.7 percent during the period 2007-14. This was likely boosted by the real-estate boom in Cambodia during the post-global financial crisis period. Productivity growth in agricul-ture was next, rising by an annual average of 1.8 percent with the application of more ad-vanced agricultural technology and inputs. The third-fastest productivity growth of 0.7 percent was in trade (wholesale and retail).
While the garment and footwear sector con-tinued to be a main driver of growth, the sec-tor’s annual average productivity growth was only a modest 0.16 percent.
BOX 1: PRODUCTIVTY (CON’D)
Table B2: Decomposition of per capita value added growth (by the Shapley method), employment by sector, in the period 2007-14.
Percent % Contribution
Annual Growth per capita Value Added
4.26 100%
Change in Productivity 5.99 141%
Agriculture 1.87 44%
Mining & other manufacturing
0.05 1%
Utilities 0.03 1%
Garment & footwear 0.16 4%
Construction -0.27 -6%
Trade 0.72 17%
Transport & Communications
0.31 7%
Real estate 2.70 63%
Other Activities 0.02 0%
Inter-sectoral Reallocation Effect
0.40 9%
Change in Employment rate -2.86 -67%
Change in Participation Rate 0.32 8%
Change in Share of Working Age Pop
0.81 19%
Source: World Bank staff calculations
58 56 47 39 33
5 9
99
10
15 13 12
12 12
17 17 26
30 35
3 2 5 7 8 2 3 2 3 2
0%10%20%30%40%50%60%70%80%90%
100%
2004 2009 2012 2014 2015Net agriculture Agricultural wageNet nonagriculture Non-agricultural wageRemittance Other
Figure 14: Agriculture income only accounted for 43 percent of total rural incomes. Rural income (%)
Source: The Cambodian authorities
THE EXTERNAL SECTOR
a) Merchandise exports
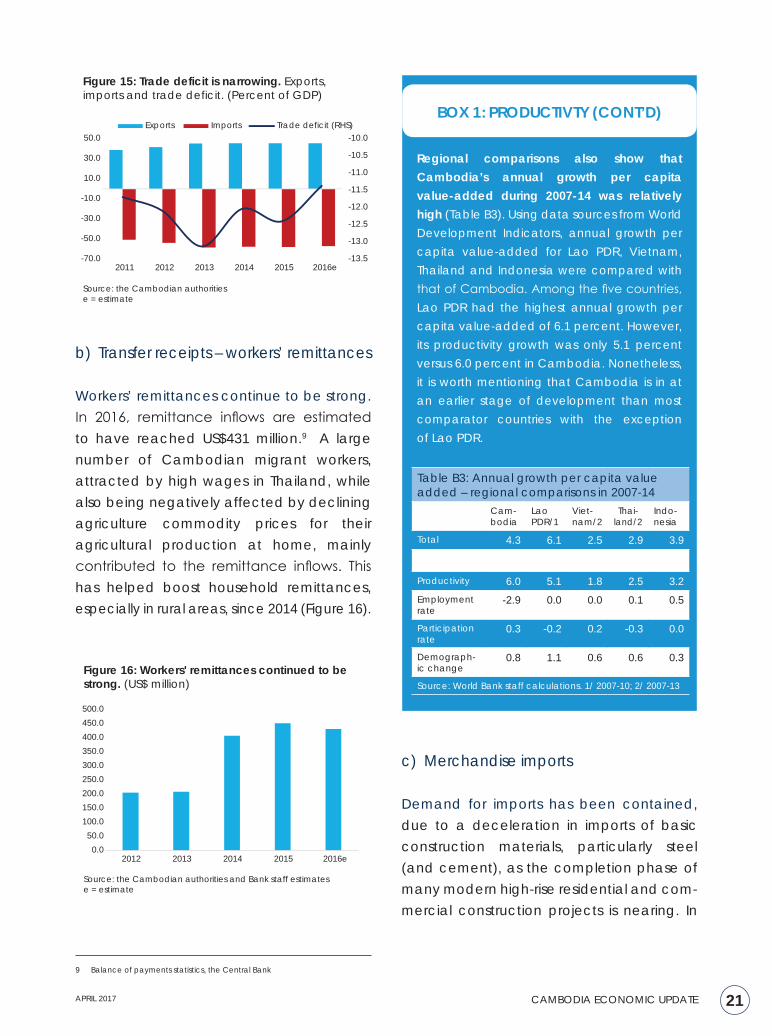
Overall, merchandise exports remained solid, with continued garment and non-garment export growth. Merchandise exports are estimated to have expanded at 11 percent year-on-year in 2016, reaching 45.5 percent of GDP (Figure 15), driven by garment and footwear exports, which rose by 8.4 percent and 14.8 percent year-on-year, respectively. This is compared with an 8.3 percent year-on-year growth in 2015. Agricultural commodity exports, in particular paddy rice exports, are believed to have been boosted by the expansion of wet season rice production, which increased by 5.3 percent year-on-year, or by almost 0.4 million metric tons in 2016.
21APRIL 2017 CAMBODIA ECONOMIC UPDATE
b) Transfer receipts – workers’ remittances
Workers’ remittances continue to be strong. In 2016, remittance inflows are estimated to have reached US$431 million.9 A large number of Cambodian migrant workers, attracted by high wages in Thailand, while also being negatively affected by declining agriculture commodity prices for their agricultural production at home, mainly contributed to the remittance inflows. This has helped boost household remittances, especially in rural areas, since 2014 (Figure 16).
Regional comparisons also show that Cambodia’s annual growth per capita value-added during 2007-14 was relatively high (Table B3). Using data sources from World Development Indicators, annual growth per capita value-added for Lao PDR, Vietnam, Thailand and Indonesia were compared with that of Cambodia. Among the five countries, Lao PDR had the highest annual growth per capita value-added of 6.1 percent. However, its productivity growth was only 5.1 percent versus 6.0 percent in Cambodia. Nonetheless, it is worth mentioning that Cambodia is in at an earlier stage of development than most comparator countries with the exception of Lao PDR.
BOX 1: PRODUCTIVTY (CONT’D)
Table B3: Annual growth per capita value added – regional comparisons in 2007-14
Cam-bodia
Lao PDR/1
Viet-nam/2
Thai-land/2
Indo-nesia
Total 4.3 6.1 2.5 2.9 3.9
Productivity 6.0 5.1 1.8 2.5 3.2Employment rate
-2.9 0.0 0.0 0.1 0.5
Participation rate
0.3 -0.2 0.2 -0.3 0.0
Demograph-ic change
0.8 1.1 0.6 0.6 0.3
Source: World Bank staff calculations. 1/ 2007-10; 2/ 2007-13
9 Balance of payments statistics, the Central Bank
-13.5
-13.0
-12.5
-12.0
-11.5
-11.0
-10.5
-10.0
-70.0
-50.0
-30.0
-10.0
10.0
30.0
50.0
2011 2012 2013 2014 2015 2016e
Exports Imports Trade deficit (RHS)
Figure 15: Trade deficit is narrowing. Exports, imports and trade deficit. (Percent of GDP)
Source: the Cambodian authoritiese = estimate
0.050.0
100.0150.0200.0250.0300.0350.0400.0450.0500.0
2012 2013 2014 2015 2016e
Figure 16: Workers' remittances continued to be strong. (US$ million)
Source: the Cambodian authorities and Bank staff estimatese = estimate
c) Merchandise imports
Demand for imports has been contained, due to a deceleration in imports of basic construction materials, particularly steel (and cement), as the completion phase of many modern high-rise residential and com-mercial construction projects is nearing. In
22 CAMBODIA ECONOMIC UPDATE APRIL 2017
addition, there has been a rapidly growing import substitution effort, with the expansion of domestic production, especially for food and beverage products and cement. Im-port growth is estimated to have remained at around 9 percent year-on-year in 2016, equivalent to 56.9 percent of GDP.
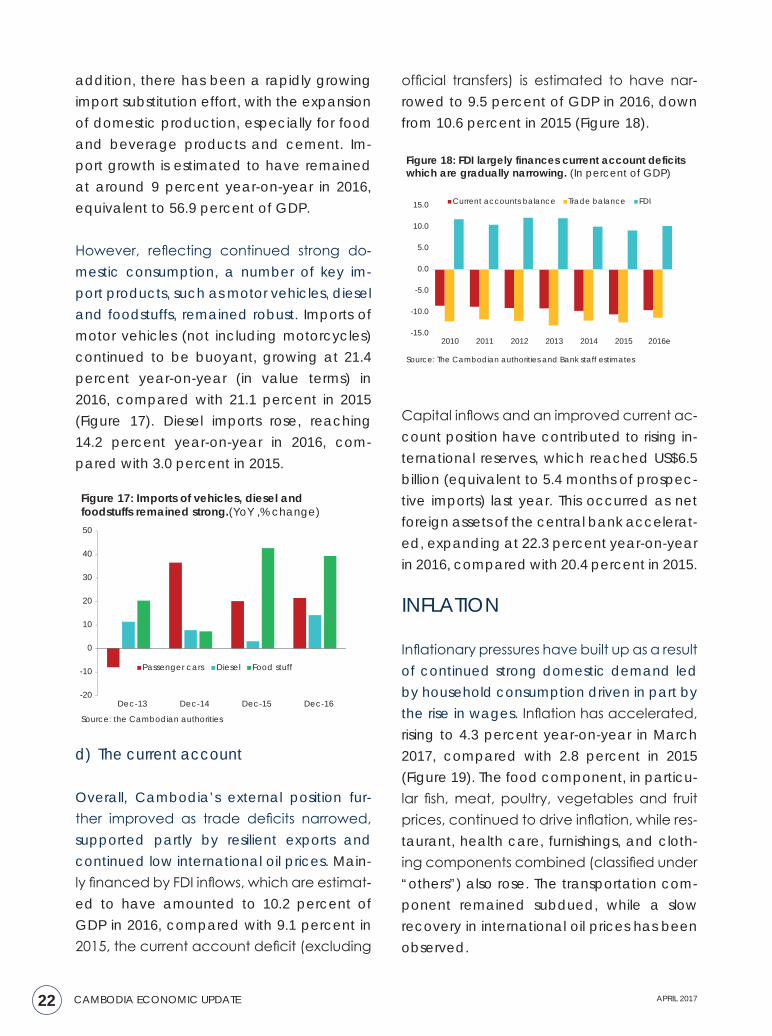
However, reflecting continued strong do-mestic consumption, a number of key im-port products, such as motor vehicles, diesel and foodstuffs, remained robust. Imports of motor vehicles (not including motorcycles) continued to be buoyant, growing at 21.4 percent year-on-year (in value terms) in 2016, compared with 21.1 percent in 2015 (Figure 17). Diesel imports rose, reaching 14.2 percent year-on-year in 2016, com-pared with 3.0 percent in 2015.
-20
-10
0
10
20
30
40
50
Dec-13 Dec-14 Dec-15 Dec-16
Passenger cars Diesel Food stuff
Figure 17: Imports of vehicles, diesel and foodstuffs remained strong.(YoY ,% change)
Source: the Cambodian authorities
-15.0
-10.0
-5.0
0.0
5.0
10.0
15.0
2010 2011 2012 2013 2014 2015 2016e
Current accounts balance Trade balance FDI
Figure 18: FDI largely finances current account deficits which are gradually narrowing. (In percent of GDP)
Source: The Cambodian authorities and Bank staff estimates
d) The current account
Overall, Cambodia’s external position fur-ther improved as trade deficits narrowed, supported partly by resilient exports and continued low international oil prices. Main-ly financed by FDI inflows, which are estimat-ed to have amounted to 10.2 percent of GDP in 2016, compared with 9.1 percent in 2015, the current account deficit (excluding
official transfers) is estimated to have nar-rowed to 9.5 percent of GDP in 2016, down from 10.6 percent in 2015 (Figure 18).
Capital inflows and an improved current ac-count position have contributed to rising in-ternational reserves, which reached US$6.5 billion (equivalent to 5.4 months of prospec-tive imports) last year. This occurred as net foreign assets of the central bank accelerat-ed, expanding at 22.3 percent year-on-year in 2016, compared with 20.4 percent in 2015.
INFLATION
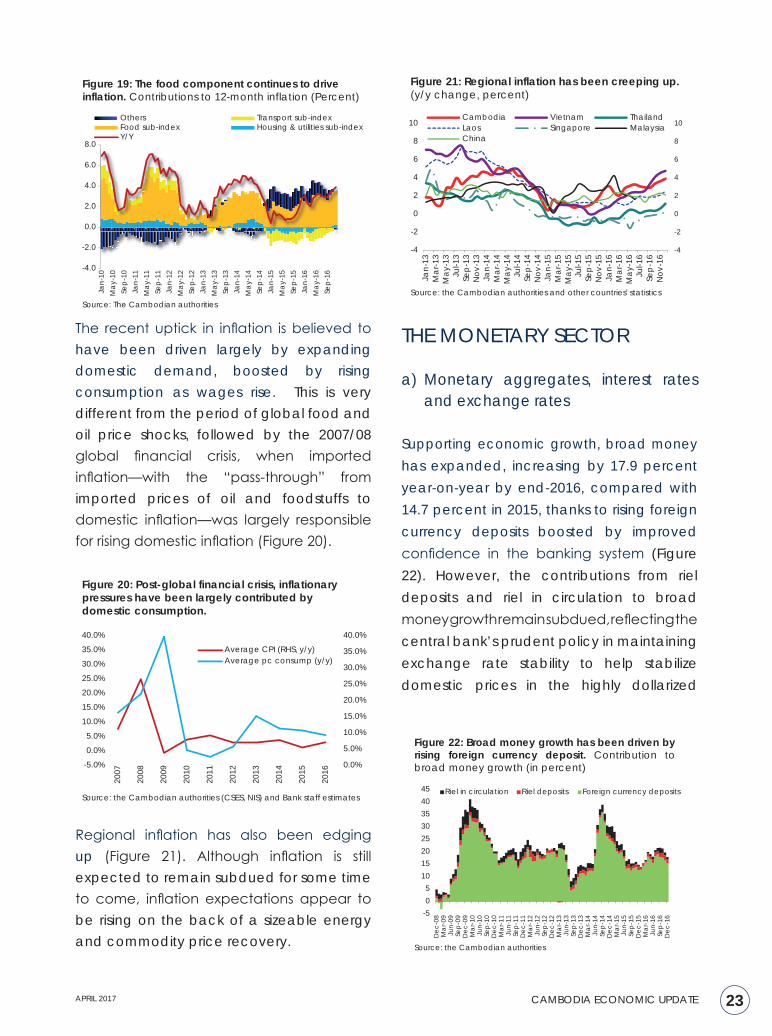
Inflationary pressures have built up as a result of continued strong domestic demand led by household consumption driven in part by the rise in wages. Inflation has accelerated, rising to 4.3 percent year-on-year in March 2017, compared with 2.8 percent in 2015 (Figure 19). The food component, in particu-lar fish, meat, poultry, vegetables and fruit prices, continued to drive inflation, while res-taurant, health care, furnishings, and cloth-ing components combined (classified under “others”) also rose. The transportation com-ponent remained subdued, while a slow recovery in international oil prices has been observed.
23APRIL 2017 CAMBODIA ECONOMIC UPDATE
The recent uptick in inflation is believed to have been driven largely by expanding domestic demand, boosted by rising consumption as wages rise. This is very different from the period of global food and oil price shocks, followed by the 2007/08 global financial crisis, when imported inflation—with the “pass-through” from imported prices of oil and foodstuffs to domestic inflation—was largely responsible for rising domestic inflation (Figure 20).
Regional inflation has also been edging up (Figure 21). Although inflation is still expected to remain subdued for some time to come, inflation expectations appear to be rising on the back of a sizeable energy and commodity price recovery.
THE MONETARY SECTOR
a) Monetary aggregates, interest rates and exchange rates
Supporting economic growth, broad money has expanded, increasing by 17.9 percent year-on-year by end-2016, compared with 14.7 percent in 2015, thanks to rising foreign currency deposits boosted by improved confidence in the banking system (Figure 22). However, the contributions from riel deposits and riel in circulation to broad money growth remain subdued, reflecting the central bank’s prudent policy in maintaining exchange rate stability to help stabilize domestic prices in the highly dollarized
-4.0
-2.0
0.0
2.0
4.0
6.0
8.0
Jan-
10M
ay-1
0Se
p-10
Jan-
11M
ay-1
1Se
p-11
Jan-
12M
ay-1
2Se
p-12
Jan-
13M
ay-1
3Se
p-13
Jan-
14M
ay-1
4Se
p-14
Jan-
15M
ay-1
5Se
p-15
Jan-
16M
ay-1
6Se
p-16
Others Transport sub-indexFood sub-index Housing & utilities sub-indexY/Y
Figure 19: The food component continues to drive inflation. Contributions to 12-month inflation (Percent)
Source: The Cambodian authorities
-4
-2
0
2
4
6
8
10
-4
-2
0
2
4
6
8
10
Jan-
13M
ar-1
3M
ay-1
3Ju
l-13
Sep-
13N
ov-1
3Ja
n-14
Mar
-14
May
-14
Jul-1
4Se
p-14
Nov
-14
Jan-
15M
ar-1
5M
ay-1
5Ju
l-15
Sep-
15N
ov-1
5Ja
n-16
Mar
-16
May
-16
Jul-1
6Se
p-16
Nov
-16
Cambodia Vietnam ThailandLaos Singapore MalaysiaChina
Figure 21: Regional inflation has been creeping up.
(y/y change, percent)
Source: the Cambodian authorities and other countries' statistics
0.0%
5.0%
10.0%
15.0%
20.0%
25.0%
30.0%
35.0%
40.0%
-5.0%
0.0%
5.0%
10.0%
15.0%
20.0%
25.0%
30.0%
35.0%
40.0%
2007
2008
2009
2010
2011
2012
2013
2014
2015
2016
Average CPI (RHS, y/y)Average pc consump (y/y)
Figure 20: Post-global financial crisis, inflationary pressures have been largely contributed by domestic consumption.
Source: the Cambodian authorities (CSES, NIS) and Bank staff estimates
-505
1015202530354045
Dec
-08
Mar
-09
Jun-
09Se
p-09
Dec
-09
Mar
-10
Jun-
10Se
p-10
Dec
-10
Mar
-11
Jun-
11Se
p-11
Dec
-11
Mar
-12
Jun-
12Se
p-12
Dec
-12
Mar
-13
Jun-
13Se
p-13
Dec
-13
Mar
-14
Jun-
14Se
p-14
Dec
-14
Mar
-15
Jun-
15Se
p-15
Dec
-15
Mar
-16
Jun-
16Se
p-16
Dec
-16
Riel in circulation Riel deposits Foreign currency deposits
Figure 22: Broad money growth has been driven by rising foreign currency deposit. Contribution to broad money growth (in percent)
Source: the Cambodian authorities
24 CAMBODIA ECONOMIC UPDATE APRIL 2017
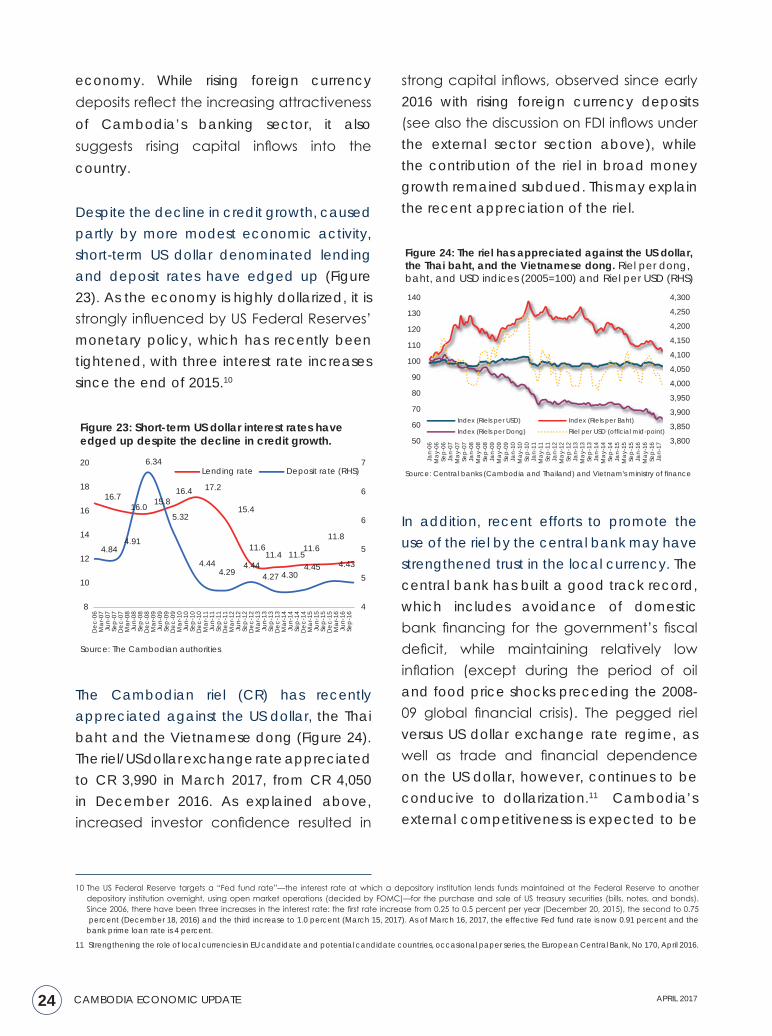
Despite the decline in credit growth, caused partly by more modest economic activity, short-term US dollar denominated lending and deposit rates have edged up (Figure 23). As the economy is highly dollarized, it is strongly influenced by US Federal Reserves’ monetary policy, which has recently been tightened, with three interest rate increases since the end of 2015.10
The Cambodian riel (CR) has recently appreciated against the US dollar, the Thai baht and the Vietnamese dong (Figure 24). The riel/US dollar exchange rate appreciated to CR 3,990 in March 2017, from CR 4,050 in December 2016. As explained above, increased investor confidence resulted in
10 The US Federal Reserve targets a “Fed fund rate”—the interest rate at which a depository institution lends funds maintained at the Federal Reserve to another depository institution overnight, using open market operations (decided by FOMC)—for the purchase and sale of US treasury securities (bills, notes, and bonds). Since 2006, there have been three increases in the interest rate: the first rate increase from 0.25 to 0.5 percent per year (December 20, 2015), the second to 0.75 percent (December 18, 2016) and the third increase to 1.0 percent (March 15, 2017). As of March 16, 2017, the effective Fed fund rate is now 0.91 percent and the bank prime loan rate is 4 percent.
11 Strengthening the role of local currencies in EU candidate and potential candidate countries, occasional paper series, the European Central Bank, No 170, April 2016.
3,800
3,850
3,900
3,950
4,000
4,050
4,100
4,150
4,200
4,250
4,300
50
60
70
80
90
100
110
120
130
140
Jan-
06M
ay-0
6Se
p-06
Jan-
07M
ay-0
7Se
p-07
Jan-
08M
ay-0
8Se
p-08
Jan-
09M
ay-0
9Se
p-09
Jan-
10M
ay-1
0Se
p-10
Jan-
11M
ay-1
1Se
p-11
Jan-
12M
ay-1
2Se
p-12
Jan-
13M
ay-1
3Se
p-13
Jan-
14M
ay-1
4Se
p-14
Jan-
15M
ay-1
5Se
p-15
Jan-
16M
ay-1
6Se
p-16
Jan-
17
Index (Riels per USD) Index (Riels per Baht)
Index (Riels per Dong) Riel per USD (official mid-point)
Figure 24: The riel has appreciated against the US dollar, the Thai baht, and the Vietnamese dong. Riel per dong, baht, and USD indices (2005=100) and Riel per USD (RHS)
Source: Central banks (Cambodia and Thailand) and Vietnam's ministry of finance
16.7 16.0 15.8
16.4 17.2
15.4
11.6 11.4 11.5
11.6 11.8
4.84 4.91
6.34
5.32
4.44 4.29
4.444.27 4.30
4.45 4.43
4
5
5
6
6
7
8
10
12
14
16
18
20
Dec
-06
Mar
-07
Jun-
07Se
p-0
7D
ec-0
7M
ar-0
8Ju
n-08
Sep
-08
Dec
-08
Mar
-09
Jun-
09Se
p-0
9D
ec-0
9M
ar-1
0Ju
n-10
Sep
-10
Dec
-10
Mar
-11
Jun-
11Se
p-1
1D
ec-1
1M
ar-1
2Ju
n-12
Sep
-12
Dec
-12
Mar
-13
Jun-
13Se
p-1
3D
ec-1
3M
ar-1
4Ju
n-14
Sep
-14
Dec
-14
Mar
-15
Jun-
15Se
p-1
5D
ec-1
5M
ar-1
6Ju
n-16
Sep
-16
Lending rate Deposit rate (RHS)
Figure 23: Short-term US dollar interest rates have edged up despite the decline in credit growth.
Source: The Cambodian authorities
strong capital inflows, observed since early 2016 with rising foreign currency deposits (see also the discussion on FDI inflows under the external sector section above), while the contribution of the riel in broad money growth remained subdued. This may explain the recent appreciation of the riel.
In addition, recent efforts to promote the use of the riel by the central bank may have strengthened trust in the local currency. The central bank has built a good track record, which includes avoidance of domestic bank financing for the government’s fiscal deficit, while maintaining relatively low inflation (except during the period of oil and food price shocks preceding the 2008-09 global financial crisis). The pegged riel versus US dollar exchange rate regime, as well as trade and financial dependence on the US dollar, however, continues to be conducive to dollarization.11 Cambodia’s external competitiveness is expected to be
economy. While rising foreign currency deposits reflect the increasing attractiveness of Cambodia’s banking sector, it also suggests rising capital inflows into the country.
25APRIL 2017 CAMBODIA ECONOMIC UPDATE
05
101520253035404550
Jan-
10M
ay-1
0Se
p-10
Jan-
11M
ay-1
1Se
p-11
Jan-
12M
ay-1
2Se
p-12
Jan-
13M
ay-1
3Se
p-13
Jan-
14M
ay-1
4Se
p-14
Jan-
15M
ay-1
5Se
p-15
Jan-
16M
ay-1
6Se
p-16
Deposits by the private sector Credits to the private sector
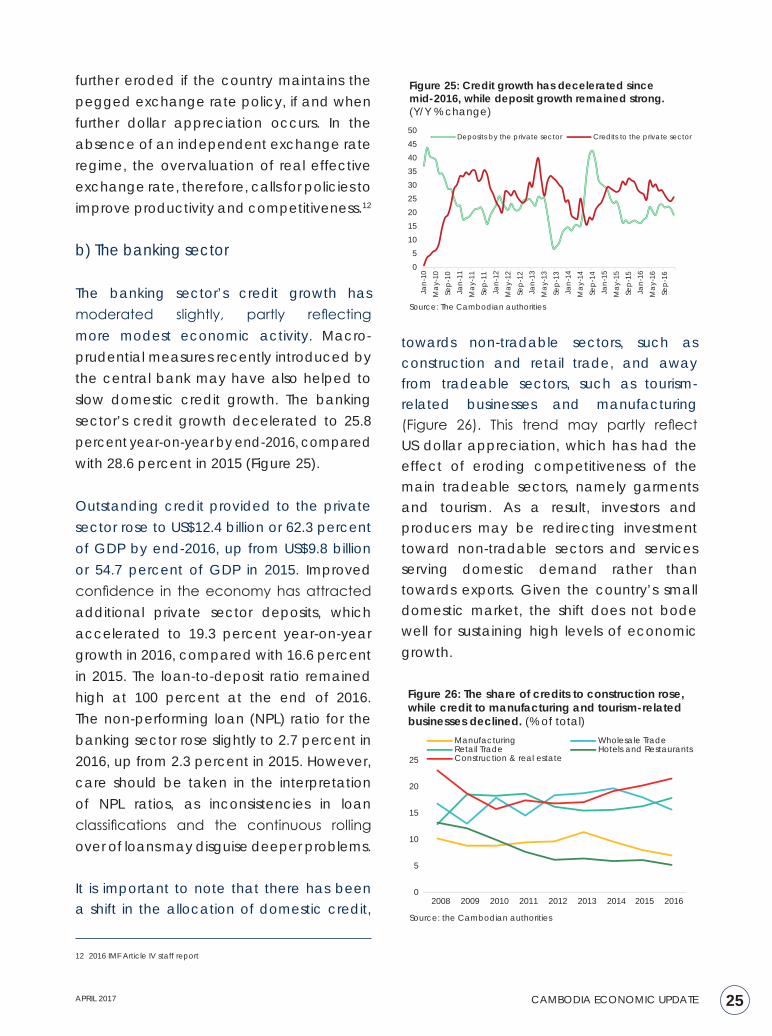
Figure 25: Credit growth has decelerated since mid-2016, while deposit growth remained strong. (Y/Y % change)
Source: The Cambodian authorities
further eroded if the country maintains the pegged exchange rate policy, if and when further dollar appreciation occurs. In the absence of an independent exchange rate regime, the overvaluation of real effective exchange rate, therefore, calls for policies to improve productivity and competitiveness.12
b) The banking sector
The banking sector’s credit growth has moderated slightly, partly reflecting more modest economic activity. Macro-prudential measures recently introduced by the central bank may have also helped to slow domestic credit growth. The banking sector’s credit growth decelerated to 25.8 percent year-on-year by end-2016, compared with 28.6 percent in 2015 (Figure 25).
Outstanding credit provided to the private sector rose to US$12.4 billion or 62.3 percent of GDP by end-2016, up from US$9.8 billion or 54.7 percent of GDP in 2015. Improved confidence in the economy has attracted additional private sector deposits, which accelerated to 19.3 percent year-on-year growth in 2016, compared with 16.6 percent in 2015. The loan-to-deposit ratio remained high at 100 percent at the end of 2016. The non-performing loan (NPL) ratio for the banking sector rose slightly to 2.7 percent in 2016, up from 2.3 percent in 2015. However, care should be taken in the interpretation of NPL ratios, as inconsistencies in loan classifications and the continuous rolling over of loans may disguise deeper problems.
It is important to note that there has been a shift in the allocation of domestic credit,
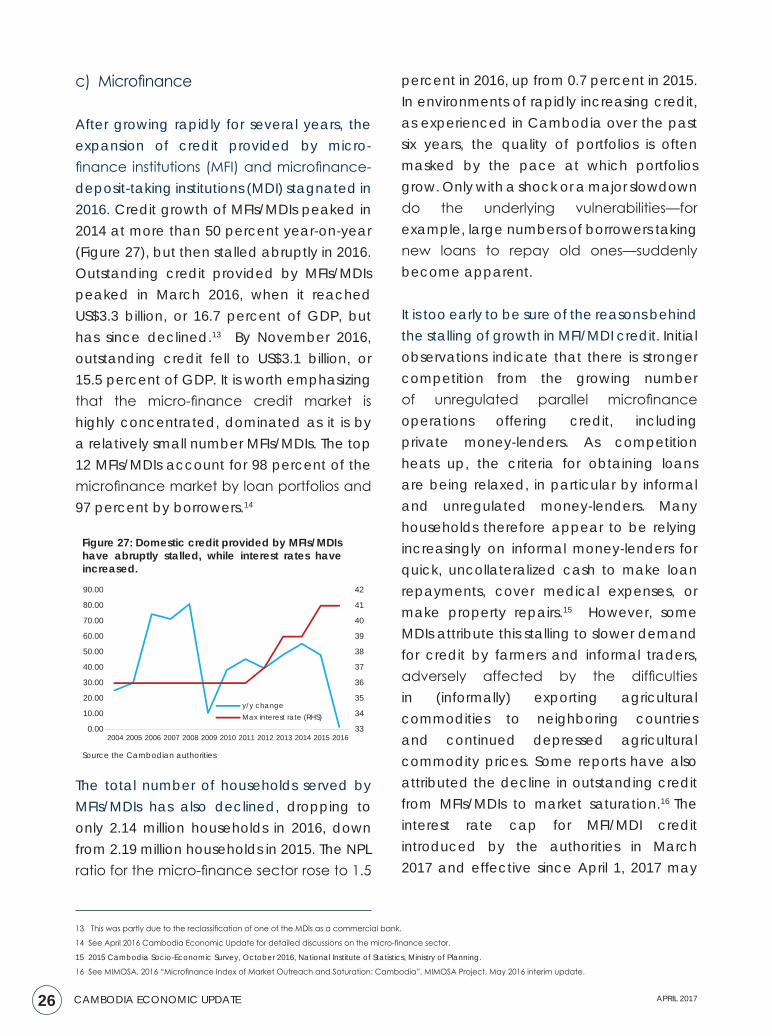
towards non-tradable sectors, such as construction and retail trade, and away from tradeable sectors, such as tourism-related businesses and manufacturing (Figure 26). This trend may partly reflect US dollar appreciation, which has had the effect of eroding competitiveness of the main tradeable sectors, namely garments and tourism. As a result, investors and producers may be redirecting investment toward non-tradable sectors and services serving domestic demand rather than towards exports. Given the country’s small domestic market, the shift does not bode well for sustaining high levels of economic growth.
12 2016 IMF Article IV staff report
0
5
10
15
20
25
2008 2009 2010 2011 2012 2013 2014 2015 2016
Manufacturing Wholesale TradeRetail Trade Hotels and RestaurantsConstruction & real estate
Figure 26: The share of credits to construction rose, while credit to manufacturing and tourism-related businesses declined. (% of total)
Source: the Cambodian authorities
26 CAMBODIA ECONOMIC UPDATE APRIL 2017
33
34
35
36
37
38
39
40
41
42
0.00
10.00
20.00
30.00
40.00
50.00
60.00
70.00
80.00
90.00
2004 2005 2006 2007 2008 2009 2010 2011 2012 2013 2014 2015 2016
y/y changeMax interest rate (RHS)
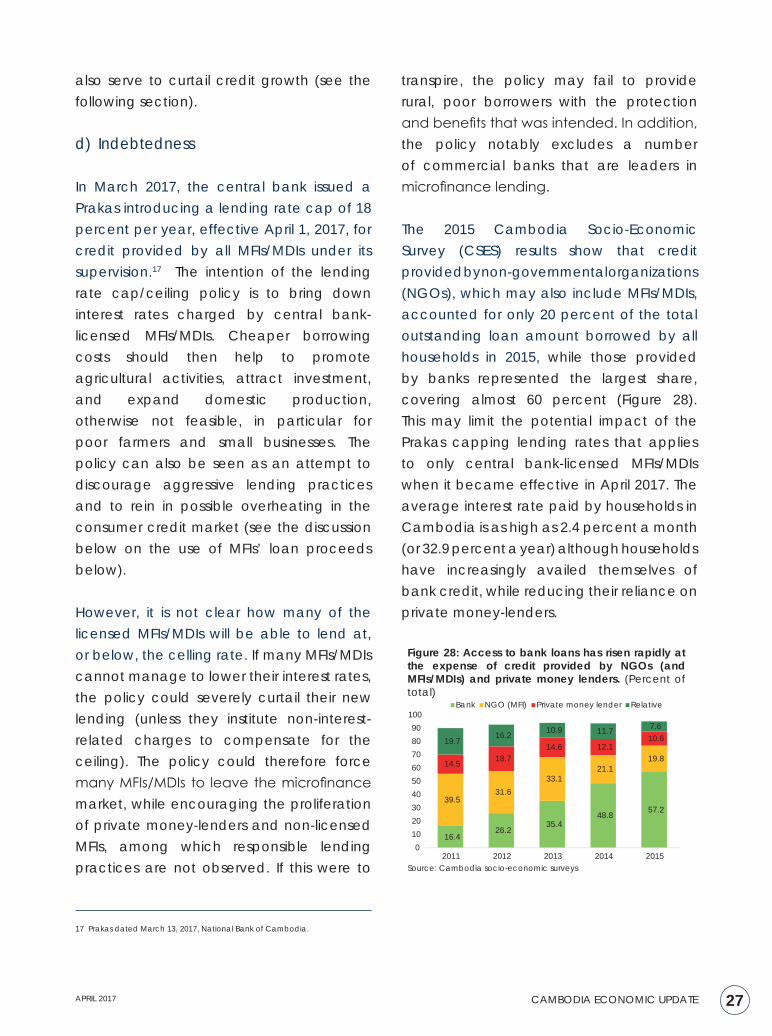
Figure 27: Domestic credit provided by MFIs/MDIs have abruptly stalled, while interest rates have increased.
Source the Cambodian authorities
c) Microfinance
After growing rapidly for several years, the expansion of credit provided by micro-finance institutions (MFI) and microfinance-deposit-taking institutions (MDI) stagnated in 2016. Credit growth of MFIs/MDIs peaked in 2014 at more than 50 percent year-on-year (Figure 27), but then stalled abruptly in 2016. Outstanding credit provided by MFIs/MDIs peaked in March 2016, when it reached US$3.3 billion, or 16.7 percent of GDP, but has since declined.13 By November 2016, outstanding credit fell to US$3.1 billion, or 15.5 percent of GDP. It is worth emphasizing that the micro-finance credit market is highly concentrated, dominated as it is by a relatively small number MFIs/MDIs. The top 12 MFIs/MDIs account for 98 percent of the microfinance market by loan portfolios and 97 percent by borrowers.14
The total number of households served by MFIs/MDIs has also declined, dropping to only 2.14 million households in 2016, down from 2.19 million households in 2015. The NPL ratio for the micro-finance sector rose to 1.5
13 This was partly due to the reclassification of one of the MDIs as a commercial bank.
14 See April 2016 Cambodia Economic Update for detailed discussions on the micro-finance sector.
15 2015 Cambodia Socio-Economic Survey, October 2016, National Institute of Statistics, Ministry of Planning.
16 See MIMOSA, 2016 “Microfinance Index of Market Outreach and Saturation: Cambodia”, MIMOSA Project, May 2016 interim update.
percent in 2016, up from 0.7 percent in 2015. In environments of rapidly increasing credit, as experienced in Cambodia over the past six years, the quality of portfolios is often masked by the pace at which portfolios grow. Only with a shock or a major slowdown do the underlying vulnerabilities—for example, large numbers of borrowers taking new loans to repay old ones—suddenly become apparent.
It is too early to be sure of the reasons behind the stalling of growth in MFI/MDI credit. Initial observations indicate that there is stronger competition from the growing number of unregulated parallel microfinance operations offering credit, including private money-lenders. As competition heats up, the criteria for obtaining loans are being relaxed, in particular by informal and unregulated money-lenders. Many households therefore appear to be relying increasingly on informal money-lenders for quick, uncollateralized cash to make loan repayments, cover medical expenses, or make property repairs.15 However, some MDIs attribute this stalling to slower demand for credit by farmers and informal traders, adversely affected by the difficulties in (informally) exporting agricultural commodities to neighboring countries and continued depressed agricultural commodity prices. Some reports have also attributed the decline in outstanding credit from MFIs/MDIs to market saturation.16 The interest rate cap for MFI/MDI credit introduced by the authorities in March 2017 and effective since April 1, 2017 may
27APRIL 2017 CAMBODIA ECONOMIC UPDATE
also serve to curtail credit growth (see the following section).
d) Indebtedness
In March 2017, the central bank issued a Prakas introducing a lending rate cap of 18 percent per year, effective April 1, 2017, for credit provided by all MFIs/MDIs under its supervision.17 The intention of the lending rate cap/ceiling policy is to bring down interest rates charged by central bank-licensed MFIs/MDIs. Cheaper borrowing costs should then help to promote agricultural activities, attract investment, and expand domestic production, otherwise not feasible, in particular for poor farmers and small businesses. The policy can also be seen as an attempt to discourage aggressive lending practices and to rein in possible overheating in the consumer credit market (see the discussion below on the use of MFIs’ loan proceeds below).
However, it is not clear how many of the licensed MFIs/MDIs will be able to lend at, or below, the celling rate. If many MFIs/MDIs cannot manage to lower their interest rates, the policy could severely curtail their new lending (unless they institute non-interest-related charges to compensate for the ceiling). The policy could therefore force many MFIs/MDIs to leave the microfinance market, while encouraging the proliferation of private money-lenders and non-licensed MFIs, among which responsible lending practices are not observed. If this were to
17 Prakas dated March 13, 2017, National Bank of Cambodia.
transpire, the policy may fail to provide rural, poor borrowers with the protection and benefits that was intended. In addition, the policy notably excludes a number of commercial banks that are leaders in microfinance lending.
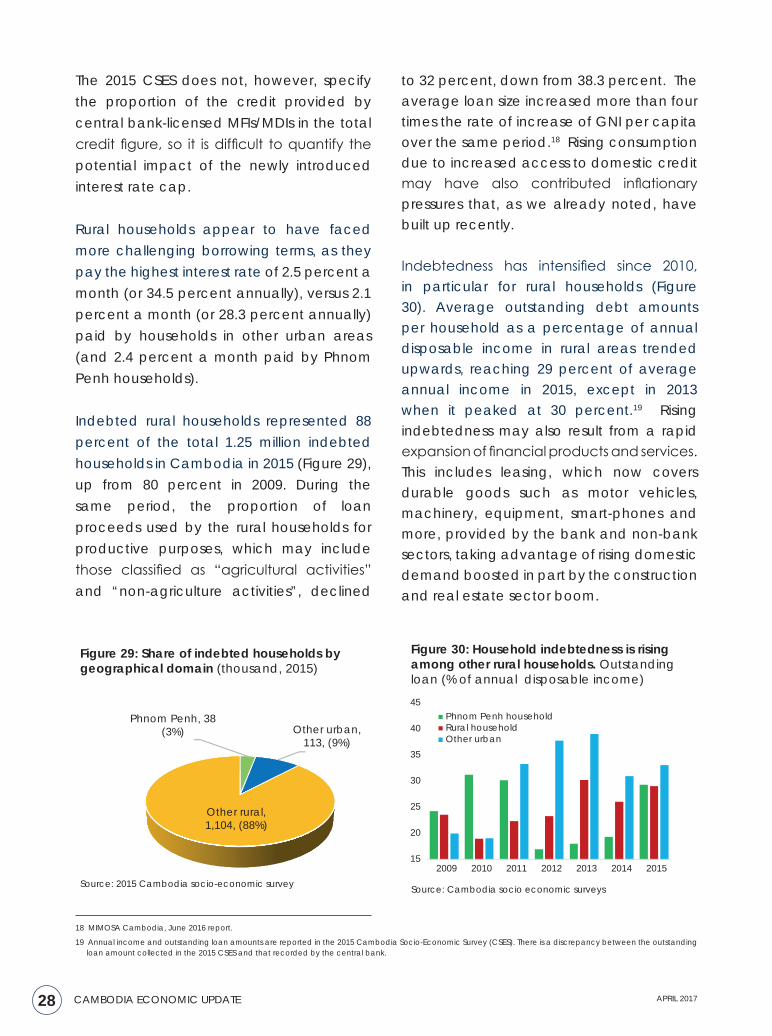
The 2015 Cambodia Socio-Economic Survey (CSES) results show that credit provided by non-governmental organizations (NGOs), which may also include MFIs/MDIs, accounted for only 20 percent of the total outstanding loan amount borrowed by all households in 2015, while those provided by banks represented the largest share, covering almost 60 percent (Figure 28). This may limit the potential impact of the Prakas capping lending rates that applies to only central bank-licensed MFIs/MDIs when it became effective in April 2017. The average interest rate paid by households in Cambodia is as high as 2.4 percent a month (or 32.9 percent a year) although households have increasingly availed themselves of bank credit, while reducing their reliance on private money-lenders.
16.4 26.2
35.4 48.8 57.2
39.5 31.6
33.1 21.1
19.8 14.5 18.7 14.6 12.1
10.6 19.7 16.2 10.9 11.7 7.6
0102030405060708090
100
2011 2012 2013 2014 2015
Bank NGO (MFI) Private money lender Relative
Figure 28: Access to bank loans has risen rapidly at the expense of credit provided by NGOs (and MFIs/MDIs) and private money lenders. (Percent of total)
Source: Cambodia socio-economic surveys
28 CAMBODIA ECONOMIC UPDATE APRIL 2017
The 2015 CSES does not, however, specify the proportion of the credit provided by central bank-licensed MFIs/MDIs in the total credit figure, so it is difficult to quantify the potential impact of the newly introduced interest rate cap.
Rural households appear to have faced more challenging borrowing terms, as they pay the highest interest rate of 2.5 percent a month (or 34.5 percent annually), versus 2.1 percent a month (or 28.3 percent annually) paid by households in other urban areas (and 2.4 percent a month paid by Phnom Penh households).
Indebted rural households represented 88 percent of the total 1.25 million indebted households in Cambodia in 2015 (Figure 29), up from 80 percent in 2009. During the same period, the proportion of loan proceeds used by the rural households for productive purposes, which may include those classified as “agricultural activities” and “non-agriculture activities”, declined
to 32 percent, down from 38.3 percent. The average loan size increased more than four times the rate of increase of GNI per capita over the same period.18 Rising consumption due to increased access to domestic credit may have also contributed inflationary pressures that, as we already noted, have built up recently.
Indebtedness has intensified since 2010, in particular for rural households (Figure 30). Average outstanding debt amounts per household as a percentage of annual disposable income in rural areas trended upwards, reaching 29 percent of average annual income in 2015, except in 2013 when it peaked at 30 percent.19 Rising indebtedness may also result from a rapid expansion of financial products and services. This includes leasing, which now covers durable goods such as motor vehicles, machinery, equipment, smart-phones and more, provided by the bank and non-bank sectors, taking advantage of rising domestic demand boosted in part by the construction and real estate sector boom.
Phnom Penh, 38(3%)
Other rural,1,104, (88%)
Other urban,113, (9%)
Figure 29: Share of indebted households by
geographical domain (thousand, 2015)
Source: 2015 Cambodia socio-economic survey
18 MIMOSA Cambodia, June 2016 report.
19 Annual income and outstanding loan amounts are reported in the 2015 Cambodia Socio-Economic Survey (CSES). There is a discrepancy between the outstanding loan amount collected in the 2015 CSES and that recorded by the central bank.
15
20
25
30
35
40
45
2009 2010 2011 2012 2013 2014 2015
Phnom Penh householdRural householdOther urban
.
Figure 30: Household indebtedness is rising among other rural households. Outstanding loan (% of annual disposable income)
Source: Cambodia socio economic surveys
29APRIL 2017 CAMBODIA ECONOMIC UPDATE
THE FISCAL SECTOR
a) Domestic revenue
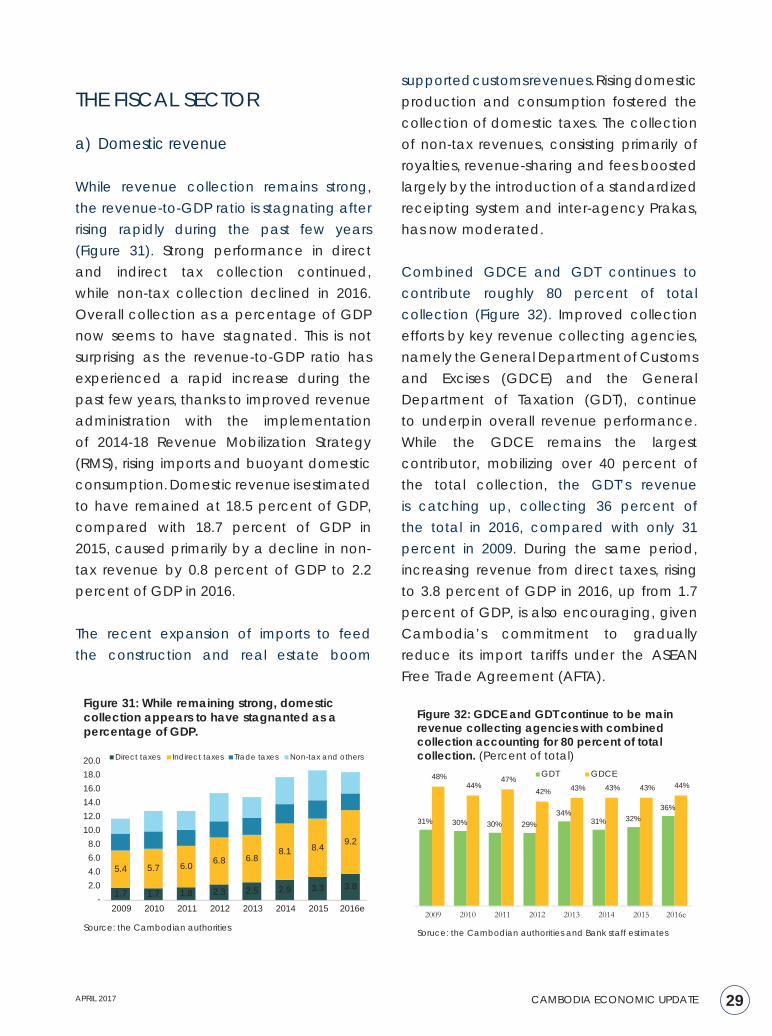
While revenue collection remains strong, the revenue-to-GDP ratio is stagnating after rising rapidly during the past few years (Figure 31). Strong performance in direct and indirect tax collection continued, while non-tax collection declined in 2016. Overall collection as a percentage of GDP now seems to have stagnated. This is not surprising as the revenue-to-GDP ratio has experienced a rapid increase during the past few years, thanks to improved revenue administration with the implementation of 2014-18 Revenue Mobilization Strategy (RMS), rising imports and buoyant domestic consumption. Domestic revenue is estimated to have remained at 18.5 percent of GDP, compared with 18.7 percent of GDP in 2015, caused primarily by a decline in non-tax revenue by 0.8 percent of GDP to 2.2 percent of GDP in 2016.
The recent expansion of imports to feed the construction and real estate boom
supported customs revenues. Rising domestic production and consumption fostered the collection of domestic taxes. The collection of non-tax revenues, consisting primarily of royalties, revenue-sharing and fees boosted largely by the introduction of a standardized receipting system and inter-agency Prakas, has now moderated.
Combined GDCE and GDT continues to contribute roughly 80 percent of total collection (Figure 32). Improved collection efforts by key revenue collecting agencies, namely the General Department of Customs and Excises (GDCE) and the General Department of Taxation (GDT), continue to underpin overall revenue performance. While the GDCE remains the largest contributor, mobilizing over 40 percent of the total collection, the GDT’s revenue is catching up, collecting 36 percent of the total in 2016, compared with only 31 percent in 2009. During the same period, increasing revenue from direct taxes, rising to 3.8 percent of GDP in 2016, up from 1.7 percent of GDP, is also encouraging, given Cambodia’s commitment to gradually reduce its import tariffs under the ASEAN Free Trade Agreement (AFTA).
1.7 1.7 1.8 2.3 2.5 2.9 3.3 3.8
5.4 5.7 6.0 6.8 6.88.1 8.4 9.2
- 2.0 4.0 6.0 8.0
10.0 12.0 14.0 16.0 18.0 20.0
2009 2010 2011 2012 2013 2014 2015 2016e
Direct taxes Indirect taxes Trade taxes Non-tax and others
Figure 31: While remaining strong, domestic collection appears to have stagnanted as a percentage of GDP.
Source: the Cambodian authorities
31% 30% 30% 29%34%
31% 32%36%
48% 44%
47%42% 43% 43% 43% 44%
2009 2010 2011 2012 2013 2014 2015 2016e
GDT GDCE
Figure 32: GDCE and GDT continue to be main revenue collecting agencies with combined collection accounting for 80 percent of total collection. (Percent of total)
Soruce: the Cambodian authorities and Bank staff estimates
30 CAMBODIA ECONOMIC UPDATE APRIL 2017
7.36.4 8.2 7.0 7.0 6.3 5.2 4.7 4.8
2.4
2.4
2.62.1 2.1
1.9 2.6 2.4 2.4
4.4
4.8 4.3
4.6 5.0 5.7 6.5 7.4 7.6
6.3 6.2
7.17.2 6.9 6.8 6.5 7.1 6.9
0
5
10
15
20
2009 2010 2011 2012 2013 2014 2015 2016e 2017b
External fin capital Gov't-financed capitalWage Non-wageNSDP (required capital)
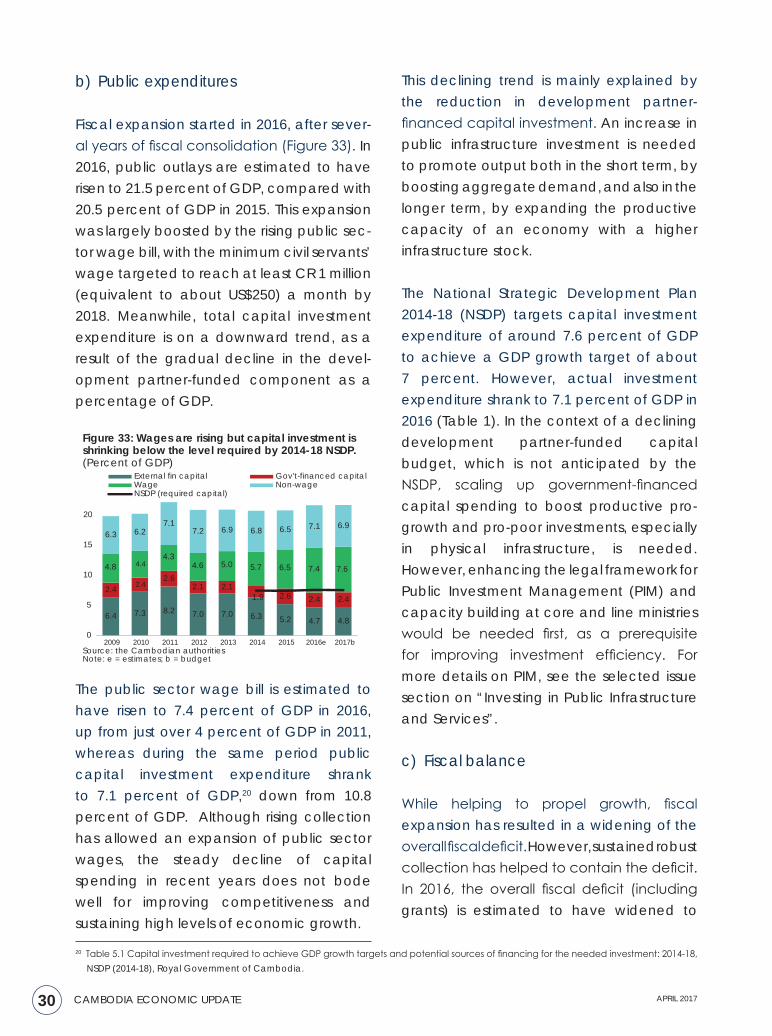
Figure 33: Wages are rising but capital investment is shrinking below the level required by 2014-18 NSDP. (Percent of GDP)
Source: the Cambodian authoritiesNote: e = estimates; b = budget
The public sector wage bill is estimated to have risen to 7.4 percent of GDP in 2016, up from just over 4 percent of GDP in 2011, whereas during the same period public capital investment expenditure shrank to 7.1 percent of GDP,20 down from 10.8 percent of GDP. Although rising collection has allowed an expansion of public sector wages, the steady decline of capital spending in recent years does not bode well for improving competitiveness and sustaining high levels of economic growth.
20 Table 5.1 Capital investment required to achieve GDP growth targets and potential sources of financing for the needed investment: 2014-18, NSDP (2014-18), Royal Government of Cambodia.
b) Public expenditures
Fiscal expansion started in 2016, after sever-al years of fiscal consolidation (Figure 33). In 2016, public outlays are estimated to have risen to 21.5 percent of GDP, compared with 20.5 percent of GDP in 2015. This expansion was largely boosted by the rising public sec-tor wage bill, with the minimum civil servants’ wage targeted to reach at least CR 1 million (equivalent to about US$250) a month by 2018. Meanwhile, total capital investment expenditure is on a downward trend, as a result of the gradual decline in the devel-opment partner-funded component as a percentage of GDP.
This declining trend is mainly explained by the reduction in development partner-financed capital investment. An increase in public infrastructure investment is needed to promote output both in the short term, by boosting aggregate demand, and also in the longer term, by expanding the productive capacity of an economy with a higher infrastructure stock.
The National Strategic Development Plan 2014-18 (NSDP) targets capital investment expenditure of around 7.6 percent of GDP to achieve a GDP growth target of about 7 percent. However, actual investment expenditure shrank to 7.1 percent of GDP in 2016 (Table 1). In the context of a declining development partner-funded capital budget, which is not anticipated by the NSDP, scaling up government-financed capital spending to boost productive pro-growth and pro-poor investments, especially in physical infrastructure, is needed. However, enhancing the legal framework for Public Investment Management (PIM) and capacity building at core and line ministries would be needed first, as a prerequisite for improving investment efficiency. For more details on PIM, see the selected issue section on “Investing in Public Infrastructure and Services”.
c) Fiscal balance
While helping to propel growth, fiscal expansion has resulted in a widening of the overall fiscal deficit. However, sustained robust collection has helped to contain the deficit. In 2016, the overall fiscal deficit (including grants) is estimated to have widened to
31APRIL 2017 CAMBODIA ECONOMIC UPDATE
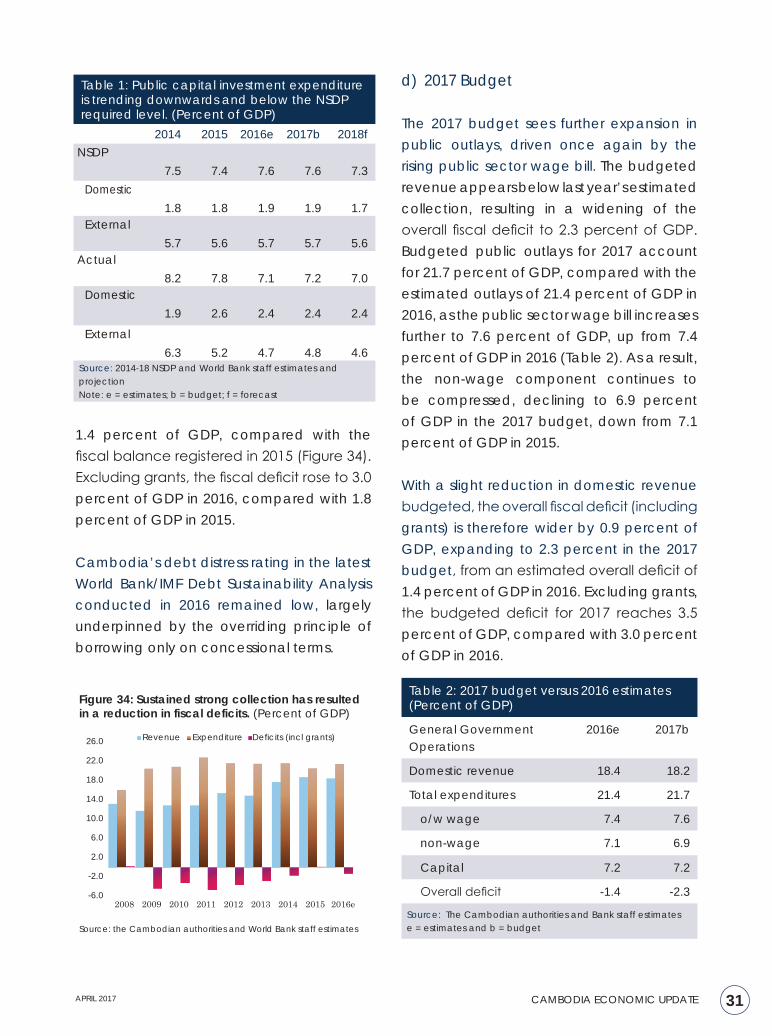
Table 1: Public capital investment expenditure is trending downwards and below the NSDP required level. (Percent of GDP)
2014 2015 2016e 2017b 2018fNSDP
7.5
7.4
7.6
7.6
7.3 Domestic
1.8
1.8
1.9
1.9
1.7 External
5.7
5.6
5.7
5.7
5.6 Actual
8.2
7.8
7.1
7.2
7.0 Domestic
1.9
2.6
2.4
2.4
2.4
External 6.3
5.2
4.7
4.8
4.6
Source: 2014-18 NSDP and World Bank staff estimates and projectionNote: e = estimates; b = budget; f = forecast
1.4 percent of GDP, compared with the fiscal balance registered in 2015 (Figure 34). Excluding grants, the fiscal deficit rose to 3.0 percent of GDP in 2016, compared with 1.8 percent of GDP in 2015.
Cambodia’s debt distress rating in the latest World Bank/IMF Debt Sustainability Analysis conducted in 2016 remained low, largely underpinned by the overriding principle of borrowing only on concessional terms.
d) 2017 Budget
The 2017 budget sees further expansion in public outlays, driven once again by the rising public sector wage bill. The budgeted revenue appears below last year’s estimated collection, resulting in a widening of the overall fiscal deficit to 2.3 percent of GDP. Budgeted public outlays for 2017 account for 21.7 percent of GDP, compared with the estimated outlays of 21.4 percent of GDP in 2016, as the public sector wage bill increases further to 7.6 percent of GDP, up from 7.4 percent of GDP in 2016 (Table 2). As a result, the non-wage component continues to be compressed, declining to 6.9 percent of GDP in the 2017 budget, down from 7.1 percent of GDP in 2015.
With a slight reduction in domestic revenue budgeted, the overall fiscal deficit (including grants) is therefore wider by 0.9 percent of GDP, expanding to 2.3 percent in the 2017 budget, from an estimated overall deficit of 1.4 percent of GDP in 2016. Excluding grants, the budgeted deficit for 2017 reaches 3.5 percent of GDP, compared with 3.0 percent of GDP in 2016.
-6.0
-2.0
2.0
6.0
10.0
14.0
18.0
22.0
26.0
2008 2009 2010 2011 2012 2013 2014 2015 2016e
Revenue Expenditure Deficits (incl grants)
Figure 34: Sustained strong collection has resulted in a reduction in fiscal deficits. (Percent of GDP)
Source: the Cambodian authorities and World Bank staff estimates
Table 2: 2017 budget versus 2016 estimates (Percent of GDP)
General Government Operations
2016e 2017b
Domestic revenue 18.4 18.2
Total expenditures 21.4 21.7
o/w wage 7.4 7.6
non-wage 7.1 6.9
Capital 7.2 7.2
Overall deficit -1.4 -2.3
Source: The Cambodian authorities and Bank staff estimatese = estimates and b = budget

32 CAMBODIA ECONOMIC UPDATE APRIL 2017
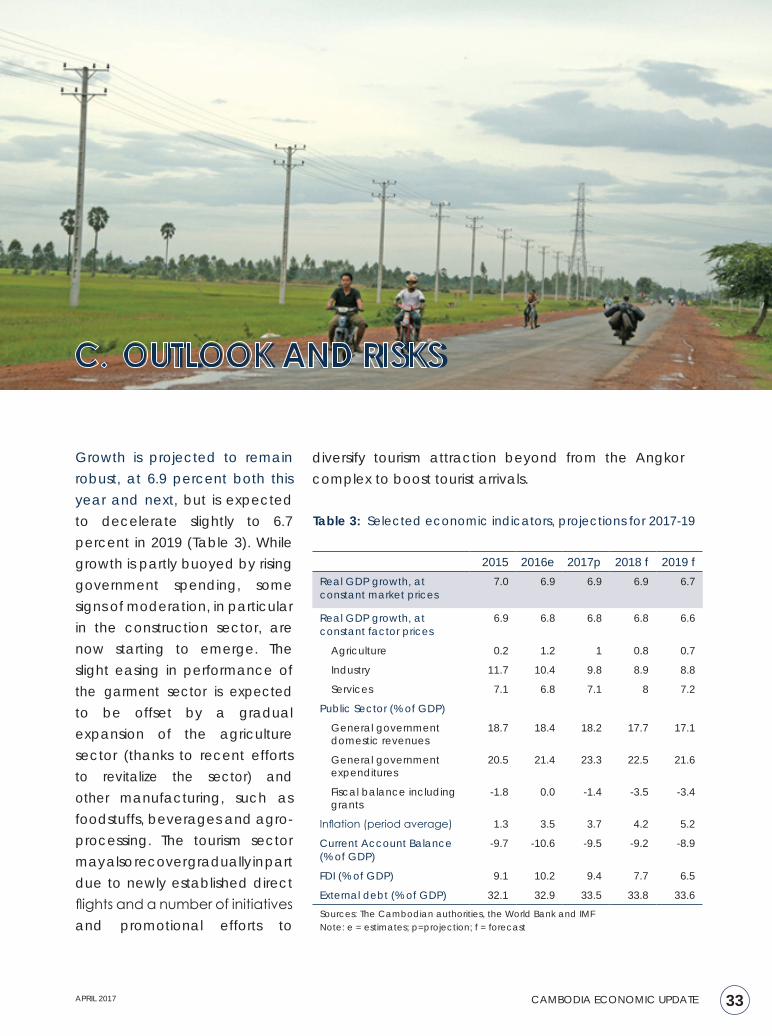
33APRIL 2017 CAMBODIA ECONOMIC UPDATE
C. OUTLOOK AND RISKS
Growth is projected to remain robust, at 6.9 percent both this year and next, but is expected to decelerate slightly to 6.7 percent in 2019 (Table 3). While growth is partly buoyed by rising government spending, some signs of moderation, in particular in the construction sector, are now starting to emerge. The slight easing in performance of the garment sector is expected to be offset by a gradual expansion of the agriculture sector (thanks to recent efforts to revitalize the sector) and other manufacturing, such as foodstuffs, beverages and agro-processing. The tourism sector may also recover gradually in part due to newly established direct flights and a number of initiatives and promotional efforts to
2015 2016e 2017p 2018 f 2019 fReal GDP growth, at constant market prices
7.0 6.9 6.9 6.9 6.7
Real GDP growth, at constant factor prices
6.9 6.8 6.8 6.8 6.6
Agriculture 0.2 1.2 1 0.8 0.7
Industry 11.7 10.4 9.8 8.9 8.8
Services 7.1 6.8 7.1 8 7.2
Public Sector (% of GDP)
General government domestic revenues
18.7 18.4 18.2 17.7 17.1
General government expenditures
20.5 21.4 23.3 22.5 21.6
Fiscal balance including grants
-1.8 0.0 -1.4 -3.5 -3.4
Inflation (period average) 1.3 3.5 3.7 4.2 5.2
Current Account Balance (% of GDP)
-9.7 -10.6 -9.5 -9.2 -8.9
FDI (% of GDP) 9.1 10.2 9.4 7.7 6.5
External debt (% of GDP) 32.1 32.9 33.5 33.8 33.6
Sources: The Cambodian authorities, the World Bank and IMF Note: e = estimates; p=projection; f = forecast
Table 3: Selected economic indicators, projections for 2017-19
diversify tourism attraction beyond from the Angkor complex to boost tourist arrivals.
34 CAMBODIA ECONOMIC UPDATE APRIL 2017
The outlook for growth remains favorable in the medium term, largely underpinned by export diversification. However, as discussed in the selected issue section below, boosting productive investments, especially in physical infrastructure, underpinning pro-growth and pro-poor commitments under the 2014-18 NSDP, while also enhancing spending efficiency, will be crucial, given that inadequate infrastructure has long been one of Cambodia’s key constraints and is seen as a major bottleneck. Improving labor productivity, as well as the performance of the public sector, will be fundamental for Cambodia to remain competitive, given rising competition from other low-wage garment exporting countries.
Cambodia’s external position is expected to be sustained, with rising FDI inflows, depressed oil prices, and slower imports in the short term. Adjustments in the construction sector after the post-global financial crisis boom will ease imports in the short term, as the completion phase of many modern high-rise residential and commercial construction projects is nearing. Gradual progress in promoting domestic production will also help to substitute imports in the medium term.
The expansionary fiscal policy will likely continue at least until 2018, as a rising public sector wage bill, election-related expenditures, and the need to boost public investment, are likely to keep public outlays on the rise. In contrast, with the adjustments of the construction and real estate sector resulting in softer demand for domestic consumption and imports, the robust
revenue gains that Cambodia experienced until recently may slowly diminish. This is likely to occur unless tax policy measures are introduced to expand the tax base and further strengthen revenue administration in the short and medium term.
The rural non-farm economy could be a significant contributor to poverty reduction and shared prosperity in Cambodia in the years to come. Cambodia is similar to Vietnam, where livelihood diversification in rural areas has already contributed significantly to poverty reduction and shared prosperity, and non-wage agriculture income constituted about 36 percent of incomes for the bottom 40 percent in 2015.
Downside risks to this outlook include the fallout from further rises in US interest rates, a slowdown in the economic recovery in Europe, and uncertainties over global trade. Domestically, potential election-related uncertainty may occur during and after the general election, which is scheduled to be held in mid-2018. US monetary policy tightening is expected to result in the US dollar appreciating vis-à-vis the Euro and other currencies, which would make Cambodia’s exports and tourism relatively more expensive for the rest of the world, and therefore less competitive. Continued interest rate hikes in the US may weaken prospects of further capital inflows to Cambodia. Any disruption in global trade flows will have substantial negative impacts on Cambodia, given its high level of dependence on exports, particularly garments and footwear, as one of main drivers of economic growth.
35APRIL 2017 CAMBODIA ECONOMIC UPDATE
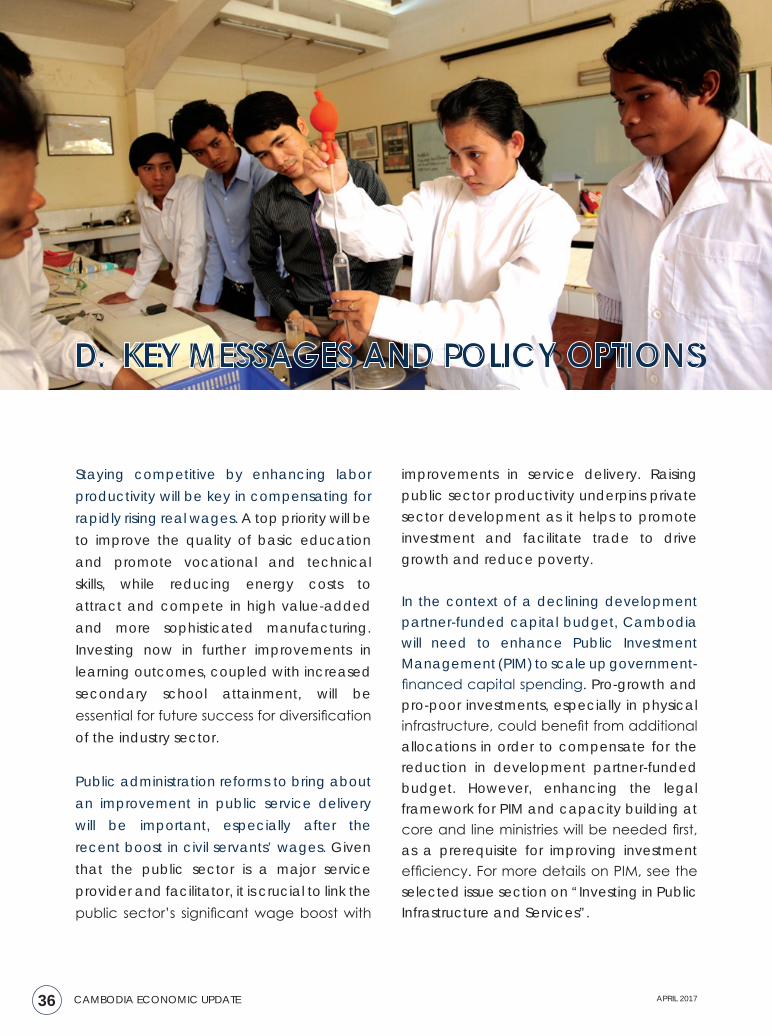
36 CAMBODIA ECONOMIC UPDATE APRIL 2017
D. KEY MESSAGES AND POLICY OPTIONS
Staying competitive by enhancing labor productivity will be key in compensating for rapidly rising real wages. A top priority will be to improve the quality of basic education and promote vocational and technical skills, while reducing energy costs to attract and compete in high value-added and more sophisticated manufacturing. Investing now in further improvements in learning outcomes, coupled with increased secondary school attainment, will be essential for future success for diversification of the industry sector. Public administration reforms to bring about an improvement in public service delivery will be important, especially after the recent boost in civil servants’ wages. Given that the public sector is a major service provider and facilitator, it is crucial to link the public sector’s significant wage boost with
improvements in service delivery. Raising public sector productivity underpins private sector development as it helps to promote investment and facilitate trade to drive growth and reduce poverty.
In the context of a declining development partner-funded capital budget, Cambodia will need to enhance Public Investment Management (PIM) to scale up government-financed capital spending. Pro-growth and pro-poor investments, especially in physical infrastructure, could benefit from additional allocations in order to compensate for the reduction in development partner-funded budget. However, enhancing the legal framework for PIM and capacity building at core and line ministries will be needed first, as a prerequisite for improving investment efficiency. For more details on PIM, see the selected issue section on “Investing in Public Infrastructure and Services”.
37APRIL 2017 CAMBODIA ECONOMIC UPDATE
A recent assessment calls for improving all stages of PIM—project pre-appraisal, appraisal, project prioritization, and budgeting supported by upstream decision-making. It is important to establish standardized guidelines and effective cost controls in downstream project implementation, while upgrading the capacity of ministries and agencies to prepare and assess effective and efficient investment projects connected with their strategic priorities in the Budget Strategic Plan (BSP) and Medium-Term Expenditure Framework (MTEF).
Further attention to improving consumers’ financial literacy, in particular for the poorly educated portion of the population, should be a priority. In addition, to avoid unsustainable over-indebtedness, limitations on consumer lending relative to portfolio size may be warranted, in order to rein in possible overheating in the consumer credit market. It is likely that the newly introduced lending rate cap helps to reduce borrowing costs, beneficial for productive purposes, in particular for poor farmers and small businesses. However, it may also curtail access to finance in under-served areas.
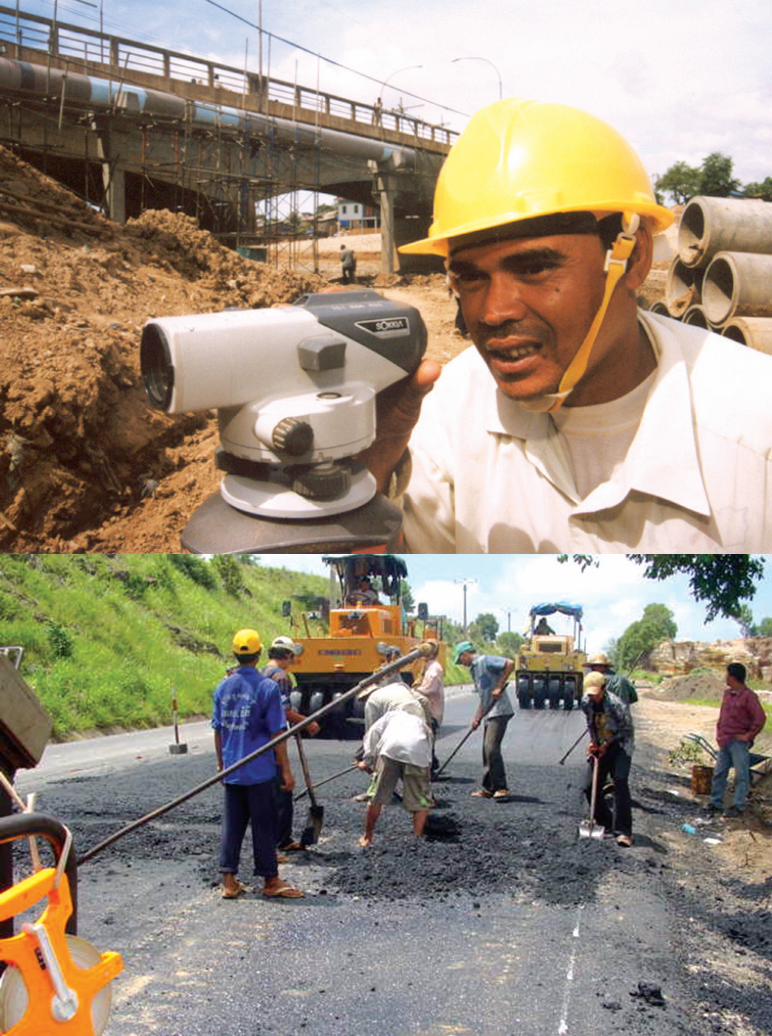
38 CAMBODIA ECONOMIC UPDATE APRIL 2017
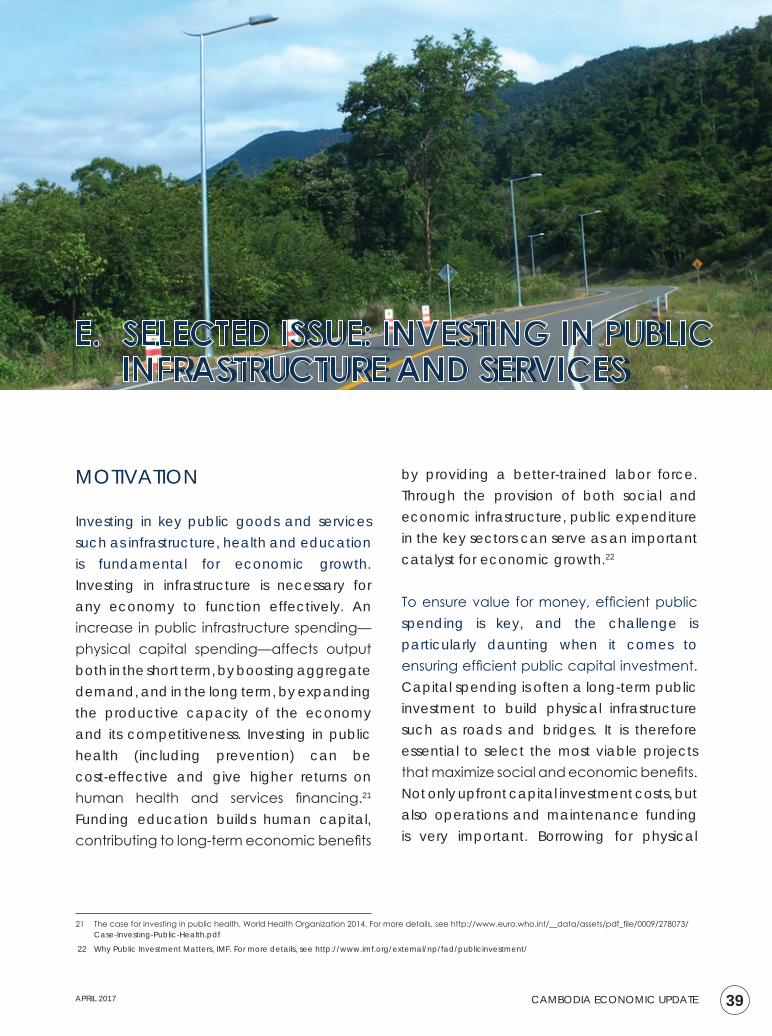
39APRIL 2017 CAMBODIA ECONOMIC UPDATE
E. SELECTED ISSUE: INVESTING IN PUBLIC INFRASTRUCTURE AND SERVICES
MOTIVATION
Investing in key public goods and services such as infrastructure, health and education is fundamental for economic growth. Investing in infrastructure is necessary for any economy to function effectively. An increase in public infrastructure spending—physical capital spending—affects output both in the short term, by boosting aggregate demand, and in the long term, by expanding the productive capacity of the economy and its competitiveness. Investing in public health (including prevention) can be cost-effective and give higher returns on human health and services financing.21
Funding education builds human capital, contributing to long-term economic benefits
by providing a better-trained labor force. Through the provision of both social and economic infrastructure, public expenditure in the key sectors can serve as an important catalyst for economic growth.22
To ensure value for money, efficient public spending is key, and the challenge is particularly daunting when it comes to ensuring efficient public capital investment. Capital spending is often a long-term public investment to build physical infrastructure such as roads and bridges. It is therefore essential to select the most viable projects that maximize social and economic benefits. Not only upfront capital investment costs, but also operations and maintenance funding is very important. Borrowing for physical
21 The case for investing in public health, World Health Organization 2014. For more details, see http://www.euro.who.int/__data/assets/pdf_file/0009/278073/ Case-Investing-Public-Health.pdf
22 Why Public Investment Matters, IMF. For more details, see http://www.imf.org/external/np/fad/publicinvestment/
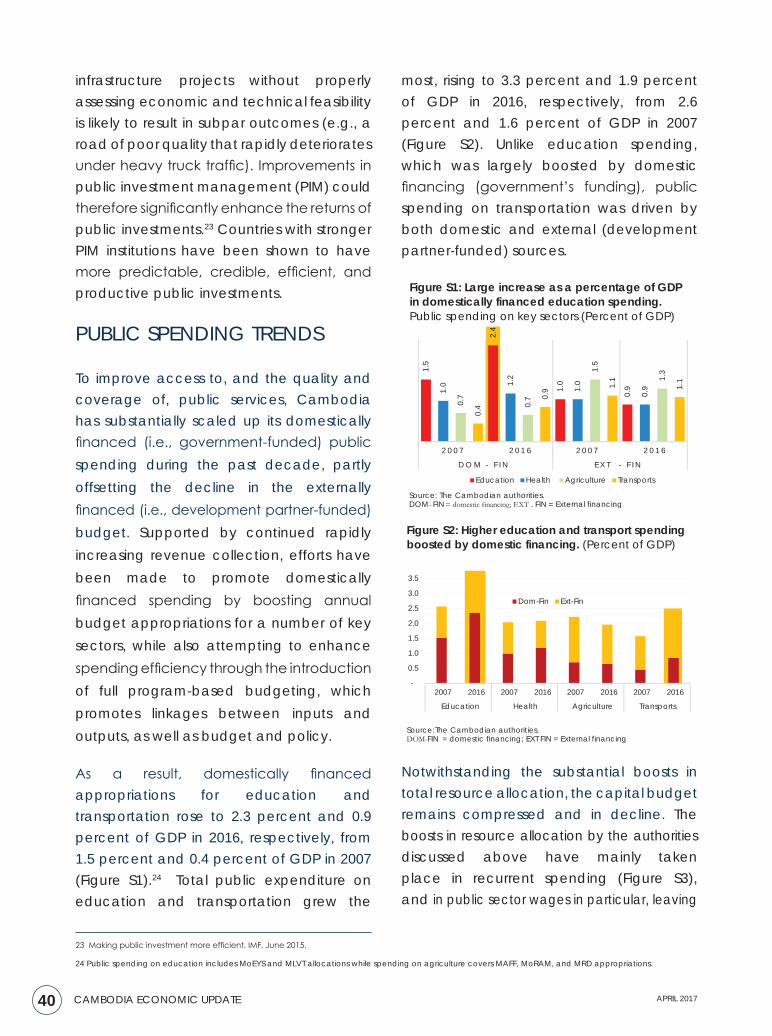
40 CAMBODIA ECONOMIC UPDATE APRIL 2017
infrastructure projects without properly assessing economic and technical feasibility is likely to result in subpar outcomes (e.g., a road of poor quality that rapidly deteriorates under heavy truck traffic). Improvements in public investment management (PIM) could therefore significantly enhance the returns of public investments.23 Countries with stronger PIM institutions have been shown to have more predictable, credible, efficient, and productive public investments.
PUBLIC SPENDING TRENDS
To improve access to, and the quality and coverage of, public services, Cambodia has substantially scaled up its domestically financed (i.e., government-funded) public spending during the past decade, partly offsetting the decline in the externally financed (i.e., development partner-funded) budget. Supported by continued rapidly increasing revenue collection, efforts have been made to promote domestically financed spending by boosting annual budget appropriations for a number of key sectors, while also attempting to enhance spending efficiency through the introduction of full program-based budgeting, which promotes linkages between inputs and outputs, as well as budget and policy.
1.5
2.4
1.0
0.91.0 1.
2
1.0
0.9
0.7
0.7
1.5
1.3
0.4
0.9 1.
1
1.1
2 0 0 7 2 0 1 6 2 0 0 7 2 0 1 6
D O M - F I N E X T - F I N
Education Health Agriculture Transports
Source: The Cambodian authorities.DOM- FIN = domestic financing; EXT - FIN = External financing
Figure S1: Large increase as a percentage of GDP in domestically financed education spending. Public spending on key sectors (Percent of GDP)
-
0.5
1.0
1.5
2.0
2.5
3.0
3.5
2007 2016 2007 2016 2007 2016 2007 2016
Education Health Agriculture Transports
Dom-Fin Ext-Fin
Source:The Cambodian authorities.DOM-FIN = domestic financing; EXT - FIN = External financing
Figure S2: Higher education and transport spending boosted by domestic financing. (Percent of GDP)
As a result, domestically financed appropriations for education and transportation rose to 2.3 percent and 0.9 percent of GDP in 2016, respectively, from 1.5 percent and 0.4 percent of GDP in 2007 (Figure S1).24 Total public expenditure on education and transportation grew the
most, rising to 3.3 percent and 1.9 percent of GDP in 2016, respectively, from 2.6 percent and 1.6 percent of GDP in 2007 (Figure S2). Unlike education spending, which was largely boosted by domestic financing (government’s funding), public spending on transportation was driven by both domestic and external (development partner-funded) sources.
Notwithstanding the substantial boosts in total resource allocation, the capital budget remains compressed and in decline. The boosts in resource allocation by the authorities discussed above have mainly taken place in recurrent spending (Figure S3), and in public sector wages in particular, leaving
23 Making public investment more efficient, IMF, June 2015.
24 Public spending on education includes MoEYS and MLVT allocations while spending on agriculture covers MAFF, MoRAM, and MRD appropriations.
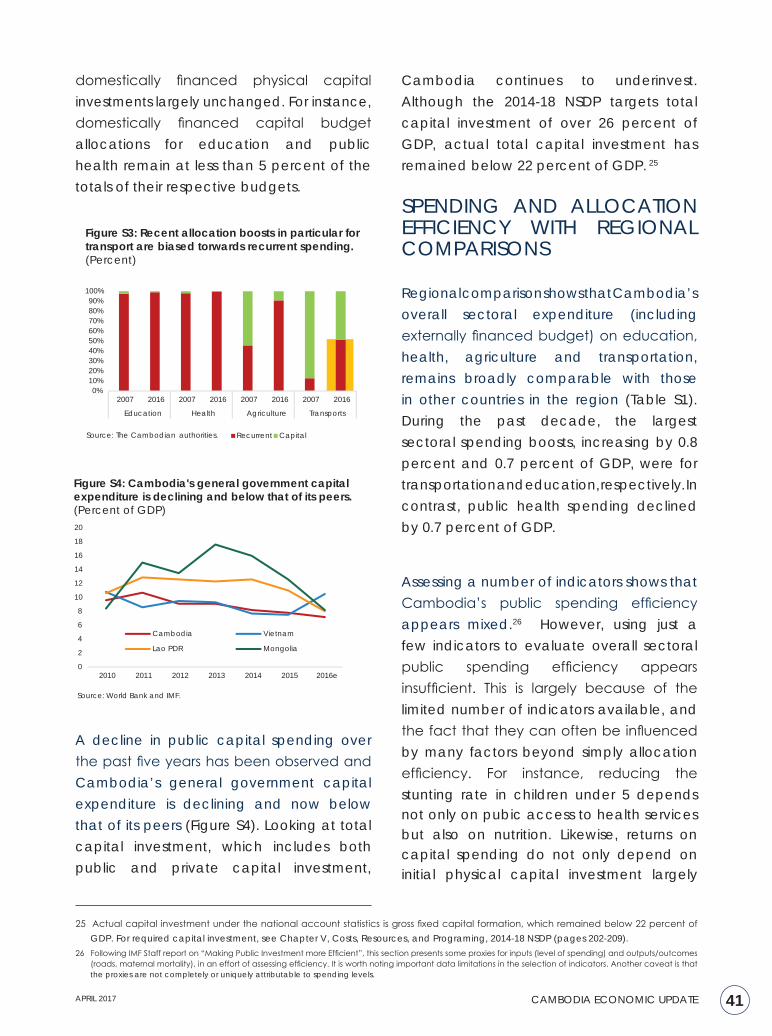
41APRIL 2017 CAMBODIA ECONOMIC UPDATE
0%10%20%30%40%50%60%70%80%90%
100%
2007 2016 2007 2016 2007 2016 2007 2016
Education Health Agriculture Transports
Recurrent CapitalSource: The Cambodian authorities.
Figure S3: Recent allocation boosts in particular for transport are biased torwards recurrent spending.(Percent)
0
2
4
6
8
10
12
14
16
18
20
2010 2011 2012 2013 2014 2015 2016e
Cambodia Vietnam
Lao PDR Mongolia
Source: World Bank and IMF.
Figure S4: Cambodia's general government capital expenditure is declining and below that of its peers. (Percent of GDP)
A decline in public capital spending over the past five years has been observed and Cambodia’s general government capital expenditure is declining and now below that of its peers (Figure S4). Looking at total capital investment, which includes both public and private capital investment,
25 Actual capital investment under the national account statistics is gross fixed capital formation, which remained below 22 percent of GDP. For required capital investment, see Chapter V, Costs, Resources, and Programing, 2014-18 NSDP (pages 202-209).
26 Following IMF Staff report on “Making Public Investment more Efficient”, this section presents some proxies for inputs (level of spending) and outputs/outcomes (roads, maternal mortality), in an effort of assessing efficiency. It is worth noting important data limitations in the selection of indicators. Another caveat is that the proxies are not completely or uniquely attributable to spending levels.
domestically financed physical capital investments largely unchanged. For instance, domestically financed capital budget allocations for education and public health remain at less than 5 percent of the totals of their respective budgets.
Cambodia continues to underinvest. Although the 2014-18 NSDP targets total capital investment of over 26 percent of GDP, actual total capital investment has remained below 22 percent of GDP. 25
SPENDING AND ALLOCATION EFFICIENCY WITH REGIONAL COMPARISONS
Regional comparison shows that Cambodia’s overall sectoral expenditure (including externally financed budget) on education, health, agriculture and transportation, remains broadly comparable with those in other countries in the region (Table S1). During the past decade, the largest sectoral spending boosts, increasing by 0.8 percent and 0.7 percent of GDP, were for transportation and education, respectively. In contrast, public health spending declined by 0.7 percent of GDP.
Assessing a number of indicators shows that Cambodia’s public spending efficiency appears mixed.26 However, using just a few indicators to evaluate overall sectoral public spending efficiency appears insufficient. This is largely because of the limited number of indicators available, and the fact that they can often be influenced by many factors beyond simply allocation efficiency. For instance, reducing the stunting rate in children under 5 depends not only on pubic access to health services but also on nutrition. Likewise, returns on capital spending do not only depend on initial physical capital investment largely
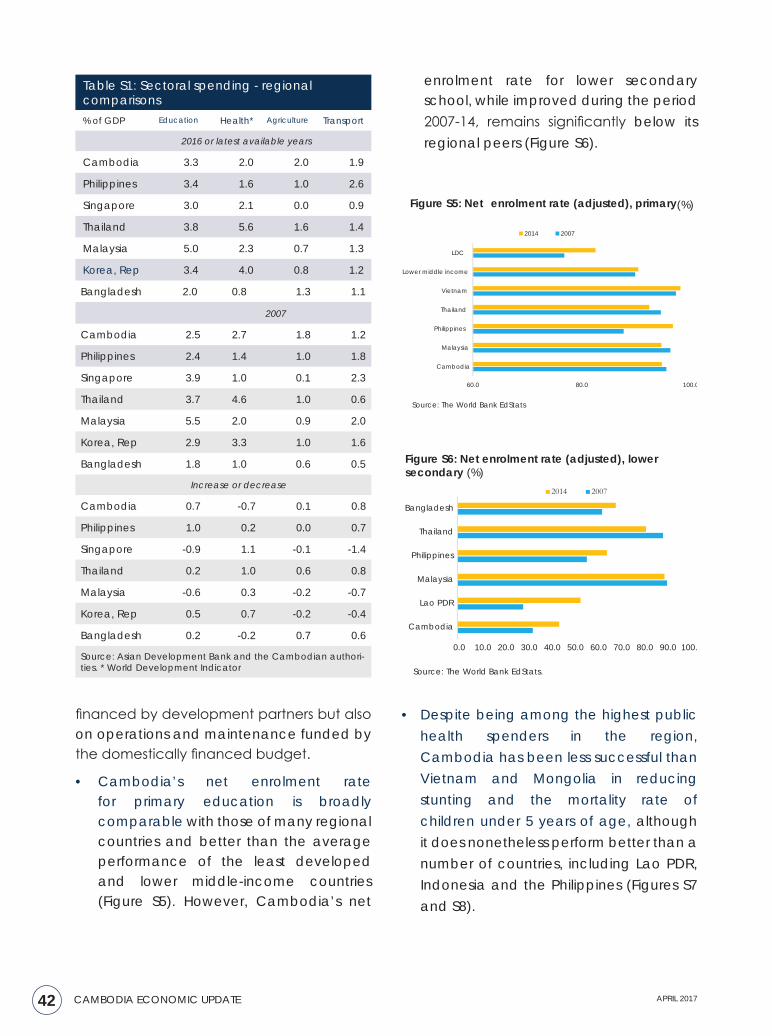
42 CAMBODIA ECONOMIC UPDATE APRIL 2017
Table S1: Sectoral spending - regional comparisons % of GDP Education Health* Agriculture Transport
2016 or latest available years
Cambodia 3.3 2.0 2.0 1.9
Philippines 3.4 1.6 1.0 2.6
Singapore 3.0 2.1 0.0 0.9
Thailand 3.8 5.6 1.6 1.4
Malaysia 5.0 2.3 0.7 1.3
Korea, Rep 3.4 4.0 0.8 1.2
Bangladesh 2.0 0.8 1.3 1.1
2007
Cambodia 2.5 2.7 1.8 1.2
Philippines 2.4 1.4 1.0 1.8
Singapore 3.9 1.0 0.1 2.3
Thailand 3.7 4.6 1.0 0.6
Malaysia 5.5 2.0 0.9 2.0
Korea, Rep 2.9 3.3 1.0 1.6
Bangladesh 1.8 1.0 0.6 0.5
Increase or decrease
Cambodia 0.7 -0.7 0.1 0.8
Philippines 1.0 0.2 0.0 0.7
Singapore -0.9 1.1 -0.1 -1.4
Thailand 0.2 1.0 0.6 0.8
Malaysia -0.6 0.3 -0.2 -0.7
Korea, Rep 0.5 0.7 -0.2 -0.4
Bangladesh 0.2 -0.2 0.7 0.6
Source: Asian Development Bank and the Cambodian authori-ties. * World Development Indicator
60.0 80.0 100.0
Cambodia
Malaysia
Philippines
Thailand
Vietnam
Lower middle income
LDC
2014 2007
Source: The World Bank EdStats
Figure S5: Net enrolment rate (adjusted), primary (%)
0.0 10.0 20.0 30.0 40.0 50.0 60.0 70.0 80.0 90.0 100.0
Cambodia
Lao PDR
Malaysia
Philippines
Thailand
Bangladesh
2014 2007
Source: The World Bank EdStats.
Figure S6: Net enrolment rate (adjusted), lower secondary (%)
financed by development partners but also on operations and maintenance funded by the domestically financed budget.
• Cambodia’s net enrolment rate for primary education is broadly comparable with those of many regional countries and better than the average performance of the least developed and lower middle-income countries (Figure S5). However, Cambodia’s net
• Despite being among the highest public health spenders in the region, Cambodia has been less successful than Vietnam and Mongolia in reducing stunting and the mortality rate of children under 5 years of age, although it does nonetheless perform better than a number of countries, including Lao PDR, Indonesia and the Philippines (Figures S7 and S8).
enrolment rate for lower secondary school, while improved during the period 2007-14, remains significantly below its regional peers (Figure S6).
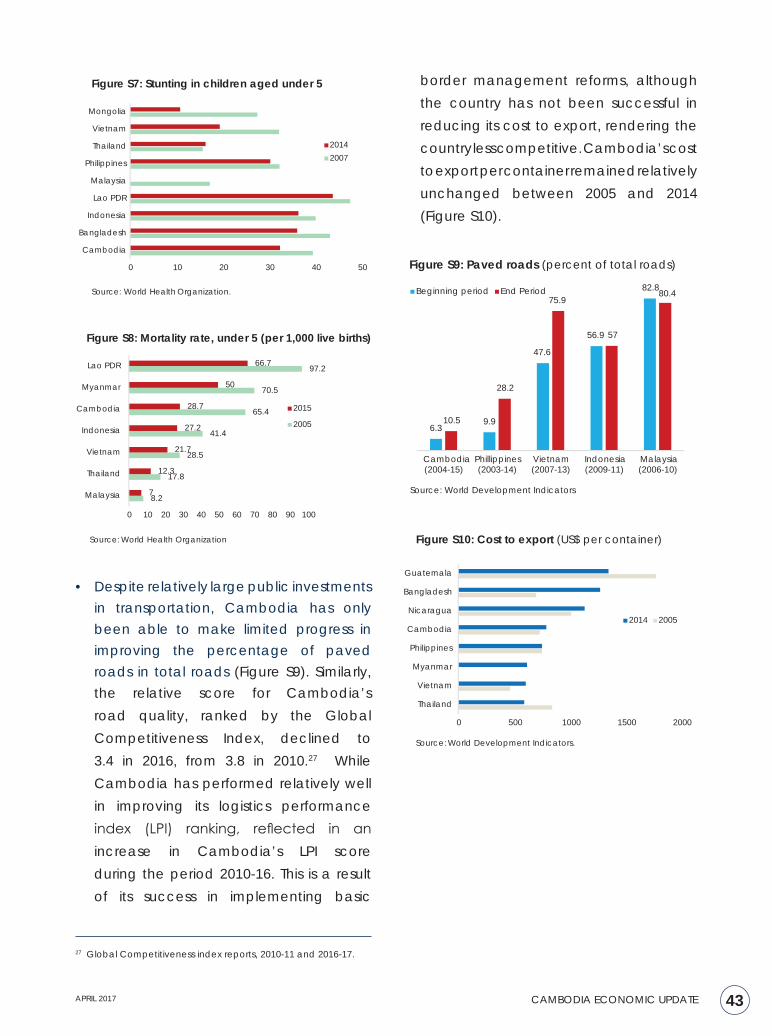
43APRIL 2017 CAMBODIA ECONOMIC UPDATE
• Despite relatively large public investments in transportation, Cambodia has only been able to make limited progress in improving the percentage of paved roads in total roads (Figure S9). Similarly, the relative score for Cambodia’s road quality, ranked by the Global Competitiveness Index, declined to 3.4 in 2016, from 3.8 in 2010.27 While Cambodia has performed relatively well in improving its logistics performance index (LPI) ranking, reflected in an increase in Cambodia’s LPI score during the period 2010-16. This is a result of its success in implementing basic
27 Global Competitiveness index reports, 2010-11 and 2016-17.
6.39.9
47.6
56.9
82.8
10.5
28.2
75.9
57
80.4
Cambodia(2004-15)
Phillippines(2003-14)
Vietnam(2007-13)
Indonesia(2009-11)
Malaysia(2006-10)
Beginning period End Period
Figure S9: Paved roads (percent of total roads)
Source: World Development Indicators
0 10 20 30 40 50
Cambodia
Bangladesh
Indonesia
Lao PDR
Malaysia
Philippines
Thailand
Vietnam
Mongolia
20142007
Source: World Health Organization.
Figure S7: Stunting in children aged under 5
0 500 1000 1500 2000
Thailand
Vietnam
Myanmar
Philippines
Cambodia
Nicaragua
Bangladesh
Guatemala
2014 2005
Source: World Development Indicators.
Figure S10: Cost to export (US$ per container)
8.2
17.8
28.5
41.4
65.4
70.5
97.2
7
12.3
21.7
27.2
28.7
50
66.7
0 10 20 30 40 50 60 70 80 90 100
Malaysia
Thailand
Vietnam
Indonesia
Cambodia
Myanmar
Lao PDR
2015
2005
Source: World Health Organization
Figure S8: Mortality rate, under 5 (per 1,000 live births)
border management reforms, although the country has not been successful in reducing its cost to export, rendering the country less competitive. Cambodia’s cost to export per container remained relatively unchanged between 2005 and 2014 (Figure S10).
44 CAMBODIA ECONOMIC UPDATE APRIL 2017
PUBLIC INVESTMENT MANAGEMENT (PIM)a) Roles of capital investment
While there is evidence that capital spending boosts growth more than recurrent spending, the fiscal multiplier effect of capital spending may not be as large as expected if there are leakages. IIzetzki et al. (2011) find that, in developing countries, the multiplier effect of government investment is significantly higher than that of government consumption over a two-year time horizon. 28 This suggests that capital expenditure is a crucial factor in driving growth in developing countries. However, the fiscal multiplier effect of capital spending may not be as large as expected if there are leakages. Waste due to inefficiencies in some developing economies is estimated to be as high as 50 or 60 percent of the funds invested—levels that would severely hamper any fiscal stimulus efforts (Riera-Crichton et al., 2014). The positive stimulus from fiscal policy is far larger in developed industrial countries than in developing economies, and this can be explained by the fact that developed economies are often more efficient in allocating and executing spending.
For Cambodia, declining investment would have important implications for its competitiveness, as inadequate infrastructure has long been one of Cambodia’s key constraints and is seen as a major bottleneck.29 The recent boost in public spending by the government appears biased towards raising public sector wages, while domestically financed capital expenditure has remained modest,
28 IMF working paper (2011), How Big (Small?) Are Fiscal Multipliers? https://www.imf.org/external/pubs/ft/wp/2011/wp1152.pdf29 Key constraints Cambodia faces include high energy costs, infrastructure bottlenecks, and regulatory impediments to doing business
(Doing Business 2016, World Bank).30 World Bank Cambodia PIM Assessment, 2017.
at around 2.0 to 2.5 percent of GDP in the period 2009-16. Therefore, going forward, Cambodia would need to prepare to scale up government-financed investment and it is therefore crucial for Cambodia to enhance the efficiency and effectiveness of public investment management (PIM). In 2011, an index of public investment efficiency ranked Cambodia among the bottom 40 percent of developing economies, mainly due to weaknesses in investment project selection and appraisal (Dabla-Norris et al., 2011).
b) Cambodia’s current PIM practices
A recent assessment found that the existing legal and regulatory framework for PIM is only very loosely governed by a diverse set of budget and investment laws, and other government regulations.30 While there is some relevant legislation, such as the Annual Budget Law, the Public Finance System Law, and the Procurement Law, PIM-specific regulation appears to be inadequate. The Budget Law does not provide a dedicated chapter or any articles on regulating capital expenditure and PIM, while the Public Finance System Law makes only one reference to capital budgeting and PIM processes. As a result, the division of roles and responsibilities among key stakeholders is loose or, simply put, legally non-binding.
Several challenges are apparent in the upstream stages of project preparation, pre-screening, appraisal, and budgeting. For domestically financed investment projects in particular, there are no standardized PIM. The non-standardization and absence of a centrally developed, uniform set of guidelines, manuals, and templates for the preparation of project proposals and
45APRIL 2017 CAMBODIA ECONOMIC UPDATE
appraisals, and the monitoring of execution, have resulted in vastly different practices across line ministries. In addition, the function of independent review (of project documents) has not been formalized; an effective gatekeeping role for the allocation and use of the capital budget is therefore non-existent.
The quality of capital budget execution and monitoring in the downstream stages has been found to be inadequate, partly due to the lack of any centrally developed standardized operation guidelines. This problem can be observed in the stages of project implementation, adjustment, facility operation, and ex-post review. While development partner-funded projects follow Standard Operations Procedures, there is a lack of standardized operation guidelines for government-funded investment, which results in a wide variation of practices among spending agencies. In such an environment, there is no effective instrument or tool at hand to ensure effective monitoring that could help ascertain whether financing of public investment is being used efficiently and appropriately. As such, the new legal procurement framework would need to be complemented with secondary PIM-specific regulations to ensure that it can achieve value for money in capital projects.
c) Steps towards improving Cambodia’s PIM
In order to address these challenges going forward, broad and comprehensive recommendations for strategic reforms are suggested. These include institutional and procedural developments supplemented with the prioritized reform actions over the short to medium term in all stages of PIM.
a. Gatekeeping role. Introduction of a gatekeeping role with the function
of independent review in upstream decision-making for project pre-appraisal, appraisal, project prioritization, and budgeting.
b. Standardized guidelines. Establishing standardized guidelines and effective cost controls in downstream project implementation. Instead of developing completely new guidelines and procedures governing PIM, a more desirable strategy may be to review and possibly adopt key principles of the existing Standard Operating Procedures (SOP) whenever feasible. Gradually applying unified governing guidelines and procedures for both domestically financed and externally financed public investment guidelines and procedures will also underpin the authorities’ efforts to achieve budget integration and policy-budget linkages.
c. Capacity upgrade. Upgrading the capacity of ministries and agencies to prepare and assess effectively and efficiently investment projects, strictly connected with their strategic priorities in the Budget Strategic Plan (BSP) and Medium-Term Expenditure Framework (MTEF) to achieve the goal of moving towards the establishment of effective linkages across policy, planning and budgeting. In this regard, the further strengthening of budget comprehensiveness will also lend itself to supporting improved public investment efficiency by fully integrating domestically and externally financed budgets.
All three main recommendations highlighted above would serve the central objective of PIM reform in Cambodia by establishing a centralized independent review or gate-keeping function at the Ministry of Economy and Finance.
46 CAMBODIA ECONOMIC UPDATE APRIL 2017
Given that Cambodia’s public spending on key sectors is now comparable with its peers, improving public spending efficiency is the next important step. In addition, the recent efforts to promote domestically financed spending in key sectors such as education, health, transportation and agriculture have been biased towards increasing recurrent spending, mainly on public sector wages. It is therefore necessary to ensure sufficient allocations for operations and maintain-ance.
Sustained investment in physical capital, so far mainly financed by development part-ners, would therefore underpin the coun-try’s growth prospects, as it is fundamental for maintaining Cambodia’s competiveness going forward. Inadequate infrastructure has long been one of Cambodia’s key con-straints and is seen as a major bottleneck. Given its small, open economy, Cambo-dia’s growth prospects hinge upon its com-petitiveness, which has been constrained by rising wages and input costs, an ap-preciation of the US dollar, and institution-
al capacity and governance challenges. Strategic reforms at all stages of PIM are needed to strengthen both the upstream decision-making for project pre-appraisal, appraisal, project prioritization, and budgeting, and also downstream to establish standard-ized project implementation and monitoring by possibly adopting key principles of exist-ing Standard Operating Procedures (SOP) whenever feasible.
Towards this end, it will be necessary to continue building capacity to be able to prepare and assess more effective and effi-cient investment projects, strictly connected to the BSP and MTEF. Such projects should fully integrate externally and domestically financed budgets, in order to achieve the goal of moving towards the establishment of effective linkages across policy, planning and budgeting. In the absence of the Me-dium-Term Expenditure Framwork (MTEF), adequate resources are not earmarked for infrastructure operations and maintenance, which likely leads to higher capital expendi-ture in the long term and also results in poor public investment efficiency. 31
CONCLUSIONS
31 Guidelines for Public Expenditure Management, Barry H. Potter and Jack Diamond, IMF.
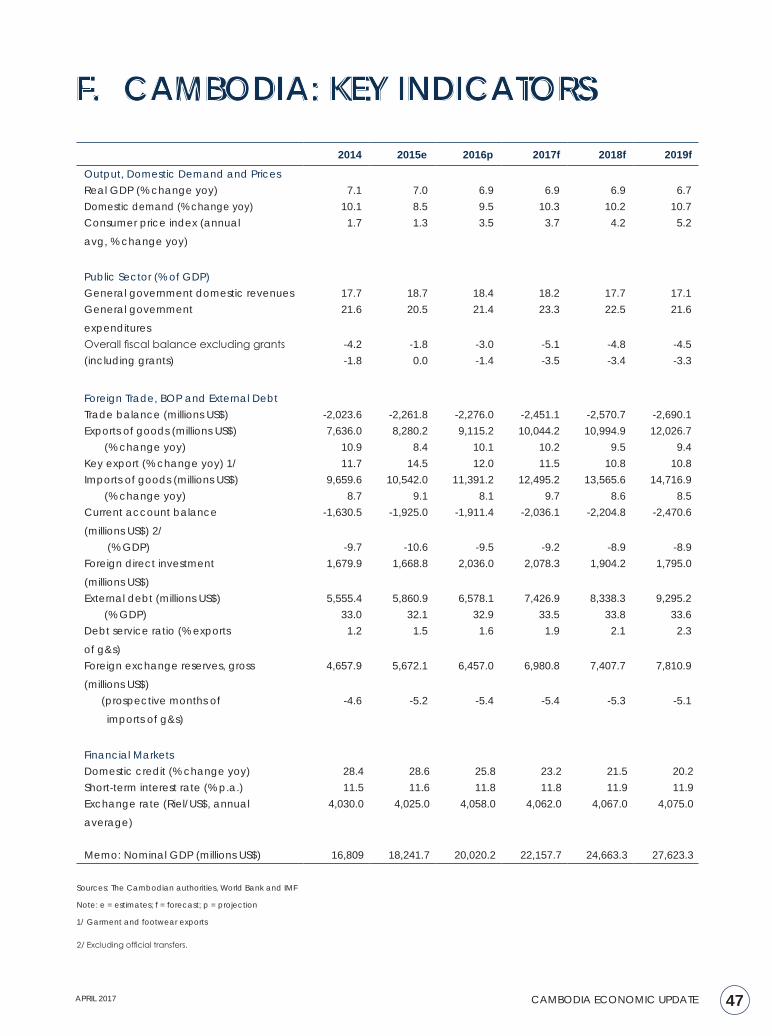
47APRIL 2017 CAMBODIA ECONOMIC UPDATE
2014 2015e 2016p 2017f 2018f 2019f
Output, Domestic Demand and PricesReal GDP (% change yoy) 7.1 7.0 6.9 6.9 6.9 6.7Domestic demand (% change yoy) 10.1 8.5 9.5 10.3 10.2 10.7Consumer price index (annual
avg, % change yoy)
1.7 1.3 3.5 3.7 4.2 5.2
Public Sector (% of GDP)General government domestic revenues 17.7 18.7 18.4 18.2 17.7 17.1General government
expenditures
21.6 20.5 21.4 23.3 22.5 21.6
Overall fiscal balance excluding grants -4.2 -1.8 -3.0 -5.1 -4.8 -4.5(including grants) -1.8 0.0 -1.4 -3.5 -3.4 -3.3
Foreign Trade, BOP and External DebtTrade balance (millions US$) -2,023.6 -2,261.8 -2,276.0 -2,451.1 -2,570.7 -2,690.1Exports of goods (millions US$) 7,636.0 8,280.2 9,115.2 10,044.2 10,994.9 12,026.7
(% change yoy) 10.9 8.4 10.1 10.2 9.5 9.4Key export (% change yoy) 1/ 11.7 14.5 12.0 11.5 10.8 10.8Imports of goods (millions US$) 9,659.6 10,542.0 11,391.2 12,495.2 13,565.6 14,716.9
(% change yoy) 8.7 9.1 8.1 9.7 8.6 8.5Current account balance
(millions US$) 2/
-1,630.5 -1,925.0 -1,911.4 -2,036.1 -2,204.8 -2,470.6
(% GDP) -9.7 -10.6 -9.5 -9.2 -8.9 -8.9Foreign direct investment
(millions US$)
1,679.9 1,668.8 2,036.0 2,078.3 1,904.2 1,795.0
External debt (millions US$) 5,555.4 5,860.9 6,578.1 7,426.9 8,338.3 9,295.2 (% GDP) 33.0 32.1 32.9 33.5 33.8 33.6
Debt service ratio (% exports
of g&s)
1.2 1.5 1.6 1.9 2.1 2.3
Foreign exchange reserves, gross
(millions US$)
4,657.9 5,672.1 6,457.0 6,980.8 7,407.7 7,810.9
(prospective months of
imports of g&s)
-4.6 -5.2 -5.4 -5.4 -5.3 -5.1
Financial MarketsDomestic credit (% change yoy) 28.4 28.6 25.8 23.2 21.5 20.2Short-term interest rate (% p.a.) 11.5 11.6 11.8 11.8 11.9 11.9Exchange rate (Riel/US$, annual
average)
4,030.0 4,025.0 4,058.0 4,062.0 4,067.0 4,075.0
Memo: Nominal GDP (millions US$) 16,809 18,241.7 20,020.2 22,157.7 24,663.3 27,623.3
Sources: The Cambodian authorities, World Bank and IMF
Note: e = estimates; f = forecast; p = projection
1/ Garment and footwear exports
2/ Excluding official transfers.
F. CAMBODIA: KEY INDICATORS
The World BankCambodia Country OfficeExchange Square BuildingFloor 10th IBRD and 11th IFC Streets 51-61 and Streets 102 -106Sangkat Wat Phnom, Khan Daun PenhPhnom Penh, CambodiaWebsite: www.worldbank.org/cambodia