
Public Debt Strategy in Mexico - OECD.org Debt Strategy in Mexico 3rd OECD-China Forum on Public...
23
Public Debt Strategy in Mexico 3rd OECD-China Forum on Public Debt Management and Government Securities Markets September 2006, Beijing, China www.hacienda.gob.mx/ucp
Transcript of Public Debt Strategy in Mexico - OECD.org Debt Strategy in Mexico 3rd OECD-China Forum on Public...

Public Debt Strategy in Mexico
3rd OECD-China Forum on Public
Debt Management and Government
Securities Markets
September 2006, Beijing, China
www.hacienda.gob.mx/ucp
2
Index
1. Debt Management Strategy Overview
2. Recent Liability Management Operations
3. Policy Guidelines and Concluding Remarks

3
Public debt management has been a keyelement of economic policy in recent years
The annual debt management strategy has followed three main guidelines:
Finance the public deficit internally.Focus domestic financing on long-term fixed-rate securitiesImprove external financing conditions through a series of coordinated operations.
Main Achievements
1. A balanced composition of domestic and external debt
2. Improved external debt structure
3. Development of local debt markets

4
1. A balanced debt composition
55.3
59.6
59.9
59.5
60.9
67.0
67.4
44.7
40.4
40.1
40.5
39.1
33.0
32.5
2000
2001
2002
2003
2004
2005
Jul-
06
Federal Government’s Net External Debt
(% of GDP)
9.0
8.08.3
8.7
8.1
6.56.9
5.0
5.5
6.0
6.5
7.0
7.5
8.0
8.5
9.0
9.5
2000
2001
2002
2003
2004
2005
Jul-
06
Source: SHCP Source: SHCP
Federal Government’s Net External Debt Composition
(%)
5
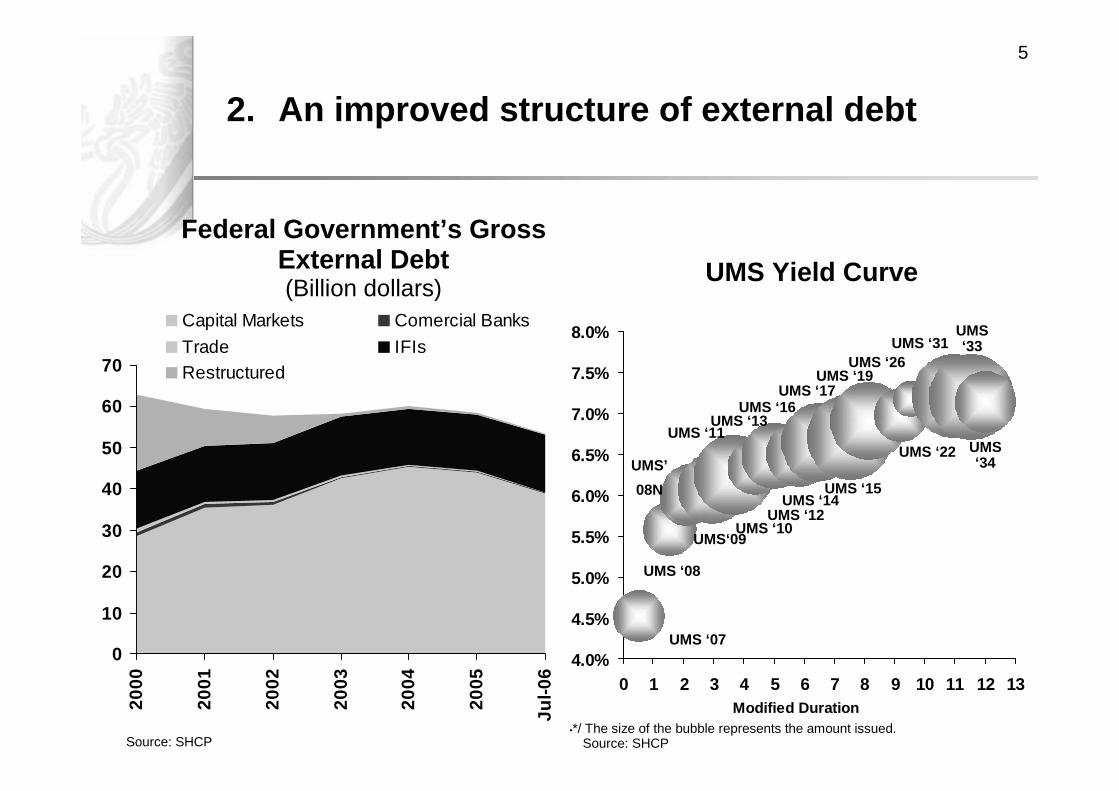
2. An improved structure of external debt
0
10
20
30
40
50
60
70
2000
2001
2002
2003
2004
2005
Jul-0
6
Capital Markets Comercial Banks
Trade IFIsRestructured
UMS Yield Curve
4.0%
4.5%
5.0%
5.5%
6.0%
6.5%
7.0%
7.5%
8.0%
0 1 2 3 4 5 6 7 8 9 10 11 12 13Modified Duration
UMS ‘14
UMS ‘26
UMS ‘16UMS ‘17
UMS ‘10UMS‘09
UMS ‘08
UMS ‘07
UMS ‘19
UMS ‘31
UMS ‘12
UMS ‘22
UMS ‘13
UMS ‘15
UMS ‘33
UMS’
08N
UMS ‘34
•*/ The size of the bubble represents the amount issued.Source: SHCP Source: SHCP
UMS ‘11
Federal Government’s Gross External Debt(Billion dollars)

6
1. Legal framework2. Clearing and settlement3. Price vendors4. Market-makers program
1. Communication strategy2. Benchmark issuances3. Market microstructure
improvements
1. Institutional Investors2. Increased domestic
financial savings3. Promotion of local market
among foreign investors
3.- Development of local markets
Infrastructure
Demand Policies
Supply Policies

7
6
8
10
12
14
16
18
20
0 5 10 15 20
3.9
3.3
2.9
2.52.2
2.0
1.5
2.52.3
1.7
1.31.1
0.90.7
0
1
2
3
4
2000
2001
2002
2003
2004
2005
Jun
-06
Average Maturity
Duration
Yield Curve Evolution(%)
3.- Development of local markets
Average Maturity and Duration(years)
Nov, 1999
Jan, 2000May, 2000
Jul, 2001
Jul, 2006
Maturity
Source: SHCP Source: SHCP
%

8
Ratings of Long-Term External Debt
Sensitivity of the Financing Cost of the Federal Government Debt
50 Cent Increase in the MXP/USD Exchange Rate
(% of GDP)
100bp Increase of Interest Rates
(% of GDP)
0.062
0.177
2000 2006
0.063
0.025
2000 2006
Jan-
97
Aug
-99
Mar
-00
Mar
-00
Feb
-02
Feb
-02
Jan-
05
Jan-
05
Dec
-05
Moody's S&P
Ba2
Ba1
Baa3
Baa1
BB
BB+
BBB-
BBB
BBB+
S&PFitch
Baa2
Fitch
The vulnerability of public finances to unfavorable shocks has been reduced

9
1.0
1.1
1.2
1.3
1.4
1.5
1.6
2000 2001 2002 2003 2004 2005 2006
1.01
1.02
1.02
1.03
1.03
1.04
1.04
1.05
1.05
1.06
2000 2001 2002 2003 2004 2005 2006
Federal Government Debt:Interest Rate CaR
(Absolute CaR/Expected Cost)
Federal Government Debt:ExRate CaR
(Absolute CaR/Expected Cost)
Risk measures have continued to decline

10
Index
1. Debt Management Strategy Overview
2. Recent Liability Management Operations
3. Policy Guidelines and Concluding Remarks

11A series of operations aimed at reducing the financing costof public debt and maintaining an adequate risk level werecarried out in 2005 and 2006
2005
Purchase of Dollars from the CB and Global Bonds Buyback
First Issue of Debt Exchange Warrants (dollars)
2006
Second Issue of Debt Exchange Warrants (euros)
Bond Repurchase Offer and Placement of New Global Bond
Prepayment of Debt with International Financial Institutions
1
2
3
4
5
12
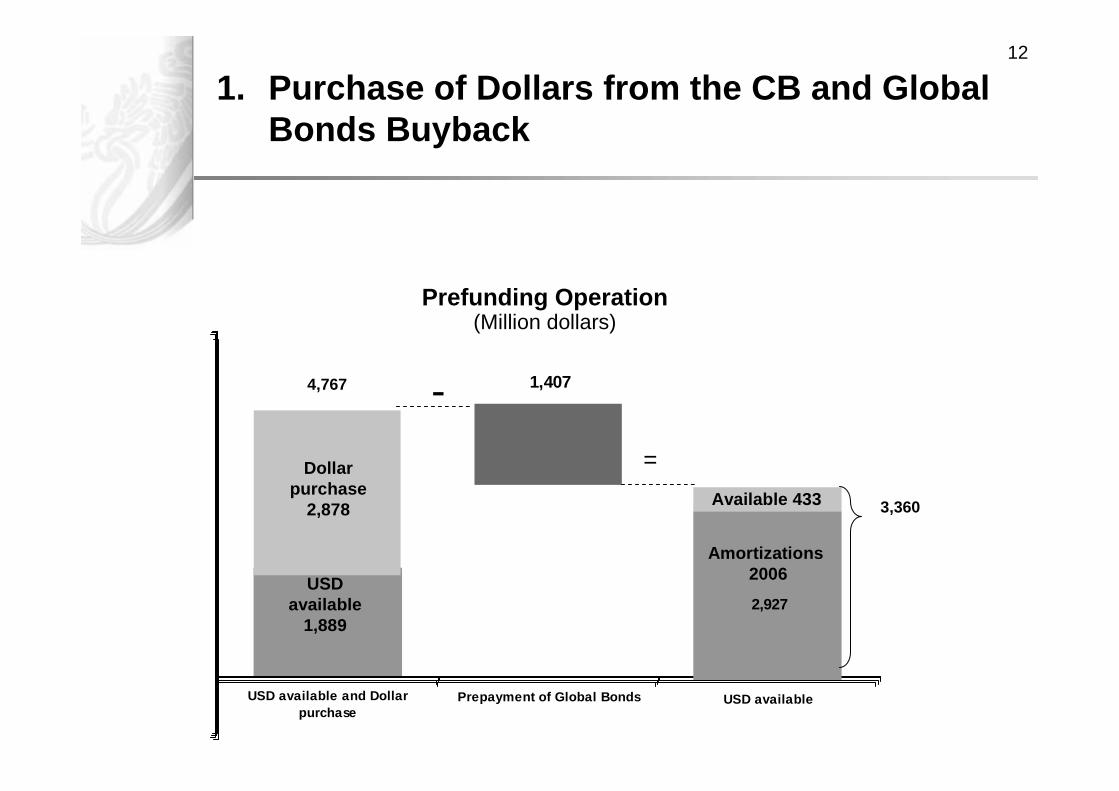
1,407
Prepayment of Global Bonds
-
USD available and Dollarpurchase
Prefunding Operation(Million dollars)
USD available
1,889
1. Purchase of Dollars from the CB and Global Bonds Buyback
2,927
USD available
Available 433
=
Amortizations2006
3,360
4,767
Dollarpurchase
2,878
13
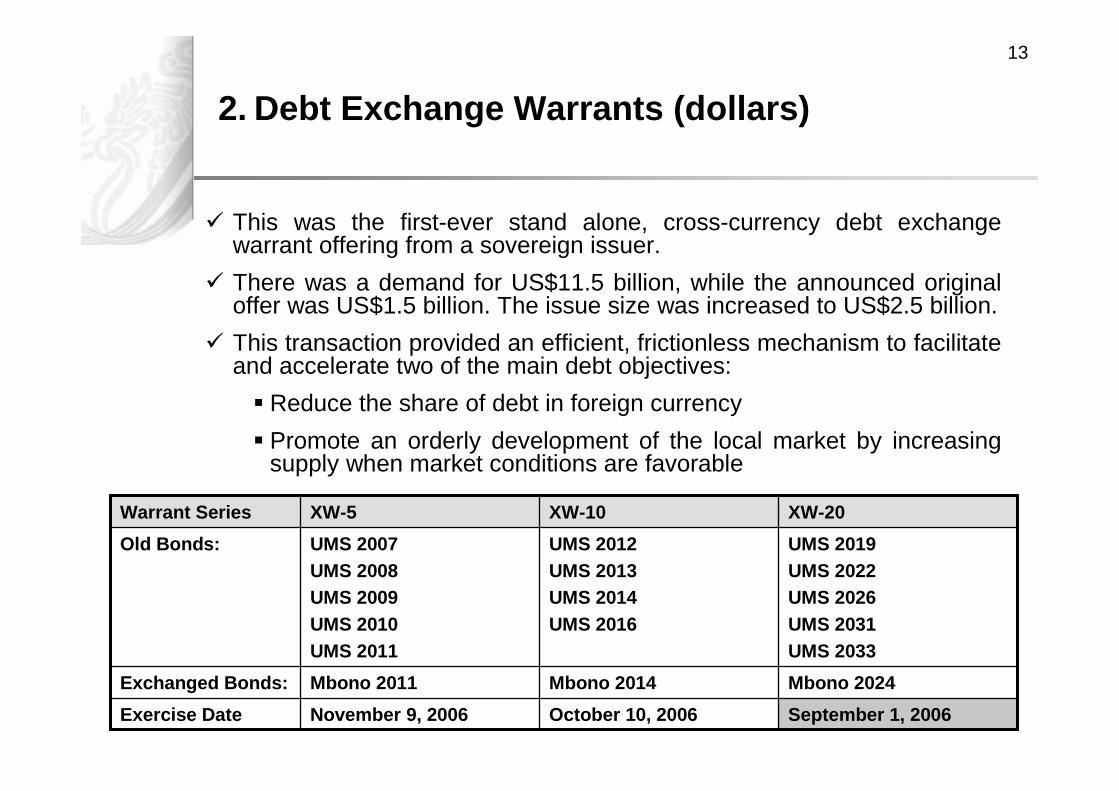
2. Debt Exchange Warrants (dollars)
This was the first-ever stand alone, cross-currency debt exchange warrant offering from a sovereign issuer.
There was a demand for US$11.5 billion, while the announced original offer was US$1.5 billion. The issue size was increased to US$2.5 billion.
This transaction provided an efficient, frictionless mechanism to facilitate and accelerate two of the main debt objectives:
Reduce the share of debt in foreign currency
Promote an orderly development of the local market by increasingsupply when market conditions are favorable
Mbono 2024Mbono 2014Mbono 2011Exchanged Bonds:
September 1, 2006October 10, 2006November 9, 2006Exercise Date
UMS 2019UMS 2022UMS 2026UMS 2031UMS 2033
UMS 2012UMS 2013UMS 2014UMS 2016
UMS 2007UMS 2008UMS 2009UMS 2010UMS 2011
Old Bonds:
XW-20XW-10XW-5Warrant Series

14
Mexico issued warrants in euros in March 2006. The operation generated EUR€1.5 billion in demand, 2.5 times the EUR€600 million allocated.
Nov. 22, 2006Exercise Date:
Mbono 2013Mbono 2023
Exchanged Securities
UMS EUR 2008UMS EUR 2010UMS EUR 2013UMS ITL 2007UMS ITL 2013UMS ITL 2017UMS DEM 2008UMS DEM 2009
Old Bonds:
XW-EWarrant Series:
3. Debt Exchange Warrants (euros)
15
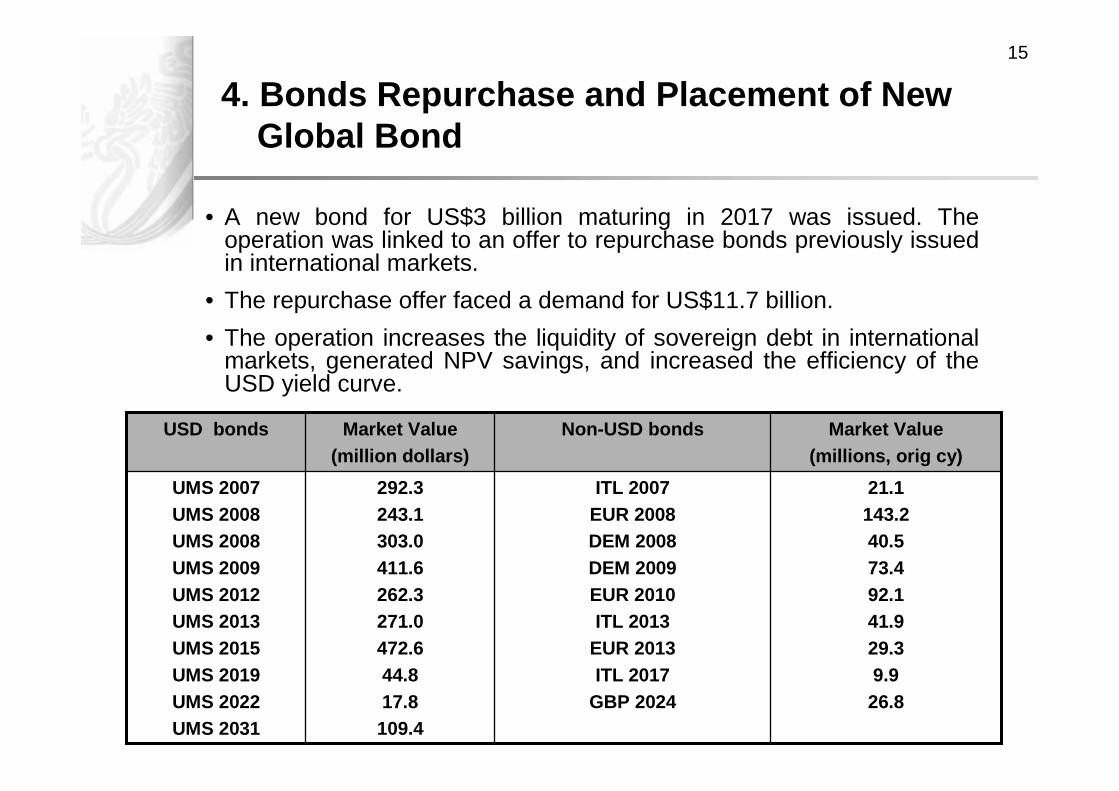
4. Bonds Repurchase and Placement of NewGlobal Bond
• A new bond for US$3 billion maturing in 2017 was issued. Theoperation was linked to an offer to repurchase bonds previously issuedin international markets.
• The repurchase offer faced a demand for US$11.7 billion.
• The operation increases the liquidity of sovereign debt in international markets, generated NPV savings, and increased the efficiency of the USD yield curve.
21.1143.240.573.492.141.929.39.926.8
ITL 2007EUR 2008DEM 2008DEM 2009EUR 2010ITL 2013
EUR 2013ITL 2017
GBP 2024
292.3243.1303.0411.6262.3271.0472.644.817.8109.4
UMS 2007UMS 2008UMS 2008UMS 2009UMS 2012UMS 2013UMS 2015UMS 2019UMS 2022UMS 2031
Market Value(millions, orig cy)
Non-USD bondsMarket Value(million dollars)
USD bonds

16
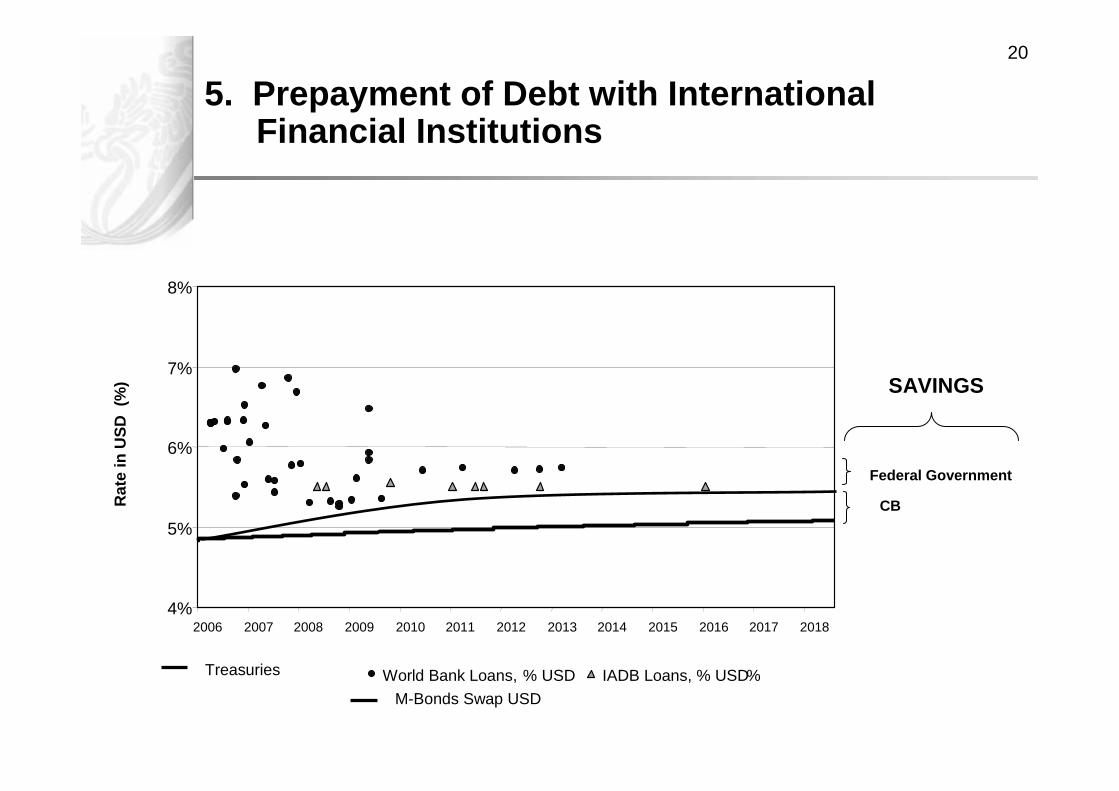
5. Prepayment of Debt with InternationalFinancial Institutions
The Ministry of Finance will prepay several loans from the Inter-American Development Bank and the World Bank for an approximate amount of USD 9 billion.
In order to carry out the prepayment, the Federal Government will purchase US dollars from the Central Bank’s international reserve.
The funds came from issuing securities in the local market with similar characteristics to the Central Bank’s monetary regulation bonds (floating coupon rate).
An equivalent amount of BREMS will be retired by the Central Bank in a concurrent transaction.

17
World Bank$6,507
IFIS$13,376
Restructured$125
IADB$6,869
Market Debt $42,936
Foreign Trade $245
76% 24%
12%
12%
0%
0%
Federal Government External Debt(millions of dollars)
Source: SHCP
5. Prepayment of Debt with InternationalFinancial Institutions

18
Financing Cost of IFI instruments vs. Peso Yield Curve
4%
5%
6%
7%
8%
9%
10%
11%
2006 2007 2008 2009 2010 2011 2012 2013 2014 2015 2016 2017 2018 2019 2020
Average Life
(%, p
eso
s)
M Bond Curve World Bank Credits IADB Credits
Outstanding amounts by February 28, 2006. Yield curves as of April 24, 2006.
5. Prepayment of Debt with InternationalFinancial Institutions

19
Financing Cost
C2 C195%95%
Without OperationWith Operation
Pro
bab
ility
CaR
Distribution of Financing Cost(Density function)
5. Prepayment of Debt with InternationalFinancial Institutions
20
World Bank Loans, % USD IADB Loans, % USD %
4%
5%
6%
7%
8%
2006 2007 2008 2009 2010 2011 2012 2013 2014 2015 2016 2017 2018
Treasuries
Rat
ein
US
D (
%)
M-Bonds Swap USD
Federal Government
CB
SAVINGS
5. Prepayment of Debt with InternationalFinancial Institutions

21
Index
1. Overview
2. Recent Liability Management Operations
3. Policy Guidelines and Concluding Remarks
22
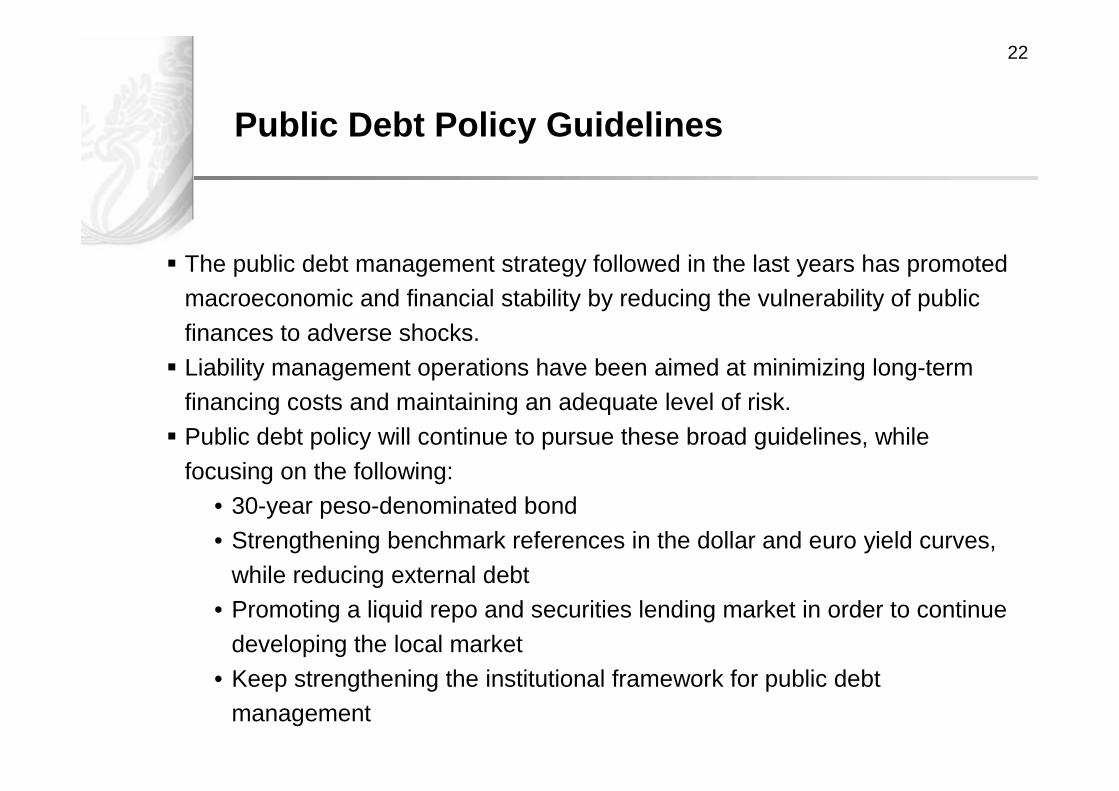
Public Debt Policy Guidelines
The public debt management strategy followed in the last years has promoted macroeconomic and financial stability by reducing the vulnerability of public
finances to adverse shocks.
Liability management operations have been aimed at minimizing long-term financing costs and maintaining an adequate level of risk.
Public debt policy will continue to pursue these broad guidelines, while
focusing on the following:• 30-year peso-denominated bond
• Strengthening benchmark references in the dollar and euro yield curves,
while reducing external debt• Promoting a liquid repo and securities lending market in order to continue
developing the local market
• Keep strengthening the institutional framework for public debt management
www.hacienda.gob.mx/ucp


![III. Public Debt Management Strategy 2013-20151].pdf · III. Public Debt Management Strategy 2013-2015 ... of the Public Debt Law, public debt is an unconditional ... Republic of](https://static.fdocuments.net/doc/165x107/5aebf0267f8b9a36698f0205/iii-public-debt-management-strategy-2013-1pdfiii-public-debt-management-strategy.jpg)


![ETHIOPIA’S MEDIUM TERM DEBT MANAGEMENT STRATEGY (2013 …siteresources.worldbank.org/INTDEBTDEPT/Resources/468980... · Ethiopia’s Medium Term Debt Strategy [2013-2017] Page 1](https://static.fdocuments.net/doc/165x107/5b1c3d1c7f8b9a1b688b5d65/ethiopias-medium-term-debt-management-strategy-2013-ethiopias-medium.jpg)

