Public Debt and Budgetary Procedures: Top Down or Bottom ...
31
This PDF is a selection from an out-of-print volume from the National Bureau of Economic Research Volume Title: Fiscal Institutions and Fiscal Performance Volume Author/Editor: James M. Poterba and , editors Volume Publisher: University of Chicago Press Volume ISBN: 0-226-67623-4 Volume URL: http://www.nber.org/books/pote99-1 Publication Date: January 1999 Chapter Title: Public Debt and Budgetary Procedures: Top Down or Bottom Up? Some Evidence from Swiss Municipalities Chapter Author: Lars P. Feld, Gebhard Kirchgassner Chapter URL: http://www.nber.org/chapters/c8027 Chapter pages in book: (p. 151 - 180)
Transcript of Public Debt and Budgetary Procedures: Top Down or Bottom ...
This PDF is a selection from an out-of-print volume from the National Bureauof Economic Research
Volume Title: Fiscal Institutions and Fiscal Performance
Volume Author/Editor: James M. Poterba and , editors
Volume Publisher: University of Chicago Press
Volume ISBN: 0-226-67623-4
Volume URL: http://www.nber.org/books/pote99-1
Publication Date: January 1999
Chapter Title: Public Debt and Budgetary Procedures: Top Down or BottomUp? Some Evidence from Swiss Municipalities
Chapter Author: Lars P. Feld, Gebhard Kirchgassner
Chapter URL: http://www.nber.org/chapters/c8027
Chapter pages in book: (p. 151 - 180)
7 Public Debt and Budgetary Procedures: Top Down or Bottom Up? Some Evidence from Swiss Municipalities Lars P. Feld and Gebhard Kirchgassner
7.1 Introduction
By the end of the eighties and early nineties government deficits and public debt in relation to GDP had increased to a higher level than before in nearly all OECD countries. Alesina and Perotti (1995) analyze this development of public debt in OECD countries and deduce two stylized questions that a theo- retical explanation should capture: (i) Why are there large and persistent de- ficits in peacetime, and why now? (ii) Why do deficits and debt differ sig- nificantly between countries? The authors survey the existing theoretical explanations of public debt and establish that only a few political-economic models accord with the facts of increased public debt. The tax-smoothing the- ory of the government budget (see Barro 1979) that presents the government as a “benevolent social planner” maximizing the utility of a representative agent does not, for example, answer those two questions. It can explain neither the high public debt in the eighties nor the large cross-country differences, although it is compatible with the increase of debt as a result of the 1973-74 recession. Much the same holds with the fiscal illusion theory of Buchanan and Wagner (1977). However, similar verdicts can be brought forward against theories that rely on several political sources of time inconsistency,’ partisan
Lars P. Feld is a research assistant at the University of St. Gallen, Switzerland. Gebhard Kirch- gassner is professor of economics and econometrics at the University of St. Gallen, Switzerland.
The authors thank Marcel R. Savioz for helpful suggestions and for the correspondence with the French-speaking municipalities, as well as Sandra Elmer for providing the map of Switzerland and Robert Straw for editing the paper in English. The authors also acknowledge the very useful discussions and comments by W. Mark Crain, Bernard Dafflon, Guy Gilbert, Jurgen von Hagen, Claude Jean-Renaud, Jim Poterba, Philippe Thalmann, and Hannelore Weck-Hannemann. Without the cooperation of the administrations of 131 Swiss communities and 26 Swiss cantons and their answers to a survey, this study would not have been possible.
1. See, e.g., Alesina and Tabellini 1988.
151
152 Lars P. Feld and Gebhard Kirchgassner
theories,2 and theories of intergenerational redi~tribution.~ According to the analysis of Alesina and Perotti, there exist only two classes of models that are able to address the two stylized questions mentioned above: on the one hand, models in which governments use public debt strategically to commit future governments? and, on the other hand, models of distributional conflict and “wars of attr i t i~n.”~
Recently, Velasco (chap. 2 in this volume) has developed a dynamic model of government net assets as the common property of all fiscal authorities. Sev- eral interest groups or the different spending ministries attempt to get money from this common resource in order to finance policies benefiting the prefer- ences of their group members or constituencies. Then a dynamic problem arises that is similar to the “tragedy of the commons” (see Hardin 1968). The problem of a fiscal commons consists in the fact that each of the n agents uses the whole stock of resources and not one-nth of it as a basis for consumption or spending decisions.
Given the facts of increasing public deficits and debt as a fiscal commons and the arguments brought forward that serious failures of political markets tend to create such deficits, two institutional possibilities to reduce deficits and debt may be proposed. Buchanan and Wagner (1977), for example, demand formal (constitutional) fiscal restraints. However, as the German example shows, formal fiscal restraints even on the constitutional level do not necessar- ily prevent federal public debt from growing.6 Recently, several authors have analyzed the conditions that most probably lead to binding balanced-budget rules.’ Bohn and Inman (1996) provide a comprehensive empirical analysis on the different designs of formal fiscal constraints. They find that in order to be effective deficit constraints must require a balanced budget at the end of the fiscal year, not just in prospect at the beginning (no-carry-over rule). Further- more, balanced-budget rules must be grounded constitutionally rather than merely based on statutes. Another factor that matters is the enforcement of balanced-budget rules: Of the 36 U.S. states with a no-carry-over rule, the 15 whose supreme courts are appointed by the state’s legislature or governor had larger deficits than the 21 states whose supreme courts are elected directly by the voters. Finally, the balanced-budget rule must be difficult to amend.
As von Hagen (1991) has shown for the U.S. states, formal fiscal restraints give incentives to policymakers to increase off-budget activities.8 Thus, in con-
2. Tabellini and LaVia (1989) report empirical evidence that deficits in the United States were
3. See Cukierman and Meltzer 1989 and Tabellini 1991. 4. See, e.g., Shachar 1993 or, for local governments, Rosenberg 1992. 5. See, e.g., Alesina and Drazen 1991, as well as Drazen and Grilli 1993. 6. Art. 11 5 ( I ) of the German Grundgesetz demands that, except for major macroeconomic
disequilibria, federal net borrowing not be higher than investment expenditure of the federal level. 7. See Alesina and Bayoumi 1996; Alt and Lowry 1994; Eichengreen and von Hagen 1996;
Poterba 1994, 1995a, 1995b; von Hagen and Eichengreen 1996; and the surveys in Poterba 1996, 1997.
8. For the ineffectiveness of constitutional limitations in the case of U.S. states see also Kiewiet and Szakaly 1996.
systematically larger under Democratic than under Republican administrations.
153 Public Debt and Budgetary Procedures: Top Down or Bottom Up?
trast to this rather outcome-oriented institutional solution, von Hagen (1992) and von Hagen and Harden (1994, 1995) have analyzed whether budgetary procedures have an impact on the level of government expenditure and budget deficits. According to their results the following features reduce the spending bias: (i) a strong position of the prime minister or finance minister in the nego- tiation process of the budget within the government before the budget law has passed, or government negotiations producing a set of binding targets early in that process; (ii) a parliamentary process with strong limits on amendments, line-item voting on expenditures, and an “all-or-nothing” vote on the total size of the budget preceding the parliamentary debate; (iii) a large degree of trans- parency of the budget; (iv) a limited spending flexibility for the ministries and a strong position of the finance minister vis-a-vis the spending ministers in the execution process of the budget law. All in all, “top down” procedures work better than “bottom up” procedure^.^
In these theoretical as well as empirical studies another institutional possi- bility of debt control has been neglected as an independent rule: Voters may have the possibility to vote on budget deficits in referenda. Buchanan (1958, 1987) supposed that democratic governments, either direct or representative, entail a bias for borrowing because voters favor current benefits but dislike taxes. Therefore he suggests constitutional constraints. Inman (1982) argued that fiscal limitations are potentially valuable policy tools when direct demo- cratic review (or a Tiebout-like exit process) does not adequately control gov- ernment behavior. Moak, however, considers direct democracy as the only reli- able safeguard against excessive indebtedness (1982, 114). If voters acted as fiscal conservatives, as Peltzman (1992) in an empirical study of U.S. elections has impressively shown, they would be more reluctant to increase public debt. Indeed, because referenda and initiatives reduce the political leeway of the government, elements of direct democracy may also reduce the strategic use of public debt: governments and parties then have fewer opportunities to follow the special interests of their constituencies. More basically, the principal-agent problem inherent in (more or less) representative democracies becomes less severe once referenda and/or initiatives are available for citizens. lo
Using Swiss (Pommerehne 1978, 1990) and US. data (Matsusaka 1995), researchers have derived empirical results concerning the relationship between direct democracy and the economy. First, government expenditure is-ceteris paribus-lower in direct than in representative democracy (see also Holcombe 1980). Second, the structure of public expenditure changes with respect to different institutional regimes. The existence of the initiative leads to a reduc- tion in the state, as well as an increase in the local, component of state and local spending. Third, with respect to revenue composition direct democracies
9. De Haan and Sturm (1994) are able to confirm these results under ceteris paribus conditions for European Union (EU) member states during the eighties. These confirming results are, how- ever, obtained by excluding Luxembourg from their panel data set.
10. See Matsusaka 1992; Matsusaka and McCarty 1997; as well as Romer and Rosenthal 1978, 1979.

154 Lars P. Feld and Gebhard Kirchgassner
rely more on charges than on broad-based taxes. Fourth, Pommerehne and Weck-Hannemann (1 996) show that the willingness to finance government is higher in cantons with a direct than in those with a representative democratic system, indicating more efficient revenue collection. Fifth, some public goods are produced more efficiently in direct democracies than in representative de- mocracies." Sixth, economic performance, as measured by GDP per capita is-ceteris paribus-higher in those Swiss cantons with direct than in those with representative democracies (see Feld and Savioz 1997). Finally, Kiewiet and Szakaly (1996) show for a panel of the U.S. states from 1961 to 1990 that referendum approval of guaranteed debt is the most effective restraint on state borrowing.
In this paper, we thus attempt to find clues in the actual experience of Swit- zerland whether and which budgetary procedures have an impact on public debt. The variation in Swiss budgetary procedures and direct democratic deci- sion making between municipalities and between states (cantons) is consider- able. Switzerland is one of the few industrial countries (and presumably the only European one) where it is possible to study the effect of institutional differences on the level of government deficits and public debt. In section 7.2 the institutional variety of Switzerland is described. In section 7.3 a spatial model is outlined in order to illustrate the restrictions imposed on representa- tives by the voters in a referendum. An econometric model is developed and empirically estimated using data on Swiss municipalities in section 7.4. The paper finishes with some concluding remarks (sec. 7.5).
7.2 Budgetary Procedures at Swiss Subfederal Levels
Switzerland's constitution combines elements of direct democracy with a high degree of federalism. It consists of three governmental levels that estab- lish strong fiscal competencies of the single states (cantons) and local govern- ment units. Although fiscal competencies of the different tiers of government are not the focus of this paper, they are worth mentioning. The main progres- sive taxes on personal and corporate income are state and local taxes. The cantons have the basic power to tax income and capital. The municipalities can levy a surcharge on cantonal direct and property taxes. The central government relies mainly on indirect (proportional) taxes, the general sales tax and specific consumption taxes like the mineral oil tax. There is, however, a small but highly progressive federal income tax, which amounts to 25 percent of total federal tax revenue in 1994, while the cantons and municipalities rely on in- come and property taxes for about 50 percent of their total revenue and 95 percent of their tax revenue. The federal income tax has a maximal marginal tax rate of 13.2 percent and an average tax rate of 11.5 percent. Owing to a
11. Pommerehne (1983) analyzes refuse collection in Swiss municipalities and shows that the costs of production are the lowest in direct democratic municipalities with a private supplier.
155 Public Debt and Budgetary Procedures: Top Down or Bottom Up?
basic tax exemption, the highest 3 percent of income taxpayers pay 50 percent of the revenue of the federal income tax. The federal government can also rely on a source tax on income from interest, the so-called Verrechnungssteuel: There are systems of horizontal and vertical fiscal equalization, mainly con- sisting of matching grants, as well as regional policies. However, the system is not as generous as, for example, in Germany: The share of own revenue from all government revenue ranges from 65 percent to 99.8 percent in our sample of 137 Swiss municipalities.
Concerning elements of direct democracy, the Swiss constitution includes a constitutional initiative and obligatory and optional referenda on the federal level, but no legislative initiative. A constitutional initiative requires 100,000 signatures (2.2 percent of the voters in 1994), an optional referendum 50,000 signatures (1.1 percent of the voters in 1994). Since the share of required signa- tures from all votes has declined from 7.5 percent (1893) to 2.2 percent (1994) in the case of the constitutional initiative and from 4.7 percent (1 879) to 1.1 percent (1994) in the case of the optional referendum, the number of executed initiatives and optional referenda has substantially risen during the last hun- dred years (Kleinewefers 1995). Only once, in 1977, after women's right to vote was established in 1971 (on the federal level), did voters increase the sig- nature requirement in a referendum, bringing it back to its original time trend.
At the federal level, the Swiss political system continually developed toward a higher degree of direct democracy during the first hundred years after the constitution of 1848, which already established a constitutional initiative (on total revision of the constitution) and an obligatory referendum on constitu- tional changes.'* Thiirer (1992) argues that the development of direct demo- cratic institutions at the central level in Switzerland follows a trend over time toward more popular participation. In 1874 the optional referendum on laws was introduced. In 189 1 an initiative on partial revision of the constitution was established. In 1921 the referendum on international treaties (extended in 1977 to the joining of international organizations) and in 1949 an obligatory referen- dum on urgent, universally binding federal decisions were introduced in the constitution. Several attempts to introduce a legislative initiative at the federal level and thus to increase the possibilities for popular participation were re- jected (1950, 1958, 1972). Most recently, a committee is collecting signatures for an initiative aimed at introducing a constructive referendum (a referendum with counterproposal) at the central level.
Since 1949 there have also been slight changes in the creation and use of
12. See Luthardt 1994. Sometimes direct democracy in Switzerland is attributed to the political self-organization of Swiss citizens in townships and villages by local assemblies comparable to the U.S. town meetings. The constitutional changes in the nineteenth century appear to have devel- oped from the Middle Ages with elements of direct democracy carried over to modem times as the institutions of referendum and initiative. We start the description of the history of Swiss direct democracy in the nineteenth century, however, because it is more profoundly analyzed than the historical records of small villages in earlier times.
156 Lars P. Feld and Gebhard Kirchgassner
referenda and initiatives in the cantons and municipalities of Switzerland, al- though they are rather minor and do not always aim at more direct democracy. Referenda and initiatives are institutions with a widespread though varying use at those levels. On the state level, we find the whole spectrum from the classic assembly in some cantons, like the two Appenzell, Glarus, and Obwalden, to more representative democracies in others, like Neuchatel. The same disper- sion is found at the local level. In some cantons and municipalities the obliga- tory and optional referenda include more issues than in others; some establish a legislative initiative in addition to the constitutional initiative, others do not.
Much the same holds with respect to budgetary procedures. Some cantons, like St. Gallen, rely on more stringent procedural rules than others. Some can- tons allow for participation of voters in the budgetary process in a referendum on the budget draft, the tax rate, or the budget deficit. Other cantons give the secretary of finance a stronger position in the budgetary process, while yet others decide on the budget in a meeting of the heads of all spending depart- ments. Thus, the question whether a “top down” or a “bottom up” budgetary procedure leads to more favorable results should become answerable in the Swiss institutional setting.
The focus of our analysis is on the local level only. Swiss municipalities have a much greater variation in budgetary decision-making processes than cantons do. Our data set includes 131 of the 137 largest Swiss towns and com- munities, whose population ranges between approximately 400,000 and ap- proximately 3,000 person^.'^ Table 7.1 sketches the distribution of those mu- nicipalities within the 26 cantons and the percentage of the cantonal population that lives in them. Nearly 46 percent of the Swiss population lives in these 137 municipalities. Cantons that include relatively large towns like Zurich or typi- cal city-states like Basel-Stadt or Genkve have a higher municipal populational fraction in our data set. Small cantons that are situated in the mountainous areas and have a higher share of rural population are somewhat underrepre- sented. This sample selection also influences the variation and distribution of budgetary decision making since Swiss rural municipalities, for example, by having local assemblies, make more use of direct democratic decision making on the average than larger m~nicipalities.’~
Table 7.2 contains information on the extent of direct democratic budgetary decision making reported as the mean of the municipalities of the respective canton and descriptive statistics for the different language areas of Switzer-
13. We have not yet received data from the municipalities of Diibendorf (ZH), Baar (ZG), Onex (GE), Wetzikon (ZH), Cham (ZG), and Locarno (TI). These communities, which count only for 1.37 percent of the Swiss population, therefore had to be excluded from our sample.
14. One reason is that the larger the population of a community is, the smaller the benefits of participating and, therefore, the participation rate in local assemblies. (For empirical evidence in the canton Basel-Landschaft see Kirchgassner and Pommerehne 1978.) Correspondingly, on the state level, assemblies exist only in very small cantons, and they are sometimes contested today. Nevertheless, using the instruments of referenda and initiatives, direct democracy is also handled in large cantons or cities.
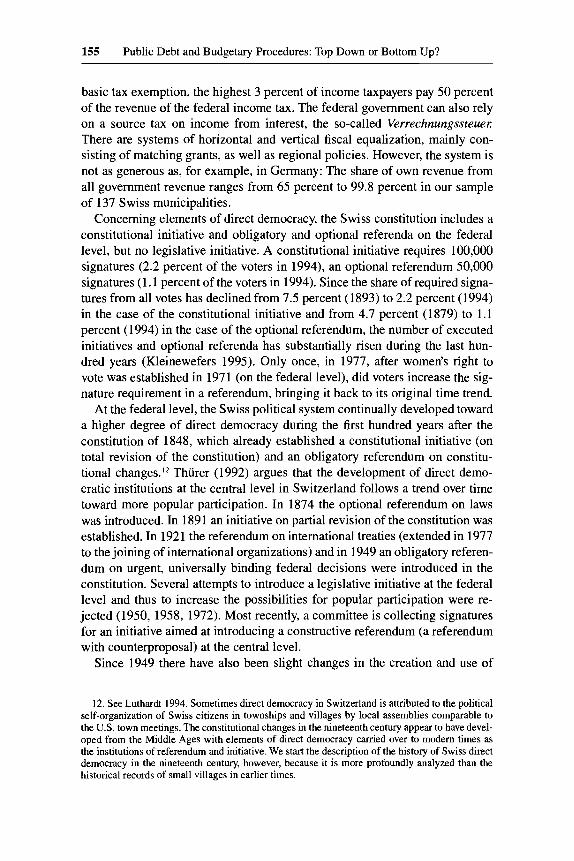
157 Public Debt and Budgetary Procedures: Top Down or Bottom Up?
Table 7.1 Population in Swiss Municipalities with Respect to Their State (Canton)
Population in % Number of of Population
State (Canton) Municipalities of the Canton
Zurich (ZH) Bem (BE) Luzem (LU) Uri (UR) Schwyz (SZ) Obwalden (OW) Nidwalden (NW) Glarus (GL) Zug (ZG) Fribourg (FR) Solothum (SO) Basel-Stadt (BS) Basel-Landschaft (BL) Schaffhausen (SH) Appenzell a. Rh. (AR) Appenzell i. Rh. (AI) St. Gallen (SG) Graubunden (GR) Aargau (AG) Thurgau (TG) Ticino (TI) Vaud (VD) Valais (VS) NeuchPtel (NE) Genttve (GE) Jura (JU)
24 17 7 1 3 0 1 1 3 3 3 2 8 2 1 1 8 4 8 5 4
12 5 4 8 2
65.8 42.6 47.8 24.2 31.2 0.0
18.8 14.9 56.9 23.4 21.5 99.5 51.0 62.1 29.9 37.4 37.6 29.6 19.3 32.3 22.7 47.7 31.0 53.0 76.9 27.8
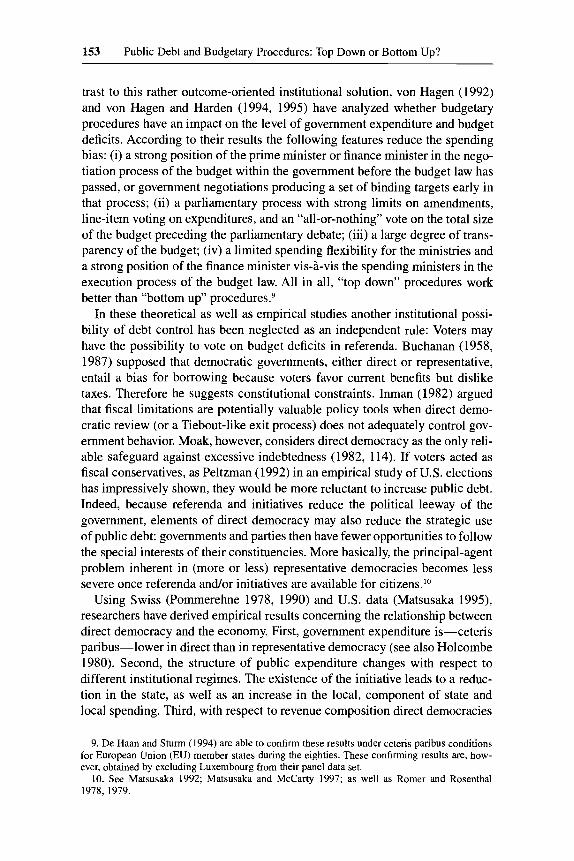
land. The first column reports whether there is an obligatory referendum, an optional referendum, or a local assembly on the budget draft. The second col- umn indicates whether the tax rate is controlled by the voters in an obligatory referendum, an optional referendum, or a local assembly. The last column shows whether especially the budget deficit is controlled by the citizens in an obligatory referendum, an optional referendum, or a local assembly.
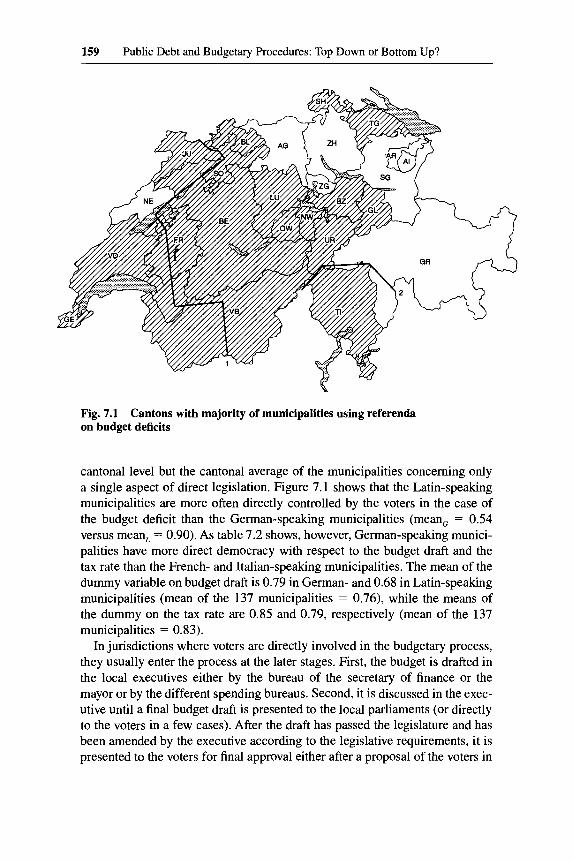
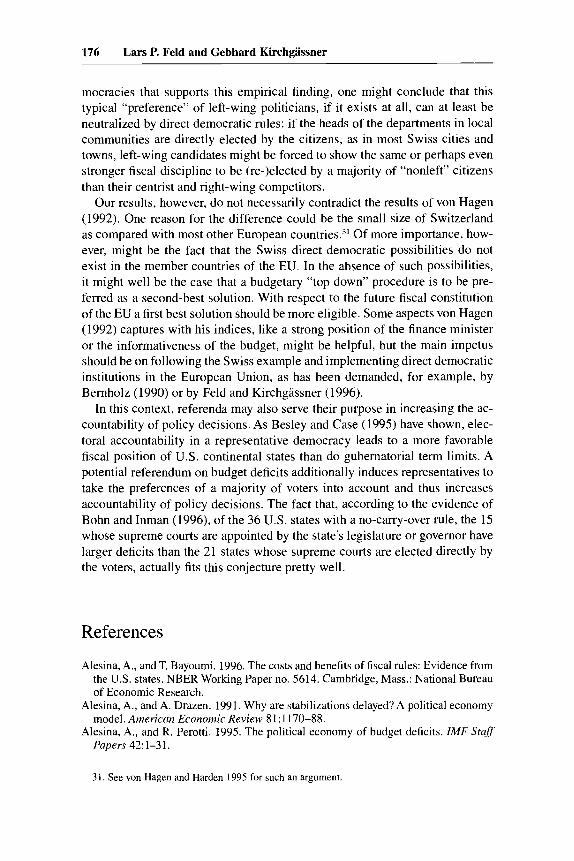
The latter information is graphically presented in figure 7.1, showing a map of Switzerland, the abbreviations for the cantons used in table 7.1, and the language border between the German and French (line 1) and the German and Italian (line 2) language areas of Switzerland. French-speaking Switzerland is the smaller area in the west of the map, while the Italian-speaking area consists of Ticino and parts of the canton of Graubunden in the south of Switzerland. Those cantons in which the majority of municipalities in our sample has no direct democratic decisions over the budget deficit are captured by the white (unshaded) area. Note that figure 7.1 does not capture direct democracy at the
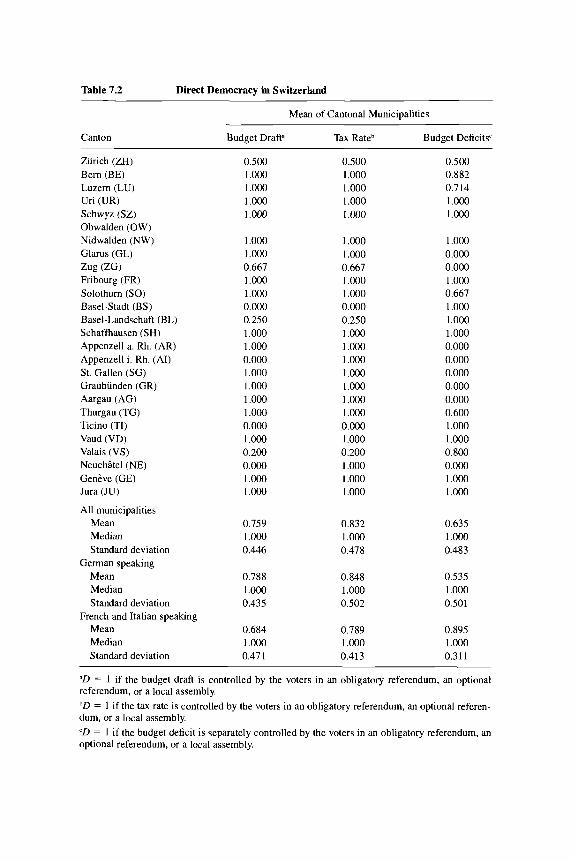
Table 7.2 Direct Democracy in Switzerland
Mean of Cantonal Municipalities
Canton Budget DrafP Tax Rateb Budget Deficits'
Zurich (ZH) Bem (BE) Luzern (LU) Uri (UR) Schwyz (SZ) Obwalden (OW) Nidwalden (NW) Glarus (GL) Zug (ZG) Fribourg (FR) Solothum (SO) Basel-Stadt (BS) Basel-Landschaft (BL) Scbaffhausen (SH) Appenzell a. Rh. (AR) Appenzell i. Rh. (AI) St. Gallen (SG) Graubiinden (GR) Aargau (AG) Thurgau (TG) Ticino (TI) Vaud (VD) Valais (VS) Neucbitel (NE) Genkve (GE) Jura (JU)
All municipalities Mean Median Standard deviation
Mean Median Standard deviation
Mean Median Standard deviation
German speaking
French and Italian speaking
0.500 1.000 1.000 1.000 1.000
1.000 1.000 0.667 1.000 1.000 0.000 0.250 1.000 1.000 0.000 1.000 1 .om 1.000 1 .000 0.000 1.000 0.200 0.000 1.000 1 .om
0.759 1.000 0.446
0.788 1.000 0.435
0.684 1 .om 0.471
0.500 1 .ooo 1 .ooo 1 .ooo 1.000
1 .ooo 1.000 0.667 1.000 1.000 0.000 0.250 I .DO0 1.000 1.000 1.000 1.000 1.000 1.000 0.000 1.000 0.200 1.000 1.000 1.000
0.832 1.000 0.478
0.848 1 .DO0 0.502
0.789 1.000 0.413
0.500 0.882 0.7 14 1.000 1.000
1.000 0.000 0.000 1.000 0.667 1.000 1.000 1.000 0.000 0.000 0.000 0.000 0.000 0.600 1.000 1.000 0.800 0.000 1.000 1.000
0.635 1 .ooo 0.483
0.535 1.000 0.501
0.895 1 .ooo 0.311
= 1 if the budget draft is controlled by the voters in an obligatory referendum, an optional referendum, or a local assembly. bD = 1 if the tax rate is controlled by the voters in an obligatory referendum, an optional referen- dum, or a local assembly. 'D = 1 if the budget deficit is separately controlled by the voters in an obligatory referendum, an optional referendum, or a local assembly.
159 Public Debt and Budgetary Procedures: Top Down or Bottom Up?
Fig. 7.1 on budget deficits
Cantons with majority of municipalities using referenda
cantonal level but the cantonal average of the municipalities concerning only a single aspect of direct legislation. Figure 7.1 shows that the Latin-speaking municipalities are more often directly controlled by the voters in the case of the budget deficit than the German-speaking municipalities (mean, = 0.54 versus mean, = 0.90). As table 7.2 shows, however, German-speaking munici- palities have more direct democracy with respect to the budget draft and the tax rate than the French- and Italian-speaking municipalities. The mean of the dummy variable on budget draft is 0.79 in German- and 0.68 in Latin-speaking municipalities (mean of the 137 municipalities = 0.76), while the means of the dummy on the tax rate are 0.85 and 0.79, respectively (mean of the 137 municipalities = 0.83).
In jurisdictions where voters are directly involved in the budgetary process, they usually enter the process at the later stages. First, the budget is drafted in the local executives either by the bureau of the secretary of finance or the mayor or by the different spending bureaus. Second, it is discussed in the exec- utive until a final budget draft is presented to the local parliaments (or directly to the voters in a few cases). After the draft has passed the legislature and has been amended by the executive according to the legislative requirements, it is presented to the voters for final approval either after a proposal of the voters in
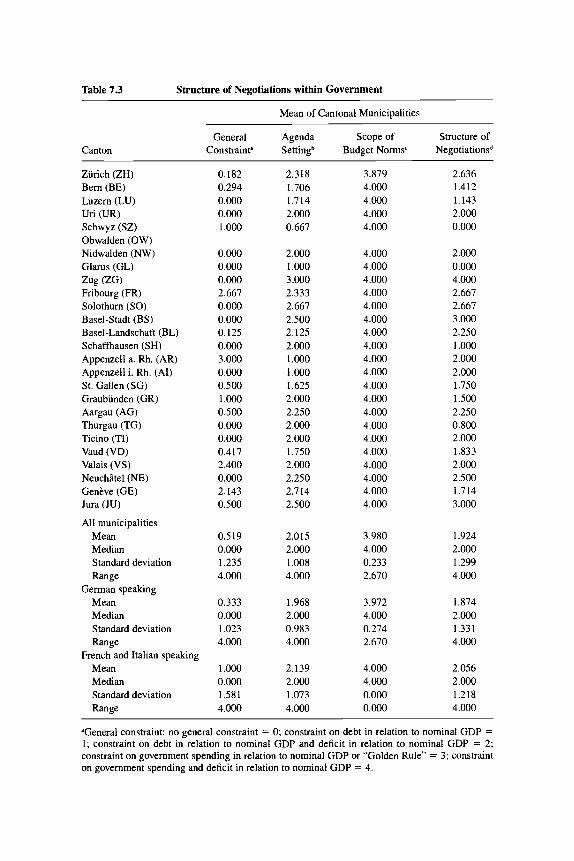
Table 7.3 Structure of Negotiations within Government
Mean of Cantonal Municipalities
Canton
~ ~~
General Agenda Scope of Structure of Constrainta Settingb Budget Norms‘ Negotiationsd
Zurich (ZH) Bern (BE) Luzern (LU) Uri (UR) Schwyz (SZ) Obwalden (OW) Nidwalden (NW) Glarus (GL) Zug (ZG) Fribourg (FR) Solothurn (SO) Basel-Stadt (BS) Basel-Landschaft (BL) Schaffhausen (SH) Appenzell a. Rh. (AR) Appenzell i. Rh. (AI) St. Gallen (SG) Graubunden (GR) Aargau (AG) Thurgau (TG) Ticino (TI) Vaud (VD) Valais (VS) Neuchkel (NE) Genive (GE) Jura (JU)
All municipalities Mean Median Standard deviation Range
Mean Median Standard deviation Range
Mean Median Standard deviation Range
German speaking
French and Italian speaking
0. I82 0.294 0.000 0.000 1.000
0.000 0.000 0.000 2.667 0.000 0.000 0.125 0.000 3.000 0.000 0.500 1 .000 0.500 0.000 0.000 0.417 2.400 0.000 2.143 0.500
0.519 0.000 1.235 4.000
0.333 0.000 1.023 4.000
1 .000 0.000 1.58 1 4.000
2.3 18 1.706 1.714 2.000 0.667
2.000 1.000 3.000 2.333 2.667 2.500 2.125 2.000 1 .ooo 1.000 1.625 2.000 2.250 2.000 2.000 1.750 2.000 2.250 2.714 2.500
2.015 2.000 1.008 4.000
1.968 2.000 0.983 4.000
2.139 2.000 1.073 4.000
3.879 4.000 4.000 4.000 4.000
4.000 4.000 4.000 4.000 4.000 4.000 4.000 4.000 4.000 4.000 4.000 4.000 4.000 4.000 4.000 4.000 4.000 4.000 4.000 4.000
3.980 4.000 0.233 2.670
3.972 4.000 0.274 2.670
4.000 4.000 0.000 0.000
2.636 1.412 1.143 2.000 0.000
2.000 0.000 4.000 2.667 2.667 3.000 2.250 1.000 2.000 2.000 1.750 1.500 2.250 0.800 2.000 1.833 2.000 2.500 1.714 3.000
1.924 2.000 1.299 4.000
1.874 2.000 1.33 1 4.000
2.056 2.000 1.218 4.000
”General constraint: no general constraint = 0; constraint on debt in relation to nominal GDP = 1; constraint on debt in relation to nominal GDP and deficit in relation to nominal GDP = 2; constraint on government spending in relation to nominal GDP or “Golden Rule” = 3; constraint on government spending and deficit in relation to nominal GDP = 4.
161 Public Debt and Budgetary Procedures: Top Down or Bottom Up?
Table 7.3 (continued)
bAgenda setting for budget negotiations: secretary of finance (SF) or “cabinet” collects bids from heads of departments = 0; SF or “cabinet” collects bids subject to preagreed guidelines = 1; “cabinet” decides on budget norms first = 2; SF proposes budget norms to be voted on by the “cabinet” = 3; SF or mayor determines budget parameters to be observed by heads of depart- ments = 4. ‘Scope of budget norms in the setting of agenda: expenditure or deficit = 0; specific budget tar- gets = 1.33; specific together with overall limits on the budget size = 2.66; “broad,” i.e., overall limits on the budget size = 4. dStructure of negotiations: all “cabinet members” involved together = 0; multilateral = 2; bilateral between heads of departments and SF = 4.
an optional referendum or because the budgetary process requires an obliga- tory referendum. In some municipalities, the budget deficit has to be approved by the voters separately; that is, the budget deficit is not only reported in the budget draft but also annexed on a different ballot sheet. Thus, the budget deficit has to be agreed upon by the voters in a way similar to the separate decision on tax rate changes.
We measure budgetary procedures of Swiss municipalities not only by the extent of direct democratic decision making on the budget, but also by more or less the same indices of procedures as von Hagen (1992,69-74). Von Hagen builds a structural index and an index of long-term planning constraint that consists of five different items in the budgetary process: (i) the structure of negotiations within government, (ii) the structure of the parliamentary process, (iii) the informativeness of the budget draft, (iv) the flexibility of the budget execution, and (v) the long-term planning constraint. The information we re- ceived from the Swiss municipalities has not allowed us to get exactly the same information about the structure of parliamentary process and the flexibility of budget execution. Thus, the structure of negotiations within government is characterized in our data by the following issues, shown in table 7.3 as cantonal means of the municipalities and descriptives for the two Swiss language areas.I5
The existence of a general constraint indicates that the draft begins with the statement of overall restrictions or targets on total spending, revenues, deficits, or government debt. General constraints are not used frequently as means to discipline municipalities in Switzerland. Only in the cantons of Fribourg, Ap- penzell Ausser Rhoden, Valais, and Genbve are municipalities more strongly restricted by such formal constraints than in other cantons. In some of these cantons, municipalities facing severe budgetary problems get grants from the cantonal fiscal equalization scheme only if those local decision-making bodies agree to raise their local tax rates in order to reduce deficits and debt. This has been treated in the data underlying table 7.3 as the strongest general constraint. The agenda setting for budget negotiations reflects whether the initial budget
15. Information on the details of these indices is provided in the notes to tables 7.3-7.5.
162 Lars P. Feld and Gebhard Kirchgassner
guidelines are set by the mayor or secretary of finance or by the heads of the different departments. Agenda-setting power of a central authority in the budg- etary process varies considerably between the municipalities and the different cantons. A particular pattern is observable only to a limited extent. The small cantons of Schwyz, Glarus, Appenzell Ausser Rhoden, and Appenzell Inner Rhoden have average values of their municipalities that are low, which indi- cates a weak role for the agenda setter. Agenda-setting power of the secretary of finance or the mayor is only slightly higher in Latin-speaking municipalities (mean = 2.14) than in German-speaking ones (mean = 1.97). The agenda may specify the scope of budget norms, that is, overall limits on the budget size, limits on spending or deficits, or it may determine specific budget targets to- gether with one of the former limits. The scope of budget norms does not vary much over the municipalities in the sample except for the canton of Zurich. Subsequent negotiations may be structured bi- or multilaterally between the secretary of finance and the heads of the departments or contain the whole “cabinet.” The structure of negotiations within government appears to be more centralized and “top down” in Latin-speaking municipalities (mean = 2.06) than in the German-speaking ones (mean = 1.87).
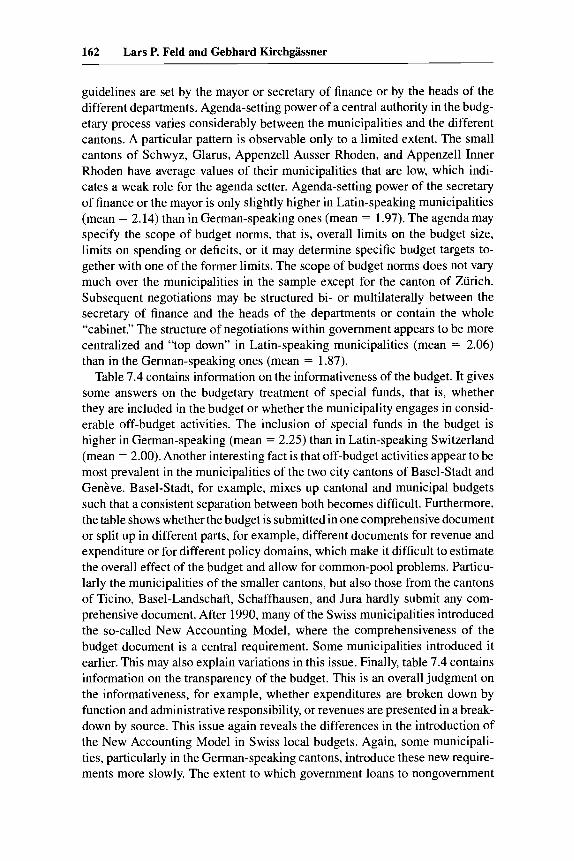
Table 7.4 contains information on the informativeness of the budget. It gives some answers on the budgetary treatment of special funds, that is, whether they are included in the budget or whether the municipality engages in consid- erable off-budget activities. The inclusion of special funds in the budget is higher in German-speaking (mean = 2.25) than in Latin-speaking Switzerland (mean = 2.00). Another interesting fact is that off-budget activities appear to be most prevalent in the municipalities of the two city cantons of Basel-Stadt and Genkve. Basel-Stadt, for example, mixes up cantonal and municipal budgets such that a consistent separation between both becomes difficult. Furthermore, the table shows whether the budget is submitted in one comprehensive document or split up in different parts, for example, different documents for revenue and expenditure or for different policy domains, which make it difficult to estimate the overall effect of the budget and allow for common-pool problems. Particu- larly the municipalities of the smaller cantons, but also those from the cantons of Ticino, Basel-Landschaft, Schaffhausen, and Jura hardly submit any com- prehensive document. After 1990, many of the Swiss municipalities introduced the so-called New Accounting Model, where the comprehensiveness of the budget document is a central requirement. Some municipalities introduced it earlier. This may also explain variations in this issue. Finally, table 7.4 contains information on the transparency of the budget. This is an overall judgment on the informativeness, for example, whether expenditures are broken down by function and administrative responsibility, or revenues are presented in a break- down by source. This issue again reveals the differences in the introduction of the New Accounting Model in Swiss local budgets. Again, some municipali- ties, particularly in the German-speaking cantons, introduce these new require- ments more slowly. The extent to which government loans to nongovernment
Table 7.4 Informativeness of the Budget Draft
Canton
~~ ~
Mean of Cantonal Municipalities
Special One Funds' Documentb Transparencyc
Zurich (ZH) 2.318 1.455 2.455 Bern (BE) 2.47 1 1.294 2.706 Luzern (LU) 2.429 1.7 14 2.857 Uri (UR) 2.000 0.000 2.000 Schwyz (SZ) 3.667 4.000 4.000 Obwalden (OW) Nidwalden (NW) 2.000 0.000 2.000 Glarus (GL) 2.000 0.000 2.000 Zug (ZG) 1.000 0.000 2.000 Fribourg (FR) 2.000 0.667 2.000 Solothum (SO) 1.667 0.000 2.000 Basel-Stadt (BS) 0.500 2.000 3.000 Basel-Landschaft (BL) 1.750 0.000 1.750 Schaffnausen (SH) 2.000 0.000 2.000 Appenzell a. Rh. (AR) 2.000 0.000 2.000 Appenzell i. Rh. (AI) 2.000 0.000 2.000 St. Gallen (SG) 2.250 1.500 2.500 Graubunden (GR) 2.500 1.000 2.500 Aargau (AG) 2.375 1.500 2.750 Thurgau (TG) 2.600 1.600 2.400 Ticino (TI) 1.333 0.000 2.000 Vaud (VD) 2.750 2.000 3.000 Valais (VS) 2.000 0.000 2.000 Neuchltel (NE) 2.250 1.000 2.000
Jura (JU) 2.000 0.000 2.000
Mean 2.183 1.282 2.534 Median 2.000 O.Oo0 2.000 Standard deviation 1.142 1.858 1.105
Genkve (GE) 0.571 2.857 3.429
All municipalities
Range 4.000 4.000 4.000 German speaking
Mean 2.253 1.200 2.484 Median 2.000 0.000 2.000 Standard deviation 1.081 1.831 1.080 Range 4.000 4.000 4.000
Mean 2.000 1.500 2.667 Median 2.000 0.000 2.000 Standard deviation 1.287 1.935 1.171 Range 4.000 4.000 4.000
French and Italian speaking
aSpecial funds: not included in the budget draft (considerable off-budget activities) = 0; some special funds are included = 1; most special funds are included = 2; special funds are included, but annexed to budget draft = 3; special funds are included in the budget draft = 4. bBudget submitted in one document or in different documents: no (different documents for revenue and expenditure or for different policy domains) = 0; in recent times submitted in one document = 2; submitted in one document = 4. 'Assessment of budget transparency, i.e., expenditures broken down by function and administrative responsibility or revenues presented in a breakdown by source: hardly transparent = 0; not fully transparent = 2; fully transparent = 4.
164 Lars P. Feld and Gebhard Kirchgassner
entities as well as links to national accounts statistics are revealed in the budget draft were reported only by a few municipalities and thus had to be skipped.
The municipalities have also provided some insight into the nature of long- term planning constraints at the local level. Table 7.5 contains some informa- tion on the existence of a multiannual target or projections of intertemporal guidelines of their budget plans, the length of the planning horizon, the kind of forecasts used-that is, on what basis these forecasts are derived, ad hoc, fixed, updated, or by using a macroeconomic model-and the degree of com- mitment that is connected to the multiannual plan. The commitment may only express political preferences and the willingness to make efforts to come close to these targets, without, however, being binding. The targets may also be only indicative in that they carry less weight than a political commitment. They may be part of a coalition agreement, only for internal orientation or more specific on total government revenue and expenditures. The long-term planning con- straint shows that German-speaking municipalities are more constrained. The target exists more often, the nature of the forecast is more reliable, and the commitment connected with it is stronger. Only the planning horizon is longer in Latin-speaking Switzerland. However, again the municipalities of smaller cantons have less often introduced long-term planning constraints, as the fig- ures for the municipalities of the cantons of Schwyz, Nidwalden, Zug, Appen- zell Aussen Rhoden, and Appenzell Inner Rhoden show. Again, some of these differences are caused by differences in the introduction of the New Account- ing Model, which does not require the introduction of long-term planning tar- gets but recommends it as a basis for rational budgetary planning.
7.3 A Spatial Model
The budgetary process in Swiss municipalities with referendum approval of the budget deficit can be analyzed in a similar, but more stylized manner, as Inman ( 1 997) does in a general paper. Consider a budget game where agents prefer different levels of budget deficits d up to a maximum limit on deficits d,,, that is set by capital markets. Deficits that exceed d,,, are not funded by the market. Suppose that the executive prefers a public deficit level d, that is higher than the one preferred by parliament, d,. The latter prefers deficits that exceed the deficit level preferred by the voters, d, , such that d,,,, > d, > d, > dv. The budgetary process outlined above corresponds to a multistage budget game illustrated by the following spatial mode1.l6
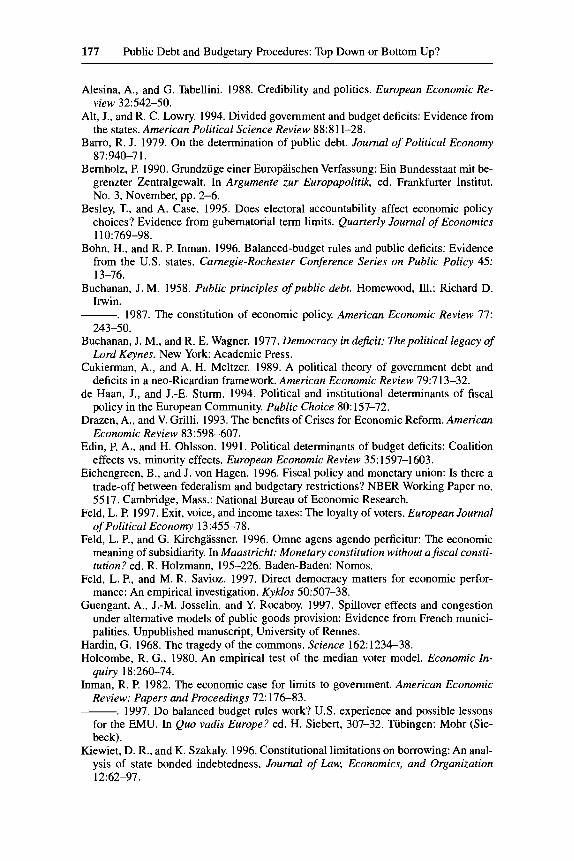
The agents in figure 7.2 decide on two issues XI and X , that may represent two different spending categories. Let X , represent public infrastructure and X , public education spending. A movement along the axis corresponds to an increase in spending. The level as well as the structure of spending determines
16. The model develops Moser’s (1996) and Feld’s (1997) applications to the Swiss political system further and applies it to referenda on budget deficits.
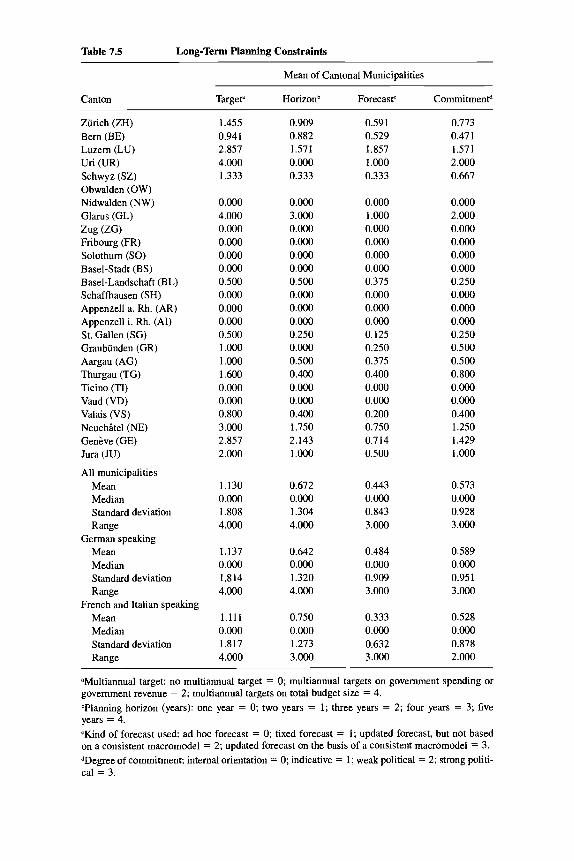
Table 7.5 Long-Term Planning Constraints
Canton
Mean of Cantonal Municipalities
Targeta Horizonb Forecast' Commitment"
Zurich (ZH) Bern (BE) Luzern (LU) Uri (UR) Schwyz (SZ) Obwalden (OW) Nidwalden (NW) Glarus (GL) Zug (ZG) Fribourg (FR) Solothurn (SO) Basel-Stadt (BS) Basel-Landschaft (BL) Schaffhausen (SH) Appenzell a. Rh. (AR) Appenzell i. Rh. (AI) St. Gallen (SG) Graubunden (GR) Aargau (AG) Thurgau (TG) Ticino (TI) Vaud (VD) Valais (VS) Neuchltel (NE) Genkve (GE) Jura (JU)
All municipalities Mean Median Standard deviation Range
Mean Median Standard deviation Range
Mean Median Standard deviation Range
German speaking
French and Italian speaking
1.455 0.941 2.857 4.000 1.333
0.000 4.000 0.000 0.000 0.000 0.000 0.500 0.000 0.000 0.000 0.500 1 .000 1.000 1.600 0.000 0.000 0.800 3.000 2.857 2.000
1.130 0.000 1.808 4.000
1.137 0.000 1.814 4.000
1.111 0.000 1.817 4.000
0.909 0.882 1.571 0.000 0.333
0.000 3.000 0.000 0.000 0.000 0.000 0.500 O.Oo0 O.Oo0 0.000 0.250 0.000 0.500 0.400 0.000 0.000 0.400 1.750 2.143 1 .Ooo
0.672 0.000 1.304 4.000
0.642 0.000 1.320 4.000
0.750 0.000 1.273 3.000
0.591 0.773 0.529 0.471 1.857 1.571 1.000 2.000 0.333 0.667
0.000 0.000 1 .000 2.000 O.Oo0 0.000 0.000 0.000 0.000 0.000 0.000 0.000 0.375 0.250 0.000 0.000 0.000 0.000 0.000 0.000 0.125 0.250 0.250 0.500 0.375 0.500 0.400 0.800 0.000 0.000 0.000 0.000 0.200 0.400 0.750 1.250 0.714 1.429 0.500 1.000
0.443 0.573 0.Ooo 0.000 0.843 0.928 3.000 3.000
0.484 0.589 0.000 0.000 0.909 0.951 3.000 3 .000
0.333 0.528 0.000 0.000 0.632 0.878 3 ,000 2.000
'Multiannual target: no multiannual target = 0; multiannual targets on government spending or government revenue = 2; multiannual targets on total budget size = 4. bPlanning horizon (years): one year = 0; two years = 1; three years = 2; four years = 3; five years = 4. <Kind of forecast used: ad hoc forecast = 0; fixed forecast = 1; updated forecast, but not based on a consistent macromodel = 2; updated forecast on the basis of a consistent macromodel = 3. dDegree of commitment: internal orientation = 0; indicative = 1; weak political = 2; strong politi- cal = 3.
166 Lars P. Feld and Gebhard Kirchgassner
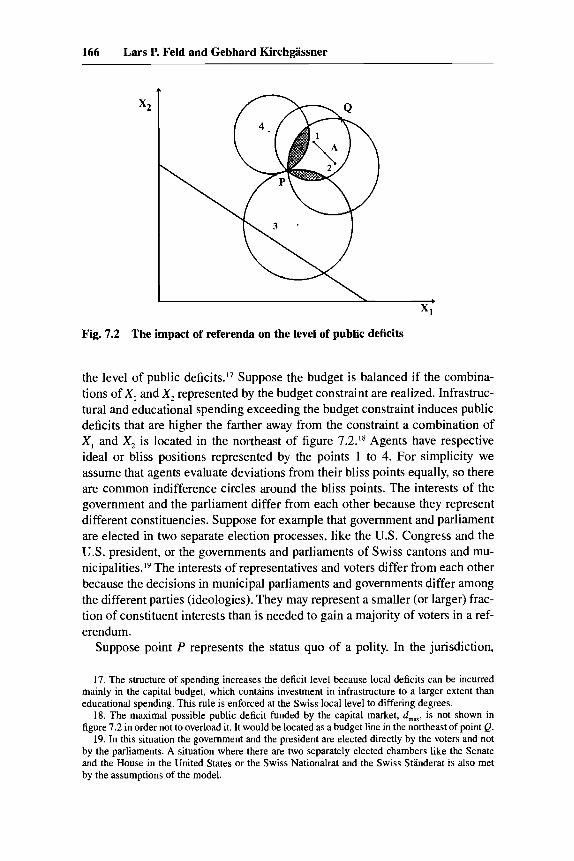
Fig. 7.2 The impact of referenda on the level of public deficits
the level of public deficit^.'^ Suppose the budget is balanced if the combina- tions of XI and X , represented by the budget constraint are realized. Infrastruc- tural and educational spending exceeding the budget constraint induces public deficits that are higher the farther away from the constraint a combination of X , and X , is located in the northeast of figure 7.2.18 Agents have respective ideal or bliss positions represented by the points 1 to 4. For simplicity we assume that agents evaluate deviations from their bliss points equally, so there are common indifference circles around the bliss points. The interests of the government and the parliament differ from each other because they represent different constituencies. Suppose for example that government and parliament are elected in two separate election processes, like the U.S. Congress and the U.S. president, or the governments and parliaments of Swiss cantons and mu- nicipalities.I9 The interests of representatives and voters differ from each other because the decisions in municipal parliaments and governments differ among the different parties (ideologies). They may represent a smaller (or larger) frac- tion of constituent interests than is needed to gain a majority of voters in a ref- erendum.
Suppose point P represents the status quo of a polity. In the jurisdiction,
17. The structure of spending increases the deficit level because local deficits can be incurred mainly in the capital budget, which contains investment in infrastructure to a larger extent than educational spending. This rule is enforced at the Swiss local level to differing degrees.
18. The maximal possible public deficit funded by the capital market, d,,., is not shown in figure 7.2 in order not to overload it. It would be located as a budget line in the northeast of point Q.
19. In this situation the government and the president are elected directly by the voters and not by the parliaments. A situation where there are two separately elected chambers like the Senate and the House in the United States or the Swiss Nationalrat and the Swiss Standerat is also met by the assumptions of the model.
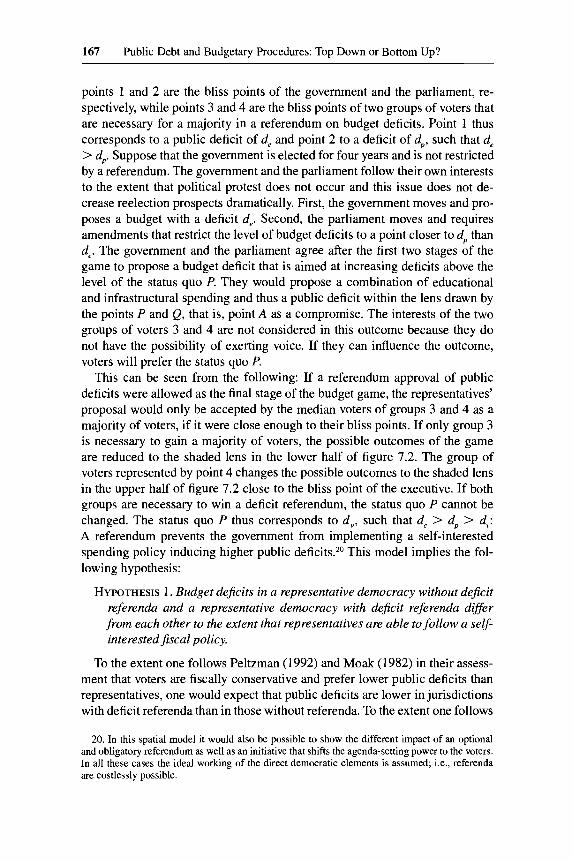
167 Public Debt and Budgetary Procedures: Top Down or Bottom Up?
points 1 and 2 are the bliss points of the government and the parliament, re- spectively, while points 3 and 4 are the bliss points of two groups of voters that are necessary for a majority in a referendum on budget deficits. Point 1 thus corresponds to a public deficit of d, and point 2 to a deficit of dp, such that d, > d,. Suppose that the government is elected for four years and is not restricted by a referendum. The government and the parliament follow their own interests to the extent that political protest does not occur and this issue does not de- crease reelection prospects dramatically. First, the government moves and pro- poses a budget with a deficit d,. Second, the parliament moves and requires amendments that restrict the level of budget deficits to a point closer to d, than d,. The government and the parliament agree after the first two stages of the game to propose a budget deficit that is aimed at increasing deficits above the level of the status quo P. They would propose a combination of educational and infrastructural spending and thus a public deficit within the lens drawn by the points P and Q, that is, point A as a compromise. The interests of the two groups of voters 3 and 4 are not considered in this outcome because they do not have the possibility of exerting voice. If they can influence the outcome, voters will prefer the status quo P.
This can be seen from the following: If a referendum approval of public deficits were allowed as the final stage of the budget game, the representatives’ proposal would only be accepted by the median voters of groups 3 and 4 as a majority of voters, if it were close enough to their bliss points. If only group 3 is necessary to gain a majority of voters, the possible outcomes of the game are reduced to the shaded lens in the lower half of figure 7.2. The group of voters represented by point 4 changes the possible outcomes to the shaded lens in the upper half of figure 7.2 close to the bliss point of the executive. If both groups are necessary to win a deficit referendum, the status quo P cannot be changed. The status quo P thus corresponds to d v , such that d, > dp > dv: A referendum prevents the government from implementing a self-interested spending policy inducing higher public deficits.*O This model implies the fol- lowing hypothesis:
HYPOTHESIS 1. Budget deficits in a representative democracy without deficit referenda and a representative democracy with deficit referenda differ from each other to the extent that representatives are able to follow a self- interested fiscal policy.
To the extent one follows Peltzman (1992) and Moak (1982) in their assess- ment that voters are fiscally conservative and prefer lower public deficits than representatives, one would expect that public deficits are lower in jurisdictions with deficit referenda than in those without referenda. To the extent one follows
20. In this spatial model it would also be possible to show the different impact of an optional and obligatory referendum as well as an initiative that shifts the agenda-setting power to the voters. In all these cases the ideal working of the direct democratic elements is assumed; i t . , referenda are costlessly possible.
168 Lars P. Feld and Gebhard Kirchgassner
Buchanan (1958, 1987) in his assessment of a bias of voters for borrowing, public deficits might even be higher in jurisdictions with deficit referenda than in those without referenda.
However, the impact of referenda on budget deficits and public debt does not necessarily have to rely on fiscal conservatism of voters and thus their pref- erences. If public budgets were common-property resources and public debt the policy outcome of a “tragedy of fiscal commons,” as Velasco (chap. 2 in this volume) has shown, elements of direct democracy would reduce the dan- ger of n agents overusing the fiscal commons. Remember the basic mechanism leading to a commons dilemma in budgetary decision making: The problem of a fiscal commons consists in the fact that each of the n agents uses the whole stock of resources and not one-nth of it as a basis for consumption or spending decisions. Each agent attempts to get an optimal level of resources out of the fiscal commons by optimizing according to hisher individual yield and indi- vidual costs. In a referendum situation agent n faces a different optimization problem. He/she can only decide how the level of the common fiscal resource is distributed among the different budgetary projects. Agent n faces the con- straint that the other n - 1 agents extract fiscal resources as well and optimizes hisher profit by considering the actions of others. This reasoning implies hy- pothesis 2:
HYPOTHESIS 2. Budget dejicits andpublic debt are lower in a representative democracy with dejicit referenda than in a representative democracy with- out dejicit referenda.
7.4 An Econometric Model
All in all the arguments made above appear to indicate that direct democratic elements as well as a strong role of the finance minister reduce the possibilities of representatives incumng public debt. However, they do not give any insight into whether “top down” (strong finance minister) or “bottom up” (strong role of voters) budgetary procedures are more efficient in the reduction of public debt. In order to test this comparative relationship empirically we develop an econometric model inspired by the models of Roubini and Sachs (1989a, 1989b) and de Haan and Sturm (1994). The dependent variable is debt per capita.*’
As higher income may reduce the level of public debt, mean income is intro- duced as an explanatory variable. Due to lack of local GDP data, mean income is defined by total taxable income divided by the number of taxpayers. Thus, it also makes sense to normalize public debt by using the number of taxpayers instead of the number of inhabitants as the population measure of the size of a
21. We use public debt instead of deficits because debt is the accumulated result of fiscal policies of the past and may thus enable us to indicate the longer-run influences of budgetary institutions, although the data set lacks a time dimension.
169 Public Debt and Budgetary Procedures: Top Down or Bottom Up?
local community. This variable can itself also play a crucial role in the level of local public expenditure. However, its sign is ambiguous. On the one hand, more inhabitants will pay for public goods. This reduces cost per capita (tax- payer), and it should lead to a lower public debt per capita. On the other hand, due to economies of scale in their provision some public goods will be pro- vided only in agglomerations. In this case, the overall level of public expen- diture for the agglomeration might increase, and-ceteris paribus-public debt will rise.
Following Roubini and Sachs, the unemployment rate is included in the model. Higher unemployment might trigger higher public debt. The adverse shocks of high unemployment result in increasing deficits, and owing to the fact that net lending in booms rarely appears they also lead-in the long run- to a higher debt.
As pointed out above, the bequest motive as altruism between generations may not be sufficient to prevent the present generation of taxpayers from dis- tributing wealth from future taxpayers by incurring public debt. As Cukierman and Meltzer (1989) as well as Tabellini (1991) have pointed out, the bequest motive becomes weaker the larger the spread in the personal income and/or wealth distribution. This is in line with a hypothesis by Meltzer and Richard (198 l), who propose that the higher the ratio of average to median income, the higher the redistribution that is related to it. Thus, the higher this ratio is, the higher the relation between debt and income might be.
Additionally, the model contains some political variables. The first political variable that is included measures the strength of an executive government by introducing the number of coalition parties in the executive. Due to the fact that minority governments do not exist in Swiss municipalities, we avoid the queries made by Edin and Ohlsson (1991) with respect to the Roubini and Sachs coalition variable. As outlined above, the coalition variable is normally expected to have a positive sign; that is, the more political parties are involved in the executive, the higher the share of public debt. However, the existence of direct democratic decision-making rules at all Swiss government levels has led to grand coalitions in Switzerland. Although there is some variation between cantons and between municipalities, at least two of the three greatest political parties, often even all three, the SP (Social Democrats), the FDP (Liberals), and the CVP (Christian Democrats) are part of the executive. This kind of great consensus, called Konkordunz (concordance), renders the grand coalition rather normal. We thus would not expect this variable to have a significant impact. The second political variable follows the arguments of the partisan cycles models that left-wing parties are prone to incur a higher public debt. Thus, the share of left-wing parties in the executive should have a positive impact on the level of public debt.
Further political variables consist of the von Hagen indices on budgetary procedures. In contrast to the member countries of the EU, which were investi- gated by von Hagen (1992), only three of the five proposed items are available
170 Lars P. Feld and Gebhard Kirchgassner
for Swiss municipalities. To avoid further aggregation problems, these items are introduced separately.** Since a strong position of the secretary of finance in the budget process is supposed to reduce the possibility that the different spending branches in the executive will overuse the fiscal commons, the index of the structure of negotiations within government is expected to have a nega- tive sign. A strong secretary of finance would-ceteris paribus-reduce the level of public debt. A higher informativeness of the budget will reduce the time inconsistency problems mentioned by Alesina and Tabellini (1 988), the information problems pointed to by Persson and Svensson (1989), and the fiscal commons problem as well. Therefore, the respective index should have a nega- tive impact. Finally the index of the long-term planning constraint should also have a negative impact since it will also reduce time inconsistency problems.
The last political variable that is included in the model is a dummy variable for direct democracy. It takes on the value of 1 if the executive (or the parlia- ment) is controlled by the voters because of an obligatory referendum, an op- tional referendum, or a local assembly on the level of the budget deficit, and 0 otherwise. This holds for 87 of our observations (local municipalities). Be- cause of a budgetary referendum the fiscal commons problem is less severe. Deficit referenda lead to a lower level of public debt. Moreover, if voters are fiscally conservative, that is, if they weigh the future tax burden more heavily than the government and/or the parliament, the dummy variable for direct de- mocracy should have a negative impact on the amount of public debt.
Since debt-servicing costs hardly vary between Swiss municipalities, we cannot use interest rates or some other indicator of the “cost of the debt.”23 Instead, one might use the tax rate for the median taxpayer as an indicator of the price a citizen has to pay for the public good. The higher the tax rate, the lower the level of public debt should be. However, in the political process people or political decision makers decide not only the size of public debt, but about several fiscal instruments. Hence, the tax rate is not an exogenously given variable. Public debt is rather the long-run result of fiscal policies, where decisions about expenditure and its financing are made. In Swiss local commu- nities the latter consists of decisions about the tax rate and about revenue that is raised from other sources than taxes. This results in an (annual) surplus or deficit and finally in a certain amount of public debt. This implies, however, that we have a simultaneous decision in the budgetary process about (the planned values of) public debt, the tax rate, the share of own public revenue, and public expenditure.
22. Due to the large number of observations we do not have to aggregate the different indices to save degrees of freedom, as von Hagen (1992) had to do.
23. Although default risk may vary between different Swiss municipalities, neither public insti- tutions nor the Swiss banks provide any data on it. As Bernard Dafflon indicated to us, both may even not have any reliable data since he was asked by Swiss banks to conduct a default risk assess- ment of municipalities of various cantons. Furthermore, depreciation rates of public capital goods are legally fixed in the different cantons and vary between municipalities. However, these data are not available to us.

171 Public Debt and Budgetary Procedures: Top Down or Bottom Up?
Technically, the result is an econometric model with four equations that have to be estimated simultaneously. An estimation of the structural form is, how- ever, impossible, because we do not have the necessary instruments due to the pure cross-section design of our data set. On the other hand, as the interesting political variables are strongly exogenous-there has been, for example, no change in the constitutional structure during the years preceding our analysis- the reduced-form estimates might even be more interesting because they repre- sent the long-run effects of these variables. Thus, we estimate the reduced form of the system with the (logs of the) following variables:
Endogenous variables:
public debt per taxpayer tax rate for the median taxpayer share of own government revenue from total revenue public expenditure per taxpayer
Exogenous variables:
average taxable income unemployment rate number of taxpayers in the municipality ratio of average (mean) to median taxable income index of structure of negotiations within government index of informativeness of the budget index of long-term planning constraint a dummy variable that takes on the value of 1 if there is direct democratic decision making on the budget deficit and 0 otherwise share of leftist parties in the executive number of parties in the executive
We estimate this model using a Zellner-Aitken seemingly unrelated regression (SUR) with data for the 131 Swiss municipalities mentioned above for the year 1990.24 As the sizes of these municipalities are rather different, instead of using ordinary least squares, we perform a weighted regression, using the square root of the number of taxpayers as weight.
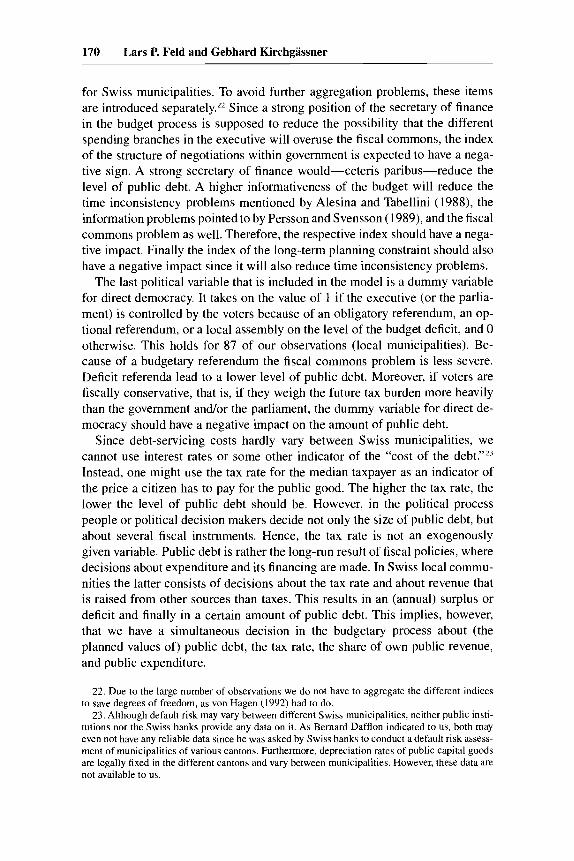
The results are given in table 7.6. The main result is that the dummy for direct democratic decision making has a strong negative influence on the amount of public debt. Moreover, it has also significant impacts on the other variables in the system: direct democracy leads-ceteris paribus-to a higher tax rate of the median taxpayer, a higher share of own public revenue, and
24. Due to the fact that all explanatory variables are included in all equations the simultaneous estimates of the coefficients are the same as single equation estimates; only the estimates for the variances-and, thus, also the r-statistics-differ.
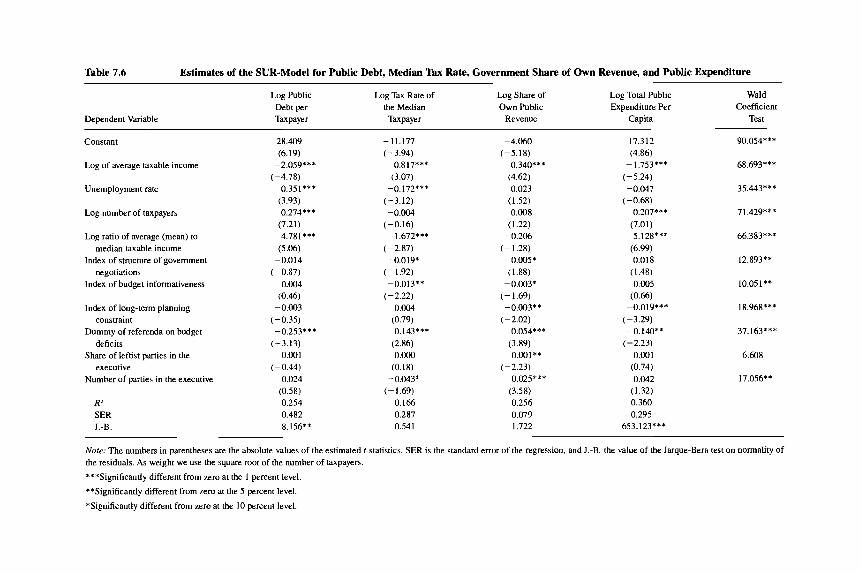
Table 7.6 Estimates of the SUR-Model for Public Debt, Median Tax Rate, Government Share of Own Revenue, and Public Expenditure
Dependent Variable
Log Public Log Tax Rate of Log Share of Log Total Public Debt per the Median Own Public Expenditure Per Taxpayer Taxpayer Revenue Capita
Wald Coefficient
Test
Constant
Log of average taxable income
Unemployment rate
Log number of taxpayers
Log ratio of average (mean) to median taxable income
Index of structure of government negotiations
Index of budget informativeness
Index of long-term planning
Dummy of referenda on budget
Share of leftist parties in the
Number of parties in the executive
constraint
deficits
executive
R' SER J.-B.
28.409 (6.19)
(-4.78) 0.35 1 ***
(3.93) 0.274***
(7.21) 4.781 ***
(5.06) -0.014
(-0.87) 0.004
(0.46) -0.003
(-0.35) -0.253***
(- 3.13) -0.001
(-0.44) 0.024
(0.58) 0.254 0.482 8.156**
-2.059***
-11.177 (-3.94)
0.817*** (3.07)
-0.172*** (- 3.12) -0.004
(-0.16) -1.672***
(-2.87) -0.019*
(- 1.92) -0.013**
(-2.22) 0.004
(0.79) 0.143***
(2.86) 0.OOO
(0.18) -0.043*
(- 1.69) 0.166 0.287 0.541
-4.060 (-5.18)
0.340*** (4.62) 0.023
(1.52) 0.008
(1.22) -0.206
(- 1.28) 0.005*
(1.88) -0.003*
(- 1.69)
(-2.02) 0.054***
(3.89) -0.001**
- 0.03 * *
(-2.23) 0.025***
(3.58) 0.256 0.079 1.722
17.312 (4.86)
-1.753*** (-5.24) -0.047
(-0.68) 0.207***
(7.01) 5.128***
(6.99) 0.018
( 1 . 4 ) 0.005
(0.66)
(-3.29) ~- 0.140**
(-2.23) 0.001
(0.74) 0.042
(1.32) 0.360 0.295
653.123***
-0.019***
90.054***
68.693***
35.443***
71.429***
66.383***
12.893**
10.051 **
18.968***
37.163***
6.608
17.056**
Note: The numbers in parentheses are the absolute values of the estimated 1-statistics. SER is the standard error of the regression, and J.-B. the value of the Jarque-Bera test on normality of the residuals. As weight we use the square root of the number of taxpayers.
***Significantly different from zero at the 1 percent level.
**Significantly different from zero at the 5 percent level.
*Significantly different from zero at the 10 percent level.
173 Public Debt and Budgetary Procedures: Top Down or Bottom Up?
lower public expenditure. In contrast to that, none of the other political vari- ables has any significant impact on the size of public debt. The von Hagen indices in particular do not influence the level of public debt at all.25 This does not imply, however, that these other variables do not have any impact on the whole system: Wald tests for the impact on all four equations show a lack of significance only in the case of the share of leftist parties. The number of par- ties in the executive has a positive impact on the share of own public revenue, a negative impact on the median tax rate, and no impact on public debt and expenditure. This result is pretty surprising because grand coalitions are the rule rather than the exception in Switzerland. The index of structure of negotia- tions within government has a negative impact on the tax rate and a positive one on the share of own public revenue; the index of informativeness of the budget has a negative impact on both the tax rate and the share of own public revenue, whereas the index of long-term planning constraint has a negative impact on the share of own public revenue as well as public expenditure.
The log of average taxable income has a strong negative impact on public debt: the richer a local community, the less it has to rely on debt financing. Richer communities will also-ceteris paribus-have higher tax rates for the median taxpayer, a higher share of own public revenues, and-astonishingly- lower public expenditure per capita.26 The higher unemployment, the higher is public debt and the lower the median tax rate. Neither the share of own public revenue nor public expenditure is significantly affected by unemployment. The population variable has a highly significant positive impact on government ex- penditure. Thus, the size of the community matters: A doubling of the number of taxpayers raises expenditure per capita by about one-fifth. This clearly re- flects that-possibly due to economies of scale-the range of public services is larger in large than in small communities. Because there is no corresponding influence on the revenue side, this also results in significantly higher debt. The Meltzermichard-Cukiermafleltzer variable also matters: the higher in- come inequality, the higher is public expenditure, the lower is the median tax rate, and, correspondingly, the higher is the public debt. Thus, a higher ratio of mean to median incomes induces higher intergenerational redistribution.
Given the fact that this estimate is a cross section for a share variable, the value of the multiple correlation coefficient might be acceptable: We can ex- plain about 25 percent of the variance of the dependent variable in the debt equation. On the other side, it also clearly indicates that the explanation is far from being perfect. The possible factors that have been proposed in the litera- ture and are included in this equation leave out some other, perhaps more im- portant factors. This holds in a similar way for the other three equations.
25. A Wald test of the three von Hagen indicators gives x2 = 3.424, of all five other political
26. Similar (astonishing) results with respect to public expenditure have been derived by Guen- variables x2 = 4.224. Both values are far away from any conventional significance level.
gant, Josselin, and Rocaboy (1997) for 36,143 French municipalities in 1991.

174 Lars P. Feld and Gebhard Kirchgassner
The Jarque-Bera statistic shows that the normality hypothesis has to be re- jected for the estimated residuals in the debt equation at the 5 percent and in the expenditure equation even at the 1 percent significance level. In the debt equation, this is due to one outlier, the town of Wettingen. In the expenditure equation, we see three outliers: Basel, Lugano, and Altdorf. If we exclude these four observations from our sample, the coefficients of the variables as well as their significance remain largely unchanged. This indicates that our results are robust with respect to these outliers.
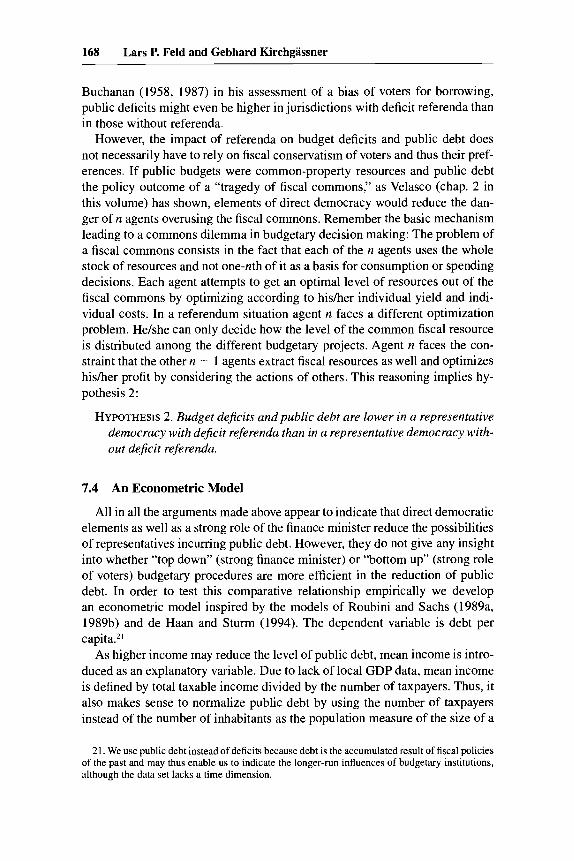
Up to now, we have only tested whether there is a significant difference with respect to direct and representative democracy in the constant term of our equation. However, it may well be the case that there are also differences in other coefficients that may lead to a significantly larger public debt in represen- tative versus direct democracies. This might even be the case if we cannot find a structural break in this eq~ation.~’ This can be checked if the model is first re-estimated for only the 84 communities with direct democracy and second the estimated coefficients are employed to simulate “theoretical” values for the 47 communities with representative democracy.28
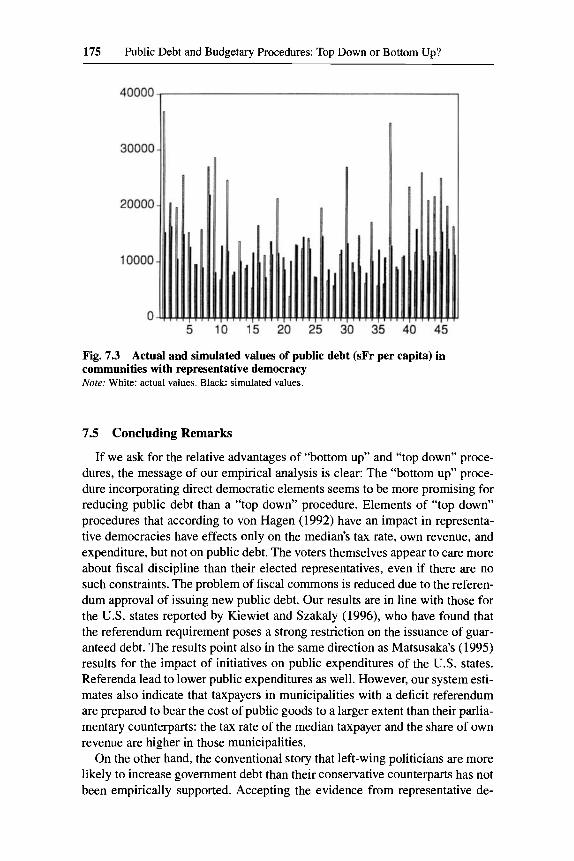
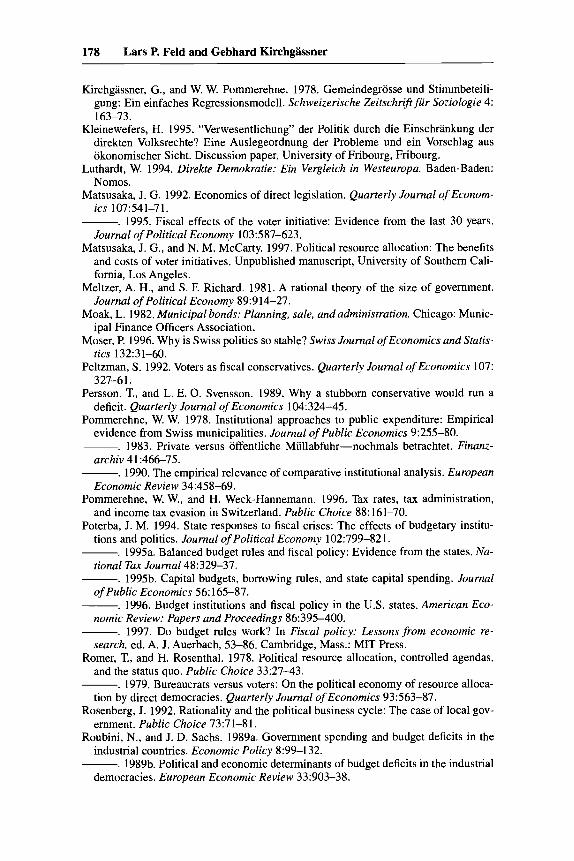
The result is shown in figure 7.3. For the communities with representative democracy, the actual public debt is higher than the theoretical values in 32 of 47 cases: if we assume that an increase is equally likely as a reduction of debt per capita ( p = q = O S ) , the probability that an increase occurs in not more than 15 municipalities is lower than 2 percent. The simulations show a (weighted) average public debt that is 45.2 percent lower than the actual one. If we calculate this in absolute terms, we get an average per capita debt that is lower by about sFr 10,000 than the actual one. Both of these values are strongly significantly different from zero.29 But this result is mainly due to the large weight of Zurich, which actually has a rather high debt per capita. Neverthe- less, if we exclude this observation, we still get the result that estimated average public debt is 23.8 percent lower than the actual one, and if we calculate this in absolute terms, we get a value of about sFr 4,500. Both of these values are again strongly significantly different from zero.3o Given an average local public debt of sFr 20,400 per capita in Switzerland, this difference is not only statisti- cally but also economically significant.
27. We performed Chow breakpoint tests for this system. If we test only for a break in the first equation within this system, we get a X2-statistic of 24.213 with 10 degrees of freedom, which is significantly different from zero at the 1 percent level. If we test for all coefficients in this equation without the constant term, the value of the test statistic is 13.922, which is not significant at the 10 percent level. If we test for a structural break in the whole system, we get x2 = 131.392 with 40 degrees of freedom including the constant terms and xz = 87.403 with 36 degrees of freedom excluding the constant terms. Both results are highly significant.
28. Three of the 87 municipalities in our sample with direct democracy on budget deficits have not provided us with an answer on the survey.
29. The corresponding t-statistics in a weighted regression of the difference between actual and simulated values are 6.29 for the logarithmic and 7.24 for the absolute values.
30. If the observation of Zurich is excluded, the corresponding t-statistics in a weighted regres- sion of the difference between actual and simulated values are 3.42 for the logarithmic and 4.87 for the absolute values.
175 Public Debt and Budgetary Procedures: Top Down or Bottom Up?
Fig. 7.3 Actual and simulated values of public debt (sFr per capita) in communities with representative democracy Note: White: actual values. Black simulated values.
7.5 Concluding Remarks
If we ask for the relative advantages of “bottom up” and “top down” proce- dures, the message of our empirical analysis is clear: The “bottom up” proce- dure incorporating direct democratic elements seems to be more promising for reducing public debt than a “top down” procedure. Elements of “top down” procedures that according to von Hagen (1992) have an impact in representa- tive democracies have effects only on the median’s tax rate, own revenue, and expenditure, but not on public debt. The voters themselves appear to care more about fiscal discipline than their elected representatives, even if there are no such constraints. The problem of fiscal commons is reduced due to the referen- dum approval of issuing new public debt. Our results are in line with those for the U.S. states reported by Kiewiet and Szakaly (1996), who have found that the referendum requirement poses a strong restriction on the issuance of guar- anteed debt. The results point also in the same direction as Matsusaka’s (1995) results for the impact of initiatives on public expenditures of the U.S. states. Referenda lead to lower public expenditures as well. However, our system esti- mates also indicate that taxpayers in municipalities with a deficit referendum are prepared to bear the cost of public goods to a larger extent than their parlia- mentary counterparts: the tax rate of the median taxpayer and the share of own revenue are higher in those municipalities.
On the other hand, the conventional story that left-wing politicians are more likely to increase government debt than their conservative counterparts has not been empirically supported. Accepting the evidence from representative de-
176 Lars P. Feld and Gebhard Kirchgassner
mocracies that supports this empirical finding, one might conclude that this typical “preference” of left-wing politicians, if it exists at all, can at least be neutralized by direct democratic rules: if the heads of the departments in local communities are directly elected by the citizens, as in most Swiss cities and towns, left-wing candidates might be forced to show the same or perhaps even stronger fiscal discipline to be (re-)elected by a majority of “nonleft” citizens than their centrist and right-wing competitors.
Our results, however, do not necessarily contradict the results of von Hagen (1992). One reason for the difference could be the small size of Switzerland as compared with most other European countries.31 Of more importance, how- ever, might be the fact that the Swiss direct democratic possibilities do not exist in the member countries of the EU. In the absence of such possibilities, it might well be the case that a budgetary “top down” procedure is to be pre- ferred as a second-best solution. With respect to the future fiscal constitution of the EU a first best solution should be more eligible. Some aspects von Hagen (1992) captures with his indices, like a strong position of the finance minister or the informativeness of the budget, might be helpful, but the main impetus should be on following the Swiss example and implementing direct democratic institutions in the European Union, as has been demanded, for example, by Bernholz (1990) or by Feld and Kirchgassner (1996).
In this context, referenda may also serve their purpose in increasing the ac- countability of policy decisions. As Besley and Case (1995) have shown, elec- toral accountability in a representative democracy leads to a more favorable fiscal position of U.S. continental states than do gubernatorial term limits. A potential referendum on budget deficits additionally induces representatives to take the preferences of a majority of voters into account and thus increases accountability of policy decisions. The fact that, according to the evidence of Bohn and Inman (1996), of the 36 U.S. states with a no-carry-over rule, the 15 whose supreme courts are appointed by the state’s legislature or governor have larger deficits than the 21 states whose supreme courts are elected directly by the voters, actually fits this conjecture pretty well.
References
Alesina, A,, and T. Bayoumi. 1996. The costs and benefits of fiscal rules: Evidence from the U S . states. NBER Working Paper no. 5614. Cambridge, Mass.: National Bureau of Economic Research.
Alesina, A,, and A. Drazen. 1991. Why are stabilizations delayed? A political economy model. American Economic Review 81:1170-88.
Alesina, A., and R. Perotti. 1995. The political economy of budget deficits. ZMF Staff Papers 42: 1-3 1 .
3 1. See von Hagen and Harden 1995 for such an argument
177 Public Debt and Budgetary Procedures: Top Down or Bottom Up?
Alesina, A., and G. Tabellini. 1988. Credibility and politics. European Economic Re-
Alt, J., and R. C. Lowry. 1994. Divided government and budget deficits: Evidence from
Barro, R. J. 1979. On the determination of public debt. Journal of Political Economy
Bernholz, P. 1990. Grundzuge einer Europiiischen Verfassung: Ein Bundesstaat mit be- grenzter Zentralgewalt. In Argumente zur Europapolitik, ed. Frankfurter Institut. No. 3, November, pp. 2-6.
Besley, T., and A. Case. 1995. Does electoral accountability affect economic policy choices? Evidence from gubernatorial term limits. Quarterly Journal of Economics
Bohn, H., and R. P. Inman. 1996. Balanced-budget rules and public deficits: Evidence from the U S . states. Carnegie-Rochester Conference Series on Public Policy 45:
Buchanan, J. M. 1958. Public principles ofpublic debt. Homewood, Ill.: Richard D.
. 1987. The constitution of economic policy. American Economic Review 77:
Buchanan, J. M., and R. E. Wagner. 1977. Democracy in dejicit: The political legacy of Lord Keynes. New York: Academic Press.
Cukierman, A., and A. H. Meltzer. 1989. A political theory of government debt and deficits in a neo-Ricardian framework. American Economic Review 79:713-32.
de Haan, J., and J.-E. Sturm. 1994. Political and institutional determinants of fiscal policy in the European Community. Public Choice 80: 157-72.
Drazen, A,, and V. Grilli. 1993. The benefits of Crises for Economic Reform. American Economic Review 83598-607.
Edin, P. A., and H. Ohlsson. 1991. Political determinants of budget deficits: Coalition effects vs. minority effects. European Economic Review 35: 1597-1603.
Eichengreen, B., and J. von Hagen. 1996. Fiscal policy and monetary union: Is there a trade-off between federalism and budgetary restrictions? NBER Working Paper no. 55 17. Cambridge, Mass.: National Bureau of Economic Research.
Feld, L. P. 1997. Exit, voice, and income taxes: The loyalty of voters. European Journal of Political Economy
Feld, L. P., and G. Kirc 96. Omne agens agendo perficitur: The economic meaning of subsidiarity. In Maastricht: Monetary constitution without afiscal consti- tution? ed. R. Holzmann, 195-226. Baden-Baden: Nomos.
Feld, L. P., and M. R. Savioz. 1997. Direct democracy matters for economic perfor- mance: An empirical investigation. Kyklos 50507-38.
Guengant, A., J.-M. Josselin, and Y. Rocaboy. 1997. Spillover effects and congestion under alternative models of public goods provision: Evidence from French munici- palities. Unpublished manuscript, University of Rennes.
view 32542-50.
the states. American Political Science Review 88:811-28.
871940-7 1.
110:769-98.
13-76.
Irwin.
243-50.
Hardin, G. 1968. The tragedy of the commons. Science 162:1234-38. Holcombe, R. G., 1980. An empirical test of the median voter model. Economic In-
quiry 18:260-74. Inman, R. P. 1982. The economic case for limits to government. American Economic
Review: Papers and Proceedings 72: 176-83. . 1997. Do balanced budget rules work? U.S. experience and possible lessons
for the EMU. In Quo vadis Europe? ed. H. Siebert, 307-32. Tubingen: Mohr (Sie- beck).
Kiewiet, D. R., and K. Szakaly. 1996. Constitutional limitations on borrowing: An anal- ysis of state bonded indebtedness. Journal of Law, Economics, and Organization 12:62-97.
178 Lars P. Feld and Gebhard Kirchgiissner
Kirchgassner, G., and W. W. Pommerehne. 1978. Gemeindegrosse und Stimmbeteili- gung: Ein einfaches Regressionsmodell. Schweizerische Zeitschrifi fur Soziologie 4:
Kleinewefers, H. 1995. “Verwesentlichung” der Politik durch die Einschrankung der direkten Volksrechte? Eine Auslegeordnung der Probleme und ein Vorschlag aus okonomischer Sicht. Discussion paper, University of Fribourg, Fribourg.
Luthardt, W. 1994. Direkte Demokratie: Ein Vergleich in Westeuropa. Baden-Baden: Nomos.
Matsusaka, J. G. 1992. Economics of direct legislation. Quarterly Journal of Econom- ics 107541-71.
. 1995. Fiscal effects of the voter initiative: Evidence from the last 30 years. Journal of Political Economy 103587-623.
Matsusaka, J. G., and N. M. McCarty. 1997. Political resource allocation: The benefits and costs of voter initiatives. Unpublished manuscript, University of Southern Cali- fornia, Los Angeles.
Meltzer, A. H., and S. F. Richard. 1981. A rational theory of the size of government. Journal of Political Economy 89:914-27.
Moak, L. 1982. Municipal bonds: Planning, sale, and administration. Chicago: Munic- ipal Finance Officers Association.
Moser, P. 1996. Why is Swiss politics so stable? Swiss Journal of Economics and Statis- tics 132:31-60.
Peltzman, S. 1992. Voters as fiscal conservatives. Quarterly Journal of Economics 107:
Persson, T., and L. E. 0. Svensson. 1989. Why a stubborn conservative would run a
Pommerehne, W. W. 1978. Institutional approaches to public expenditure: Empirical
. 1983. Private versus offentliche Mullabfuhr-nochmals betrachtet. Finanz-
. 1990. The empirical relevance of comparative institutional analysis. European
Pommerehne, W. W., and H. Weck-Hannemann. 1996. Tax rates, tax administration,
Poterba, J. M. 1994. State responses to fiscal crises: The effects of budgetary institu-
. 1995a. Balanced budget rules and fiscal policy: Evidence from the states. Na-
. 1995b. Capital budgets, borrowing rules, and state capital spending. Journal
. 1996. Budget institutions and fiscal policy in the U.S. states. American Eco-
. 1997. Do budget rules work? In Fiscal policy: Lessonsfrom economic re-
Romer, T., and H. Rosenthal. 1978. Political resource allocation, controlled agendas,
. 1979. Bureaucrats versus voters: On the political economy of resource alloca-
Rosenberg, J. 1992. Rationality and the political business cycle: The case of local gov-
Roubini, N., and J. D. Sachs. 1989a. Government spending and budget deficits in the
. 1989b. Political and economic determinants of budget deficits in the industrial
163-73.
327-61.
deficit. Quarterly Journal of Economics 104:324-45.
evidence from Swiss municipalities. Journal of Public Economics 9:255-80.
archiv 41 :466-75.
Economic Review 34:458-69.
and income tax evasion in Switzerland. Public Choice 88: 161-70.
tions and politics. Journal of Political Economy 102:799-821.
tional Tar Journal 48:329-37.
of Public Economics 56: 165-87.
nomic Review: Papers and Proceedings 86:395-400.
search, ed. A. J. Auerbach, 53-86. Cambridge, Mass.: MIT Press.
and the status quo. Public Choice 33:27-43.
tion by direct democracies. Quarterly Journal of Economics 93:563-87.
ernment. Public Choice 73:71-81.
industrial countries. Economic Policy 8:99-132.
democracies. European Economic Review 33:903-38.
179 Public Debt and Budgetary Procedures: Top Down or Bottom Up?
Shachar, R. 1993. Forgetfulness and the political cycles. Economics and Politics 5:
Tabellini, G. 1991. The politics of intergenerational redistribution. Journal of Political Economy 99:335-57.
Tabellini, G., and V. LaVia. 1989. Money, deficit, and public debt in the United States. Review of Economics and Statistics 71: 15-25.
Thurer, D. 1992. Schweizerische Verfassungsordnung vor der Herausforderung durch die Europiiische Integration. Zeitschrifrfir Schweizerisches Recht 1:73-106.
von Hagen, J. 1991. A note on the empirical effectiveness of formal fiscal restraints. Journal of Public Economics 44:99-110.
. 1992. Budgetary procedures and fiscal performance in the European Commu- nities. Economic Papers no. 96, Commission of the European Communities, October.
von Hagen, J., and B. Eichengreen. 1996. Federalism, fiscal restraints, and European Monetary Union. American Economic Review: Papers and Proceedings 86: 134-38.
von Hagen, J., and I. J. Harden. 1994. National budget processes and fiscal perfor- mance. European Economy: Reports and Studies 3:311-418.
. 1995. Budget processes and commitment to fiscal discipline. European Eco- nomic Review 39:771-79.
15-25.
This Page Intentionally Left Blank