
Public Corporations: 2019
10
4 August 2021 | 1100 hrs | 140/2021 Public Corporations: 2019 Definition Public corporations are government-controlled units established by Government, or by other public corporations, as market producers principally engaged in the production of goods, non-financial and financial services, and are classified in Non-Financial and Financial sectors rather than in the General Government sector. The methodologies followed in establishing whether an institution is classified as a public corporation are the European System of Accounts (ESA) 2010 and the Manual on Government Deficit and Debt (2019 Edition). For further information refer to methodological notes 1 and 2. In this news release, the focus is on the aggregate position of all public corporations excluding the Central Bank of Malta, a public financial corporation by nature. The reason for its exclusion is that since the Central Bank’s financial assets and liabilities are considerably higher than those of other public corporations, its inclusion would weigh too heavily on, and possibly distort, the overall results. However, for completeness, tables 5 and 6 show the statements of financial performance and position for all public corporations, including the Central Bank of Malta. A list of all the public corporations as at the end of 2019 is presented towards the end of the news release. Statement of financial performance In 2019, public corporations registered a surplus of €129.8 million, an increase of €36.1 million when compared to 2018. Total revenue of public corporations amounted to €1,598.2 million, €109.4 million higher than that registered in the previous year. The main source of revenue was the income generated from own operations, with a share of 89.4 per cent. Total expenditure of €1,468.4 million was recorded, an increase of €73.3 million in comparison to 2018. The primary expenditure items were Direct operating expenses and Wages and salaries, which accounted for 71.2 per cent and 16.6 per cent of total expenditure, respectively (Table 1). Taking the Central Bank of Malta into consideration, in 2019 the aggregate surplus of public corporations amounted to €161.3 million, resulting from revenue of €1,670.0 million and expenditure of €1,508.6 million (Table 5). Statement of financial position The total assets of public corporations stood at €4,307.5 million in 2019, with the predominant asset category being non-financial assets (68.1 per cent), rather than financial assets (31.9 per cent). All the asset sub- categories registered an increase compared to 2018, except for Stocks and inventories (-€1.3 million). On the other hand, financial liabilities totalled €2,627.9 million, consisting of Bank borrowings (42.9 per cent), Other liabilities (38.4 per cent) and Trade and other payables (18.6 per cent). Compared to 2018, Other liabilities and Trade and other payables increased by €500.5 million and €40.2 million respectively, while Bank borrowings decreased by €93.8 million (Table 2). Compared to 2018, the aggregate net worth of public corporations increased by €120.7 million, which resulted from a rise in total assets (€567.6 million) that outweighed the increase in total liabilities (€446.9 million). https://twitter.com/NSOMALTA/ https://www.facebook.com/nsomalta/ Compiled by: Public Finance Unit Contact us: National Statistics Office, Lascaris, Valletta VLT 2000 T. +356 25997219, E. [email protected] In 2019, public corporations registered a surplus of €129.8 million, equivalent to 1.0 per cent of GDP, and a net worth position of €1,679.6 million, amounting to 12.4 per cent of GDP.
Transcript of Public Corporations: 2019
1Kindly indicate source when quoting from this release.The advance release calendar may be consulted at www.nso.gov.mt
Issued by: Dissemination Unit, National Statistics Office, Lascaris, Valletta VLT 2000, Malta.T. +356 2599 7219 F. +356 2599 7205 E. [email protected]
4 August 2021 | 1100 hrs | 140/2021
Public Corporations: 2019
Definition
Public corporations are government-controlled units established by Government, or by other public corporations, as market producers principally engaged in the production of goods, non-financial and financial services, and are classified in Non-Financial and Financial sectors rather than in the General Government sector. The methodologies followed in establishing whether an institution is classified as a public corporation are the European System of Accounts (ESA) 2010 and the Manual on Government Deficit and Debt (2019 Edition). For further information refer to methodological notes 1 and 2.
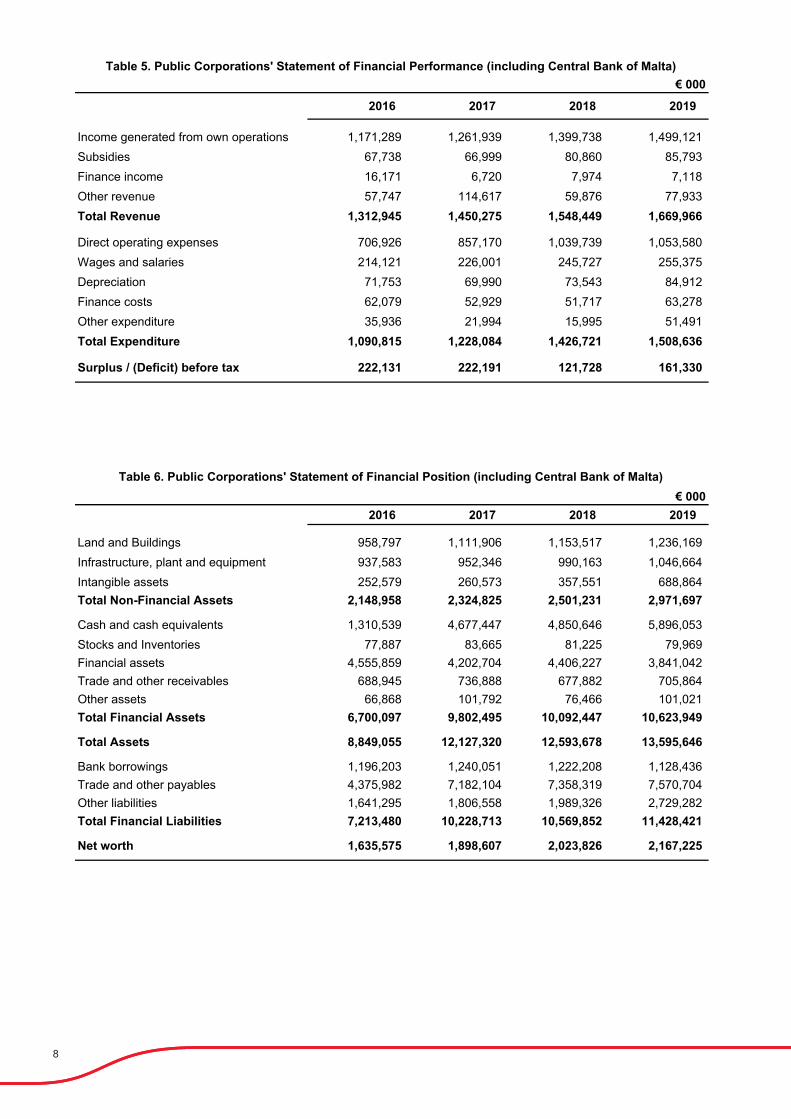
In this news release, the focus is on the aggregate position of all public corporations excluding the Central Bank of Malta, a public financial corporation by nature. The reason for its exclusion is that since the Central Bank’s financial assets and liabilities are considerably higher than those of other public corporations, its inclusion would weigh too heavily on, and possibly distort, the overall results. However, for completeness, tables 5 and 6 show the statements of financial performance and position for all public corporations, including the Central Bank of Malta. A list of all the public corporations as at the end of 2019 is presented towards the end of the news release.
Statement of financial performance
In 2019, public corporations registered a surplus of €129.8 million, an increase of €36.1 million when compared to 2018. Total revenue of public corporations amounted to €1,598.2 million, €109.4 million higher than that registered in the previous year. The main source of revenue was the income generated from own operations, with a share of 89.4 per cent. Total expenditure of €1,468.4 million was recorded, an increase of €73.3 million in comparison to 2018. The primary expenditure items were Direct operating expenses and Wages and salaries, which accounted for 71.2 per cent and 16.6 per cent of total expenditure, respectively (Table 1).
Taking the Central Bank of Malta into consideration, in 2019 the aggregate surplus of public corporations amounted to €161.3 million, resulting from revenue of €1,670.0 million and expenditure of €1,508.6 million (Table 5). Statement of financial position
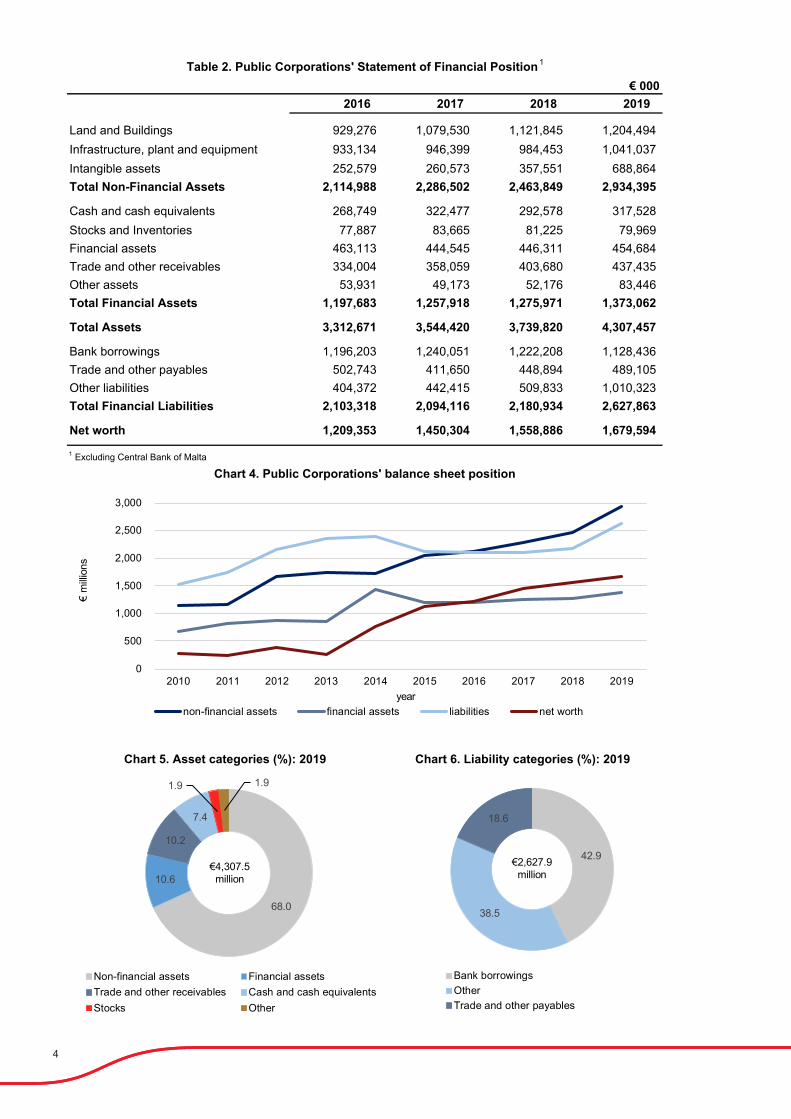
The total assets of public corporations stood at €4,307.5 million in 2019, with the predominant asset category being non-financial assets (68.1 per cent), rather than financial assets (31.9 per cent). All the asset sub-categories registered an increase compared to 2018, except for Stocks and inventories (-€1.3 million). On the other hand, financial liabilities totalled €2,627.9 million, consisting of Bank borrowings (42.9 per cent), Other liabilities (38.4 per cent) and Trade and other payables (18.6 per cent). Compared to 2018, Other liabilities and Trade and other payables increased by €500.5 million and €40.2 million respectively, while Bank borrowings decreased by €93.8 million (Table 2).
Compared to 2018, the aggregate net worth of public corporations increased by €120.7 million, which resulted from a rise in total assets (€567.6 million) that outweighed the increase in total liabilities (€446.9 million).
https://twitter.com/NSOMALTA/ https://www.facebook.com/nsomalta/
Compiled by: Public Finance Unit Contact us: National Statistics Office, Lascaris, Valletta VLT 2000 T. +356 25997219, E. [email protected]
In 2019, public corporations registered a surplus of €129.8 million, equivalent to 1.0 per cent of GDP, and a net worth position of €1,679.6 million, amounting to 12.4 per cent of GDP.
2
By 2019, the net worth of public corporations had reached €1,679.6 million1 (Table 2).
Taking into account all the public corporations, including the Central Bank of Malta, in 2019 the net worth stood at €2,167.2 million, resulting from the difference between total assets of €13,595.6 million and total liabilities of €11,428.4 million (Table 6). Analysis by NACE
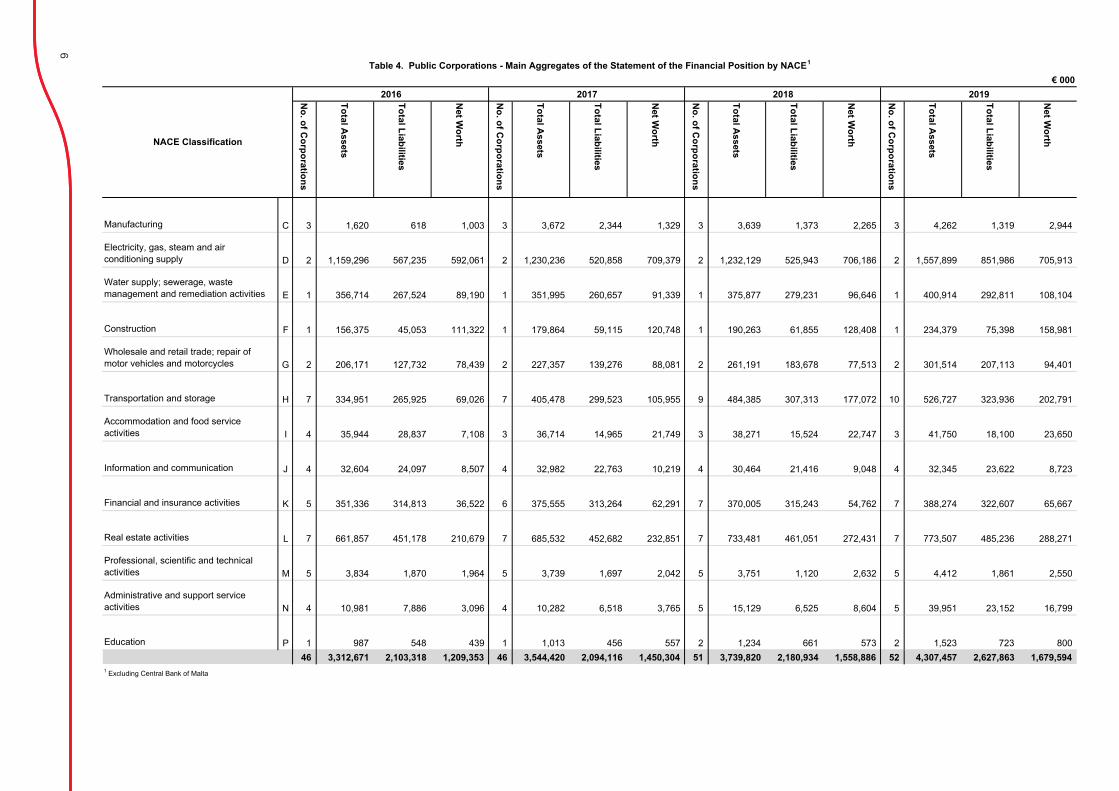
In 2019, there were 53 public corporations, including the Central Bank of Malta.
The sector with the highest revenue and expenditure of public corporations was the Electricity, gas, steam and air conditioning supply sector, with amounts of €480.5 million and €458.0 million, respectively. In this respect, other key sectors were the Transport and storage and Wholesale and retail trade sectors. The Construction sector recorded the highest surplus, which totalled €41.3 million, followed by the Electricity, gas, steam and air conditioning supply sector which registered a surplus of €22.5 million (Table 3).
The Electricity, gas, steam and air conditioning supply sector accounted for the highest share of public corporation assets and liabilities, which stood at 36.2 per cent and 32.4 per cent, respectively (Table 4).
1 The majority of increases in the non-financial assets and liabilities were largely driven by the introduction of the new accounting standard IFRS 16 ‘Leases’ across all public corporations.

3
€ 000
2016 2017 2018 2019
Income generated from own operations 1,077,875 1,192,014 1,341,472 1,429,234Subsidies 67,738 66,999 80,860 85,793Finance income 16,171 6,720 7,974 7,118Other revenue 56,609 113,499 58,515 76,075Total Revenue 1,218,393 1,379,232 1,488,822 1,598,221
Direct operating expenses 700,782 850,987 1,032,330 1,046,074Wages and salaries 203,826 214,774 234,351 243,405Depreciation 70,983 68,932 72,195 83,362Finance costs 62,079 52,929 51,717 63,278Other expenditure 15,033 4,419 4,501 32,272Total Expenditure 1,052,703 1,192,041 1,395,094 1,468,391
Surplus / (Deficit) before tax 165,691 187,191 93,728 129,8301 Excluding Central Bank of Malta
Chart 2. Revenue categories (%): 2019
Chart 1. Public Corporations' surplus / deficit
Table 1. Public Corporations' Statement of Financial Performance 1
Chart 3. Expenditure categories (%): 2019
0
250
500
750
1,000
1,250
1,500
1,750
2010 2011 2012 2013 2014 2015 2016 2017 2018 2019
€ m
illion
s
year
surplus / deficit total revenue total expenditure
89.4
5.4 4.8
0.4
Income from own operationsSubsidiesOtherFinance Income
€1.598.2million
71.2
16.6
5.74.3
2.2
Direct operating expenses Wages and salariesDepreciation Finance CostsOther
€1,468.4million
4
€ 000 2016 2017 2018 2019
Land and Buildings 929,276 1,079,530 1,121,845 1,204,494Infrastructure, plant and equipment 933,134 946,399 984,453 1,041,037Intangible assets 252,579 260,573 357,551 688,864Total Non-Financial Assets 2,114,988 2,286,502 2,463,849 2,934,395
Cash and cash equivalents 268,749 322,477 292,578 317,528Stocks and Inventories 77,887 83,665 81,225 79,969Financial assets 463,113 444,545 446,311 454,684Trade and other receivables 334,004 358,059 403,680 437,435Other assets 53,931 49,173 52,176 83,446Total Financial Assets 1,197,683 1,257,918 1,275,971 1,373,062
Total Assets 3,312,671 3,544,420 3,739,820 4,307,457
Bank borrowings 1,196,203 1,240,051 1,222,208 1,128,436Trade and other payables 502,743 411,650 448,894 489,105Other liabilities 404,372 442,415 509,833 1,010,323Total Financial Liabilities 2,103,318 2,094,116 2,180,934 2,627,863
Net worth 1,209,353 1,450,304 1,558,886 1,679,5941 Excluding Central Bank of Malta
Table 2. Public Corporations' Statement of Financial Position 1
Chart 4. Public Corporations' balance sheet position
Chart 5. Asset categories (%): 2019 Chart 6. Liability categories (%): 2019
0
500
1,000
1,500
2,000
2,500
3,000
2010 2011 2012 2013 2014 2015 2016 2017 2018 2019
€ m
illion
s
yearnon-financial assets financial assets liabilities net worth
68.0
10.6
10.2
7.4
1.9 1.9
Non-financial assets Financial assetsTrade and other receivables Cash and cash equivalentsStocks Other
€4,307.5million
42.9
38.5
18.6
Bank borrowingsOtherTrade and other payables
€2,627.9million

5
€ 000
No. of C
orporations
Total Revenue
Total Expenditure
Surplus/Deficit
No. of C
orporations
Total Revenue
Total Expenditure
Surplus/Deficit
No. of C
orporations
Total Revenue
Total Expenditure
Surplus/Deficit
No. of C
orporations
Total Revenue
Total Expenditure
Surplus/Deficit
Manufacturing C 3 3,173 3,169 4 3 8,245 7,743 502 3 9,766 8,324 1,443 3 10,308 9,250 1,058
Electricity, gas, steam and air conditioning supply D 2 377,893 312,990 64,903 2 456,560 396,981 59,579 2 464,082 440,431 23,651 2 480,544 458,044 22,500
Water supply; sewerage, waste management and remediation activities E 1 87,870 80,554 7,316 1 87,497 85,347 2,149 1 93,916 87,760 6,156 1 104,651 92,662 11,989
Construction F 1 9,996 1,733 8,263 1 24,160 1,662 22,499 1 15,674 1,935 13,739 1 52,260 10,927 41,332
Wholesale and retail trade; repair of motor vehicles and motorcycles G 2 242,957 219,353 23,604 2 245,873 229,000 16,873 2 318,825 319,772 -947 2 358,431 346,586 11,845
Transportation and storage H 7 293,480 286,758 6,722 7 338,219 315,567 22,652 9 377,909 371,548 6,362 10 366,751 357,211 9,541
Accommodation and food service activities I 4 16,321 6,766 9,556 3 8,676 6,910 1,766 3 8,257 6,227 2,029 3 8,046 6,168 1,878
Information and communication J 4 20,129 21,164 -1,035 4 26,444 24,848 1,596 4 19,584 20,695 -1,111 4 23,742 24,011 -268
Financial and insurance activities K 5 48,892 37,210 11,681 6 50,432 39,177 11,255 7 40,487 45,163 -4,676 7 60,600 56,574 4,027
Real estate activities L 7 65,567 33,564 32,003 7 81,770 34,655 47,115 7 74,559 37,807 36,751 7 64,044 49,361 14,683
Professional, scientific and technical activities M 5 2,000 518 1,481 5 687 545 142 5 1,468 548 920 5 1,260 567 692
Administrative and support service activities N 4 49,007 48,060 947 4 49,476 48,594 882 5 62,856 53,699 9,157 5 65,842 55,638 10,204
Education P 1 1,110 865 245 1 1,192 1,011 181 2 1,440 1,186 254 2 1,741 1,391 35046 1,218,393 1,052,703 165,691 46 1,379,232 1,192,041 187,191 51 1,488,822 1,395,094 93,728 52 1,598,221 1,468,391 129,830
1 Excluding Central Bank of Malta
Table 3. Public Corporations - Main Aggregates of the Statement of the Financial Performance by NACE 1
2019
NACE Classification
201820172016
6
€ 000
No. of C
orporations
Total Assets
Total Liabilities
Net W
orth
No. of C
orporations
Total Assets
Total Liabilities
Net W
orth
No. of C
orporations
Total Assets
Total Liabilities
Net W
orth
No. of C
orporations
Total Assets
Total Liabilities
Net W
orth
Manufacturing C 3 1,620 618 1,003 3 3,672 2,344 1,329 3 3,639 1,373 2,265 3 4,262 1,319 2,944
Electricity, gas, steam and air conditioning supply D 2 1,159,296 567,235 592,061 2 1,230,236 520,858 709,379 2 1,232,129 525,943 706,186 2 1,557,899 851,986 705,913
Water supply; sewerage, waste management and remediation activities E 1 356,714 267,524 89,190 1 351,995 260,657 91,339 1 375,877 279,231 96,646 1 400,914 292,811 108,104
Construction F 1 156,375 45,053 111,322 1 179,864 59,115 120,748 1 190,263 61,855 128,408 1 234,379 75,398 158,981
Wholesale and retail trade; repair of motor vehicles and motorcycles G 2 206,171 127,732 78,439 2 227,357 139,276 88,081 2 261,191 183,678 77,513 2 301,514 207,113 94,401
Transportation and storage H 7 334,951 265,925 69,026 7 405,478 299,523 105,955 9 484,385 307,313 177,072 10 526,727 323,936 202,791
Accommodation and food service activities I 4 35,944 28,837 7,108 3 36,714 14,965 21,749 3 38,271 15,524 22,747 3 41,750 18,100 23,650
Information and communication J 4 32,604 24,097 8,507 4 32,982 22,763 10,219 4 30,464 21,416 9,048 4 32,345 23,622 8,723
Financial and insurance activities K 5 351,336 314,813 36,522 6 375,555 313,264 62,291 7 370,005 315,243 54,762 7 388,274 322,607 65,667
Real estate activities L 7 661,857 451,178 210,679 7 685,532 452,682 232,851 7 733,481 461,051 272,431 7 773,507 485,236 288,271
Professional, scientific and technical activities M 5 3,834 1,870 1,964 5 3,739 1,697 2,042 5 3,751 1,120 2,632 5 4,412 1,861 2,550
Administrative and support service activities N 4 10,981 7,886 3,096 4 10,282 6,518 3,765 5 15,129 6,525 8,604 5 39,951 23,152 16,799
Education P 1 987 548 439 1 1,013 456 557 2 1,234 661 573 2 1,523 723 80046 3,312,671 2,103,318 1,209,353 46 3,544,420 2,094,116 1,450,304 51 3,739,820 2,180,934 1,558,886 52 4,307,457 2,627,863 1,679,594
1 Excluding Central Bank of Malta
Table 4. Public Corporations - Main Aggregates of the Statement of the Financial Position by NACE1
2019
NACE Classification
2016 2017 2018

7
Chart 7. Public Corporations' surplus / deficit by NACE industry: 2019
Chart 8. Public Corporations' net worth by NACE industry: 2019
0 50 100 150 200 250 300 350 400 450 500 550 600 650 700 750
PNMLKJI
HGFEDC
€ millions
NAC
E In
dust
ry
-2 3 8 13 18 23 28 33 38 43
P
N
M
L
K
J
I
H
G
F
E
D
C
€ millions
NAC
E In
dust
ry
8
€ 000
2016 2017 2018 2019
Income generated from own operations 1,171,289 1,261,939 1,399,738 1,499,121Subsidies 67,738 66,999 80,860 85,793Finance income 16,171 6,720 7,974 7,118Other revenue 57,747 114,617 59,876 77,933Total Revenue 1,312,945 1,450,275 1,548,449 1,669,966
Direct operating expenses 706,926 857,170 1,039,739 1,053,580Wages and salaries 214,121 226,001 245,727 255,375Depreciation 71,753 69,990 73,543 84,912Finance costs 62,079 52,929 51,717 63,278Other expenditure 35,936 21,994 15,995 51,491Total Expenditure 1,090,815 1,228,084 1,426,721 1,508,636
Surplus / (Deficit) before tax 222,131 222,191 121,728 161,330
€ 000 2016 2017 2018 2019
Land and Buildings 958,797 1,111,906 1,153,517 1,236,169Infrastructure, plant and equipment 937,583 952,346 990,163 1,046,664Intangible assets 252,579 260,573 357,551 688,864Total Non-Financial Assets 2,148,958 2,324,825 2,501,231 2,971,697
Cash and cash equivalents 1,310,539 4,677,447 4,850,646 5,896,053Stocks and Inventories 77,887 83,665 81,225 79,969Financial assets 4,555,859 4,202,704 4,406,227 3,841,042Trade and other receivables 688,945 736,888 677,882 705,864Other assets 66,868 101,792 76,466 101,021Total Financial Assets 6,700,097 9,802,495 10,092,447 10,623,949
Total Assets 8,849,055 12,127,320 12,593,678 13,595,646
Bank borrowings 1,196,203 1,240,051 1,222,208 1,128,436Trade and other payables 4,375,982 7,182,104 7,358,319 7,570,704Other liabilities 1,641,295 1,806,558 1,989,326 2,729,282Total Financial Liabilities 7,213,480 10,228,713 10,569,852 11,428,421
Net worth 1,635,575 1,898,607 2,023,826 2,167,225
Table 5. Public Corporations' Statement of Financial Performance (including Central Bank of Malta)
Table 6. Public Corporations' Statement of Financial Position (including Central Bank of Malta)

9
NACE code NACE code
AirMalta Aviation Services Ltd 52 Malta Development Bank 64
Air Malta plc 51 Malta Digital Hub Ltd 68
Automated Revenue Management Services Ltd (ARMS) 63 Malta Electronic Certification Services Ltd 63
Casma Ltd 68 Malta Financial Services Authority 66
Central Bank of Malta 64 Malta Freeport Coporation Ltd. 68
ClearFlowPlus Ltd 71 Malta Life Sciences Centre Ltd 68
D3 Power Generation Ltd 35 Malta Marketing Co. Ltd 73
Enemalta plc 35 Malta Stock Exchange Institute Ltd 85
Enemed Co. Ltd. 46 Malta Stock Exchange plc 66
Energy Service Centre Ltd 33 Malta University Consulting Ltd 85
Engineering Resources Ltd 78 Malta University Holding Co. Ltd 64
Gozo Channel (Operations) Ltd 50 Malta University Residence Ltd 55
Gozo Heliport Ltd 52 Mediterranean Conference Centre 82
Heritage Malta Services Ltd 68 Mediterranean Offshore Bunkering Co. Ltd 52
Indis Malta Ltd 68 Melita Transgas Co. Ltd 49
Institute of Foreign Direct Investment Studies Ltd 73 Milano Due Ltd 55
International Clean Energy Ltd 74 MPG Energy Services Ltd 19
International Energy Service Centre Ltd 33 MSX p.l.c. 64
Keys Security Services Ltd 80 Petromal Co. Ltd 47
KM Holdings Ltd 64 Public Broadcasting Services Ltd. 60
Kordin Grain Terminal Co. Ltd 52 Transport Malta 52
Libyan Maltese Investment Co Ltd 64 Malta University Broadcasting Ltd 60
Malita Investments Plc 41 Vault Finance Ltd 65
Malpro Ltd 68 Vivaldi Hotel (Operations) Ltd 55
Malta Air Traffic Services Ltd 52 Water Services Corporation 36
Malta Air Travel Ltd (a.k.a Malta Med Air Ltd) 51 World Aviation Group Ltd 79
Malta Business Registry 82
Note: Companies that are in the process of dissolution or have been struck off do not feature in this list.
List of Public Corporations as at 31 December 2019

10
Methodological Notes
1.
2.
3.
4.
5.
6.
7.
8. A detailed news release calendar is available at:https://nso.gov.mt/en/News_Releases/Release_Calendar/Pages/News-Release-Calendar.aspx
References to this news release are to be cited appropriately.
This release presents data on public corporations in accordance with the methodology defined in the conceptual referenceframework of the Manual on Government Deficit and Debt (2019 edition), which is in turn based on the European System ofAccounts (ESA 2010). This compliance with the reference framework allows for the international comparability of the data.
A number of criteria, etablished in the Manual on Government Deficit and Debt, determine whether a unit is controlled byGovernment, based on the level of Government control:
The data sources used to compile this news release are the following, ranked by order of preference:
Data on individual public corporations is provided by NSO to Eurostat on an annual basis in a dedicated Questionnaire onGovernment-controlled entities classified outside the General Government sector.
The Public Sector consists of all the institutional units within the General Government and Public Corporations sectors.Although the formation of both sectors is done in accordance with the same established methodologies, the data cannot beaggregated to form the Public Sector, as the data for the General Government is in accordance with ESA 2010 rules, whilethe data for the public corporations is in line with business accounts.
- Business accounts - audited financial statements that are prepared in accordance with the InternationalFinancialReportingStandards (IFRS).- Financial Data Reporting System (FDRS) templates - some public corporations report their financial data on the MinistryofFinance Financial Data Reporting System. - Estimates - Used in the absence of the two data sources above.
i. Rights to appoint, remove, approve or veto a majority of officers, board of directors, etc.ii. Rights to appoint, veto or remove a majority of appointments for key committees (or sub-committees) of the entity havinga decisive role on key factors of its general policy.iii. Ownership of the majority of voting interest.iv. Rights to appoint, veto or remove key personnel.v. Rights under special shares and options.vi. Rights to control via contractual agreements.
The data contained in this release may be revised. Figures may not add up due to rounding.
- Public Units in liquidation- Public hospitals, schools, TV and radio broadcasting- Units engaged in financial activities- Special purpose entities
- Government debt management offices
- Public head offices, public holding companies and their subsidiaries- Restructuring and privatisation agencies- Market regulatory bodies and professional associations- Entities having the features of captive financial institutions
Public Corporations' data between the years 2010-2015 can be found in the excel version of this news release.
a. Quantitative Test: The market/non-market test. If sales cover less than 50 per cent of the production costs (intermediateconsumption, compensation of employees, consumption of fixed capital and net interest charge), the unit is classified insidethe General Government sector.
b. Qualitative Test: Other criteria for specific units in particular areas of activity are also taken in consideration and need tobe applied accordingly:
- Units that sell their output only to the Government
vii. Rights to control from agreement/permission to borrow.viii. Control via excessive regulation.
The first three criteria are sufficient to determine government control, however if inconclusive, the other criteria areconsidered.
To determine whether the government-controlled unit is to be classified inside the General Government sector or not, thefollowing tests are applied:


