Azuki Bean Cultivation in Hokkaido and Breeding at Tokachi ...
Public Bean Breeding in Ontario Research Update
AAFC/U of G Bean Breeding ProgramOPCC Research Day; March 23, 2012
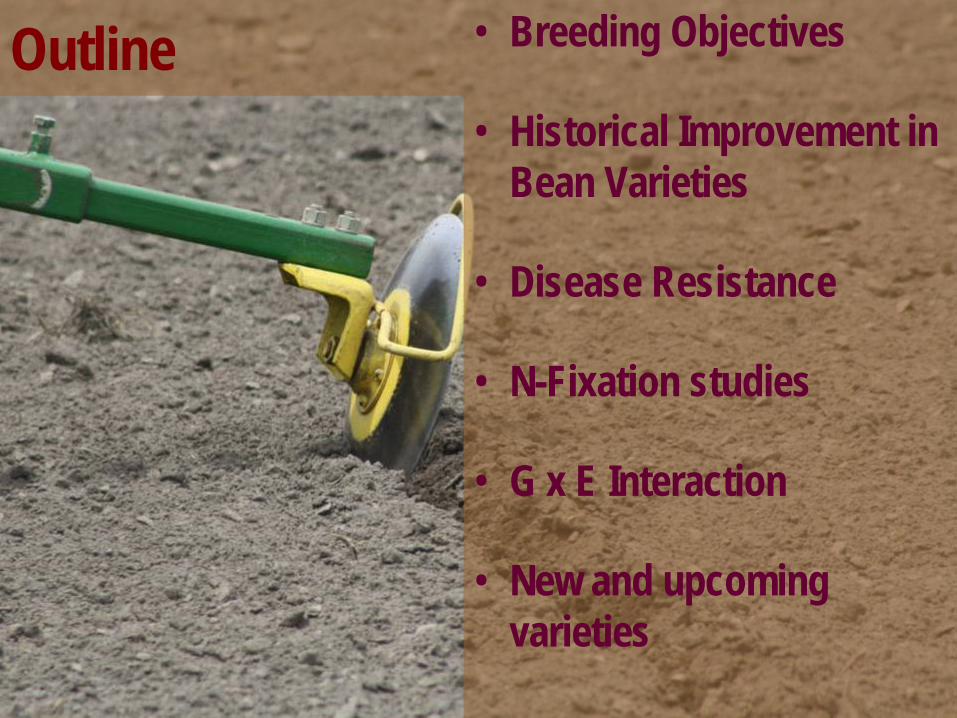
Outline • Breeding Objectives
• Historical Improvement in Bean Varieties
• Disease Resistance
• N-Fixation studies
• G x E Interaction
• New and upcoming varieties
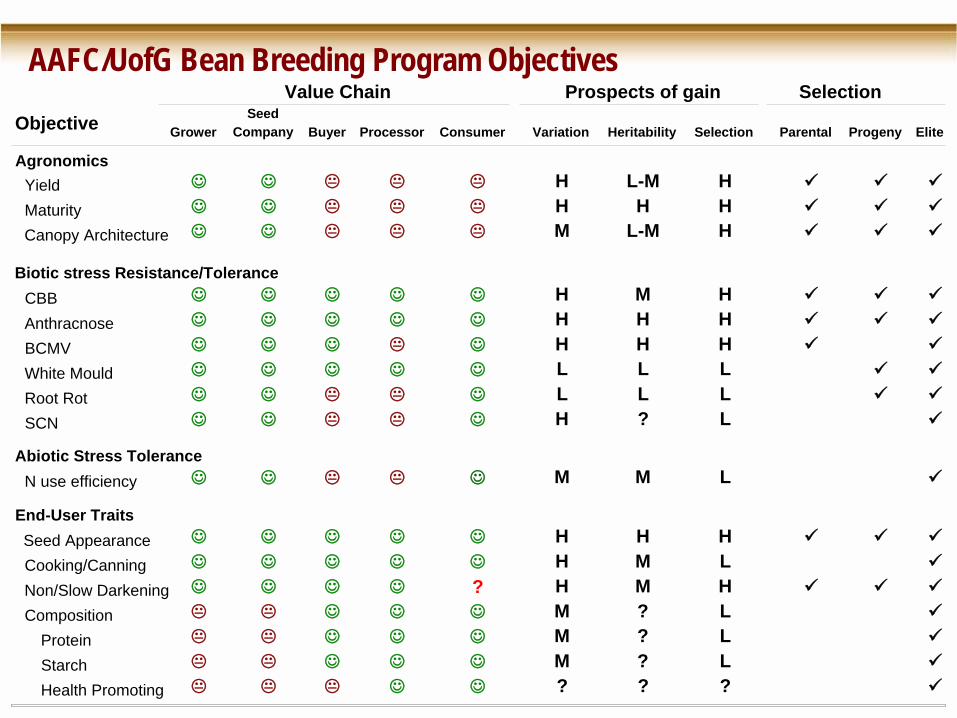
AAFC/UofG Bean Breeding Program Objectives
Objective GrowerSeed
Company Buyer Processor Consumer Variation Heritability Selection Parental Progeny Elite
AgronomicsYield H L-M H
Maturity H H H
Canopy Architecture M L-M H
Biotic stress Resistance/ToleranceCBB H M H
Anthracnose H H H
BCMV H H H
White Mould L L L
Root Rot L L L
SCN H ? L
Abiotic Stress ToleranceN use efficiency M M L
End-User TraitsSeed Appearance H H H
Cooking/Canning H M L
Non/Slow Darkening ? H M H
Composition M ? L
Protein M ? L
Starch M ? L
Health Promoting ? ? ?
Value Chain Prospects of gain Selection
CONTRIBUTION OF GENETIC IMPROVEMENT IN YIELD INCREASE AND DISEASE RESISTANCE IN NAVY BEANS RELEASED IN CENTRAL CANADA
SINCE 1930’s.
Navabi, A., A. Burt, T. Rupert, T. H. Smith, C. Gillard and K. P. Pauls
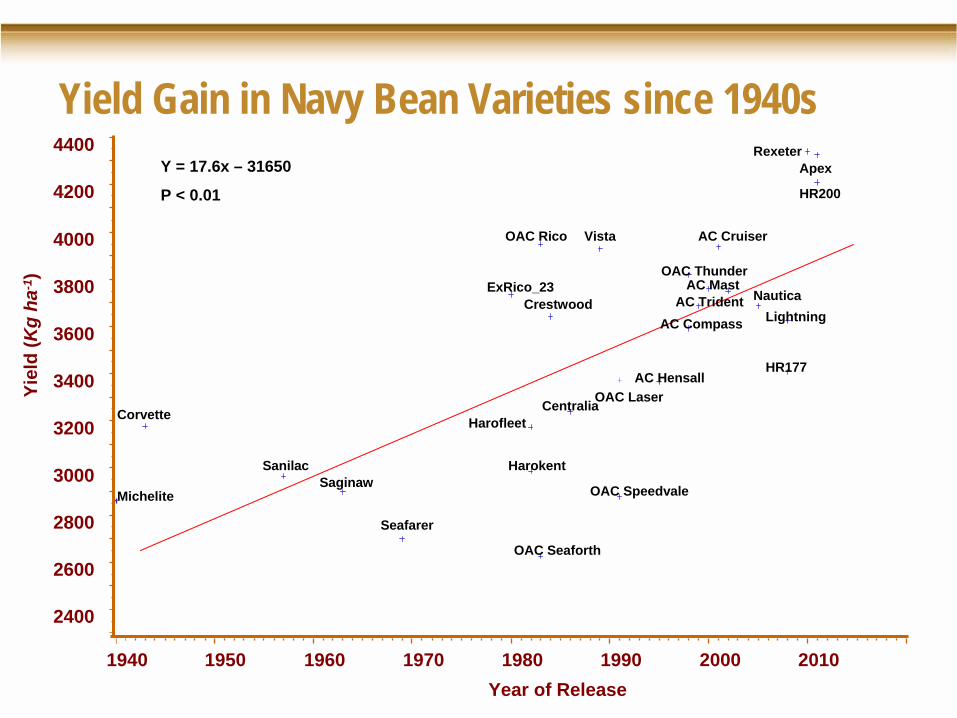
Yield Gain in Navy Bean Varieties since 1940s
Yiel
d (K
g ha
-1)
2400
2600
2800
3000
3200
3400
3600
3800
4000
4200
4400
Year of Release1940 1950 1960 1970 1980 1990 2000 2010
AC Compass
AC Cruiser
AC Hensall
AC Mast AC Trident
Centralia Corvette
Crestwood ExRico_23
HR177
Apex
HR200
Harofleet
Harokent
Lightning
Michelite
Nautica
Rexeter
OAC Laser
OAC Rico
OAC Seaforth
OAC Speedvale
OAC Thunder
Saginaw Sanilac
Seafarer
Vista
Y = 17.6x – 31650
P < 0.01
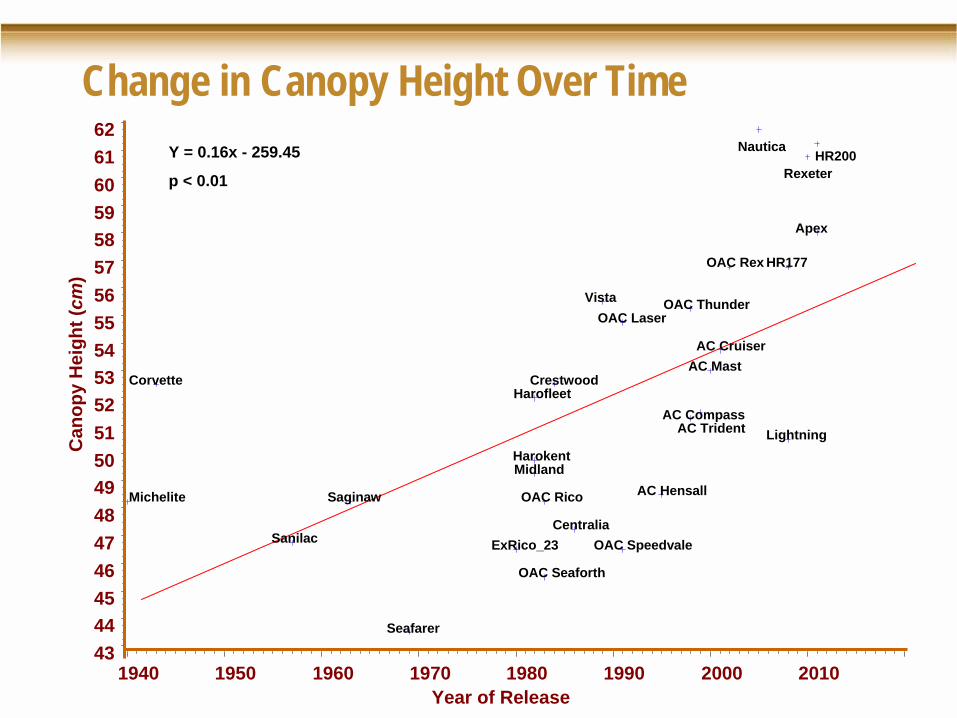
Change in Canopy Height Over TimeC
anop
y H
eigh
t (cm
)
Year of Release
4344454647484950515253545556575859606162
1940 1950 1960 1970 1980 1990 2000 2010
AC Compass
AC Cruiser
AC Hensall
AC Mast
AC Trident
Centralia
Corvette Crestwood
ExRico_23
HR177
Apex
HR200
Harofleet
HarokentLightning
Michelite
Midland
Nautica
Rexeter
OAC Laser
OAC Rex
OAC Rico
OAC Seaforth
OAC Speedvale
OAC Thunder
Saginaw
Sanilac
Seafarer
Vista
Y = 0.16x - 259.45
p < 0.01
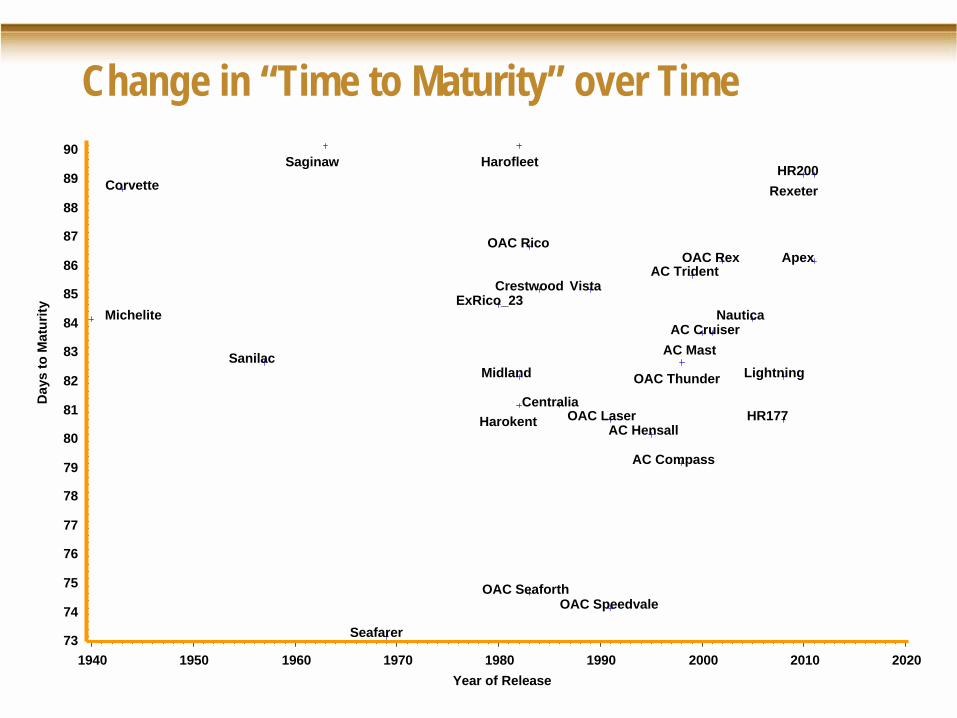
Change in “Time to Maturity” over TimeD
ays
to M
atur
ity
73
74
75
76
77
78
79
80
81
82
83
84
85
86
87
88
89
90
Year of Release1940 1950 1960 1970 1980 1990 2000 2010 2020
AC Compass
AC Cruiser
AC Hensall
AC Mast
AC Trident
Centralia
Corvette
Crestwood ExRico_23
HR177
Apex
HR200 Harofleet
Harokent
Lightning
Michelite
Midland
Nautica
Rexeter
OAC Laser
OAC Rex OAC Rico
OAC Seaforth OAC Speedvale
OAC Thunder
Saginaw
Sanilac
Seafarer
Vista
CB
B S
core
(0-5
)
0
1
2
3
4
5
Year of Release
1940 1950 1960 1970 1980 1990 2000 2010 2020
Michelite
Corvette
Sanilac
Saginaw
Seafarer
ExRico23Harofleet
Harokent
Midland
OAC Rico
Seaforth
Crestwood
CentraliaVista
Laser
Speedvale
Hensall
Compass
Thunder
TridentAC Mast
Cruiser
OAC Rex
Nautica
Lightning
HR177
Apex
HR200Rexeter
OAC 09-4
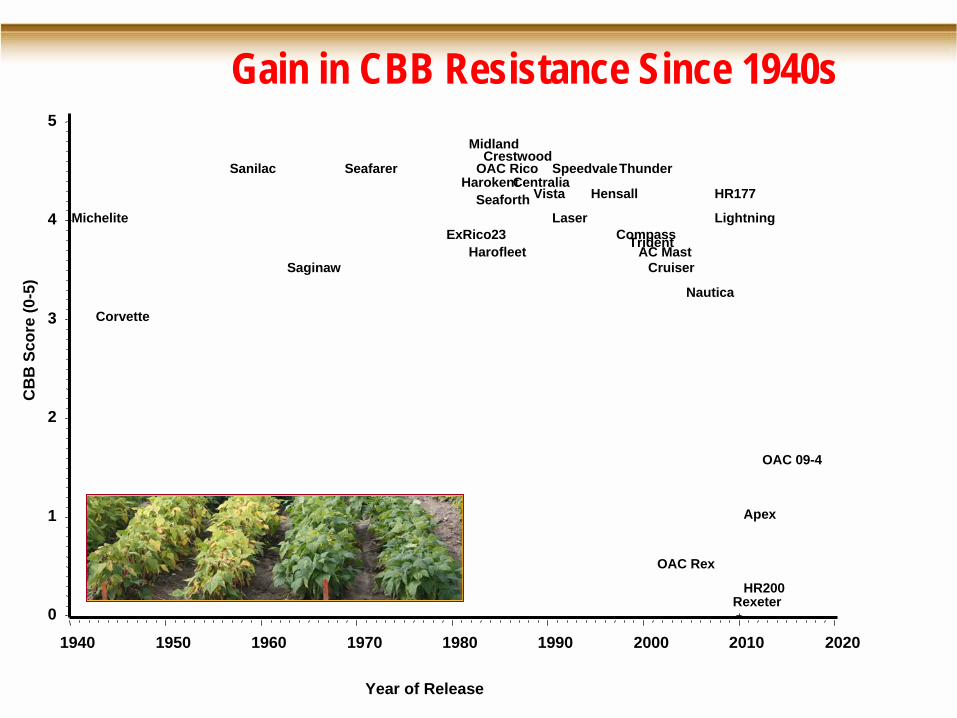
Gain in CBB Resistance Since 1940s
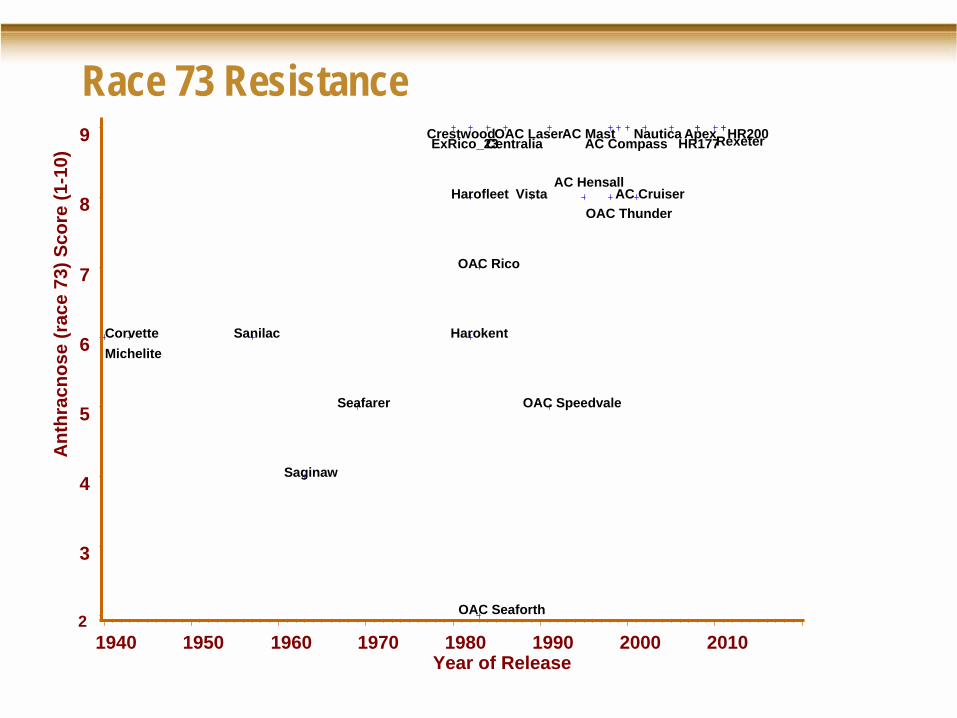
Race 73 ResistanceA
nthr
acno
se (r
ace
73) S
core
(1-1
0)
2
3
4
5
6
7
8
9
Year of Release1940 1950 1960 1970 1980 1990 2000 2010
AC Compass
AC Cruiser AC Hensall
AC Mast Centralia
Corvette
Crestwood ExRico_23 HR177
Apex HR200
Harofleet
HarokentMichelite
NauticaOAC Laser
OAC Rico
OAC Seaforth
OAC Speedvale
OAC Thunder
Saginaw
Sanilac
Seafarer
Vista
Rexeter
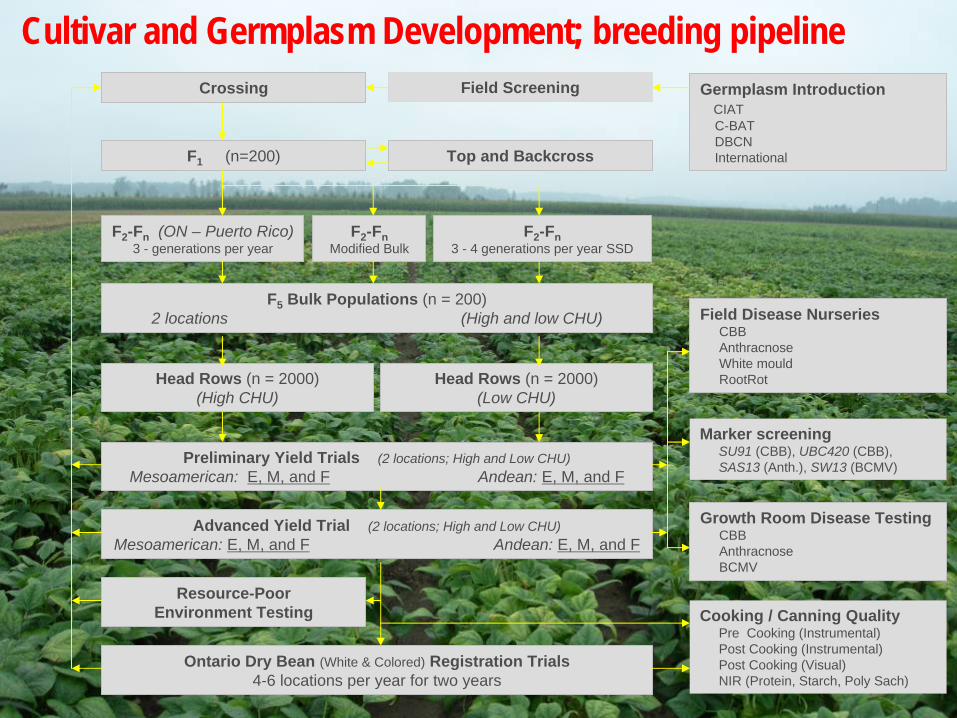
Cultivar and Germplasm Development; breeding pipelineCrossing
Head Rows (n = 2000) (Low CHU)
F1 (n=200) Top and Backcross
F2 -Fn (ON – Puerto Rico)3 - generations per year
F2 -FnModified Bulk
F5 Bulk Populations (n = 200) 2 locations (High and low CHU)
Preliminary Yield Trials (2 locations; High and Low CHU)Mesoamerican: E, M, and F Andean: E, M, and F
Advanced Yield Trial (2 locations; High and Low CHU)Mesoamerican: E, M, and F Andean: E, M, and F
Ontario Dry Bean (White & Colored) Registration Trials4-6 locations per year for two years
F2 -Fn3 - 4 generations per year SSD
Germplasm Introduction CIAT C-BATDBCNInternational
Cooking / Canning Quality Pre Cooking (Instrumental)Post Cooking (Instrumental)Post Cooking (Visual)NIR (Protein, Starch, Poly Sach)
Marker screeningSU91 (CBB), UBC420 (CBB), SAS13 (Anth.), SW13 (BCMV)
Resource-PoorEnvironment Testing
Field Screening
Head Rows (n = 2000) (High CHU)
Field Disease NurseriesCBBAnthracnoseWhite mouldRootRot
Growth Room Disease TestingCBBAnthracnoseBCMV
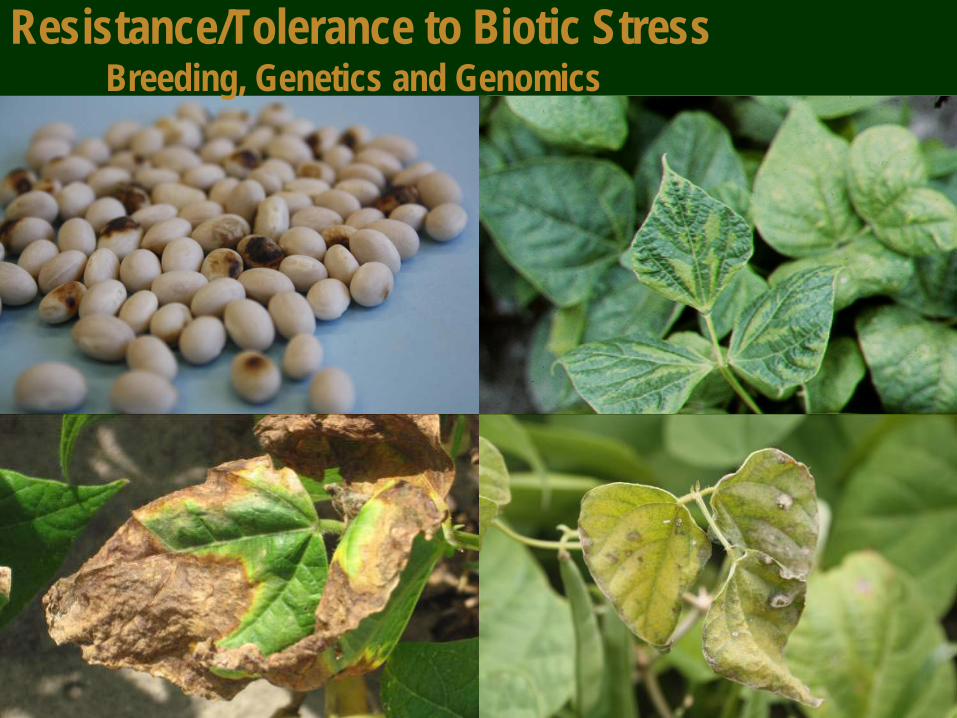
Resistance/Tolerance to Biotic Stress Breeding, Genetics and Genomics
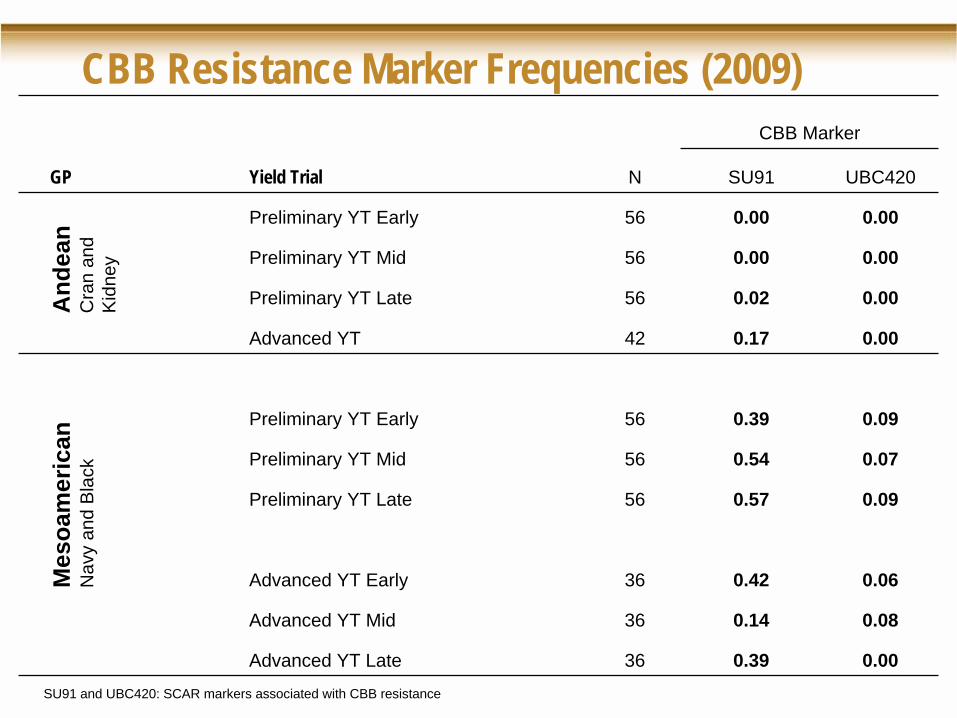
CBB Resistance Marker Frequencies (2009) CBB Marker
GP Yield Trial N SU91 UBC420
Preliminary YT Early 56 0.00 0.00
Preliminary YT Mid 56 0.00 0.00
Preliminary YT Late 56 0.02 0.00
Advanced YT 42 0.17 0.00
Preliminary YT Early 56 0.39 0.09
Preliminary YT Mid 56 0.54 0.07
Preliminary YT Late 56 0.57 0.09
Advanced YT Early 36 0.42 0.06
Advanced YT Mid 36 0.14 0.08
Advanced YT Late 36 0.39 0.00
And
ean
Cra
nan
d K
idne
y
Mes
oam
eric
anN
avy
and
Bla
ck
SU91 and UBC420: SCAR markers associated with CBB resistance
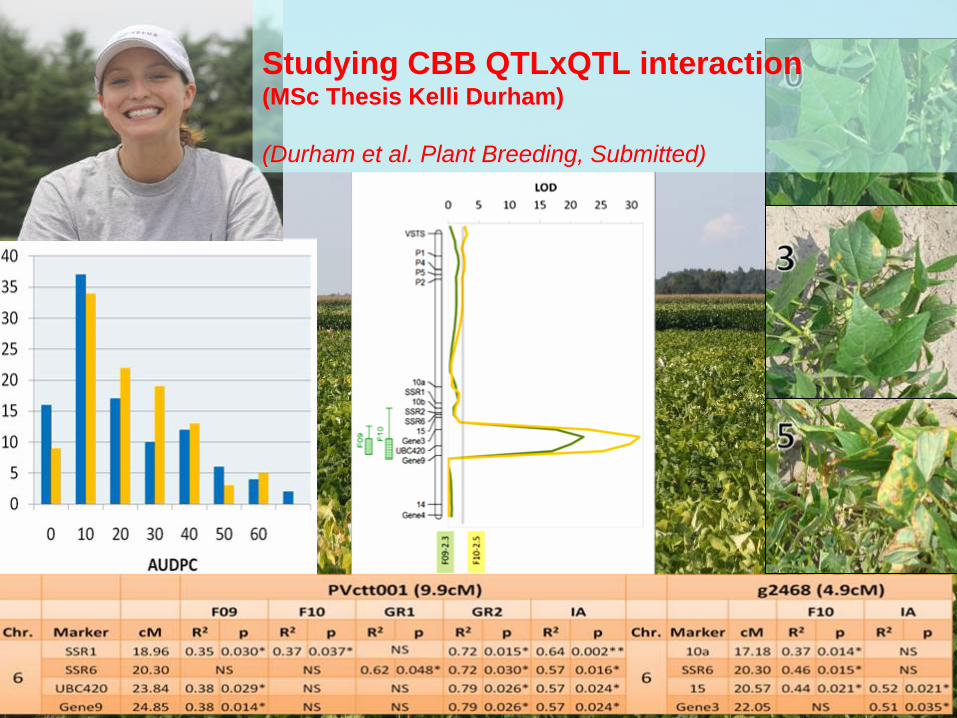
Studying CBB QTLxQTL interaction (MSc Thesis Kelli Durham)
(Durham et al. Plant Breeding, Submitted)
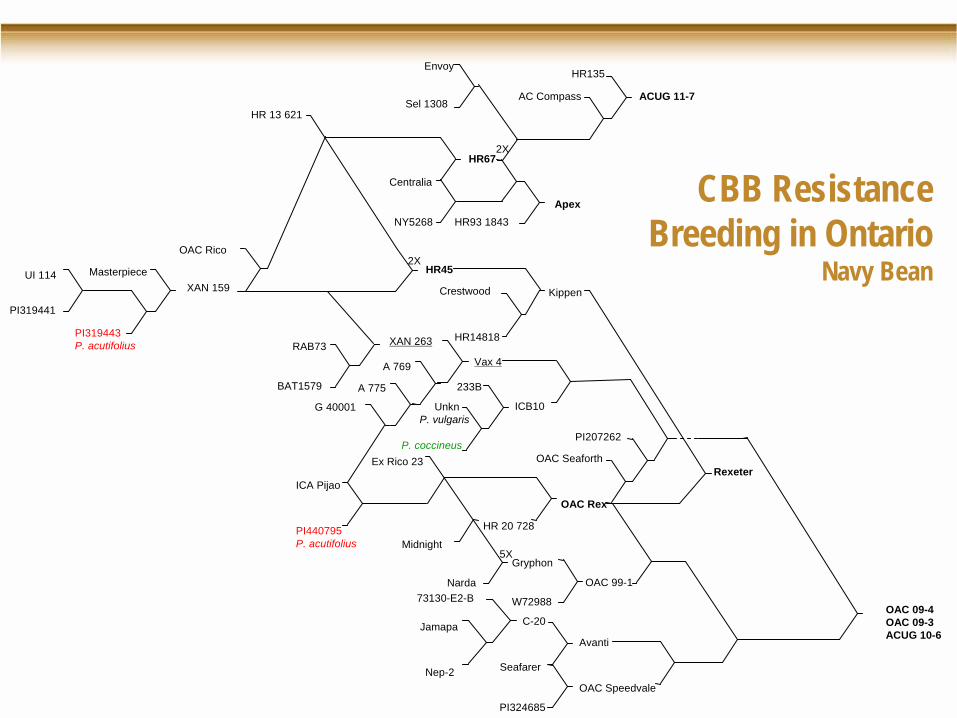
CBB Resistance Breeding in Ontario
Navy BeanXAN 159
Masterpiece
PI319443P. acutifolius
PI319441
UI 114
OAC Rico
HR 13 621
Centralia
HR67
NY5268 HR93 1843
Apex
ICA Pijao
PI440795P. acutifolius Midnight
HR 20 728
OAC Rex
Ex Rico 23
G 40001
A 775
A 769
XAN 263
Vax 4RAB73
BAT1579
HR452X
Avanti
Seafarer
C-20Jamapa
73130-E2-B
Nep-2
Crestwood
HR14818
Kippen
Rexeter
Narda
5XGryphon
W72988
OAC 99-1
PI324685
OAC Speedvale
ICB10
PI207262
OAC Seaforth
233B
UnknP. vulgaris
P. coccineus
OAC 09-4OAC 09-3ACUG 10-6
Envoy
Sel 1308
2X
AC Compass
HR135
ACUG 11-7
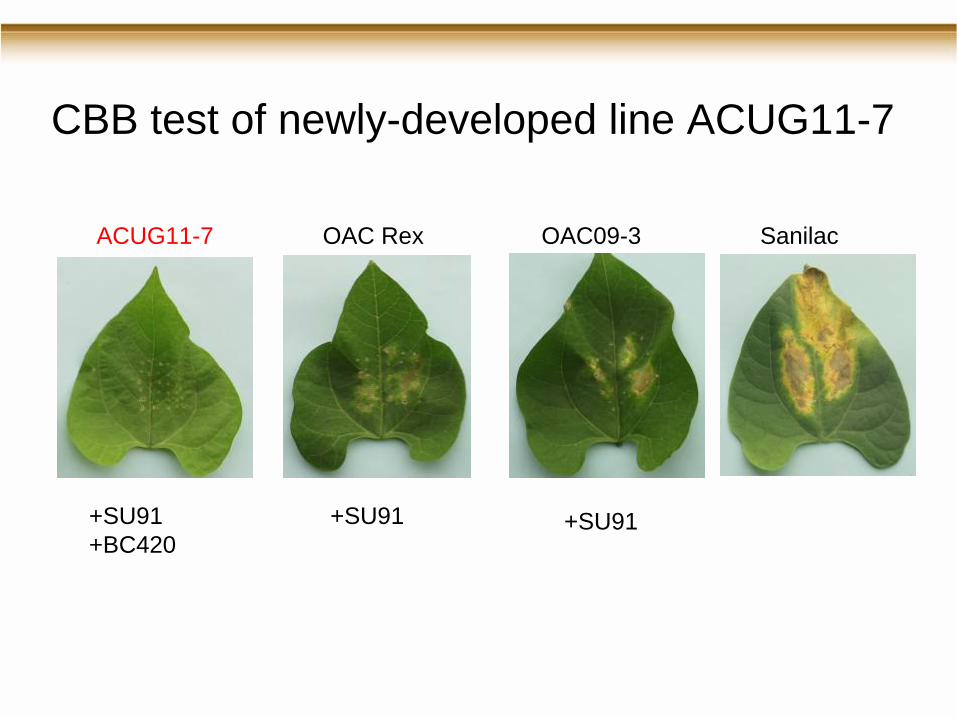
CBB test of newly-developed line ACUG11-7
ACUG11-7 OAC Rex OAC09-3 Sanilac
+SU91+BC420
+SU91 +SU91
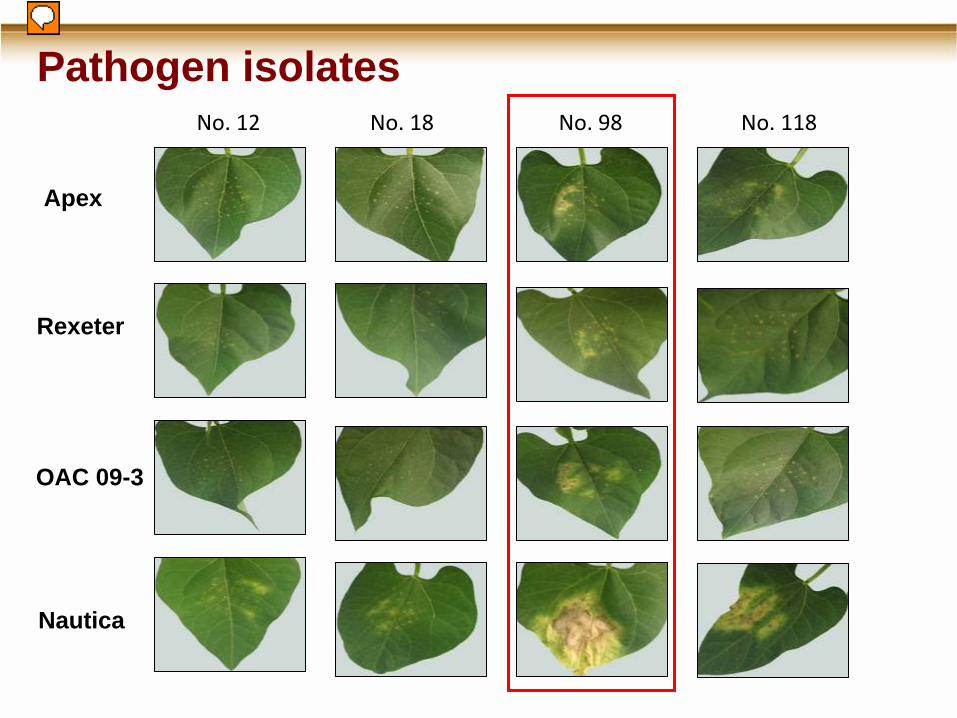
Pathogen isolatesNo. 12 No. 18 No. 118No. 98
Nautica
OAC 09-3
Apex
Rexeter
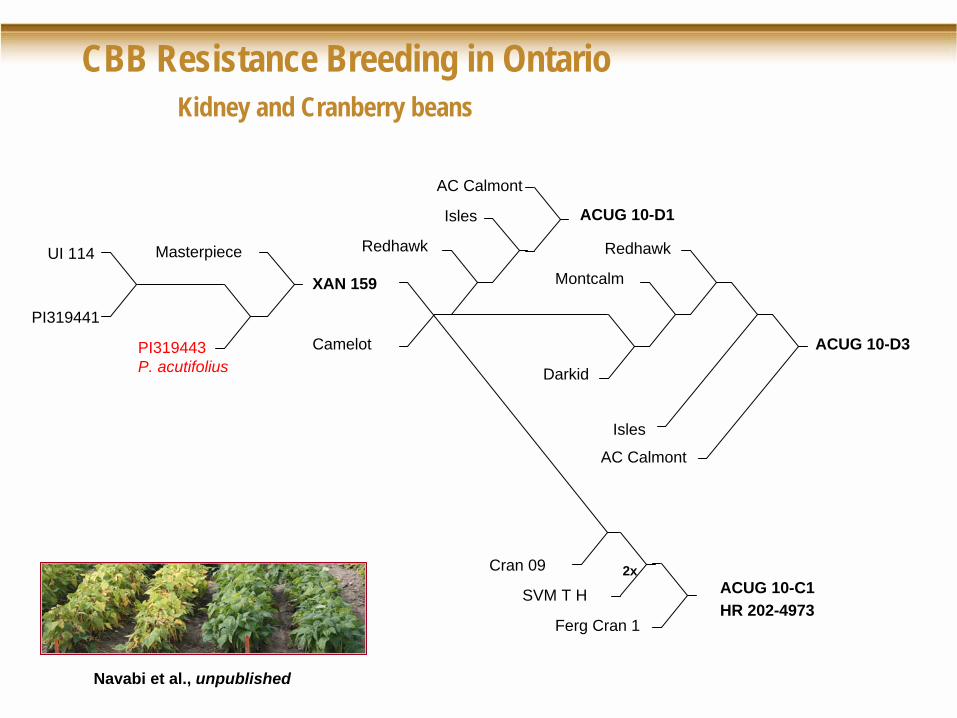
CBB Resistance Breeding in Ontario Kidney and Cranberry beans
PI319441
UI 114
XAN 159
Masterpiece
PI319443P. acutifolius
Camelot
Redhawk
Isles
AC Calmont
ACUG 10-D1
Darkid
Montcalm
Redhawk
Isles
AC Calmont
ACUG 10-D3
ACUG 10-C1
Ferg Cran 1
SVM T H
Cran 09
HR 202-4973
2x
Navabi et al., unpublished
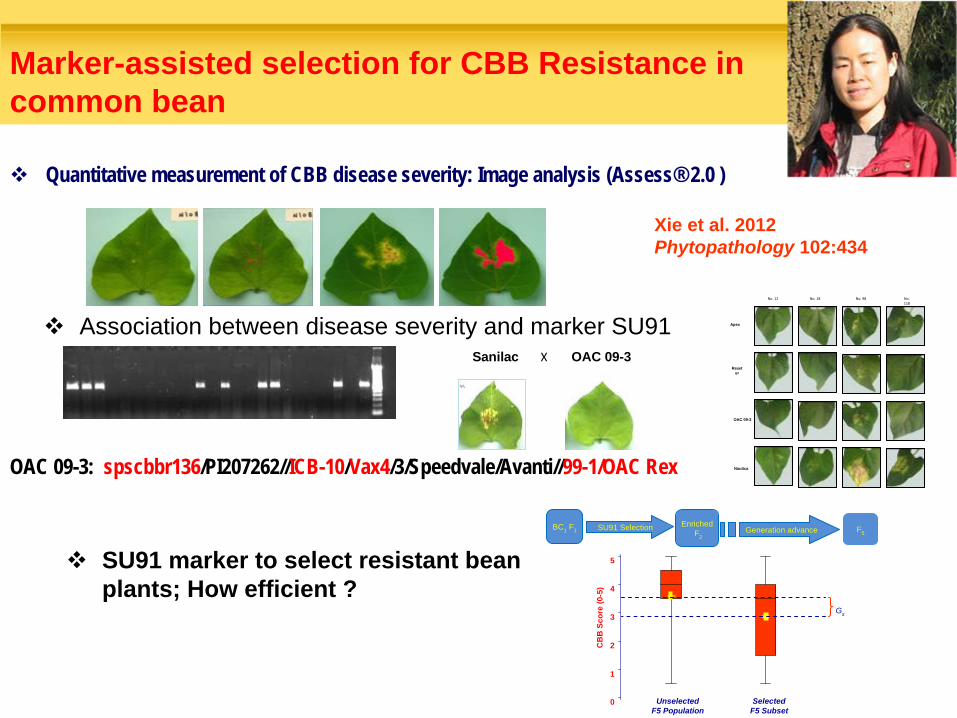
Quantitative measurement of CBB disease severity: Image analysis (Assess® 2.0 )
OAC 09-3: spscbbr136/PI207262//ICB-10/Vax4/3/Speedvale/Avanti//99-1/OAC Rex
Marker-assisted selection for CBB Resistance in common bean
Association between disease severity and marker SU91
SU91 marker to select resistant bean plants; How efficient ?
Xie et al. 2012 Phytopathology 102:434
SelectedF5 Subset
UnselectedF5 Population
0
1
2
3
4
5
CB
B S
core
(0-5
)Gs
BC1 F1Enriched
F2SU91 Selection F5Generation advance
No. 12 No. 18 No.
118No. 98
Nautica
OAC 09-3
Apex
Rexet er
Sanilac X OAC 09-3
Field
AUDPC Growth room
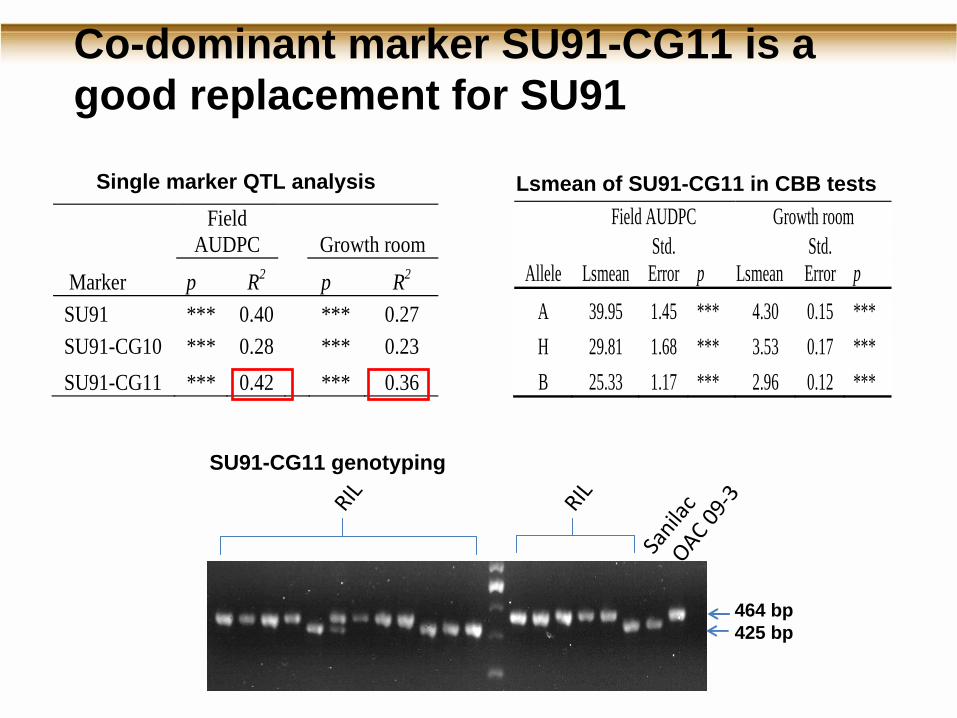
Marker p R2 p R2 SU91 *** 0.40 *** 0.27 SU91-CG10 *** 0.28 *** 0.23 SU91-CG11 *** 0.42 *** 0.36
Allele
Field AUDPC Growth room
Lsmean Std.
Error p Lsmean Std.
Error p A 39.95 1.45 *** 4.30 0.15 *** H 29.81 1.68 *** 3.53 0.17 *** B 25.33 1.17 *** 2.96 0.12 ***
Co-dominant marker SU91-CG11 is a good replacement for SU91
SU91-CG11 genotyping
Sanilac
OAC 09‐3RIL
RIL
464 bp425 bp
Single marker QTL analysis Lsmean of SU91-CG11 in CBB tests
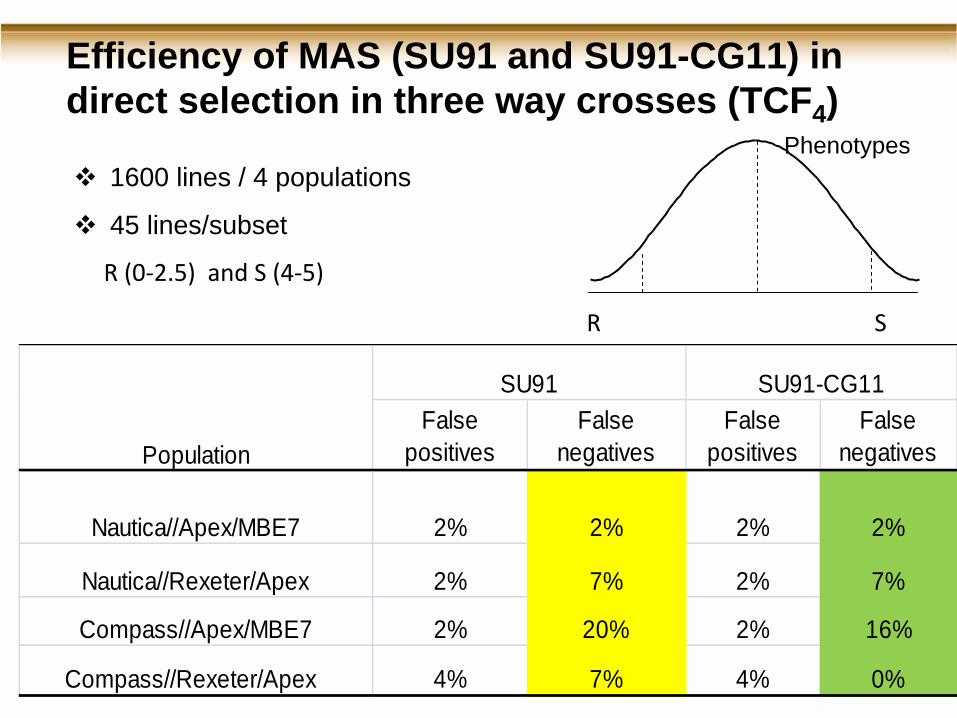
Efficiency of MAS (SU91 and SU91-CG11) in direct selection in three way crosses (TCF4 )
R S
1600 lines / 4 populations
45 lines/subset
R (0‐2.5) and S (4‐5)
Phenotypes
False positives
False negatives
False positives
False negatives
Nautica//Apex/MBE7 2% 2% 2% 2%
Nautica//Rexeter/Apex 2% 7% 2% 7%
Compass//Apex/MBE7 2% 20% 2% 16%
Compass//Rexeter/Apex 4% 7% 4% 0%
SU91 SU91-CG11
Population
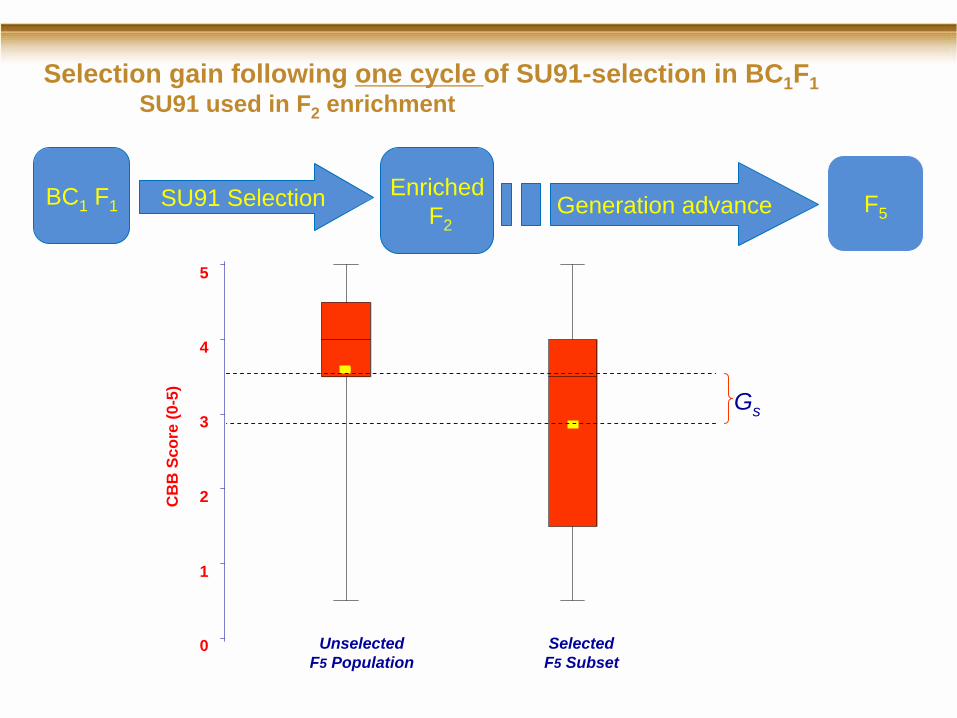
Selection gain following one cycle of SU91-selection in BC1F1SU91 used in F2 enrichment
SelectedF5 Subset
UnselectedF5 Population
0
1
2
3
4
5
CB
B S
core
(0-5
)
Gs
BC1 F1Enriched
F2SU91 Selection F5Generation advance
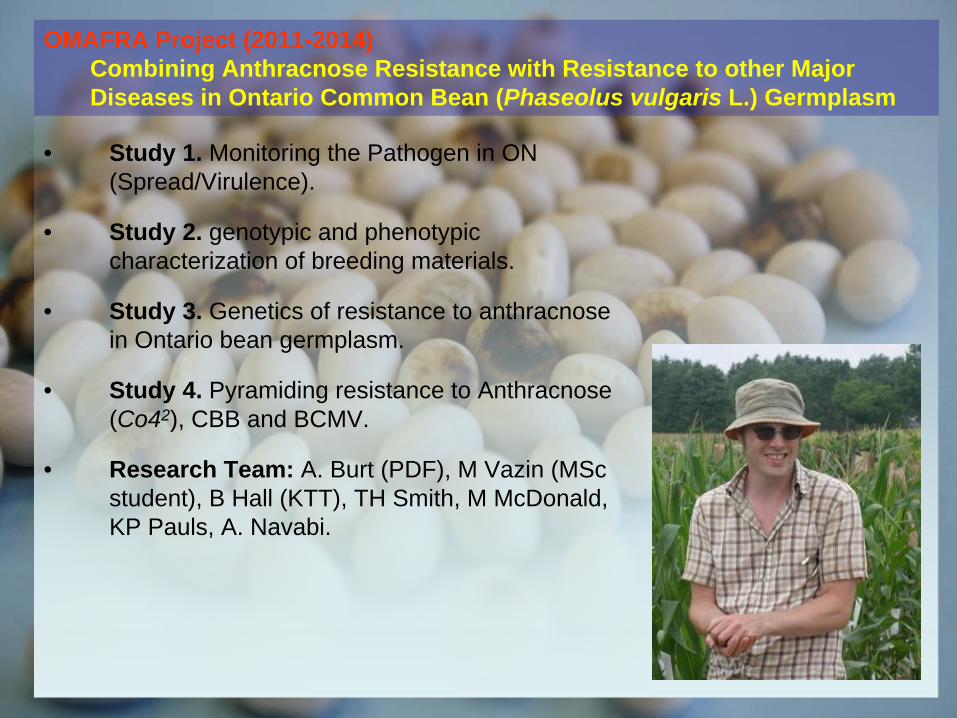
OMAFRA Project (2011-2014)Combining Anthracnose Resistance with Resistance to other Major Diseases in Ontario Common Bean (Phaseolus vulgaris L.) Germplasm
• Study 1. Monitoring the Pathogen in ON (Spread/Virulence).
• Study 2. genotypic and phenotypic characterization of breeding materials.
• Study 3. Genetics of resistance to anthracnose in Ontario bean germplasm.
• Study 4. Pyramiding resistance to Anthracnose (Co42), CBB and BCMV.
• Research Team: A. Burt (PDF), M Vazin (MSc student), B Hall (KTT), TH Smith, M McDonald, KP Pauls, A. Navabi.
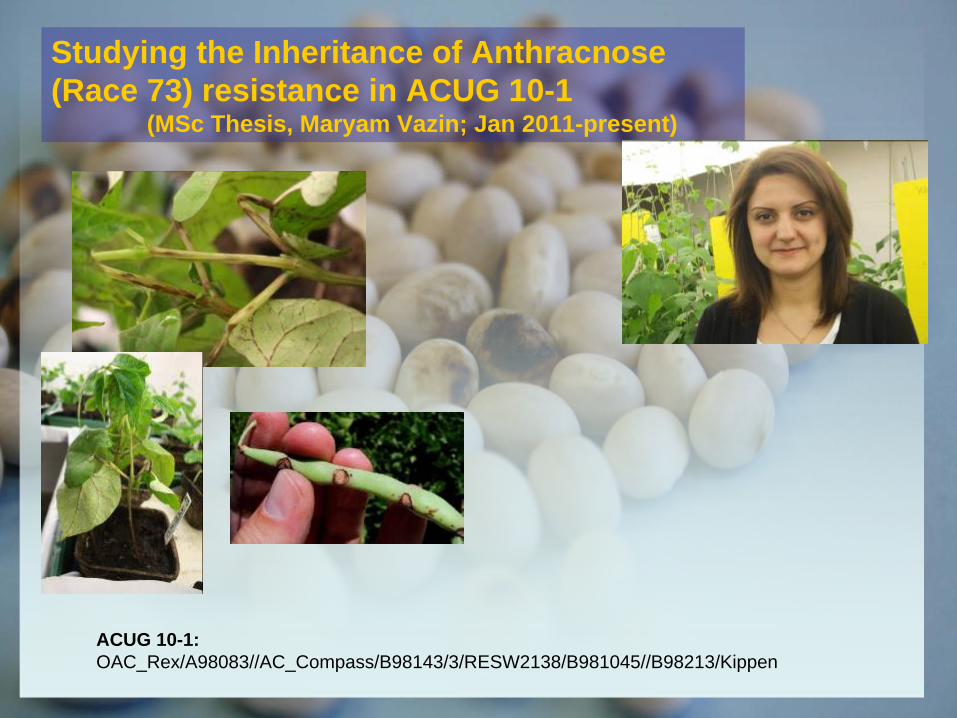
Studying the Inheritance of Anthracnose (Race 73) resistance in ACUG 10-1
(MSc Thesis, Maryam Vazin; Jan 2011-present)
ACUG 10-1: OAC_Rex/A98083//AC_Compass/B98143/3/RESW2138/B981045//B98213/Kippen
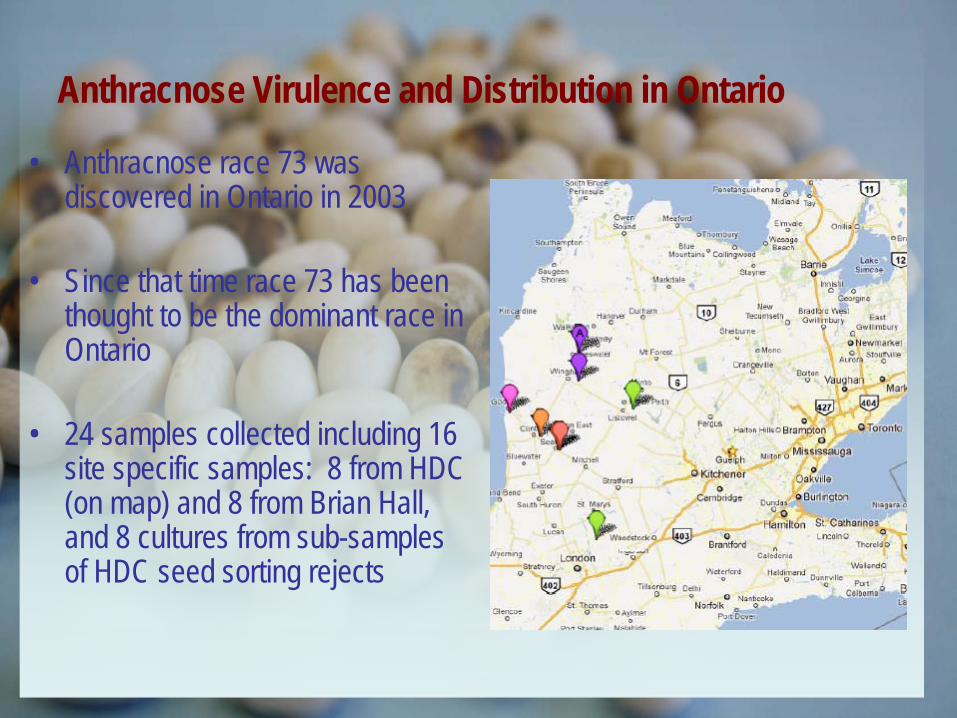
Anthracnose Virulence and Distribution in Ontario
• Anthracnose race 73 was discovered in Ontario in 2003
• Since that time race 73 has been thought to be the dominant race in Ontario
• 24 samples collected including 16 site specific samples: 8 from HDC (on map) and 8 from Brian Hall, and 8 cultures from sub-samples of HDC seed sorting rejects
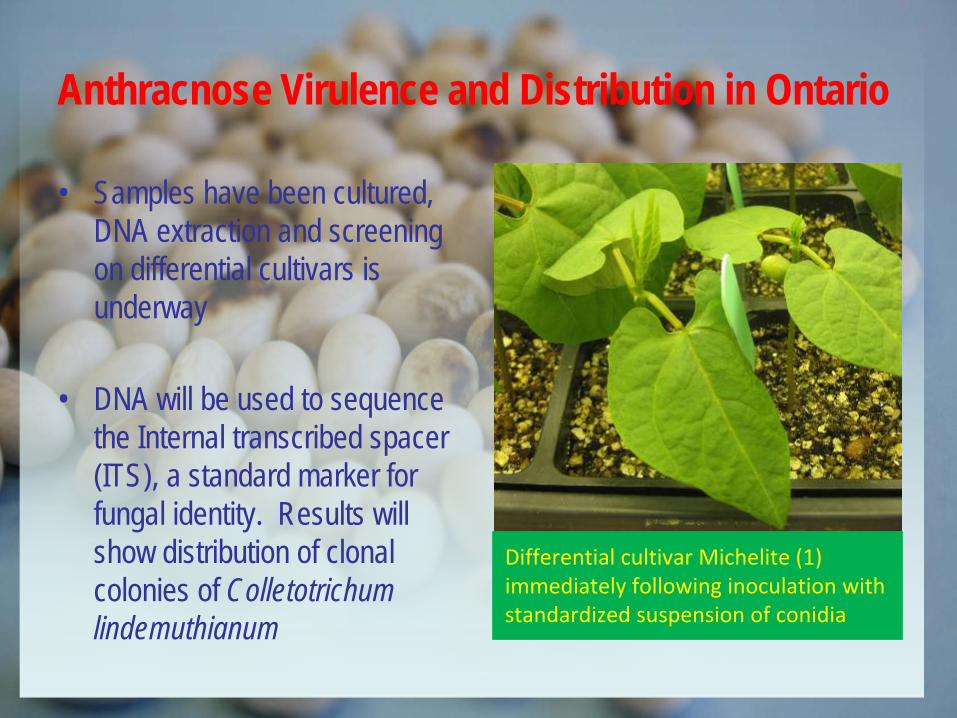
• Samples have been cultured, DNA extraction and screening on differential cultivars is underway
• DNA will be used to sequence the Internal transcribed spacer (ITS), a standard marker for fungal identity. Results will show distribution of clonal colonies of Colletotrichum lindemuthianum
Differential cultivar Michelite
(1)
immediately following inoculation with
standardized suspension of conidia
Anthracnose Virulence and Distribution in Ontario
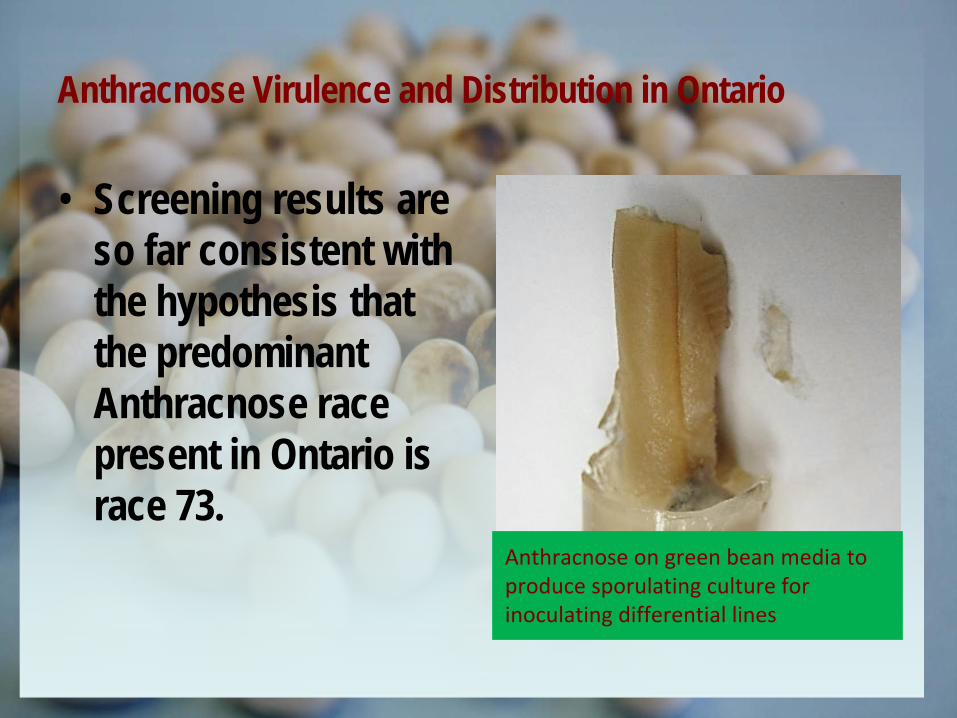
• Screening results are so far consistent with the hypothesis that the predominant Anthracnose race present in Ontario is race 73.
Anthracnose on green bean media to
produce sporulating
culture for
inoculating differential lines
Anthracnose Virulence and Distribution in Ontario
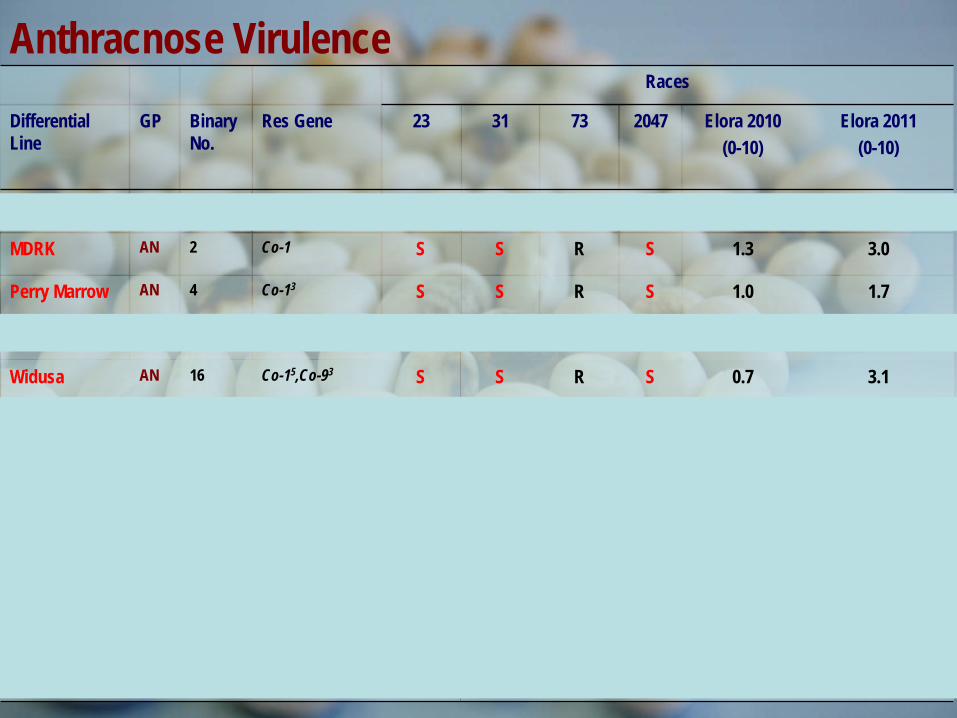
Anthracnose VirulenceRaces
Differential Line
GP Binary No.
Res Gene 23 31 73 2047 Elora 2010(0-10)
Elora 2011(0-10)
Michelite MA 1 Co-11 S S S S 1.3 5.7
MDRK AN 2 Co-1 S S R S 1.3 3.0
Perry Marrow AN 4 Co-13 S S R S 1.0 1.7
Cornell 49242 MA 8 Co-2 R S S S 4.0 5.1
Widusa AN 16 Co-15,Co-93 S S R S 0.7 3.1
Kaboon AN 32 Co-12 R R R S 1.0 3.0
Mexico 222 MA 64 Co-3 R R S S 10.0 9.0
PI 207262 MA 128 Co-43, Co-9 R R R S 0.3 1.0
TO MA 256 Co-4 R R R S 1.7 1.7
TU MA 512 Co-5 R R R S 0.7 1.9
AB136 MA 1024 Co-6,co-8 R R R S 0.3 1.1
G2333 MA 2048 Co-42,Co52,Co7 R R R R 0.1 1.1
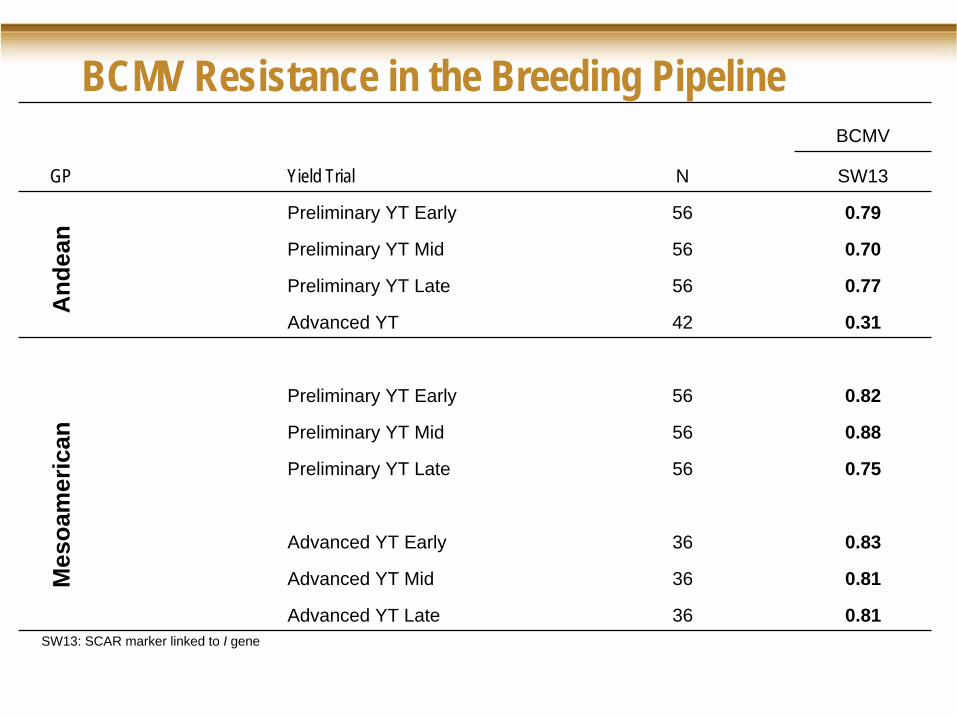
BCMV Resistance in the Breeding Pipeline BCMV
GP Yield Trial N SW13
Preliminary YT Early 56 0.79
Preliminary YT Mid 56 0.70
Preliminary YT Late 56 0.77
Advanced YT 42 0.31
Preliminary YT Early 56 0.82
Preliminary YT Mid 56 0.88
Preliminary YT Late 56 0.75
Advanced YT Early 36 0.83
Advanced YT Mid 36 0.81
Advanced YT Late 36 0.81
And
ean
Mes
oam
eric
an
SW13: SCAR marker linked to I gene
White Mold Tolerance
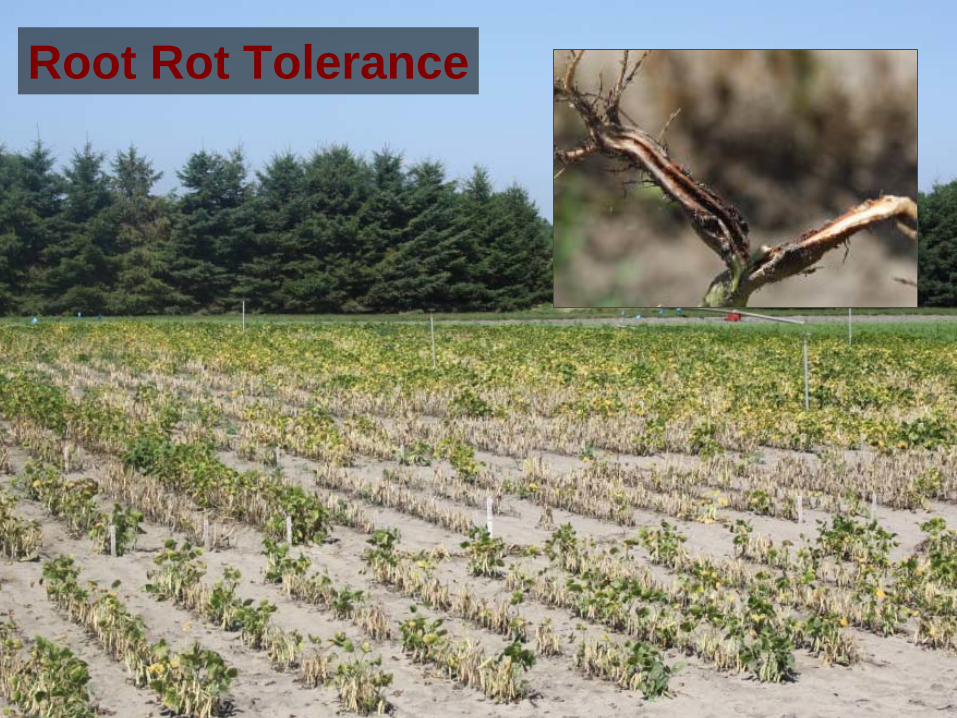
Root Rot Tolerance
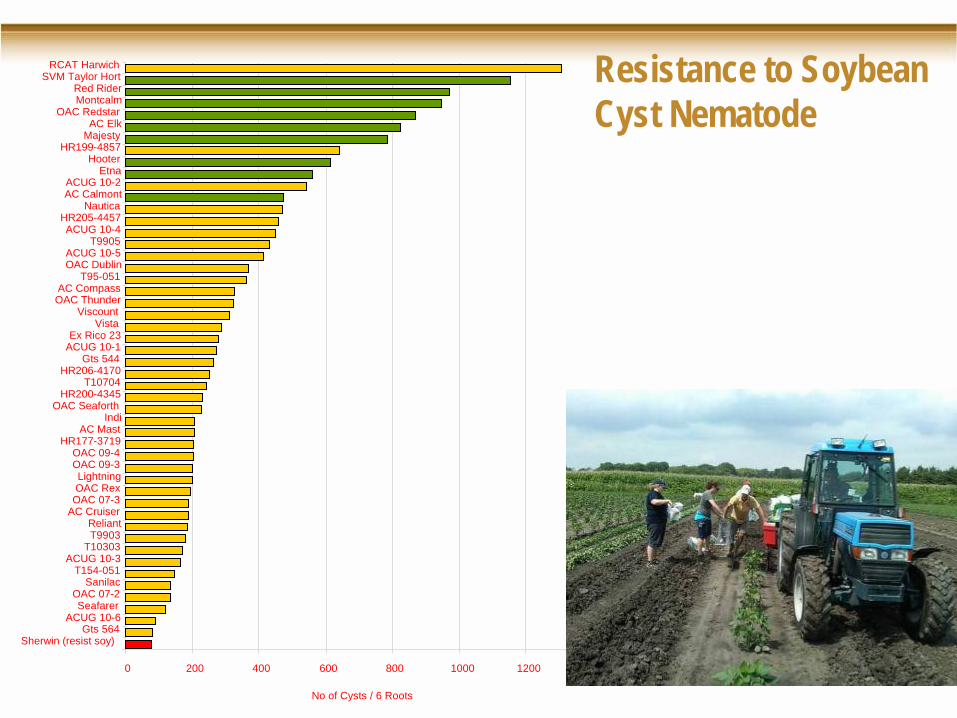
Resistance to Soybean Cyst Nematode
0 200 400 600 800 1000 1200 1400
Sherwin (resist soy)Gts 564
ACUG 10-6Seafarer
OAC 07-2Sanilac
T154-051ACUG 10-3
T10303T9903Reliant
AC CruiserOAC 07-3OAC RexLightning
OAC 09-3OAC 09-4
HR177-3719AC Mast
IndiOAC Seaforth
HR200-4345T10704
HR206-4170Gts 544
ACUG 10-1Ex Rico 23
VistaViscount
OAC ThunderAC Compass
T95-051OAC DublinACUG 10-5
T9905ACUG 10-4
HR205-4457Nautica
AC CalmontACUG 10-2
EtnaHooter
HR199-4857MajestyAC Elk
OAC RedstarMontcalmRed Rider
SVM Taylor HortRCAT Harwich
No of Cysts / 6 Roots
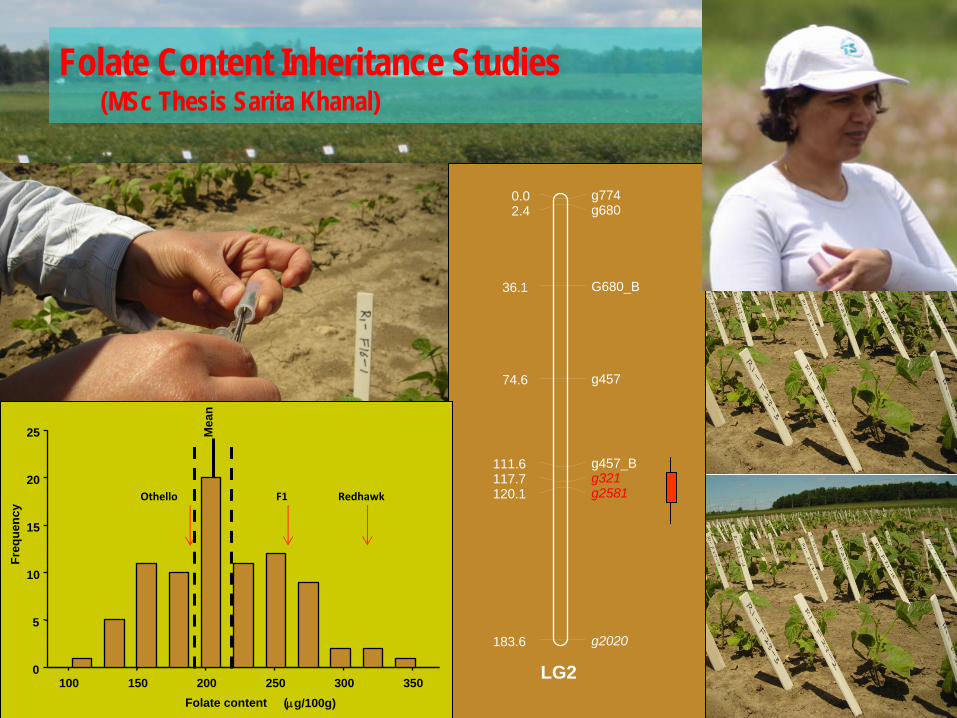
Folate Content Inheritance Studies (MSc Thesis Sarita Khanal)
g7740.0g6802.4
G680_B36.1
g45774.6
g457_B111.6g321117.7g2581120.1
g2020183.6
LG2
Othello F1
Redhawk
100 150 200 250 300 3500
5
10
15
20
25
Folate content (g/100g)
Freq
uenc
y
Mea
n
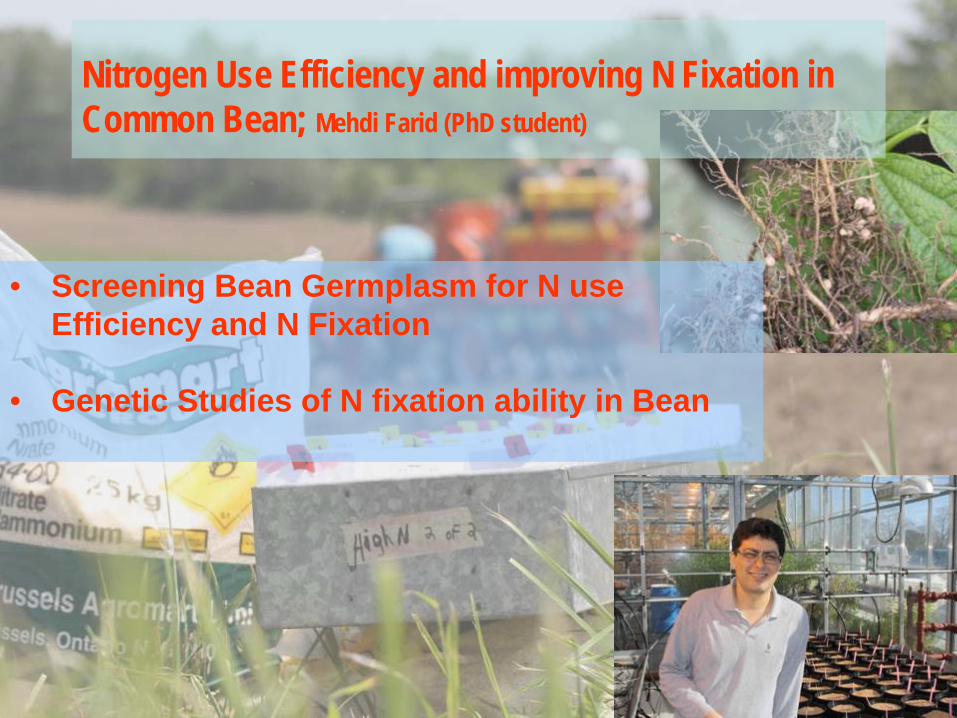
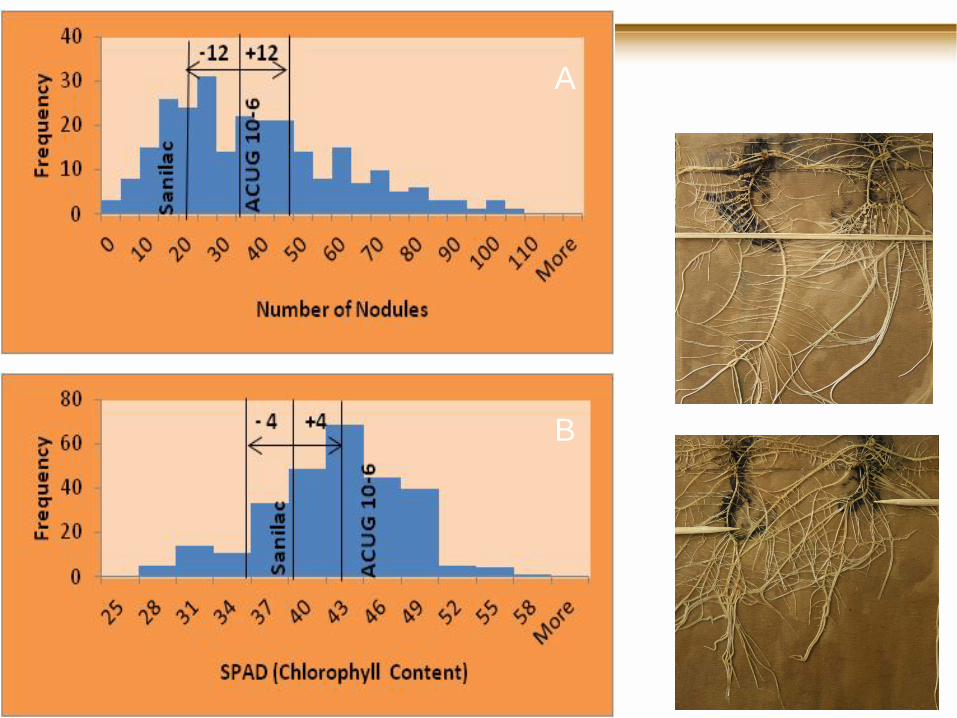
• Screening Bean Germplasm for N use Efficiency and N Fixation
• Genetic Studies of N fixation ability in Bean
Nitrogen Use Efficiency and improving N Fixation in Common Bean; Mehdi Farid (PhD student)
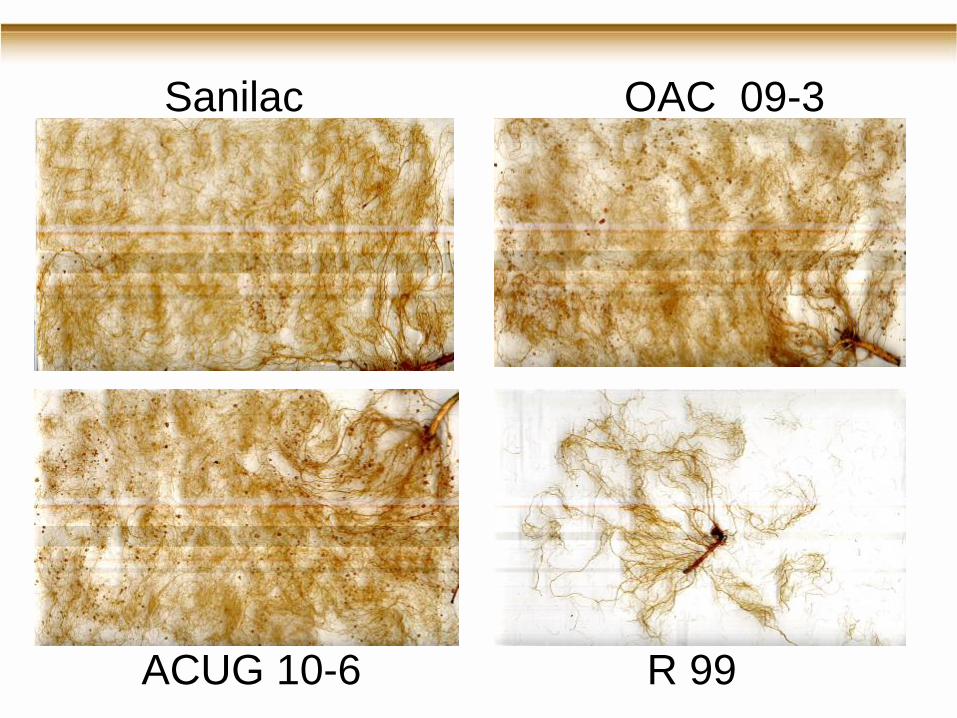
Sanilac
ACUG 10-6
OAC 09-3
R 99
A
B
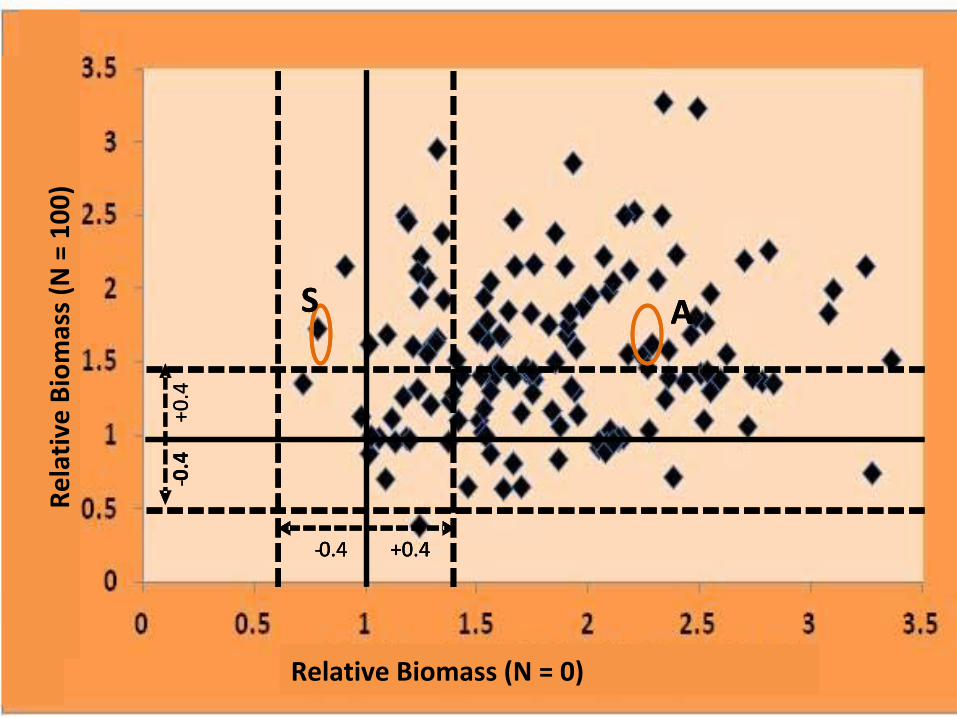
N2Fixation Efficiency (N0 )
+0.4
‐0.4 +0.4
‐0.4
N2Fixation
Efficiency (N
AS
Relative Biomass (N = 0)
+0.4
‐0.4 +0.4‐0.4 +0.4
‐0.4
Relative Biomass (N = 100
)
AS
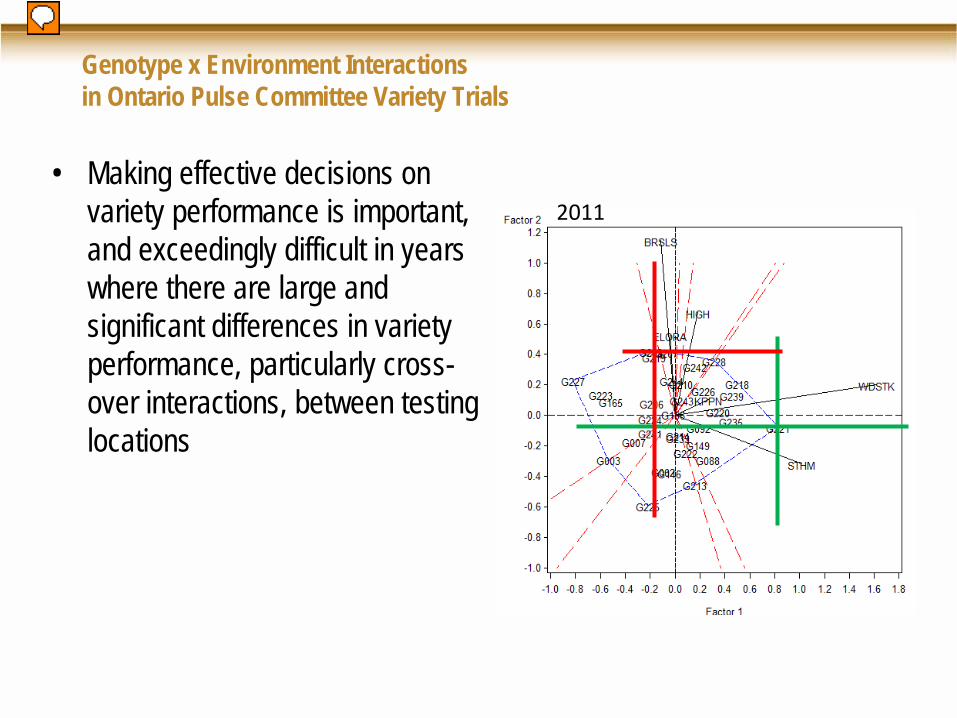
Genotype x Environment Interactions in Ontario Pulse Committee Variety Trials
• Making effective decisions on variety performance is important, and exceedingly difficult in years where there are large and significant differences in variety performance, particularly cross- over interactions, between testing locations
2011
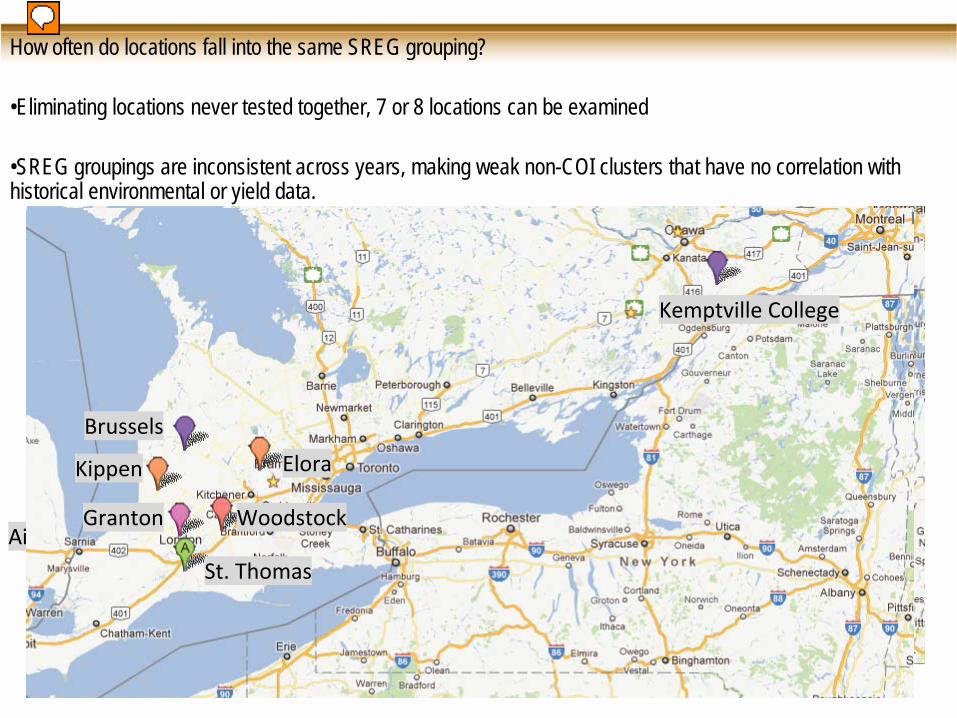
How often do locations fall into the same SREG grouping?
•Eliminating locations never tested together, 7 or 8 locations can be examined
•SREG groupings are inconsistent across years, making weak non-COI clusters that have no correlation with historical environmental or yield data.
Kemptville College
Elora
Woodstock
St. Thomas
Ailsa Craig
Kippen Exeter
Brussels
Kemptville College
Elora
Woodstock
Kippen
Granton
Brussels
St. Thomas
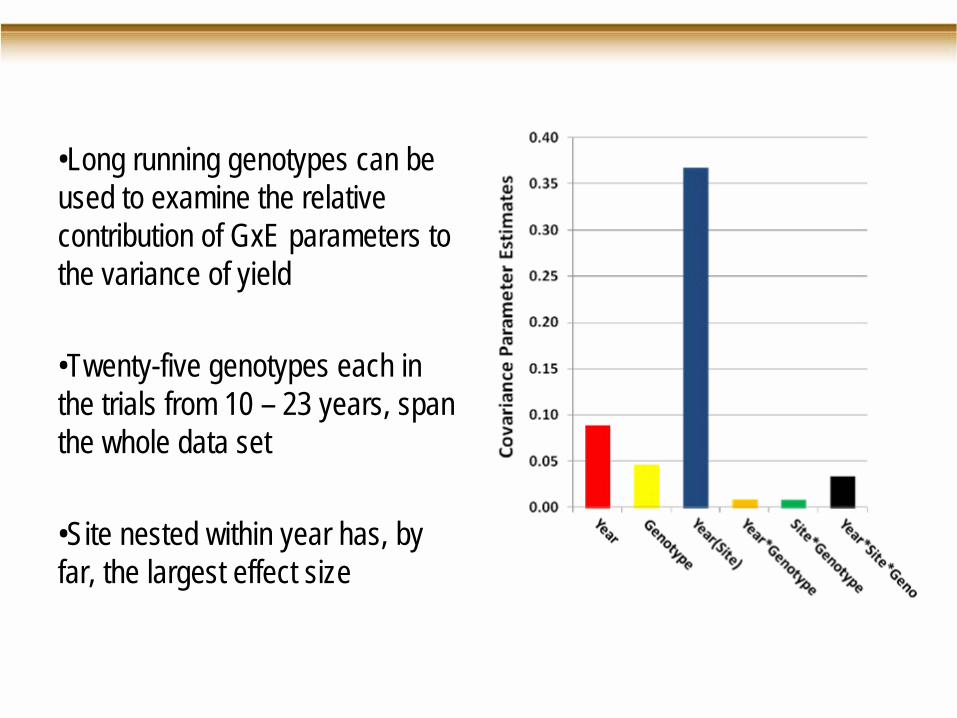
•Long running genotypes can be used to examine the relative contribution of GxE parameters to the variance of yield
•Twenty-five genotypes each in the trials from 10 – 23 years, span the whole data set
•Site nested within year has, by far, the largest effect size
Next steps
Using the common sub-set of genotypes, we can analyze 3 years at a time to get variance partitions across years and locations.
Use data from long-term check varieties to answer complicated questions– e.g. is the performance at Site X over time or average performance across sites a
better predictor of a varieties’ performance at Site X?
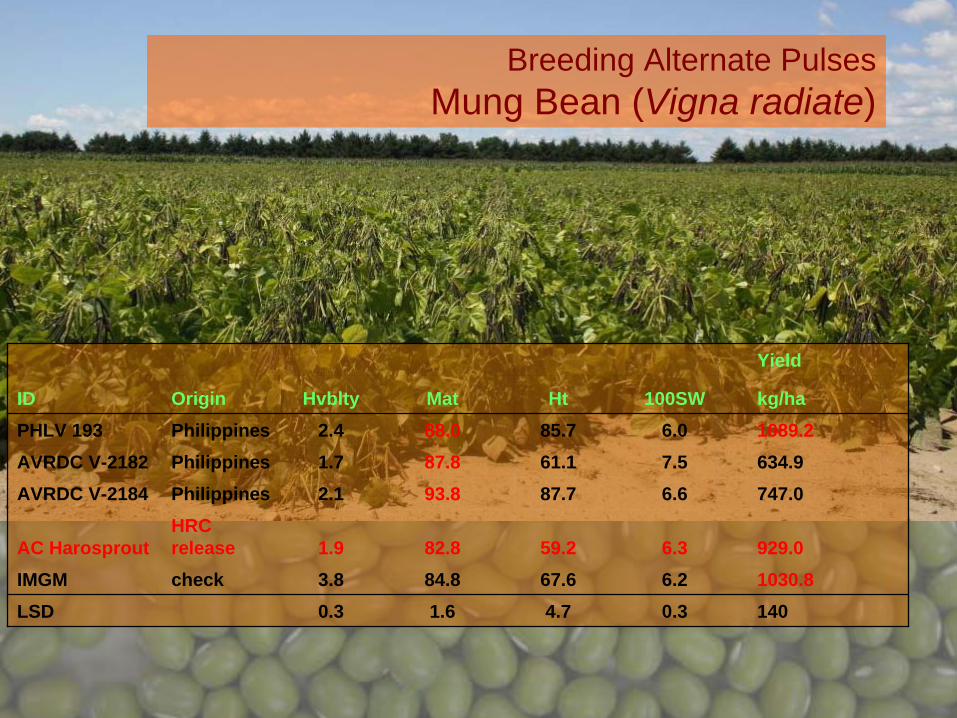
Breeding Alternate PulsesMung Bean (Vigna radiate)
Yield
ID Origin Hvblty Mat Ht 100SW kg/haPHLV 193 Philippines 2.4 88.0 85.7 6.0 1089.2AVRDC V-2182 Philippines 1.7 87.8 61.1 7.5 634.9AVRDC V-2184 Philippines 2.1 93.8 87.7 6.6 747.0
AC HarosproutHRC release 1.9 82.8 59.2 6.3 929.0
IMGM check 3.8 84.8 67.6 6.2 1030.8LSD 0.3 1.6 4.7 0.3 140
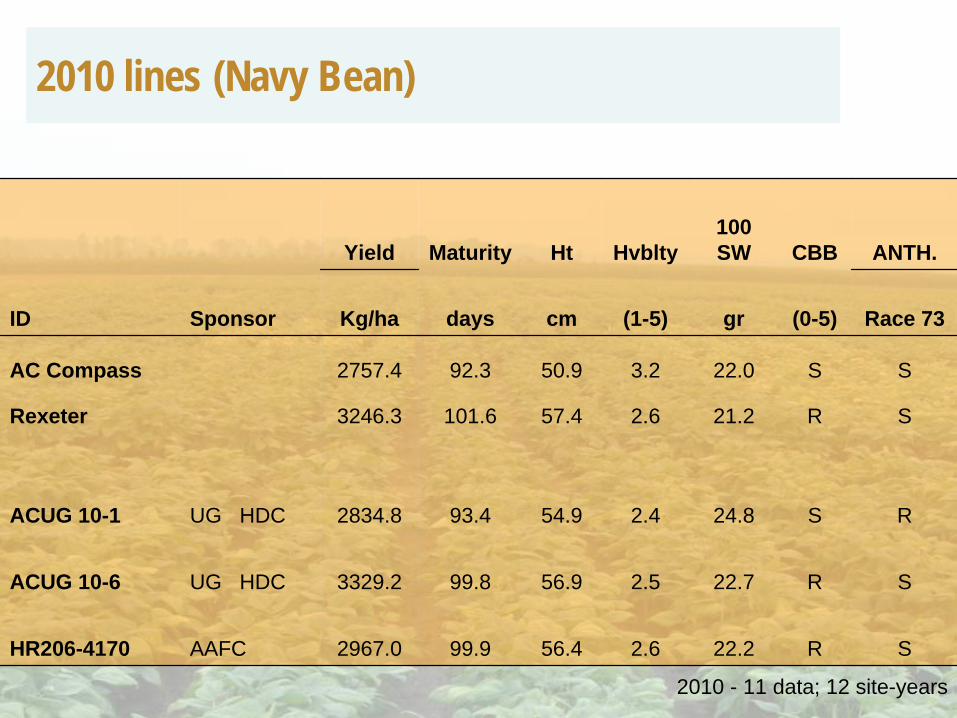
2010 lines (Navy Bean)
2010 - 11 data; 12 site-years
Yield Maturity Ht Hvblty100 SW CBB ANTH.
ID Sponsor Kg/ha days cm (1-5) gr (0-5) Race 73
AC Compass 2757.4 92.3 50.9 3.2 22.0 S S
Rexeter 3246.3 101.6 57.4 2.6 21.2 R S
ACUG 10-1 UG HDC 2834.8 93.4 54.9 2.4 24.8 S R
ACUG 10-6 UG HDC 3329.2 99.8 56.9 2.5 22.7 R S
HR206-4170 AAFC 2967.0 99.9 56.4 2.6 22.2 R S
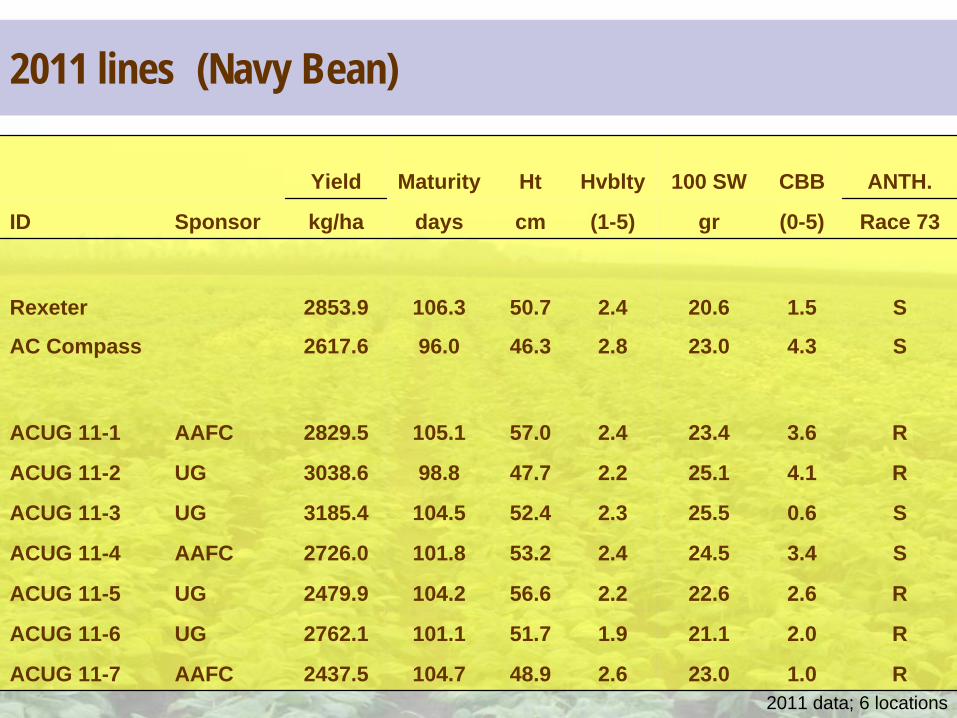
2011 lines (Navy Bean)
Yield Maturity Ht Hvblty 100 SW CBB ANTH.
ID Sponsor kg/ha days cm (1-5) gr (0-5) Race 73
Rexeter 2853.9 106.3 50.7 2.4 20.6 1.5 S
AC Compass 2617.6 96.0 46.3 2.8 23.0 4.3 S
ACUG 11-1 AAFC 2829.5 105.1 57.0 2.4 23.4 3.6 R
ACUG 11-2 UG 3038.6 98.8 47.7 2.2 25.1 4.1 R
ACUG 11-3 UG 3185.4 104.5 52.4 2.3 25.5 0.6 S
ACUG 11-4 AAFC 2726.0 101.8 53.2 2.4 24.5 3.4 S
ACUG 11-5 UG 2479.9 104.2 56.6 2.2 22.6 2.6 R
ACUG 11-6 UG 2762.1 101.1 51.7 1.9 21.1 2.0 R
ACUG 11-7 AAFC 2437.5 104.7 48.9 2.6 23.0 1.0 R2011 data; 6 locations
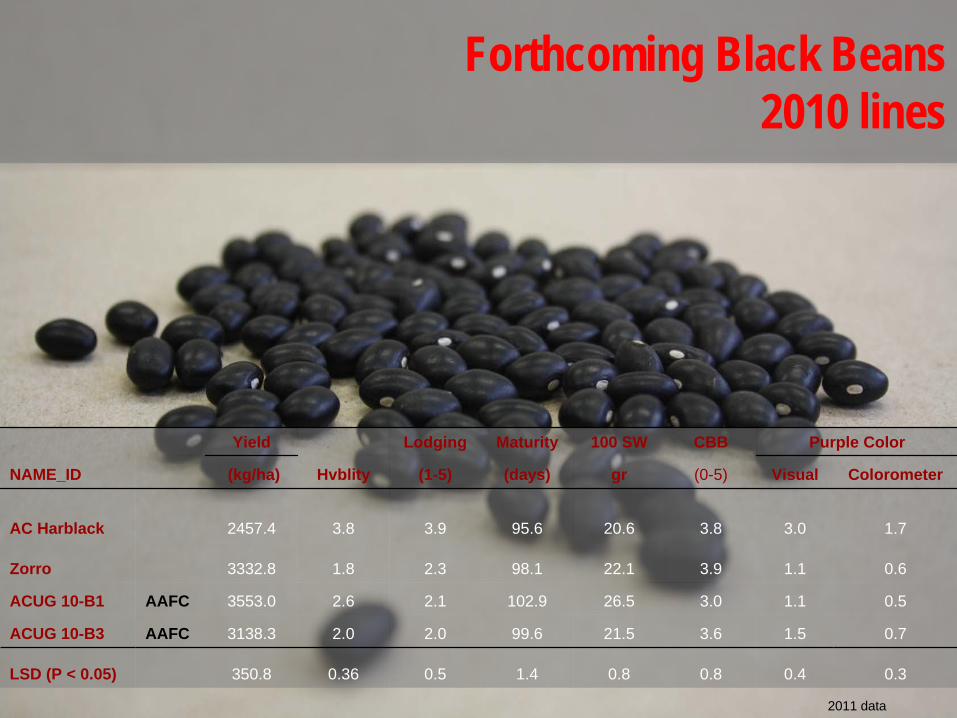
Forthcoming Black Beans 2010 lines
Yield Lodging Maturity 100 SW CBB Purple Color
NAME_ID (kg/ha) Hvblity (1-5) (days) gr (0-5) Visual Colorometer
AC Harblack 2457.4 3.8 3.9 95.6 20.6 3.8 3.0 1.7
Zorro 3332.8 1.8 2.3 98.1 22.1 3.9 1.1 0.6
ACUG 10-B1 AAFC 3553.0 2.6 2.1 102.9 26.5 3.0 1.1 0.5
ACUG 10-B3 AAFC 3138.3 2.0 2.0 99.6 21.5 3.6 1.5 0.7
LSD (P < 0.05) 350.8 0.36 0.5 1.4 0.8 0.8 0.4 0.3
2011 data
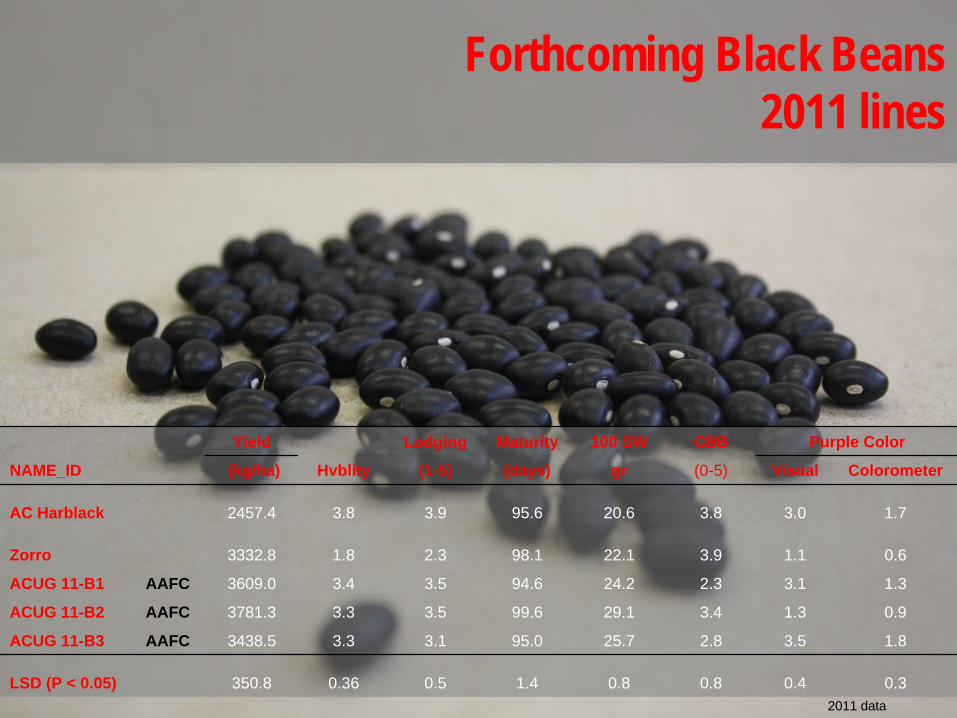
Yield Lodging Maturity 100 SW CBB Purple Color
NAME_ID (kg/ha) Hvblity (1-5) (days) gr (0-5) Visual Colorometer
AC Harblack 2457.4 3.8 3.9 95.6 20.6 3.8 3.0 1.7
Zorro 3332.8 1.8 2.3 98.1 22.1 3.9 1.1 0.6
ACUG 11-B1 AAFC 3609.0 3.4 3.5 94.6 24.2 2.3 3.1 1.3
ACUG 11-B2 AAFC 3781.3 3.3 3.5 99.6 29.1 3.4 1.3 0.9
ACUG 11-B3 AAFC 3438.5 3.3 3.1 95.0 25.7 2.8 3.5 1.8
LSD (P < 0.05) 350.8 0.36 0.5 1.4 0.8 0.8 0.4 0.3
Forthcoming Black Beans 2011 lines
2011 data
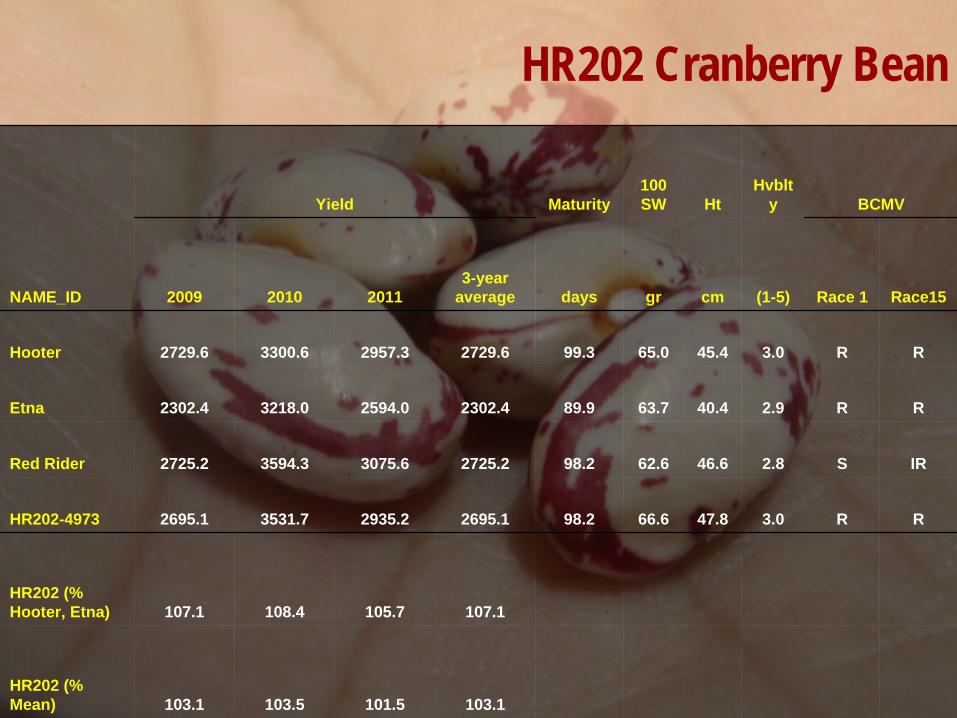
HR202 Cranberry Bean
Yield Maturity100 SW Ht
Hvblt y BCMV
NAME_ID 2009 2010 20113-year
average days gr cm (1-5) Race 1 Race15
Hooter 2729.6 3300.6 2957.3 2729.6 99.3 65.0 45.4 3.0 R R
Etna 2302.4 3218.0 2594.0 2302.4 89.9 63.7 40.4 2.9 R R
Red Rider 2725.2 3594.3 3075.6 2725.2 98.2 62.6 46.6 2.8 S IR
HR202-4973 2695.1 3531.7 2935.2 2695.1 98.2 66.6 47.8 3.0 R R
HR202 (% Hooter, Etna) 107.1 108.4 105.7 107.1
HR202 (% Mean) 103.1 103.5 101.5 103.1
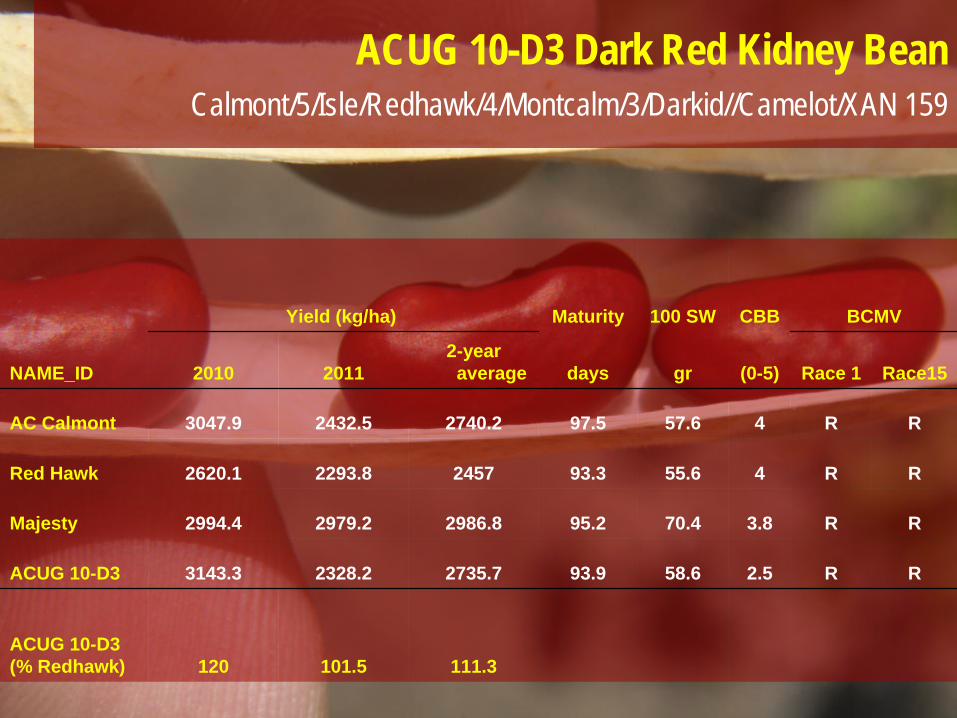
ACUG 10-D3 Dark Red Kidney Bean Calmont/5/Isle/Redhawk/4/Montcalm/3/Darkid//Camelot/XAN 159
Yield (kg/ha) Maturity 100 SW CBB BCMV
NAME_ID 2010 20112-year average days gr (0-5) Race 1 Race15
AC Calmont 3047.9 2432.5 2740.2 97.5 57.6 4 R R
Red Hawk 2620.1 2293.8 2457 93.3 55.6 4 R R
Majesty 2994.4 2979.2 2986.8 95.2 70.4 3.8 R R
ACUG 10-D3 3143.3 2328.2 2735.7 93.9 58.6 2.5 R R
ACUG 10-D3 (% Redhawk) 120 101.5 111.3
Acknowledgment