PUAOC For personal use only...2019/06/17 · Demand for HPA has risen eight-fold since 2003 and is...
35
Registered Office Website: www.purealumina.com.au Level 4, 100 Albert Road Email: [email protected] South Melbourne, Vic, 3205 ACN 072 692 365 Revised Investor Presentation 17 June 2019 ASX Code: PUA, PUAOC Investor Presentation - Revised Pure Alumina Limited (ASX: PUA) (Pure Alumina) advises that it has received a request from the Australian Securities Exchange (ASX), in relation to the announcement entitled “Investor Presentation – Updated – Correction” (14 June Investor Presentation) released via the ASX Market Announcements Platform on 14 June 2019, to provide additional information in, and to make amendments to, the 14 June Investor Presentation. Pure Alumina therefore provides the attached investor presentation (Revised Investor Presentation) which includes the following changes made to the 14 June Investor Presentation: Slide 14 This slide has been modified to include a footnote to refer readers to slide 31 for details on how the production cost on slide 14 was calculated and provide a detailed breakdown. Former Slide 18 This slide, Slide 18 in the 14 June Investor Presentation, presented aggregated data using standard metrics in “best, average & poor” categories to compare processes used or proposed to produce High Purity Alumina (HPA). As the processes are in different stages of development, Pure Alumina is of the view that to be consistent with the approach adopted for former Slide 19, as referred to below, Slide 18 should be retracted from the Investor Presentation. Former Slide 19 This slide, Slide 19 in the 14 June Investor Presentation, compared features of Polar Sapphire’s HPA project to those of other companies who are developing HPA projects. While the data contained on this slide was sourced from those companies’ publicly issued releases, the ASX bought to Pure Alumina’s attention that the projects being compared were at different stages of development and, as noted in ASX Compliance Update 08/18 issued on 19 September 2018, peer comparisons between companies at different stages of development may potentially be misleading. Pure Alumina therefore retracts this slide from the Investor Presentation. Other Changes Minor updates have been made to other slides to ensure the information remains current. For personal use only
Transcript of PUAOC For personal use only...2019/06/17 · Demand for HPA has risen eight-fold since 2003 and is...

Registered Office Website: www.purealumina.com.au Level 4, 100 Albert Road Email: [email protected] South Melbourne, Vic, 3205
ACN 072 692 365
Revised Investor Presentation 17 June 2019
ASX Code: PUA, PUAOC
Investor Presentation - Revised
Pure Alumina Limited (ASX: PUA) (Pure Alumina) advises that it has received a request from the Australian Securities Exchange (ASX), in relation to the announcement entitled “Investor Presentation – Updated – Correction” (14 June Investor Presentation) released via the ASX Market Announcements Platform on 14 June 2019, to provide additional information in, and to make amendments to, the 14 June Investor Presentation.
Pure Alumina therefore provides the attached investor presentation (Revised Investor Presentation) which includes the following changes made to the 14 June Investor Presentation:
Slide 14
This slide has been modified to include a footnote to refer readers to slide 31 for details on how the production cost on slide 14 was calculated and provide a detailed breakdown.
Former Slide 18
This slide, Slide 18 in the 14 June Investor Presentation, presented aggregated data using standard metrics in “best, average & poor” categories to compare processes used or proposed to produce High Purity Alumina (HPA). As the processes are in different stages of development, Pure Alumina is of the view that to be consistent with the approach adopted for former Slide 19, as referred to below, Slide 18 should be retracted from the Investor Presentation.
Former Slide 19
This slide, Slide 19 in the 14 June Investor Presentation, compared features of Polar Sapphire’s HPA project to those of other companies who are developing HPA projects. While the data contained on this slide was sourced from those companies’ publicly issued releases, the ASX bought to Pure Alumina’s attention that the projects being compared were at different stages of development and, as noted in ASX Compliance Update 08/18 issued on 19 September 2018, peer comparisons between companies at different stages of development may potentially be misleading.
Pure Alumina therefore retracts this slide from the Investor Presentation.
Other Changes Minor updates have been made to other slides to ensure the information remains current.
For
per
sona
l use
onl
y

2
The Revised Investor Presentation replaces the 14 June Investor Presentation and former Slides 18 and 19, as referred to above, are retracted and investors should not rely on any comparisons made on those retracted slides.
Martin McFarlane Managing Director
Media - For further information, please contact: Paul Armstrong - Read Corporate +61 8 9388 1474
For
per
sona
l use
onl
y

A NEW COMMERCIAL LOW COST PRODUCER OF
HIGH PURITY ALUMINA
For
per
sona
l use
onl
y

Disclaimer
Forward-looking Statements
This announcement contains forward-looking statements which are identified by words such as ‘anticipates’, ‘forecasts’, ‘may’, ‘will’, ‘could’, ‘believes’, ‘estimates’, ‘targets’, ‘expects’, ‘plan’ or ‘intends’ and other similar words that involve risks and uncertainties. Indications of, and guidelines or outlook on, future earnings, distributions or financial position or performance and targets, estimates and assumptions in respect of production, prices, operating costs, results, capital expenditures, reserves and resources are also forward-looking statements. These statements are based on an assessment of present economic and operating conditions, and on a number of assumptions and estimates regarding future events and actions that, while considered reasonable as at the date of this announcement and are expected to take place, are inherently subject to significant technical, business, economic, competitive, political and social uncertainties and contingencies. Such forward-looking statements are not guarantees of future performance and involve known and unknown risks, uncertainties, assumptions and other important factors, many of which are beyond the control of the Company, the directors and management. We cannot and do not give any assurance that the results, performance or achievements expressed or implied by the forward-looking statements contained in this announcement will actually occur and readers are cautioned not to place undue reliance on these forward-looking statements. These forward-looking statements are subject to various risk factors that could cause actual events or results to differ materially from the eventsor results estimated, expressed or anticipated in these statements.F
or p
erso
nal u
se o
nly

Investment Highlights
One of the world’s highest quality, lowest cost HPA suppliers
1
Rapid market growth and order backlog
Compelling valuation and lower risk proposition vs industry peers
CapEx substantially lower than other potential HPA suppliers – near term cash flow positive
3
2
3
4
Pure Alumina is raising capital to acquire Polar Sapphire (“Polar”) and to fund a commercial-scale factory
For
per
sona
l use
onl
y

Team
Experience:• Experienced
cleantech/advanced material manufacturing entrepreneur
• COO - Jaco SolarSi• Founder, President, CTO -
6N Silicon (purifying silicon for solar cells)
Education:• MBA, Western University• P. Eng, Materials
Engineering, McMaster University
Scott Nichol Founder, CEO
Dan Smith VP of Operations
Iman Zargaran R&D Manager
Experience:• Experience scaling new
technologies to production scale
• Broad manufacturing and management
• 6N Silicon – designed, managed construction, commissioned and procured equipment for 100,000 sq. ft. manufacturing facility
Education:• P. Eng, Mechanical
Engineering, Queen's University
Experience:• 10+ years of materials
development experience• Technical Project
Manager - PNFCO (nano-materials)
• Engineering Coordinator -Pishgaman Catalyst Alvand (alumina)
Education:• Master’s, Materials
Engineering, University of Tehran
• P. Eng, Materials Engineering,
David LeavyVP of Finance
Experience:• 25+ years experience in
the banking and mining industries
• CFO of multiple mining companies during project development
Education:• B.Econ, Murdoch
University• M. App. Fin., Macquarie
University
4
Highly qualified team with extensive industry experience and proven track record of building cleantech companies
For
per
sona
l use
onl
y

The Acquisition – Polar Sapphire
• Polar’s innovative process produces 99.999% (5N) HPA(Al2O3) - the highest commercial grade of HPA, commanding a price premium.
• Polar can also produce 3N and 4N HPA using lower cost feedstock
• Polar’s technology is proven – its Toronto pilot plant has capacity to produce HPA at 145 tonnes/year
• Commercial production is only a modest 2.4 times scale up – low risk – many current components already operate at commercial scale
5
Polar Sapphire, a private Canadian company, has perfected its unique patented HPA production technology over 6 years.
Sapphire Boule made from Polar Sapphire TechnologyF
or p
erso
nal u
se o
nly

The Acquisition – Polar Sapphire
• Polar’s modular system has many advantages compared to other methods of producing HPA including:• significantly lower CapEx and Operating Costs,• flexibility to produce multiple grades at once; and• rapid expansion
• Polar has passed the rigorous qualification process of multiple sapphire producers and is now receiving orders exceeding current capacity
• Polar’s 5N process has a significantly lower capital intensity than other Kaolin HPA projects and its operating costs are in line or better than most 4N HPA cash costs
6
Quality testing of a Polar Sapphire Boule
Polar’s modular production process has key advantages over existing methods of HPA production
For
per
sona
l use
onl
y
Key Acquisition Terms
7
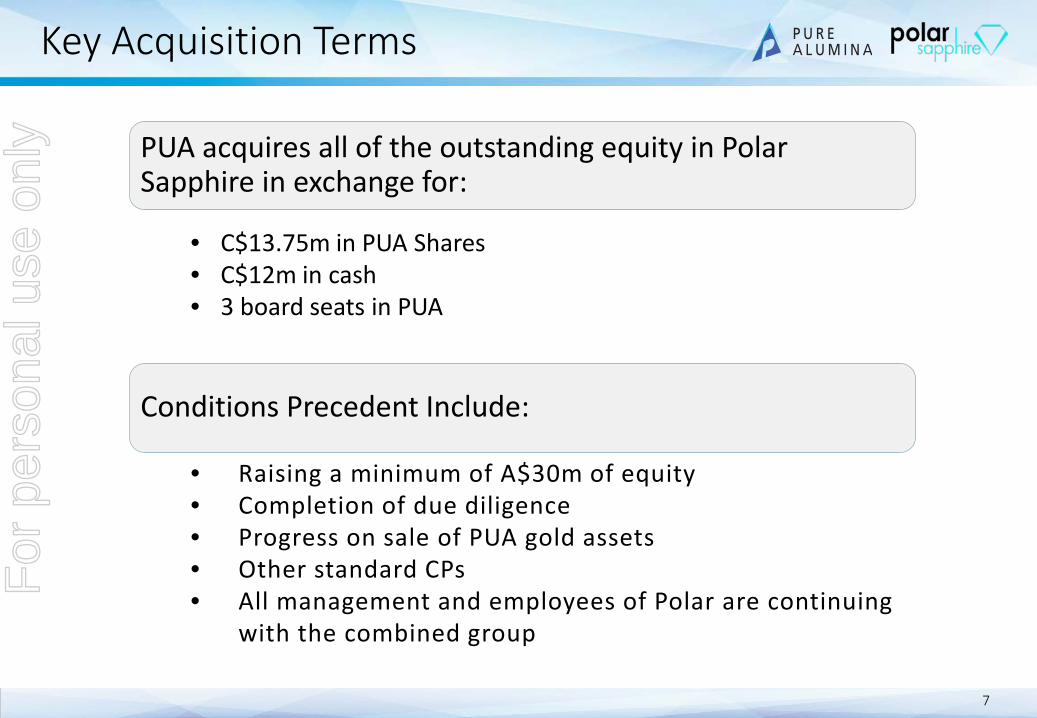
PUA acquires all of the outstanding equity in Polar Sapphire in exchange for:
• C$13.75m in PUA Shares• C$12m in cash• 3 board seats in PUA
• Raising a minimum of A$30m of equity• Completion of due diligence• Progress on sale of PUA gold assets• Other standard CPs• All management and employees of Polar are continuing
with the combined group
Conditions Precedent Include:
For
per
sona
l use
onl
y

HPA Applications
8
For
per
sona
l use
onl
y

Rapid HPA Growth from Multiple Sectors
9Source: Roskill 2017
CAGR 2018-2028
7.0%
26.0%
6.2%
5.8%
8.0%
Total: 10.5%
Demand for HPA has risen eight-fold since 2003 and is forecast to triple by 2030• LED’s consume >50% of HPA demand and is growing strongly. LED’s currently have ~20% of
the lighting market with saturation expected above 80%.• Lithium batteries are an emerging HPA market and forecast to become the largest HPA
market within 10 year as electric vehicle and power storage markets take off. • PUA plans to sell into market growth rather than cannibalizing competitors market share
0
10,000
20,000
30,000
40,000
50,000
60,000
70,000
80,000
90,000
100,000
2016 2017 2018 2019 2020 2021 2022 2023 2024 2025 2026 2027 2028
Tonn
es
Demand by Use
Others
Batteries
Phosphor
Semiconductor
LED
For
per
sona
l use
onl
y

HPA Coating
10
Coated Battery Separators
PE/PP separator base
• Lithium batteries generate significant heat that, if unmanaged, may result in thermal runaway e.g. Samsung Galaxy Note 7
• Demand for larger batteries and greater energy density e.g. EV batteries, increases the thermal management issue
• Coating battery separators with HPA has been found to significantly improve safety and efficiency:• provide greater thermal stability to the battery,
• significantly improves impedance (Macmullannumber <3) allowing for high power capability,
• improve battery life cycle and lowers self-dischargeFor
per
sona
l use
onl
y

Polar’s HPA – Value Proposition
LEDSapphire Wafer
Sapphire Ingot
Sapphire BouleHPA
HPA in the LED Supply Chain
11
HPA in the market today produces boules with defects (bubbles, color, clarity), limiting the ingot yield/boule
Polar Sapphire HPA produces higher quality boules with fewer defects, increasing ingot yields and revenue for customers by up to 25%
For
per
sona
l use
onl
y

Polar is Solution to Existing Issues
12
Competitors HPASapphire for LED’s
Powder for Battery Separators
HPA in the market today produces boules with defects (bubbles, colour, cloudy), limiting the ingot yield/boule
Polar HPA has increased value in use while solving current HPA issues
•Increased clarity•Increased Yield•Fewer defects
For
per
sona
l use
onl
y

Competitive Advantage
Revenue/Sapphire Boule with Competitor HPA vs. Polar HPA (USD $/Boule1)
$720 $720
$5,580 $5,580
$1,575$6,300
$7,875
Competitor HPA
Additional Revenue/Boule -Increased Yield
HPA Material Cost
• Full value of Polar Sapphire HPA is ~USD $77/KG:o $24/KG2 ($720/30 KG
bouleo $53/KG3 ($1,575/30 KG
boule) – additional revenue, given 25% increase in ingot yield per boule from Polar Sapphire HPA
1. One sapphire boule is ~30 KG2. Source: Rosckill3. Polar analysis. Value to customer of using Polar HPA, assumes customer increases revenue by 25 % per boule from increased yield
and fewer defects
2
1
2
1
13
Total Revenue per
Boule (Using Polar
HPA)Total Revenue per
Boule (Using Competitors’ HPA)
Polar HPA generates 25% more revenue for producers than competitor HPA
Notes:
For
per
sona
l use
onl
y

Business Model
14
Polar’s proprietary low-energy process generates one of the world’s highest-purity, lowest production cost alumina• Simple process uses aluminium to produce high quality 5N HPA, which
few can compete with.• Polar forecast production cost $7/kg*, equivalent to competitor 4N cost• Low cost ensures strong sustainable margins • PUA will look to reduce input costs further by implementing this
technology into its current Kaolin process
* Refer slide 31 for production cost methodology and detailed break down of production costs
For
per
sona
l use
onl
y

Kaolin Based HPA Manufacturing Process
15
Capital intensive and complex
For
per
sona
l use
onl
y

Polar’s HPA Manufacturing Process
16
• Significantly reduced capital from fewer process stages
• Lower forecast operating costs• In production now• Short lead time (12 months) to
commercial production & cash flow• Low scale-up risk
Simple cheaper process
For
per
sona
l use
onl
y

Polar’s Unique IP is Patented
17
Polar’s proprietary HPA process is protected by 2 patents• The patents are granted in
the USA• Patent applications have been
lodged in other jurisdictions and are pending
• Patent protection significantly mitigates risk of competition
For
per
sona
l use
onl
y

The Transaction Timeline
The indicative transaction timeline is:• Sign non-Binding Heads of Agreement
• Sign Binding Agreement
• Due Diligence
• Roadshow and Capital Structure
• Transaction approvals inc. ASX
• Shareholder meeting
• Transaction Completion
June
July
Aug
Aug
18
Sapphire Crystal Boule made from Polar HPA
For
per
sona
l use
onl
y

Strategy Post Transaction
19
Note: Potential expansion and cost reduction are current expectations only and may change with market conditions• Forecast is based on continued expansion of production• Sales volumes are uncertain and may not achieve expectations
-
1,000
2,000
3,000
4,000
5,000
6,000
$6,000
$6,500
$7,000
$7,500
$8,000
$8,500
$9,000
2020 2021 2022 2023
Tonn
es S
old
Ope
ratin
g Co
st (U
S$/T
onne
)
Production Ramp Up and Decline in Operating Cost per Tonne
Tonnes Sold Operating Cost (US$per Tonne)
For
per
sona
l use
onl
y

Financial Projections
HPA Price Range by Purity Level(USD $/KG)
$6
$8
$30
$20
$30
$60
HPA 99.99% (4N)
HPA 99.999% (5N)
HPA 99.9999%(6N)
LowHigh
Polar – Impact of Pricing per 1,000t of HPA Production
1. All figures in USDSource; Polar Sapphire sales and market analysis 20
HPA prices can vary significantly by purity, geography, and customer; Polar is using conservative price assumptions
Pure Alumina is using a conservative price of $20/kg
PRICE EBITDA$ 10.00 $3.25m$ 15.00 $8.25m$ 20.00 $13.25m$ 25.00 $18.25m$ 30.00 $23.25m
For
per
sona
l use
onl
y

Experienced Board
21
Tom Eadie – Chairman• 20+ years as Geologist and mining executive
Scott Nichol – Managing Director• Founder and creator of Polar Sapphire Technology • 10+ years experience in C-suite roles in manufacturing and solar energy
Martin McFarlane – Non-Executive Director • 25+ years of resources experience, 8+ years in battery materials• B.Eng, B.Bus
Wayne Maddever – Non-Executive Director• Experienced director and manager of technology start ups, Polar founding Director• pH.D in Metallurgical and Materials Science
Robert Boston – Non-Executive Director• 15+ years of mining experience and experienced lawyer• B.Comm, B.LLB, Grad Dip App.Fin, Dip Man
Tom Rand – Non-Executive Director• Partner at Arctern Ventures, largest investor in Polar. • Sits on the board of a number of cleantech companies
For
per
sona
l use
onl
y

Corporate Snapshot
22
ASX Code: PUAOrdinary Shares 221.8mListed Options 52.2mUnlisted Options 29.2mMarket cap (@$0.037) $8.2m52 week high-low (A$) $0.096-$0.026Cash (12 June 2019) $1.7m
PUA Shareholders Post $30m Capital Raising (at indicative 3.5¢ per share)
%
Existing PUA shareholders 13.7%Existing Polar Sapphire shareholders 28.4%New Shareholders 57.9%
A share consolidation may be considered at the time of the capital raising and subsequent shareholder meeting
0.00
0.01
0.02
0.03
0.04
0.05
0.06
0.07
0.08
0.09
0.10
0.00
1.00
2.00
3.00
4.00
5.00
6.00
7.00
8.00
9.00
10.00Share Price Performance and Volume to 12 June
Volu
me(
'm)
Pric
e ($
)
Top Shareholders - 12 June 2019 %Tolga Kumova 7.2%Thea Management Pty Ltd (Chairman) 4.1%Robert Hallas 2.0%BNP Paribas 1.6%Andrew Brown 1.4%Board and Management (ex Chairman) 1.9%Top 20 32.4%
For
per
sona
l use
onl
y

Polar Sapphire – Capital Structure
23
Shareholder Total Common Shares
Issued Fully Diluted %
Scott Nichol (founder, CEO) 1,800,000 37.0%Daniel Smith (founder, COO) 100,000 2.1%YiYi Ventures (private company) 166,666 3.4%ArcTern Fund I 2,166,666 44.5%ArcTern SPV VI, L.P. 506,952 10.4%Others 124,999 2.6%Total - Shares 4,865,283 100%
• All current shareholders in Polar Sapphire will remain significant shareholders in Pure Alumina
• Supportive shareholder base with high level of knowledge about technology and operations
Existing shareholdings of Polar Sapphire prior to the proposed acquisition by Pure Alumina
For
per
sona
l use
onl
y

Intended Use of Proceeds
24
Intended Use of Funds Amount
Cash to Polar ShareholdersVC Preferred Shareholders $6.5mCurrent Management $2.15mOther Shareholders $3.35m
Capex for 1000t per Year Plant $15mGeneral Working Capital $3mTotal $30m
For
per
sona
l use
onl
y

Investment Highlights
One of the world’s highest quality, lowest cost HPA suppliers
1
Rapid market growth and order backlog
Compelling valuation and lower risk proposition vs industry peers
CapEx substantially lower than other potential HPA suppliers – near term cash flow positive
25
2
3
4
For
per
sona
l use
onl
y

Appendix
For
per
sona
l use
onl
y

Manufacturing Process and Products
Polar HPA Manufacturing Process
Dissolve aluminum/ore in HCl acid to make PAC
Heat and calcinate PAC into alumina powder
Mill powder
Spray dry powder
Press powder into pucks
Sinter pucks
1
2
3
4
5
6
• 2 patents granted in US• Patents pending in China and Canada• Patents cover manufacturing process• All equipment is custom-made, and process
cannot be replicated with standard equipment
Polar HPA Products and Applications
Beads
Pucks
Powder
Sapphire Boule
LEDs
Other Sapphire
Semiconductors
Phosphor (for Plasma Displays)
Lithium-Ion Battery Separators
Other
27
Polar Sapphire’s unique HPA production process is protected by patents and custom-made equipment
For
per
sona
l use
onl
y

Execution Plan
Sapphire Market (LEDs and Other Applications)
• Secure letters of intent (LOIs) or contracts with 2-3 potential customers for at least 1 MT/day
• Customers will be offered discounted price on initial orders, incentivizing them to confirm yield benefits at scale and qualify Polar Sapphire HPA with end-users (after which full price will be charged)
• Continue to grow customer pipeline and work with existing companies in pipeline to convert from testing to commercial orders
• Build commercial-scale factory (5,000 MT/year) to satisfy demand, beginning with 3 lines and ramping up to 15 lines, with expansion beyond this based on demand
Lithium-Ion Battery Separators
• Research into the development of battery grade HPA for use in lithium ion battery separators is underway
• Technical assistance agreement signed with major separator manufacturer to fast track the development process
• Discussions with separator manufacturers are underway, with initial samples for testing currently being prepared
• Potential to secure grant funding from Canadian government sources to fund R&D
28
Polar Sapphire will initially focus on the large and growing market for HPA in sapphire production (for LEDs and other applications)
For
per
sona
l use
onl
y

Customer Pipeline
• Estimated to be ~70 sapphire manufacturers globally
• Most sapphire manufacturers are located in Asia (China, South Korea, and Japan); 50% est. to be in China
• Other manufacturing locations include Taiwan, Europe, and US
Source: Benchmark Minerals; Polar Sapphire Analysis
29
Estimated to be ~70 sapphire manufacturers (main customers) globally, with the majority located in China
For
per
sona
l use
onl
y

Competition – Current HPA Producers
HPA Producers (Market Share by Volume, Global, 2015)
Other (15), 18% RSA Le
Rubis (France), 3%
Dailian Rall (China), 3%
Huantou (China), 4%
Nippon Light Metal (Japan), 6%
Xuancheng Jing Rui
(China), 6%Baikowski
(France), 6%Sasol (South Africa), 9%
Zibo Xinfumeng
(China), 13%
Hebei Pengda (China),
15%
Sumitomo Chemicals
(Japan), 16%
HPA Producers (Tons/Year, Global, 2015)
Company Country Tons/Year
Sumitomo Chemicals Japan 3,020
Hebei Pengda China 3,000
Zibo Xinfumeng China 2,500
Sasol South Africa 1,800
Xuancheng Jing Rui China 1,200
Baikowski France 1,200
Nippon Light Metal Japan 1,100
Huantou China 800
RSA Le Rubis France 600
Dailian Rall China 600
Other (15) N/A 3,570
Source: Technavio
30
There are ~25 HPA producers globally, with the majority of production in Asia
For
per
sona
l use
onl
y

Polar’s HPA – Production Cost
Source: Polar Sapphire Analysis
31
Aluminum, $3.05
Chemicals, $0.29
Energy, $1.11
Consumables, $0.12
Labour, $1.31
Shipping, $0.25
Factory Lease, $0.29 Insurance, $0.17 Consultants, $0.09
US$ / KG Total estimated cost of production of US$6.70/kg is based on:• results achieved by Polar Sapphire from
operating their Pilot line• consumables, chemicals, energy costs,
lease and labor based on rates in Ontario, Canada
• based on 3,000 tpa HPA production –assumes US$36m capital investment to achieve this capacity
• depreciation estimated at $0.98 USD/kg based on Polar Sapphire estimate
• aluminum prices based on purchases made, cost may vary depending on supplier, purity, volume ordered and market conditions
For
per
sona
l use
onl
y

Sapphire Boule Production Cost
Seed, Water, Argon, 30%
Labor, 4%
HPA, 10%
Power, 13%
Hot Zone, 27%
Crucible, 16%
Sapphire Boule Production Cost Breakdown
32
HPA represents ~10% of the total sapphire boule production cost
For
per
sona
l use
onl
y

Polar Technology Solves Orbite Issues
33
• Calcining step is a major challenge for all HPA companies that use a hydrochloric acid-based process
• Orbite has not resolved calcining yet and this contributed to their bankruptcy issues
• Polar developed and proved its own calcining technology at its pilot plant, eliminating scale up risk
• Polar’s proprietary HPA process has much lower initial and total capex than Orbite’sF
or p
erso
nal u
se o
nly