
Generalized spectral phase-only time-domain ptychographic ...
Upload
truongnguyetCategory
view
250download
0
Ptychographic hyperspectralspectromicroscopy with an extreme ultraviolethigh harmonic comb
BOSHENG ZHANG,* DENNIS F. GARDNER, MATTHEW H. SEABERG,ELISABETH R. SHANBLATT, CHRISTINA L. PORTER, ROBERT KARLJR., CHRISTOPHER A. MANCUSO, HENRY C. KAPTEYN, MARGARETM. MURNANE, AND DANIEL E. ADAMS
JILA, University of Colorado, 440 UCB, Boulder, Colorado 80309, USA∗[email protected]
Abstract: We report a proof-of-principle demonstration of a new scheme of spectromicroscopyin the extreme ultraviolet (EUV) spectral range, where the spectral response of the sample atdifferent wavelengths is imaged simultaneously. This scheme is enabled by combining ptycho-graphic information multiplexing (PIM) with a tabletop EUV source based on high harmonicgeneration, where four spectrally narrow harmonics near 30 nm form a spectral comb structure.Extending PIM from previously demonstrated visible wavelengths to the EUV/X-ray wavelengthspromises much higher spatial resolution and a more powerful spectral contrast mechanism, mak-ing PIM an attractive spectromicroscopy method in both microscopy and spectroscopy aspects.In addition to spectromicroscopy, this method images the multicolor EUV beam in situ, makingthis a powerful beam characterization technique. In contrast to other methods, the techniquesdescribed here use no hardware to separate wavelengths, leading to efficient use of the EUVradiation.
c© 2016 Optical Society of America
OCIS codes: (110.4234) Multispectral and hyperspectral imaging; (180.7460) X-ray microscopy; (310.3840) Materialsand process characterization; (100.5070) Phase retrieval.
References and links1. D. Wilson, D. Rudolf, C. Weier, R. Adam, G. Winkler, R. Frömter, S. Danylyuk, K. Bergmann, D. Grützmacher, C. M.
Schneider, and L. Juschkin, “Generation of circularly polarized radiation from a compact plasma-based extremeultraviolet light source for tabletop X-ray magnetic circular dichroism studies,” Rev. Sci. Instrum. 85, 103110 (2014).
2. J. P. Strachan, G. Medeiros-Ribeiro, J. J. Yang, M-X Zhang, F. Miao, I. Goldfarb, M. Holt, V. Rose, and R. S.Williams, “Spectromicroscopy of tantalum oxide memristors,” Appl. Phys. Lett. 98, 242114 (2011).
3. H. Ade and B. Hsiao, “X-ray linear dichroism microscopy,” Science 262, 1427–1429 (1993).4. H. Ade, J. Kirz, S. L. Hulbert, E. D. Johnson, E. Anderson, and D. Kern, “X-ray spectromicroscopy with a zone plate
generated microprobe,” Appl. Phys. Lett. 56, 1841–1843 (1990).5. P. Horowitz and J. A. Howell, “A scanning x-ray microscope using synchrotron radiation,” Science 178, 608–611
(1972).6. D. J. Batey, D. Claus, and J. M. Rodenburg, “Information multiplexing in ptychography,” Ultramicroscopy 138,
13–21 (2014).7. H. M. L. Faulkner and J. M. Rodenburg, “Movable aperture lensless transmission microscopy: a novel phase retrieval
algorithm,” Phys. Rev. Lett. 93, 023903 (2004).8. J. M. Rodenburg, A. C. Hurst, A. G. Cullis, B. R. Dobson, F. Pfeiffer, O. Bunk, C. David, K. Jefimovs, and I. Johnson,
“Hard-X-ray lensless imaging of extended objects,” Phys. Rev. Lett. 98, 034801 (2007).9. P. Thibault, M. Dierolf, A. Menzel, O. Bunk, C. David, and F. Pfeiffer, “High-resolution scanning x-ray diffraction
microscopy,” Science 321, 379–382 (2008).10. M. D. Seaberg, B. Zhang, D. F. Gardner, E. R. Shanblatt, M. M. Murnane, H. C. Kapteyn, and D. E. Adams, “Tabletop
nanometer extreme ultraviolet imaging in an extended reflection mode using coherent Fresnel ptychography,” Optica1, 39–44 (2014).
11. B. Zhang, D. F. Gardner, M. D. Seaberg, E. R. Shanblatt, H. C. Kapteyn, M. M. Murnane, and D. E. Adams, “Highcontrast 3D imaging of surfaces near the wavelength limit using tabletop EUV ptychography,” Ultramicroscopy 158,98–104 (2015).
12. P. Thibault and A. Menzel, “Reconstructing state mixtures from diffraction measurements,” Nature 494, 68–71(2013).
Vol. 24, No. 16 | 8 Aug 2016 | OPTICS EXPRESS 18745
#268239 http://dx.doi.org/10.1364/OE.24.018745 Journal © 2016 Received 20 Jun 2016; revised 27 Jul 2016; accepted 28 Jul 2016; published 5 Aug 2016
13. R. Karl, C. Bevis, R. Lopez-Rios, J. Reichanadter, D. Gardner, C. Porter, E. Shanblatt, M. Tanksalvala, G. F. Mancini,M. Murnane, H. Kapteyn, and D. Adams, “Spatial, spectral, and polarization multiplexed ptychography,” Opt.Express 23, 30250–30258 (2015).
14. A. Rundquist, C. G. Durfee III, Z. Chang, C. Herne, S. Backus, M. M. Murnane, and H. C. Kapteyn, “Phase-matchedgeneration of coherent soft X-rays,” Science 280, 1412–1415 (1998).
15. R. A. Bartels, S. Backus, E. Zeek, L. Misoguti, G. Vdovin, I. P. Christov, M. M. Murnane, and H. C. Kapteyn,“Shaped-pulse optimization of coherent emission of high-harmonic soft X-rays,” Nature 406, 164–166 (2000).
16. M.-C. Chen, P. Arpin, T. Popmintchev, M. Gerrity, B. Zhang, M. D. Seaberg, D. Popmintchev, M. M. Murnane, andH. C. Kapteyn, “Bright, coherent, ultrafast soft X-ray harmonics spanning the water window from a tabletop lightsource,” Phys. Rev. Lett. 105, 173901 (2010).
17. T. Popmintchev, M.-C. Chen, D. Popmintchev, P. Arpin, S. Brown, S. Ališauskas, G. Andriukaitis, T. Balciunas,O. D. Mücke, A. Pugzlys, A. Baltuška, B. Shim, S. E. Schrauth, A. Gaeta, C. Hernández-García, L. Plaja, A. Becker,A. Jaron-Becker, M. M. Murnane, and H. C. Kapteyn, “Bright coherent ultrahigh harmonics in the keV x-ray regimefrom mid-infrared femtosecond lasers,” Science 336, 1287–1291 (2012).
18. D. Popmintchev, C. Hernández-García, F. Dollar, C. A. Mancuso, J. A. Pérez-Hernández, M.-C. Chen, A. Hankla,X. Gao, B. Shim, A. L. Gaeta, M. Tarazkar, D. A. Romanov, R. J. Levis, J. A. Gaffney, M. Foord, S. B. Libby,A. Jaron-Becker, A. Becker, L. Plaja, M. M. Murnane, H. C. Kapteyn, and T. Popmintchev, “Ultraviolet surprise:Efficient soft x-ray high-harmonic generation in multiply ionized plasmas,” Science 350, 1225–1231 (2015).
19. T. Fan, P. Grychtol, R. Knut, C. Hernández-García, D. D. Hickstein, D. Zusin, C. Gentry, F. J. Dollar, C. A. Mancuso,C. W. Hogle, O. Kfir, D. Legut, K. Carva, J. L. Ellis, K. M. Dorney, C. Chen, O. G. Shpyrko, E. E. Fullerton, O.Cohen, P. M. Oppeneer, D. B. Miloševic, A. Becker, A. A. Jaron-Becker, T. Popmintchev, M. M. Murnane, and H. C.Kapteyn, “Bright circularly polarized soft X-ray high harmonics for X-ray magnetic circular dichroism,” Proc. Natl.Acad. Sci. U.S.A. 112, 14206–14211 (2015).
20. R. A. Bartels, A. Paul, M. M. Murnane, H. C. Kapteyn, S. Backus, Y. Liu, and D. T. Attwood, “Absolute determinationof the wavelength and spectrum of an extreme-ultraviolet beam by a Young’s double-slit measurement,” Opt. Lett.27, 707–709 (2002).
21. R. L. Sandberg, A. Paul, D. A. Raymondson, S. Hädrich, D. M. Gaudiosi, J. Holtsnider, R. I. Tobey, O. Cohen, M. M.Murnane, H. C. Kapteyn, C. Song, J. Miao, Y. Liu, and F. Salmassi, “Lensless eiffractive imaging using tabletopcoherent high-harmonic soft-X-ray beams,” Phys. Rev. Lett. 99, 098103 (2007).
22. M. D. Seaberg, D. E. Adams, E. L. Townsend, D. A. Raymondson, W. F. Schlotter, Y. Liu, C. S. Menoni, L. Rong,C.-C. Chen, J. Miao, H. C. Kapteyn, and M. M. Murnane, “Ultrahigh 22 nm resolution coherent diffractive imagingusing a desktop 13 nm high harmonic source,” Opt. Express 19, 22470–22479 (2011).
23. B. Zhang, M. D. Seaberg, D. E. Adams, D. F. Gardner, E. R. Shanblatt, J. M. Shaw, W. Chao, E. M. Gullikson,F. Salmassi, H. C. Kapteyn, and M. M. Murnane, “Full field tabletop EUV coherent diffractive imaging in atransmission geometry,” Opt. Express 21, 21970–21980 (2013).
24. D. F. Gardner, B. Zhang, M. D. Seaberg, L. S. Martin, D. E. Adams, F. Salmassi, E. M. Gullikson, H. C. Kapteyn, andM. M. Murnane, “High numerical aperture reflection mode coherent diffraction microscopy using off-axis aperturedillumination,” Opt. Express 20, 19050–19059 (2012).
25. B. Chen, R. A. Dilanian, S. Teichmann, B. Abbey, A. G. Peele, G. J. Williams, P. Hannaford, L. Van Dao, H. M.Quiney, and K. A. Nugent, “Multiple wavelength diffractive imaging,” Phys. Rev. A 79, 023809 (2009).
26. B. Abbey, L. W. Whitehead, H. M. Quiney, D. J. Vine, G. A. Cadenazzi, C. A. Henderson, K. A. Nugent, E. Balaur,C. T. Putkunz, A. G. Peele, G. J. Williams, and I. McNulty, “Lensless imaging using broadband X-ray sources,” Nat.Photonics 5, 420–424 (2011).
27. S. Witte, V. T. Tenner, D. WE Noom, and K. SE Eikema, “Lensless diffractive imaging with ultra-broadband table-topsources: from infrared to extreme-ultraviolet wavelengths,” Light Sci. Appl. 3, e163 (2014).
28. M. D. Seaberg, “Nanoscale EUV microscopy on a tabletop: a general transmission and reflection mode microscopebased on coherent diractive imaging with high harmonic illumination,” Ph.D. Thesis, University of Colorado (2014).
29. F. Zhang, I. Peterson, J. Vila-Comamala, A. Diaz, F. Berenguer, R. Bean, B. Chen, A. Menzel, I. K. Robinson, andJ. M. Rodenburg, “Translation position determination in ptychographic coherent diffraction imaging,” Opt. Express21, 13592–13606 (2013).
30. B. L. Henke, E. M. Gullikson, and J. C. Davis, “X-ray interactions: Photoabsorption, scattering, transmission, andreflection at E = 50-30,000 eV, Z = 1-92,” At. Data Nucl. Data Tables 54, 181–342 (1993).
31. R. H. T. Bates, “Fourier phase problems are uniquely uolvable in more than one dimension. I: Underlying theory,”Optik 61, 247–262 (1982).
32. K. M. Hoogeboom-Pot, J. N. Hernandez-Charpak, X. Gu, T. D. Frazer, E. H. Anderson, W. Chao, R. W. Falcone,R. Yang, M. M. Murnane, H. C. Kapteyn, and D. Nardi, “A new regime of nanoscale thermal transport: Collectivediffusion increases dissipation efficiency,” Proc. Natl. Acad. Sci. U.S.A. 112, 4846–4851 (2015).
33. E. Turgut, C. La-o-vorakiat, J. M. Shaw, P. Grychtol, H. T. Nembach, D. Rudolf, R. Adam, M. Aeschlimann, C. M.Schneider, T. J. Silva, M. M. Murnane, H. C. Kapteyn, and S. Mathias, “Controlling the competition betweenoptically induced ultrafast spin-flip scattering and spin transport in magnetic multilayers,” Phys. Rev. Lett. 110,197201 (2013).
Vol. 24, No. 16 | 8 Aug 2016 | OPTICS EXPRESS 18746
1. Introduction
New imaging capabilities are driving revolutionary advances in science and technology, makingit possible to image biological systems in three dimensions with stunning detail. For materi-als systems that cannot be labeled using fluorescent markers, and that are opaque to visiblelight, shorter wavelength light has advantages. As nanosystems relevant to the semiconductorindustry become increasingly complex, there is a critical need for microscopy techniques thatcan distinguish between different materials. This capability is realized using spectromicroscopytechniques in the extreme ultraviolet (EUV) and X-ray range [1, 2], which take advantage ofelement-specific absorption contrast. However, established techniques such as near edge X-rayabsorption fine structure (NEXAFS) [3], X-ray absorption near edge structure (XANES) [4],and X-ray fluorescence [5] spectromicroscopies can only record images at one wavelength at atime: either a monochromator or spectrometer must be scanned in order to collect a full series ofimages. In contrast, ptychographic information multiplexing [6] (PIM), which is an extension toptychographic coherent diffractive imaging (CDI), enables the collection of images at multiplewavelengths simultaneously. When combined with EUV and X-ray wavelengths, this techniquecan be used to produce images with elemental contrast without the need for wavelength scanning.
Ptychographic CDI [7–11] has achieved great success due to its high fidelity and robustness insituations where other CDI methods fail. In a ptychographic microscope, the object is scannedarea-by-area to record a diffraction pattern at each scan position, ensuring overlap betweenadjacent scan positions. The diffraction patterns and scan locations are then fed into an iterativealgorithm, to retrieve the phase of the diffracted fields. By back-propagating the diffraction field tothe sample position, complex-valued images of the object are obtained with quantitative amplitudeand phase information. Scanning with overlap is a simple, yet elegant way of introducingredundant information into the diffraction-based measurements, distinguishing ptychographyfrom other computational imaging techniques.
In addition to removing experimental restrictions required for other types of CDI, suchas sample isolation, recent breakthroughs demonstrate that the information redundancy inptychography also enables the reconstruction of state mixtures, i.e. the decomposition of mutuallyincoherent modes [6, 12, 13]. Thibault and Menzel [12] demonstrated the reconstruction of fivedominant spatial modes in a partially coherent X-ray beam used for ptychography illumination.Shortly thereafter, Batey et al. [6] simultaneously illuminated a sample with three separatesingle-color visible lasers with blue, green and red wavelengths, and successfully recovered thesample’s response for each of these three colors using the PIM technique.
CDI requires light sources with a high degree of spatial coherence. To address this challengeat short wavelengths, coherent light sources based on tabletop high harmonic generation (HHG)and large-scale free electron lasers (FELs) are under rapid development. High harmonic gen-eration [14–19] is an extreme nonlinear process that coherently upconverts infrared, visible, orUV light to extreme ultraviolet (EUV) and X-ray wavelengths. HHG is unique as a light sourcebecause the generation conditions can be adjusted so that the light emerges either as a coherent su-percontinuum (corresponding to an isolated attosecond burst in time), or as a comb of harmonics,with periodicity both in space and time. Under the right conditions, the harmonics are spectrallynarrow (∆λ/λ < 1%) [15, 20] and also tunable by changing the driving laser wavelength orchirp. Since its demonstration in 2007, CDI using HHG sources has become a successful imag-ing modality, enabling high resolution image reconstruction both in transmission [21–23] andmore recently in reflection [10, 11, 24]. Despite these successes, HHG CDI contains untappedpotential because the spectral structure of HHG has been underutilized. Indeed, recent work usedbroadband HHG beams as a way to make more efficient use of available photons [25, 26], byassuming that the object looks identical at all constituent wavelengths [25–27].
In this work, we extend PIM [6] to utilize multiple high harmonics as the illumination source,thereby employing an important spectral range offering element-specific contrast due to nearby
Vol. 24, No. 16 | 8 Aug 2016 | OPTICS EXPRESS 18747
absorption edges. By relaxing the previous assumption of a uniform spectral response, weretrieve a wealth of information about the sample, including the spectrally-dependent amplitudeand phase that encode the sample composition and topography. To achieve this, we illuminatethe sample with several harmonic orders simultaneously, and employ the PIM algorithm toreconstruct independent images at each wavelength. Thus, in addition to high-contrast, high-spatial-resolution imaging systems, we can now achieve intrinsic element-specific contrast atmultiple wavelengths simultaneously. The information redundancy in ptychography allows notonly the sample, but also the illumination, to be imaged, enabling us to also demonstrate in situimaging of a multicolor EUV beam. Finally, we note that the combination of a comb of coherentharmonics and the PIM algorithm is the most efficient use of HHG EUV radiation for imaging todate because there is no energy loss from any multilayer mirrors or monochromatizing optics.
2. Experiment
The experimental setup is shown in Fig. 1. Phase matched high harmonics near 30 nm weregenerated by focusing ultrashort pulses from a Ti:Sapphire amplifier (KMLabs Dragon, 790nm central wavelength, 5 kHz repetition rate, 1.5 mJ pulse energy, 22 fs pulse width) into ahollow waveguide (150 µm inner diameter, 5 cm long) filled with argon at 35 Torr. In contrastto previous experiments, no EUV multilayer mirrors were used to select a single harmonic.Instead, an ellipsoidal mirror refocused all the harmonics onto the sample, with an estimatedbeam diameter of 10 µm based on a knife-edge measurement. Due to geometrical constraintsof our imaging chamber, we added a pair of gold mirrors placed at an angle of 45◦ to directthe beam onto the necessary path. The sample (titanium features patterned on silicon [10]) wasplaced on a two-axis scanning stage at a 50.5◦ angle of incidence. Diffraction from the sample,which is an incoherent superposition of scattered light from all four harmonics, was measuredby an EUV-sensitive CCD (Andor) detector placed 55 mm away from the sample, and waspositioned normal to the specular reflection of the beam. The ptychographic scan consisted ofa 28 × 11 rectangular grid (with added random offsets up to 20% of the step size to preventperiodic artifacts in the reconstruction). Compared with single color ptychography, PIM tries toreconstruct images for multiple wavelengths, and more information requires more informationredundancy, which translates to smaller scanning step size for ptychography. We chose a scanningstep size of 1 µm to ensure enough information redundancy for the ptychographic dataset. Theequivalent numerical aperture (NA) of the collected diffraction is 0.086, providing a half-pitchresolution near 170 nm. The exposure time was set to 1.5 seconds to avoid saturation of the CCD.We accumulated three exposures at each position to increase the signal-to-noise ratio, resultingin a total exposure time of 23 minutes. Further optimization of the setup would enable removalof the gold mirrors, which have a combined reflectivity of only 2%. Keeping everything else thesame, the total exposure time could be reduced to 30 seconds.
To precisely determine the wavelengths of the harmonics, we placed a two-dimensional(2D), Λ = 300 nm period nano-pillar grating adjacent to the sample in the same plane. Thisgrating acted as a low-resolution spectrometer. Diffraction from this grating illuminated by theEUV harmonic comb is shown in Fig. 2(a). We can clearly see the first-order diffraction peakscorresponding to spatial frequency 1/Λ for different harmonics. We remapped [24] the diffractionpattern to a uniform grid of spatial frequencies normalized by 1/λ, with the result shown inFig. 2(b). The spectral intensity, calculated as the modulus square of the diffraction amplitudealong the magenta line in Fig. 2(b), is shown as a dashed line in Fig. 2(c), where the wavelengthaxis is calculated as the product of Λ and the normalized spatial frequency. The peaks are locatedat 29.1, 31.5, 34.6, and 38.1 nm, and correspond to harmonic orders 27, 25, 23, and 21 of thelaser driving wavelength centered at 790 nm. The spectrum obtained in this way is blurred dueto the fact that the HHG beam was not focused onto the detector (see dashed line in Fig. 2(c)).To obtain spectral intensities more representative of the actual HHG spectrum, we performed a
Vol. 24, No. 16 | 8 Aug 2016 | OPTICS EXPRESS 18748
29.1 nm
31.5 nm
34.6 nm
38.1 nmλ
Inte
nsity PIM
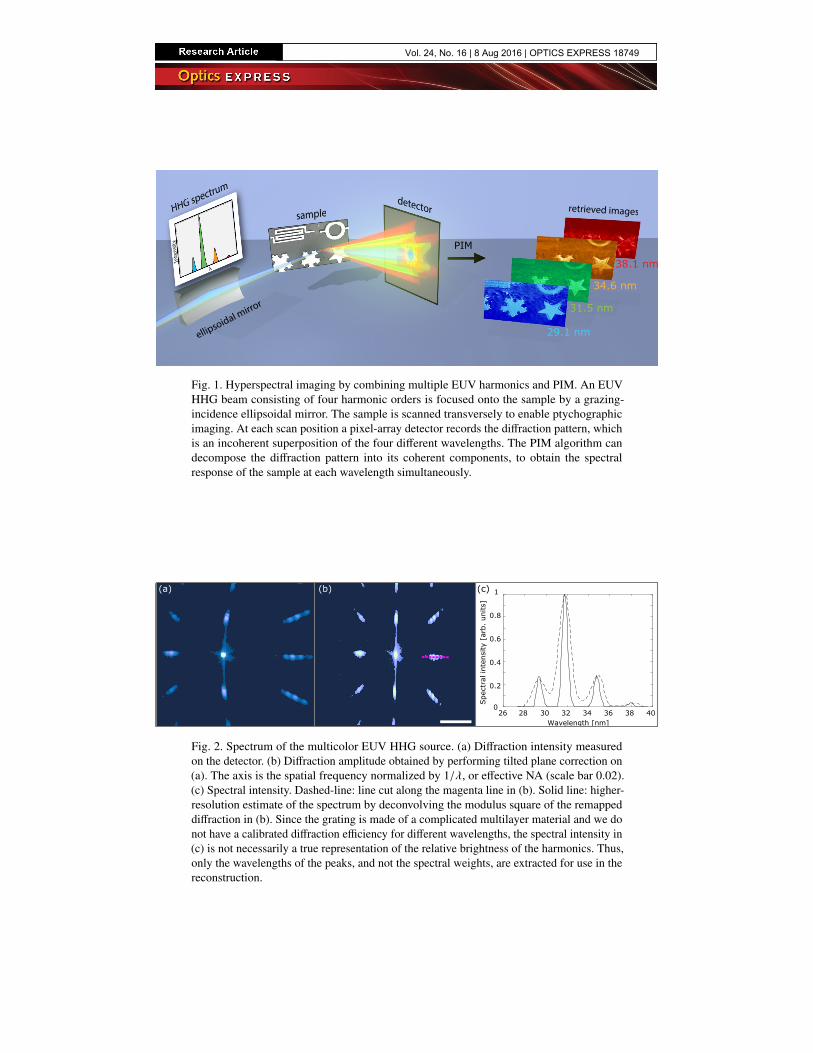
Fig. 1. Hyperspectral imaging by combining multiple EUV harmonics and PIM. An EUVHHG beam consisting of four harmonic orders is focused onto the sample by a grazing-incidence ellipsoidal mirror. The sample is scanned transversely to enable ptychographicimaging. At each scan position a pixel-array detector records the diffraction pattern, whichis an incoherent superposition of the four different wavelengths. The PIM algorithm candecompose the diffraction pattern into its coherent components, to obtain the spectralresponse of the sample at each wavelength simultaneously.
Spec
tral
inte
nsi
ty [
arb.
units]
0
0.2
0.4
0.6
0.8
1
26 28 30 32 4034 36 38Wavelength [nm]
26 28 30 32 34 36 38 400
0.1
0.2
0.3
0.4
0.5
0.6
0.7
0.8
0.9
1(a) (b) (c)
Fig. 2. Spectrum of the multicolor EUV HHG source. (a) Diffraction intensity measuredon the detector. (b) Diffraction amplitude obtained by performing tilted plane correction on(a). The axis is the spatial frequency normalized by 1/λ, or effective NA (scale bar 0.02).(c) Spectral intensity. Dashed-line: line cut along the magenta line in (b). Solid line: higher-resolution estimate of the spectrum by deconvolving the modulus square of the remappeddiffraction in (b). Since the grating is made of a complicated multilayer material and we donot have a calibrated diffraction efficiency for different wavelengths, the spectral intensity in(c) is not necessarily a true representation of the relative brightness of the harmonics. Thus,only the wavelengths of the peaks, and not the spectral weights, are extracted for use in thereconstruction.
Vol. 24, No. 16 | 8 Aug 2016 | OPTICS EXPRESS 18749
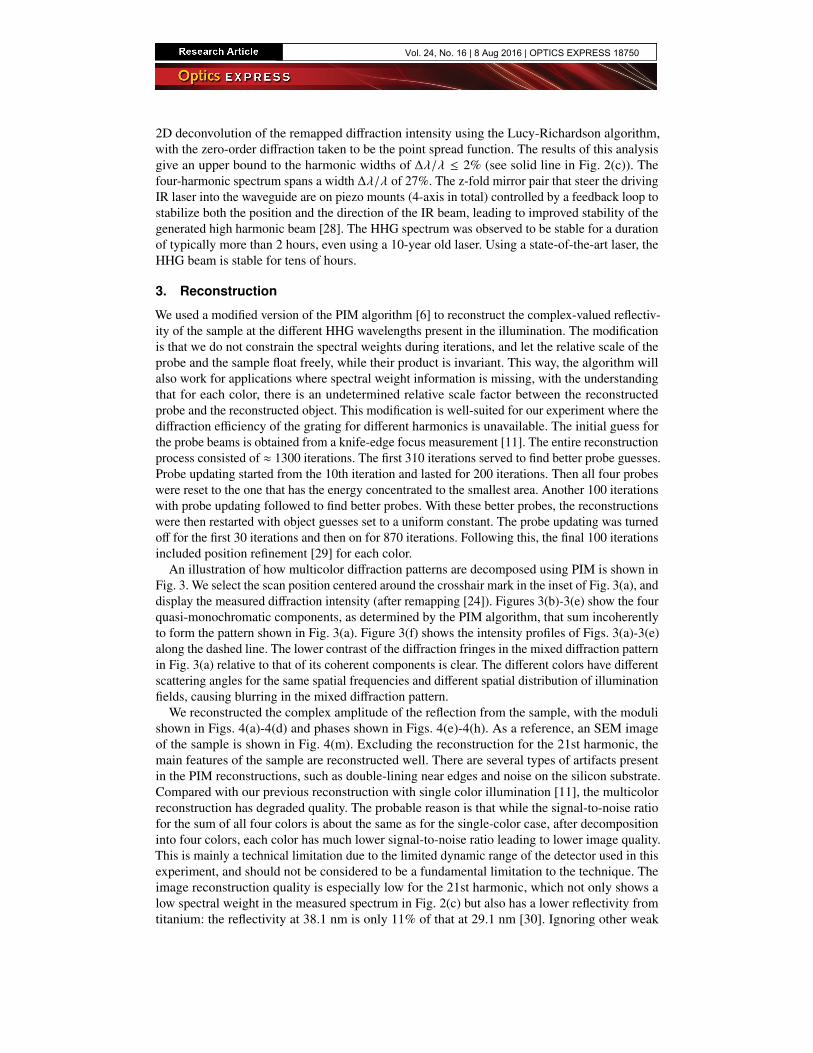
2D deconvolution of the remapped diffraction intensity using the Lucy-Richardson algorithm,with the zero-order diffraction taken to be the point spread function. The results of this analysisgive an upper bound to the harmonic widths of ∆λ/λ ≤ 2% (see solid line in Fig. 2(c)). Thefour-harmonic spectrum spans a width ∆λ/λ of 27%. The z-fold mirror pair that steer the drivingIR laser into the waveguide are on piezo mounts (4-axis in total) controlled by a feedback loop tostabilize both the position and the direction of the IR beam, leading to improved stability of thegenerated high harmonic beam [28]. The HHG spectrum was observed to be stable for a durationof typically more than 2 hours, even using a 10-year old laser. Using a state-of-the-art laser, theHHG beam is stable for tens of hours.
3. Reconstruction
We used a modified version of the PIM algorithm [6] to reconstruct the complex-valued reflectiv-ity of the sample at the different HHG wavelengths present in the illumination. The modificationis that we do not constrain the spectral weights during iterations, and let the relative scale of theprobe and the sample float freely, while their product is invariant. This way, the algorithm willalso work for applications where spectral weight information is missing, with the understandingthat for each color, there is an undetermined relative scale factor between the reconstructedprobe and the reconstructed object. This modification is well-suited for our experiment where thediffraction efficiency of the grating for different harmonics is unavailable. The initial guess forthe probe beams is obtained from a knife-edge focus measurement [11]. The entire reconstructionprocess consisted of ≈ 1300 iterations. The first 310 iterations served to find better probe guesses.Probe updating started from the 10th iteration and lasted for 200 iterations. Then all four probeswere reset to the one that has the energy concentrated to the smallest area. Another 100 iterationswith probe updating followed to find better probes. With these better probes, the reconstructionswere then restarted with object guesses set to a uniform constant. The probe updating was turnedoff for the first 30 iterations and then on for 870 iterations. Following this, the final 100 iterationsincluded position refinement [29] for each color.
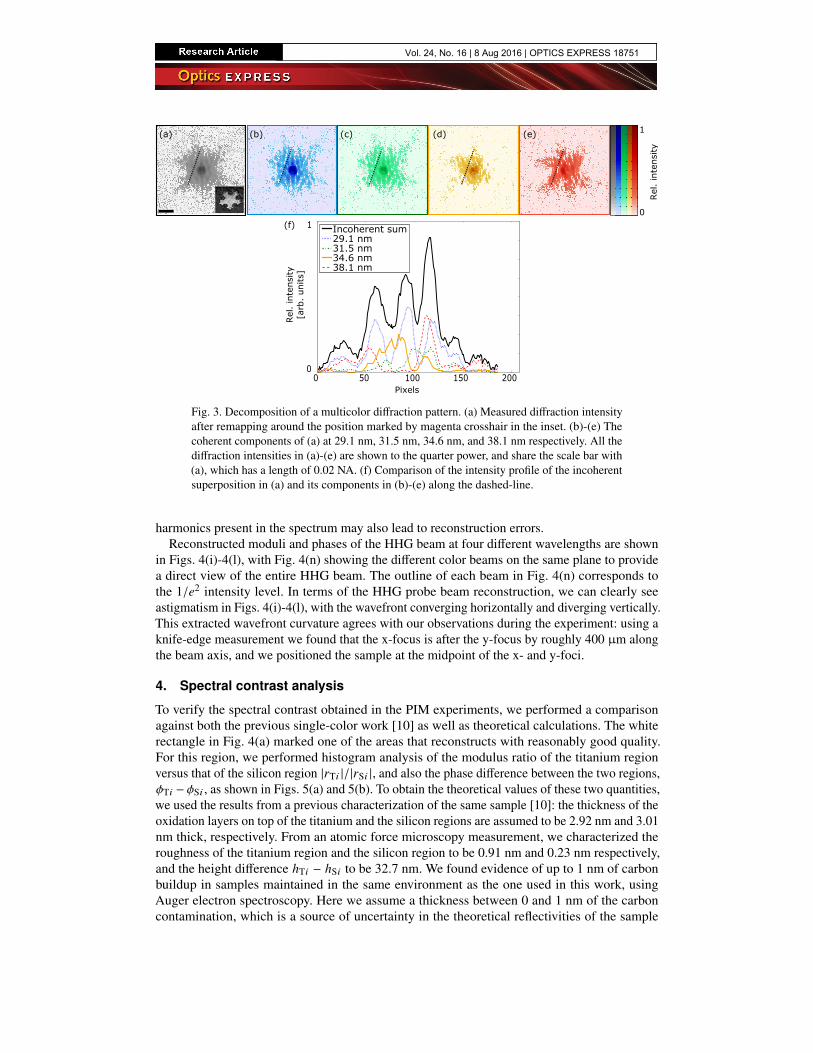
An illustration of how multicolor diffraction patterns are decomposed using PIM is shown inFig. 3. We select the scan position centered around the crosshair mark in the inset of Fig. 3(a), anddisplay the measured diffraction intensity (after remapping [24]). Figures 3(b)-3(e) show the fourquasi-monochromatic components, as determined by the PIM algorithm, that sum incoherentlyto form the pattern shown in Fig. 3(a). Figure 3(f) shows the intensity profiles of Figs. 3(a)-3(e)along the dashed line. The lower contrast of the diffraction fringes in the mixed diffraction patternin Fig. 3(a) relative to that of its coherent components is clear. The different colors have differentscattering angles for the same spatial frequencies and different spatial distribution of illuminationfields, causing blurring in the mixed diffraction pattern.
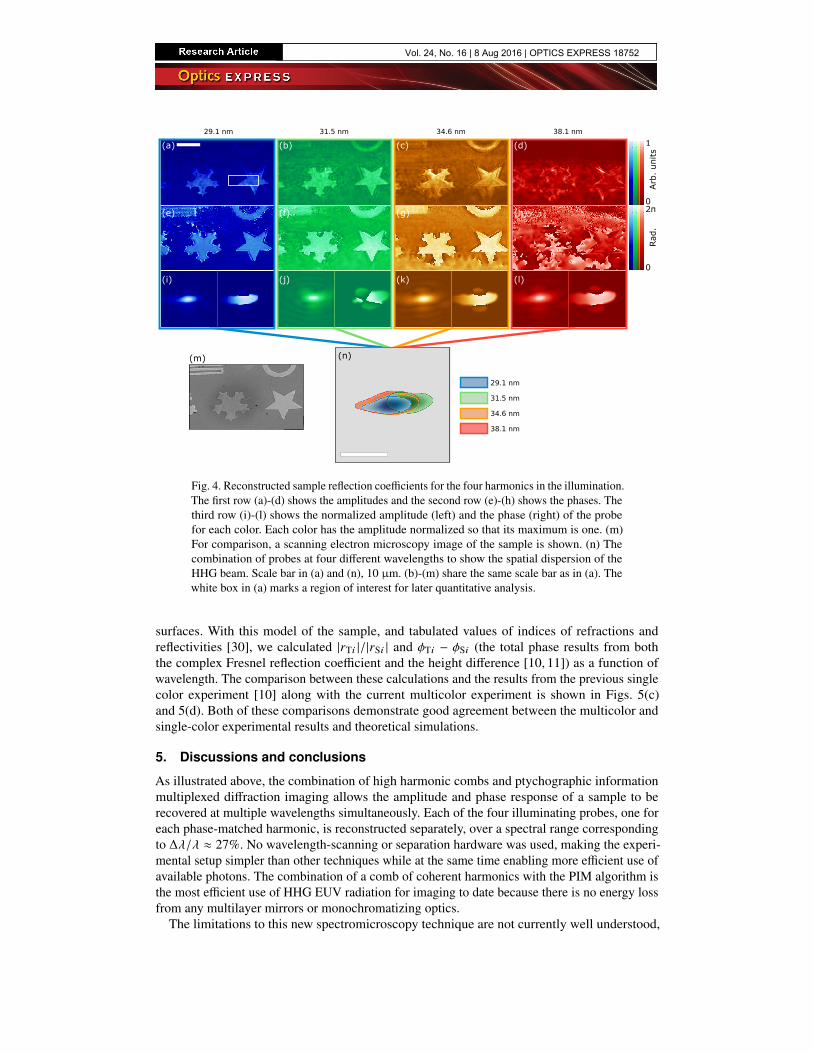
We reconstructed the complex amplitude of the reflection from the sample, with the modulishown in Figs. 4(a)-4(d) and phases shown in Figs. 4(e)-4(h). As a reference, an SEM imageof the sample is shown in Fig. 4(m). Excluding the reconstruction for the 21st harmonic, themain features of the sample are reconstructed well. There are several types of artifacts presentin the PIM reconstructions, such as double-lining near edges and noise on the silicon substrate.Compared with our previous reconstruction with single color illumination [11], the multicolorreconstruction has degraded quality. The probable reason is that while the signal-to-noise ratiofor the sum of all four colors is about the same as for the single-color case, after decompositioninto four colors, each color has much lower signal-to-noise ratio leading to lower image quality.This is mainly a technical limitation due to the limited dynamic range of the detector used in thisexperiment, and should not be considered to be a fundamental limitation to the technique. Theimage reconstruction quality is especially low for the 21st harmonic, which not only shows alow spectral weight in the measured spectrum in Fig. 2(c) but also has a lower reflectivity fromtitanium: the reflectivity at 38.1 nm is only 11% of that at 29.1 nm [30]. Ignoring other weak
Vol. 24, No. 16 | 8 Aug 2016 | OPTICS EXPRESS 18750
0
1
Rel
. in
tensi
ty
0 50 100 150 2000
1
Pixels
Incoherent sum29.1 nm31.5 nm34.6 nm38.1 nm
Rel
. in
tensi
ty
[arb
. units]
(a) (b) (c) (d) (e)
(f)
Fig. 3. Decomposition of a multicolor diffraction pattern. (a) Measured diffraction intensityafter remapping around the position marked by magenta crosshair in the inset. (b)-(e) Thecoherent components of (a) at 29.1 nm, 31.5 nm, 34.6 nm, and 38.1 nm respectively. All thediffraction intensities in (a)-(e) are shown to the quarter power, and share the scale bar with(a), which has a length of 0.02 NA. (f) Comparison of the intensity profile of the incoherentsuperposition in (a) and its components in (b)-(e) along the dashed-line.
harmonics present in the spectrum may also lead to reconstruction errors.Reconstructed moduli and phases of the HHG beam at four different wavelengths are shown
in Figs. 4(i)-4(l), with Fig. 4(n) showing the different color beams on the same plane to providea direct view of the entire HHG beam. The outline of each beam in Fig. 4(n) corresponds tothe 1/e2 intensity level. In terms of the HHG probe beam reconstruction, we can clearly seeastigmatism in Figs. 4(i)-4(l), with the wavefront converging horizontally and diverging vertically.This extracted wavefront curvature agrees with our observations during the experiment: using aknife-edge measurement we found that the x-focus is after the y-focus by roughly 400 µm alongthe beam axis, and we positioned the sample at the midpoint of the x- and y-foci.
4. Spectral contrast analysis
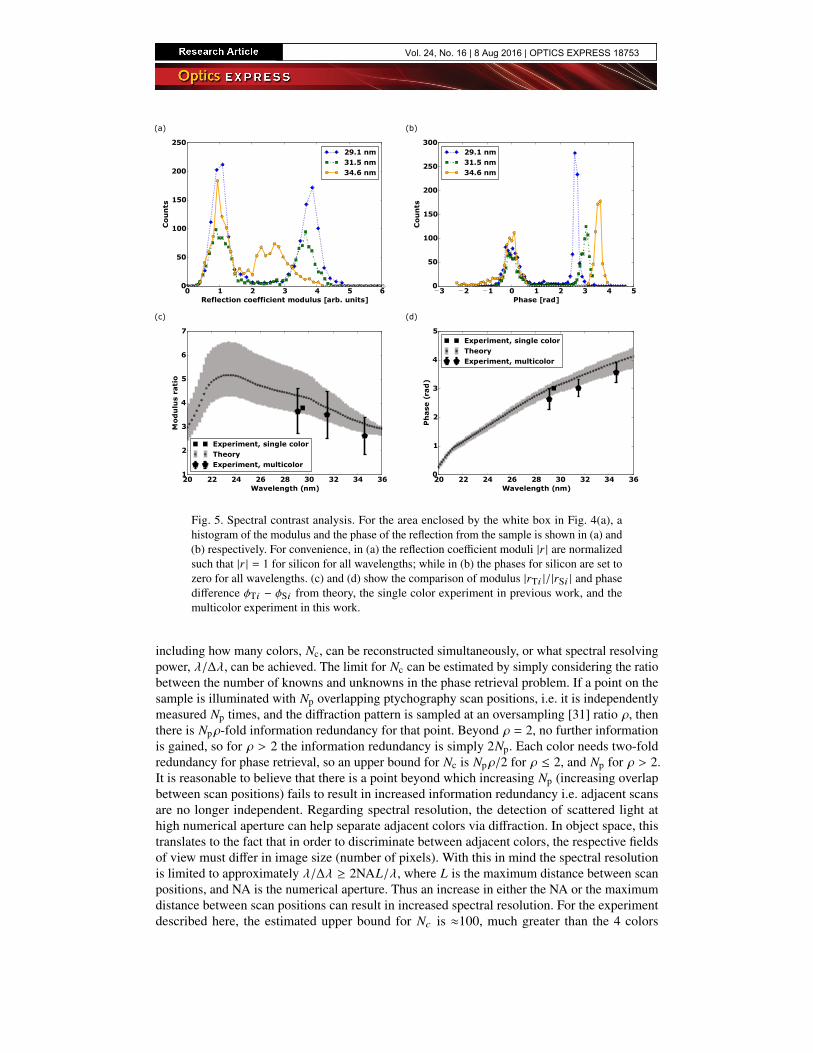
To verify the spectral contrast obtained in the PIM experiments, we performed a comparisonagainst both the previous single-color work [10] as well as theoretical calculations. The whiterectangle in Fig. 4(a) marked one of the areas that reconstructs with reasonably good quality.For this region, we performed histogram analysis of the modulus ratio of the titanium regionversus that of the silicon region |rTi |/|rSi |, and also the phase difference between the two regions,φTi − φSi , as shown in Figs. 5(a) and 5(b). To obtain the theoretical values of these two quantities,we used the results from a previous characterization of the same sample [10]: the thickness of theoxidation layers on top of the titanium and the silicon regions are assumed to be 2.92 nm and 3.01nm thick, respectively. From an atomic force microscopy measurement, we characterized theroughness of the titanium region and the silicon region to be 0.91 nm and 0.23 nm respectively,and the height difference hTi − hSi to be 32.7 nm. We found evidence of up to 1 nm of carbonbuildup in samples maintained in the same environment as the one used in this work, usingAuger electron spectroscopy. Here we assume a thickness between 0 and 1 nm of the carboncontamination, which is a source of uncertainty in the theoretical reflectivities of the sample
Vol. 24, No. 16 | 8 Aug 2016 | OPTICS EXPRESS 18751
0
1
Arb
. units
0
2π
Rad
.
(a) (b) (c) (d)
(e) (f) (g) (h)
(i) (j) (k) (l)
(m) (n)
Fig. 4. Reconstructed sample reflection coefficients for the four harmonics in the illumination.The first row (a)-(d) shows the amplitudes and the second row (e)-(h) shows the phases. Thethird row (i)-(l) shows the normalized amplitude (left) and the phase (right) of the probefor each color. Each color has the amplitude normalized so that its maximum is one. (m)For comparison, a scanning electron microscopy image of the sample is shown. (n) Thecombination of probes at four different wavelengths to show the spatial dispersion of theHHG beam. Scale bar in (a) and (n), 10 µm. (b)-(m) share the same scale bar as in (a). Thewhite box in (a) marks a region of interest for later quantitative analysis.
surfaces. With this model of the sample, and tabulated values of indices of refractions andreflectivities [30], we calculated |rTi |/|rSi | and φTi − φSi (the total phase results from boththe complex Fresnel reflection coefficient and the height difference [10, 11]) as a function ofwavelength. The comparison between these calculations and the results from the previous singlecolor experiment [10] along with the current multicolor experiment is shown in Figs. 5(c)and 5(d). Both of these comparisons demonstrate good agreement between the multicolor andsingle-color experimental results and theoretical simulations.
5. Discussions and conclusions
As illustrated above, the combination of high harmonic combs and ptychographic informationmultiplexed diffraction imaging allows the amplitude and phase response of a sample to berecovered at multiple wavelengths simultaneously. Each of the four illuminating probes, one foreach phase-matched harmonic, is reconstructed separately, over a spectral range correspondingto ∆λ/λ ≈ 27%. No wavelength-scanning or separation hardware was used, making the experi-mental setup simpler than other techniques while at the same time enabling more efficient use ofavailable photons. The combination of a comb of coherent harmonics with the PIM algorithm isthe most efficient use of HHG EUV radiation for imaging to date because there is no energy lossfrom any multilayer mirrors or monochromatizing optics.
The limitations to this new spectromicroscopy technique are not currently well understood,
Vol. 24, No. 16 | 8 Aug 2016 | OPTICS EXPRESS 18752
20 22 24 26 28 30 32 34 36Wavelength (nm)
0
1
2
3
4
5
Ph
ase
(ra
d)
Experiment, single colorTheoryExperiment, multicolor
20 22 24 26 28 30 32 34 36Wavelength (nm)
1
2
3
4
5
6
7
Mo
du
lus
rati
o
Experiment, single colorTheoryExperiment, multicolor
3 2 1 0 1 2 3 4 5Phase [rad]
0
50
100
150
200
250
300
Co
un
ts
29.1 nm31.5 nm34.6 nm
0 1 2 3 4 5 6Reflection coefficient modulus [arb. units]
0
50
100
150
200
250
Co
un
ts
29.1 nm31.5 nm34.6 nm
(a) (b)
(c) (d)
Fig. 5. Spectral contrast analysis. For the area enclosed by the white box in Fig. 4(a), ahistogram of the modulus and the phase of the reflection from the sample is shown in (a) and(b) respectively. For convenience, in (a) the reflection coefficient moduli |r | are normalizedsuch that |r | = 1 for silicon for all wavelengths; while in (b) the phases for silicon are set tozero for all wavelengths. (c) and (d) show the comparison of modulus |rTi |/|rSi | and phasedifference φTi − φSi from theory, the single color experiment in previous work, and themulticolor experiment in this work.
including how many colors, Nc, can be reconstructed simultaneously, or what spectral resolvingpower, λ/∆λ, can be achieved. The limit for Nc can be estimated by simply considering the ratiobetween the number of knowns and unknowns in the phase retrieval problem. If a point on thesample is illuminated with Np overlapping ptychography scan positions, i.e. it is independentlymeasured Np times, and the diffraction pattern is sampled at an oversampling [31] ratio ρ, thenthere is Npρ-fold information redundancy for that point. Beyond ρ = 2, no further informationis gained, so for ρ > 2 the information redundancy is simply 2Np. Each color needs two-foldredundancy for phase retrieval, so an upper bound for Nc is Npρ/2 for ρ ≤ 2, and Np for ρ > 2.It is reasonable to believe that there is a point beyond which increasing Np (increasing overlapbetween scan positions) fails to result in increased information redundancy i.e. adjacent scansare no longer independent. Regarding spectral resolution, the detection of scattered light athigh numerical aperture can help separate adjacent colors via diffraction. In object space, thistranslates to the fact that in order to discriminate between adjacent colors, the respective fieldsof view must differ in image size (number of pixels). With this in mind the spectral resolutionis limited to approximately λ/∆λ ≥ 2NAL/λ, where L is the maximum distance between scanpositions, and NA is the numerical aperture. Thus an increase in either the NA or the maximumdistance between scan positions can result in increased spectral resolution. For the experimentdescribed here, the estimated upper bound for Nc is ≈100, much greater than the 4 colors
Vol. 24, No. 16 | 8 Aug 2016 | OPTICS EXPRESS 18753
reconstructed here. The spectral resolving power is estimated to be 80, which is higher than thenecessary resolving power of 15 necessary to distinguish adjacent harmonics.
Looking forward, the spatial resolution can easily reach below 50 nm by placing the detectorcloser to the sample for a higher numerical aperture [11]. Various element-specific absorptionedges in the EUV/X-ray spectrum range at higher photon energies than studied here provideopportunities for high-contrast spectral imaging. Broadband and narrowband shorter wavelengthHHG sources are being developed that are bright (i.e. phase matched) and that can operate in thewater window range [16,18] for biological imaging, reaching photon energies up to 1.6 keV [17].It is also possible to extend this technique to multicolor sources other than HHG, such assynchrotrons and free electron lasers. The HHG source used in this work has a favorable spectralstructure with discrete spectral lines, each of which has a narrow bandwidth. The question of howto address more continuous, broadband spectra with this technique will be addressed in futurework. Each harmonic has a transform limited pulse duration on the order of ≈ 5 femtoseconds.By making use of the ultrashort pulse duration of the HHG source in a pump-probe geometry,this technique can be used for spectral imaging of ultrafast charge, spin and phonon dynamics infunctioning nanosystems [32, 33].
Funding
Defense Advanced Research Projects Agency (DARPA) PULSE program (DARPA-BAA-12-63);NSF Engineering Center in EUV Science and Technology (0310717); Semiconductor ResearchCorporation (2013-OJ-2443); National Science Foundation COSI IGERT (0801680); NationalScience Foundation Graduate Research Fellowship Program; Ford Foundation fellowship pro-gram; Katherine Burr Blodgett fellowship program.
Acknowledgments
This work was performed at JILA. We thank Dr. Ming-Chang Chen for his help on the ellipsoidalmirror. The current address of B.Z. is KLA-Tencor Corporation, One Technology Drive, Milpitas,CA 95035, USA. The current address of M.H.S. is SLAC National Accelerator Laboratory,Menlo Park, CA 94025, USA.
Vol. 24, No. 16 | 8 Aug 2016 | OPTICS EXPRESS 18754