
Psychophysical interactions with a double-slit ... interactions with a double-slit interference...
14
Psychophysical interactions with a double-slit interference pattern Dean Radin, 1,a) Leena Michel, 1 James Johnston, 2 and Arnaud Delorme 3 1 Institute of Noetic Sciences, 625 Second Street, Suite 200, Petaluma, California 94952, USA 2 Biofeedback Health, Berkeley, California 94705, USA 3 University of California, San Diego, 9500 Gilman Drive, La Jolla, California 92093-0559, USA (Received 2 April 2013; accepted 19 September 2013; published online 30 December 2013) Abstract: Previously reported experiments suggested that interference patterns generated by a double-slit optical system were perturbed by a psychophysical (i.e., mind–matter) interaction. Three new experiments were conducted to further investigate this phenomenon. The first study con- sisted of 50 half-hour test sessions where participants concentrated their attention-toward or -away from a double-slit system located 3 m away. The spectral magnitude and phase associated with the double-slit component of the interference pattern were compared between the two attention condi- tions, and the combined results provided evidence for an interaction (effect size ¼0.73 6 0.14, p ¼ 2.4 10 7 ). One hundred control sessions using the same equipment, protocol and analysis, but without participants present, showed no effect (effect size ¼ 0.04 6 0.10, p ¼ 0.71). A Fraunhofer diffraction model was used to explore various interpretations of this outcome. This analysis suggested that the distribution of light between the two slits and the horizontal stability of the laser beam were the principle components of the optical system that were perturbed. The sec- ond experiment used a duplicate double-slit system and similar test protocol, but it was conducted over the Internet by streaming data to participants’ web browsers. Some 685 people from six conti- nents contributed 2089 experimental sessions. Results were similar to those observed in the first experiment, but smaller in magnitude (effect size ¼0.09 6 0.02, p ¼ 2.6 10 6 ). Data from 2303 control sessions, conducted automatically every 2 h using the same equipment but without observ- ers showed no effect (effect size ¼0.01 6 0.02, p ¼ 0.61). Distance between participants and the optical system, ranging from 1 km to 18,000 km, showed no correlation with experimental effect size. The third experiment used a newly designed double-slit system, a revised test protocol, and a simpler method of statistical analysis. Twenty sessions contributed by 10 participants successfully replicated the interaction effect observed in the first two studies (effect size ¼0.62 6 0.22, p ¼ 0.006). V C 2013 Physics Essays Publication.[http://dx.doi.org/10.4006/0836-1398-26.4.553] Re ´sume ´: Des expe ´riences re ´alise ´es pre ´ce ´demment sugge `rent que des franges d’interfe ´rences ge ´ne ´re ´es par un syste `me de double fente optique peuvent e ˆtre perturbe ´es par des interactions psycho-physiques (c’est-a `-dire des interactions entre conscience et matie `re). Trois nouvelles expe ´- riences ont e ´te ´ mene ´es pour e ´tudier ce phe ´nome `ne. Dans la premie `re e ´tude, au cours de 50 se ´ances d’une demi heure chacune, des participants ont concentre ´ leurs attentions soit pour influencer un syste `me de double fente situe ´e a ` 3 m de distance, soit pour ignorer ce me ˆme syste `me. L’ampleur et la phase spectrale associe ´e aux franges d’interfe ´rence ont e ´te ´ compare ´s entre les deux conditions de focalisation de l’attention, et les re ´sultats combine ´s sont compatibles avec l’hypothe `se d’une inter- action entre conscience et matie `re (taille d’effet ¼0.73 6 0.14, p ¼ 2.4 10 7 ). De plus, l’effet n’est pas pre ´sent quand la me ˆme analyse est effectue ´e sur cents sessions contro ˆles utilisant le me ˆme e ´quipement et le me ˆme protocole, mais fonctionnant en l’absence de participants (taille d’effet ¼ 0.04 6 0.10, p ¼ 0.71). Un mode `le de diffraction de Fraunhofer utilise ´ pour explorer dif- fe ´rentes interpre ´tations de ce re ´sultat sugge `re que la distribution de la lumie `re entre les deux fentes et la stabilite ´ horizontale du faisceau laser sont les principaux composants du syste `me optique qui ont e ´te ´ perturbe ´s. La seconde expe ´rience utilise un syste `me de double fente et un protocole de test similaire, mais elle a e ´te ´ mene ´e sur Internet en envoyant en temps re ´el les donne ´es du syste `me de double fente aux navigateurs Web des participants. 685 personnes provenant de six continents ont contribue ´ 2089 sessions expe ´rimentales. Les re ´sultats sont similaires a ` la premie `re expe ´rience mais la taille d’effet est de plus faible amplitude (taille d’effet ¼0.09 6 0.02, p ¼ 2.6 10 6 ). Les don- ne ´es de 2303 sessions de contro ˆle, re ´alise ´ automatiquement toutes les deux heures en utilisant le me ˆme e ´quipement mais sans observateurs n’ont montre ´ aucun effet (taille d’effet ¼0.01 6 0.02, p ¼ 0.61). La distance entre les participants et le syste `me optique, qui va de 1 km a ` 18,000 km, n’est pas corre ´le ´e avec la taille de l’effet expe ´rimental. La troisie `me expe ´rience utilise un syste `me a) [email protected] 0836-1398/2013/26(4)/553/14/$25.00 V C 2013 Physics Essays Publication 553 PHYSICS ESSAYS 26, 4 (2013)
Transcript of Psychophysical interactions with a double-slit ... interactions with a double-slit interference...

Psychophysical interactions with a double-slit interference pattern
Dean Radin,1,a) Leena Michel,1 James Johnston,2 and Arnaud Delorme3
1Institute of Noetic Sciences, 625 Second Street, Suite 200, Petaluma, California 94952, USA2Biofeedback Health, Berkeley, California 94705, USA3University of California, San Diego, 9500 Gilman Drive, La Jolla, California 92093-0559, USA
(Received 2 April 2013; accepted 19 September 2013; published online 30 December 2013)
Abstract: Previously reported experiments suggested that interference patterns generated by a
double-slit optical system were perturbed by a psychophysical (i.e., mind–matter) interaction.
Three new experiments were conducted to further investigate this phenomenon. The first study con-
sisted of 50 half-hour test sessions where participants concentrated their attention-toward or -away
from a double-slit system located 3 m away. The spectral magnitude and phase associated with the
double-slit component of the interference pattern were compared between the two attention condi-
tions, and the combined results provided evidence for an interaction (effect size¼�0.73 6 0.14,
p¼ 2.4� 10�7). One hundred control sessions using the same equipment, protocol and analysis,
but without participants present, showed no effect (effect size¼ 0.04 6 0.10, p¼ 0.71). A
Fraunhofer diffraction model was used to explore various interpretations of this outcome. This
analysis suggested that the distribution of light between the two slits and the horizontal stability of
the laser beam were the principle components of the optical system that were perturbed. The sec-
ond experiment used a duplicate double-slit system and similar test protocol, but it was conducted
over the Internet by streaming data to participants’ web browsers. Some 685 people from six conti-
nents contributed 2089 experimental sessions. Results were similar to those observed in the first
experiment, but smaller in magnitude (effect size¼�0.09 6 0.02, p¼ 2.6� 10�6). Data from 2303
control sessions, conducted automatically every 2 h using the same equipment but without observ-
ers showed no effect (effect size¼�0.01 6 0.02, p¼ 0.61). Distance between participants and the
optical system, ranging from 1 km to 18,000 km, showed no correlation with experimental effect
size. The third experiment used a newly designed double-slit system, a revised test protocol, and a
simpler method of statistical analysis. Twenty sessions contributed by 10 participants successfully
replicated the interaction effect observed in the first two studies (effect size¼�0.62 6 0.22,
p¼ 0.006). VC 2013 Physics Essays Publication. [http://dx.doi.org/10.4006/0836-1398-26.4.553]
Resume: Des experiences realisees precedemment suggerent que des franges d’interferences
generees par un systeme de double fente optique peuvent etre perturbees par des interactions
psycho-physiques (c’est-a-dire des interactions entre conscience et matiere). Trois nouvelles expe-
riences ont ete menees pour etudier ce phenomene. Dans la premiere etude, au cours de 50 seances
d’une demi heure chacune, des participants ont concentre leurs attentions soit pour influencer un
systeme de double fente situee a 3 m de distance, soit pour ignorer ce meme systeme. L’ampleur et
la phase spectrale associee aux franges d’interference ont ete compares entre les deux conditions de
focalisation de l’attention, et les resultats combines sont compatibles avec l’hypothese d’une inter-
action entre conscience et matiere (taille d’effet¼�0.73 6 0.14, p¼ 2.4� 10�7). De plus, l’effet
n’est pas present quand la meme analyse est effectuee sur cents sessions controles utilisant le
meme equipement et le meme protocole, mais fonctionnant en l’absence de participants (taille
d’effet¼ 0.04 6 0.10, p¼ 0.71). Un modele de diffraction de Fraunhofer utilise pour explorer dif-
ferentes interpretations de ce resultat suggere que la distribution de la lumiere entre les deux fentes
et la stabilite horizontale du faisceau laser sont les principaux composants du systeme optique qui
ont ete perturbes. La seconde experience utilise un systeme de double fente et un protocole de test
similaire, mais elle a ete menee sur Internet en envoyant en temps reel les donnees du systeme de
double fente aux navigateurs Web des participants. 685 personnes provenant de six continents ont
contribue 2089 sessions experimentales. Les resultats sont similaires a la premiere experience mais
la taille d’effet est de plus faible amplitude (taille d’effet¼�0.09 6 0.02, p¼ 2.6� 10�6). Les don-
nees de 2303 sessions de controle, realise automatiquement toutes les deux heures en utilisant le
meme equipement mais sans observateurs n’ont montre aucun effet (taille d’effet¼�0.01 6 0.02,
p¼ 0.61). La distance entre les participants et le systeme optique, qui va de 1 km a 18,000 km,
n’est pas correlee avec la taille de l’effet experimental. La troisieme experience utilise un systeme
0836-1398/2013/26(4)/553/14/$25.00 VC 2013 Physics Essays Publication553
PHYSICS ESSAYS 26, 4 (2013)
de double fente nouvellement concu, un protocole modifie, et une methode simple d’analyse statis-
tique. Vingt seances realisees par 10 participants ont permis de reproduire l’effet d’interaction
observe dans les deux premieres etudes (taille d’effet¼�0.52 6 0.22, p¼ 0.02).
Key words: Quantum Measurement Problem; Consciousness; Double-Slit Experiment; Mind–Matter Interaction.
I. INTRODUCTION
Elementary quantum objects behave differently when
observed than when unobserved.1 This can easily be demon-
strated in a double-slit optical system by using a detector to
determine the path that photons take through the two slits.
When “which-path” information is obtained, photons behave
in a particle-like fashion, otherwise they behave in a wave-
like fashion.2 The shift from wave to particle is reflected by
a decline in interference in the pattern of light produced by
the double-slit apparatus.
Numerous interpretations of this observational sensi-
tivity, known as the quantum measurement problem
(QMP), have been proposed. They range from the QMP
presents a severe threat to the foundations of quantum
theory, to the QMP is a mere pseudoproblem.3–6 So far
there is little consensus on which interpretation is most
adequate.7 The chronic state of confusion was reaffirmed
in a January 2013 news item in Nature, which reported an
informal poll taken at a 2011 conference on “Quantum
Physics and the Nature of Reality.”8 The poll indicated
that 80 years after the development of quantum theory
there is still no agreement on interpretations of the QMP
among scientists and scholars who specialize in studying
the foundations of quantum reality. For example, one of
the questions asked in the poll was about the role of the
observer in quantum theory: The observer (a) is a complex
quantum system, (b) plays no role whatsoever, (c) has a
role in the formalism but no physical role, or (d) plays an
important physical role (e.g., wave-function collapse by
consciousness). Again the responses indicated a lack of
consensus, with about the same number of respondents
asserting that the observer played either no role or a criti-
cal role.
One reason that such fundamental questions remain
unresolved is due to a lack of empirical evidence that
might assist in informing the debate. The experiments
reported here and in earlier publications were designed to
provide such data. The approach we took was to probe the
behavior of the interference pattern produced by a double-
slit optical system to see if focused attention alone might
alter the interference pattern in predictable ways. To do
this, we asked individuals to attempt to gain which-path
information from a double-slit system using so-called
extrasensory perception (ESP). While the idea of ESP is
perpetually controversial because there are no well-
accepted explanations for such phenomena, based on a
growing experimental literature it appears that the existen-
tial portion of the debate may be nearing a denouement.
The cumulative evidence in favor of such a phenomenon
has systematically improved over the last century, and
articles reporting these studies are increasingly appearing
in mainstream journals.9–14
A. Background
In earlier publications, we reported a series of psycho-
physical interaction experiments using optical interferome-
ters.15,16 Participants in those studies were asked to imagine
that they could mentally perceive the movement of photons
in an interferometer so as to gain which-path information, or
to mentally “push” the photons to influence their path. The
behavior of the interference pattern was then compared
between counterbalanced attention-toward versus attention-
away conditions.
The first study involved a Michelson interferometer; that
was followed by six experiments using a Young-type dou-
ble-slit system.9,10 The Michelson study resulted in a statisti-
cally significant difference in the interference pattern
between the two attention conditions (p¼ 0.002), with most
of the effects due to 9 of 18 total sessions involving experi-
enced meditators as participants (meditators p¼ 9.4� 10�6).
Control tests using the same setup in the same location but
with no observers present resulted in a null effect. The
double-slit experiments showed a similar outcome when par-
ticipants were observing (overall z¼�4.36, p¼ 6� 10�6),
and null results in control conditions without observers
(z¼ 0.43, p¼ 0.67). Examination of the experimental proto-
col, analytical procedures, and variations in temperature,
vibration, and signal drift revealed no artifacts that could
adequately account for the observed effects.
The experiments reported here were designed to (a) rep-
licate previous results and model the data to analytically
explore how psychophysical interactions might perturb an
interference pattern, (b) study the role of distance between
participants and the optical system, and (c) replicate the
effect using a more stable interferometer and a simpler ana-
lytical approach.
II. EXPERIMENT 1
A. Method
1. Double-slit system
A 5 mW linearly polarized HeNe laser beam (Model 25
LHP 151-249, 632.8 nm wavelength, TEM00, Melles-Griot,
Albuquerque, NM, USA) was passed through two 10% trans-
mission neutral density filters (Rolyn Optics, Covina, CA),
and then through two slits etched in a metal foil slide with
slit widths of 10 lm each and separated by 200 lm (Lenox
Laser, Glen Arm, MD, USA). The interference pattern was
recorded by a 3000 pixel CCD line camera with a pixel size
of 7� 200 lm (7 lm pitch) and 12-bit A-D resolution (Thor-
labs Model LC1-USB, Newton, NJ, USA). The camera was
located 14.0 cm from the slits,1 and a camera snapshot or
1An earlier publication mistakenly listed this distance as 10.4 cm.
554 Phys. Essays 26, 4 (2013)
frame recorded the interference pattern by integrating light
intensity for 40 ms, allowing for collection of 20 frames per
second.
The optical apparatus was housed inside an optically
sealed, custom-machined aluminum housing, painted matte
black inside and out. The laser and camera were powered
continuously throughout the experiment to avoid warm-up
fluctuations, and the experiment was controlled by a Micro-
soft Windows 7 computer running a program written in
MATLAB (version 2009 b, MathWorks, Natick, MA, USA),
and augmented by software libraries to interface the Thor-
labs camera to the computer.
2. Environment
All test sessions were conducted inside an electromag-
netically shielded chamber (double steel-walled, 8 feet per
side, 2800 pounds, Series 81 Solid Cell chamber, ETS-
Lindgren Cedar Park, TX, USA), and electrical line power
was conditioned by an electromagnetic interference filter
(ETS-Lindgren filter LRW-1050-S1). The interior walls and
ceiling of the chamber were covered with fabric and the floor
was covered with antistatic carpeting. After the participant
had settled in, a research assistant explained the task and
then left the chamber and shut the door.
3. Participants
Twenty-one individuals recruited for the test were
selected based either on their superior performance in previ-
ous experiments of this type,15,16 or because they maintained
an active meditation practice or other mental discipline that
requires focused attention, such as musician, intentional
healer, or artist. Ages of the recruited participants ranged
from 22 to 63 (mean 47). As a group they had no distinguish-
ing features compared with numerous demographic factors
(gender, race, income, education, profession, etc.), but one
factor was strongly deviant from the population norm—a
personality trait called absorption. This refers to the capacity
to become deeply involved in sensory or imaginative experi-
ences, and in extreme cases to lose awareness of everything
except for a single object of attention. Of particular rele-
vance to the present study is that the trait of high absorption
is commonly associated with experiential reports of
expanded awareness and self-transcendence. This group of
participants was substantially above the population norm for
absorption, as measured by the Tellegen Absorption Scale
(z¼ 3.5, p¼ 0.0003).17
4. Procedure
Participants filled out an informed consent describing
the nature of the task, then one at a time a research assistant
invited them into the shielded chamber. The optical appara-
tus was described, including the location inside the device
where the double-slit was located. Then the participant was
instructed to sit in a chair about 3 m from the optical system
and asked to remain seated and to not approach the optical
system at any time during the test session.
The research assistant then told participants that when
they heard a recorded voice instructing them to
“concentrate,” that they should focus their attention on the
two slits located inside the optical system. It was explained
that this task was an act of imagination and that they would
not be looking at the actual slits with their eyes. Most of the
participants were selected based on their previous perform-
ance on this task, so they were familiar with the procedure.
New participants were advised that if they preferred they
could mentally try to block one of the two slits, or to
“become one with” the optical system in a contemplative
way, or to mentally push the laser beam so as to cause it to
go through one slit rather than both. The precise form of
interaction was left up to each participant and could be modi-
fied at their discretion.
At this point, the participant put on noise-cancelling
headphones and the research assistant left the shielded cham-
ber. Shortly thereafter, the participant heard a recorded voice
welcoming them, followed by instructions to relax for a
minute while a presession baseline was recorded from the
double-slit system. Then the recording announced the begin-
ning of each test condition. Attention-toward periods were
announced with the phrase “now please concentrate,” and
attention-away periods with the phrase “now please relax.”
At the end of the test session, the recorded voice invited the
participant to relax for a minute while a postsession baseline
from the optical system was obtained.
Concentration and relax epochs lasted 30 s plus an
additional 0–9 s determined uniformly at random on each
successive epoch. Random epoch lengths were used to
encourage participants to remain alert by preventing them
from accommodating to fixed time periods; it also was useful
in avoiding spurious synchrony between the length of the
epochs and inherent power or frequency oscillations in the
laser.
Each test session consisted of 40 epochs presented in a
counterbalanced AB order, where A and B refer to attention-
toward (i.e., concentrate) and attention-away (relax), respec-
tively. Including the pre and postbaseline data, on average
one test session lasted about 25 min, during which camera
frames were recorded at 20 per second, for a total of about
30,000 frames per session.
To assist participants in focusing on the task, real-time
performance feedback was provided during the concentrate
epochs. To do this, the volume of a richly harmonic droning
tone was controlled by the ratio between the double-slit and
single-slit spectral magnitudes (as described below). When
that value declined the volume increased, and vice versa. To
avoid sudden changes in volume, the ratio values were
averaged over 3 s. During relaxation periods, the droning
tone was set to a uniformly low volume and uncoupled from
variations in the ratio value.
5. Data preprocessing
Interference pattern data recorded during the experimen-
tal sessions were preprocessed in five steps:
1. The interference pattern recorded from each camera
frame was decomposed into its spatial wavenumbers
Phys. Essays 26, 4 (2013) 555
using MATLAB’s discrete Fast Fourier Transform (FFT)
function.
2. The complex numbers resulting from the FFT were
separated into spectral magnitude with the MATLAB absfunction and spectral phase with the MATLAB anglefunction.
3. Magnitude was log 10 transformed to reduce distribu-
tion skew, and phase was adjusted using the MATLAB
unwrap function, which smoothes angular discontinu-
ities that can arise in successive phase measurements.
That is, because phase is bound within the unit circle, it
is possible for angles that are close to each other in
successive measurements to apparently jump from say,
þp to –p. The unwrap function removes these jumps.
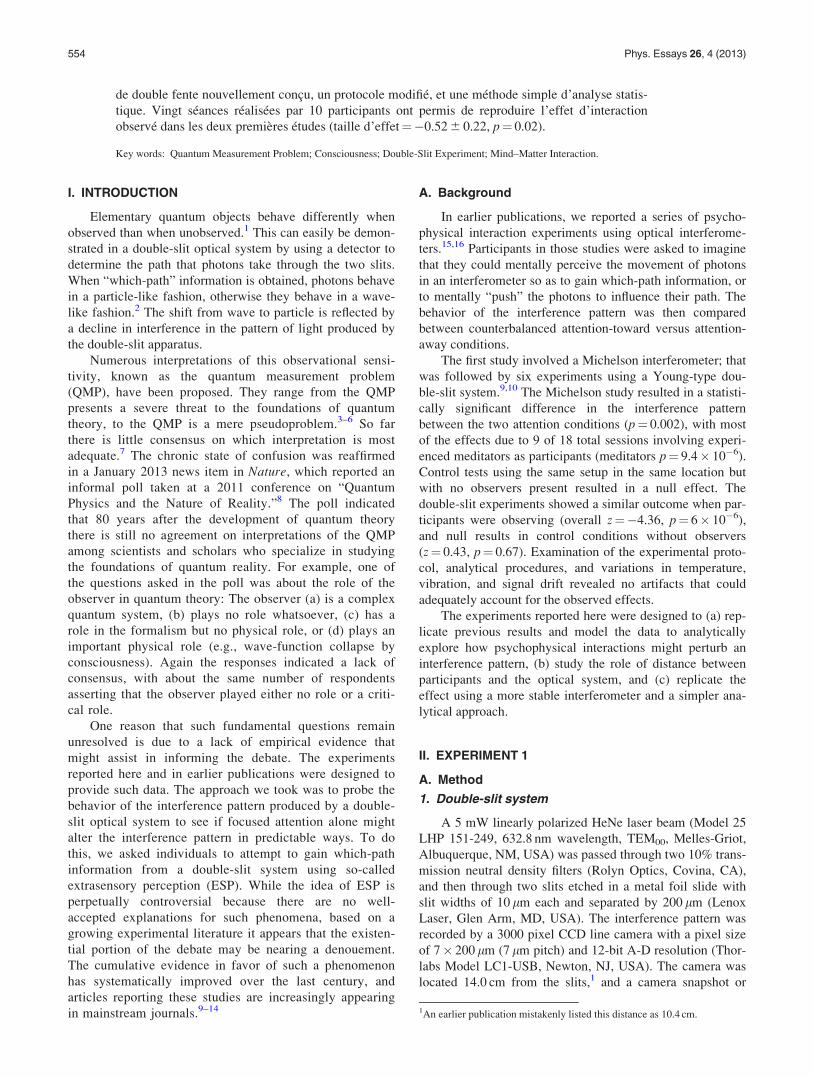
Figure 1 shows the mean normalized log-transformed
magnitude and unwrapped phase for the first 200 wave-
numbers, averaged over 30,000 camera frames.
4. Log-transformed magnitude was detrended using a
least-squares linear fit between the spectral peaks asso-
ciated with single-slit diffraction and double-slit inter-
ference, specifically between the nearly linear portion of
the spectrum between wavenumbers 14 and 39 (as
shown in Fig. 1). This midspectrum detrending was
used to reduce noise associated with oscillations in laser
output intensity associated with thermal expansion and
contraction in the HeNe laser tube, and with laser mode-
hopping (see Fig. 2).
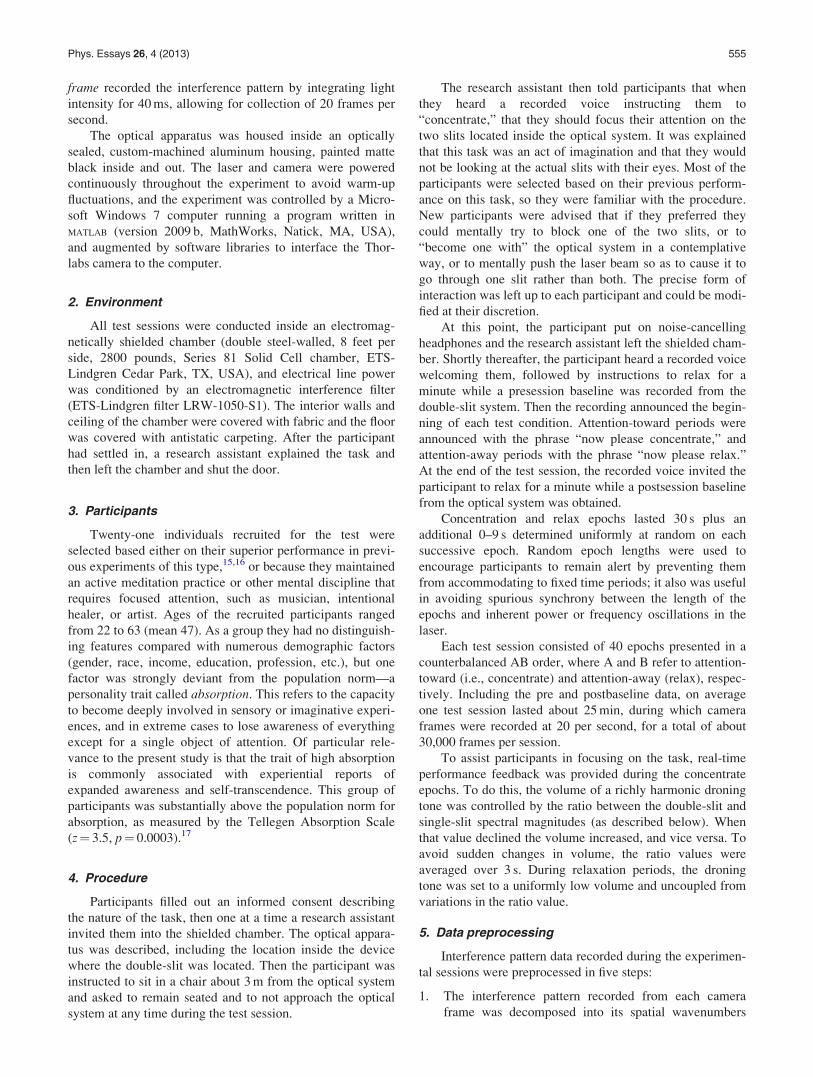
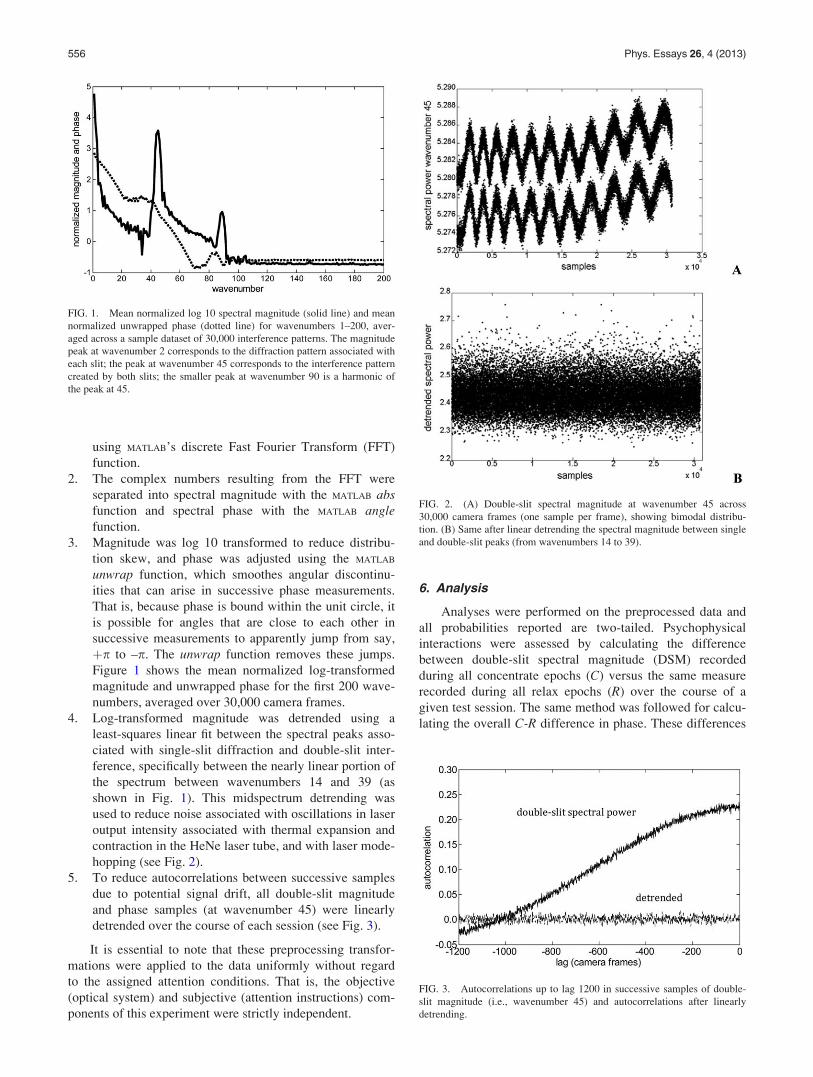
5. To reduce autocorrelations between successive samples
due to potential signal drift, all double-slit magnitude
and phase samples (at wavenumber 45) were linearly
detrended over the course of each session (see Fig. 3).
It is essential to note that these preprocessing transfor-
mations were applied to the data uniformly without regard
to the assigned attention conditions. That is, the objective
(optical system) and subjective (attention instructions) com-
ponents of this experiment were strictly independent.
6. Analysis
Analyses were performed on the preprocessed data and
all probabilities reported are two-tailed. Psychophysical
interactions were assessed by calculating the difference
between double-slit spectral magnitude (DSM) recorded
during all concentrate epochs (C) versus the same measure
recorded during all relax epochs (R) over the course of a
given test session. The same method was followed for calcu-
lating the overall C-R difference in phase. These differences
FIG. 1. Mean normalized log 10 spectral magnitude (solid line) and mean
normalized unwrapped phase (dotted line) for wavenumbers 1–200, aver-
aged across a sample dataset of 30,000 interference patterns. The magnitude
peak at wavenumber 2 corresponds to the diffraction pattern associated with
each slit; the peak at wavenumber 45 corresponds to the interference pattern
created by both slits; the smaller peak at wavenumber 90 is a harmonic of
the peak at 45.
FIG. 2. (A) Double-slit spectral magnitude at wavenumber 45 across
30,000 camera frames (one sample per frame), showing bimodal distribu-
tion. (B) Same after linear detrending the spectral magnitude between single
and double-slit peaks (from wavenumbers 14 to 39).
FIG. 3. Autocorrelations up to lag 1200 in successive samples of double-
slit magnitude (i.e., wavenumber 45) and autocorrelations after linearly
detrending.
556 Phys. Essays 26, 4 (2013)
were assessed separately for each of the 50 test sessions
using a nonparametric Mann–Whitney U-test; one for spec-
tral magnitude and one for phase. Note that step 5 in the data
preprocessing scheme removed sample autocorrelations, in
accordance with the requirement of independence of samples
in a Mann–Whitney U-test.18 The outcomes of the two
Mann–Whitney U-tests per test session, each expressed in
terms of a z score, were combined within each session as a
composite z score, i.e., z ¼ ðzmag þ zphaseÞ=ffiffiffi2p
, and the
resulting composite z scores were combined across sessions
as a Stouffer z score (i.e., sz ¼Pn
i¼1 zi=ffiffiffinp
, where n is the
number of sessions and sz is distributed as a z score).
To gain further confidence that this statistical procedure
did not introduce an unanticipated artifact, the final Stouffer
z composite score was compared with chance expectation of
a zero difference using a nonparametric bootstrap test. This
procedure compared the original Stouffer z to a distribution
of 10,000 identically constructed composite Stouffer z scores
formed by randomly permuting the original C and R assign-
ments within each session. The outcome of this process was
a new z score formed as z ¼ ðsz� lÞ=r, where l was the
mean and r the standard deviation of the distribution of
bootstrap-generated composite scores. Under the null hy-
pothesis of no psychophysical interaction, this differential
composite measure of double-slit magnitude and phase
should be zero.
Besides calculating this composite score, an additional
analysis was deemed to be useful. The hypothesized psycho-
physical effect is assumed to be associated with human atten-
tion, which suggests that it should take a few seconds for
participants to reorient their attention when switching
between mental tasks. As a result, the composite z score was
predicted to be larger (in an absolute sense) after lagging the
data a few seconds,19 and more specifically, based on our
previously reported studies the lag would take about 3 s.
Thus, the composite z score was recalculated after lagging
the data with respect to the moment when the attention
instructions were provided.
Conducting repeated statistical tests requires adjustment
for multiple comparisons, so assuming that the maximum
difference would be observed from about 2–4 s, a conserva-
tive Bonferroni correction would require p¼ 0.025/3¼ 0.008
(based on two-tailed probabilities), or z¼ 2.4 as a threshold
for declaring a statistically significant effect.
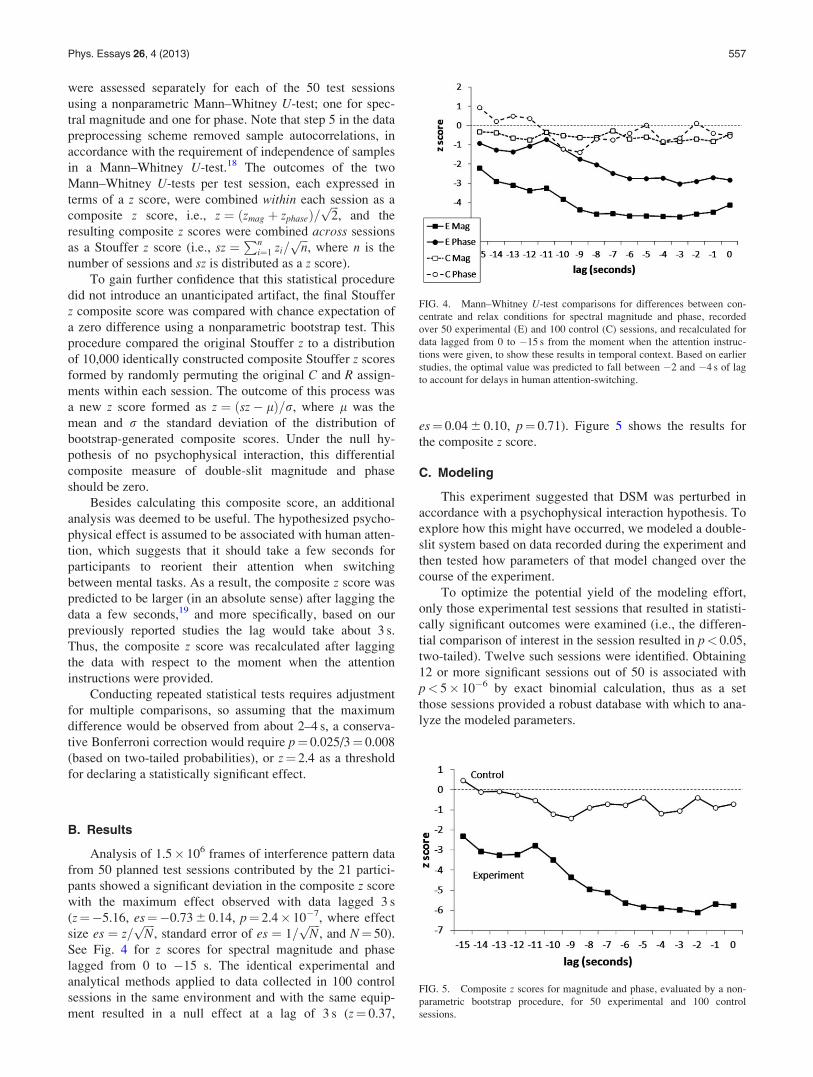
B. Results
Analysis of 1.5� 106 frames of interference pattern data
from 50 planned test sessions contributed by the 21 partici-
pants showed a significant deviation in the composite z score
with the maximum effect observed with data lagged 3 s
(z¼�5.16, es¼�0.73 6 0.14, p¼ 2.4� 10�7, where effect
size es ¼ z=ffiffiffiffiNp
, standard error of es ¼ 1=ffiffiffiffiNp
, and N¼ 50).
See Fig. 4 for z scores for spectral magnitude and phase
lagged from 0 to �15 s. The identical experimental and
analytical methods applied to data collected in 100 control
sessions in the same environment and with the same equip-
ment resulted in a null effect at a lag of 3 s (z¼ 0.37,
es¼ 0.04 6 0.10, p¼ 0.71). Figure 5 shows the results for
the composite z score.
C. Modeling
This experiment suggested that DSM was perturbed in
accordance with a psychophysical interaction hypothesis. To
explore how this might have occurred, we modeled a double-
slit system based on data recorded during the experiment and
then tested how parameters of that model changed over the
course of the experiment.
To optimize the potential yield of the modeling effort,
only those experimental test sessions that resulted in statisti-
cally significant outcomes were examined (i.e., the differen-
tial comparison of interest in the session resulted in p< 0.05,
two-tailed). Twelve such sessions were identified. Obtaining
12 or more significant sessions out of 50 is associated with
p< 5� 10�6 by exact binomial calculation, thus as a set
those sessions provided a robust database with which to ana-
lyze the modeled parameters.
FIG. 4. Mann–Whitney U-test comparisons for differences between con-
centrate and relax conditions for spectral magnitude and phase, recorded
over 50 experimental (E) and 100 control (C) sessions, and recalculated for
data lagged from 0 to �15 s from the moment when the attention instruc-
tions were given, to show these results in temporal context. Based on earlier
studies, the optimal value was predicted to fall between �2 and �4 s of lag
to account for delays in human attention-switching.
FIG. 5. Composite z scores for magnitude and phase, evaluated by a non-
parametric bootstrap procedure, for 50 experimental and 100 control
sessions.
Phys. Essays 26, 4 (2013) 557
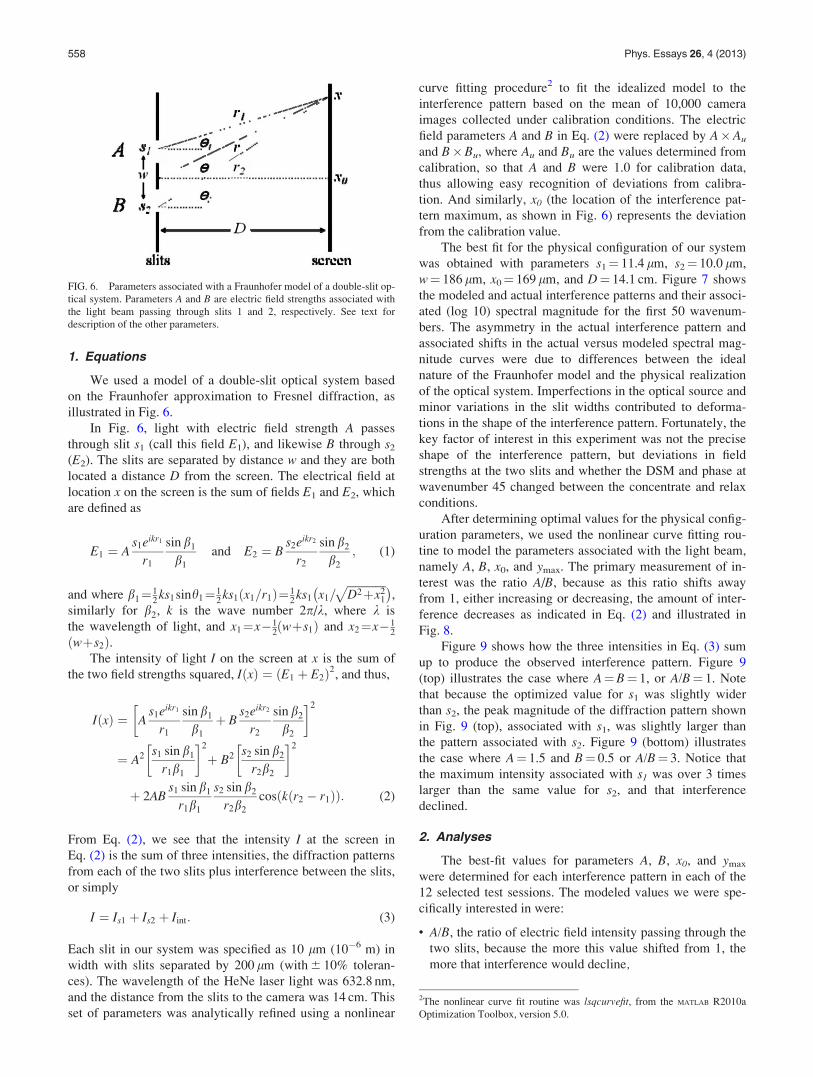
1. Equations
We used a model of a double-slit optical system based
on the Fraunhofer approximation to Fresnel diffraction, as
illustrated in Fig. 6.
In Fig. 6, light with electric field strength A passes
through slit s1 (call this field E1), and likewise B through s2
(E2). The slits are separated by distance w and they are both
located a distance D from the screen. The electrical field at
location x on the screen is the sum of fields E1 and E2, which
are defined as
E1 ¼ As1eikr1
r1
sin b1
b1
and E2 ¼ Bs2eikr2
r2
sin b2
b2
; (1)
and where b1¼12ks1sinh1¼1
2ks1 x1=r1ð Þ¼1
2ks1
�x1=
ffiffiffiffiffiffiffiffiffiffiffiffiffiffiD2þx2
1
p �,
similarly for b2, k is the wave number 2p/k, where k is
the wavelength of light, and x1¼x�12ðwþs1Þ and x2¼x�1
2
ðwþs2Þ.The intensity of light I on the screen at x is the sum of
the two field strengths squared, IðxÞ ¼ E1 þ E2ð Þ2, and thus,
IðxÞ ¼ As1eikr1
r1
sin b1
b1
þ Bs2eikr2
r2
sin b2
b2
� �2
¼ A2 s1 sin b1
r1b1
� �2
þ B2 s2 sin b2
r2b2
� �2
þ 2ABs1 sin b1
r1b1
s2 sin b2
r2b2
cos kðr2 � r1Þð Þ: (2)
From Eq. (2), we see that the intensity I at the screen in
Eq. (2) is the sum of three intensities, the diffraction patterns
from each of the two slits plus interference between the slits,
or simply
I ¼ Is1 þ Is2 þ Iint: (3)
Each slit in our system was specified as 10 lm (10�6 m) in
width with slits separated by 200 lm (with 6 10% toleran-
ces). The wavelength of the HeNe laser light was 632.8 nm,
and the distance from the slits to the camera was 14 cm. This
set of parameters was analytically refined using a nonlinear
curve fitting procedure2 to fit the idealized model to the
interference pattern based on the mean of 10,000 camera
images collected under calibration conditions. The electric
field parameters A and B in Eq. (2) were replaced by A�Au
and B�Bu, where Au and Bu are the values determined from
calibration, so that A and B were 1.0 for calibration data,
thus allowing easy recognition of deviations from calibra-
tion. And similarly, x0 (the location of the interference pat-
tern maximum, as shown in Fig. 6) represents the deviation
from the calibration value.
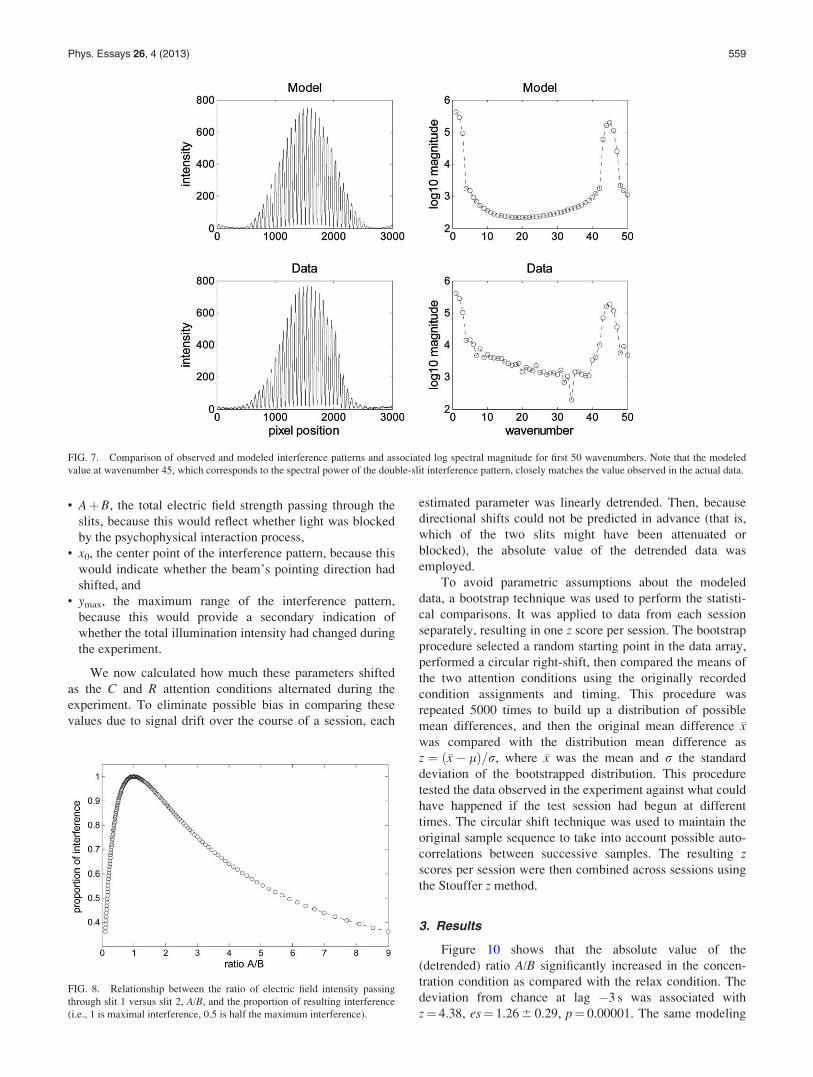
The best fit for the physical configuration of our system
was obtained with parameters s1¼ 11.4 lm, s2¼ 10.0 lm,
w¼ 186 lm, x0¼ 169 lm, and D¼ 14.1 cm. Figure 7 shows
the modeled and actual interference patterns and their associ-
ated (log 10) spectral magnitude for the first 50 wavenum-
bers. The asymmetry in the actual interference pattern and
associated shifts in the actual versus modeled spectral mag-
nitude curves were due to differences between the ideal
nature of the Fraunhofer model and the physical realization
of the optical system. Imperfections in the optical source and
minor variations in the slit widths contributed to deforma-
tions in the shape of the interference pattern. Fortunately, the
key factor of interest in this experiment was not the precise
shape of the interference pattern, but deviations in field
strengths at the two slits and whether the DSM and phase at
wavenumber 45 changed between the concentrate and relax
conditions.
After determining optimal values for the physical config-
uration parameters, we used the nonlinear curve fitting rou-
tine to model the parameters associated with the light beam,
namely A, B, x0, and ymax. The primary measurement of in-
terest was the ratio A/B, because as this ratio shifts away
from 1, either increasing or decreasing, the amount of inter-
ference decreases as indicated in Eq. (2) and illustrated in
Fig. 8.
Figure 9 shows how the three intensities in Eq. (3) sum
up to produce the observed interference pattern. Figure 9
(top) illustrates the case where A¼B¼ 1, or A/B¼ 1. Note
that because the optimized value for s1 was slightly wider
than s2, the peak magnitude of the diffraction pattern shown
in Fig. 9 (top), associated with s1, was slightly larger than
the pattern associated with s2. Figure 9 (bottom) illustrates
the case where A¼ 1.5 and B¼ 0.5 or A/B¼ 3. Notice that
the maximum intensity associated with s1 was over 3 times
larger than the same value for s2, and that interference
declined.
2. Analyses
The best-fit values for parameters A, B, x0, and ymax
were determined for each interference pattern in each of the
12 selected test sessions. The modeled values we were spe-
cifically interested in were:
• A/B, the ratio of electric field intensity passing through the
two slits, because the more this value shifted from 1, the
more that interference would decline,
FIG. 6. Parameters associated with a Fraunhofer model of a double-slit op-
tical system. Parameters A and B are electric field strengths associated with
the light beam passing through slits 1 and 2, respectively. See text for
description of the other parameters.
2The nonlinear curve fit routine was lsqcurvefit, from the MATLAB R2010a
Optimization Toolbox, version 5.0.
558 Phys. Essays 26, 4 (2013)
• AþB, the total electric field strength passing through the
slits, because this would reflect whether light was blocked
by the psychophysical interaction process,• x0, the center point of the interference pattern, because this
would indicate whether the beam’s pointing direction had
shifted, and• ymax, the maximum range of the interference pattern,
because this would provide a secondary indication of
whether the total illumination intensity had changed during
the experiment.
We now calculated how much these parameters shifted
as the C and R attention conditions alternated during the
experiment. To eliminate possible bias in comparing these
values due to signal drift over the course of a session, each
estimated parameter was linearly detrended. Then, because
directional shifts could not be predicted in advance (that is,
which of the two slits might have been attenuated or
blocked), the absolute value of the detrended data was
employed.
To avoid parametric assumptions about the modeled
data, a bootstrap technique was used to perform the statisti-
cal comparisons. It was applied to data from each session
separately, resulting in one z score per session. The bootstrap
procedure selected a random starting point in the data array,
performed a circular right-shift, then compared the means of
the two attention conditions using the originally recorded
condition assignments and timing. This procedure was
repeated 5000 times to build up a distribution of possible
mean differences, and then the original mean difference �xwas compared with the distribution mean difference as
z ¼ ð�x� lÞ=r, where �x was the mean and r the standard
deviation of the bootstrapped distribution. This procedure
tested the data observed in the experiment against what could
have happened if the test session had begun at different
times. The circular shift technique was used to maintain the
original sample sequence to take into account possible auto-
correlations between successive samples. The resulting zscores per session were then combined across sessions using
the Stouffer z method.
3. Results
Figure 10 shows that the absolute value of the
(detrended) ratio A/B significantly increased in the concen-
tration condition as compared with the relax condition. The
deviation from chance at lag �3 s was associated with
z¼ 4.38, es¼ 1.26 6 0.29, p¼ 0.00001. The same modeling
FIG. 7. Comparison of observed and modeled interference patterns and associated log spectral magnitude for first 50 wavenumbers. Note that the modeled
value at wavenumber 45, which corresponds to the spectral power of the double-slit interference pattern, closely matches the value observed in the actual data.
FIG. 8. Relationship between the ratio of electric field intensity passing
through slit 1 versus slit 2, A/B, and the proportion of resulting interference
(i.e., 1 is maximal interference, 0.5 is half the maximum interference).
Phys. Essays 26, 4 (2013) 559

effort applied to data from the control sessions (to test for
analytical biases) showed virtually no change in A/B(z¼ 0.022, p¼ 0.98). Analysis of x0 also showed a signifi-
cant shift (z¼�3.88, es¼�1.12 6 0.29, p¼ 0.0001). The
parameters AþB and ymax did not show significant differen-
ces (z¼�1.26, p¼ 0.21; z¼ 1.23, p¼ 0.22, respectively).
4. Interpretation
During the relax condition, participants were instructed
to withdraw their attention from the optical system. During
those periods, psychophysical interactions would be absent
and photons passing through the system would be expected
to behave in a wave-like manner (see Fig. 11). The ratio
of the electric fields passing through the two slits would
therefore indicate a relative balance, resulting in maximum
interference, and the center point of the interference pattern
would move as a weighted average of the centers of the two
diffraction patterns. During the concentration condition, the
photons would presumably be constrained by psychophysical
interactions, so they would display more particle-like behav-
ior. In the extreme case where photons acted solely like par-
ticles, they would only be able to pass through slit 1 or slit 2,
but not both at once. Such dichotomous behavior would tend
to unbalance the A/B ratio, which in turn would result in a
decline in interference. This interpretation is speculative, of
course, so at this early stage of investigation the primary
value of the modeling effort is that it demonstrates a viable
approach for analytically probing what would otherwise not
be directly observable.
FIG. 9. (A) Illumination intensity resulting from each slit, interference between the slits, and the modeled interference pattern, when the electric field ratio
A/B¼ 1. (B) The same measures when this ratio is unbalanced at A/B¼ 3.
560 Phys. Essays 26, 4 (2013)

III. EXPERIMENT 2
To exclude the effects of potential heat and vibration
artifacts caused by proximity between the human body and
the optical apparatus, we conducted an experiment over the
Internet to strictly isolate the optical system from the partici-
pants. The double-slit system used in this experiment was a
duplicate of that used in Experiment 1, and the exact same
preprocessing and statistical procedures employed in the first
experiment were used to analyze the resulting data.
A. Method
In counterbalanced epochs, the participants—who could
be located anywhere in the world—were instructed to shift
their attention-toward or -away from the double-slit optical
system located in our laboratory. Concentration epochs were
30 s in length, and relax epochs were 30 s plus 0–5 s in
length, determined uniformly at random for each successive
relax epoch.
1. Double-slit system and performance feedback
The distance from the slits to the camera in the optical
system used in this test was approximately 16 cm. The HeNe
laser and camera were powered on continuously throughout
the experiment to avoid warm-up artifacts, and the optical
system and experiment were controlled by a Microsoft
Windows XP computer running a web server program writ-
ten in MATLAB (version 2009 b). The server program accessed
interference patterns from the camera at 16 frames per sec-
ond and stored every fourth frame.
The program calculated the DSM from each interference
pattern and used that value to provide performance feedback
to the user during the concentrate epochs. This was accom-
plished by calculating the mean DSM recorded over each
successive relax epoch, and comparing that value to a 3 s
sliding window average of DSM measures observed during
the following concentrate condition. No feedback was pro-
vided during relax epochs.
2. Internet client and data integrity
Participants performed the experiment through a client
program embedded in a web page on a custom web site. The
client received streaming data from the server and also pro-
vided graphic feedback. The application was written in
Adobe Flash Professional and ActionScript (Versions CS5.5
and 3.0, respectively, Adobe Systems Inc., San Jose, CA). A
survey associated with this experiment was hosted by
www.SurveyMonkey.com (Palo Alto, CA), and the web
portal to the experiment was hosted on a commercial hosting
service. Standard web tools including Joomla! (www.joomla.
org), PHP (www.php.net), and mySQL (www.mysql.com)
were used to run the webpage, register users, and record
online data. The experiment itself was controlled by a MAT-
LAB program acting as a web server. Participant identities
were protected by encrypting personal information with
MD5, a commonly used 128-bit cryptographic hash function,
and the web server provided protection against common
server attacks, such as SQL code injection.
To further reduce the possibility that data from the
double-slit system could be externally manipulated or falsely
inserted into our database, the web server controlling the
experiment did not accept data from external sources (with
one exception, mentioned below). The data streamed to
the user’s browser by the web server were summarized per-
formance feedback, whereas our web server stored the full
camera images of the double-slit interference patterns in a
location that was inaccessible to online users. All collected
data were stored on our server and simultaneously uploaded
FIG. 10. (Color online) (Left) Effect size and one standard error bars for the absolute value of A/B for the subset of 12 significant experimental sessions (top
line) and 100 control sessions (bottom line), lagged from 0 to �15 s. (Right) Same results expressed in the form of Stouffer z scores.
FIG. 11. Speculative interpretation of the results of the modeling effort.
See text.
Phys. Essays 26, 4 (2013) 561

to a cloud storage service. Copies of data on the server were
also recorded on an external hard disk once a week.
To detect if a user began an experimental session but left
in the middle of a session, or if their Internet connection spon-
taneously failed, at the end of each attention epoch the server
waited for a handshake from the client computer. If the hand-
shake (a predefined sequence of characters) did not occur
within 5 s, then the test session was automatically closed and
the server was reinitialized to wait for another user. While all
test sessions were saved, only fully completed sessions were
considered part of the formal database. Because the test
streamed data live from the optical system located in our labo-
ratory, only one person could take the test at any given time.
3. Participants
Participants were recruited by inviting people through
social networks, blogs, and online newsletters. Over 13,000
people from 121 countries visited the test website between
November 2011 and December 2012. About half of the users
hailed from North America and a third from Europe. Approxi-
mately 1 in 10 persons who visited the web site signed up for
the test, and about half of those completed the logon process
and actually took the test. This low response rate was
expected; the registration process was designed to reduce the
number of frivolous users by requiring participants to fill out a
demographic survey, to successfully complete a response
challenge (www.captcha.net), and by requiring a real email
address to complete the registration process.
4. Test procedure
To assist users in understanding the nature of the task,
the registration website provided text descriptions and links
to instructional videos. During a test session, performance
feedback was provided in the form of a simple graph, where
a line would go up if DSM was going in the predicted direc-
tion (i.e., decreasing), and vice versa. In addition, the pitch
of a whistling wind sound followed the movement of the
line; this allowed users to conduct the experiment with eyes
closed. The computer also provided prerecorded voice
instructions to announce the attention conditions with the
phrases “now please concentrate” or “now please relax.”
There were 21 approximately 30 s epochs in a test run, so a
typical test session lasted just over 11 min.
The demographic survey that each user filled out before
taking the test asked for their name, gender, age, email, loca-
tion, belief in ESP, and several similar psychological and
personal belief questions. The ESP belief question was
included because previous experiments have observed that
openness to the possibility of ESP is often positively corre-
lated with success in ESP tasks.20
5. Timing lags and other internet factors
Timing tests were conducted to compare when the web
server sent a signal to the client to announce the attention
instruction for each epoch, versus when data began to be
displayed to the user. These tests indicated that the combina-
tion of (a) Internet data transmission delays, (b) human task-
switching delays, (c) processing delays in our web server
and the client’s computer, and (d) environmental distrac-
tions, allowed us to estimate lags in the range of 5–10 s
before a maximal effect was expected to occur.
Between November 2011 and January 2012, about 1000
online test sessions were contributed by about 500 people.
We used those data as a pilot test to see whether the online
experiment would successfully operate by itself, 24 h a day,
and to assess our data integrity and network security
schemes. Based on that experience, an improved system was
developed that self-repaired after unexpected software
crashes, and that automatically backed up all data to a cloud
data service. Methods were also developed for preventing
attempts to manipulate the data by malicious Internet soft-
ware programs designed to penetrate or compromise web
servers. Comparison checks on the data stored on the web
server, on external hard drives, and on the cloud service gave
no indications that any of the data in the formal experiment
had been improperly accessed or corrupted.
To provide control data in this experiment, the web
server was programmed to simulate a user by automatically
conducting a test session at the beginning of each even hour,
around the clock. These sessions were conducted the same
way as human trials, including streaming live data to a dis-
tant Ubuntu Linux server programmed to simulate a human.
The only difference between the experimental and control
trials was that during control trials no one observed the data,
and the incoming data stream was received by a Java client
program instead of a web-based Flash client program.
6. Analysis
The same sequence of preprocessing steps described in
Section II.A.5 was used to process the experimental and con-
trol data in this study, with one adjustment. The peak DSM
in the first experiment was at wavenumber 45. The same
peak for the optical system used in this experiment was at
wavenumber 42, due to a different distance between the
slits and the camera (16 cm versus 14 cm). So Step 4 in
Section II.A.5 used wavenumber 42 instead of 45, and the
range for detrending the middle of the spectrum was accord-
ingly reduced by 3, i.e., from wavenumber 14 to 39 in the
first experiment to 14 to 36 in this experiment.
B. Results
1. Users and sessions
The formal portion of the test was specified to run until a
minimum of 2000 completed experimental and 2000 com-
pleted control sessions had been recorded. The formal test
began in January 2012, and ten months later a total of 2240
experimental sessions had been contributed, of which 2089
were completed sessions. Those sessions were contributed
by 685 people from 120 countries. During the same period,
2303 completed control sessions were also recorded.
According to the user survey, the participants ranged in
age from 10 to 84 (mean age 42), 56% strongly believed that
ESP exists and fewer than 1% strongly believed that it does
not exist. Incidentally, the correlation between belief in ESP
562 Phys. Essays 26, 4 (2013)
and meditation practice was r¼ 0.23 (p¼ 3� 10�7), based
on 451 people who answered both the ESP and the medita-
tion question.
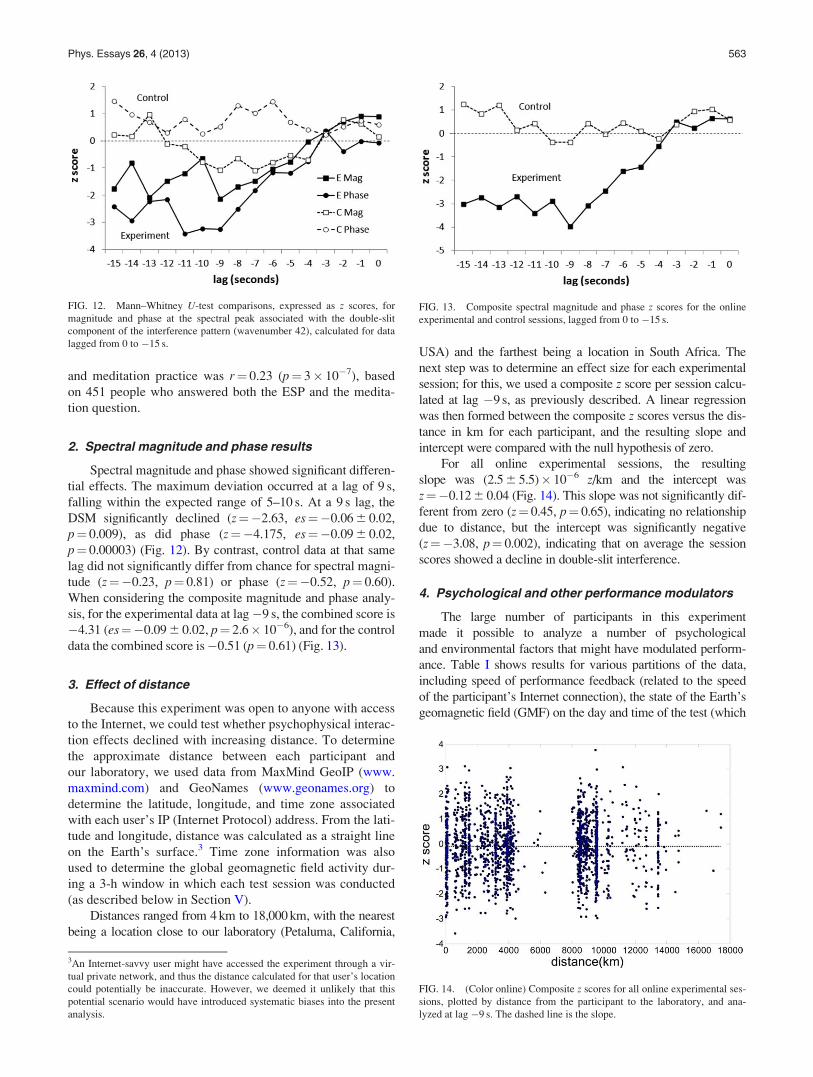
2. Spectral magnitude and phase results
Spectral magnitude and phase showed significant differen-
tial effects. The maximum deviation occurred at a lag of 9 s,
falling within the expected range of 5–10 s. At a 9 s lag, the
DSM significantly declined (z¼�2.63, es¼�0.06 6 0.02,
p¼ 0.009), as did phase (z¼�4.175, es¼�0.09 6 0.02,
p¼ 0.00003) (Fig. 12). By contrast, control data at that same
lag did not significantly differ from chance for spectral magni-
tude (z¼�0.23, p¼ 0.81) or phase (z¼�0.52, p¼ 0.60).
When considering the composite magnitude and phase analy-
sis, for the experimental data at lag�9 s, the combined score is
�4.31 (es¼�0.09 6 0.02, p¼ 2.6� 10�6), and for the control
data the combined score is�0.51 (p¼ 0.61) (Fig. 13).
3. Effect of distance
Because this experiment was open to anyone with access
to the Internet, we could test whether psychophysical interac-
tion effects declined with increasing distance. To determine
the approximate distance between each participant and
our laboratory, we used data from MaxMind GeoIP (www.
maxmind.com) and GeoNames (www.geonames.org) to
determine the latitude, longitude, and time zone associated
with each user’s IP (Internet Protocol) address. From the lati-
tude and longitude, distance was calculated as a straight line
on the Earth’s surface.3 Time zone information was also
used to determine the global geomagnetic field activity dur-
ing a 3-h window in which each test session was conducted
(as described below in Section V).
Distances ranged from 4 km to 18,000 km, with the nearest
being a location close to our laboratory (Petaluma, California,
USA) and the farthest being a location in South Africa. The
next step was to determine an effect size for each experimental
session; for this, we used a composite z score per session calcu-
lated at lag �9 s, as previously described. A linear regression
was then formed between the composite z scores versus the dis-
tance in km for each participant, and the resulting slope and
intercept were compared with the null hypothesis of zero.
For all online experimental sessions, the resulting
slope was (2.5 6 5.5)� 10�6 z/km and the intercept was
z¼�0.12 6 0.04 (Fig. 14). This slope was not significantly dif-
ferent from zero (z¼ 0.45, p¼ 0.65), indicating no relationship
due to distance, but the intercept was significantly negative
(z¼�3.08, p¼ 0.002), indicating that on average the session
scores showed a decline in double-slit interference.
4. Psychological and other performance modulators
The large number of participants in this experiment
made it possible to analyze a number of psychological
and environmental factors that might have modulated perform-
ance. Table I shows results for various partitions of the data,
including speed of performance feedback (related to the speed
of the participant’s Internet connection), the state of the Earth’s
geomagnetic field (GMF) on the day and time of the test (which
FIG. 12. Mann–Whitney U-test comparisons, expressed as z scores, for
magnitude and phase at the spectral peak associated with the double-slit
component of the interference pattern (wavenumber 42), calculated for data
lagged from 0 to �15 s.
FIG. 13. Composite spectral magnitude and phase z scores for the online
experimental and control sessions, lagged from 0 to �15 s.
FIG. 14. (Color online) Composite z scores for all online experimental ses-
sions, plotted by distance from the participant to the laboratory, and ana-
lyzed at lag �9 s. The dashed line is the slope.
3An Internet-savvy user might have accessed the experiment through a vir-
tual private network, and thus the distance calculated for that user’s location
could potentially be inaccurate. However, we deemed it unlikely that this
potential scenario would have introduced systematic biases into the present
analysis.
Phys. Essays 26, 4 (2013) 563
previous studies have indicated is a correlate of human per-
formance in a wide range of human affairs, including in the
present domain16,21,22), and the participant’s motivation, medi-
tation experience, belief in ESP, and belief in a more radical
form of purported mind–matter interaction, levitation.
These analyses indicated that participants who received
faster performance feedback achieved better results than those
who received slower feedback (z(difference)¼�3.02,
p¼ 0.003, two-tailed), where the Internet connection speed was
estimated by the number of data samples delivered by the web
server over the course of the session. Slower Internet transmis-
sion rates delivered slower and more sporadic feedback.
The analysis also indicated that participants who were
highly motivated, as indicated by those who provided 10 or
more completed test sessions, performed better than those
with lower motivation, as reflected by those who provided just
one or two sessions (z(difference)¼�2.64, p¼ 0.008, two-
tailed). Sessions conducted on days with quieter geomagnetic
fields, meaning geomagnetic Ap indices below the median
value measured across all test sessions, produced slightly bet-
ter results than sessions on noisy GMF days, and those who
believed in levitation performed somewhat better than those
who did not. By contrast, participants with an active medita-
tion practice performed no differently than those with little or
no meditation experience, and those who believed in ESP per-
formed about the same as those who did not.
These analyses suggest that there may be many factors,
from psychological to environmental, that modulate per-
formance in the present task. Such factors are commonly
observed in a wide array of cognitive tasks, suggesting that
there may be optimal conditions that can be crafted, moni-
tored, or otherwise exploited to enhance experimental yields.
The analysis also indicates that the results in the present
experiments are related to how humans actually perform
attention-focusing and other real-world tasks,23,24 thus pro-
viding a secondary indication that the results are not due to
mundane physical or analytical artifacts.
IV. EXPERIMENT 3
This experiment was designed to simplify the data pre-
processing and analytical procedures by using a more stable
laser in a newly designed double-slit optical system. It also
employed a task designed to help optimize participants’
attention during the concentration epochs.
A. Method
1. Double-slit system
A beam from a 25 mW diode-pumped solid-state laser
(642 6 4 nm wavelength, single longitudinal mode,
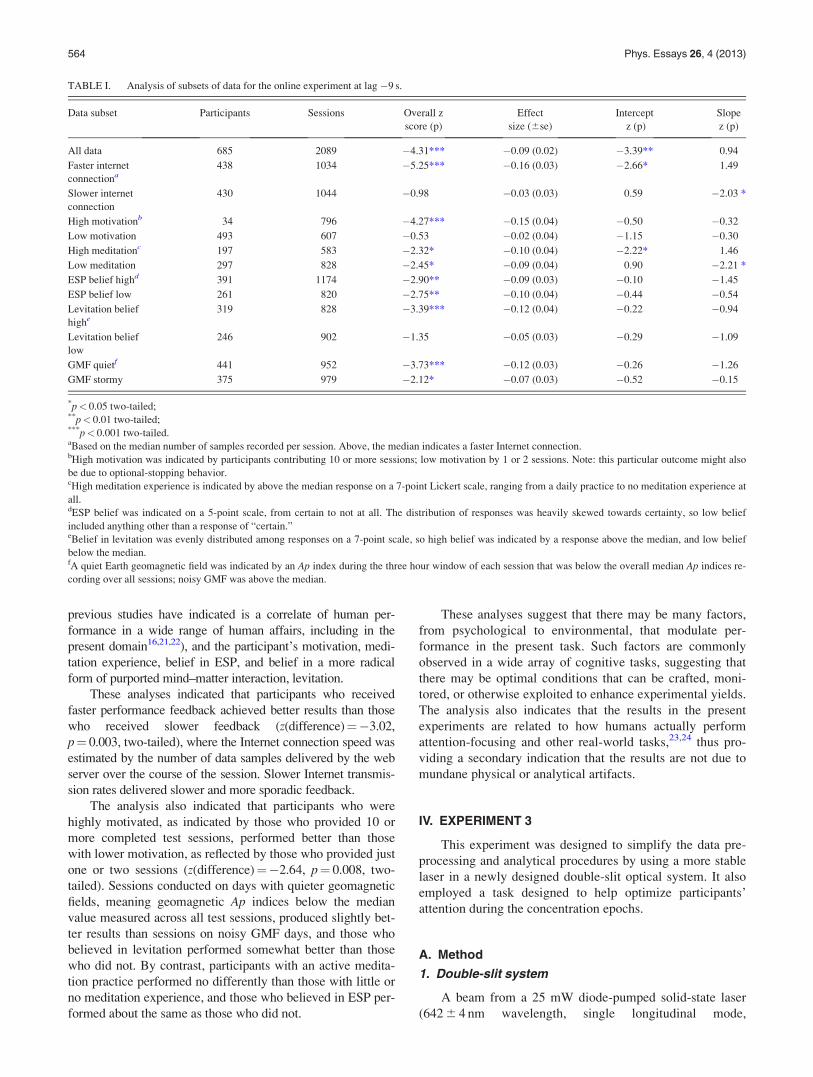
TABLE I. Analysis of subsets of data for the online experiment at lag �9 s.
Data subset Participants Sessions Overall z
score (p)
Effect
size (6se)
Intercept
z (p)
Slope
z (p)
All data 685 2089 �4.31*** �0.09 (0.02) �3.39** 0.94
Faster internet
connectiona438 1034 �5.25*** �0.16 (0.03) �2.66* 1.49
Slower internet
connection
430 1044 �0.98 �0.03 (0.03) 0.59 �2.03 *
High motivationb 34 796 �4.27*** �0.15 (0.04) �0.50 �0.32
Low motivation 493 607 �0.53 �0.02 (0.04) �1.15 �0.30
High meditationc 197 583 �2.32* �0.10 (0.04) �2.22* 1.46
Low meditation 297 828 �2.45* �0.09 (0.04) 0.90 �2.21 *
ESP belief highd 391 1174 �2.90** �0.09 (0.03) �0.10 �1.45
ESP belief low 261 820 �2.75** �0.10 (0.04) �0.44 �0.54
Levitation belief
highe319 828 �3.39*** �0.12 (0.04) �0.22 �0.94
Levitation belief
low
246 902 �1.35 �0.05 (0.03) �0.29 �1.09
GMF quietf 441 952 �3.73*** �0.12 (0.03) �0.26 �1.26
GMF stormy 375 979 �2.12* �0.07 (0.03) �0.52 �0.15
*p< 0.05 two-tailed;**p< 0.01 two-tailed;***p< 0.001 two-tailed.aBased on the median number of samples recorded per session. Above, the median indicates a faster Internet connection.bHigh motivation was indicated by participants contributing 10 or more sessions; low motivation by 1 or 2 sessions. Note: this particular outcome might also
be due to optional-stopping behavior.cHigh meditation experience is indicated by above the median response on a 7-point Lickert scale, ranging from a daily practice to no meditation experience at
all.dESP belief was indicated on a 5-point scale, from certain to not at all. The distribution of responses was heavily skewed towards certainty, so low belief
included anything other than a response of “certain.”eBelief in levitation was evenly distributed among responses on a 7-point scale, so high belief was indicated by a response above the median, and low belief
below the median.fA quiet Earth geomagnetic field was indicated by an Ap index during the three hour window of each session that was below the overall median Ap indices re-
cording over all sessions; noisy GMF was above the median.
564 Phys. Essays 26, 4 (2013)
coherence length> 10 m, output noise< 0.5%, TEM00,
pointing stability< 0.005 mrad/ �C, temperature-stabilized,
Model DL640-025-SO, Crystalaser, Reno, NV, USA) was
passed through a clear quartz crystal, then a 1% transmission
neutral density filter (Model NDL-25 S-2, Thorlabs, Newton,
NJ, USA), and then through two slits with widths of 10 lm
and separated by 200 lm (Lenox Laser, Glen Arm, MD,
USA). The quartz crystal was used to expand the beam diam-
eter from 1.1 mm to approximately 3 mm. The interference
pattern was recorded by a 2048 pixel CCD line camera with
a pixel size of 14� 56 lm (14 lm pitch) and 12-bit A-D re-
solution (Model LC1100-USB, Thorlabs). The camera was
located 18 cm from the slits, and the interference pattern was
recorded by the camera approximately every 55 ms.
The optical apparatus was secured to an optical breadboard
inside a heavy, optically sealed aluminum housing whose inte-
rior was entirely covered by mu metal (for magnetic shielding)
and painted matte black. The experiment was controlled by a
Microsoft Windows 7 computer running a program written in
MATLAB (version 2009 b), and augmented by software libraries
to interface the Thorlabs camera to the computer.
2. Participants and environment
All test and control sessions were conducted inside the
previously described electromagnetically shielded chamber.
Ten individuals recruited for the test were selected from a
pool of participants known to maintain a meditation practice
or other form of mental discipline requiring focused or crea-
tive imagination.
3. Procedure
Participants were invited to sit in a chair about 3 m from
the optical system, they were given noise-cancelling head-
phones to wear, and they were invited to relax and listen to
the instructions over the headphones. As in Experiment 1,
participants were asked to not touch or approach the optical
system at any time.
A recorded voice welcomed the participant and asked
them to relax for 30 s while a presession baseline was
recorded from the double-slit system. Then the voice
announced, “When ready, press the button to begin the next
trial.” This allowed the participant to begin each trial when-
ever they felt ready to apply their attention to the task. This
differed from the previous experiments, which presented
timed instructions to concentrate or relax without regard to
the participant’s state of mental readiness.
When the button was pressed, the voice announced,
“Please wait,” 5 s later it said, “Get ready,” and 10 s later it
said, “Now please concentrate.” Twenty-five seconds later
the voice said, “Now please relax,” and 5 s later the initial
announcement was repeated, “When ready, press a button to
begin the next trial.” After 15 min, the voice thanked the
participant and the session ended. Through this procedure,
participants were able to initiate trials on demand. To be con-
sidered part of the formal database, only sessions with five or
more trials contributed were used.
To assist participants in focusing on the double-slit sys-
tem, real-time performance feedback was provided during
the concentration epochs by varying the volume of a droning
tone. The volume was controlled in near real-time by com-
paring the DSM value associated with the most recently
recorded interference pattern against 50 most recent values
recorded during the previous relax periods (with a t-test).
The resulting t-score was transformed into an odds value
which was constrained to fall between 1 and 100. That num-
ber was then used as a volume control, ranging from 1%
(quietest) to 100% (loudest). When the double-slit spectral
value declined the volume accordingly increased, and vice
versa. To avoid abrupt changes, the volume values were
averaged over 3 s. During relax and wait periods, the droning
tone volume was set to zero.
4. Data preprocessing
Interference pattern data recorded during the experimen-
tal sessions were transformed by FFT into spectral magni-
tude and phase, but steps 4 and 5 described in Section II.A.5
were no longer necessary given the enhanced stability of the
laser. Given the geometry of this double-slit apparatus,
wavenumber 53 was associated with the peak spectral mag-
nitude of the double-slit interference pattern.
5. Analysis
As before, mean spectral magnitude associated with the
double-slit interference pattern was compared across all con-
centration versus relax epochs over the course of each test
session. The same method was used when comparing mean
phase. These means were accumulated for each of 20
planned sessions and evaluated using the previously
described circular shift permutation technique. The outcome
of each test session was expressed in terms of a magnitude
plus phase composite z score, and those scores were com-
bined into a single Stouffer z score across the 20 test sessions
to provide the final statistic. Based on the results of previous
experiments, we prespecified a lag of �3 s as the optimal
time to evaluate the psychophysical hypothesis.
Unlike the previous experiments where attention condi-
tions were automatically assigned on a timed basis, the pres-
ent protocol required the participant to begin each trial at
will. Thus, conducting a control session required a different
approach. To do this, we ran 20 sessions without anyone
present, then we assigned the trial-initiating button-pressing
behavior recorded during each experimental session to a ran-
domly selected control session, and then we analyzed the
control data using the same analytical method that was
applied to the original experimental data.
B. Results
Analysis of data from 20 test sessions contributed by 10
participants showed a modestly significant deviation in DSM
and phase in alignment with the results of the first two tests.
At the prespecified lag of �3 s, the composite z score was
z¼�2.76, es¼�0.62 6 0.22, p¼ 0.006. Twenty control
sessions conducted in the same environment and with the
same equipment and analysis method resulted in a null effect
with z¼ 0.09, es¼ 0.02 6 0.22, p¼ 0.93.
Phys. Essays 26, 4 (2013) 565

V. DISCUSSION
The experiments reported here are consistent with the
results of previously reported studies using optical systems
as targets in psychophysical experiments.16,25,26 Together
they suggest the existence of an attention-modulated mind–
matter interaction effect. The combined outcome of the pres-
ent three experiments, expressed in terms of an (unweighted)
Stouffer z score, is
z ¼ ½ð�5:16Þ þ ð�4:31Þ þ ð�2:33Þ�=ffiffiffi3p
¼ �6:81; p ¼ 4:8� 10�12:
Because of the unconventional nature of the hypothesized
interaction, it is important to assess whether the observed
outcomes might have been mimicked by one or more arti-
facts. Experiment 2 suggested that the results of Experiment
1 were probably not due to systematic fluctuations in heat,
electromagnetic fields, or vibration caused by proximity of
the human body. The results of Experiment 2 were supported
by expected correlations between performance and psycho-
logical factors, including feedback rate, motivation, and
attention task-switching delays. The lack of correlation with
the factor of belief in ESP was unexpected, although the
strong skew towards high belief in the participant population
may have made that comparison unreliable. Evidence that
the specific hardware implementations and experimental pro-
tocols used in Experiments 1 and 2 had not introduced arti-
facts was provided by the results of Experiment 3.
What the present experiments do not unambiguously
demonstrate is that the observed effects are necessarily rele-
vant to the QMP. That is, what we observed was a decline in
interference correlated with periods of observation versus no-
observation. This is consistent with a consciousness-related
interpretation of the QMP, but there may be other ways of
explaining these effects that do not require quantum concepts.
Another limitation in interpreting the results of these
experiments is that in order to reduce noise due to signal
drift and the multimodal output of the HeNe laser, data in
the first two experiments required substantial preprocessing.
Those transforms were applied uniformly to the data with-
out regard to the attention conditions, so they could not
have introduced biases in the comparisons of interest. How-
ever, the transforms do make it difficult to visualize what
was happening physically within the optical apparatus. To
address this problem, we were able to simplify the analyti-
cal approach in Experiment 3 by using a more stable optical
system.
We may note that controlling the physical characteristics
of this experiment was relatively easy as compared to control-
ling the psychological factors. For example, previous double-
slit experiments suggested that meditators tended to outper-
form nonmeditators,15,16 but Experiment 2 did not replicate
that finding. In addition, belief in ESP did not appear to be as
strong a predictor of success as previous research might have
implied. Of course, the set and setting of controlled laboratory
experiments are vastly different than unsupervised online
tests, and those differences may have been sufficient to
account for the lack of the expected correlations.
Finally, we recognize that the experiments reported in
this paper are, by themselves, insufficient to definitively
demonstrate the existence of a mind–matter interaction
effect. To gain confidence in such a phenomenon would
require scores of successful replications conducted in differ-
ent laboratories. There is, of course, an existing literature
reporting over a thousand conceptually similar studies con-
ducted many over decades by dozens of independent labora-
tories.14 From that larger perspective, the results reported
here are not particularly surprising. However, theoretical
models that adequately account for these effects have signifi-
cantly lagged behind the empirical evidence, and until that
problem is solved wider acceptance of this phenomenon will
remain controversial. One of our goals in publishing this
work is to bring this line of research to the attention of scien-
tists interested in foundational problems of physics, and by
doing so we hope to stimulate replications and discussions
leading to testable theoretical models.
Future research on this topic would benefit by simultane-
ously studying personality, cognitive and neuroscience
factors related to improved human performance in psycho-
physical tasks, by developing ever more sensitive physical
targets, and by continuing to refine mathematical models that
may help to shed light on the underlying mechanisms.
ACKNOWLEDGMENTS
This work was supported by grants from the Federico
and Elvia Faggin Foundation, Inc.
1S. Groblacher, T. Paterek, R. Kaltenbaek, C. Brukner, M. Zukowski, M.
Aspelmeyer, and A. Zeilinger, Nature 446(7138), 871 (2007).2R. Feynman, R. Leighton, and M. Sands, The Feynman Lectures onPhysics (Addison-Wesley, New York, 1965).
3E. P. Wigner, Am. J. Phys. 31, 6 (1963).4H. Stapp, Mindful Universe: Quantum Mechanics and the ParticipatingObserver (Springer, New York, 2007).
5E. J. Squires, Eur. J. Phys. 8, 171 (1987).6B. Rosenblum and F. Kuttner, Found. Phys. 32, 1273 (2002).7M. Schlosshauer, J. Kofler, and A. Zeilinger, e-print arXiv:1301.1069v1.8P. Ball, Nature (2013).9L. Storm, P. E. Tressoldi, and L. Di Risio, Psychol. Bull. 136, 471 (2010).
10P. E. Tressoldi, Front. Psychol. 2, 117 (2011).11J. Mossbridge, P. Tressoldi, and J. Utts, Front. Phys. 3, 1 (2012).12D. Radin and R. Nelson, Found. Phys. 19, 1499 (1989).13D. Radin, R. Nelson, Y. Dobyns, and J. Houtkooper, Psychol. Bull. 132,
529 (2006).14D. Radin, Entangled Minds (Simon & Schuster, New York, 2006).15D. Radin, Explore 4, 25 (2008).16D. Radin, L. Michel, K. Galdamez, P. Wendland, R. Rickenbach, and A.
Delorme, Phys. Essays 25, 157 (2012).17A. Tellegen and G. Atkinson, J. Abnorm. Psychol. 83, 268 (1974).18M. Hollander and D. A. Wolfe, Nonparametric Statistical Methods
(John Wiley & Sons, Inc., Hoboken, NJ, 1999).19L. Li, M. Wang, Q. J. Zhao, and N. Fogelson, PLoS One 7(7), e42233 (2012).20G. Schmeidler and G. Murphy, J. Abnorm. Psychol. 36, 271 (1946).21G. Schaut and M. Persinger, Percept. Mot. Skills 61, 412 (1985).22A. Kriveloyova and C. Robotti, “Playing the Field: Geomagnetic Storms
and the Stock Market,” Federal Reserve Bank of Atlanta Working Paper
Series, Paper No. 2003-5b (2003), http://www.frbatlanta.org/filelegacy-
docs/wp0305b.pdf23B. J. Baars and D. B. Edelman, Phys. Life Rev. 9, 285 (2012).24A. Wykowska, C. Anderl, A. Schubo, and B. Hommel, Front. Psychol. 4,
59 (2013).25M. Ibison and S. Jeffers, J. Sci. Explor. 12, 543 (1998), http://www.scienti-
ficexploration.org/journal/jse_12_4_ibison.pdf26D. Radin, Explore 4, 25 (2008).
566 Phys. Essays 26, 4 (2013)