
PSYCHOLOGY EVALUATING THERAPEUTIC ALLIANCE...
77
` PSYCHOLOGY EVALUATING THERAPEUTIC ALLIANCE LONGITUDINALLY: DESCRIBING THERAPEUTIC ALLIANCE GROWTH AND ITS IMPLICATIONS FOR OUTCOMES JEFFREY J. SAPYTA Dissertation under the direction of Professor Leonard Bickman Therapeutic alliance, the helping relationship that develops between client and therapist, is the most commonly studied process variable in mental health treatment. In child/adolescent treatment, the relationship that develops between therapist and the youth’s caregiver has also been argued as important. This is due to the routine involvement of caregivers in treatment tasks (e.g., learning new parenting skills), as well as their involvement in dictating the youth’s treatment goals and treatment agenda. Alliance is theorized not to remain static; it deteriorates or grows stronger over the course of treatment. Yet despite alliance’s theorized volatility and instrumental role in predicting eventual treatment response, very little research has investigated whether longitudinal alliance change within client relates to outcome. Using data from the Multimodal Treatment Study of Children with AD/HD, caregivers participating in the parent-training arm of the study were utilized to investigate how alliance growth affects outcome using statistical methods that can model appropriately within-client change
-
Upload
vuonghuong -
Category
Documents
-
view
220 -
download
0
Transcript of PSYCHOLOGY EVALUATING THERAPEUTIC ALLIANCE...

`
PSYCHOLOGY
EVALUATING THERAPEUTIC ALLIANCE LONGITUDINALLY:
DESCRIBING THERAPEUTIC ALLIANCE GROWTH
AND ITS IMPLICATIONS FOR OUTCOMES
JEFFREY J. SAPYTA
Dissertation under the direction of Professor Leonard Bickman
Therapeutic alliance, the helping relationship that develops between client and
therapist, is the most commonly studied process variable in mental health treatment. In
child/adolescent treatment, the relationship that develops between therapist and the
youth’s caregiver has also been argued as important. This is due to the routine
involvement of caregivers in treatment tasks (e.g., learning new parenting skills), as well
as their involvement in dictating the youth’s treatment goals and treatment agenda.
Alliance is theorized not to remain static; it deteriorates or grows stronger over the course
of treatment. Yet despite alliance’s theorized volatility and instrumental role in
predicting eventual treatment response, very little research has investigated whether
longitudinal alliance change within client relates to outcome. Using data from the
Multimodal Treatment Study of Children with AD/HD, caregivers participating in the
parent-training arm of the study were utilized to investigate how alliance growth affects
outcome using statistical methods that can model appropriately within-client change

(hierarchical linear modeling, survival analysis). Consistent with hypotheses, caregiver-
reported alliance was found to be significantly volatile within-clients and has different
trajectories in early versus late treatment. These findings call into question the utility of
the alliance literature’s traditional means of summarizing therapeutic alliance (e.g.,
average overall alliance, one-session snapshots of alliance over phases of treatment).
Contrary to the other hypotheses, treatment engagement variables did not consistently
predict eventual treatment response, patterns of missing alliance data, or early
termination from the study. The only consistent predictor of outcome (i.e., treatment
response and early termination), was treatment group assignment, which is consistent
with the main findings of the study. Explanations for the results of this study are
generated, and the conclusion of the study outlines the new directions that can move the
therapeutic alliance literature forward using advances in longitudinal statistics.

EVALUATING THERAPEUTIC ALLIANCE LONGITUDINALLY:
DESCRIBING THERAPEUTIC ALLIANCE GROWTH
AND ITS IMPLICATIONS FOR OUTCOMES
By
Jeffrey J. Sapyta
Dissertation
Submitted to the Faculty of the
Graduate School of Vanderbilt University
in partial fulfillment of the requirements
for the degree of
DOCTOR OF PHILOSOPHY
in
Psychology
August, 2006
Nashville, Tennessee
Approved:
Professor Leonard Bickman
Professor Craig Anne Heflinger
Professor Steven D. Hollon
ii
ACKNOWLEDGEMENTS
Jeffrey J. Sapyta was supported in part with National Institute of Mental Health
(NIMH) T32 MH19544-11A. Special thanks also go to Peter S. Jensen and the larger
research consortium for allowing the author to pursue therapeutic alliance research using
data from the most important study to date on youth treatment for AD/HD: The
Multimodal Treatment Study of Children with Attention Deficit Hyperactivity Disorder
(MTA).
On a personal note, this project could not be completed without the charity and
patience of numerous people. I would like to thank Dr. Leonard Bickman for his
guidance and support, as well as his commitment to scientific excellence. I would also
like to thank Dr. E. Warren Lambert for his wit, contagious laughter, and statistical
assistance on numerous projects including this one. Special commiseration awards go to
the many that helped me slog through the milestones including Drs. Stephanie Reich,
Tricia Lipani, Joan Walker, Wendy Garrard, and Annalise Caron.
But my largest expression of gratitude goes to my darling wife, Dr. Nicole L.
Schramm-Sapyta. It was only by her enduring patience and love that ultimately kept me
focused, inspired, and, on my best days, forging toward the finish line.

iii
TABLE OF CONTENTS
Page ACKNOWLEDGEMENTS.................................................................................................... ii
LIST OF TABLES...................................................................................................................v
LIST OF FIGURES ................................................................................................................vi
Chapter
I. INTRODUCTION ..........................................................................................................1
Empirical Evidence of Therapeutic Alliance in Child Studies ........................2 Caregiver Therapeutic Alliance .......................................................................4 Definition and Empirical Structure of Therapeutic Alliance...........................5 Theories Describing How and Why Alliance Affects Outcomes ....................7 Common Features of Theories Explaining the Alliance-Outcome Relationship ....................................................................................................10 The Great Disconnect: The Study of Alliance Longitudinally ......................11 Future Directions in Therapeutic Alliance Research ......................................13 Study Purpose .................................................................................................15
II. METHOD ......................................................................................................................17
Population Sample ..........................................................................................17 Sampling and Data Collection ........................................................................17 Measures .........................................................................................................19
Caregiver Working Alliance Inventory- Short Version (C-WAI) .........19 Swanson, Nolan, and Pelham AD/HD Checklist from the DSM-IV (SNAP-IV) .............................................................................................20
Data Analysis ..................................................................................................20 Hierarchical Linear Modeling................................................................20 Pattern-Mixture Model Analysis............................................................22 Assessing Treatment Dropout Using Survival Analysis........................23
III. RESULTS ......................................................................................................................25
Preliminary Analyses ......................................................................................25 Caregiver Alliance Growth .............................................................................28 Caregiver Alliance Growth Relationship to Outcome ....................................32 Pattern Mixture Analysis ................................................................................39 Survival Analysis ............................................................................................43
IV. DISCUSSION................................................................................................................47

iv
Appendix A. CONSTRUCTING PIECEWISE MODELS ................................................................59 B. PATTERN MIXTURE ANALYSIS DUMMY CODING............................................61 REFERENCES .......................................................................................................................62

v
LIST OF TABLES
Table Page 1. Descriptive data for the caregiver working alliance inventory item mean value and reflected log transformation…………………………………….25 2. Descriptive data for the SNAP-IV total scale and subscales…………………….28 3. Linear growth model of alliance throughout treatment (unconditional model)….29 4. Linear growth model of alliance over the course of treatment (unconditional
model) for subjects with sufficient data to construct a piecewise growth model…………………………………………………….……………………….31 5. Linear piecewise model of growth of alliance over the course of treatment
(early slope and late slope)………………………………………………………32 6. Unconditional model for caregiver-reported SNAP-IV AD/HD composite
over the course of treatment (i.e., through 14-month time point)………………..34
7. 14-month caregiver-reported AD/HD composite model including treatment group……………………………………………………..…………....36
8. 14-month caregiver-reported AD/HD composite model including
treatment group and piecewise alliance slopes…………………………………..37
9. 24-month caregiver-reported AD/HD composite model including treatment group and piecewise alliance slopes……………………………….….40
10. Frequency table of missing data patterns over early, middle, and late parent-training sessions………………………………………...……………...…41 ..
11. Cox regression analyses with covariates predicting premature termination…..…46

vi
LIST OF FIGURES
Figure Page 1. Frequency of completed alliance data by session number……………………….27 2. Linear growth model of therapeutic alliance by training session………………..30 3. 14-month caregiver-reported AD/HD symptoms by treatment group……...……35 4. Cumulative survival function of treatment dropout……………………………...37 5. Cumulative survival of dropout by treatment group…………………………..…47

1
CHAPTER 1
INTRODUCTION
Therapeutic alliance, the helping relationship that develops between client and
therapist, is the most commonly studied process variable in mental health treatment
(Horvath & Bedi, 2002). Although it was discussed as an important component of the
therapeutic relationship by prominent psychodynamic authors (e.g., Freud 1913/1966;
Greenson, 1965; Zetzel, 1956), it remained a theoretical curiosity until the mid 1970s. It
was during this period that therapeutic alliance was first investigated as a predictor of
outcome (e.g., Luborsky, 1976; Strupp & Hadley, 1979). After 30 years of research, it is
now considered by many as the best therapy process predictor of therapeutic outcome in
adult populations (e.g., Horvath & Luborsky, 1993; Orlinsky, Grawe, & Parks, 1994).
Besides “traditional” psychotherapy settings (i.e., outpatient services with a therapist),
alliance has been predictive of outcomes in approaches as diverse as couples therapy,
behavioral medicine, and pharmacotherapy (Bourgeois, Sabourin, & Wright, 1990; Gavin
et al, 1999; Krupnick, Sotsky, Simmens, & Moyer, 1996).
Since the operational definitions of alliance were developed in the 1970s, over
2000 research publications have been published regarding therapeutic alliance (Horvath
& Bedi, 2002). A larger review of process variables found therapeutic bond to be the
best predictor of outcome (Orlinksy, Grawe, & Parks, 1994). However, this review only
used vote-counting methods of significant findings, which is highly dependent on factors
such as measurement reliability and sample size. Furthermore, vote counting methods do
not quantitatively address the strength of the relationship between alliance and outcome.

2
Parametric measures of effect size (e.g., r or Cohen’s d) can both describe the size of the
relationship between two variables as well as if the relationship is significant. Horvath
and Symonds (1991) was the first meta-analysis to evaluate the relationship between
outcome and therapeutic alliance. Based on 24 studies, the average effect size was r =
0.26. Small, medium, and large effects for r are .10, .30, and .50, respectively (Cohen,
1992). Two other major meta-analyses on adult client therapeutic alliance have been
recently conducted (Horvath & Bedi, 2002; Martin, Garske, & Davis, 2001). Both of
these reviews had larger study samples (i.e., 89 and 79 studies, respectively) use more
sophisticated meta-analytic procedures (e.g., homogeneity of variance tests) and had
similar effects (r = .21 & r= .22, respectively). Tests for homogeneity of variance
indicated that there were no significant moderator variables. This finding is interesting,
because it appears that the average alliance relationship to outcome in adult studies does
not depend on type of rater, time of alliance assessment, type of treatment provided, or
the publication status of the study.
Empirical Evidence of Therapeutic Alliance in Child Studies
Despite decades of investigation in adult populations, therapeutic alliance has
only gained increased attention in child1 clinical outcome studies in the last 10 years (Eltz,
Shirk, & Sarlin, 1995; Florsheim, Shotorbani, Guest-Warnick et al, 2000; Green, Kroll,
Imrie et al, 2001; Hogue, Dauber, Stambaugh, Cecero, & Liddle, 2006). One estimate
indicates that less than 3% of child therapy studies have examined treatment processes
like therapeutic alliance (Kazdin, Bass, Ayers, & Rodgers, 1990). This has led some to
1 References to child studies includes studies where the primary clients are either children or adolescents.

3
describe treatment process research (i.e., research into within-treatment
variables/interactions) as the “ignored stepchild of child psychotherapy investigators”
(Russell & Shirk, 1998). Although alliance in child community practice has not been
evaluated with the rigor that it has had in adult psychotherapy, emerging evidence in
inpatient adolescent services, youth day treatment, and the child welfare system indicate a
similar relationship between alliance and outcome as in adult research clinics (Dore &
Alexander, 1996; Colson, Cornsweet, Murphy et al, 1991; Eltz, Shirk, & Sarlin, 1995;
Florsheim, Shotorbani, Guest-Warnick et al, 2000; Green, Kroll, Imrie et al, 2001). An
argument can be made that it may be more important in child mental health settings.
Since most children enter therapy involuntarily and could be experiencing social deficits,
the ability for the clinician to form and maintain a therapeutic relationship in child
therapy is paramount (Shirk & Saiz, 1992). Failure to establish a therapeutic alliance
early in treatment could lead to dropout. Data from child and family therapy studies
suggest that as much as 30%-60% of participants terminate prematurely (Armbruster &
Kazdin, 1994). In cases where children/adolescents involved in residential treatment
cannot decline treatment, low therapeutic alliance can presumably attenuate treatment
effectiveness (Shirk, 2001). Recently, a meta-analysis was conducted investigating the
relationship between therapeutic alliance and outcome in child studies (Shirk & Karver,
2003). In a sample of 23 studies, the relationship was quite similar to adult studies of
alliance (r=.21). In contrast to the adult studies, several moderators were found. Alliance
was more related to outcome in externalizing children versus internalizing children
(M= .30 vs. M= .10). On methodological factors, alliance was more related to outcome
on therapist- and observer-reported alliance than in the child (M = .29-.26 vs. M= .18).

4
Also, late session reports versus early session reports were more related to outcome (M
= .27 versus M= .12). Although alliance in child studies may have a similar overall
relationship with outcome, it appears that some moderators of alliance that affect its
relationship to outcome.
Caregiver Therapeutic Alliance
There is growing evidence that process research in youth treatment must also
recognize the alliance between caregiver and therapist. A survey of nearly 1200 child
psychologists and psychiatrists cite parental cooperation as the only factor more
important than the therapist-child relationship (Kazdin, Siegel, & Bass, 1990).
Furthermore, theoretical papers on this topic have suggested that a therapeutic alliance
with the parents or primary caregiver may in some cases be more important for treatment
adherence and outcomes than the child’s relationship to the therapist (DiGiuseppe,
Linscott, & Jilton, 1996). Since the primary caregiver is often primarily in charge of
providing/arranging transportation, payment, and establishing treatment goals, the
caregiver could be considered more the “client” than the child (e.g., Weisz & Jensen,
1999). Attrition in child psychotherapy has been found to be more related to
characteristics of the parent than the child (Gould, Schaffer, & Kaplan, 1985). Recent
empirical research has indicated that factors related to parental alliance affect
engagement, attendance, and outcome (Kabuth, DeTychey, & Vidailhet, 2005;
Morrissey-Kane & Prinz, 1999). In the largest study to date of child/adolescent treatment
dropouts in community outpatient settings, the most cited reason for dropping out of
treatment by parents was therapeutic relationship problems (Garcia & Weisz, 2002). This
study illustrated that therapeutic alliance was more important for treatment engagement

5
and preventing premature dropout than if the child had improved or whether the child still
needed treatment.
Definition and Empirical Structure of Therapeutic Alliance
The numerous therapeutic alliance measurement systems are currently based on
only a few theoretical models. All of these alliance models share two major factors in
common: agreement on the agenda of therapy and the presence of a client emotional bond.
Luborsky’s (1976) theory of alliance was the first to discriminate how alliance develops
over time. The first phase of alliance, Type I Alliance, involves the client’s belief that the
therapist is helpful and provides a warm, supporting relationship. Type II Alliance
develops later, and it consists of the client’s commitment to the therapeutic process.
Bordin (1979) described therapeutic alliance as a three factor model: (1) the emotional
bond between the client and therapist, (2) the agreement of the two parties on the
therapeutic tasks, and (3) the agreement on the goals/expectations of therapy. Gaston
(1990) attempted to reconcile these previous theoretical models and current empirical
therapist/client characteristic literature by proposing a four factor model: (1) the patient’s
capacity to purposefully work in therapy, (2) the client’s emotional bond to the therapist,
(3) the therapist empathetic understanding and involvement, and (4) the patient-therapist
agreement of tasks and goals.
These modern conceptualizations of alliance have generated several measurement
scales. Luborsky (1976) developed a series of alliance measurement systems known
collectively as the Penn Scales (HAcs; Luborsky, 1976; HAr; Luborsky, Crits-Christoph,
Alexander, Margolis, & Cohen, 1983; HAq; Luborsky, McLellan, Woody, O’Brien, &
Auerbach, 1985). These were the first scales to be commonly used to measure

6
therapeutic alliance. These instruments operationalized his Type I and Type II alliance
constructs into therapist-, client-, and observer-rated alliance measures. The Working
Alliance Inventory, with factors tapping into bond, agreement on tasks, and agreement on
goals is now the most widely used alliance measure today (WAI; Horvath & Greenberg,
1989). The California Psychotherapy Alliance Scales is also widely used, has versions
for all three types of raters, and is based on Gaston’s (1990) four-factor theory (CALPAS;
Marmar, Gaston, Gallagher, & Thompson, 1989). Other measurement scales used to a
lesser extent are the Vanderbilt Psychotherapy Process Scale (VPPS; Suh, Strupp, &
O’Malley, 1986), Therapeutic Alliance Rating Scale (TARS; Marziali, 1984), and
Therapeutic Bond Scales (Saunders, Howard, & Orlinsky, 1989).
Psychometric evaluation of the therapeutic alliance construct has not
consistently supported multiple factors in the most widely used alliance measures. High
correlations between dimensions in these studies would indicate that therapeutic alliance
would be best considered a unidimensional construct (e.g., Gaston, 1991; Morgan, 1982;
Salvio, Beutler, Wood, & Engle, 1992). However, other authors have argued elsewhere
that a priori classical test theory methods of maximizing reliability and inter-item
correlations in small validation samples could prevent viewing multidimensional patterns
found in larger, more representative samples (Henry, Strupp, Schacht, & Gaston, 1994;
Horvath & Greenberg, 1989). Confirmatory factor analyses studying this issue have
yielded both unidimensional and multidimensional factor solutions. Tracey & Kokotovic
(1989) compared the fit of the traditional Bordin (1979) model (i.e., 3 factors), one
general factor, and a hierarchical 2-level factor on two samples that totaled 207 subjects.
The hierarchical two-level model consisted of the three first-order factors as well as a

7
second-order general alliance factor, which loaded on each first-order factor. None of the
models fit the data well, but the hierarchical two-factor model had the best fit and was
reported as the most adequate. However, the authors failed to point out that more
complicated models would always approximate the sample’s variance/covariance matrix
better. With a larger sample (i.e., 308 subjects), Gaston, Sabourin, Hatcher, & Hansell
(1992) found additional evidence of a two-level model. Four mildly correlated alliance
instruments (i.e., resembling Gaston’s therapeutic alliance model) were imbedded in a
larger alliance factor. Sapyta (2001) investigated the factor structure of the therapeutic
alliance instrument used in this study. Although the hierarchical two-factor model was
the best fitting model, the item loadings suggest each item loads highest on the general
factor. In everyday practice, it was suggested that clinicians use the overall mean, and
not each individual factor.
Theories Describing How and Why Alliance Affects Outcomes
Many theorists have considered how the therapeutic relationship contributes to
treatment engagement and therapeutic change. Interestingly, very few of these
individuals could be considered therapeutic alliance theorists per se. Instead they have
used the concept of alliance as part of larger perspective on psychotherapy. Some
approaches have included concepts that are basic to other fields such as social
psychology. Social influence theory describes counseling and the therapeutic
relationship as a process of interpersonal influence (Strong, 1968). Through charismatic
qualities of the therapist (client-perceived expertness, trustworthiness, and attractiveness),
the therapist reframes the client’s issues and attempts to change their behavior patterns or
attitudes about the world. This sometimes causes psychological discomfort or cognitive

8
dissonance, which then motivates the client to reduce the dissonance in several ways.
Ideally under this model, the counselor can successfully persuade the client to accept the
therapist’s model of change and dismiss their own objections. This may take a few
sessions of conflict, but eventually the client will come to agree and participate in the
therapist’s model for change. However, the client can also alleviate the dissonance of
changing thoughts/behavior by essentially disengaging from the therapeutic process (e.g.,
reject the therapist’s claim entirely, discount the importance of alleviating this particular
problem, or seek other sources or experts with a philosophy closer to their own).
The phase model for psychotherapy is another theory that describes how the
therapeutic relationship may affect therapeutic outcome (Howard, Lueger, Maling, &
Martinovich, 1993). Based on previous models of healing, they describe how therapists
must provide a plausible rationale for the client’s distress (Frank & Frank, 1993;
Luborsky, Singer, & Luborsky, 1975). The phases of therapy include remoralization,
remediation, and rehabilitation. This is a stage model, which specifies that a client cannot
go into remediation until the client meets criteria of remoralization. It is in the
remoralization phase, where it is argued; developing the therapeutic relationship is
paramount. Based heavily on previous work by Frank & Frank (1993), the phase model
of psychotherapy argues that clients seek therapy when they are no longer able to cope
with their current strategies and begin to feel powerless and hopeless (i.e., demoralized).
Clients then seek the services of a therapist who will build a therapeutic relationship with
them. In this relationship, the therapist will convey an aura of an expert, clarify the
client’s presenting problem, and instill hope in the client for treatment success. Once the
client perceives the therapist as trustworthy/competent and has developed an emotional

9
bond with the therapist, the client will be willing to form goals based on the now
reframed problems as well as participate in therapeutic tasks. Thus, the initial therapeutic
relationship fosters an allegiance to the therapist’s treatment model, which then leads to
the activities of reducing the client’s symptoms, issues, etc. Only after the establishment
of a strong alliance, can the client work on relieving current symptoms (i.e., remediation)
and perhaps changing maladaptive habits or personality characteristics after symptoms
are reduced (i.e., rehabilitation).
Besides the formal theories of psychotherapy process, there have been other
attempts to explain how alliance relates to outcome based on empirical processes. The
role of client expectancies relationship with alliance has recently been gaining greater
attention (Connolly-Gibbons et al, 2003; Joyce & Piper, 1998; Morrisey-Kane & Prinz,
1999). Client expectancies have been defined as the anticipatory beliefs that clients have
regarding the procedures, outcomes, and any other aspect about the treatment rationale or
its delivery (Nock & Kazdin, 2001). Pretreatment expectancies have been found to be
significantly associated with alliance (e.g., Joyce & Piper, 1998). Although pretreatment
expectancies are also related to outcome, it appears that this relationship is partially
mediated by therapeutic alliance (Meyer et al, 2002). These findings suggest that client
expectancies may play a significant role in how the alliance is developed. If a client has
optimistic expectancies about treatment, the process of “persuading” the client of the
treatment rationale may be easier than in clients with lower expectations. Along with
expectancies, some alliance theorists have described how within-client variation may
predict treatment success. A reasonably high but gradually increasing alliance through
treatment has been indicated as predictive of better outcomes (Florsheim et al, 2000;

10
Joyce & Piper, 1998). Others argue that the typical pattern of successful therapy is
initially high, followed by lower alliance when the honeymoon period ends. But in
successful therapy cases, the alliance will be restored to its initial level. Thus, successful
treatment cases will resemble a “U-shaped” high-low-high pattern (Gelso & Carter, 1994).
Common Features of Theories Explaining the Alliance-Outcome Relationship
The theories that describe how the therapeutic relationship affects outcome have
several components that compliment each other. Most notably, they all describe a
temporal process regarding how alliance develops and fluctuates, with particular alliance
development courses leading to improving or declining negative outcomes. This is also a
main tenet in one of the prominent alliance theories (Luborsky, 1976). The expectancies
literature also fits nicely in this approach, because expectancies of the client may affect
how well the alliance can initially be developed. A client already feeling optimistic
about therapy success could have fewer reservations of establishing a good alliance early.
Once therapy begins, the ability of a therapist to be persuasive (through being perceived
as expert, trustworthy, and attractive) and the client’s expectations of therapy will
determine if the therapist can successfully redefine the client’s problem, establish a
treatment rationale, and instill hope that causes an emotional reaction in the client (i.e.,
bond to therapist). Once this bond is formulated, it motivates the client to engage in the
collaborative goals and tasks of therapy. If this emotional bond is not adequately in place;
the client will reject the therapist’s treatment rationale and will not improve due to the
therapy.
These conceptualizations also leave room for the client to question the therapist
and therapeutic approach in the early stages of therapy. In this early phase, there may be

11
a degree of volatility to the therapeutic relationship as the therapist both attempts to
persuade the client in reframing their issues and simultaneously introducing the treatment
rationale. The few alliance articles that assess within-client variation longitudinally
indicate that there is significant volatility of alliance, at least in the early phase of
treatment (e.g., Kivlighan & Shaunessy, 2000). Other researchers have described how
alliance ruptures may happen occasionally at any point in treatment (Safran & Muran,
1996). Therefore, based on the theories described, clinicians and researchers should
concentrate to both the level of alliance and the degree of volatility throughout treatment.
The Great Disconnect: The Study of Alliance Longitudinally
Despite the large attention given to alliance’s role in outcome and the theories
describing alliance volatility, there is very little research investigating whether
longitudinal alliance change within-client relates to outcome. According to alliance
theorists, therapeutic alliance develops gradually and does not remain static throughout
treatment. Yet despite the assumed volatility of therapeutic alliance, only a few
researchers in the extensive alliance literature have attempted to explain alliance
volatility’s impact on outcome. Bordin (1979) argued that the strength of the alliance
depends on both the personal characteristics of the client and therapist and how these
interact with the specific tasks they engage in throughout treatment. Others have argued
that the therapeutic relationship must be first grounded in trust of the therapist, which
leads to commitment in the tasks and goals of therapy (Frank & Frank, 1993; Luborsky,
1976). Others hypothesize how different patterns of alliance development may impact
eventual outcome (Gelso & Carter, 1994; Mann, 1973). For instance, Mann’s (1973)
description of clients truly engaged in time-limited therapy will begin treatment with a

12
level of optimism, followed by frustration as the therapist begins challenging their life
patterns, and finally rebound to the level of initial engagement when they incorporate the
therapist’s messages. Finally, the research program at Beth Israel Medical Center
currently has the most descriptive model of therapeutic alliance volatility: therapeutic
alliance ruptures (e.g., Safran & Muran, 2000; Safran, Muran, & Samstag, 1994). They
have developed taxonomy of different alliance ruptures and a stage-process model in
identifying, attending, and repairing alliance ruptures. Ruptures in alliance are argued as
not only common but expected. It is how the therapist handles a therapeutic alliance
rupture, not the rupture itself, which eventually determines how responsive a client is to
treatment.
Despite the basic theoretical tenet that alliance development is a volatile process;
the empirical approaches to investigating alliance have mostly neglected alliance as a
longitudinal process. Many alliance studies measure the alliance at only one point of
time (Horvath & Marx, 1990). Alliance in this way is typically operationalized as a one
session snap shot (i.e., typically around the third session) or the average alliance
throughout treatment (Horvath & Symonds, 1991). Others have examined the alliance
over time by breaking the treatment into phases (e.g., thirds; early, middle, or late
treatment). They will then select randomly one session from each phase or average the
alliance within a phase as one score (e.g., Hartley & Strupp, 1983). Although these
approaches yield group averages that are useful in identifying alliance-outcome
relationships, they inform nothing about how within-person changes of alliance over time
affect future treatment engagement or eventual clinical outcome (Henry, Strupp, Schacht,

13
& Gaston, 1994; Kivlighan & Shaughnessy, 2000). To best understand how therapeutic
alliance operates, you must not only know where the clients are but how they got there.
Future Directions in Therapeutic Alliance Research
Although therapeutic alliance has been consistently linked to outcome, most of
the studies have only used autoregressive methods of linking a specific session, phase, or
average alliance to outcome. However, recent advances in longitudinal analyses can be
utilized in therapeutic alliance research. Hierarchical linear modeling (HLM) has the
ability of simultaneously modeling a person’s initial level on a variable of interest as well
as the patterns of change that occur within subject. This approach has many benefits over
previous methods of studying change such as repeated measures ANOVA (Nich &
Carroll, 1997). Some reports have studied how alliance change over time (i.e., growth) is
related to subsequent outcome (Kivlighan & Shaughnessy, 1995, 2000). The findings of
these two studies were mixed, but a pattern of increasing alliance throughout treatment
was consistently linked with positive outcome. Replicating these initial longitudinal
findings in other populations and settings are crucial for generalizing the effect of
alliance longitudinal growth on therapy outcomes. Another longitudinal method being
used more commonly for treatment engagement research is survival analysis (Corning &
Malofeeva, 2004; Woodside, Carter, & Blackmore, 2004). For studying time until an
event (e.g., treatment dropout), survival analysis is superior to traditional methods of
studying longitudinal data such as OLS regression (Singer & Willett, 2003). In fact,
some have argued that most of psychotherapy termination research to date has been
flawed due to the use of common use of statistical methods that do not correctly account
for termination as a longitudinal process (Corning & Malofeeva, 2004). For example, as

14
opposed to ANOVA or OLS regression, only survival analysis can accurately account for
censored data (i.e, an event that has not yet occurred due to an arbitrary cause such as the
data collection period ending).
Another proposed method of improving the research on the effect of treatment
engagement on outcome is to expand the scope of treatment engagement variables.
Although therapeutic alliance has been the most often-studied process variable, the
construct is mostly observed as client-reported data, which can contribute some
traditional biases associated with self-report questionnaires (e.g., social desirability,
recency effect). Furthermore, studying alliance exclusively may be problematic due to
growing evidence that many alliance instruments have ceiling effects (i.e., most patients
have high alliances with therapist), which can lead to biased analyses due to truncated
samples. Therefore, treatment engagement should move toward involving several
discrete variables that may all reflect treatment engagement in different ways. Including
variables such as pretreatment expectancies to treatment, homework completion, and
treatment attendance collectively may give a more robust picture of treatment
engagement’s impact on outcome.
Another interesting application for studying change in therapeutic alliance is
developing benchmarks for how alliance typically develops. Since the growth of alliance
through the course of treatment has not been adequately addressed, we simply do not
know how alliance is established or fluctuates normatively. Finding the typical growth of
alliance can be useful in flagging clinicians when fluctuations of alliance are out of the
ordinary and require additional attention. This approach has been shown promising
effects in systematically providing feedback to clinicians in symptoms/functioning

15
assessments. Known as patient-focused research, this approach has shown to improve
outcome and reduce premature termination in clients who are not doing well in therapy
(Lambert et al, 2001). A meta-analysis of providing feedback in this way has shown to
significantly affect clinician behavior, treatment engagement, and to a lesser extent
clinical outcome (Sapyta, 2004). In light of these promising findings, finding the typical
course of alliance in treatment is an important question by itself. The following study
will investigate how alliance growth typically occurs in treatment as well as its
relationship to outcome.
Study Purpose
Using data from the 14-month long Multimodal Treatment Study of Children with
AD/HD (MTA), this study will address several questions regarding studying
longitudinally therapeutic alliance over the course of treatment: (1) does therapeutic
alliance fluctuate significantly over the course of treatment and to what extent does the
volatility vary depending on the phase of treatment (i.e., early or late)? According to the
theories describing the therapeutic relationship, large volatility should be expected early
in treatment as the client is being socialized into the treatment rationale described by the
therapist. It is hypothesized that the volatility in the sample should follow these theories
with more volatility early in treatment. The amount of volatility should then decline as
therapy progresses. (2) Does therapeutic alliance growth predict outcome over and above
average alliance and does this relationship vary based on the phase of treatment (i.e.,
early or late)? Although alliance will be related to outcome throughout treatment, early
positive alliance is hypothesized as the most crucial for successful treatment response.
Clients with high or growing alliance toward the end of the early phase of treatment are

16
predicted to have the best outcomes. Previous process-outcome studies on therapeutic
alliance typically assessed alliance at one time point (e.g., average alliance in treatment,
one session in a large section of treatment). We will compare this approach with
incorporating each client’s alliance slope as well. (3) Do different patterns of missing
alliance data predict treatment or alliance outcomes? It is hypothesized that participation
in therapeutic alliance procedures is a proxy to treatment engagement in general and thus
should have a similar relationship to outcome. Lack of participation in measurement
procedures, especially after initial cooperation, could be an indicator of low treatment
engagement. (4) Are predictors such as therapeutic alliance, missing data patterns, and
treatment group related to other treatment engagement variables such as premature
dropout? It is hypothesized that early therapeutic alliance growth will be a better
predictor of treatment dropout than other alliance summary variables such as average TA.
In particular, early engagement markers such as declining early alliance or sudden lack of
participation in measurement procedures could be indicators that a client is at risk of
terminating prematurely. Not benefiting from the treatment assigned may also make one
more at risk for termination, which may make those assigned to the less effective
treatment (i.e., parent-training only) more at risk to dropout of treatment.

17
CHAPTER II
METHOD
Population Sample
Participants for this study were from the Multimodal Treatment Study of Children
with AD/HD (MTA). In the MTA, 579 children with AD/HD and at least one caregiver
for each child participated in a randomized controlled trial comparing four treatment
strategies. The children, aged 7.0-9.9 years of age, were assigned to 14 months of
medication management (titration followed by monthly visits with a pharmacotherapist);
intensive behavioral treatment which includes 35 parent-training sessions; the two
combined; or routine community care. The sample was 80% male and 61% Caucasian.
Outcome measurement2 was collected during treatment at baseline, 3 months, 9 months,
and 14 months. Follow-up outcome measurement was also collected 10 months after the
termination of treatment (i.e., 24 months after randomization). For further details on the
study methodology, see Arnold, 1997a, 1997b and MTA Cooperative Group, 1999.
Sampling and Data Collection
All families that were randomized to an experimental treatment (i.e., not
community care) were eligible to complete the adapted Working Alliance Inventory-
Short for caregivers (CWAI-S). After their scheduled treatment appointment, family
2 In practice, outcome measurement time intervals are approximate, not exact. However, this is not problematic in HLM, due to its ability to model precisely the time between baseline and the respective data collection point.

18
members had the opportunity to complete a CWAI-S, place it in a sealed envelope, and
give it to a research assistant on-site. Of the 433 families eligible to complete a CWAI-S,
334 families completed at least one. Analyses indicate that families who participated had
significantly lower teacher-reported baseline symptoms as measured by the SNAP
Inattention mean item score (t (431)= -2.14, p < .05), SNAP ODD mean item score (t(431)
= -2.04, p < .05), and SNAP Total mean score (t(431)= -3.24, p < .001). In contrast, there
were no significant differences on caregiver-reported baseline symptoms. Teachers also
reported significantly greater symptom reduction in participators as measured by mean
item SNAP Inattention (t(431)= -2.45, p < .05) and SNAP Total mean score (t(431)= -
3.03, p < .003). There were no caregiver-reported symptom reduction differences
between participators and non-participators.
Similar to the published papers on the MTA, only measures reported by biological
mothers will be utilized for these analyses. This was primarily done in the MTA because
outcome measurement was mostly completed by biological mothers (MTA Cooperative
Group, 1999). In the parent-training and medication-management sessions, sometimes
additional family members would complete alliance measures with the primary caregiver
(e.g., Grandmother). However a vast majority (68%) of the 1841 valid alliance measures
were completed by biological mothers. There were 439 biological father-reported
measures (24%) and the rest were completed by grandparents, stepparents, or other
family members.
Only alliance measures from parent-training sessions were utilized for this
longitudinal study. The first reason for this was lack of more medication management
participation. While families in the parent-training and combined treatment groups had a

19
participation rate averaging 80 percent (81% and 79%, respectively), only 40% of
families assigned to medication management-only treatment participated including two of
the six treatment sites with no medication management participation at all. More
importantly the design of the study specified that medication management sessions had
significantly fewer alliance measurement points, which is problematic for analyses
studying longitudinal change. Medication management session had only three
“preferred” visits as opposed to six sessions preferred for parent-training sessions. In
practice only 50% of families with medication management sessions had three or more
time points. In contrast, 81% of parent-training sessions that had three or more time
points. Finally, a preliminary growth model found no differences on slope or intercept
between parent-training and medication management sessions (t(286) = 1.18, p =.24;
t(286) = -1.10, p =.28). Therefore, due to the above reasons and to maximize power to
detect differences using families in the combined treatment group, only parent-training
sessions will be used. The final sample size utilized for this study with mother-reported,
parent-training sessions with linking outcome measurement was 229.
Measures
Caregiver Working Alliance Inventory- Short Version (C-WAI)
The short version of the Working Alliance Inventory (WAI-Short; Tracey &
Kokotovic, 1989) was adapted for use in the MTA study for caregiver-therapist
therapeutic alliance. It consists of 12 items on a 7-point likert scale with three subscales
mapping directly on to the Bordin (1979) model of therapeutic alliance (i.e., agreement
on tasks, agreement on goals, and bond). The original WAI has consistently been

20
reported as highly reliable (i.e., α = .84-.92) and possessing adequate convergent (e.g.,
other alliance measures) and discriminant validity (e.g. client perceptions of therapist
expertness, attractiveness, etc.) (Horvath, 1994; Tichenor & Hill, 1989). As mentioned
previously, confirmatory analyses of this measure indicate one general factor is the most
parsimonious representation of the factor structure. For this reason, mean item score will
be used in all analyses.
Swanson, Nolan, and Pelham AD/HD Checklist from the DSM-IV (SNAP-IV)
The SNAP-IV was the primary AD/HD symptom scale used in MTA studies (The
MTA Cooperative Group, 1999). The SNAP-IV has shown adequate reliability and
validity in psychometric studies (Swanson, 1992). The 39-item SNAP-IV in this sample
has good reliability (α = .94). Mother- and teacher-reported SNAP-IV will be utilized for
the study. The AD/HD composite score will be utilized as the outcome variable for all
analyses, which is consistent with the analytical procedures used for the main MTA
studies.
Data Analysis
Hierarchical Linear Modeling
The present study uses hierarchical linear modeling, otherwise known as random-
coefficients regression or individual growth modeling (Francis et al, 1991; Raudenbush &
Bryk, 2002). This family of statistical procedures analyzes nested data (e.g., students
within schools) or longitudinal data by generating growth curves (i.e., individualized
change over time). The estimation procedures used in HLM are superior to random
effects ANOVA and other longitudinal data approaches. Each level-2 unit (e.g., multiple

21
time points nested within subjects) has a unique intercept and slope, and HLM models
can also include data that has significant missing data. This is in contrast to repeated
measures ANCOVA, which can only fix a single growth parameter for all cases and
typically requires no missing data.
Allowing all available data to be included is a major advantage of HLM because
maximizing the amount of subjects allowed leads to better estimates and increased
statistical power. Even subjects with only one time point can be included in longitudinal
models. Although these individuals would provide no information about within-person
variation, HLM still incorporates these data into the estimates of fixed effects when
appropriate (Singer & Willett, 2003). Another advantage over ANOVA procedures is that
HLM handles irregularly spaced time points well. Since time is modeled precisely in
HLM, the data schedule does not have to be equally spaced. Finally, HLM has the ability
to accurately estimate variance and covariance components, even with unbalanced, nested
data (Raudenbush & Bryk, 2002). This gives the analyst the ability to decomposition the
level-2 variation into within- and between-unit components, which cannot be done
accurately with repeated measures ANOVA in unbalanced designs.
The typical protocol for conducting HLM model comparisons will begin by
generating an unconditional model, which is a model that lacks any level-2 predictors.
Then, a model including level-2 predictors will be generated and then compared to the
unconditional model. Both of these models variance components will be estimated using
full maximum likelihood. Only full maximum likelihood deviance statistics can compare
nested models that differ on both fixed and random components, as is planned in the
current study.

22
In order to test our hypotheses regarding differential therapeutic alliance growth
in different phases of treatment, a piecewise linear model will be used to generate
separate slopes for the early and late phase of treatment. Piecewise models have been
used in other applications such in mental health services, where specifying particular
phases of treatment better reflect individual trajectories or ease interpretation (Lambert,
Wahler, Andrade, & Bickman, 2001). These types of models have been used with
success to model phenomena with distinct early and late longitudinal trajectories, such as
patient response to HIV/AIDS medication (Littell, Milliken, Stroup, & Wolfinger, 1996).
This study will test whether a piecewise model specifying “early” alliance development
and “late” alliance development is more representative of the overall trajectory. If so, the
specified trajectories of alliance in “early” and “late” treatment will be compared to
traditional summaries of therapeutic alliance (e.g., average TA) on their ability to predict
treatment outcome in the MTA.
Pattern-Mixture Model Analysis
As mentioned previously, HLM can provide valid parameter estimates in the
presence of missing data. The caveat to this assertion is that the missing data must be
considered ignorable nonresponse (Laird, 1988). Ignorable nonresponse has been
described as meeting Rubin’s (1976) missing at random (MAR) criteria, which is
achieved when the factors contributing to the missing data can be attributed to both
observed covariates and previous observed values of the missing data in question
(Hedeker & Gibbons, 1997). However, in cases where the MAR criteria may not be met
due to missing data patterns, a class of models called pattern-mixture models are often
used to address missing data in longitudinal designs (Hedeker & Gibbons, 1997; Little,

23
1995). Subjects are grouped based on their missing data pattern and then the relative
impact of these categorical classes of missing data can be tested. When significant
differences between different missing data patterns occur in outcomes (e.g., treatment
completers show better treatment benefit than those that attrite), the pattern-mixture
approach can model corrected estimates based on the missing data pattern of the sample.
In order to determine if patterns of missing alliance data impacts alliance growth
or eventual outcome, the pattern-mixture model approach will be utilized. Although
previous studies indicate that missing outcome data patterns have no effect on the major
MTA outcome findings (e.g., The MTA Cooperative Group, 1999), similar analyses have
not been conducted with patterns of missing alliance data. It’s possible that certain
missing data patterns (e.g., few valid alliance measurements collected) may be indicative
of disengagement from the study procedures or recent alliance ruptures with the therapist.
We will evaluate how the most common data patterns (e.g., missing vs. complete data)
impact alliance, premature termination, and outcome.
The procedures used to conduct a pattern-mixture analysis are similar to those that
test models in standard hierarchical linear modeling. The unconditional model will be
compared to pattern-mixture models that correspond to subject-level missing data
patterns. Dummy codes reflecting these patterns will be modeled as level-2 predictors
and compared with the unconditional model. The variance components will also be
estimated using full maximum likelihood to compare nested models.
Assessing Treatment Dropout Using Survival Analysis
Treatment dropout is also an important variable when assessing treatment
engagement. Survival analysis offers advantages over other forms of regression (e.g.,

24
OLS regression, ANOVA) because of several properties specific to premature
termination research (Corning & Malofeeva, 2004; Singer & Willett, 2003). The ability
for survival analysis to accurately account for censored data, time-varying covariates, and
multiple end states simultaneously (e.g., premature termination, mutual termination, or
censored termination) make this approach superior to traditional methods. Survival
analysis also provides more information than traditional methods because it can model
both whether a premature termination occurred and when, which provide more powerful
tests for covariates.
The impact of treatment engagement covariates (e.g., therapeutic alliance growth)
on premature dropout was analyzed using Cox regression survival analysis. Similar to
HLM conditional model comparisons, an estimate of a covariate’s goodness of fit is
evaluated by the amount of additional variance it can account for over and above the
unconditional model. The goodness of fit test is distributed as a chi-square with degrees
of freedom equal to the number of additional covariates being modeled. After initially
modeling premature termination with no predictors, several models with therapeutic
alliance, patterns of missing data, and treatment group status will be entered as covariates
will be generated.

25
CHAPTER III
RESULTS
Preliminary Analyses
A total of 229 families that were involved in parent-training sessions were utilized
based on the criteria described above. Table 1 highlights the descriptive statistics,
reliability and counts for number of waves caregiver alliance data by treatment group.
The CWAI-S in this sample had acceptable reliability (α = .84) and acceptable numbers
of observations per case for longitudinal analyses (approximately 2/3 of sample has 4 or
more repeated measures per client).
Table 1. Descriptive data for the caregiver working alliance inventory item mean value and reflected log transformation.
Highest # of Observations
Measure n Mean SD Range Cronbach’s
α 1 2 3 4+
CWAI-S (item mean) 229 6.11 .52 4.14-7.00 .84 25 23 34 147
Parent Training 118 6.14 .51 4.42-7.00 .84 16 9 22 71
Combined 111 6.09 .52 4.14-7.00 .84 9 14 12 76
CWAI-S (transformed) * 0.25 .12 0.57-0.00 * * * * *
Parent Training * 0.25 .12 0.55-0.00 * * * * *
Combined * 0.26 .11 0.57-0.00 * * * * * Note: * indicates the same value in the transformed portion of the table as in the non-transformed CWAI-S section

26
The CWAI-S was evaluated for normality. The distribution was evaluated by
using normal quantile plots to determine normality and identify outliers. Outliers are
problematic because they often have disproportionate influence on mean and variance
estimates (e.g., Cohen, Cohen, West, & Aiken, 2003). Examination of the distribution
indicated a large negative skew with several outliers. Tabachnik and Fidell (1989)
provide formulas to transform skewness values to z scores. Alliance ratings had
significant skewness and kurtosis scores (i.e., all univariate z-transformed scores higher
than 3.0 and 10.0 respectively), which indicated a large negative skew to both measures.
In these cases, a reflected log transformation is strongly recommended (Tabachnik &
Fidel, 1989). The alliance ratings were transformed, which significantly improved its
skewness and kurtosis. As can be seen in Table 1, the reflected transformation reversed
the interpretation of values (e.g., 0.0 = very high alliance after transformation). Despite
the transformation, there were still 6 cases that were considered outliers. These cases
were kept in the study, but they were windsorized. Windsorizing recodes an outlier to a
less extreme value, which is typically a z-score of 2.0 (Lipsey & Wilson, 2001). This
was done for all outliers.
In order to assess early vs. late therapeutic alliance’s impact, the parent training
sessions had to be categorized into “early” and “late” groups. Data collection in the
MTA data set had intended for therapeutic alliance on the “preferred visits” of parent
training Session 4, 6, 12, 18, 24, and 27. Figure 1 displays the historgram for therapeutic
alliance data collected by session number. As can be seen, data was collected most
frequently on the preferred visits (e.g., 4, 6, 12, etc.) but at least some data was collected
on each session. To maximize power for all comparisons preferred visits 4, 6, and 12

27
were considered “early” sessions and visits 18, 24, and 27 were considered “late”. In
practice, subjects may have missing data on several of these preferred visit dates. In
order to systematically code for early and late sessions, session number was used to
determine the early and late session categories. Session 14 was selected because it
approximated the midpoint of both the session number and cumulative frequency of the
data collected. Using this designation, 51% of the sample would be considered an
“early” treatment session and 49% would be considered a “late” treatment session.
5 10 15 20 25
Parent Training Session Number
0
20
40
60
80
100
120
Freq
uenc
y
Figure 1. Frequency of completed alliance data by session number.

28
The mother- and teacher-reported SNAP-IV data available from the primary
caregiver alliance sample were also utilized. Descriptive statistics for each reporter are
included in Table 2. All reliabilities are adequately high. Exploratory analyses of each
measure also indicate no problems with distribution or outliers.
Table 2. Descriptive data for the SNAP-IV total scale and subscales Highest # of Observations
Measure n Mean SD Range Cronbach’s
α 1 2 3 4+
Caregiver SNAP-IV (item mean) 229 1.31 .58 0.00-3.00 .94 2 8 16 203
Parent Training 118 1.42 .57 0.00-3.00 .93 0 7 10 101 Combined 111 1.19 .58 0.00-3.00 .95 2 1 6 102
Teacher SNAP-IV
(item mean) 216 1.27 .85 0.00-3.00 .93 3 5 31 177 Parent Training 112 1.41 .56 0.00-3.00 .93 0 4 21 87 Combined 104 1.11 .50 0.00-3.00 .92 3 1 10 90
Caregiver Alliance Growth
Inspection of the alliance slope trajectories prior to modeling indicated that a
linear growth function would represent growth best across the entire duration of treatment.
A two-level, unconditional hierarchical model of caregiver therapeutic alliance growth
was generated. The reason for modeling an unconditional growth model first is to
determine on average if there is a significant slope, determine if growth and initial status
should be considered fixed or random effects, and also to serve as a baseline for testing
nested models. Prior to modeling, the time variable (i.e., session number) was centered at

29
Session 2 because that was the earliest session an alliance rating was observed. Table 3
describes the findings for the unconditional growth model.
The summary statistics for the unconditional model suggest that both the initial
status and growth rate parameters are significant. It should be noted that due to the
reflected transformation described previously, a negative growth rate actually indicates
increasing alliance. The mean growth rate is significant and changing at -.003 logits
(+.013 untransformed CWAI units) per session. In untransformed units, this would
indicate a change of 0.325 untransformed units across the span of the study. Both initial
status and growth also indicate significant variance, so both parameters can continue to
be modeled as random parameters (i.e., initial status and slope that can be modeled
uniquely to each subject). One note of concern is that the overall reliability of the growth
rate is at 0.21. This indicates that only 21% of the growth of therapeutic alliance can be
predicted by level-2 predictors.
Table 3. Linear growth model of alliance throughout treatment (unconditional model) Fixed Effect Coefficient SE t Ratio (df=228) p Value Mean initial status, β00 0.289 .01 30.74 <0.001 Mean growth rate, β10 -0.003 .00 -6.50 <0.001 Random Effect Variance df χ2 p Value Initial status, r0i 0.01126 202 503.94 <0.001 Growth rate, r1i 0.00001 202 247.82 <.015 Level-1 error, eti 0.00882 Random level-1 coefficient Initial status, π0i .54 Growth rate, π1i .21 Deviance Statistic (6) -1379.14
30
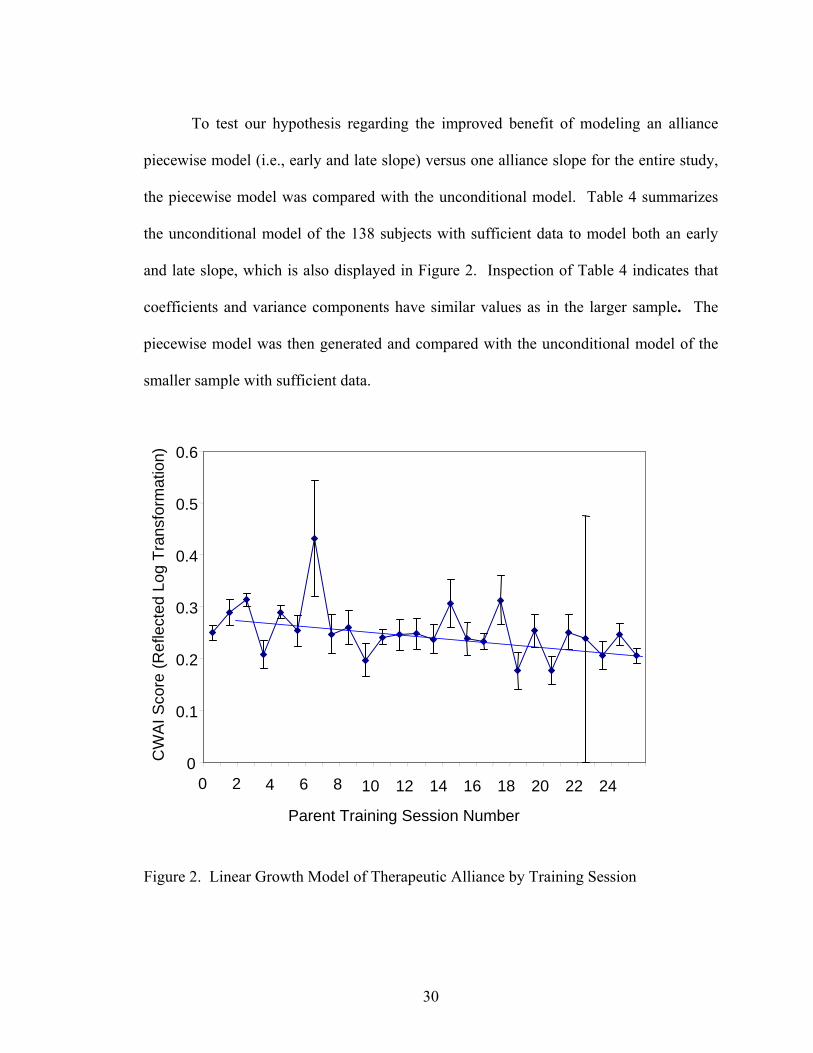
To test our hypothesis regarding the improved benefit of modeling an alliance
piecewise model (i.e., early and late slope) versus one alliance slope for the entire study,
the piecewise model was compared with the unconditional model. Table 4 summarizes
the unconditional model of the 138 subjects with sufficient data to model both an early
and late slope, which is also displayed in Figure 2. Inspection of Table 4 indicates that
coefficients and variance components have similar values as in the larger sample. The
piecewise model was then generated and compared with the unconditional model of the
smaller sample with sufficient data.
Figure 2. Linear Growth Model of Therapeutic Alliance by Training Session
0
0.1
0.2
0.3
0.4
0.5
0.6
0 2 4 6 8 10 12 14 16 18 20 22 24
Parent Training Session Number
CW
AI S
core
(Ref
lect
ed L
og T
rans
form
atio
n)

31
Table 4. Linear growth model of alliance over the course of treatment (unconditional model) for subjects with sufficient data to construct a piecewise growth model Fixed Effect Coefficient SE t Ratio (df=137) p Value Mean initial status, β00 0.292 0.011 25.59 <0.001 Mean growth rate, β10 -0.003 0.001 -5.82 <0.001 Random Effect Variance df χ2 p Value Initial status, r0i 0.012 137 441.19 <0.001 Growth rate, r1i 0.000 137 210.70 <0.001 Level-1 error, eti 0.009 Random level-1 coefficient Initial status, π0i .68 Growth rate, π1i .34 Deviance Statistic (6) -1024.82
Table 5 displays the results of the alliance piecewise model. Inspection of the
piecewise model parameters indicates that the early slope was found to be significant,
which is in contrast to the nonsignificant overall slope of the late sessions. The variance
components of both early and late slope were significant, indicating each have significant
random effects. As predicted, the early slope is both more steep and variable than the
slope later in treatment. Descriptively, this indicates that alliance fluctuations are larger
early in treatment, but then become more gradual (i.e., no significant change on average)
and less variable later in treatment. When compared with the unconditional model, the
piecewise model predicts a statistically significant amount of additional variance (i.e.,
13.4% of Level-1 variance) to justify the more complicated, piecewise model (χ2(4) =
16.76, p < .01).

32
Table 5. Linear piecewise model of growth of alliance over the course of treatment (early slope and late slope) Fixed Effect Coefficient SE t Ratio (df=137) p Value Mean initial status, β00 0.310 0.01 23.75 <0.001 Mean early growth rate, β10 -0.007 0.001 -4.34 <0.001 Mean late growth rate, β10 -0.002 0.001 -1.85 0.067 Random Effect Variance df χ2 p Value Initial status, r0i 0.01375 137 328.66 <0.001 Early growth rate, r1i 0.00010 137 206.96 <0.001 Late growth rate, r2i 0.00003 137 219.04 <0.001 Level-1 error, eti 0.00741 Random level-1 coefficient Initial status, π0i .55 Early growth rate, π1i .30 Late growth rate, π2i .34 Deviance Statistic (10) -1041.580083
Caregiver Alliance Growth Relationship to Outcome
Using the sample with sufficient data to model both an early and late therapeutic
alliance slope, the relationship between outcome and fluctuations in therapeutic alliance
was evaluated. Using the residual file from the generated piecewise therapeutic alliance
model, the respective early and late slope was calculated by adding the ordinary least
squares residual of the subject to the fitted model value. Traditional conventions to
summarize therapeutic alliance were also utilized including average overall TA, average
early TA, and average late TA.
The distributions for early alliance slope, late alliance slope, and the conventional
TA summary variables were all evaluated for normality. Significant outliers were

33
identified for both of the slope variables (i.e., three and five, respectively). These outliers
were truncated by windsorizing them. All distributions were then assessed for normality
using both Kolmogorov-Smirnov and Shapiro-Wilk tests (Chakravarti, Laha, & Roy,
1967; Shapiro & Wilk, 1965). All were non-significant indicating the distributions
reasonably adhere to a normal distribution for their respective sample size.
The relationship between therapeutic alliance growth and outcome was then
evaluated. The primary outcome variable for the MTA, the SNAP-IV AD/HD composite
score, was utilized as the dependent variable as reported by both caregivers and teachers.
As was practiced in the primary MTA analyses, a log transformation was performed on
the Level-1 time variable due to the curvilinear trajectory of outcome growth. The
practice of transforming curvilinear trajectories with a log transformation aids both
estimating parameters and interpretation of the coefficients (Cohen, P., Cohen, J., West,
S., & Aiken, L., 2002).
Therapeutic alliance growth was first evaluated with the caregiver-reported
AD/HD composite score up to the end of the treatment phase (i.e., 14-month timepoint).
Table 6 summarizes the unconditional model for caregiver-reported outcome with a log-
transformed Level-1 time covariate. Inspection of the growth coefficient indicates that
the slope is significant (i.e., AD/HD symptoms improve over time). The variance
components for both growth and initial status are also significant, justifying their model
specification as random effects.
34
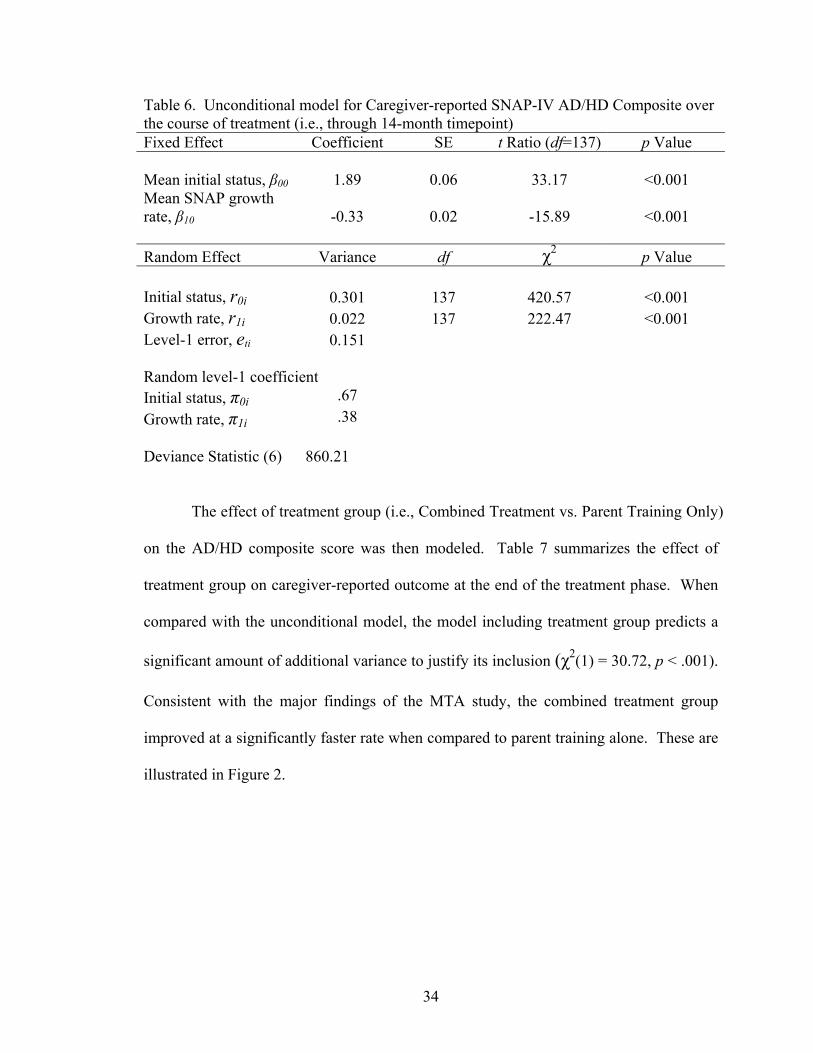
Table 6. Unconditional model for Caregiver-reported SNAP-IV AD/HD Composite over the course of treatment (i.e., through 14-month timepoint) Fixed Effect Coefficient SE t Ratio (df=137) p Value Mean initial status, β00 1.89 0.06 33.17 <0.001 Mean SNAP growth rate, β10 -0.33 0.02 -15.89 <0.001 Random Effect Variance df χ2 p Value Initial status, r0i 0.301 137 420.57 <0.001 Growth rate, r1i 0.022 137 222.47 <0.001 Level-1 error, eti 0.151 Random level-1 coefficient Initial status, π0i .67 Growth rate, π1i .38 Deviance Statistic (6) 860.21
The effect of treatment group (i.e., Combined Treatment vs. Parent Training Only)
on the AD/HD composite score was then modeled. Table 7 summarizes the effect of
treatment group on caregiver-reported outcome at the end of the treatment phase. When
compared with the unconditional model, the model including treatment group predicts a
significant amount of additional variance to justify its inclusion (χ2(1) = 30.72, p < .001).
Consistent with the major findings of the MTA study, the combined treatment group
improved at a significantly faster rate when compared to parent training alone. These are
illustrated in Figure 2.

35
Figure 3. 14-month caregiver-reported AD/HD symptoms by treatment group
Both early and late therapeutic alliance slope was then evaluated by entering it in
the model that included treatment group. Table 8 summarizes the model with treatment
group, early TA slope, and late TA slope. When the TA slopes were entered, they
werefound not to predict any additional variance χ2(2) = 0.86, p < .65). Similar null
findings were found when average early TA (χ2(1) = 0.32, p < .57), average late TA
(χ2(1) = 0.08, p < .78), and average overall TA (χ2(1) = 0.02, p < .89) were entered
respectively with a model including treatment group. It appears that, contrary to our
hypotheses, that therapeutic alliance did not contribute to predicting eventual treatment
outcome over and above participation in combined treatment.
0
0.50
1.00
1.50
2.00
SNA
P C
ompo
site
Sco
re
0 0.75 1.5 2.25 3.00
Time from Baseline (Log Transformation)
0
Combined PT Only

36
Table 7. 14-month caregiver-reported AD/HD composite model including treatment group Fixed Effect Coefficient SE t Ratio (df=137) p Value Mean initial status, β00 1.89 0.06 33.23 <0.001 Mean SNAP growth rate, β10 -0.33 0.02 -17.25 <0.001 Combined treatment, β11 -0.18 0.03 -5.90 <0.001 Random Effect Variance df χ2 p Value Mean initial status, β00 0.300 137 419.66 <0.001 Growth rate, r1i 0.014 136 189.39 0.002 Level-1 error, eti 0.152 Random level-1 coefficient Initial status, π0i .67 Growth rate, π1i .27 Deviance Statistic (7) 829.490318 Variance explained
Var (π0i) Var (π1i)
Unconditional N/A 0.02232 Conditional on Treatment N/A .01356
Proportion of Variance Explained N/A 39.2

37
Table 8. 14-month caregiver-reported AD/HD composite model including treatment group and piecewise alliance slopes Fixed Effect Coefficient SE t Ratio (df=137) p Value Mean initial status, β00 1.89 0.06 33.21 <0.001 Mean SNAP growth rate, β10 -0.33 0.02 -17.29 <0.001 Combined treatment, β11 -0.18 0.03 -5.77 <0.001 Early TA Slope, β12 -0.55 0.90 -0.61 0.55 Late TA Slope, β13 0.70 1.88 0.37 0.71 Random Effect Variance df χ2 p Value Mean initial status, β00 0.300 137 419.64509 <0.001 Growth rate, r1i 0.013 134 187.46679 0.002 Level-1 error, eti 0.152 Random level-1 coefficient Initial status, π0i .67 Growth rate, π1i .27 Deviance Statistic (9) 828.625328
Therapeutic alliance was also found to not be related to caregiver-reported
outcome when long-term effects were evaluated (i.e., 24-month time point). Consistent
with the previous findings, the model including treatment group accounted for a
significant amount of additional variance (χ2(1) = 18.07, p < .001) and clients in the
combined treatment group improved at a faster rate. However, a model with treatment
group, and both TA slope parameters did not account for additional variance when
compared with the model with only treatment group (χ2(2) = 0.78, p < .68). The
traditional TA conventions of average early TA (χ2(1) = 0.00, p < .99), average late TA,

38
and average overall TA (χ2(1) = 0.47, p < .49) also failed to account for additional
variance when entered in model including treatment group. It appears that therapeutic
alliance is not related to outcome on any of the primary caregiver-reported outcome
measures.
Therapeutic alliance growth was also evaluated using the teacher-reported
AD/HD composite of the SNAP-IV in a similar fashion. Beginning with the data
available up to the end of treatment (14-month timepoint), treatment group was entered
first and yielded a model that accounted for a significant amount of additional variance
when compared to the unconditional model (χ2(1) = 14.33, p < .001). When the TA
slopes were then added to the model with treatment group, they did not account for a
significant amount of variance (χ2(2) = 2.10, p < .35). Similar non-significant findings
were found for average overall TA (χ2(1) = 0.15, p < .70), average early TA (χ2(1) =
0.98, p < .32), and average late TA (χ2(1) = 0.11, p < .74). Similar to the primary
caregiver-reported outcome measures, therapeutic alliance did not predict outcome over
and above treatment assignment at the end of treatment (14-months).
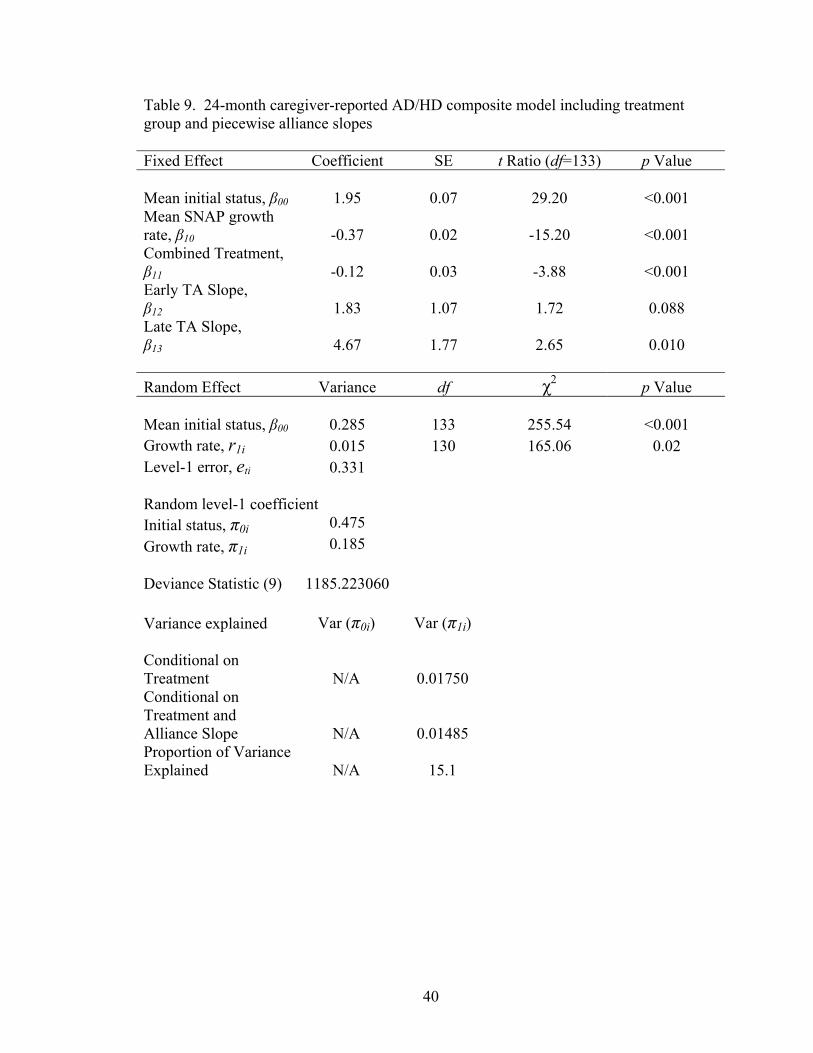
Some significant relationships between outcome and therapeutic alliance did
emerge when the teacher-reported long term outcomes were included. As before,
treatment group was found to be a significant predictor of treatment outcome when
compared to the unconditional model (χ2(1) = 15.81, p < .001). When the TA slopes
were added to the model including treatment group, the new model including the TA
slopes accounted for a significant amount of variance (χ2(2) = 6.85, p < .03), and it is
summarized in Table 9. Inspection of Table 9 indicated that the Early TA slope

39
parameter was not significant, and so it was removed from the model. The model
including only treatment group and Late TA slope was then generated but not significant
(χ2(1) = 3.48, p < .06). Similar to all previous outcome analyses, the traditional TA
conventions of average TA (χ2(1) = 0.08, p < .78), average early TA (χ2(1) = 0.61, p <
.44), and average late TA (χ2(1) = 1.84, p < .17) were all non significant. Similar to the
other analyses, the traditional summaries of therapeutic alliance did not predict outcome
in the 24-month teacher-reported outcome measures. However, entering both early and
late therapeutic alliance slope did predict treatment outcome over and above treatment
assignment (i.e., 15.1% explained error variance). However this trend did not hold once
early alliance slope was removed due to lack of a significant Early TA slope coefficient.
Pattern Mixture Analysis
The degree that therapeutic alliance missing data patterns affects outcomes were
evaluated using pattern mixture analysis procedures. In order to accurately evaluate
patterns of missing data, a dummy coding strategy was utilized to reflect different
patterns of missing data. Subjects were divided by these missing data patterns and
entered as level-2 variables. As mentioned previously, therapeutic alliance ratings had
six “preferred” timepoints where alliance data was to be collected (i.e., Sessions 4, 6, 12,
18, 24, 27). Due to the number of permutations of missing data in six timepoints (i.e., 26
= 64 separate patterns), the groups were combined to early, middle, and late. From these
major categories, the frequency table for existing data patterns was generated and is
displayed in Table 10.
40
Table 9. 24-month caregiver-reported AD/HD composite model including treatment group and piecewise alliance slopes Fixed Effect Coefficient SE t Ratio (df=133) p Value Mean initial status, β00 1.95 0.07 29.20 <0.001 Mean SNAP growth rate, β10 -0.37 0.02 -15.20 <0.001 Combined Treatment, β11 -0.12 0.03 -3.88 <0.001 Early TA Slope, β12 1.83 1.07 1.72 0.088 Late TA Slope, β13 4.67 1.77 2.65 0.010 Random Effect Variance df χ2 p Value Mean initial status, β00 0.285 133 255.54 <0.001 Growth rate, r1i 0.015 130 165.06 0.02 Level-1 error, eti 0.331 Random level-1 coefficient Initial status, π0i 0.475 Growth rate, π1i 0.185 Deviance Statistic (9) 1185.223060 Variance explained
Var (π0i)
Var (π1i)
Conditional on Treatment N/A 0.01750
Conditional on Treatment and Alliance Slope N/A 0.01485
Proportion of Variance Explained N/A 15.1

41
Table 10. Frequency table of missing data patterns over early, middle, and late parent-training sessions
Missing Data Pattern Frequency Percentage
Observed./Observed./Observed. 121 52.8 Observed./Observed./Missing. 26 11.4 Observed./Missing./Missing. 24 10.5 Missing./Missing./Observed. 20 8.7 Missing./Observed/Observed 17 7.4 Observed/Missing./Observed 16 7.0 Missing/Observed/Missing. 5 2.2
Few missing data patterns had enough data to warrant separate analyses for each
category. When this is the case, Hedecker & Gibbons (1997) recommend testing missing
data patterns that both incorporate adequately represented categories and can model
complete/incomplete data patterns. For this reason two major comparisons were utilized
that represented the most frequent missing data patterns. The first compared those with
complete data in all three phases in treatment to those with any missing data (i.e.,
complete vs. incomplete data). This comparison included all data available and
compared groups of relative equal groups (i.e., Completers = 53% vs. Non-completers =
47%). The second pattern that utilizes the most frequent missing data patterns compares
completers vs. those that begin initial data collection and then subsequently drop out of
all further alliance data collection. This analysis compared the three most common
missing data patterns and 75% of the sample. This comparison also highlights our
hypotheses regarding the importance of early alliance and subsequent dropout could
serve as a proxy for low treatment engagement. Hedecker & Gibbons describe this
comparison as a monotone pattern of dropout and is represented by two dummy coded
variables. The dummy coding strategies for both the incomplete and monotone coding
schemes are illustrated in Appendix II.

42
The impact of various patterns of missing alliance data was tested on several
outcome variables. Similar to our previous procedures, an unconditional model must first
be generated before the pattern mixture models can be compared to it. For comparing
subjects with incomplete data collection vs. complete data collection, the full
unconditional model for therapeutic alliance displayed in Table 3 was used. Using the
“incomplete” coding strategy illustrated in Appendix 2, the impact of a subject having
incomplete data was tested on their overall therapeutic alliance growth. The pattern
mixture model was found to be nonsignificant, suggesting that the effect of having
incomplete data does not significantly alter the growth or intercept of therapeutic alliance
(χ2(2) = 0.53, p < .77). Similarly using the “monotone” coding strategy, no significant
differences were found on alliance development between subjects with complete data
versus initial participators who “dropout” in future waves (χ2(4) = 4.22, p < .38).
Similar procedures tested the impact of missing alliance data on treatment
outcome. Consistent with the lack of effects missing data has on alliance growth, missing
data patterns had no significant impact on outcome. When using the incomplete coding
strategy, missing data patterns had no effect on either caregiver-reported 14-month (χ2(2)
= 2.26, p < .33) or 24-month outcome (χ2(2) = 1.54, p < .47). Incomplete data also had
no effect for 14-month (χ2(2) = 0.66, p < .72) and 24-month (χ2(2) = 0.28, p < .87)
teacher-reported outcome. When using the monotone coding strategy (i.e., initial
participators who dropout in all subsequent data collection), no effects were found on
teacher-reported (14-month- χ2(4) = 1.50, p < .83 ; 24-month- χ2(4) = 3.53, p < .47) or

43
caregiver-reported (14-month- χ2(4) = 1.21, p < .88 ; 24-month- χ2(4) = 3.00, p < .56)
outcome.
It appears that patterns of missing therapeutic alliance data do not predict either
therapeutic alliance growth or subsequent clinical outcome. Although hypothesized to be
a proxy for treatment engagement, it did not predict outcome on either caregiver- or
teacher-reported outcome measures.
Survival Analysis
The effect of treatment engagement variables on premature termination was
evaluated using survival analysis procedures. In particular, Cox (1972) regression
procedures were used to generate both the survival functions and test the goodness of fit
of added covariates to the baseline hazard function. Because Cox regression assumes that
time is on a continuous scale, the number of days since baseline was used as opposed to
assessment point for the time variable. Also due to the skew in the time distribution
typically found in survival analysis, time was modeled after a log transformation. Figure
2 illustrates the baseline cumulative survival function. To ease interpretation, the x-axis
was transformed back to raw number of days since baseline. Inspection of the function
indicates that a gradual decline in treatment participation occurs during the 3-month
(median= 104 days) and 9-month time points (median = 229 days). A more drastic
decline occurs at the 14-month timepoint (median = 412 days), where a larger proportion

44
of the sample attrite.
0 100 200 300 400 500
Days After Baseline
0.80
0.85
0.90
0.95
1.00
Cum
ulat
ive S
urviv
al
Figure 4. Cumulative survival function of treatment dropout
Covariate analyses were conducted using the primary therapeutic alliance
variables, missing data patterns, and treatment assignment. Each static covariate (i.e.,
average overall alliance, alliance missing data pattern, and treatment assignment) was
tested separately by entering it as a predictor and comparing the difference in goodness of
fit , which is distributed as a chi-square with one degree of freedom. In addition, alliance
slope (early and late) and average slope (early and late) were modeled as time-varying
covariates. Based on the concordance between parent-training session 14 (i.e., the
midpoint of the treatment protocol) and the corresponding outcome measurement point,
the time-varying covariate was considered “early” until the 9-month outcome
measurement point when the covariate became “late”.

45
0 100 200 300 400 500
Days from Baseline
0.4
0.5
0.6
0.7
0.8
0.9
1.0
Cum
ulat
ive
Surv
ival
Treatment GroupPT OnlyCombined
Figure 5. Cumulative survival by treatment group
The results of covariate effects on survival are displayed in Table 11. Consistent
with previous analyses, none of the alliance variables or missing data patterns were
related to premature termination. The only significant predictor of premature termination
was treatment assignment. Figure 3 illustrates the survival function by treatment group.
Once again, in contrast to treatment group assignment, it appears that engagement
variables are not related to outcome in the MTA data set.

46
Table 11. Cox regression analyses with covariates predicting premature termination. Covariate B SE χ2
dif p Value Effect Size (r) Treatment Group -2.64 0.60 38.39 <0.001 0.41 Overall Average TA 0.48 1.39 0.12 0.73 0.02 Early Average TA .08 1.45 0.00 0.96 0 Late Average TA .03 1.54 0.00 0.99 0 Early TA Slope -10.08 12.94 0.61 0.44 0.06 Late TA Slope 12.78 21.50 0.35 0.56 0.05

47
CHAPTER IV
DISCUSSION
This study generated several findings related to therapeutic alliance and outcome:
1. Therapeutic alliance is volatile within-clients and has different trajectories in
early versus late treatment. This brings into question the utility of traditional
means of summarizing therapeutic alliance such as average overall alliance
and one-session snapshots of alliance over phases of treatment.
2. Assignment to the combined treatment (i.e., medication management and
behavioral treatment) significantly predicted therapeutic outcome.
Inconsistent with our hypotheses, therapeutic alliance did not consistently
predict treatment outcome over and above treatment assignment.
3. Patterns of missing therapeutic alliance data, hypothesized to be a proxy for
overall treatment engagement, was not predictive of therapeutic alliance
growth or treatment outcome.
4. Premature treatment dropout, as analyzed using survival analysis, was only
predicted by treatment group assignment. Treatment engagement variables
such as therapeutic alliance and missing alliance data patterns did not predict
premature treatment termination.

48
This study incorporated several different statistical techniques to investigate the
role of longitudinal treatment engagement on treatment outcome. The treatment
engagement literature, with a few recent exceptions, has not addressed adequately the
role that longitudinal changes in constructs such as therapeutic alliance can affect
eventual treatment outcomes. As opposed to the majority of studies that use one-session
snapshots to represent stretches of treatment, this study utilized piecewise HLM growth
models to represent therapeutic alliance trajectories representative of the larger course of
treatment engagement over time.
This study utilized the Multimodal Treatment Study of Children with AD/HD to
address the role of longitudinal treatment engagement for several reasons. First, the
MTA systematically collected therapeutic alliance data up to seven times over the course
of a 14-month treatment span. There is no other published study that parallels the scope
or frequency of therapeutic alliance data collection over such a long period of treatment.
Second, the MTA collected therapeutic alliance data from the most commonly utilized
measure (i.e., WAI). The fact that this study utilizes the state-of-the-art measure adds to
the generalizability of the findings. Third, the study also was a first to evaluate the role
that caregiver therapeutic alliance could have on clinical outcome of child mental health
services. The role that caregivers play in both the financing and execution of child
treatment plans are well documented (Weisz & Jensen, 1999). Therefore, the impact of
the caregiver’s bond to the therapist on outcome is important to evaluate.
First, this study described the pattern of therapeutic alliance growth during the
course of therapy. The theories describing therapeutic alliance development typically
conceptualize alliance to be a volatile process, particularly in the early stage of treatment.

49
Therefore for this sample, it was hypothesized that higher fluctuations in therapeutic
alliance (i.e., more drastic growth) and the overall volatility (i.e., higher variability)
would be most likely found in the early stage of treatment. Once the therapeutic alliance
is established and the client internalizes the treatment rationale in later stages, the alliance
should stabilize (i.e., small subsequent alliance growth) and the frequency of treatment
alliance ruptures should dissipate (i.e., less variability).
In order to adequately describe the possibility that growth may be different or
more variable in different phases of treatment, a therapeutic alliance piecewise growth
model was generated. When the piecewise model was compared to a single slope model,
the findings were consistent with all of the initial hypotheses. First, the piecewise model
represented therapeutic alliance growth significantly better than a typical linear growth
model. This suggests that alliance growth could vary significantly depending on the
phase of treatment. Second, alliance growth exhibited more drastic growth trends early
in treatment. Inspection of the alliance growth coefficients indicated that alliance
generally increased during the early phase of treatment but then typically leveled off (i.e.,
no significant growth) during the late phase of treatment. Finally, the variability of
alliance was more pronounced in early treatment. The variance in early treatment was
also larger than in late treatment suggesting that the volatility also decreased as treatment
progressed.
These descriptive findings from the alliance piecewise growth model can be
explained by either theoretical or methodological factors. Most of the theories relevant to
therapeutic alliance suggest that treatment engagement would be the most volatile early
in the treatment process. For example, the phase model for psychotherapy describes that

50
a client seeking treatment must first be socialized to the rationale and procedures of
treatment in the early phase of remoralization. During this phase the client must reframe
their mental condition and begin to trust the therapist as an agent for change. Due to the
number of factors that could affect the outcome of this initial phase (e.g., the client’s
motivation to change, the match between pretreatment expectancies and the therapist’s
treatment rationale, the therapist’s ability to persuade the client), the period would be
expected to be highly volatile and could perhaps lead to the most client-initiated
unilateral treatment termination. The descriptive picture of MTA therapeutic alliance
growth would be consistent with this theoretical explanation. However, the
methodological nuances of the MTA sample cannot be entirely ruled out. The
distribution of therapeutic alliance ratings was skewed, indicating that a majority of
caregivers reported high alliance with their therapist throughout the study. As therapeutic
alliance increased during the study, the already high alliance may have exhibited a ceiling
effect in late sessions for some participants. In fact, 17% of the sample that had a late
session at all (i.e., 31 of 186) had the highest score possible on their last recorded late
session. However, despite the overall high alliance ratings in late sessions, 42% of the
late TA slopes in the piecewise model were decreasing. These findings indicate that
although overall high TA led to truncation and ceiling effects in a portion of the sample,
nearly half of the participants were demonstrating decreasing alliance in late treatment.
This indicates that although alliance growth is affected by consistently high alliance
ratings, ceiling effects cannot completely explain the descriptive findings.
The second question this study addressed was the relationship between
therapeutic alliance growth and treatment outcome. In addition to evaluating the

51
predictive utility of alliance growth, the study also evaluated how alliance growth
compares to the literature regarding traditional methods of summarizing therapeutic
alliance. Consistent with previous studies, the average early, late, and overall alliance
were all included as possible predictors of treatment outcome. It was hypothesized that
all therapeutic alliance indicators would be related to therapy outcome, but therapeutic
alliance growth would be a better predictor due to its ability to represent treatment
engagement trends. Furthermore, early alliance growth was hypothesized to be the most
predictive indicator of eventual outcome, because it represented the alliance trend during
the relationship-building phase of treatment.
Contrary to our hypotheses, every therapeutic alliance indicator failed to predict
treatment outcome over and above the effect of treatment group. In both caregiver- and
teacher-reported outcome, none of the therapeutic alliance indicators significantly
predicted outcome. Similar results were found in both 14-month and 24-month outcome.
There was a trend for late therapeutic alliance growth to be a significant predictor over
and above treatment assignment in the 24-month teacher reported data. However, little
weight can be attributed to this finding due to the number of a priori comparisons
conducted.
The third major research question of this study was the degree that patterns of
missing alliance data could predict alliance or treatment outcomes. Although therapeutic
alliance ratings can directly assess a client’s level of treatment engagement, this study
hypothesized that families who participate sporadically in alliance data collection may
also not be engaging in the overall treatment. Conceptualizing participation in alliance
data collection as a proxy to therapeutic alliance itself, caregivers who participate in most

52
or all data collection procedures were expected to have higher alliances as well as better
outcomes. Two different coding strategies were used to assess the impact of missing data
as outlined by Hedecker & Gibbons (1997). The “incomplete” coding scheme directly
compared those who completed alliance data in all phases of treatment to those who
missed any along the way. Although this can illustrate the general impact of missing data
on outcome, it does not address our hypotheses regarding the impact of dropout after
initial early treatment engagement. If clients participate initially and then subsequently
dropout, it is hypothesized that these clients will have initially poor alliance (i.e., in early
treatment) and subsequent poor outcome.
As with the ratings of alliance, the patterns of missing alliance data were not
related to outcome. For both the incomplete and monotone coding schemes, missing data
patterns were related to neither alliance nor outcome. Although it may have been the
case that missing alliance data collection could be a proxy for poor alliance (particularly
in this generally high alliance sample), the results do not support our hypotheses.
Perhaps other proxies for treatment engagement may be more related to alliance
development and outcome. Proxies such as parent-training session attendance or
medication management adherence (e.g., pill counts, prescription records) may be better
indicators of treatment engagement because they are directly related to participation in
specific components of treatment.
Our final research question investigated whether treatment engagement variables
or treatment selection was related to premature dropout. Similar to our previous research
questions, it was hypothesized that those with low overall therapeutic alliance, declining
alliance growth, and poor alliance measurement attendance would be associated with

53
premature termination. Since combined treatment was found to a more effective
treatment for AD/HD, the study also hypothesized that treatment group was related to
outcome. It was argued that not being exposed to the most effective treatment would be
similarly related to premature termination as treatment engagement.
Consistent with our previous analyses, none of the therapeutic alliance indicators
predicted premature termination. The only significant predictor was treatment group.
Overall, not a large portion of the sample prematurely dropped out (40 out of 229).
However, 38 of those who did dropout were from the Parent Training Only treatment
group. At first glance, it would seem the difference between premature treatment
termination between the combined and parent-training groups is vastly different.
However, it should be noted that the MTA defined dropout as both participants who
literally dropped out of the study and/or participants who crossed treatment arms (i.e.,
began another treatment that was not initially assigned). Although the distinction
between these types of “dropout” were not coded directly, it was systematically easier to
dropout of the parent training only group because adding any additional treatment
constituted dropping out of this group. In contrast, nothing could be added to the
combined treatment group. Nevertheless, significantly more parent-training only
participants dropped out, most likely due to experiencing less benefit from the parent
training only treatment. When comparing these results with the lack of association with
therapeutic alliance variables, it is interesting to speculate why alliance was not related to
any outcome in most comparisons.
Despite the large literature indicating that therapeutic alliance is a significant
predictor of outcome, some aspects particular to the MTA study may have contributed to

54
alliance’s non-findings. For example, this is the first outcome study to date that has
evaluated therapeutic alliance’s relationship to outcome of AD/HD treatment. There may
be factors specific to AD/HD (e.g., primarily a neurological disorder) that may stymie a
strong therapeutic relationship from having additional benefit over and above highly
effective treatments. Just as it would be unreasonable to suggest that having a strong
bond with your neurosurgeon could improve the outcome of having a tumor over and
above the latest surgical procedures, the same may be the case for disorders that are
primarily not affected by psychological factors such as social influence.
The fact that the most effective treatment for AD/HD is a combination of
medication and psychological treatment could also be related to alliance’s non-findings.
Although alliance has been found to be related to outcome in pharmacotherapy trials
before (e.g., Krupnick, Sotsky, Simmens, & Moyer, 1996), alliance may not be adequate
to predict outcome consistently in interventions that require little more of the client than
take medication daily. Alliance may be a better predictor of outcome in interventions
that require more time-consuming/involving therapeutic tasks (e.g., doing daily mood
grids, thought records several times a day). It could also be a better predictor in
interventions that have a larger variability in treatment adherence. For example, a client
with adequate alliance could attend weekly sessions to vent but do very little outside the
therapy hour to address their issue. However, a highly engaged client may journal,
complete, daily mood records, implement the therapist’s suggestions for behavior change,
or other activities in addition to attending the treatment session. For these reasons,
alliance may be a better predictor of treatment outcome in interventions where the
variability in exposure to a treatment’s “specific effects” is greater or involve large

55
amounts of time/energy to be compliant with the treatment. Even among medication
treatment regimens, treatment engagement variables may be better related to outcome in
regimens that require extensive monitoring/dosing (e.g., diabetes control) than taking a
dose once or twice a day, as is typically the case in AD/HD treatment.
Another possible factor for the non-findings specific to the MTA data was that
therapeutic alliance was reported by the client’s caregivers. The MTA study is the first
study to date that directly addresses the role of caregiver therapeutic alliance on client
outcome. Although there is previous literature citing the importance of caregiver
therapeutic alliance in child studies, most of these studies were conducted using
retrospective surveys or were theoretical papers. Several factors could explain why
caregiver therapeutic alliance would not be as predictive of outcome as it is in typical
mental health treatment modalities. First, although the “therapy” is caregiver-centered
the eventual outcome is based on their child’s symptoms. It could be that the therapeutic
relationship that the caregiver develops with the therapist may be too far removed to
helping with the child’s symptoms. Theories relevant to alliance’s impact on outcome
describe how the therapeutic relationship is important to remoralizing the client by
reframing their problems in the context of the therapist’s treatment rationale and instilling
hope (e.g., remoralization) (Frank & Frank, 1993; Howard et al, 1993). Motivating the
client through processes such as remoralization may improve symptoms via positive
expectancies or other psychological effects that may be difficult to transfer to an
individual not directly involved in the therapeutic process.
Finally, therapeutic alliance’s inability to predict outcome or premature
termination may be related to the lack of variability in the MTA alliance data. As

56
mentioned previously, the majority of caregivers in the MTA sample had high alliances
with their therapist. It may be that high overall alliance ratings should be expected in
efficacy trials that include highly trained clinicians using state-of-the-art treatments with
intense supervision. In fact, high alliance ratings in randomized control trials are not
uncommon, particularly with self-report alliance measures (Kendall et al, 1997; Schelef,
Diamond, Diamond, & Liddle, 2005). However, the fact remains that truncated
distributions leading to ceiling effects limit the ability to detect true associations between
variables (Cohen, P., Cohen, J., West, S., & Aiken, L., 2002). Further troubling is the
fact that families who did not participate in alliance data collection had poorer treatment
outcomes on teacher-reported measures. Having a more representative sample from all
families involved in treatment may have increased the power enough to detect differences.
The following study evaluated the impact of longitudinal therapeutic alliance
development on outcome and other treatment engagement variables. Based on the
available data using appropriate longitudinal analytic techniques, caregiver-reported
therapeutic alliance does not appear to be strongly related to treatment outcome for child
AD/HD treatment. Although this study advanced the scope of how alliance can be
investigated in child studies, much more work is needed to determine the impact that
treatment engagement variables affect outcome. This study utilized hierarchical linear
modeling that can flexibly model sample trends despite missing data or irregularly spaced
time points. Although this approach is flexible to account for missing data, samples that
can minimize the amount of missing data and include additional treatment engagement
variables can address more specific theoretical and methodological longitudinal questions
than in the current study.

57
One way to advance alliance literature would be to actively test competing
theories why therapeutic alliance is related to treatment outcome. For example, there are
two competing hypotheses explaining alliance’s relationship to outcome based on the
general- vs. specific-effects debate (Feeley, DeRubeis, & Gelfand, 1999; Wampold,
2001). One main theory explains that therapeutic alliance is a necessary predicate of
future treatment benefit, and improvement in symptoms/functioning can be predicted by
previous gains in the therapeutic relationship (e.g., Klein et al, 2003; Frank & Frank,
1993). A competing theory explains that high therapeutic alliance is based on
experiencing prior symptom relief based on the specific effects of treatment (e.g., CBT
techniques). Although these competing theories have been actively tested in previous
studies (e.g., DeRubeis, Brotman, & Gibbons, 2005), these studies have used OLS
regression techniques that are simply not adequate to address these longitudinal questions.
A possible future study could utilize structural equation modeling (SEM) that can
specifically test the two competing models using cross-lag designs. However, due to
SEM requirement of equal time intervals and complete data, this study may be more
likely to be conducted in treatment efficacy trials than in community settings.
Another way to move the literature forward is to stop focusing exclusively on
therapeutic alliance and expand the scope of treatment engagement to other variables.
Although alliance has been found to be a key predictor of outcome, it is only one
indicator of treatment engagement. Specifically, alliance is a summary of attitudes
toward the therapist and treatment procedures. But it does not inform about what a
clients does in the context of the therapy procedures. Adding engagement variables such
as homework completion rates or weekly session attendance in addition to regular

58
therapeutic alliance ratings may represent a better indication of overall treatment
engagement. Additional variables such as pretreatment expectancies have also been
getting increased attention (e.g., Dew & Bickman, 2005). Promising research in this field
suggests that therapeutic alliance mediates the relationship between expectancies and
eventual therapeutic outcome (Abouguendia, Joyce, Piper, & Ogrodniczuk, 2004).
Investigating further the relationship between pretreatment variables, alliance, and
eventual outcome may lead to better understanding of the longitudinal processes that
affect outcome.
A final approach to improving the therapeutic alliance literature is to develop
better measures that have more suitable distributions for analyses. The distributions for
both the therapeutic alliance ratings were both highly skewed and positive. More
attention needs to be focused on developing alliance scales that are less likely to have
ceiling effects (i.e., more “difficult” in content). Generating items that may tap into
higher degrees of alliance (e.g., “I implement what my therapist challenges me to do
everyday”) may further differentiate alliance on the high side. New measurement
methods, such as item response theory, can be implemented to determine items that may
discriminate between individuals with moderate alliance and high alliance (Embretson &
Reise, 2000). By continuing to use measures with truncated variance, researchers may be
generating spurious findings and attenuated correlations between alliance and other
variables.

59
APPENDIX A
CONSTRUCTING PIECEWISE MODELS
Piecewise models are useful to model nonlinearity in data. Although a linear
model seems the most parsimonious when looking at the entire span of treatment (i.e., 14
months), it is sometimes useful to investigate different phases of treatment. Inspection of
the growth plots indicated generally linear, but curvilinear patters were evident in many
of the plots for a short period of time. Most of these inflections were transient, and the
lines would then become linear again. For alliance researchers, an interesting question is
whether these varying patterns are more pronounced in a particular phase of therapy? In
order to test this, one could construct a piecewise model.
In order to accomplish this in the MTA data set, we essentially construct two
separate slopes for an early phase (through Session 14) a then one for later treatment
(Session 15 through Session 27). The level-1 model would look like this:
Yti= π0i + π1i(Early Phase) + π2i(Late Phase)+ eti
Once this is constructed, the unconditional model can assess the slope and
volatility for each phase of treatment. If both phases are significant, we can then identify
how much variance is predicted by using this approach over the simple linear model.
In order to construct the piecewise model, each observation has a coded variable
that relates to each of the slope parameters. Since the time variable of the linear model is
based on the session number, the coding scheme for the separate slopes follows from that.
However, it is difficult to describe concisely the coding scheme, because the three
variables are coded differently depending on the particular measurement time point. For
this reason, we will illustrate with an example from the data set.

60
The following is a case from the MTA alliance data. The dummy codes early and
late signify which phase of treatment each repeated measure was collected in. The
variable “Session” is the parent-training session that therapeutic alliance was observed.
Since no alliance data was collected prior to Session 2, session number was centered on
Session 2 (i.e., becoming the session representing the intercept). From this centered
variable, the piecewise model is constructed by constructing two slope parameters that
will selectively estimate a particular phase of treatment. These slope variables are called
early_slp and late_slp. The variables are shown below from subject 3420:
id early late Session Centered Early_slp Late_slp 3420 1 0 2 0 0 0 3420 1 0 5 3 3 0 3420 1 0 11 9 9 0 3420 1 0 12 10 10 0 3420 0 1 14 12 12 0 3420 0 1 16 14 12 2 3420 0 1 17 15 12 3 3420 0 1 23 21 12 9 3420 0 1 24 22 12 10 3420 0 1 25 23 12 11
As this illustrates, early_slp is coded exactly the same as unconditional time
variable for measurement points in that phase. For subsequent measurement points, it is
coded as the last recorded alliance point in the early phase. Subsequent time points are
coded similarly except they must subtract the last measurement session of the previous
time point from their respective days from baseline.

61
APPENDIX B
PATTERN MIXTURE ANALYSIS DUMMY CODING
Hedecker & Gibbons (1997) describe several dummy coding systems that can be
used to model missing data patterns. Many times differences between all possible
missing data pattern cannot be evaluated because some categories are not realized
adequately in the sample. In these cases, coding schemes that can both model incomplete
vs. complete data patterns and represent a large proportion of the sample should be
implemented. The two coding schemes that were used for this pattern mixture analysis
compared either complete vs. incomplete data or compared complete data vs. those that
initially participated and then dropped out for all subsequent data collection periods. The
dummy coding strategies for both schemes is described below. The incomplete coding
scheme adds a dummy code in the model that will represent the effect having anything
but complete data. The monotone coding scheme adds two dummy codes (i.e., M1 and
M2) that are entered simultaneously. When these two are added to the level-2 model,
each missing data pattern is compared respectively to subjects with complete data. Both
the “incomplete” and “monotone” coding schemes can represent large proportions of the
overall alliance sample (100% and 75%, respectively) and address the question if
differential missing data patterns can predict the course of alliance or treatment outcome.
Missing Pattern D1 D2 D3 D4 D5 D6 M1 M2 Incomplete
Obs./Obs./Obs. 0 0 0 0 0 0 0 0 0 Obs./Obs./Msg. 1 0 0 0 0 0 0 1 1 Obs./Msg./Msg. 0 1 0 0 0 0 1 0 1 Msg./Msg./Obs. 0 0 1 0 0 0 1 Msg./Obs./Obs. 0 0 0 1 0 0 1 Obs./Msg./Obs. 0 0 0 0 1 0 1 Msg./Obs./Msg. 0 0 0 0 0 1 1

62
REFERENCES
Abouguendia, M., Joyce, A., Piper, W., & Ogrodniczuk, J. (2004). Alliance as a mediator of expectancy effects in short-term group psychotherapy. Group dynamics: Theory, research, and practice, 8, 3-12.
Armbruster, P., & Kazdin, A.E. (1994). Attrition in child psychotherapy. Advances in
Clinical Child Psychology, 16, 81-108. Arnold, L., Abikoff, H., Cantwell, D., Conners, C., Elliot, G., Greenhill, L., et al (1997a).
NIMH collaborative multimodal treatment study of children with ADHD (MTA): Design and choices. Archives of General Psychiatry, 54, 865-870.
Arnold, L., Abikoff, H., Cantwell, D., Conners, C., Elliot, G., Greenhill, L., et al (1997b).
NIMH collaborative multimodal treatment study of children with ADHD (MTA): Design, methodology, and protocol evolution. Journal of Attention Disorders, 2, 141-158.
Bordin, E. (1979). The generalizability of the psychoanalytic concept of the working
alliance. Psychotherapy: Theory, Research and Practice, 16, 252-260. Bourgeois, L., Sabourin, S., & Wright, J. (1990). Predictive validity of therapeutic
alliance in group marital therapy. Journal of Consulting and Clinical Psychology, 58, 608-613.
Chakravarti, I.M., Laha, R.G. & Roy, J. (1967). Handbook of methods of applied
sciences. New York: Wiley and Sons. Cohen, J., (1992). A Power Primer. Psychological Bulletin, 112, 155-159. Cohen, P., Cohen, J., West, S., & Aiken, L., (2002). Applied multiple
regression/correlation analysis for the behavior sciences (3rd ed.). New York: Lea. Colson, D., Cornsweet, C., Murphy, T., O'Malley, F., Hyland, P., McParland, M., &
Coyne, L. (1991). Perceived treatment difficulty and therapeutic alliance on an adolescent psychiatric hospital unit. American Journal of Orthopsychiatry, 61, 221-229.
Corning, A.F., & Malofeeva, E.V. (2004). The application of survival analysis to the
study of psychotherapy termination. Journal of Counseling Psychology, 51, 354-367. Cox, D.R. (1972). Regression models and life tables. Journal of the Royal Statistical
Society: Series B, 34, 187-220.

63
DeRubeis, R.J., Brotman, M.A., Gibbons, C.J. (2005). A conceptual and methodological analysis of the nonspecifics argument. Clinical Psychology: Science and Practice, 12, 101.
Dew, S., & Bickman, L. (2005). Client expectancies about therapy. Mental Health
Services Research, 7, 21-33. DiGiuseppe, R., Linscott, J., & Jilton, R. (1996). Developing the therapeutic alliance in
child-adolescent psychotherapy. Applied and Preventive Psychology, 5, 85-100. Dore, M., & Alexander, L. (1996). Preserving families at risk of child abuse and neglect:
The role of the helping alliance. Child Abuse and Neglect, 20, 349-361. Eltz, M., Shirk, S., & Sarlin, N. (1995). Alliance formation and treatment outcome among
maltreated adolescents. Child Abuse and Neglect, 19, 419-431. Embretson, S.E., & Reise, S.P. (2000). Item response theory for psychologists. Mahwah:
Lawrence Erlbaum Associates. Feeley, M., DeRubeis, R.J., & Gelfand, L.A. (1999). The temporal relation of adherence
and alliance to symptom change in cognitive therapy for depression. Journal of Consulting and Clinical Psychology, 67, 578-582.
Florsheim, P., Shotorbani, S., Guest-Warnick, G., Barratt, T., & Hwang, W. (2000). Role
of the working alliance in the treatment of delinquent boys in community-based programs. Journal of Clinical Child Psychology, 29, 94-107.
Francis, D., Fletcher, J., Stuebing, K., Davidson, K., & Thompson N. (1991). Analysis of
change: Modeling individual growth. Journal of Consulting and Clinical Psychology, 59, 27-37.
Frank, J., & Frank, J. (1993). Persuasion and healing: A comparative study of
psychotherapy (3rd ed.). Baltimore: The Johns Hopkins University Press. Freud, S. (1913/1966). The dynamics of transference. In J. Strachey (Ed.), Standard
edition of the complete psychological works of Sigmund Freud (Vol. 12, pp. 97-108). London: Horgarth Press.
Garcia, J., & Weisz, J. (2002). When youth mental health care stops: Therapeutic
relationship problems and other reasons for ending youth outpatient treatment. Journal of Consulting and Clinical Psychology, 70, 439-443.
Gaston, L. (1990). The concept of the alliance and its role in psychotherapy: Theoretical
and empirical considerations. Psychotherapy: Theory, Research, Practice, Training, 27, 143-153.

64
Gaston, L. (1991). Reliability and criterion-related validity of the California Psychotherapy Alliance Scales- patient version. Psychological Assessment, 3, 68-74.
Gaston, L., Sabourin, S., Hatcher, R., & Hansell, J. (1992, June). Confirmatory factor
analysis of the patient version of the CALPAS. Paper presented at the meeting of the Society for Psychotherapy Research, Berkeley, CA.
Gavin, L., Wamboldt, M., Sorokin, N., Levy, S., & Wamboldt, F. (1999). Treatment
alliance and its association with family functioning, adherence, and medical outcome in adolescents with severe, chronic asthma. Journal of Pediatric Psychology, 24, 355-365.
Gelso, C., & Carter, J. (1994). Components of the psychotherapy relationship: Their
interaction and unfolding during treatment. Journal of Counseling Psychology, 41, 296-306.
Connolly-Gibbons, M.B., Crits-Christoph, P., de la Cruz, C., Barber, J.P., Siqueland, L.,
& Gladis, M. (2003). Pretreatment expectations, interpersonal functioning, and symptoms in the prediction of the therapeutic alliance across supportive-expressive psychotherapy and cognitive therapy. Psychotherapy Research, 13, 59-76.
Gould, M., Shaffer, D., & Kaplan, D. (1985). The characteristics of dropouts from a child
psychiatry clinic. Journal of American Academy of Child Psychiatry, 24, 316-328. Green, J., Kroll, L., Imrie, D., Frances, F., Begum, K., Harrison, L., et al (2001). Health
gain and outcome predictors during inpatient and related day treatment in child and adolescent psychiatry. Journal of the American Academy of Child and Adolescent Psychiatry, 40, 325-332.
Greenson, R. (1965). The working alliance and the transference neuroses. Psychoanalytic
Quarterly, 34, 155-181. Hartley, D., Strupp, H. (1983). The therapeutic alliance: Its relationship to outcome in
brief psychotherapy. In J. Masling (Ed.), Empirical studies of psychoanalytical theories (pp. 1-37). Hillsdale, NJ: The Analytic Press.
Hedeker, D. & Gibbons, R.D. (1997). Application of random-effects pattern-mixture
models for missing data in longitudinal studies. Psychological Methods, 2, 64-78. Henry, W., Strupp, H., Schacht, T., & Gaston, L. (1994). Psychodynamic approaches. In
A. Bergin & S. Garfield (Ed.), Handbook of Psychotherapy and Behavior Change (4th ed., pp. 467-508). New York: Wiley.
Hogue, A., Dauber, S., Stambaugh, L.F., Cecero, J.L., Liddle, H.A. (2006). Early
therapeutic alliance and treatment outcome in individual and family therapy for

65
adolescent behavior problems. Journal of Consulting and Clinical Psychology, 74, 121-129.
Horvath, A. (1994). Empirical validation of Bordin's pantheoretical model of alliance:
The working alliance inventory perspective. In A. Horvath (ed.), The working alliance: Theory, research, and practice (pp. 109-130). New York: Wiley.
Horvath, A., & Bedi, R. (2002). The alliance. In J. Norcross (Ed.), Psychotherapy
relationships that work: Therapist contributions and responsiveness to patients (pp. 37-70). New York: Oxford University Press.
Horvath, A., & Greenberg, L. (1989). Development and validation of the Working
Alliance Inventory. Journal of Counseling Psychology, 36, 223-233. Horvath, A., & Luborsky, L. (1993). The role of the therapeutic alliance in psychotherapy.
Journal of Consulting and Clinical Psychology, 61, 561-573. Horvath, A., & Marx, R. (1990). The development and decay of the working alliance
during time-limited counseling. Canadian Journal of Counseling, 24, 240-259. Horvath, A., & Symonds, B. (1991). Relation between working alliance and outcome in
psychotherapy: A meta-analysis. Journal of Counseling Psychology, 38, 139-149. Howard, K., Lueger, R., Maling, M., & Martinovich, Z. (1993). A phase model of
psychotherapy outcome: Causal mediation of change. Journal of Consulting and Clinical Psychology, 61, 678-685.
Joyce, A., & Piper, W. (1998). Expectancy, the therapeutic alliance, and treatment
outcome in short-term individual psychotherapy. Journal of Psychotherapy Practice and Research, 7, 236-248.
Kabut, B., DeTychey, C., & Vidailhet, C. (2005). Mothers’ therapeutic alliance and
children outcome in a day hospital. Annales Medico Psychologiques, 163, 486-492. Kazdin, A.E., Bass, D., Ayers, W.A., & Rodgers, A., (1990). Empirical and clinical
focus of child and adolescent psychotherapy research. Journal of Consulting and Clinical Psychology, 58, 729-740.
Kazdin, A., Siegel, T., & Bass, D. (1990). Drawing on clinical practice to inform research
on child and adolescent psychotherapy: Survey of practitioners. Professional Psychology: Research and Practice, 21, 189-198.
Kendall, P.C., Flannery-Schroeder, E., Panichelli-Mindel, S.M., Southam-Gerow, M.,
Henin, A., & Warman, M. (1997). Therapy for youths with anxiety disorders: A second randomized clinical trial. Journal of Consulting and Clinical Psychology, 65, 366-380.

66
Kivlighan, D., & Shaughnessy, P. (1995). Analysis of the development of the working
alliance using hierarchical linear modeling. Journal of Counseling Psychology, 42, 338-349.
Kivlighan, D., & Shaughnessy, P. (2000). Patterns of working alliance development: A
typology of client's working alliance ratings. Journal of Counseling Psychology, 47, 362-371.
Klein, D.N., Schwartz, J.E., Santiago, N.J., Vivian, D., Vocisano, C., Castonguay, L.G.,
et al (2003). Therapeutic alliance in depression treatment: Controlling for prior change and patient characteristics. Journal of Consulting and Clinical Psychology, 71, 997-1006.
Krupnick, J., Sotsky, S., Simmens, S., & Moyer, J. (1996). The role of the therapeutic
alliance in psychotherapy and pharmacotherapy outcome: Findings in the National Institute of Mental Health Treatment of Depression Collaborative Research Program. Journal of Consulting and Clinical Psychology, 64, 532-539.
Laird, N.M. (1988). Missing data in longitudinal studies. Statistics in Medicine, 7, 305-
315. Lambert, E.W., Wahler, R.G., Andrade, A.R., & Bickman, L. (2001). Looking for the
disorder in conduct disorder. Journal of Abnormal Psychology, 110, 110-123. Lambert, M., Whipple, J., Smart, D., Vermeersch, D., Nielsen, S., & Hawkins, E. (2001).
The effects of providing therapists with feedback on patient progress during psychotherapy: Are outcomes enhanced? Psychotherapy Research, 11, 49-68.
Lipsey, M.W., & Wilson, D.B. (2001). Practical meta-analysis. Thousand Oaks: Sage. Littell, R.C., Milliken, G.A., Stroup, W.W., & Wolfinger, R.D. (1996). SAS system for
mixed models. Cary, NC: SAS Institute. Little, R.J. (1995). Modeling the drop-out mechanism in repeated-measures studies.
Journal of the American Statistical Association, 90, 1112-1121. Luborsky, L. (1976). Helping alliances in psychotherapy. In J. Cleghorn (Ed.), Successful
psychotherapy (pp. 92-116). New York: Bruner/Mazel. Luborsky, L., Crits-Christoph, P., Alexander, L., Margolis, M., & Cohen, M. (1983).
Two helping alliance methods for predicting outcomes of psychotherapy. A counting signs vs. global rating method. Journal of Nervous and Mental Disease, 171, 480-490.
Luborsky, L., McLellan, A., Woody, G., O'Brien, C., & Auerbach, A. (1985). Therapist
success and its determinants. Archives of General Psychiatry, 42, 602-611.
67
Luborsky, L., Singer, B., & Luborsky, L. (1975). Comparative studies of psychotherapies:
Is it true that "everyone has won and all must have prizes"? Archives of General Psychiatry, 32, 995-1008.
Mann, J. (1973). Time-limited psychotherapy. Cambridge: Harvard University Press. Marmar, C.R., Gaston L., Gallagher D., Thompson L.W. (1989). Alliance and outcome
in late-life depression. Journal of Nervous Mental Disorders, 177, 464-472. Martin, D., Garske, J., & Davis, M. (2000). Relation of the therapeutic alliance with
outcome and other variables: A meta-analytic review. Journal of Consulting and Clinical Psychology, 68, 438-450.
Marziali, E. (1984). Three viewpoints on the therapeutic alliance scales similarities,
differences and associations with psychotherapy outcome. Journal of Nervous and Mental Disease, 172, 417-423.
Meyer, B., Pilkonis, P., Krupnick, J., Egan, M., Simmens, S., & Sotsky, S. (2002).
Treatment expectancies, patient alliance and outcome: Further analyses from the National Institute of Mental Health Treatment of Depression Collaborative. Journal of Consulting and Clinical Psychology, 70, 1051-1055.
Morgan, R. (1982). Predicting the outcomes of psychotherapy by the Penn Helping
Alliance Rating Method. Archives of General Psychiatry, 39, 397-402. Morrissey-Kane, E., & Prinz, R. (1999). Engagement in child and adolescent treatment:
The role of parental cognitions and attributions. Clinical Child and Family Psychology Review, 2, 183-198.
The MTA Cooperative Group (1999). A 14-month randomized clinical trial of treatment
strategies for attention-deficit/hyperactivity disorder. Archives of General Psychiatry, 56, 1073-1086.
Nich, C., & Carrol, K. (1997). Now you see it, now you don’t: A comparison of
traditional versus random-effects regression models in the analysis of longitudinal follow-up data from a clinical trial. Journal of Consulting and Clinical Psychology, 65, 252-261.
Nock, M., & Kazdin, A. (2001). Parent expectancies for child therapy: Assessment and
relation to participation in treatment. Journal of Child and Family Studies, 10, 155-180.
Orlinsky, D., Grawe, K., & Parks B. (1994). Process and outcome in psychotherapy:
Noch einmal. In A. Bergin & S. Garfield (Eds.), Handbook of psychotherapy and behavior change (4th ed., pp. 270-376). New York: Wiley.

68
Raudenbush, S., & Bryk A. (2002). Hierarchical linear models: Applications and data
analysis methods (2nd ed.). Thousand Oaks: Sage. Rubin, D.B. (1976). Inference and missing data. Biometrika, 63, 581-592. Russell, R., & Shirk, S. (1998). Child psychotherapy process research. Advances in
Clinical Child Psychology, 20, 93-124. Safran, J., & Muran J. (1996). The resolution of ruptures in the therapeutic alliance.
Journal of Consulting and Clinical Psychology, 64, 447-458. Safran, J. & Muran, J. (2000). Resolving therapeutic alliance ruptures: Diversity and
integration. Journal of Clinical Psychology, 56, 233-243. Safran, J., Muran J., & Samstag L. (1994). Resolving therapeutic alliance ruptures: A
task analytic investigation. In A. Horvath & L. Greenberg (Eds.), The working alliance: Theory, research, and practice. New York: Wiley.
Salvio, M., Beutler, L., Wood, J., & Engle D. (1992). The strength of the therapeutic
alliance in three treatments for depression. Psychotherapy Research, 2, 31-36. Sapyta, J. (2001). Parent-therapist therapeutic alliance and client satisfaction:
Construct validity and relationship to outcome. Unpublished Master’s Thesis, Vanderbilt University, Nashville, TN.
Sapyta, J. (2004). The effect of the provision of information on client status toward
clinician behavior and outcome: A meta-analysis. Unpublished manuscript, Vanderbilt University, Nashville, TN.
Saunders, S., Howard, K., & Orlinsky D. (1989). The Therapeutic Bond Scales:
Psychometric characteristics and relationship to treatment effectiveness. Psychological Assessment, 1, 323-330.
Shapiro, S.S., Wilk, M.B. (1965). An analysis of variance test for normality. Biometrika,
52,591-599. Shelef K., Diamond, G.M., Diamond, G,S,, & Liddle, H.A., (2005). Adolescent and
parent alliance and treatment outcome in multidimensional family therapy. Journal of Consulting and Clinical Psychology, 73, 689-698.
Shirk, S. (2001). The road to effective child psychological services: Treatment processes
and outcome research. In J. Hughes & A. La Greca (Eds.), Handbook of Psychological Services for Children and Adolescents (pp. 43-59). New York: Oxford University Press.

69
Shirk, S., & Karver, M. (2003). Prediction of treatment outcome from relationship variables in child and adolescent therapy: A meta-analytic review. Journal of Consulting and Clinical Psychology, 71, 452-464.
Shirk, S., & Saiz, C. (1992). Clinical, empirical, and developmental perspectives on the
therapeutic relationship in child psychotherapy. Development and Psychopathology, 4, 713-728.
Singer, J., & Willett, J. (2003). Applied longitudinal data analysis: Modeling change and
event occurrence. New York: Oxford University Press. Strong, S. (1968). Counseling: An interpersonal influence process. Journal of
Counseling Psychology, 15, 215-224. Strupp, H., & Hadley, S. (1979). Specific vs. nonspecific factors in psychotherapy: A
controlled study of outcome. Archives of General Psychiatry, 36, 1125-1136. Suh, C., Strupp, H., & O'Malley, S. (1986). The Vanderbilt process measures: The
Psychotherapy Process Scale (VPPS) and the Negative Indicators Scale (VNIS). In L. Greenberg & W. Pinsof (Eds.), The psychotherapeutic process: A research handbook (pp. 285-323). New York: Guilford Press.
Swanson, J. (1992). School-based assessments and interventions for ADD students. Irvine:
KC Publications. Tabachnik, B., & Fidel, L. (1989). Using multivariate statistics (2nd Ed). New York:
Harper and Row. Tracey, T., & Kokotovic, A. (1989). Factor structure of the Working Alliance Inventory.
Psychological Assessment, 1, 207-210. Tichenor, V., & Hill, C. (1989). A comparison of six measures of the working alliance.
Psychotherapy: Theory, Research and Practice, 26, 215-224. Wampold, B.E. (2001). The great psychotherapy debate: Models, methods, and findings.
Mahwah: Erlbaum and Associates. Weisz, J., & Jensen, P. (1999). Efficacy and effectiveness in child and adolescent
psychotherapy and pharmacotherapy. Mental Health Services Research, 1, 125-157. Woodside, D.B., Carter, J.C., & Blackmore, E. (2004). Predictors of premature
termination of inpatient treatment for anorexia nervosa. American Journal of Psychiatry, 161, 2277-2281
Zetzel, E. (1956) Current concepts of transference. International Journal of
Psychoanalysis, 37, 369-376.