
Psychological Assessment - University of Oregongsaucier/comp_val.pdf · NEO-FFI has been translated...
16
Psychological Assessment Comparative Validity of Brief to Medium-Length Big Five and Big Six Personality Questionnaires Amber Gayle Thalmayer, Gerard Saucier, and Annemarie Eigenhuis Online First Publication, August 22, 2011. doi: 10.1037/a0024165 CITATION Thalmayer, A. G., Saucier, G., & Eigenhuis, A. (2011, August 22). Comparative Validity of Brief to Medium-Length Big Five and Big Six Personality Questionnaires. Psychological Assessment. Advance online publication. doi: 10.1037/a0024165
Transcript of Psychological Assessment - University of Oregongsaucier/comp_val.pdf · NEO-FFI has been translated...
Psychological Assessment
Comparative Validity of Brief to Medium-Length Big Fiveand Big Six Personality QuestionnairesAmber Gayle Thalmayer, Gerard Saucier, and Annemarie EigenhuisOnline First Publication, August 22, 2011. doi: 10.1037/a0024165
CITATIONThalmayer, A. G., Saucier, G., & Eigenhuis, A. (2011, August 22). Comparative Validity ofBrief to Medium-Length Big Five and Big Six Personality Questionnaires. PsychologicalAssessment. Advance online publication. doi: 10.1037/a0024165
Comparative Validity of Brief to Medium-Length Big Five and Big SixPersonality Questionnaires
Amber Gayle Thalmayer and Gerard SaucierUniversity of Oregon
Annemarie EigenhuisUniversity of Amsterdam
A general consensus on the Big Five model of personality attributes has been highly generative for thefield of personality psychology. Many important psychological and life outcome correlates with Big Fivetrait dimensions have been established. But researchers must choose between multiple Big Five inven-tories when conducting a study and are faced with a variety of options as to inventory length.Furthermore, a 6-factor model has been proposed to extend and update the Big Five model, in part byadding a dimension of Honesty/Humility or Honesty/Propriety. In this study, 3 popular brief tomedium-length Big Five measures (NEO Five Factor Inventory, Big Five Inventory [BFI], and Interna-tional Personality Item Pool), and 3 six-factor measures (HEXACO Personality Inventory, QuestionnaireBig Six Scales, and a 6-factor version of the BFI) were placed in competition to best predict importantstudent life outcomes. The effect of test length was investigated by comparing brief versions of mostmeasures (subsets of items) with original versions. Personality questionnaires were administered toundergraduate students (N � 227). Participants’ college transcripts and student conduct records wereobtained 6–9 months after data was collected. Six-factor inventories demonstrated better predictiveability for life outcomes than did some Big Five inventories. Additional behavioral observations made onparticipants, including their Facebook profiles and cell-phone text usage, were predicted similarly by BigFive and 6-factor measures. A brief version of the BFI performed surprisingly well; across inventoryplatforms, increasing test length had little effect on predictive validity. Comparative validity of themodels and measures in terms of outcome prediction and parsimony is discussed.
Keywords: inventories, psychometrics, psychological assessment, test validity, five factor personalitymodel
Supplemental materials: http://dx.doi.org/10.1037/a0024165.supp
The Big Five is a structural model of personality attributes thatemerged from a variety of factor-analytic studies conducted withdiverse temperament and personality scales and with lexical stud-ies in the latter half of the twentieth century (Digman, 1996). Theconvergence of previous studies on five core factors becameapparent to personality researchers in the 1980s (Digman, 1996;Goldberg, 1993). The contemporary prominence of the model is inpart due to the development of the NEO personality inventory(NEO-PI-R) by Costa and McCrae (1989) and to lexical studiesconducted in German (Ostendorf, 1990) and Dutch (De Raad,
Hendriks, & Hofstee, 1992) that gave initial cross-cultural supportto the Big Five model. Extraversion, Agreeableness, Conscientious-ness, Emotional Stability (or Neuroticism), and Intellect (or Open-ness) are now widely accepted as five relatively independent factorsthat account for phenotypic personality variation between people. Thecommon language for personality description provided by the BigFive has been highly generative for personality psychologists. Reli-able measurement tools have been established to measure the fivefactors in self- and peer reports, and studies demonstrate the robust-ness of the model for many Western populations.
An abundance of ongoing research on personality structure,however, has also brought some weaknesses of the model to light.Whether a Big Five structure emerges in the factor analyses withinindigenous lexical studies appears to depend on two principalconstituents of method. One is variable-selection restrictions, es-tablished by Allport and Odbert (1936): Highly evaluative terms,temporary states (including many emotion descriptors), socialroles, physical descriptors, and social attitudes or belief-dispositions were excluded from lists of person-descriptive traitsby these authors. Many lexical studies have followed thesevariable-restriction practices quite closely, while others have not.One reason for the inconsistency is that such restrictions do notentirely conform to contemporary conceptions of how personalityis defined (Saucier, 1997; Funder, 2007). Studies including a widerselection of variables have not produced good replications of theBig Five (e.g., Benet-Martinez & Waller, 1997; Church, Reyes,
Amber Gayle Thalmayer, Gerard Saucier, and Annemarie Eigenhuis,Department of Psychology, University of Oregon.
Annemarie Eigenhuis is now at the Department of Psychology, Univer-sity of Amsterdam, Amsterdam, the Netherlands.
This study would not have been possible without the help of hardwork-ing undergraduate research assistants, in particular Phil Getty and JenniferAnne Beltz. Jason Isbell, Shanee Mali, Thomas Bradley, Lily Pon, KatrinaFriedrich, and Caitlin Sweeney also provided many hours of assistance.Carl Yeh, Director of Student Conduct and Community Standards, pro-vided crucial assistance by facilitating our retrieval of student conductrecords used in this study.
Correspondence concerning this article should be addressed to AmberGayle Thalmayer, Department of Psychology, 1227 University of Oregon,Eugene, OR 97403. E-mail: [email protected]
Psychological Assessment © 2011 American Psychological Association2011, Vol. ●●, No. ●, 000–000 1040-3590/11/$12.00 DOI: 10.1037/a0024165
1
Katigbak, & Grimm, 1997; Saucier, 1997, 2003, 2009; Saucier,Ole-Kotikash, & Payne, 2006).
Another aspect of method contributing to likelihood of a BigFive structure is linguistic/cultural setting. The Big Five rose toprominence after the structure was found in three closely relatedlanguages (English, German, and Dutch). McCrae and Costa(1997) translated the NEO-PI-R into half a dozen languages, foundthat items coalesced into similar factors in each language, andjudged the model to be cross-culturally universal. But indigenouslexical studies in Italian (De Raad, DiBlas, & Perugini, 1998),Hungarian (Szirmak & De Raad, 1994), Greek (Saucier, Georgia-des, Tsaousis, & Goldberg, 2005), and Chinese (Zhou, Saucier,Gao, & Liu, 2009) failed to find the Big Five in the five-factorsolution where one would expect it.
Could the Big Five benefit from a 21st century upgrade tocorrect for these weaknesses? Could findings from lexical studieswith broader selection criteria, and those collected in more diverselanguages, be incorporated into the current model, without forcingresearchers to start from scratch? A Big Six model, which is basedon convergences among lexical study results when more factorsand a wider selection of variables is allowed, would seem to fit thebill. In practice, this would primarily mean allowing a sixth factorto join the Big Five, with only minor adjustments to the content ofother dimensions. Thus it would be straightforward to integrateprevious findings based on Big Five questionnaires with newfindings using Big Six inventories.
In order to justify an upgrade from the Big Five to the Big Sixmodel, however, it is necessary to establish that such an upgradeleads to measurable improvement in validity. To yield evidence onthis count, we arranged a comparative validity competition, or“race,” including the most commonly used brief, short, andmedium-length Big Five and Big Six inventories.
Aside from the “how many factors” question, the present raceaddresses the comparative validity of diverse Big Five inventories.With an abundance of Big Five inventories now available, therecan be uncertainty among researchers about which to choose.Choice of inventory may be consequential for results, since inven-tories are not perfectly matched in the content-conceptualization ofall factors. As Goldberg (1999) pointed out, the dearth of compar-ative validity tests, directly pitting popular instruments against oneanother, makes it hard for those who use such measures to makeinformed choices between them. This dearth also slows scientificprogress in improving measures. Instead, published personalitymeasures tend to remain static over long periods of time, and insome cases authors have a financial incentive to avoid directcomparison with other measures.
Finally, in addition to issues of model and inventory, thiscomparative validity study was designed to address the ongoingdebate on optimal test length. We (as well as Rammstedt & John,2007) observe that the predominant direction in the developmentof Big Five inventories over the past two decades has been towardincreasingly briefer measures. Typically, use of abbreviated mea-sures has been seen as a compromise, in which one maximizesconvenience but gives up reliability (at least internal-consistencyreliability) and, presumably, predictive validity. But it has alsobeen argued that short measures might have advantages in terms ofvalidity, for example by reducing respondent boredom and fatigue(Burisch, 1984). The design of the current study allowed us tocompare brief (as few as 10 items), short (26–60 items), and
medium-length (around 100 items) versions of popular inventoriesin terms of predicting important life outcomes.
Measures Associated With a Big Five Model
The NEO-Five Factor Inventory (NEO-FFI)
The NEO-FFI is a shorter (60-item) version of the 240-itemRevised NEO Personality Inventory (NEO-PI-R), both developedby Costa and McCrae (1992). The first version of the measure,published in 1985, included scales measuring facets of Neuroti-cism, Extraversion, and Openness, but scales to measure facets ofAgreeableness and Conscientiousness were added due to increas-ing scientific consensus on five trait factors. The shorter version ofthe measure is designed to measure five dimensions without thefacet scores assessed in the long version (although Saucier, 1998,did isolate replicable subcomponents in the NEO-FFI). It includesthe items most closely associated with the five factors in the longerversion, which means that the facets are not equally represented inthe short version. Agreeableness in the short version, for example,does not include items related to modesty and tender-mindedness,two facets in the longer version. Costa and McCrae (1989) statedthat the NEO-FFI scales account for about 75% as much varianceas the full-scale measures on convergent criteria (adjective self-reports from 3 years previous, and spouse and peer ratings). TheNEO-FFI has been translated into many languages, and the trans-lated items typically group into the Big Five dimensions (McCrae& Allik, 2002). The NEO-FFI is a popular measure with a widebase establishing the validity of its scores, but its status as aproprietary, commercial measure (with substantial per-use costs)inhibits some research uses.
The Big Five Inventory (BFI)
The 44-item BFI (John, Donahue, Kentle, 1991) was designed tobe a short, efficient and noncommercial research measure of theBig Five. It includes short phrases, based on adjectives demon-strated to be prototypical for each of the five dimensions by expertratings and factor analytic studies (John & Srivastava, 1999). Thismeasure has been used frequently in research, and has been trans-lated into at least eight languages (http://www.ocf.berkeley.edu/�johnlab/bfi.htm). In response to increasing demands for shortermeasures, a 10-item version of the BFI was developed in Germanand English (Rammstedt & John, 2007) for research settings withsevere time constraints. Because the 10 items are a subset of the44-item BFI, the BFI-10 can be scored wherever the longer BFIhas been administered.
An alternative six-factor version of the BFI was created for thepurposes of this study. The second author created an Honesty/Propriety (H/P) scale with 10 International Personality Item Pool(IPIP; http://ipip.ori.org) items, based entirely on data from acommunity sample in which all IPIP items (as well as the BFI)were administered. Content for this dimension (degree of sociallydisapproved risk-taking, deceit, and instrumental use of others)matches content for a sixth factor as discussed below. A change inthe content of the Agreeableness (A) dimension was necessary toreduce correlation between A and H/P. Thus the original set of BFIA items were replaced with IPIP items with content focused onpatience, trust, forgiveness, and lack of anger, grudge-holding, and
2 THALMAYER, SAUCIER, AND EIGENHUIS

vindictiveness, content that tends to be more orthogonal to H/Pcontent than is much of the original BFI A scale. Table 1 presentsitems for the original BFI A scale, the corresponding “A6” scaleand the H/P scale added to the BFI in this study.
The International Personality Item Pool Big-FiveMarker Scales (IPIP 50)
This inventory was developed using as benchmarks the Big Fiveas captured by 100 factor-marker adjectives presented by Goldberg(1992), but using short phrases that are intended to provide greatercontext than adjectives alone can convey (Goldberg, 1999). Theinventory was developed as part of an international collaborativeeffort to develop broad-bandwidth, noncommercial measurementinstruments which can be freely compared to other instruments,and refined over time (Goldberg, 1999). This inventory differsfrom the NEO and BFI in that the fifth factor is defined asIntellect/Imagination rather than Openness to Experience, and thisscale includes several items referencing perceived abilities of acognitive nature. IPIP Agreeableness also differs notably fromNEO and BFI conceptualizations in its emphasis on empathy andinterest in others, and lack of items referring to quarrelsomeness.
A briefer 20-item version of the IPIP Big Five was developed byDonnellan, Oswald, Baird, and Lucas (2006). The authors foundconvergent, discriminant, and criterion-related validity for scoreson this measure comparable to that found with the longer versionof the measure. Test–retest correlations were also comparablebetween brief and longer versions.
Big Six Measures
The HEXACO Personality Inventory (HEXACO-PI)
Ashton and colleagues (2004) integrated the factor structures ofeight previous independent lexical studies. They noted that authorsof lexical studies have tended to look for the Big Five in theirresults, and have reported results in terms of similarities to it.There are, however, consistencies in the divergences from the BigFive these diverse studies describe. In particular, a dimension withcontent related to ethical behavior (honesty, humility, and integrityvs. greed) often appears. Some of this content is occasionallyincluded in dimensions of Conscientiousness or Agreeableness butmore often is left out of the Big Five. (DeRaad et al., 2010,
claimed that six factors [indeed, like five factors] are not replicableacross languages in lexical studies. However, in a rebuttal, Ashton& Lee, 2010, showed that DeRaad et al. had handled some of thedata sets in a way that suppressed the estimate for the averagereplicability of the six-factor models.)
Ashton et al.’s (2004) six-factor model also diverges fromcommon Big Five conceptualizations in that anger and ill-temperare prominently referenced at the low end of Agreeableness (A)rather than being a peripheral part of Neuroticism; this conceptionof A is more orthogonal to the Honesty dimension than are someother conceptions of A. And unlike Big Five Neuroticism, thedimension of Emotionality includes a negative pole with contentsuch as fearlessness and self-assurance, rather than being con-ceived of solely as an absence of negative emotions. Ashton andcolleagues noted that the dimension of Intellect/Openness/Unconventionality was the least consistent dimension across thelexical studies reviewed, and its emergence depended strongly onthe terms included in the study. However, this dimension appearedmore consistently when six factors (rather than five) were ex-tracted, giving the six-factor model another advantage in terms ofcross-cultural replicability.
Lee and Ashton (2004; Ashton & Lee, 2007) developed theHEXACO-PI to operationalize this six-factor model. The ques-tionnaire includes 24 facet scales that define the six factors:Honesty-Humility (H), Emotionality (E), Extraversion (X), Agree-ableness (A), Conscientiousness (C), and Openness to Experience(O). Abbreviated versions have followed: first a half-length (96-item) version, and then a shorter, 60-item version of the measuredeveloped by selecting 10 items for each dimension, including atleast two from each of the facets. Items were selected based onhigh primary loadings and low secondary loadings and to maintainan even selection of forward- and reverse-scored items (Ashton &Lee, 2009).
The Questionnaire Big Six Scales (QB6)
Saucier (2009) compared five-, six- and seven-factor modelsfrom eight lexical studies that had used very broad variable selec-tion criteria, and concluded that a Big Six model improves on theBig Five in terms of cross-cultural replicability and that, moreover,adjective Big Six scales predict important criteria (many related topsychopathology) better than do Big Five scales. The Big Sixdimensions are termed Conscientiousness, Honesty/Propriety,
Table 1Agreeableness and Honesty/Propriety Items for the BFI and Alternative Six-Factor BFI
BFI Agreeableness BFI-6 Agreeableness BFI-6 Honesty/Propriety
Tend to find fault with others (R) Am usually a patient person Take risks that could cause trouble for me (R)Start quarrels with others (R) Trust what people say Use others for my own ends (R)Have a forgiving nature Get angry easily (R) Don’t enjoy taking risksAm considerate and kind to almost everyone Get back at people who insult me (R) Avoid activities that are physically dangerousCan be cold and aloof (R) Am inclined to forgive others Use flattery to get ahead (R)Am generally trusting Hold grudges (R) Have bad manners (R)Am helpful and unselfish with othersAm sometimes rude to others (R)Like to cooperate with others
Become frustrated and angry with people whenthey don’t live up to my expectations (R)
Distrust people (R)
Would never take things that aren’t mineAm not good at deceiving other peopleMisrepresent the facts (R)Stick to the rules
Note. BFI � Big Five Inventory; BFI-6 � six-factor BFI; (R) � reverse-scored items.
3COMPARATIVE VALIDITY BIG FIVE AND BIG SIX
Agreeableness (Kindness & Even Temper), Resiliency versus In-ternalizing Negative Emotionality, Extraversion (Gregariousnessand Positive Emotionality), and Originality/Talent.
Big Six dimensions are close enough to HEXACO dimensionsthat it is fair to consider them variants of a single model (Saucier,2009). As in the HEXACO, Big Six Agreeableness contains somecontent found in Big Five Neuroticism (aggressiveness and irrita-bility). With hostility and irritability relocated to A, and a betterdefined favorable pole, Neuroticism is redefined as Resiliencyversus Internalizing Negative Emotionality. This arrangement al-lows Big Six scales to better map onto temperament dimensions ofNeuroticism versus Resiliency, Extraversion/Positive Emotional-ity, and Disinhibition (a combination of low Agreeableness andConscientiousness; alternatively conceived of as “Constraint” inTellegen and Waller’s, 2008, Multidimensional Personality Ques-tionnaire). These dimensions of temperament are theorized toprecede both mental disorders and personality traits expressed inadulthood (Clark, 2005). Drawing from broader lexical studiesmeans that the questionnaire measures of the Big Six (Question-naire Big Six or QB6), particularly in longer versions, include afuller representation of internalizing affect (depression, anxiety,tendencies toward panic and phobias) than other measures dis-cussed in this article; this fuller representation should allow in-struments based on this model to better correlate with and predictmental disorders.
The “negative valence” content typically found in inclusive-variable-selection lexical studies is included in the Honesty/Propriety factor (which was shown to correlate with external-izing disorder tendencies; Saucier, 2009). Originality/Talentencompasses perceived talents and abilities, originality, andintellectual and aesthetic interests, as well as some “positivevalence” terms typically found in broader variable selectionstudies, although these are generally excluded in narrowerselection lexical studies.
In developing QB6 scales, an initial pool of 120 promisingIPIP items was selected to measure the six factors described inSaucier (2009), from data collected over a decade-long periodfrom the Eugene-Springfield Community Sample. An optimalsubset of 36 items (the 36QB6) was selected based on a secondsingle-wave administration of the 120 items to the same sample.A slightly longer subset of 48 items (the 48QB6), including allof the first 36, was then selected. In order to arrive at theshortest version of the inventory, while simultaneously exam-ining the effects of item validity as a criterion in scale con-struction, a 24QB6 was also created. The 24QB6 consists of thebetter half of the 48QB6 items selected based not only oncriteria used in selection of items for other QB6 inventories(fidelity to Big Six factors from Saucier, 2009, internal consis-tency, unidimensionality, and having as much as possible equalnumbers of forward- and reverse-keyed items) but also meancorrelation with several dozen criterion variables in the Eugene-Springfield sample. This “better half” 24QB6 can be comparedwith the “other half” 24-item subset of the 48QB6 to examineeffects on the scores’ predictive validity in new samples as anitem-selection criterion in the derivation sample. Finally, basedon the same second administration, progressively longer subsetsof 60 and 96 items were selected for the purposes of this study,to enable comparison with longer Big Five measures.
A Comparative Validity Competition
Grucza and Goldberg (2007) compared nine personality inven-tories administered to the Eugene Springfield Community Samplebetween 1993 and 2000 in terms of predictive ability for frequencyof behavioral acts (drug and alcohol use, undependability, friend-liness, erudition, communication and creativity), correspondencewith peer reports, and relation to measures of mental disorders.The measures compared included Big Five measures (NEO-PI-R,100 unipolar adjective markers of the Big-Five factor structuredeveloped by Goldberg, 1992, and the 485 items of the IPIP-AB5CInventory), one Big Six measure (the 180-item version of theHEXACO), and various non-Big Five inventories (Six FactorPersonality Questionnaire [6FPQ], California Psychological In-ventory [CPI], Cattell’s Sixteen Personality Factor Questionnaire,Hogan Personality Inventory, Temperament and Character Inven-tory, Multidimensional Personality Questionnaire, Jackson Person-ality Inventory). Overall the inventories were similar in theircorrelation with the domains of interest (with the possible excep-tion of the 6FPQ and the CPI, which trailed the field in this race).
Johnson (2000) compared the CPI, the Hogan Personality In-ventory, and the NEO-PI-R in terms of their ability to predictacquaintance ratings from four peers. Peers rated targets on fourvariants of the Five-Factor Model. The NEO-PI-R surpassed itscompetitors, but (as with a similar comparison on observer ratingsin the Grucza and Goldberg, 2007, study) this does not seem to bea fair comparison: It is only logical that if the criterion is ratings onthe Big Five, a Big Five measure would outperform measures fromdifferent models in predicting those ratings.
While these studies have provided some initial comparisonbetween measures, they do not include the comparisons wethink would best aid contemporary psychologists in choosing aninstrument for research studies. Grucza and Goldberg (2007)only included very long measures, ranging from 100 to 485items. Johnson (2000) also used long measures, and did notinclude life-outcome or behavioral criteria, but only peer-ratings on a Big Five instrument.
The current study seeks to compare brief, short, and medium-length Big Five and Big Six self-report measures in terms of theirability to predict important student outcomes later in the academicyear. These criteria, grades and student conduct violations, fall intothe category of “L data,” or life outcomes (Cattell, 1957), acriterion domain that should be of paramount interest to person-ality psychologists. Student-conduct-code violations were chosenas a novel way to look at broad rule-breaking versus rule-followingbehavior, somewhat analogous to an arrest or criminal record, butwith a larger base-rate. While previous studies have demonstratedthat Big Five and other personality trait measures correlate withretrospective delinquent acts or arrest records (Alalehto, 2003;Clower & Bothwell, 2001; van Dam, Janssens & De Bruyn, 2005),none, to our knowledge, use traits to predict infractions arisingafter the assessment. The demonstration of a capability to forecastimportant life events at a later date might be the gold standard forthe validity of scores on an inventory.
The current study also looked at the trait measures’ ability topredict future grade point average (GPA), as well to correlate withcurrent GPA. GPA is an excellent summary of academic achieve-ment, given the sustained levels of performance over time andacross domains and raters required to obtain high values (Hirsh &
4 THALMAYER, SAUCIER, AND EIGENHUIS
Peterson, 2008). Noftle and Robins (2007) summarized 20 previ-ous studies, most of which found significant correlations betweenBig Five (or readily comparable) personality trait inventories andcollege GPA (an exception was the IPIP-50, which did not corre-late with GPA). In a series of studies, the authors compared collegestudents’ NEO-FFI, HEXACO-PI, and BFI scores with SATscores, high school GPA, and, in one case, college GPA. Onestudy, of a 4-year longitudinal design, found predictive ability forall three inventories for college GPA (after accounting for SATscores and gender).
Secondarily, the current study used behavioral observations (“Bdata”; Funder, 2007), such as punctuality, use of Facebook, andtext messaging as outcomes. These variables are intended to beillustrative (but in no way comprehensive) of broad behaviorpatterns that can be assessed with personality inventories. Ofparamount importance in this study was to use outcome criteriathat did not rely on self-report data (“S data”; Funder, 2007), inorder to avoid shared error (from sources such as acquiescencebias) that can not be ruled out as an alternative explanation forshared variance in data collected using the same methodology.
Effects of Model
This study was designed as a comparative-validity competition,or “race,” to compare Big Five and Big Six inventories in terms ofcorrelation with and prediction of important student life outcomes.The Big Six model, based on convergences among lexical studyresults when more factors and a wider selection of variables isallowed, is similar in many ways to the Big Five model, but itdiffers in ways that extend beyond the simple addition of a sixthdimension, as described above. A comparative-validity race allowsfor a comparison of sets of dimensions, which differ in theirconceptualizations, in terms of their power to predict outcomes inthe real world.
Furthermore, Big Five inventories also differ from each other intheir conceptualization of the different dimensions, (e.g., NEO-FFIOpenness to Experience vs. IPIP Intellect), and these differencesmay lead to real differences in the performance of inventories. Thisstudy will allow us to gather data relevant to the comparative-validity impact of the different conceptualizations.
Effects of Test Length
This study also sought to explore the effect of test length on thepredictive validity of scores. In general, more items would beexpected to increase score reliability (internal consistency) andreduce measurement error and therefore, by conventional expec-tations, should predict outcomes more effectively. A possiblelimiting factor would be an “attenuation paradox” (Loevinger,1954), whereby increasing reliability may sometimes decreasevalidity. Loevinger’s paradox points to the need for testing theassumption that scores on longer, more reliable measures havemore predictive validity. A general trend toward shorter traitmeasures is evident in the literature (Rammstedt & John, 2007),and by comparing different versions of the same instrument, wecan assess costs and benefits in the trade-off between efficiencyand comprehensiveness.
Method
Participants
Undergraduate students in introductory psychology and linguis-tics courses were recruited using the psychology department’shuman subjects pool (N � 227, 65% female). The majority (62%)were freshman. Age ranged from 17 to 35 years, with a mean of19.24 (SD � 2.09). The sample was predominantly White (72%;11% were Asian or Asian American, 4% Hispanic, 2% Black, 1%American Indian, 4% “more than one,” and 5% “other”). Some54% reported that their mother had finished at least a 4-yearcollege degree, and 60% reported that their father had at least a4-year college degree.
Measures
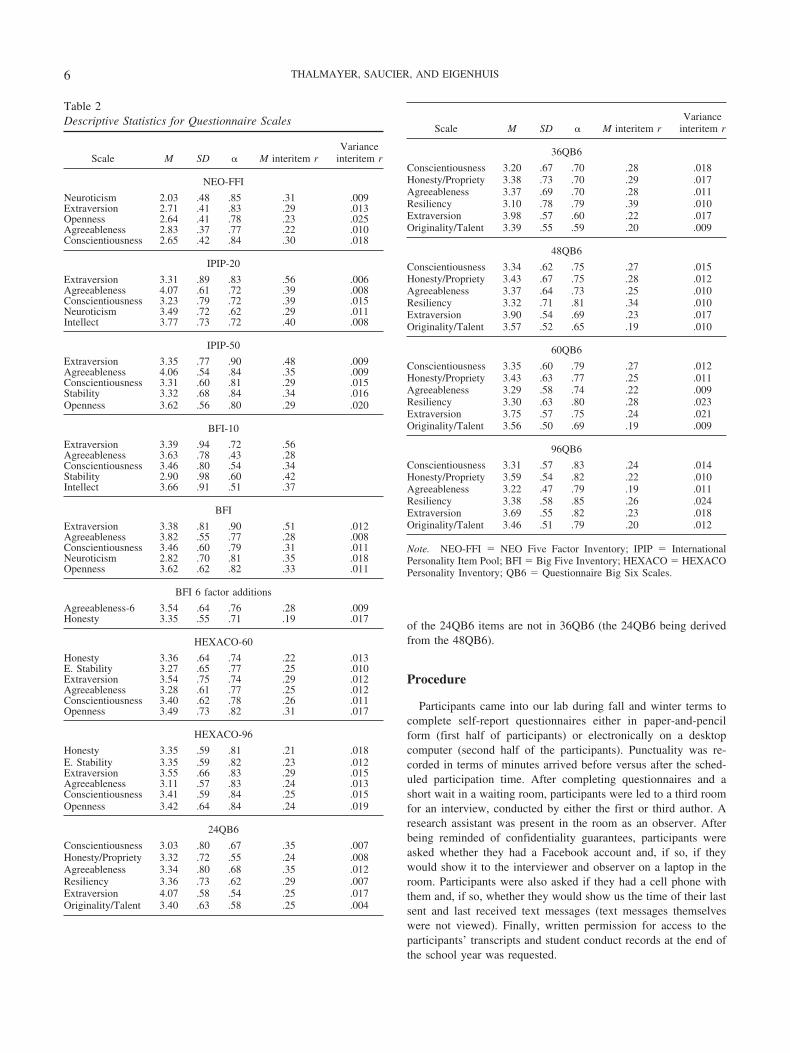
NEO-FFI. The 60-item NEO-FFI was administered in itspublished test booklet. Costa and McCrae (1992) reported averagescale-score reliabilities of .78 on this inventory. Mean score,standard deviation, Cronbach’s alpha, and the mean and varianceof interitem correlations for each scale of each measure in thecurrent sample are provided in Table 2. (The variance of interitemr is included, since it tends to be an indicator of unidimensional-ity—if this variance is zero, a factor analysis will only find onenonsinglet factor. Ideally, correlations between items in measuringa single construct should range from .15 to .50 [Clark & Watson,1995], but a large range in correlations within a scale will indicatemultidimensionality.)
BFI. We used the standard 44-item BFI. For the extensioninto a six-factor model, the item set was augmented with 18 IPIPitems, eight of which replaced the nine original Agreeablenessitems and 10 of which formed an Honesty/Propriety factor—thusthe BFI-6 has 53 items. The 10-item version was derived as asubset of the original 44 items, following Rammstedt and John(2007). In general, we did not replace or impute missing data inthis study, because there was very little of it, but one of the BFI-44(not BFI-10) items, “Am helpful and unselfish with others,” had anunusually high number (20) of missing data points; we replacedmissing responses, on this item only, with the middle option on theresponse scale.
IPIP. Goldberg (http://ipip.ori.org/newBigFive5broadTable.htm) reported alpha values of .79–.87 for scores on each of the fivescales in the 50-item version. Donnellan et al. (2006) reported alphavalues of .65–.77 for scores on the five scales of the 20-item version(N � 2,663 college freshmen).
HEXACO-PI. Lee and Ashton (2004) reported internal con-sistency values ranging from .81–.84 for the six scales in the96-item version (N � 1,126 college students; the authors refer tothis as a 100-item version, because it also includes four items“interstitial” between A and H which do not belong to one of theBig Six scales and were not included in the current study; descrip-tive statistics are available at http://www.hexaco.org/). For the60-item version, internal consistency ranged from .73 to .80 acrosstwo samples (N � 734 community members, N � 936 collegestudents; Ashton & Lee, 2009).
QB6. Twenty-four-, 36-, 48-, 60-, and 96-item versions of theQB6 were used. Each progressively longer version contains all ofthe items in the shorter versions, with the exception that three
5COMPARATIVE VALIDITY BIG FIVE AND BIG SIX
of the 24QB6 items are not in 36QB6 (the 24QB6 being derivedfrom the 48QB6).
Procedure
Participants came into our lab during fall and winter terms tocomplete self-report questionnaires either in paper-and-pencilform (first half of participants) or electronically on a desktopcomputer (second half of the participants). Punctuality was re-corded in terms of minutes arrived before versus after the sched-uled participation time. After completing questionnaires and ashort wait in a waiting room, participants were led to a third roomfor an interview, conducted by either the first or third author. Aresearch assistant was present in the room as an observer. Afterbeing reminded of confidentiality guarantees, participants wereasked whether they had a Facebook account and, if so, if theywould show it to the interviewer and observer on a laptop in theroom. Participants were also asked if they had a cell phone withthem and, if so, whether they would show us the time of their lastsent and last received text messages (text messages themselveswere not viewed). Finally, written permission for access to theparticipants’ transcripts and student conduct records at the end ofthe school year was requested.
Table 2Descriptive Statistics for Questionnaire Scales
Scale M SD � M interitem rVariance
interitem r
NEO-FFI
Neuroticism 2.03 .48 .85 .31 .009Extraversion 2.71 .41 .83 .29 .013Openness 2.64 .41 .78 .23 .025Agreeableness 2.83 .37 .77 .22 .010Conscientiousness 2.65 .42 .84 .30 .018
IPIP-20
Extraversion 3.31 .89 .83 .56 .006Agreeableness 4.07 .61 .72 .39 .008Conscientiousness 3.23 .79 .72 .39 .015Neuroticism 3.49 .72 .62 .29 .011Intellect 3.77 .73 .72 .40 .008
IPIP-50
Extraversion 3.35 .77 .90 .48 .009Agreeableness 4.06 .54 .84 .35 .009Conscientiousness 3.31 .60 .81 .29 .015Stability 3.32 .68 .84 .34 .016Openness 3.62 .56 .80 .29 .020
BFI-10
Extraversion 3.39 .94 .72 .56Agreeableness 3.63 .78 .43 .28Conscientiousness 3.46 .80 .54 .34Stability 2.90 .98 .60 .42Intellect 3.66 .91 .51 .37
BFI
Extraversion 3.38 .81 .90 .51 .012Agreeableness 3.82 .55 .77 .28 .008Conscientiousness 3.46 .60 .79 .31 .011Neuroticism 2.82 .70 .81 .35 .018Openness 3.62 .62 .82 .33 .011
BFI 6 factor additions
Agreeableness-6 3.54 .64 .76 .28 .009Honesty 3.35 .55 .71 .19 .017
HEXACO-60
Honesty 3.36 .64 .74 .22 .013E. Stability 3.27 .65 .77 .25 .010Extraversion 3.54 .75 .74 .29 .012Agreeableness 3.28 .61 .77 .25 .012Conscientiousness 3.40 .62 .78 .26 .011Openness 3.49 .73 .82 .31 .017
HEXACO-96
Honesty 3.35 .59 .81 .21 .018E. Stability 3.35 .59 .82 .23 .012Extraversion 3.55 .66 .83 .29 .015Agreeableness 3.11 .57 .83 .24 .013Conscientiousness 3.41 .59 .84 .25 .015Openness 3.42 .64 .84 .24 .019
24QB6
Conscientiousness 3.03 .80 .67 .35 .007Honesty/Propriety 3.32 .72 .55 .24 .008Agreeableness 3.34 .80 .68 .35 .012Resiliency 3.36 .73 .62 .29 .007Extraversion 4.07 .58 .54 .25 .017Originality/Talent 3.40 .63 .58 .25 .004
Scale M SD � M interitem rVariance
interitem r
36QB6
Conscientiousness 3.20 .67 .70 .28 .018Honesty/Propriety 3.38 .73 .70 .29 .017Agreeableness 3.37 .69 .70 .28 .011Resiliency 3.10 .78 .79 .39 .010Extraversion 3.98 .57 .60 .22 .017Originality/Talent 3.39 .55 .59 .20 .009
48QB6
Conscientiousness 3.34 .62 .75 .27 .015Honesty/Propriety 3.43 .67 .75 .28 .012Agreeableness 3.37 .64 .73 .25 .010Resiliency 3.32 .71 .81 .34 .010Extraversion 3.90 .54 .69 .23 .017Originality/Talent 3.57 .52 .65 .19 .010
60QB6
Conscientiousness 3.35 .60 .79 .27 .012Honesty/Propriety 3.43 .63 .77 .25 .011Agreeableness 3.29 .58 .74 .22 .009Resiliency 3.30 .63 .80 .28 .023Extraversion 3.75 .57 .75 .24 .021Originality/Talent 3.56 .50 .69 .19 .009
96QB6
Conscientiousness 3.31 .57 .83 .24 .014Honesty/Propriety 3.59 .54 .82 .22 .010Agreeableness 3.22 .47 .79 .19 .011Resiliency 3.38 .58 .85 .26 .024Extraversion 3.69 .55 .82 .23 .018Originality/Talent 3.46 .51 .79 .20 .012
Note. NEO-FFI � NEO Five Factor Inventory; IPIP � InternationalPersonality Item Pool; BFI � Big Five Inventory; HEXACO � HEXACOPersonality Inventory; QB6 � Questionnaire Big Six Scales.
6 THALMAYER, SAUCIER, AND EIGENHUIS

Criterion Variables
Grades. Of the 227 participants, 217 (96%) filled out atranscript request form, giving us permission to access their aca-demic records at the end of summer term. In order to assess thepredictive validity of inventory scale-scores as forecasting tools,we looked at GPA for terms after the term of participation (Falland Winter quarter of 2008–2009 academic year), in addition toGPA overall. Transcripts were obtained at the end of summer term,and post-study GPA was calculated for the one to three terms ofcoursework on record for each student after and not including theterm of participation in the study. Descriptive statistics for crite-rion variables are included in Table 3.
Student conduct records. Two hundred eighteen partici-pants (96%) gave us permission to access their student conductrecords (these were the same participants who agreed to let usaccess their transcript, excepting one student who did not agree tothe transcript request but did agree to the student conduct recordrequest). Records were obtained from the Office of the Dean ofStudents in August, 5 to 10 months after participants’ question-naires were completed. Because violations were more likely toexist for those students who were currently living in studenthousing (55% of participants) or had lived in student housing atsome previous point (81%), regressions accounted for monthsspent in university housing. Some of the less frequent types ofviolations, however (academic dishonesty, behavior on campusand at sporting events), could occur for any enrolled student.
The Office of the Dean of Students provided us with informa-tion about complaints involving our participants and, for eachcomplaint, whether or not the student was found responsible forthe charges. In many cases, a single incident led to more than onecomplaint or “charge,” for example, a student might have beencharged with both underage alcohol possession and disorderly
conduct after a single run-in with campus housing or securityofficers. For our analyses, we looked at both the number of eventsand the number of charges for which participants were foundresponsible (analogous to a “conviction”). Eighty-six students(39%) had experienced at least one (and as many as eight) inci-dent(s) that led to one or more complaints being lodged againstthem. For 55 of these students (25%), complaints resulted in atleast one (and up to 18) charge(s) of responsibility. Because thedistribution of both variables was very positively skewed (skew �2.81 and 4.30, SE � .16), log10 (y � 1) transformations wereperformed, which reduced the skew to 1.18 and 1.74, respectively.
We assessed forecasting power by looking at violation com-plaints reported to the Office of the Dean of Students after partic-ipation in our study. Between one and four incidents were reportedafter participation in the study for 37 students in our sample. Thisvariable also had an extreme positive skew (skew � 3.10), reducedby a log10 (y � 1) transformation (transformed skew � 2.28).Seven individuals were found responsible for the complaints re-ceived after participation (skew � 7.05, SE � .16; after log10 [y �1] transformation skew � 5.91).1
Behavioral observations. Personality attributes reflect broadpatterning in behavior. Measures of these attributes should predictspecific behavioral instances, to a degree. We tracked severalspecific behavioral indicators that can be easily collected in anylaboratory setting.
Punctuality was calculated by subtracting the actual arrival timefrom the time students had scheduled themselves to participate.Positive values indicate an early arrival and negative values a latearrival. The average arrival was about 5 min prior to appointmenttime.
Of the 226 participants interviewed (due to a late appointment,one participant was not interviewed) 214 (95%) acknowledgedhaving a Facebook account. Possession of a Facebook account wasnegatively correlated with age (r � –.20, p � .01) but was notpredicted by scores on the personality measures. Of the 214participants with a Facebook account, 205 (96%) agreed to log intotheir account and show us their profile page. Contacts (noted bythe interviewer) ranged from 18 to 1,086, with a mean of 346.1(SD � 214.32). The researchers noted the number of people in theprofile picture, on an ordinal scale (0 � not a picture of theparticipant; 1 � only the participant; 2 � participant with oneother person; 3 � participant with 2–3 others; 5 � a group largerthan four). The median score was 2 (SD � 1.13); the mostcommon scores were 1 (80 participants) and 2 (75 participants).
Two hundred twenty-two participants (98%) had a cell phonewith which they had ever sent or received a text message. Oneparticipant had lost his phone, and three participants reportedeither no phone or no use of texting. All participants with a phoneagreed to get it out to determine the exact time of their most recent
1 We also looked at specific charges/complaints (the base rate of “con-victions” was too small). The most common charge was underage alcoholpossession: 60 students (27%) had one or more alcohol related incidents ontheir records. Other charges included disorderly conduct (29 students hadone or more charge), noise (25), and marijuana use (20). Specific predic-tion of safety violations (e.g., candles in a dorm room; 12), propertydamage (6), academic dishonesty (2), other drug use (1), and interpersonalissues (1) were not analyzed due to low base rates.
Table 3Descriptive Statistics for Criterion Variables
Criterion N M SD
Academic performance
GPA overall 218 2.95 0.59GPA post study 212 2.93 0.71
Student conduct recordsIncidents total 219 0.75 1.32
log10 (y � 1) transformed 0.17 0.23Responsible total 219 0.90 2.24
log10 (y � 1) transformed 0.15 0.28Incidents forecast 219 0.25 0.66
log10 (y � 1) transformed 0.06 0.15Responsible forecast 219 0.08 0.50
log10 (y � 1) transformed 0.02 0.10
Observed behavioral indices
Punctuality 227 5.13 7.32Facebook contacts 205 339.95 215.72People in photo (median) 205 2 1.13Minutes since text received 220 620.44 4,934.41
log10 (y � 1) transformed 1.72 0.89Minutes since text sent 219 353.9 1,453.22
log10 (y � 1) transformed 1.74 0.83
Note. GPA � grade point average.
7COMPARATIVE VALIDITY BIG FIVE AND BIG SIX
messages received and sent (in four cases, the cell phone was notin the room and participants self-reported the time of their lastmessages; in one case, the participant had received a text once buthad never sent one). The latency since a message was sent orreceived was recorded in minutes. Possession of a cell phone wasnot correlated with age, but age was correlated with latency sincea text was sent (r � .29, p � .001) and since a text was received(r � .61, p � .001). In six cases, a message was received within1 min of asking, and in one case, a message was sent while thequestion was asked. In a few cases, it had been weeks since amessage was received, such that these variables were extremelypositively skewed (skew for sent messages � 11.91; skew forreceived messages � 12.92; SE � .164). A log 10 (y � 1)transformation was performed on these variables before runningthe regressions to reduce the effect of outliers (transformed vari-ables skew � .35 and .28, respectively).
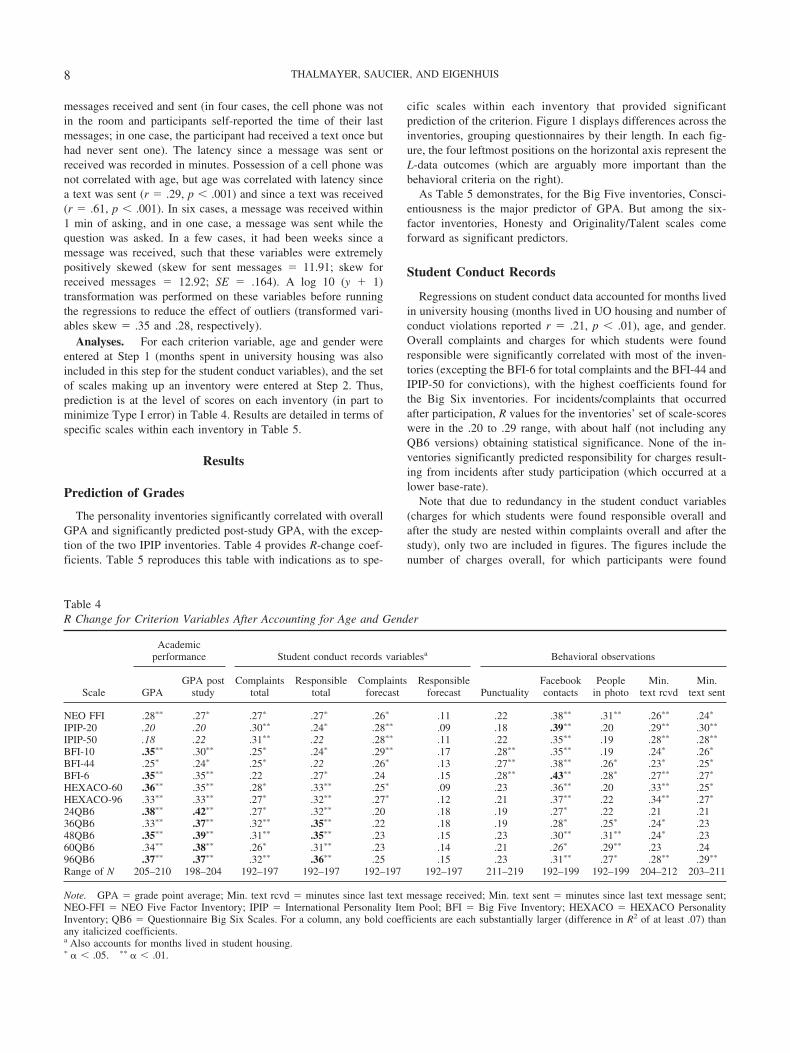
Analyses. For each criterion variable, age and gender wereentered at Step 1 (months spent in university housing was alsoincluded in this step for the student conduct variables), and the setof scales making up an inventory were entered at Step 2. Thus,prediction is at the level of scores on each inventory (in part tominimize Type I error) in Table 4. Results are detailed in terms ofspecific scales within each inventory in Table 5.
Results
Prediction of Grades
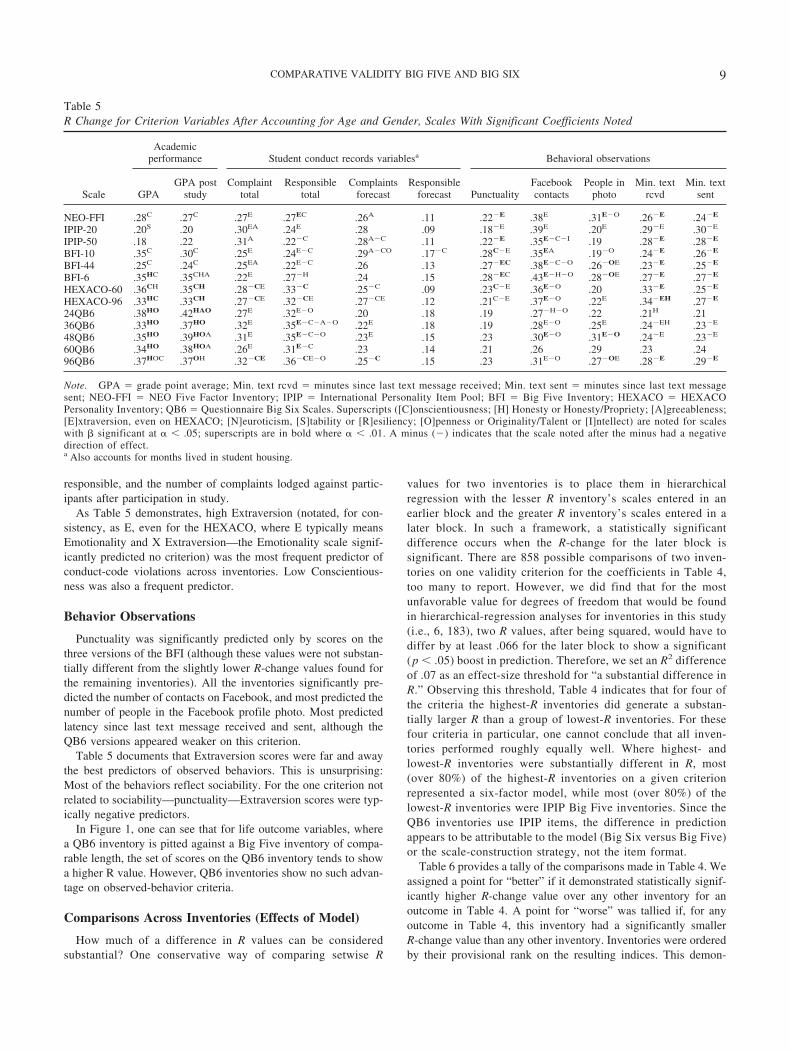
The personality inventories significantly correlated with overallGPA and significantly predicted post-study GPA, with the excep-tion of the two IPIP inventories. Table 4 provides R-change coef-ficients. Table 5 reproduces this table with indications as to spe-
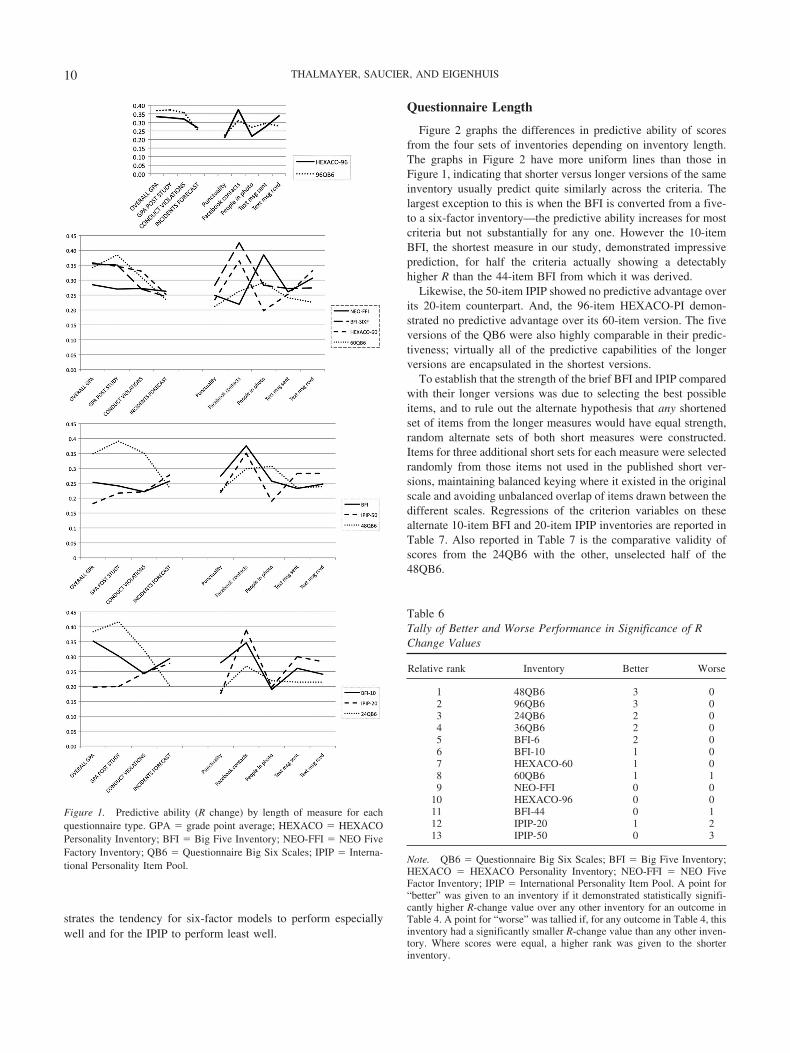
cific scales within each inventory that provided significantprediction of the criterion. Figure 1 displays differences across theinventories, grouping questionnaires by their length. In each fig-ure, the four leftmost positions on the horizontal axis represent theL-data outcomes (which are arguably more important than thebehavioral criteria on the right).
As Table 5 demonstrates, for the Big Five inventories, Consci-entiousness is the major predictor of GPA. But among the six-factor inventories, Honesty and Originality/Talent scales comeforward as significant predictors.
Student Conduct Records
Regressions on student conduct data accounted for months livedin university housing (months lived in UO housing and number ofconduct violations reported r � .21, p � .01), age, and gender.Overall complaints and charges for which students were foundresponsible were significantly correlated with most of the inven-tories (excepting the BFI-6 for total complaints and the BFI-44 andIPIP-50 for convictions), with the highest coefficients found forthe Big Six inventories. For incidents/complaints that occurredafter participation, R values for the inventories’ set of scale-scoreswere in the .20 to .29 range, with about half (not including anyQB6 versions) obtaining statistical significance. None of the in-ventories significantly predicted responsibility for charges result-ing from incidents after study participation (which occurred at alower base-rate).
Note that due to redundancy in the student conduct variables(charges for which students were found responsible overall andafter the study are nested within complaints overall and after thestudy), only two are included in figures. The figures include thenumber of charges overall, for which participants were found
Table 4R Change for Criterion Variables After Accounting for Age and Gender
Scale
Academicperformance Student conduct records variablesa Behavioral observations
GPAGPA post
studyComplaints
totalResponsible
totalComplaints
forecastResponsible
forecast PunctualityFacebookcontacts
Peoplein photo
Min.text rcvd
Min.text sent
NEO FFI .28�� .27� .27� .27� .26� .11 .22 .38�� .31�� .26�� .24�
IPIP-20 .20 .20 .30�� .24� .28�� .09 .18 .39�� .20 .29�� .30��
IPIP-50 .18 .22 .31�� .22 .28�� .11 .22 .35�� .19 .28�� .28��
BFI-10 .35�� .30�� .25� .24� .29�� .17 .28�� .35�� .19 .24� .26�
BFI-44 .25� .24� .25� .22 .26� .13 .27�� .38�� .26� .23� .25�
BFI-6 .35�� .35�� .22 .27� .24 .15 .28�� .43�� .28� .27�� .27�
HEXACO-60 .36�� .35�� .28� .33�� .25� .09 .23 .36�� .20 .33�� .25�
HEXACO-96 .33�� .33�� .27� .32�� .27� .12 .21 .37�� .22 .34�� .27�
24QB6 .38�� .42�� .27� .32�� .20 .18 .19 .27� .22 .21 .2136QB6 .33�� .37�� .32�� .35�� .22 .18 .19 .28� .25� .24� .2348QB6 .35�� .39�� .31�� .35�� .23 .15 .23 .30�� .31�� .24� .2360QB6 .34�� .38�� .26� .31�� .23 .14 .21 .26� .29�� .23 .2496QB6 .37�� .37�� .32�� .36�� .25 .15 .23 .31�� .27� .28�� .29��
Range of N 205–210 198–204 192–197 192–197 192–197 192–197 211–219 192–199 192–199 204–212 203–211
Note. GPA � grade point average; Min. text rcvd � minutes since last text message received; Min. text sent � minutes since last text message sent;NEO-FFI � NEO Five Factor Inventory; IPIP � International Personality Item Pool; BFI � Big Five Inventory; HEXACO � HEXACO PersonalityInventory; QB6 � Questionnaire Big Six Scales. For a column, any bold coefficients are each substantially larger (difference in R2 of at least .07) thanany italicized coefficients.a Also accounts for months lived in student housing.� � � .05. �� � � .01.
8 THALMAYER, SAUCIER, AND EIGENHUIS
responsible, and the number of complaints lodged against partic-ipants after participation in study.
As Table 5 demonstrates, high Extraversion (notated, for con-sistency, as E, even for the HEXACO, where E typically meansEmotionality and X Extraversion—the Emotionality scale signif-icantly predicted no criterion) was the most frequent predictor ofconduct-code violations across inventories. Low Conscientious-ness was also a frequent predictor.
Behavior Observations
Punctuality was significantly predicted only by scores on thethree versions of the BFI (although these values were not substan-tially different from the slightly lower R-change values found forthe remaining inventories). All the inventories significantly pre-dicted the number of contacts on Facebook, and most predicted thenumber of people in the Facebook profile photo. Most predictedlatency since last text message received and sent, although theQB6 versions appeared weaker on this criterion.
Table 5 documents that Extraversion scores were far and awaythe best predictors of observed behaviors. This is unsurprising:Most of the behaviors reflect sociability. For the one criterion notrelated to sociability—punctuality—Extraversion scores were typ-ically negative predictors.
In Figure 1, one can see that for life outcome variables, wherea QB6 inventory is pitted against a Big Five inventory of compa-rable length, the set of scores on the QB6 inventory tends to showa higher R value. However, QB6 inventories show no such advan-tage on observed-behavior criteria.
Comparisons Across Inventories (Effects of Model)
How much of a difference in R values can be consideredsubstantial? One conservative way of comparing setwise R
values for two inventories is to place them in hierarchicalregression with the lesser R inventory’s scales entered in anearlier block and the greater R inventory’s scales entered in alater block. In such a framework, a statistically significantdifference occurs when the R-change for the later block issignificant. There are 858 possible comparisons of two inven-tories on one validity criterion for the coefficients in Table 4,too many to report. However, we did find that for the mostunfavorable value for degrees of freedom that would be foundin hierarchical-regression analyses for inventories in this study(i.e., 6, 183), two R values, after being squared, would have todiffer by at least .066 for the later block to show a significant(p � .05) boost in prediction. Therefore, we set an R2 differenceof .07 as an effect-size threshold for “a substantial difference inR.” Observing this threshold, Table 4 indicates that for four ofthe criteria the highest-R inventories did generate a substan-tially larger R than a group of lowest-R inventories. For thesefour criteria in particular, one cannot conclude that all inven-tories performed roughly equally well. Where highest- andlowest-R inventories were substantially different in R, most(over 80%) of the highest-R inventories on a given criterionrepresented a six-factor model, while most (over 80%) of thelowest-R inventories were IPIP Big Five inventories. Since theQB6 inventories use IPIP items, the difference in predictionappears to be attributable to the model (Big Six versus Big Five)or the scale-construction strategy, not the item format.
Table 6 provides a tally of the comparisons made in Table 4. Weassigned a point for “better” if it demonstrated statistically signif-icantly higher R-change value over any other inventory for anoutcome in Table 4. A point for “worse” was tallied if, for anyoutcome in Table 4, this inventory had a significantly smallerR-change value than any other inventory. Inventories were orderedby their provisional rank on the resulting indices. This demon-
Table 5R Change for Criterion Variables After Accounting for Age and Gender, Scales With Significant Coefficients Noted
Scale
Academicperformance Student conduct records variablesa Behavioral observations
GPAGPA post
studyComplaint
totalResponsible
totalComplaints
forecastResponsible
forecast PunctualityFacebookcontacts
People inphoto
Min. textrcvd
Min. textsent
NEO-FFI .28C .27C .27E .27EC .26A .11 .22�E .38E .31E�O .26�E .24�E
IPIP-20 .20S .20 .30EA .24E .28 .09 .18�E .39E .20E .29�E .30�E
IPIP-50 .18 .22 .31A .22�C .28A�C .11 .22�E .35E�C�I .19 .28�E .28�E
BFI-10 .35C .30C .25E .24E�C .29A�CO .17�C .28C�E .35EA .19�O .24�E .26�E
BFI-44 .25C .24C .25EA .22E�C .26 .13 .27�EC .38E�C�O .26�OE .23�E .25�E
BFI-6 .35HC .35CHA .22E .27�H .24 .15 .28�EC .43E�H�O .28�OE .27�E .27�E
HEXACO-60 .36CH .35CH .28�CE .33�C .25�C .09 .23C�E .36E�O .20 .33�E .25�E
HEXACO-96 .33HC .33CH .27�CE .32�CE .27�CE .12 .21C�E .37E�O .22E .34�EH .27�E
24QB6 .38HO .42HAO .27E .32E�O .20 .18 .19 .27�H�O .22 .21H .2136QB6 .33HO .37HO .32E .35E�C�A�O .22E .18 .19 .28E�O .25E .24�EH .23�E
48QB6 .35HO .39HOA .31E .35E�C�O .23E .15 .23 .30E�O .31E�O .24�E .23�E
60QB6 .34HO .38HOA .26E .31E�C .23 .14 .21 .26 .29 .23 .2496QB6 .37HOC .37OH .32�CE .36�CE�O .25�C .15 .23 .31E�O .27�OE .28�E .29�E
Note. GPA � grade point average; Min. text rcvd � minutes since last text message received; Min. text sent � minutes since last text messagesent; NEO-FFI � NEO Five Factor Inventory; IPIP � International Personality Item Pool; BFI � Big Five Inventory; HEXACO � HEXACOPersonality Inventory; QB6 � Questionnaire Big Six Scales. Superscripts ([C]onscientiousness; [H] Honesty or Honesty/Propriety; [A]greeableness;[E]xtraversion, even on HEXACO; [N]euroticism, [S]tability or [R]esiliency; [O]penness or Originality/Talent or [I]ntellect) are noted for scaleswith � significant at � � .05; superscripts are in bold where � � .01. A minus (�) indicates that the scale noted after the minus had a negativedirection of effect.a Also accounts for months lived in student housing.
9COMPARATIVE VALIDITY BIG FIVE AND BIG SIX
strates the tendency for six-factor models to perform especiallywell and for the IPIP to perform least well.
Questionnaire Length
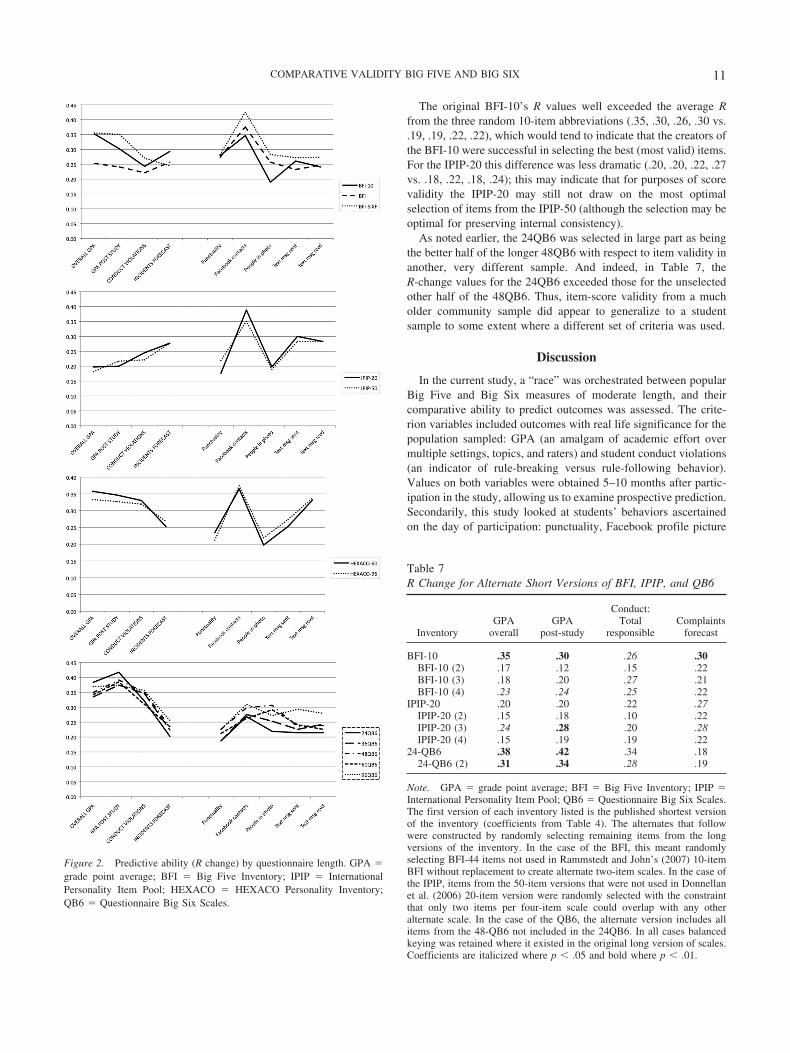
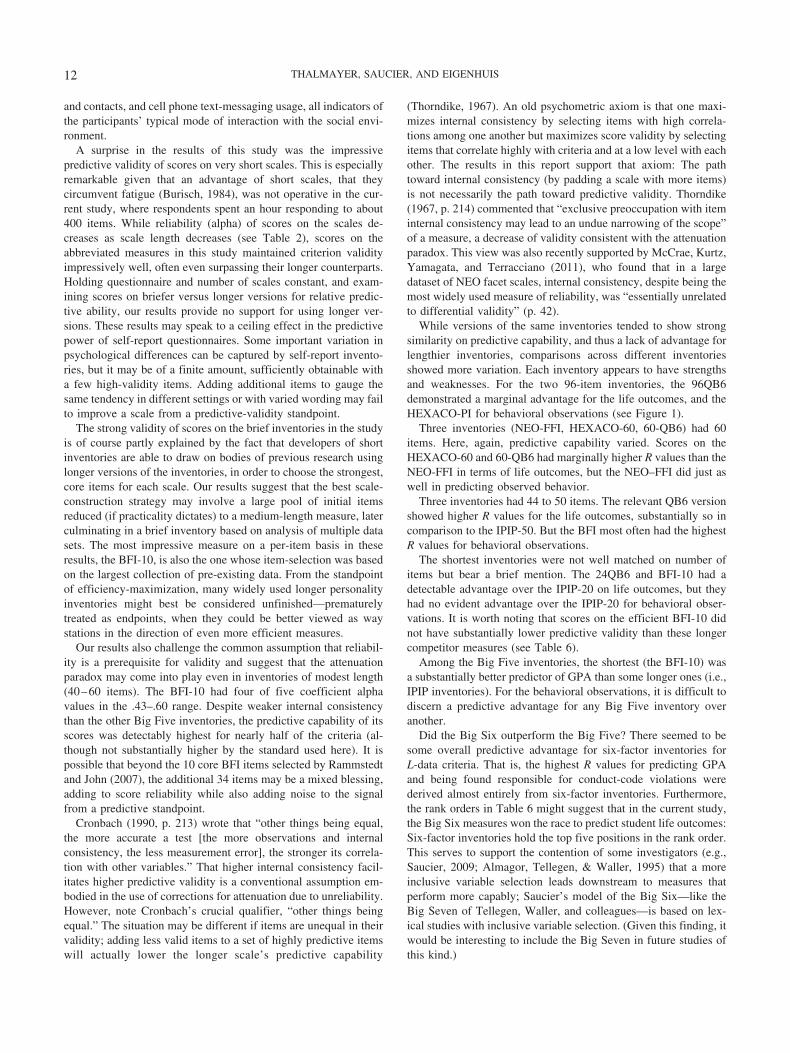
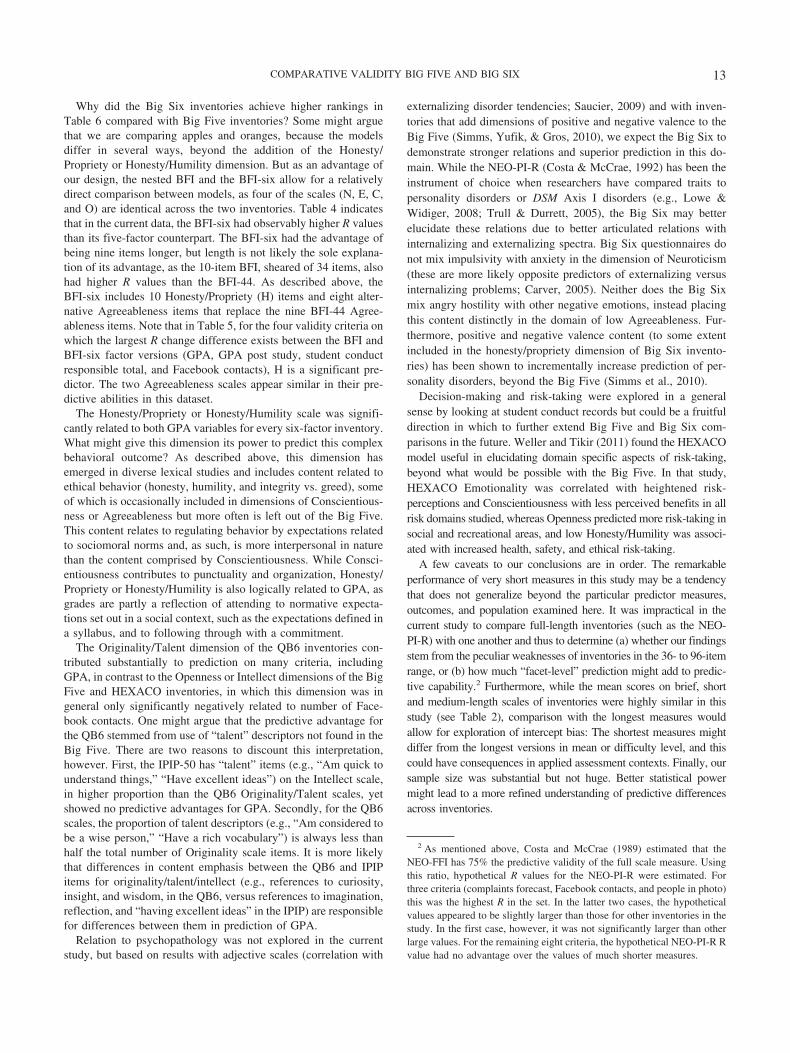
Figure 2 graphs the differences in predictive ability of scoresfrom the four sets of inventories depending on inventory length.The graphs in Figure 2 have more uniform lines than those inFigure 1, indicating that shorter versus longer versions of the sameinventory usually predict quite similarly across the criteria. Thelargest exception to this is when the BFI is converted from a five-to a six-factor inventory—the predictive ability increases for mostcriteria but not substantially for any one. However the 10-itemBFI, the shortest measure in our study, demonstrated impressiveprediction, for half the criteria actually showing a detectablyhigher R than the 44-item BFI from which it was derived.
Likewise, the 50-item IPIP showed no predictive advantage overits 20-item counterpart. And, the 96-item HEXACO-PI demon-strated no predictive advantage over its 60-item version. The fiveversions of the QB6 were also highly comparable in their predic-tiveness; virtually all of the predictive capabilities of the longerversions are encapsulated in the shortest versions.
To establish that the strength of the brief BFI and IPIP comparedwith their longer versions was due to selecting the best possibleitems, and to rule out the alternate hypothesis that any shortenedset of items from the longer measures would have equal strength,random alternate sets of both short measures were constructed.Items for three additional short sets for each measure were selectedrandomly from those items not used in the published short ver-sions, maintaining balanced keying where it existed in the originalscale and avoiding unbalanced overlap of items drawn between thedifferent scales. Regressions of the criterion variables on thesealternate 10-item BFI and 20-item IPIP inventories are reported inTable 7. Also reported in Table 7 is the comparative validity ofscores from the 24QB6 with the other, unselected half of the48QB6.
Figure 1. Predictive ability (R change) by length of measure for eachquestionnaire type. GPA � grade point average; HEXACO � HEXACOPersonality Inventory; BFI � Big Five Inventory; NEO-FFI � NEO FiveFactory Inventory; QB6 � Questionnaire Big Six Scales; IPIP � Interna-tional Personality Item Pool.
Table 6Tally of Better and Worse Performance in Significance of RChange Values
Relative rank Inventory Better Worse
1 48QB6 3 02 96QB6 3 03 24QB6 2 04 36QB6 2 05 BFI-6 2 06 BFI-10 1 07 HEXACO-60 1 08 60QB6 1 19 NEO-FFI 0 0
10 HEXACO-96 0 011 BFI-44 0 112 IPIP-20 1 213 IPIP-50 0 3
Note. QB6 � Questionnaire Big Six Scales; BFI � Big Five Inventory;HEXACO � HEXACO Personality Inventory; NEO-FFI � NEO FiveFactor Inventory; IPIP � International Personality Item Pool. A point for“better” was given to an inventory if it demonstrated statistically signifi-cantly higher R-change value over any other inventory for an outcome inTable 4. A point for “worse” was tallied if, for any outcome in Table 4, thisinventory had a significantly smaller R-change value than any other inven-tory. Where scores were equal, a higher rank was given to the shorterinventory.
10 THALMAYER, SAUCIER, AND EIGENHUIS
The original BFI-10’s R values well exceeded the average Rfrom the three random 10-item abbreviations (.35, .30, .26, .30 vs..19, .19, .22, .22), which would tend to indicate that the creators ofthe BFI-10 were successful in selecting the best (most valid) items.For the IPIP-20 this difference was less dramatic (.20, .20, .22, .27vs. .18, .22, .18, .24); this may indicate that for purposes of scorevalidity the IPIP-20 may still not draw on the most optimalselection of items from the IPIP-50 (although the selection may beoptimal for preserving internal consistency).
As noted earlier, the 24QB6 was selected in large part as beingthe better half of the longer 48QB6 with respect to item validity inanother, very different sample. And indeed, in Table 7, theR-change values for the 24QB6 exceeded those for the unselectedother half of the 48QB6. Thus, item-score validity from a mucholder community sample did appear to generalize to a studentsample to some extent where a different set of criteria was used.
Discussion
In the current study, a “race” was orchestrated between popularBig Five and Big Six measures of moderate length, and theircomparative ability to predict outcomes was assessed. The crite-rion variables included outcomes with real life significance for thepopulation sampled: GPA (an amalgam of academic effort overmultiple settings, topics, and raters) and student conduct violations(an indicator of rule-breaking versus rule-following behavior).Values on both variables were obtained 5–10 months after partic-ipation in the study, allowing us to examine prospective prediction.Secondarily, this study looked at students’ behaviors ascertainedon the day of participation: punctuality, Facebook profile picture
Figure 2. Predictive ability (R change) by questionnaire length. GPA �grade point average; BFI � Big Five Inventory; IPIP � InternationalPersonality Item Pool; HEXACO � HEXACO Personality Inventory;QB6 � Questionnaire Big Six Scales.
Table 7R Change for Alternate Short Versions of BFI, IPIP, and QB6
InventoryGPA
overallGPA
post-study
Conduct:Total
responsibleComplaints
forecast
BFI-10 .35 .30 .26 .30BFI-10 (2) .17 .12 .15 .22BFI-10 (3) .18 .20 .27 .21BFI-10 (4) .23 .24 .25 .22
IPIP-20 .20 .20 .22 .27IPIP-20 (2) .15 .18 .10 .22IPIP-20 (3) .24 .28 .20 .28IPIP-20 (4) .15 .19 .19 .22
24-QB6 .38 .42 .34 .1824-QB6 (2) .31 .34 .28 .19
Note. GPA � grade point average; BFI � Big Five Inventory; IPIP �International Personality Item Pool; QB6 � Questionnaire Big Six Scales.The first version of each inventory listed is the published shortest versionof the inventory (coefficients from Table 4). The alternates that followwere constructed by randomly selecting remaining items from the longversions of the inventory. In the case of the BFI, this meant randomlyselecting BFI-44 items not used in Rammstedt and John’s (2007) 10-itemBFI without replacement to create alternate two-item scales. In the case ofthe IPIP, items from the 50-item versions that were not used in Donnellanet al. (2006) 20-item version were randomly selected with the constraintthat only two items per four-item scale could overlap with any otheralternate scale. In the case of the QB6, the alternate version includes allitems from the 48-QB6 not included in the 24QB6. In all cases balancedkeying was retained where it existed in the original long version of scales.Coefficients are italicized where p � .05 and bold where p � .01.
11COMPARATIVE VALIDITY BIG FIVE AND BIG SIX
and contacts, and cell phone text-messaging usage, all indicators ofthe participants’ typical mode of interaction with the social envi-ronment.
A surprise in the results of this study was the impressivepredictive validity of scores on very short scales. This is especiallyremarkable given that an advantage of short scales, that theycircumvent fatigue (Burisch, 1984), was not operative in the cur-rent study, where respondents spent an hour responding to about400 items. While reliability (alpha) of scores on the scales de-creases as scale length decreases (see Table 2), scores on theabbreviated measures in this study maintained criterion validityimpressively well, often even surpassing their longer counterparts.Holding questionnaire and number of scales constant, and exam-ining scores on briefer versus longer versions for relative predic-tive ability, our results provide no support for using longer ver-sions. These results may speak to a ceiling effect in the predictivepower of self-report questionnaires. Some important variation inpsychological differences can be captured by self-report invento-ries, but it may be of a finite amount, sufficiently obtainable witha few high-validity items. Adding additional items to gauge thesame tendency in different settings or with varied wording may failto improve a scale from a predictive-validity standpoint.
The strong validity of scores on the brief inventories in the studyis of course partly explained by the fact that developers of shortinventories are able to draw on bodies of previous research usinglonger versions of the inventories, in order to choose the strongest,core items for each scale. Our results suggest that the best scale-construction strategy may involve a large pool of initial itemsreduced (if practicality dictates) to a medium-length measure, laterculminating in a brief inventory based on analysis of multiple datasets. The most impressive measure on a per-item basis in theseresults, the BFI-10, is also the one whose item-selection was basedon the largest collection of pre-existing data. From the standpointof efficiency-maximization, many widely used longer personalityinventories might best be considered unfinished—prematurelytreated as endpoints, when they could be better viewed as waystations in the direction of even more efficient measures.
Our results also challenge the common assumption that reliabil-ity is a prerequisite for validity and suggest that the attenuationparadox may come into play even in inventories of modest length(40–60 items). The BFI-10 had four of five coefficient alphavalues in the .43–.60 range. Despite weaker internal consistencythan the other Big Five inventories, the predictive capability of itsscores was detectably highest for nearly half of the criteria (al-though not substantially higher by the standard used here). It ispossible that beyond the 10 core BFI items selected by Rammstedtand John (2007), the additional 34 items may be a mixed blessing,adding to score reliability while also adding noise to the signalfrom a predictive standpoint.
Cronbach (1990, p. 213) wrote that “other things being equal,the more accurate a test [the more observations and internalconsistency, the less measurement error], the stronger its correla-tion with other variables.” That higher internal consistency facil-itates higher predictive validity is a conventional assumption em-bodied in the use of corrections for attenuation due to unreliability.However, note Cronbach’s crucial qualifier, “other things beingequal.” The situation may be different if items are unequal in theirvalidity; adding less valid items to a set of highly predictive itemswill actually lower the longer scale’s predictive capability
(Thorndike, 1967). An old psychometric axiom is that one maxi-mizes internal consistency by selecting items with high correla-tions among one another but maximizes score validity by selectingitems that correlate highly with criteria and at a low level with eachother. The results in this report support that axiom: The pathtoward internal consistency (by padding a scale with more items)is not necessarily the path toward predictive validity. Thorndike(1967, p. 214) commented that “exclusive preoccupation with iteminternal consistency may lead to an undue narrowing of the scope”of a measure, a decrease of validity consistent with the attenuationparadox. This view was also recently supported by McCrae, Kurtz,Yamagata, and Terracciano (2011), who found that in a largedataset of NEO facet scales, internal consistency, despite being themost widely used measure of reliability, was “essentially unrelatedto differential validity” (p. 42).
While versions of the same inventories tended to show strongsimilarity on predictive capability, and thus a lack of advantage forlengthier inventories, comparisons across different inventoriesshowed more variation. Each inventory appears to have strengthsand weaknesses. For the two 96-item inventories, the 96QB6demonstrated a marginal advantage for the life outcomes, and theHEXACO-PI for behavioral observations (see Figure 1).
Three inventories (NEO-FFI, HEXACO-60, 60-QB6) had 60items. Here, again, predictive capability varied. Scores on theHEXACO-60 and 60-QB6 had marginally higher R values than theNEO-FFI in terms of life outcomes, but the NEO–FFI did just aswell in predicting observed behavior.
Three inventories had 44 to 50 items. The relevant QB6 versionshowed higher R values for the life outcomes, substantially so incomparison to the IPIP-50. But the BFI most often had the highestR values for behavioral observations.
The shortest inventories were not well matched on number ofitems but bear a brief mention. The 24QB6 and BFI-10 had adetectable advantage over the IPIP-20 on life outcomes, but theyhad no evident advantage over the IPIP-20 for behavioral obser-vations. It is worth noting that scores on the efficient BFI-10 didnot have substantially lower predictive validity than these longercompetitor measures (see Table 6).
Among the Big Five inventories, the shortest (the BFI-10) wasa substantially better predictor of GPA than some longer ones (i.e.,IPIP inventories). For the behavioral observations, it is difficult todiscern a predictive advantage for any Big Five inventory overanother.
Did the Big Six outperform the Big Five? There seemed to besome overall predictive advantage for six-factor inventories forL-data criteria. That is, the highest R values for predicting GPAand being found responsible for conduct-code violations werederived almost entirely from six-factor inventories. Furthermore,the rank orders in Table 6 might suggest that in the current study,the Big Six measures won the race to predict student life outcomes:Six-factor inventories hold the top five positions in the rank order.This serves to support the contention of some investigators (e.g.,Saucier, 2009; Almagor, Tellegen, & Waller, 1995) that a moreinclusive variable selection leads downstream to measures thatperform more capably; Saucier’s model of the Big Six—like theBig Seven of Tellegen, Waller, and colleagues—is based on lex-ical studies with inclusive variable selection. (Given this finding, itwould be interesting to include the Big Seven in future studies ofthis kind.)
12 THALMAYER, SAUCIER, AND EIGENHUIS
Why did the Big Six inventories achieve higher rankings inTable 6 compared with Big Five inventories? Some might arguethat we are comparing apples and oranges, because the modelsdiffer in several ways, beyond the addition of the Honesty/Propriety or Honesty/Humility dimension. But as an advantage ofour design, the nested BFI and the BFI-six allow for a relativelydirect comparison between models, as four of the scales (N, E, C,and O) are identical across the two inventories. Table 4 indicatesthat in the current data, the BFI-six had observably higher R valuesthan its five-factor counterpart. The BFI-six had the advantage ofbeing nine items longer, but length is not likely the sole explana-tion of its advantage, as the 10-item BFI, sheared of 34 items, alsohad higher R values than the BFI-44. As described above, theBFI-six includes 10 Honesty/Propriety (H) items and eight alter-native Agreeableness items that replace the nine BFI-44 Agree-ableness items. Note that in Table 5, for the four validity criteria onwhich the largest R change difference exists between the BFI andBFI-six factor versions (GPA, GPA post study, student conductresponsible total, and Facebook contacts), H is a significant pre-dictor. The two Agreeableness scales appear similar in their pre-dictive abilities in this dataset.
The Honesty/Propriety or Honesty/Humility scale was signifi-cantly related to both GPA variables for every six-factor inventory.What might give this dimension its power to predict this complexbehavioral outcome? As described above, this dimension hasemerged in diverse lexical studies and includes content related toethical behavior (honesty, humility, and integrity vs. greed), someof which is occasionally included in dimensions of Conscientious-ness or Agreeableness but more often is left out of the Big Five.This content relates to regulating behavior by expectations relatedto sociomoral norms and, as such, is more interpersonal in naturethan the content comprised by Conscientiousness. While Consci-entiousness contributes to punctuality and organization, Honesty/Propriety or Honesty/Humility is also logically related to GPA, asgrades are partly a reflection of attending to normative expecta-tions set out in a social context, such as the expectations defined ina syllabus, and to following through with a commitment.
The Originality/Talent dimension of the QB6 inventories con-tributed substantially to prediction on many criteria, includingGPA, in contrast to the Openness or Intellect dimensions of the BigFive and HEXACO inventories, in which this dimension was ingeneral only significantly negatively related to number of Face-book contacts. One might argue that the predictive advantage forthe QB6 stemmed from use of “talent” descriptors not found in theBig Five. There are two reasons to discount this interpretation,however. First, the IPIP-50 has “talent” items (e.g., “Am quick tounderstand things,” “Have excellent ideas”) on the Intellect scale,in higher proportion than the QB6 Originality/Talent scales, yetshowed no predictive advantages for GPA. Secondly, for the QB6scales, the proportion of talent descriptors (e.g., “Am considered tobe a wise person,” “Have a rich vocabulary”) is always less thanhalf the total number of Originality scale items. It is more likelythat differences in content emphasis between the QB6 and IPIPitems for originality/talent/intellect (e.g., references to curiosity,insight, and wisdom, in the QB6, versus references to imagination,reflection, and “having excellent ideas” in the IPIP) are responsiblefor differences between them in prediction of GPA.
Relation to psychopathology was not explored in the currentstudy, but based on results with adjective scales (correlation with
externalizing disorder tendencies; Saucier, 2009) and with inven-tories that add dimensions of positive and negative valence to theBig Five (Simms, Yufik, & Gros, 2010), we expect the Big Six todemonstrate stronger relations and superior prediction in this do-main. While the NEO-PI-R (Costa & McCrae, 1992) has been theinstrument of choice when researchers have compared traits topersonality disorders or DSM Axis I disorders (e.g., Lowe &Widiger, 2008; Trull & Durrett, 2005), the Big Six may betterelucidate these relations due to better articulated relations withinternalizing and externalizing spectra. Big Six questionnaires donot mix impulsivity with anxiety in the dimension of Neuroticism(these are more likely opposite predictors of externalizing versusinternalizing problems; Carver, 2005). Neither does the Big Sixmix angry hostility with other negative emotions, instead placingthis content distinctly in the domain of low Agreeableness. Fur-thermore, positive and negative valence content (to some extentincluded in the honesty/propriety dimension of Big Six invento-ries) has been shown to incrementally increase prediction of per-sonality disorders, beyond the Big Five (Simms et al., 2010).
Decision-making and risk-taking were explored in a generalsense by looking at student conduct records but could be a fruitfuldirection in which to further extend Big Five and Big Six com-parisons in the future. Weller and Tikir (2011) found the HEXACOmodel useful in elucidating domain specific aspects of risk-taking,beyond what would be possible with the Big Five. In that study,HEXACO Emotionality was correlated with heightened risk-perceptions and Conscientiousness with less perceived benefits in allrisk domains studied, whereas Openness predicted more risk-taking insocial and recreational areas, and low Honesty/Humility was associ-ated with increased health, safety, and ethical risk-taking.
A few caveats to our conclusions are in order. The remarkableperformance of very short measures in this study may be a tendencythat does not generalize beyond the particular predictor measures,outcomes, and population examined here. It was impractical in thecurrent study to compare full-length inventories (such as the NEO-PI-R) with one another and thus to determine (a) whether our findingsstem from the peculiar weaknesses of inventories in the 36- to 96-itemrange, or (b) how much “facet-level” prediction might add to predic-tive capability.2 Furthermore, while the mean scores on brief, shortand medium-length scales of inventories were highly similar in thisstudy (see Table 2), comparison with the longest measures wouldallow for exploration of intercept bias: The shortest measures mightdiffer from the longest versions in mean or difficulty level, and thiscould have consequences in applied assessment contexts. Finally, oursample size was substantial but not huge. Better statistical powermight lead to a more refined understanding of predictive differencesacross inventories.
2 As mentioned above, Costa and McCrae (1989) estimated that theNEO-FFI has 75% the predictive validity of the full scale measure. Usingthis ratio, hypothetical R values for the NEO-PI-R were estimated. Forthree criteria (complaints forecast, Facebook contacts, and people in photo)this was the highest R in the set. In the latter two cases, the hypotheticalvalues appeared to be slightly larger than those for other inventories in thestudy. In the first case, however, it was not significantly larger than otherlarge values. For the remaining eight criteria, the hypothetical NEO-PI-R Rvalue had no advantage over the values of much shorter measures.
13COMPARATIVE VALIDITY BIG FIVE AND BIG SIX
Conclusions
For basic research purposes that call for a Big Five measure, theBFI-10 requires a minimum of participant time and seems, basedon these results, at least as predictively capable as the standard44-item BFI. Our study indicates, however, that a six-factor ex-tension of the BFI may have slightly higher predictive capabilitythan the five-scale BFI (and a very short version of this extendedBFI can be developed). The Big Six draws on a larger base oflexical research than does the Big Five, incorporating studies frommore diverse languages and studies that use more inclusive vari-able selection criteria. It is thus more likely to replicate well indiverse settings and to be reproduced within a greater diversity ofvariable selection strategies. The Honesty scale of six-factor in-ventories was related to important outcomes in this study, includ-ing grades and student conduct charges, and contributed to theprediction and interpretation of behavioral observations, some-times evidencing a negative relation to number of Facebook con-tacts and text messaging. Furthermore, it is hypothesized thatinclusion of content related to honesty and propriety, and the betterseparation and articulation of internalizing emotion and external-izing behavior content will lead inventories based on the Big Sixmodel to demonstrate advantages when predicting important men-tal health and decision making outcomes, among other real-lifecriteria. Such a model may give the Big Five a meaningful up-grade, enriching and expanding this useful model of personalityattributes for the 21st century.
References
Alalehto, T. (2003). Economic crime: Does personality matter? Interna-tional Journal of Offender Therapy and Comparative Criminology, 47,335–355.
Allport, G. W., & Odbert, H. S. (1936). Trait-names: A psycho-lexicalstudy. Psychological Monographs, 47(Serial No. 211).
Almagor, M., Tellegen, A., & Waller, N. (1995). The Big Seven model: Across-cultural replication and further exploration of the basic dimensionsof natural language trait descriptors. Journal of Personality and SocialPsychology, 69, 300–307. doi:10.1037/0022-3514.69.2.300
Ashton, M. C., & Lee, K. (2007). Empirical, theoretical, and practicaladvantages of the HEXACO model of personality structure. Personalityand Social Psychology Review, 11, 150 –166. doi:10.1177/1088868306294907
Ashton, M., & Lee, K. (2009). The HEXACO-60: A short measure of themajor dimensions of personality. Journal of Personality Assessment, 91,340–345. doi:10.1080/00223890902935878
Ashton, M., & Lee, K. (2010). On the cross-language replicability ofpersonality factors. Journal of Research in Personality, 44, 436–441.doi:10.1016/j.jrp.2010.05.006
Ashton, M., Lee, K., Perugini, M., Szarota, P., de Vries, R. E., Di Blas, L.,. . . De Raad, B. (2004). A six-factor structure of personality-descriptiveadjectives: Solutions from psycholexical studies in seven languages.Journal of Personality and Social Psychology, 86, 356 –366. doi:10.1037/0022-3514.86.2.356
Benet-Martinez, V., & Waller, N. G. (1997). Further evidence for thecross-cultural generality of the Big Seven factor model: Indigenous andimported Spanish personality constructs. Journal of Personality, 65,567–598.
Burisch, M. (1984). Approaches to personality inventory construction: Acomparison of merits. American Psychologist, 39, 214 –227. doi:10.1037/0003-066X.39.3.214
Carver, C. S. (2005). Impulse and constraint: Perspectives from personality
psychology, convergence with theory in other areas, and potential forintegration. Personality and Social Psychology Review, 9, 312–333.doi:10.1207/s15327957pspr0904_2
Cattell, R. B. (1957). Personality and motivation structure and measure-ment. New York, NY: World Book.
Church, A. T., Reyes, J. A. S., Katigbak, M. S., & Grimm, S. D. (1997).Filipino personality structure and the Big Five model: A lexical ap-proach. Journal of Personality, 65, 477–528.
Clark, L. A. (2005). Temperament as a unifying basis for personality andpsychopathology. Journal of Abnormal Psychology, 114, 505–521. doi:10.1037/0021-843X.114.4.505
Clark, L. A., & Watson, D. (1995). Constructing validity: Basic issues inobjective scale development. Psychological Assessment, 7, 309–319.doi:10.1037/1040-3590.7.3.309
Clower, C. E., & Bothwell, R. K. (2001). An exploratory study of therelationship between the Big Five and inmate recidivism. Journal ofResearch in Personality, 35, 231–237. doi:10.1006/jrpe.2000.2312
Costa, P. T., Jr., & McCrae, R. R. (1989). NEO PI/FFI manual supplement.Odessa, FL: Psychological Assessment Resources.
Costa, P. T., Jr., & McCrae, R. R. (1992). Revised NEO PersonalityInventory (NEO-PI-R) and NEO Five-Factor Inventory (NEO-FFI) pro-fessional manual. Odessa, FL: Psychological Assessment Resources.
Cronbach, L. J. (1990). Essentials of psychological testing. New York, NY:Harper & Row.
De Raad, B., Barelds, D. P. H., Levert, E., Ostendorf, F., Mlacic, B., DiBlas, L., . . . Katigbak, M. S. (2010). Only three factors of personalitydescription are fully replicable across languages: A comparison of 14trait taxonomies. Journal of Personality and Social Psychology, 98,160–173. doi:10.1037/a0017184
De Raad, B., DiBlas, L., & Perugini, M. (1998). Two independentlyconstructed Italian trait taxonomies: Comparisons among Italian andbetween Italian and Germanic languages. European Journal of Person-ality, 12, 19–41.
De Raad, B., Hendriks, A. J., & Hofstee, W. K. (1992). Towards a refinedstructure of personality traits. European Journal of Personality, 6, 301–319. doi:10.1002/per.2410060405
Digman, J. M. (1996). The curious history of the Five Factor model. In J. S.Wiggins (Ed.), The Five Factor model of personality: Theoretical per-spectives (pp. 1–20). New York, NY: Guilford Press.
Donnellan, M. B., Oswald, F. L., Baird, B. M., & Lucas, R. E. (2006). Themini-IPIP scales: Tiny-yet-effective measures of the Big Five factors ofpersonality. Psychological Assessment, 18, 192–203. doi:10.1037/1040-3590.18.2.192
Funder, D. (2007). The personality puzzle. New York, NY: Norton.Goldberg, L. R. (1992). The development of markers for the Big Five
factor structure. Psychological Assessment, 4, 26–42. doi:10.1037/1040-3590.4.1.26
Goldberg, L. R. (1993). The structure of phenotypic personality traits.American Psychologist, 48, 26–34. doi:10.1037/0003-066X.48.1.26
Goldberg, L. R. (1999). A broad-bandwidth, public domain, personalityinventory measuring the lower-level facets of several five-factor models.In I. Mervielde, I. Deary, F. De Fruyt, & F. Ostendorf (Eds.), Personalitypsychology in Europe (Vol. 7, pp. 7–28). Tilburg, the Netherlands:Tilburg University Press.
Grucza, R. A., & Goldberg, L. R. (2007). The comparative validity of 11modern personality inventories: Predictions of behavioral acts, infor-mant reports, and clinical indicators. Journal of Personality Assessment,89, 167–187.
Hirsh, J. B., & Peterson, J. B. (2008). Predicting creativity and academicsuccess with a “fake-proof” measure of the Big Five. Journal of Re-search in Personality, 42, 1323–1333. doi:10.1016/j.jrp.2008.04.006
John, O. P., Donahue, E. M., & Kentle, R. L. (1991). The Big FiveInventory (Versions 4a and 54). Berkeley, CA: University of California,Berkeley, Institute of Personality and Social Research.
14 THALMAYER, SAUCIER, AND EIGENHUIS
John, O. P., & Srivastava, S. (1999). The Big Five trait taxonomy: History,measurement, and theoretical perspectives. In L. A. Pervin & O. P. John(Eds.), Handbook of personality: Theory and research (pp. 102–138).New York, NY: Guilford Press.
Johnson, J. A. (2000). Predicting observers’ ratings of the Big Five fromthe CPI, HPI, and NEO-PI-R: A comparative validity study. EuropeanJournal of Personality, 14, 1–19.
Lee, K., & Ashton, M. (2004). Psychometric properties of the HEXACOpersonality inventory. Multivariate Behavioral Research, 39, 329–358.doi:10.1207/s15327906mbr3902_8
Loevinger, J. (1954). The attenuation paradox in test theory. PsychologicalBulletin, 51, 493–504. doi:10.1037/h0058543
Lowe, J. R., & Widiger, T. A. (2008). Personality disorders. In J. E.Maddux & B. A. Winstead (Eds.), Psychopathology: Foundations for acontemporary understanding (pp. 223–250). Mahwah, NJ: Erlbaum.
McCrae, R. R., & Allik, J. (Eds.). (2002). The Five-Factor model ofpersonality across cultures. International and cultural psychology se-ries. New York, NY: Kluwer Academic/Plenum Press.
McCrae, R. R., & Costa, P. T. (1997). Personality trait structure as a humanuniversal. American Psychologist, 52, 509–516.
McCrae, R. R., Kurtz, J. E., Yamagata, S., & Terracciano, A. (2011).Internal consistency, retest reliability, and their implications for person-ality scale validity. Personality and Social Psychology Review, 15,28–50. doi:10.1177/1088868310366253
Noftle, E. E., & Robins, R. W. (2007). Personality predictors of academicoutcomes: Big Five correlates of GPA and SAT scores. Journal ofPersonality and Social Psychology, 93, 116–130. doi:10.1037/0022-3514.93.1.116
Ostendorf, F. (1990). Sprache und persönlichkeitsstruktur: Zur Validitatdes Funf-Faktoren-Modells der Persönlichkeit [Language and personal-ity structure: Toward the validation of the Five-Factor model of person-ality]. Regensberg, Germany: Verlag.
Rammstedt, B., & John, O. P. (2007). Measuring personality in one minuteor less: A 10-item short version of the Big Five Inventory in English andGerman. Journal of Research in Personality, 41, 203–212.
Saucier, G. (1997). Effects of variable selection on the factor structure ofperson descriptors. Journal of Personality and Social Psychology, 73,1296–1312. doi:10.1037/0022-3514.73.6.1296
Saucier, G. (1998). Replicable item-cluster subcomponents in the NEOFive-Factor Inventory. Journal of Personality Assessment, 70, 263–276.doi:10.1207/s15327752jpa7002_6
Saucier, G. (2003). An alternative multiple-language structure of person-
ality attributes. European Journal of Personality, 17, 179–205. doi:10.1002/per.489
Saucier, G. (2009). Recurrent personality dimensions in inclusive lexicalstudies: Indications for a Big Six structure. Journal of Personality, 77,1577–1614. doi:10.1111/j.1467-6494.2009.00593.x
Saucier, G., Georgiades, S., Tsaousis, I., & Goldberg, L. R. (2005). Thefactor structure of Greek personality adjectives. Journal of Personalityand Social Psychology, 88, 856–875.
Saucier, G., Ole-Kotikash, L., & Payne, D. L. (2006). The structure ofpersonality and character attributes in the language of the Maasai.Unpublished manuscript, University of Oregon.
Simms, L. J., Yufik, T., & Gros, D. F. (2010). Incremental validity ofpositive and negative valence in predicting personality disorder. Per-sonality Disorders: Theory, Research, and Treatment, 1, 77–86. doi:10.1037/a0019752
Szirmak, Z., & De Raad, B. (1994). Taxonomy and structure of Hungarianpersonality traits. European Journal of Personality, 8, 95–117.
Tellegen, A., & Waller, N. G. (2008). Exploring personality through testconstruction: Development of the Multidimensional Personality Ques-tionnaire. In G. J. Boyle, G. Matthews, & D. H. Saklofske (Eds.), TheSAGE handbook of personality theory and assessment. Vol. 2: Person-ality measurement and testing (pp. 261–292). Thousand Oaks, CA:Sage.
Thorndike, R. L. (1967). The analysis and selection of test items. In D. N.Jackson & S. Messick (Eds.), Problems in human assessment (pp.201–216). New York, NY: McGraw-Hill.
Trull, T. J., & Durrett, C. A. (2005). Categorical and dimensional modelsof personality disorder. Annual Review of Clinical Psychology, 1, 355–380. doi:10.1146/annurev.clinpsy.1.102803.144009
van Dam, C., Janssens, J. M. A. M., & De Bruyn, E. E. J. (2005). PEN, BigFive, juvenile delinquency and criminal recidivism. Personality andIndividual Differences, 39, 7–19. doi:10.1016/j.paid.2004.06.016
Weller, J. A., & Tikir, A. (2011). Predicting domain-specific risk takingwith the HEXACO personality structure. Journal of Behavioral DecisionMaking, 24, 180–201.
Zhou, X., Saucier, G., Gao, D., & Liu, J. (2009). The factor structure ofChinese personality descriptors. Journal of Personality, 77, 363–400.
Received August 12, 2010Revision received April 19, 2011
Accepted April 20, 2011 �
15COMPARATIVE VALIDITY BIG FIVE AND BIG SIX