Psychological and physiological stress and burnout among ...
Psychological and Physiological Factors that Affect Success in Ultra-marathoners
Jeremy Sutton
Sport and Exercise Sciences Research Institute (SESRI) Ulster University
Thesis submitted for the degree of Doctor of Philosophy (PhD) At Ulster University
Submission: November 2018
I confirm that the word count of this thesis is less than 100,000 excluding the title page, contents, acknowledgements, abstracts, abbreviations, footnotes,
diagrams, tables, appendices, references and bibliography

2
Contents Acknowledgements .................................................................................................................... 5 Note on Access to Content ........................................................................................................ 6 1. General Introduction ........................................................................................................ 8
1.1. Introduction ......................................................................................................................... 8 1.2. Experimental Aims and Objectives .................................................................................. 11 1.3. Overview of Thesis ............................................................................................................. 12
2. Literature Review ............................................................................................................ 15 2.1. Introduction ....................................................................................................................... 15
2.1.1. Defining Human Endurance .......................................................................................................... 15 2.1.2. Evolutionary Definition of Endurance ........................................................................................... 16 2.1.3. Interdisciplinary Approach to Endurance Research ...................................................................... 17
2.2. Psychological Approach to Endurance ............................................................................ 20 2.2.1. Mental Toughness .......................................................................................................................... 20 2.2.2. Motivation ...................................................................................................................................... 34 2.2.3. Personality ..................................................................................................................................... 43
2.3. Physiological Approach to Endurance ............................................................................ 48 2.3.1. Aerobic Capacity – V̇O2max ............................................................................................................ 49 2.3.2. Lactate Inflection Point .................................................................................................................. 55 2.3.3. Running Economy ......................................................................................................................... 59 2.3.4. Stress Hormones ............................................................................................................................ 61 2.3.5. Genetics ......................................................................................................................................... 66
2.4. Psychophysiological Models of Endurance ..................................................................... 70 2.4.1. Mind over Matter ........................................................................................................................... 70 2.4.2. Central Governor Model ................................................................................................................ 70 2.4.3. Psychobiological Model ................................................................................................................ 73 2.4.4. Implications for Research .............................................................................................................. 75
2.5. Summary and Aims of Thesis ........................................................................................... 76 3. Experimental Design and Methodology ......................................................................... 79
3.1. Overall Experimental Design ........................................................................................... 79 3.2. Participants ........................................................................................................................ 79
3.2.1. Participant Number ........................................................................................................................ 79 3.2.2. Participant Consent and Screening ................................................................................................ 79
3.3. Psychological Measures ..................................................................................................... 81 3.3.1. Mental Toughness .......................................................................................................................... 81 3.3.2. Personality ..................................................................................................................................... 82 3.3.3. Motivation – Self-determination Theory ....................................................................................... 82
3.4. Physiological Measurements ............................................................................................. 84 3.4.1. Aerobic Fitness - V̇O2max Test ........................................................................................................ 84 3.4.2. Rating of Perceived Exertion ......................................................................................................... 84 3.4.3. Running Economy ......................................................................................................................... 85 3.4.4. Pain Tolerance/Threshold .............................................................................................................. 85 3.4.5. Lactate Inflection Point .................................................................................................................. 85 3.4.6. Stress Hormones ............................................................................................................................ 86
3
3.5. Blood Extraction and Analysis ......................................................................................... 87 3.5.1. Angiotensin Converting Enzyme (ACE) Gene Quantification ..................................................... 87 3.5.2. Genetic Testing for the 5HTT, BDNF and D4DR Genes .............................................................. 88
3.6. Statistical Analysis ............................................................................................................. 90 3.6.1. Comparative Statistics ................................................................................................................... 90
4. Study 1: Psychological and Physiological Factors that Influence Performance in Ultra-Marathon Runners ........................................................................................................ 93
4.1. Introduction ....................................................................................................................... 94 4.2. Methods .............................................................................................................................. 99
4.2.1. Participant Characteristics ............................................................................................................. 99 4.2.2. Experimental Design ..................................................................................................................... 99 4.2.3. Psychological Measures ............................................................................................................... 100 4.2.4. Physiological Measures ............................................................................................................... 100 4.2.5. Data Analysis ............................................................................................................................... 101 4.2.6. Learning and Development .......................................................................................................... 101
4.3. Results ............................................................................................................................... 102 4.3.1. Psychological Measures ............................................................................................................... 102 4.3.2. Physiological Measures ............................................................................................................... 103
4.4. Discussion ......................................................................................................................... 105 5. Study 2: Identification of the Psychological and Physiological Factors that Enable Endurance Performance Success in Trained Ultra-marathoners. ..................................... 112
5.1. Introduction ..................................................................................................................... 113 5.2. Methods ............................................................................................................................ 117
5.2.1. Participant Characteristics ........................................................................................................... 117 5.2.2. Experimental Design ................................................................................................................... 118 5.2.3. Psychological Measures ............................................................................................................... 118 5.2.4. Physiological Measures ............................................................................................................... 118 5.2.5. Data Analysis ............................................................................................................................... 120 5.2.6. Learning and Development .......................................................................................................... 121
5.3. Results ............................................................................................................................... 122 5.3.1. Physiological Measures ............................................................................................................... 122 5.3.2. Psychological Measures ............................................................................................................... 124 5.3.3. Correlational Analysis ................................................................................................................. 127
5.4. Discussion ......................................................................................................................... 134 6. Study 3: Psychological and Physiological Factors Influencing Ultra-Marathon Race Performance: A Field Experiment ....................................................................................... 144
6.1. Introduction ..................................................................................................................... 145 6.2. Methods ............................................................................................................................ 150
6.2.1. Participant Characteristics ........................................................................................................... 150 6.2.2. Experimental Design ................................................................................................................... 150 6.2.3. Psychological Measures ............................................................................................................... 151 6.2.4. Physiological Measures ............................................................................................................... 151 6.2.5. Data Analysis ............................................................................................................................... 152 6.2.6. Descriptive Statistics ................................................................................................................... 152 6.2.7. Learning and Development .......................................................................................................... 152
6.3. Results ............................................................................................................................... 155 6.3.1. Analysis of Stress Hormones Changes During Competition ....................................................... 155 6.3.2. Correlational Analysis ................................................................................................................. 157

4
6.4. Discussion ......................................................................................................................... 165 7. General Discussion ....................................................................................................... 172
7.1. Testing the Null Hypothesis (H0) .................................................................................... 172 7.2. General Discussion .......................................................................................................... 175 7.3. Psychophysiological Integration and Summary of Research Findings ...................... 178 7.4. Theoretical Impact of Psychological Models on Interpreting Endurance ................. 185 7.5. Limitations, and Future Work Required in this Area ................................................. 198
8. Appendices ..................................................................................................................... 202 8.1. Psychology and Physiology in Endurance – Participant Questionnaires ................... 203
8.1.1. Participant Health Questionnaire ................................................................................................. 203 8.1.2. Psychology and Physiology in Endurance – Training Questionnaire ......................................... 205
8.2. Psychological Tests .......................................................................................................... 207 8.2.1. Sport Mental Toughness Questionnaire (SMTQ) item wording (Sheard, 2013) ......................... 207 8.2.2. MTQ48 (Crust & Clough 2005) .................................................................................................. 208 8.2.3. Big 5 Personality Inventory – (John et al., 1991, 2008) .............................................................. 210 8.2.4. General Causality Orientation Scale (GCOS) – (Deci & Ryan, 1985) ........................................ 213
8.3. References ......................................................................................................................... 217

5
Acknowledgements
This thesis and the work within would not have been possible without the support, actions and
guidance of the people mentioned below. I would therefore like to acknowledge the following
people and offer my deepest gratitude for their contributions:
I am especially grateful for the continued support of my supervisors, at Ulster University, Dr
Gavin Breslin, Prof Gareth Davison, and Dr Roddy Large from Dundalk Institute of
Technology.
Dr John Brown and Roy Crowe, for their encouragement, expertise and incredible willingness
to assist in the lab.
A special thanks to all participants who gave up their time to assist in my testing.
Above all, I would like to thank my family for their encouragement, and continued support.
Without the love and companionship from my wife, Shirley, along with her unwavering belief
in my abilities, this work would neither have been started, nor finished. This journey has been
yours as much as mine. To my wonderful daughters, Jessica and Tehya, the joy you both give
me is without bounds, and fuels all that I do. Finally, I would like to thank my mother, Doreen,
and my father, Malcolm, for a lifetime of love and guidance, and teaching me the value of hard
work.

6
Note on Access to Content
I hereby declare that with effect from the date on which the thesis is deposited in the Research
Office of Ulster University I permit:
1. The Librarian of the University to allow the thesis to be copied in whole or in part without
reference to me on the understanding that such authority applies to the provision of single
copies made for study purposes or for inclusion within the stock of another library.
2. The thesis to be made available through the Ulster Institutional Repository and/or EThOS
under the terms of the Ulster eTheses Deposit Agreement which I have signed.
IT IS A CONDITION OF USE OF THIS THESIS THAT ANYONE WHO CONSULTS IT
MUST RECOGNISE THAT THE COPYRIGHT RESTS WITH THE AUTHOR AND THAT
NO QUOTATION FROM THE THESIS AND NO INFORMATION DERIVED FROM IT
MAY BE PUBLISHED UNLESS THE SOURCE IS PROPERLY ACKNOWLEDGED.

7
CHAPTER ONE
8
1. General Introduction
1.1. Introduction Despite falling levels of societal physical activity, and increased obesity in the general
population, a small, but growing number of individuals compete around the world, in the
physically and mentally demanding sport of ultra-marathons (Holt, Lee, Kim, & Klein, 2014;
Hurdiel et al., 2018; Wardenaar et al., 2018). Such long-distance running events frequently
take place in challenging environments, far in excess of the standard marathon distance of
42.20 km, over fixed distances, including 50 km, and 100 km, or time-limited, over multiple
days (Knechtle, 2015).
Whilst modern athletes, including the very best ultra-marathoners, are potentially
homogeneous physically and technically, it is possible that the maintenance of successful
performance under pressure is driven by psychological attributes (Cowden, 2016, 2017). Much
of the current sports psychology literature pays particular attention to mental toughness,
motivation and personality. Indeed, research linked to mental toughness suggests that the
mentally tough individual is marked by perseverance in the face of adversity, and an improved
understanding of the construct may benefit the endurance athlete by facilitating: (a) effective
management of challenges encountered; (b) improved problem-coping skills; and (c) an
increased focus on individual goals (Gucciardi, Peeling, Ducker & Dawson, 2016; Perry,
Clough, Crust, Earle & Nicholls, 2013). Despite concerns regarding a lack of agreement in
defining mental toughness as a psychological construct it continues to be seen as crucial to the
success of athletes, and receives considerable research focus (Andersen, 2013; Gucciardi, 2017;
Marshall et al., 2017; Vaughan, Carter, Cockroft, & Maggiorini, 2018). Running ultra-
marathons necessitates significant motivation to dedicate extended periods of time to complete

9
long periods of running, in training and competition, whilst balancing commitments to work,
family and friends (Krouse, Ransdell, Lucas, & Pritchard, 2011; Zach et al., 2018). In addition,
certain personality types may also impact the ability to handle stress in the absence of a decline
in performance and are largely attributable to genetic and non-shared environmental factors
(Horsburgh, Schermer, Veselka, & Vernon, 2009; Kaiseler, Polman, & Nicholls, 2012).
A growing body of literature has therefore explored the impact of the human genome on
phenotypes that underpin endurance performance, including musculature, maximum oxygen
uptake, and running economy (Barnes & Kilding, 2014; Sarzynski, Ghosh, & Bouchard, 2017;
Valdivieso et al., 2017). Consequently, selective genomic analysis of ultra-marathoners may
provide an insight into the factors that define the endurance athlete.
Relatively little quantitative, interdisciplinary research has been directed at both psychological
and physiological factors, and their interaction, that predict performance in ultra-marathoners,
or what drives ultra-marathoners to push their individual limits (Wortley & Islas, 2011). Indeed,
despite research yielding an improved understanding of the factors involved in endurance
performance, the bulk of studies have been specialised and fragmented, focusing on individual
elements of psychology, physiology, biomechanics, and/or genetics (Balagué, Torrents,
Hristovski, & Kelso, 2017; Hristovski, 2013). Recently it has been suggested that the
introduction of a more dynamic approach to research, modelling, and integrating seemingly
disparate disciplines, including psychology and physiology, may benefit sport and exercise
science, as it has in other research fields (Balagué et al., 2017). Indeed, cognitive science has
had considerable success over the last two decades, utilising knowledge and expertise from
diverse and discrete fields of study, including neuroscience, neurobiology, psychology,
linguistics and computing, to tackle diverse challenges including modelling memory, language,
10
visual perception, problem solving, and attention (Baddeley, 2012; Eysenck & Keane, 2015;
Wan, Chen, Shi, & Zhou, 2018). A more comprehensive exploration of measures including
mental toughness, personality, motivation, physiological stress, perception of effort, genetic
predispositions, and aerobic fitness may enable sports professionals to provide improved
support to ultra-marathoners.
At present, an understanding of endurance, synthesising both psychological and physiological
factors, remains elusive, possibly as a result of associated research challenges, including cost,
resources and available expertise. However, some limited, interdisciplinary research success
has already led to an integrated view of fatigue, and the speculation that the termination of
aerobic sessions, and endurance performance overall, is likely to be a product of the interaction
of multiple psychological and physiological variables (Hristovski & Balagué, 2010; Inzlicht &
Marcora, 2016). The Central Governor Model (Noakes, 2007), and the Psychobiological model
(Marcora, 2008), have both challenged the pre-existing view that the length of aerobic exercise
is determined by muscle fatigue, and suggested a close relationship with perception of effort
(Crewe, Tucker, & Noakes, 2008; Inzlicht & Marcora, 2016).
The aim of the present research is to provide an integrated understanding of the factors involved
in endurance through the quantification of the psychological, and physiological factors that: (a)
identify, and affect success in, the ultra-marathoner, and (b) affect the limits of aerobic fitness.
Other supplementary aims include, challenging existing psychological models of mental
toughness, motivation and personality to successfully identify ultra-marathoners, and provide
support for integrating measures from both psychology and physiology, to produce a novel,
interdisciplinary Optimum Balanced Performance Model of Endurance Success in ultra-
marathons.

11
1.2. Experimental Aims and Objectives The principal aim of this thesis was to adopt an interdisciplinary, quantitative research
methodology to identify and measure the psychological and physiological factors that affect
success in ultra-marathoners. The primary objectives in each study were as follows:
Study 1: To use an interdisciplinary approach to quantify, and compare both
psychological factors, including mental toughness and personality, and
physiological factors, including V̇O2peak scores, and the ACE gene allele that
may predict endurance performance between ultra-marathoners and non-
ultra-marathoners.
Study 2: To use an interdisciplinary approach to quantify, and compare: (a)
psychological factors, including mental toughness, personality and
motivation; and (b) physiological factors, including V̇O2peak scores, pain
tolerance and threshold, stress hormone, lactate threshold, running
economy, and the 5HTT, BDNF, D4DR genes that may predict endurance
performance as a result of further delineation between ultra-marathon,
aerobic and low aerobic groups.
Study 3: To use an interdisciplinary approach to quantify psychological factors,
including mental toughness, personality and motivation, and physiological
factors, including stress hormones in ultra-marathoners participating in a
single event and contribute to knowledge by identifying those measures that
predict successful endurance race performance.

12
1.3. Overview of Thesis This thesis is presented in 7 chapters, a brief summary of each is described below:
Chapter 2:
A review of the literature critically examined the existing research pertaining to psychological
and physiological factors that underpin human endurance performance in ultra-marathoners,
and models that attempt their integration.
Chapter 3:
This chapter included the experimental design and methodology adopted in the four separate
studies. A description of the psychological, physiological testing and statistical data analysis
procedures, in addition to biochemical analysis, is provided.
Chapter 4:
Study 1 adopted an interdisciplinary approach to quantify and compare both psychological
models, including mental toughness and personality, and physiological factors including
V̇O2peak scores, and the ACE gene allele, between ultra-marathoners and non-ultra-
marathoners.
Chapter 5:
Study 2 was designed to extend the interdisciplinary approach in Study 1 by quantifying and
comparing an increased range of psychophysiological measures, including motivation, pain
tolerance and threshold, stress hormones, lactate threshold, running economy, and the 5HTT,
BDNF, D4DR genes, between ultra-marathoners, aerobic and low aerobic groups as defined
by ultra-marathon participation and volume of aerobic training.

13
Chapter 6:
Study 3 was designed to quantify, and integrate, psychological models, including mental
toughness, personality and motivation, and physiological factors including stress hormone, in
ultra-marathoners participating in a single race and extend the body of scientific knowledge by
identifying those measures that predict successful performance.
Chapter 7:
The general discussion included a summary of findings, theoretical implications, and design
limitations of the four studies. Findings from all four studies were interpreted collectively to
propose a new interdisciplinary model of human endurance, and finally, a discussion of
recommendations for future research was provided.

14
CHAPTER TWO

15
2. Literature Review
2.1. Introduction
A narrative review of the extant research literature, identifying both psychological and
physiological factors involved in successful aerobic endurance was conducted, where success
is defined as the participation in, and completion of, an ultra-marathon event (Fonseca-
Engelhardt et al., 2013). The aims were to: (a) highlight key psychological and physiological
studies; (b) identify pertinent psychological models; (c) identify gaps in the academic
understanding, explanations and methodological approaches; (d) describe interdisciplinary
models proposed to explain aerobic fatigue; and finally (e) introduce the focus of this
programme of interdisciplinary research and how each study is designed to contribute to the
existing body of literature.
2.1.1. Defining Human Endurance In recent years, considerable growth has been seen in the number of participants entering
endurance events, with more than one hundred thousand athletes worldwide challenging the
limits of their performance (Hurdiel et al., 2018; Simpson, Post, Young, & Jensen, 2014;
Wardenaar et al., 2018;). Ultra-marathons typically have a duration in excess of 6 hours, and
are frequently standard distances of 50km, and 100km, but also include much longer, multi-
day races, taking place over difficult terrains, with significant ascents and descents (Knechtle,
2015).
Human endurance is defined as an individual’s capacity to sustain a given energy expenditure
for the longest time possible, with races, such as ultra-marathons, requiring considerable
physical and mental effort, and the need to overcome feelings of exertional discomfort (Billat,

16
Koralsztein, & Morton, 1999; Brick, MacIntyre & Campbell, 2014; Hurdiel et al., 2018).
Athletes frequently undertake physiological testing to better understand, and improve,
endurance performance, and tailor their training, nutrition and recovery, based on the results
(Seiler, Katch, Hopkins, & Buchheit, 2011; Wardenaar et al., 2018). Endurance, as with all
human behaviour, has a psychological element and researchers have identified that
psychological factors, including interventions, such as goal setting and self-talk, and mental
fatigue, affect performance (Mccormick, Meijen, & Marcora, 2015). The findings of muscular
endurance training by Crust and Clough (2005) indicated mental toughness as having an
influence on endurance performance, with the potential to reduce, or remove, the perception of
pain. More recently, researchers speculated that, as a result of the importance of psychological
skills during endurance, improved psychological strategies can significantly benefit
competitive performance (Inzlicht & Marcora, 2016; McCormick et al., 2015). Conversely,
recent research has suggested that running, as an expression of our evolution, may have in turn
facilitated brain development, including neurogenesis, the growth and development of nervous
tissue (Schulkin, 2016).
2.1.2. Evolutionary Definition of Endurance Based on evidence from evolutionary biology, physiology, and anthropology, it has been
hypothesised that endurance running historically is important in the pursuit of prey, with key
physiological adaptions evolving over millions of years to benefit long distance running, from
early hominins through to modern homo sapiens (Brooks, 2012; Hawley, Hargreaves, Joyner,
& Zierath, 2014; Schulkin, 2016). Bramble and Lieberman (2004), postulate that homo sapiens
are, as a species, designed for endurance, with highly developed, specialised features that may
have provided a significant contribution to the evolution of the human form.

17
Human endurance capacity is comparable, and often exceeds, that of other mammals, with key
evolutionary, ancestral adaptations including, upright, bipedal locomotion, a tall, narrow
physique, long legs and a developed achilles tendon providing energy return, and efficient heat
loss, necessary to facilitate life as a hunter-gatherer (Bramble & Lieberman, 2004). Whilst a
moderately trained runner can easily complete 10 km, and with training, a half, or full
marathon, other primates are fairly sedentary; even fast quadrupeds, including horses, have
been beaten by well-trained runners over longer running distances (Bramble & Lieberman,
2004; Brooks, 2012). It has been suggested that increased locomotor efficiency, along with the
ability to obtain, store, and utilise energy, may have enabled early humans to persistence hunt,
running prey to exhaustion and collapse, to meet metabolic costs of a larger brain (Brooks,
2012; Pontzer et al., 2016).
2.1.3. Interdisciplinary Approach to Endurance Research
Comparatively recently, in evolutionary terms, our endurance potential tends to be visible in
athletic performance. In addition to the rapid rise in the number of ultra-marathon events being
planned, and the number of successful participants, there has been an increase in the amount
of research conducted on participation profiles and performance in ultra-marathoners (Fonseca-
Engelhardt et al., 2013; Hoffman, Ong & Wang, 2010).
Also, recently it has been speculated that major gains are likely to be identified from an
interdisciplinary approach to sport and exercise science, rather than fragmented, contextually
isolated research (Balagué et al., 2017). It has been theorised that, in living organisms,
components cannot be analysed out of context, and may indeed behave differently when
viewed in isolation rather than part of a network (Hristovski, 2013). Contextual isolation, and
a failure to integrate knowledge from a number of disciplines may result in an insufficient

18
understanding of sport-related phenomena, whilst an interdisciplinary approach may offer
more valuable and informed directions (Balagué et al., 2017). As with successes in cognitive
science in recent decades, a cross-discipline, and interdisciplinary, approach has seen
significant success in research and model development in disciplines as diverse as language
emergence, natural language processing, working memory and mental imagery (Baddeley,
2012; Gong, Shuai, & Comrie, 2014; Moran, Guillot, Macintyre, & Collet, 2011; Wan et al.,
2018).
The remainder of this chapter describes research into psychological models and physiological
studies, including related measures that affect performance in ultra-marathoners, before
exploring, in Section 2.4, interdisciplinary, psychophysiological models proposed to explain
fatigue, and the cessation of aerobic activities. Figure 2.1 identifies the factors reviewed, and
quantified, and are numbered as follows: 1-3, psychological; 4-7 physiological; and 8-11
interdisciplinary measures.

19
Figure 2.1. Quantitative Measures of Endurance Performance

20
2.2. Psychological Approach to Endurance
A better understanding of the psychological factors that elevate endurance performance will
lead to improved evidence-based, practical and psychological intervention for athletes
(McCormick et al., 2015). According to recent research, during sporting competition an
athletes’ behavioural responses rely on various psychological factors, including mental
toughness, and its role is pivotal in supporting adaptive responses to pressure (Cowden, 2016,
2017).
2.2.1. Mental Toughness This section provides an overview of the background, key concepts and theories, and salient
research findings, regarding the concept of mental toughness and explores its capacity to
influence endurance performance.
2.2.1.1. Definition of Mental Toughness and Theoretical Background
Mental toughness has been widely recognised, in both training and competition, by coaches
and athletes, as an important, multidimensional, psychological construct related to performance
enhancement in sport (Gucciardi et al., 2016; Perry et al., 2013; Vaughan, Hanna, & Breslin,
2018). Researchers have suggested that mental toughness provides a potential advantage over
opponents by enabling individuals to cope better with the demands that sport places on them,
whilst maintaining consistency in determination, focus, and the perception of being in control
under competitive pressure (Jones, Hanton, & Connaughton, 2002). Research has attempted to
define mental toughness, along with its constituent parts, to better understand the impact the
construct has on how athletes respond to stress, to facilitate their development, and to define
appropriate instruments for measurement.

21
Much of the early research, conducted to clearly define the concept of mental toughness, relied
heavily on the theoretical understanding of the related concepts of resilience (Rutter, 1985;
2012), and hardiness (Kobasa, 1979).
2.2.1.2. Early Concepts of Mental Toughness Resilience
Resilience has been described as an individual’s ability to bounce back from life’s challenges
and unforeseen difficulties, providing mental protection from emotional and mental disorders
(Rutter, 1985; 2012). The construct is defined as a reduced vulnerability to environmental risk,
and stress, a protective effect enabling individuals to maintain their functioning, and is often
linked to the emergence of positive psychology (Fletcher & Sarkar, 2016; Rutter, 2012;
Seligman & Csikszentmihalyi, 2000). According to Jackson and Watkin (2004), it is not the
experience of hard times that determines whether we succeed or fail, but how we respond, with
the resilient individual having an internal drive, and flexible thinking, to confront new
challenges and an ability to focus on that which is within their control. Resilience is identified
with an improved outcome for individuals from similarly adverse backgrounds or experiencing
comparable, challenging experiences. An exposure to stress may have the beneficial effect of
increased resistance to similar stressors (Rutter, 2012). According to Fletcher and Sarkar
(2016), a lack of resilience should not be confused with weakness, as such vulnerability to
challenges may allow resilience to develop, as required for high performance. Furthermore,
mental fortitude training, underpinned by resilience-related theory, has been shown to enhance
resilience and the ability to thrive under pressure (Fletcher & Sarkar, 2016). Resilience training
interventions have shown positive results in both the workplace (Robertson, Cooper, Sarkar,
& Curran, 2015; Vanhove, Herian, Perez, Harms, & Lester, 2016), and in sport (Bryan, O’Shea,
& Macintyre, 2017), and may benefit, not only in dealing with stress and anxiety, post-
22
traumatic growth (Rendon, 2015), but also as an enabler for greater accomplishments. A recent
systematic review identified a lack of clarity, and agreement, regarding the conceptualisation
of resilience (Bryan, O’Shea, & Macintyre, 2017). In answer, Bryan et al. (2017) proposed that
resilience is a dynamic ability to maintain functioning in response to challenges through
facilitative adaptations, involving metacognition processes, including reflecting on mistakes.
Hardiness
Hardiness has its conceptual roots in health psychology, with researchers particularly focused
on the relationship between stress and illness, and the impact of personality in recovering from
illness. An individual high in hardiness recognises there is a choice regarding handling
externally triggered events by maintaining an internal locus of control (Kobasa, 1979).
Subsequent research, though correlational and restricted to adult students at a US defence
college, has identified individuals higher in hardiness as having a more healthy, high density
lipoprotein (HDL) cholesterol, and a lower body mass index (BMI), providing protection
against cardiovascular disease (Bartone, Valdes, & Sandvik, 2016). Hardiness can buffer an
individual against stress, illness, and life events by impacting on an individual’s perception of
a situation, or event, and subsequently affect behaviour through re-interpretation into
something less threatening (Kobasa, Maddi & Kahn, 1982). The resilient person is less likely
to avoid the stressor, but instead will become involved, and present, in whatever one does, or
encounters. Previous research has established hardiness as a personality trait comprised of three
interrelated dimensions: control, a belief that the individual is involved, rather than helpless, in
life’s outcomes; challenge, an acceptance that change is normal and provides opportunity; and
commitment, implies activity, and involvement, rather than passivity and avoidance (Kobasa
et al., 1982). Research by Kobasa et al. (1982, 1985), observed that business executives
identified with increased levels of hardiness, had a reduced occurrence of illness resulting from
23
stress.
2.2.1.3. Researching the Construct Mental Toughness
Since 2002, a key focus, mostly derived from qualitative research with elite athletes, has been
to remove the ambiguity around mental toughness through identification, and definition, of the
key characteristics of mental toughness using two distinct approaches (Connaughton, Thelwell
& Hanton, 2013). The first approach has been to formulate, through qualitative research
methods, including interviewing, a better understanding of mental toughness and its
development, and subsequently reduce conceptual ambiguity (Bull, Albinson, & Shambrook,
2005; Gucciardi, Gordon, & Dimmock, 2008; Jones et al., 2002; Jones, Hanton, &
Connaughton, 2007; Thelwell, Weston, & Greenlees, 2005). The second approach, using
quantitative methods, has involved researchers building upon existing psychological theories,
from non-sporting areas, including health psychology, to develop measures, and models, to
investigate mental toughness (Clough, Earle, & Sewell, 2002; Crust & Clough, 2005; Crust
2007, 2008, 2008a).
Though the aim in this thesis is to quantitatively measure both psychological and physiological
factors - and compare between measures, participants, and multiple time points - a review of
the qualitative methodology is warranted for several reasons. Qualitative designs, including
unstructured, or semi-structured techniques have provided important insights into, and
informed the early development of, mental toughness, and provided definitions for quantitative
research (Anthony, Gucciardi, & Gordon, 2016). However, despite prior success, concerns
have been raised regarding qualitative methods, including: (a) a reliance on the analysis of self-
24
report questionnaires rather than scientific investigation; (b) a failure to provide ongoing
advancement in the conceptual understanding of the development of mental toughness; and (c)
an inability to generalise much of the published qualitative research due to the focus on elite
athletes (Gucciardi, 2017; Connaughton et al., 2013; Gucciardi et al., 2014).
Characteristics of Mentally Tough Performers
Researchers initially attempted to qualitatively define mental toughness and identify its key
characteristics through interviewing athletes and their coaches (Bull et al., 2005; Gucciardi et
al., 2008; Jones et al., 2002; 2007; Thelwell et al., 2005). One of the most cited of these studies,
was by Jones et al. (2002), who sampled athletes, from both individual and team sports, that
had previously represented their country in major events, including the Olympics. Participants
took part in focus groups to identify personal constructs in relation to mental toughness and
individual interviews were subsequently held to confirm and rank the mental toughness
attributes identified. Jones et al.’s (2002) research, and accompanying analysis, defined mental
toughness as being both natural and developed, providing an advantage over opponents through
an improved ability to cope with the demands of training, competition and lifestyle, whilst
remaining more consistent, attention focussed and controlled under pressure.
A list of 12 ranked attributes were proposed to develop mental toughness, including, a steadfast
belief in the ability to achieve goals, a very strong motivation to succeed whilst maintaining
focus despite distractions, a disregard of other athletes’ performances, and an ability to excel
under the pressure of competition (Jones et al., 2002). A subsequent study interviewed super
elite athletes, coaches, and psychologists, from multiple sporting backgrounds, to further
conceptualise mental toughness (Jones et al., 2007). The earlier definition of mental toughness

25
by Jones et al. (2002) was confirmed, whilst the number of listed attributes increased from 12
to 30, clustered into 4 dimensions, including (a) attitude and mindset, (b) training, (c)
competition, and (d) post competition.
Research by Jones et al. (2002, 2007) made an important contribution to the existing body of
knowledge around mental toughness by providing a comprehensive definition of mental
toughness, along with a detailed breakdown of its elements, and identifying it as a cross-
discipline psychological construct important to success in sport. However, as with other early
studies into mental toughness, there was lack of clarity regarding what mental toughness really
is, or how it is developed, and a limited consensus regarding its common conceptual elements
(Gucciardi et al., 2014). Criticisms have also been raised regarding small sample sizes, the
assumption that athletes and sports professionals interviewed have a clear understanding of
mental toughness, and the premise that the perception of mental toughness is homogeneous
across sports. As a result of these concerns, and the assumption that elite-athletes are all
mentally tough, it is unclear how the definition can be extended to non-elite athletes.
Seven participants from Jones et al. (2002) study were re-interviewed regarding the
development, and maintenance, of mental toughness (Connaughton, Wadey, Hanton & Jones,
2008). Firstly, the findings indicate that mental toughness developed within three key stages,
defined as early, middle, and later years. Secondly, three mechanisms were perceived to assist
in the maintenance of mental toughness: a strong desire and internalised motivation for success;
an established social support network; and, both basic and advanced mental skills, including
focus and concentration (Connaughton et al., 2008). Developing this area further, Connaughton
et al. (2010) observed that sports professionals viewed both positive and negative critical
26
experiences, and incidents, as key to the development of mental toughness, and that it, along
with maintenance, occurred in a particular dimensional order: attitude and mindset, training,
competition, and post-competition. Connaughton et al.’s (2010) findings raise a further
question: to what degree can psychological training programs develop mental toughness?
Although the present study did not directly explore the development or maintenance of mental
toughness in ultra-marathoners, life and sporting experiences, social support, motivation and
personality are likely to underpin the decisions and behaviour that have led to success as an
endurance athlete.
Single Sport Qualitative Research
Several studies have been conducted to produce a more context-rich understanding of mental
toughness and its development in athletes (Bull at al., 2005; Gucciardi, Gordon, Dimmock,
2009; Thelwell et al., 2005). One important study focussed on the development of mental
toughness in cricket (Bull et al., 2005). A total of 12 cricketers, rated by their coaches as
mentally tough were interviewed; thematic analysis was used to understand the development,
maintenance, characteristics and attributes of mental toughness. Five general dimensions, 20
global themes and four structural categories emerged from the data (Bull et al., 2005). The
authors concluded mental toughness is comprised of similar attributes to those highlighted by
Jones et al. (2002), including self-belief, desire and motivation, along with dealing with
pressure and anxiety. The ongoing development and maintenance of mental toughness was
strongly influenced by both early environmental factors, including parenting, later exposure to
international level sport, and competitor’s mind-set (Bull et al., 2005). However, the paper fails
to specify the term mind-set, or provide clear definition, conceptual clarity or detailed
measurement. The results of Bull et al.’s (2005) research has led to improvements in coaching
including the involvement of sport psychologists, and an intervention programme to support

27
the development of mental toughness in future cricket generations; this also provides an
environment more conducive to winning. Critics have suggested that the research, though built
upon established psychological theories has several limitations: (a) the findings were largely
descriptive, for example, an exposure to foreign cricket, and the exploitation of learning
opportunities, are not obviously quantifiable, and therefore comparable between individuals;
(b) it was unclear which global themes related to the development of mental toughness; and
(c) there was no explanation of how mental toughness might actually be developed (Gucciardi
et al., 2009; Connaughton et al., 2013).
A similar, single-sport, single cohort study by Thelwell et al. (2005), investigated soccer
players, and provided further support for the definition of mental toughness provided by Jones
et al. (2002). However, analysis of findings suggests one clarification, in that mentally tough
athletes always, rather than generally, cope better with both the pressure, and the demands of
the sport. Research also ascertained that the environments the player is placed in throughout
their early career are essential to the development of mental toughness and may inform methods
to teach less experienced players coping strategies. In addition, similar mental toughness
attributes were identified in line with the study of Jones et al. (2002), including the need for a
resilient, never give in to pressure, character, and a level of self-belief that is undeterred by the
challenges associated with competition. The study has a number of limitations worth
highlighting, including a small sample size (n = 10), and the sole inclusion of international
players, affecting whether the findings can be generalised to other sports, and non-elite athletes.
Furthermore, it is questionable whether a person can be mentally tough all the time, leading to
the suggestion that mental toughness is a state-like concept; whilst some properties may persist,
it may vary across time and situations as a result of changing goals (Gucciardi, 2017).

28
A further study by Thelwell, Such, Weston, Such, and Greenlees (2010) explored elite
gymnasts, to understand the dimensions involved within the development of mental toughness.
Analysis of the results demonstrated that mental toughness can be developed through a range
of mechanisms and experiences, including mental training, competition, coaching, and
engagement with fellow athletes, friends and family. In addition to demonstrating a clear role
for psychological skills training in the development of mental toughness, the study indicated,
unexpectedly, that the nationality of the gymnast influenced the development of mental
toughness, including both cultural and environmental influences (Thelwell et al., 2010). As
with previous studies, shortfalls in the study include the assumption that all participating
athletes were mentally tough.
Research by Gucciardi et al. (2009) used Personal Construct Psychology (PCP: Kelly, 1955;
1991), to better understand the key attributes of mental toughness in sport. Kelly (1955, 1991)
postulated that we anticipate, or predict, events within our world based on personal theories we
refine over the period of our lifetime. PCP is based around the idea that whether an individual
is troubled, or untroubled, by an event, depends on the meaning that person attaches to it.
Consequently, experience, cognition and behaviour are all determined by attempts to anticipate
events, or people, and understand the outcome (Gucciardi et al., 2009). A key finding resulting
from analysis of interviews with Australian football coaches, using PCP, is that mental
toughness was not only observed to be salient for negative situations, or events, such as not
being selected, or suffering an injury, but also, for positive situations, or events, such as
handling the pressure of being an existing champion, and in good health. This identifies a
difference between mental toughness, and resilience and hardiness, both of which according to
Gucciardi et al. (2009), fail to encapsulate the concept of positive pressure. And furthermore,
that mental toughness may be defined as a collection of emotions and behaviours that enable
29
the athlete to overcome, through perseverance, obstacles, or pressure, and ensure concentration
and motivation to achieve goals when things are going well.
The above studies used qualitative methods to explore the development of mental toughness,
in individual sports, and assumed that the athletes involved are mentally tough. No research
has thus far captured the development, or definition, of mental toughness in non-elite ultra-
marathoners. This programme of research will build on the findings of Crust and Clough
(2005), described in the next section, and quantitatively measure mental toughness, to compare
ultra-marathoners, against non-ultra-marathoners to understand its importance in successful
endurance.
2.2.1.4. Measurement of Mental Toughness
Crust and Clough (2005) identified mental toughness as a trait-like dimension of personality,
extending the conceptualisation of hardiness (Kobasa et al., 1982) by adding confidence to the
three existing concepts of, control, commitment and challenge. Horsburgh et al.’s (2009)
research later confirmed that individual differences in mental toughness were indeed largely
attributable to genetic and non-shared environmental factors. The four components of the
mental toughness model defined by Crust and Clough (2005) are control, commitment,
challenge and confidence (4Cs). Their research identified a mentally tough athlete as someone
who (a) views negative experiences, or situations as challenges to be overcome, (b) believes
they are influential in controlling their future life experiences, (c) remains committed to
achieving their goals, and (d) is confident in their abilities to overcome negative life
experiences. Mentally tough individuals are likely to be resilient to stress, thrive in competition,
have reduced anxiety and be high in self-confidence.
30
Based on completion of the Mental Toughness 48 Questionnaire (MTQ48) (Crust & Clough,
2005), the authors reported a strong association between mental toughness and physical
endurance during a task to hold a dumbbell suspended with a straight arm in front of the body,
and speculated that mentally tough participants benefit from a buffering effect that impacts
either the attention to, or the perception of, pain. Although, Crust and Clough (2005) invited
further investigation of mental toughness in physically demanding situations to better
understand physiological correlates some major limitations were apparent in the study. The
participants were all students of a similar mean age of 21 years (SD=2.7) and weight 79.6 kg
(SD=5.0), and the nature of the task was inherently boring, with no consideration given to
previous weight training experience or existing participation in sports that may physically
prepare the participant for performing the task. Context may also have an effect, the pressure
of producing good results in a tough training session, or more importantly in competition, are
more challenging than in a quiet room in a research laboratory. The dumbbell holding task is
therefore not ecologically valid or representative of the available endurance activities,
including ultra-marathons, and raises doubt on the assumption that mental toughness acts as a
buffer during demanding conditions. The divergent validity of the MTQ48 has also been
challenged, due to concerns regarding the underlying conceptualisation, failing to report
underlying factor analysis, and a lack of independent scrutiny of the underlying factor structure
(Sheard, Golby & Wersch, 2009). And finally, the development, and adoption of the MTQ48
appears to lack scientific rigour, with no information supplied regarding an explanation of data
collection, and a lack of clear rationale for including the additional concept of confidence on
to the pre-existing three concepts of hardiness as proposed originally by Kobasa et al. (1982,
1985). Recent research by Vaughan et al. (2018) has offered support for the scales validity but
raises concerns regarding applicability of the MTQ48 to athletes at different competitive levels.
Indeed, a study by Gucciardi, Hanton, and Mallett (2012) stated that the four-factor model did

31
not fit the data from their sample of athletes. In response to criticism of the MTQ48, the Sports
Mental Toughness Questionnaire (SMTQ) was created to assess confidence, control and
constancy, or an unrelenting determination, using 14 items and a 5-point Likert scale (Sheard
et al., 2009). However, challenges have also been aimed at the SMTQ, regarding its ability to
capture the breadth of mental toughness captured in the earlier qualitative studies, along with
distinguishing the key aspects of mental toughness (Gucciardi, Mallett, Hanrahan, & Gordon,
2013a).
2.2.1.5. Critical Appraisal of Mental Toughness In summary, there are numerous, and varied, definitions of mental toughness, with many
psychological attributes being linked or correlated to success, including the ability to handle
pressure and adversity, resolve to overcome failures, or possession of superior mental skills for
use during performance. Early definitions of mental toughness were based on the experience
and opinion of sport professionals, including athletes and coaches and relied on analysis of
largely self-report questionnaires rather than scientific investigation (Connaughton et al., 2013;
Gucciardi, 2017).
Despite criticism, the concept, model and theories of mental toughness continue to evolve
(Gucciardi, 2017). The MTQ48, emerged from a significant body of research, is built on the
construct of hardiness, and is used to explain stress reactions, in health psychology literature.
Possibly due to its ease of use and scoring it remains the most widely used tool for the
measurement of mental toughness in sport (Gucciardi et al., 2012; Vaughan et al., 2017).
Furthermore, recent research sampled elite, amateur athletes and non-athletes, and identified
high levels of internal consistency in the MTQ48, with the six-factor model - including life and

32
emotional control, along with confidence in interpersonal skills and abilities - resulting in an
acceptable, and better fit than the four-factor model (Vaughan et al., 2017). Therefore, for the
purposes of the current programme of research, and in the absence of other measures, the
MTQ48 will be used to quantify mental toughness in non-elite, ultra-runners, and non-ultra-
runners, to contribute to the body of knowledge regarding both mental toughness and
endurance in sport.
Measurement of mental toughness, along with the quantification of physiological parameters
associated with performance, will provide insight into the relationship with environmental
stressors in the ultra-marathoner. According to Fletcher (2005) the attributes of mental
toughness, influence an individual’s appraisal and coping of a particular situation and
subsequently moderate the relationship between stressors and cognitive, emotional and
behavioural responses (see Figure 2.2).

33
Figure 2.2 Facet Model of Mental Toughness and Human Performance (Taken from Fletcher, 2005)
Other factors may also affect the cognitive processes involved. Whilst Mahoney, Ntoumanis,
Mallett and Gucciardi (2014) confirmed the importance of mental toughness they also
suggested links to variables within motivation and encouraged further research to support
optimal human functioning as opposed to the mental toughness construct. Responding to this
recommendation, motivation is discussed next.
34
2.2.2. Motivation
This section provides an overview of motivational theories of behaviour prior to discussing
measures, and their application to endurance athletes.
2.2.2.1. Definition of Motivation and Theoretical Background
Motivation has been defined as what maintains, sustains, directs and channels human behaviour
over an extended period of time (Ryan & Deci, 2017; Tsigilis, 2005). Motivation impacts an
individual’s ability to focus, and willingness to achieve excellence through mental and physical
effort and is likely to be a necessary precursor to the adoption, and the ongoing continuance,
of training to participate in ultra-marathon events (Hanson, Madaras, Dicke, & Buckworth,
2015; Zach et al., 2017). The ability of the ultra-marathoner to focus on training and
competition is often restricted in terms of both time and resources, and relies on a state of
heightened motivation, and enthusiasm, to balance dedication towards sport against family
commitments, illness, injury, and work pressures (Krouse et al., 2011). Though researchers
have identified both training intensity, and running volume, as predictors of race time, it is
unclear the role, or impact, of motivation on participation, or success, in ultra-marathon events
(Hoffman & Krishnan, 2013; Knechtle, Rosemann, Knechtle & Lepers, 2010; Knechtle, Wirth,
Knechtle, Rust & Rosemann, 2012).
2.2.2.2. Theories of Motivation Many psychological theories have been proposed to explain exercise adherence (Biddle, Mutrie
& Gorely, 2015). Some of these include the Theory of Planned Behaviour (TPB) (Ajzen, 1985,
1987, 2002), the Theory of Competence Motivation (Carter, 1985), the Social Cognitive

35
Theory (Bandura, 1977), and Self-determination Theory (SDT) (Deci & Ryan, 1985: for a
review of theories see Biddle, Mutrie, & Gorely, 2015). SDT was used in this research due to
its organismic perspective and its assumption that humans have evolved to be both curious and
intrinsically motivated to be physically active (Ryan & Deci, 2017).
Theory of Planned Behaviour
The Theory of Planned Behaviour (TPB) provides a useful account of how attitudes and beliefs
impact conscious, behavioural change (Ajzen, 1985, 1987; 2002; Palmer, Burwitz, Dyer, &
Spray, 2005). TPB is a widely-tested, social, cognitive model that has been applied successfully
in the prediction of health-related behaviour, including the adoption of healthy lifestyles,
physical activity/exercise and diet (Gucciardi & Jackson, 2013). According to TPB, beliefs
form a favourable, or unfavourable, impact on the attitude towards that behaviour, which along
with both perceived social pressure, and behavioural control, form the behavioural intention to
determine and control how that individual acts, and the amount of effort invested (Ajzen, 1985,
1987; 2002; Palmer et al., 2005). Intention is influenced by three factors: the positive or
negative evaluation of participating in a human behaviour; the social pressure regarding
performing, or not performing that behaviour; and the perception of how difficult the behaviour
is to perform (Ajzen, 2002). Consequently, the intention to participate in a chosen activity is
elevated when attitudes related to that behaviour are positive, when others appear to support
the behaviour, and an increased perceived ability to carry out that behaviour (Gucciardi &
Jackson, 2013).
TPB has been utilised successfully to predict adherence to training in female netball players
and it has subsequently identified links between positive attitudes and the determination of

36
behaviour of young people in organised sport; less success has been observed in predicting
training variation from a range of sports (Anderson & Lavallee, 2008; Gucciardi & Jackson,
2013; Palmer et al., 2005). Palmer et al. (2005) recognised that a possible explanation for the
limited ability of intentions to predict training behaviour, resulted from motivational changes
over time being as an outcome of new information. However, despite success in linking
behavioural intentions with sport continuation in a number of individual and group sport
(Gucciardi & Jackson, 2013), no research into TPB has been completed with ultra-marathoners.
Theory of Competence Motivation
The Theory of Competence Motivation (TCM), is based on the premise that perceiving either
a level of mastery, or competence, in a behaviour will increase the likelihood that it will be
repeated (Harter, 1978). Positive feedback may lead to an improvement in self-perception that
results in repeated behaviour, whilst negative feedback may result in a fear of failure, and a
reduced likelihood of repeating the activity. Harter (1978) proposed that development can be
improved through removing, or reducing, the fear of a lack of success, and through support and
positive feedback, leading to improvements in perceived success and competence, and a greater
likelihood of repeated behaviour. Early research identified support for TCM and recognised
relationships between perceived competence and the motivation to participate in sport (Klint
& Weiss, 1987). Subsequent research by Tsigilis (2005), indicated that perceived competence
significantly predicted success in endurance, and that it logically precedes intrinsic motivation.
However, the research has been limited to a shuttle test as a measure maximal aerobic fitness
and may not be representative of performance under race conditions or in line with the direct
measurement of V̇O2max. Rheinberg and Engeser (2010) proposed that the components of
motivational competence include the ability to confer situations with motive congruent

37
incentives, and that those people higher in motivational competence are less likely to take part
in activities that are incongruent with their motives.
Social Cognitive Theory
The Social Cognitive Theory (SCT) is based on the premise that learning, and behavioural
adaptations, occur as an outcome of observing others within the context of social interactions
and experiences (Bandura, 1986). The theory predicts that witnessing a person performing an
action provides the observer with a useful cognitive representation and facilitates performance
improvement, and furthermore, that learning can occur without participating in the action but
as a result of forming models using verbal, or visual imagery (Bandura, 1986). A systematic
review by Young et al. (2014) proposed that SCT is a useful model to explain physical activity
behaviour but currently falls short of examining competitive, or endurance sport. Indeed, much
of the research into SCT is within the field of social and health psychology and in particular
behavioural change through media campaigns. To date, no research examining SCT has
identified the impact of knowledge acquisition, and behavioural modification, in ultra-
marathoners through the observation of others on endurance performance (Rosário et al.,
2017). This may in part be due to the suitability of SCT to explain performance success through
motivation. A likely more suitable theory to endurance motivation is the Self-determination
Theory (Ryan & Deci, 2017).

38
Self-determination Theory (SDT)
The Self-determination Theory (SDT) is an organismic theory of human motivation based on
people’s inherent tendency towards growth, and the degree to which their behaviour is self-
motivated (Deci & Ryan, 1985). Ryan and Deci (2017) propose that humans have an evolved
the ability, and propensity, to realise their human capacities and attain healthy psychological,
social and behavioural functioning. SDT proposes that humans are adapted to be innately
curious, socially, and physically active, and that motivation results from the constant
interaction between human nature and socially contextual factors. As a result, activity is most
likely when an individual feels they are intrinsically motivated and have volition over their
behaviour (Deci & Ryan, 1985; Ryan & Deci, 2017). Intrinsically motivated people behave as
they do, because they find the activity they are taking part in inherently interesting and
appealing. Extrinsically motivated behaviour is usually driven by participating in an activity
that has an external consequence, for example, the acquisition of monetary rewards, or the
avoidance of chastisement (Deci & Ryan, 2008). The introduction of extrinsic factors, even
when individuals are free to follow their own desires, can lead to a movement in the locus, or
origin, of causality, and a corresponding reduction in intrinsic motivation (Deci & Ryan, 2000).
The internal locus of causality indicates autonomous, intrinsic motivation, and the perception
that the actor is the origin of their behaviour, rather than simply being subject to external forces
(Ryan & Connell, 1989).
Deci and Ryan (1985) propose innate and universal psychological needs that act to motivate
behaviour and provide essential nourishment to ensure the psychological health and well-being
of the individual. Central to SDT is the idea that optimal performance and maximal perception
of well-being tend to occur when the following three basic psychological needs are met:

39
relatedness, competence and autonomy (Ryan & Deci, 2017). Relatedness is concerned with a
sense of belonging, feeling significant to others, and refers to the need to feel connected to
family, peers and society. Competence is our basic need to feel capable of operating effectively
within salient life contexts and is identified with the desire to be open to new life experiences
and to learn from them (Deci & Ryan, 2008; Ryan & Deci, 2017). Autonomy stems from the
desire to feel free to make decisions and choices within situations, congruent with one’s
authentic interests, and is indicative of improvements in performance, persistence and
adherence (Ryan & Deci, 2017). Autonomous motivation contrasts with controlled motivation
which is focussed on delivering specific outcomes, usually arising from forces believed
external to the self, and is postulated to be essential to intrinsic motivation, and may be
subverted, by external influences, or pressures, including meeting deadlines, appraisals, or
monetary rewards (Deci & Ryan, 2000). Contexts that enable satisfaction of the basic
psychological needs are proposed to enhance autonomous motivation, which is made up of
intrinsic motivation, and extrinsic motivation that has been sufficiently internalised (Deci &
Ryan, 2008). Life with a focus on intrinsic goals is more likely to increase psychological needs
satisfaction and positive effects on well-being, whilst a focus on extrinsic goals may result in
mental health issues and a lack of general wellness.
Research conducted within SDT has identified that individuals with high scores in the
autonomy orientation have more positive relationships, health-related behaviour and self-
actualisation (Deci & Ryan, 2000). In contrast, a controlled orientation is more closely related
to feelings of self-consciousness, being under pressure, and adopting a more outward focus.
The SDT has been applied to multiple fields, including education, sport and business and
despite primarily being a psychological model, the theory is concerned with both evolutionary

40
and biological, as well as cultural, including familial and denial of human rights, and economic
factors, such as capitalism (Ryan & Deci, 2017). As a result, five mini-theories within SDT
have been proposed that correspond to multiple aspects of psychological integration and
motivation, rather than the traditional fields, and elements, of psychology. Early research by
Deci and Ryan (1980) resulted in the formulation of the Cognitive Evaluation Theory, used to
describe the processes involved in the influence of social environments on intrinsic motivation,
and its impact on performance and well-being. Subsequent mini-theories include the
Organismic Integration Theory describing the development of extrinsic motivation as a result
of integration, and the move towards autonomy (Ryan, Connell & Deci, 1985). The third mini-
theory, the causality orientations theory (COT), explores the personality and developmental
aspects of the SDT, where individual differences constitute the developmental outcome as the
individual interacts with the social environment over time (Deci & Ryan, 1985a; Ryan & Deci,
2017). The COT aims to measure lasting aspects of the character and predict meaningful
outcomes rather than ‘needs’ (Deci & Ryan, 1985a). SDT COT proposes three general
causality orientations, autonomy, impersonal and controlled, and intends to describe
orientations towards both one’s own motivations and that of the environment (Ryan & Deci,
2017). The autonomy orientation suggests acting with autonomy, in spite of the environment
controlling aspects of behaviour, through an orientation towards values and interests within an
interpersonal context. The control orientation refers to an inclination toward behaviour that is
regulated and controlled by social situations and contingent on reward, and the potential to
interpret situations as being controlling, despite autonomous opportunities. The impersonal
orientation indicates that tendencies toward elements of the interpersonal context that may be
identified with a lack of control over outcomes, and promote amotivation (Ryan & Deci, 2017).
A fourth mini-theory, the Basic Psychological Needs Theory, has been developed to better
41
understand how needs support, and affect, psychological health and well-being, and a fifth, the
Goal Contents theory, relates to peoples’ goals, intrinsic and extrinsic motivation, and relations
to basic needs satisfaction (Ryan & Deci, 2017).
Collectively the five mini theories provide explanations of behaviour that may include both
elements of intrinsic and extrinsic motivation. COT, in particular, consists of three heavily
researched individual differences, the impersonal orientation, autonomy orientation, and the
control orientation, and will form part of this programme of research to provide useful insight
into the preparation for, and participation in, ultra-marathon events.
2.2.2.3. Measurement of Motivation
According to Deci and Ryan (2017), one of the central purposes for identifying individual
differences in causality orientations is to better understand individuals acting autonomously in
controlling or in intrinsically motivating situations or environments, where autonomy is
undermined. People may identify meaning, and act accordingly, without submitting to the
objective characteristics of the context.
Deci and Ryan (1985) constructed and validated the General Causality Orientation Scale
(GCOS) to measure enduring motivational orientations. The scales comprise of 12 vignettes
and 36 items that describe typical, social and achievement-oriented situations, including job
application and relationships with friends, with responses indicating either an autonomous,
controlled, or impersonal type of motivation (Deci & Ryan, 1985). Each item following the
vignette is attributable to one of the three orientations, either autonomy, impersonal or control
(Deci & Ryan, 1985). A number of studies have confirmed the effectiveness of the GCOS

42
instrument in quantifying causality orientations (Cooper, Lavaysse & Gard, 2015; Koestner,
Bernieri, & Zuckerman, 1992).
According to Ryan and Deci (2017) persistent variation in contextual support, contrasted with
deprivations, can result in significant individual differences, in individuals’ orientation to the
environment. General causality orientations reflect people’s propensities across time and
contexts, and orientations to one’s own environment. To capture these individual differences,
in Studies 2 and 3, the SDT General Causality Orientation Scale (GCOS) has been used to
measure each of the three orientations, autonomy, impersonal and control, and identify
intrinsic, and extrinsic motivational individual differences between the ultra-marathoner and
the non-ultra-marathoner. Analysis of the measurements will provide a degree of insight into
the motivation of amateur athletes to train for and participate in ultra-endurance events.
2.2.2.4. Critical Appraisal
To date, SDT has not been used to distinguish between the motivation of the ultra-marathoner,
and the non-ultra-marathoner whilst controlling for physiological markers of aerobic fitness.
Therefore, research into motivation and the ultra-marathoner, using SDT, is warranted, due to
its success in explaining variance in health-related exercise behaviour, its relative simplicity,
and the suggestion that satisfaction of basic needs, including autonomy, relatedness and
competence, are likely to predict positive sporting outcomes (Deci & Ryan, 2017; Hagger &
Chatzisarantis, 2008). Furthermore, from Ryan and Deci’s (2017) proposal that humans have
evolved to realise our capacities and be innately curious, it may be speculated that ultra-
marathoners by their nature, are motivated to participate in races for personal achievement, and
push the limits of experience and capabilities (Simpson et al., 2014).

43
A greater understanding of ultra-marathoners’ motivation to run, and the links between
motivation and endurance success, may enable the sports professional to better support the
ultra-marathoner in both training and race situations and potentially reduce the likelihood of
burnout, where perceived demand exceeds personal resources (Chang et al., 2017; Lonsdale,
Hodge & Rose, 2009).
2.2.3. Personality A considerable amount of personality in sport studies has been published (Kaiseler, Levy,
Nicholls, & Madigan, 2017), but only a limited number have explored the personalities of
athletes who participate in events that are defined by arduous running conditions, over many
hours, and possibly days (Freund et al., 2013; Roebuck et al. 2018). This section explores some
of the background and key findings from research into personality that may assist forming an
understanding of amateur athletes who participate and perform well in ultra-endurance events.
2.2.3.1. Theoretical Background of Personality Personality is defined as those psychological qualities that contribute to an individual’s lasting
way of thinking, behaving and feeling (Allen, Greenlees, & Jones, 2011). It is widely accepted
that personality determines the behaviour of competitive athletes and as a result has received
considerable attention within the domain of sport (Kaiseler et al., 2017). Trait-based
assessments of natural language have been used to describe the basic personality dimensions
on which people are said to differ, and consensus has been reached regarding a five-factor
model of personality dimensions (McCrae & John, 1992; Allen et al., 2013). This agreement
led to the creation of a hierarchical, five-factor model of personality, including neuroticism,
extraversion, agreeableness, conscientiousness, and openness to experience, that maintains
44
cross-situational consistency, and has been shown to capture much of the personality variance
(Allen et al., 2013; Kaiseler, Polman & Nicholls, 2012; McCrae & John, 1992). Each of the
traits can be further subdivided into a number of other specific traits, or facets, for example,
neuroticism, which encapsulates depression, anxiety, and self-consciousness (Allen et al.,
2013). According to the definitions provided by Kaiseler et al. (2012), neuroticism is contrasted
with emotional consistency, and even-temperedness, and includes the generation of irrational
ideas; extraversion, suggests an energetic response to both the social and material world, along
with an inclination to experience positive emotions, and self-assurance; agreeableness,
suggests an orientation towards the social and the communal, along with being helpful and
trusting; conscientiousness, describes impulse control, benefiting both task and goal-directed
behaviours, and implies self-discipline; openness to experience, suggests the extent of an
individual’s complexity regarding both experiential and mental life, including creativity and
inventiveness, flexible thinking and unconventionality. The major theoretical descriptions of
personality in sport are presented below.
2.2.3.2. The Big 5 Factor Model of Personality in Sport
Five personality dimensions are frequently used as a framework for investigating personality,
with researchers indicating that higher-order personality dimensions influence an athlete’s
ability to cope with pressure and both short-term behaviours, and long-term success in sport
(Allen et al., 2011; Allen et al., 2013; Kaiseler et al., 2017). Research to understand individual
differences in sport has either focussed on the comparison of measurements taken between
diverse populations, including athletes and non-athletes, or, between discrete groups of
athletes, including athletes in diverse sports, or elite versus recreational athletes (Allen et al.,
2011). Analysis of findings has led researchers to suggest that athletes tend to have increased
45
scores in extraversion, and lower scores in neuroticism, than non-athletes, and that personality
may determine long term success in sport, however concerns have been raised regarding
research design including diversity of populations and underlying conceptualisation of
personality (Allen et al., 2011; Allen et al., 2013). Players of team sports have been identified
with higher levels of extraversion, but lower levels of conscientiousness. Research has also
demonstrated that scores from personality tests may differentiate between athletes and non-
athletes and between athletes in different sports (Allen et al., 2013). Research by Nia and
Besherat (2010), identified that athletes were more conscientious than team sport athletes, but
that the latter were more agreeable.
In contrast to research in education and organisational settings, studies to identify whether
personality can predict performance success in sport, and to identify personality profiles that
distinguish athletes from non-athletes, have failed to report consistent patterns making any
conclusions equivocal (Allen et al., 2011; Kaiseler et al., 2017). Coping, identified as the ability
to manage specific demands, through the ongoing monitoring, cognitive and behavioural
modification, is important to sporting performance, but research has had limited success linking
it to personality dimensions (Allen et al., 2011). Subsequent investigations into coping
strategies in athletes, by Allen et al. (2011) and Kaiseler et al. (2012), identified that extraverted
athletes were more problem-focussed, especially those higher in openness, whilst athletes
higher in conscientiousness were more likely to adopt emotion-focused coping strategies.
Their research identified that those athletes who are lower in openness to new experience were
more likely to cope through the avoidance of problems and stressors, and that higher-level
athletes were likely to be more conscientious, compassionate and emotionally stable (Allen et
al., 2011). Increased neuroticism appears to have a negative effect on coping strategies,
possibly as a result of exaggerating the size of the threat posed by a situation or event (Kaiseler

46
et al., 2012). The advantage of increased extraversion may be as a result of increased effort,
and seeking out, and engaging with support, whilst in contrast, agreeableness is associated with
lower levels of active coping (Kaiseler et al., 2012). Overall, research implies that the Big 5
personality dimensions influence both appraisal and coping: whilst neuroticism was associated
with the selection of less successful coping strategies, conscientiousness, openness,
extraversion and agreeableness were linked to more adaptive, effective coping strategies
(Kaiseler et al., 2012). Furthermore, the increased extraversion, conscientiousness, and reduced
neuroticism scores are likely to benefit athletes, and increase their participation in sport,
through the preparation and early involvement in sport (Nia & Besherat, 2010). Horsburgh et
al. (2009) performed research into the factors that contribute to individual differences in
behavioural traits and identified a 50% heritability of each of the 5 personality traits, openness,
extraversion, neuroticism, agreeableness and conscientiousness, along with numerous
correlations with the dimensions of mental toughness.
2.2.3.3. Applying the Big 5 Factor Model of Personality to Endurance Sports
Though research into endurance sports, using the Big 5 personality dimensions, is limited and
findings inconsistent, analysis of personality using multiple instruments, has suggested that
ultra-marathoners are identifiable by their personality traits (Roebuck et al., 2018). A review
of literature performed by Roebuck et al. (2018) identified nine studies that explored the
personality traits of ultra-marathoners. Only four of the studies had been published in the last
twenty years, and none used the Big 5 personality questionnaire: Krouse et al, (2011) focussed
on motivation and goal orientation; Hashimoto, Hagura, Kuriyama, and Nishiyamai (2006)
used the Myers-Briggs Type Indicator (MBTI) to identify that ultra-marathoners are more
introverted; and Martinez and Scott (2016) identified ultra-marathoners as being more neurotic,
47
using a ten item personality measure. The fourth study, Hughes et al. (2003), investigated a
group of ultra-marathoners participating in a single event, to identify their personality profiles,
in contrast to a normative population. Consistent with previous research, race participants
scored significantly higher in extraversion, along with openness. More recently, a study
including participants in the TransEurope footrace, a 4487k, multi-day event, identified ultra-
marathoners as having a low perception of pain, more self-centred and were less cooperative
(Freund et al., 2013). In contrast, a qualitative study, to explore competition and training
experiences, identified ultra-marathoners as having a willingness to endure pain, whist
highlighting the importance, and reliance on, the ultra-running community to provide practical
advice, camaraderie and encouragement (Simpson et al., 2014).
2.2.3.4. Critical Appraisal
Though further study is warranted, research confirms that identification of personality traits
can predict both long term success and short-term behaviour and can be used to discriminate
between athletes and non-athletes (Allen et al., 2013). However, although personality may be
an influencing contextual factor, little is known regarding its effect on cognitive appraisals,
coping effectiveness during performance in sport, and/or the ability to handle stress without
impact to performance (Allen et al., 2013; Kaiseler et al., 2012). Therefore, further research is
required to extend knowledge of how psychological factors, including personality, contribute
to successful performance in ultra-marathoners.

48
2.3. Physiological Approach to Endurance There has been extensive research into ascertaining the physiological factors that affect human
endurance performance, including maximal oxygen uptake, lactate threshold and running
economy (Barr, Clark, Corbett, & Draper, 2018; Hawley et al., 2014). To date, a large number
of studies have examined the mechanisms that affect and influence performance in aerobic
exercise, however comprehensive studies using ultra-marathoners are limited. Section 2.3
assesses research into key physiological factors that impact aerobic fitness and subsequently
human capacity for endurance.
Aerobic exercise leads to an increased metabolic response that challenges the homeostasis of
the whole body, and can result in disruption to tissues, cells, and organs, alongside changing
an individual’s oxygen uptake and lactate threshold (Caputo & Denadai, 2004; Hawley et al.,
2014). It is widely accepted that endurance training is affected by specificity of both exercise
mode and activated muscle mass and leads to a number of physiological changes and health
benefits, including aerobic and cardiovascular fitness. However, research has postulated that
aerobic training may have an upper limit to maximise health benefits, but confirms that
physically active men and women, compared with the inactive, have a 30% lower risk of death
(Schnohr, O’Keefe, Marott, Lange, & Jensen, 2015).

49
2.3.1. Aerobic Capacity – V̇O2max This section provides an overview of some of the key factors that affect maximal oxygen uptake,
its measurement, and its potential impact on performance in ultra-endurance athletes.
2.3.1.1. Definition and Theoretical Background
Maximum oxygen uptake (V̇O2max) is a measure, during maximal exercise, of the highest rate
that oxygen is consumed by the mitochondria during oxidative phosphorylation; the metabolic
pathway by which enzymes are used by cells to oxidise nutrients and subsequently release
energy in the form of adenonsine triphosphate (ATP) (Bassett & Howley, 2000; Schnohr et al.,
2015). V̇O2max is widely accepted as an indicative measure of aerobic fitness and is used to both
assess aerobic fitness, and as a guide for training sessions (Mazzoleni et al., 2017; Midgley,
Mcnaughton & Wilkinson, 2006).
There has been a long-term interest in deciphering the factors and mechanisms that limit V̇O2max,
alongside determining its role in endurance performance. The classical view of maximal
oxygen uptake originally put forward by A.V Hill et al. (1923, 1924), proposes that V̇O2max is
limited by the cardiorespiratory systems’ ability to deliver O2 to working skeletal muscles.
According to Hill’s model, there is a physiological upper limit to maximal oxygen uptake,
beyond which it does not continue to rise (Faude, Kindermann & Meyer, 2009). Consequently,
a runner’s performance may be restricted as a result of either a low oxygen uptake, a reduced
upper limit of maximal oxygen uptake, or increased oxygen requirements (Bassett & Howley,
2000). The Central Governor Model (Noakes, 2004, 2007), and the Psychobiological model
(Marcora, 2008; Marcora et al., 2009; Marcora & Staiano, 2010), in Section 2.4, refute this
viewpoint, and propose that the brain per se plays a major contributing factor.

50
Previous work has outlined the key components and systems that affect maximal oxygen
uptake, including, to varying degrees (see Figure 2.3): an increased maximal stroke volume
leading to an increased blood flow; the delivery of O2 by the pulmonary and cardiovascular
system to the contracting skeletal muscles; the capacity of the blood to carry oxygen in the
haemoglobin; the density of capillaries in muscle fibre; the quantity of the motor units recruited
by the central nervous system; and the capacity of the muscles engaged to consume the oxygen
(Bassett & Howley, 2000; Hawley et al., 2014).
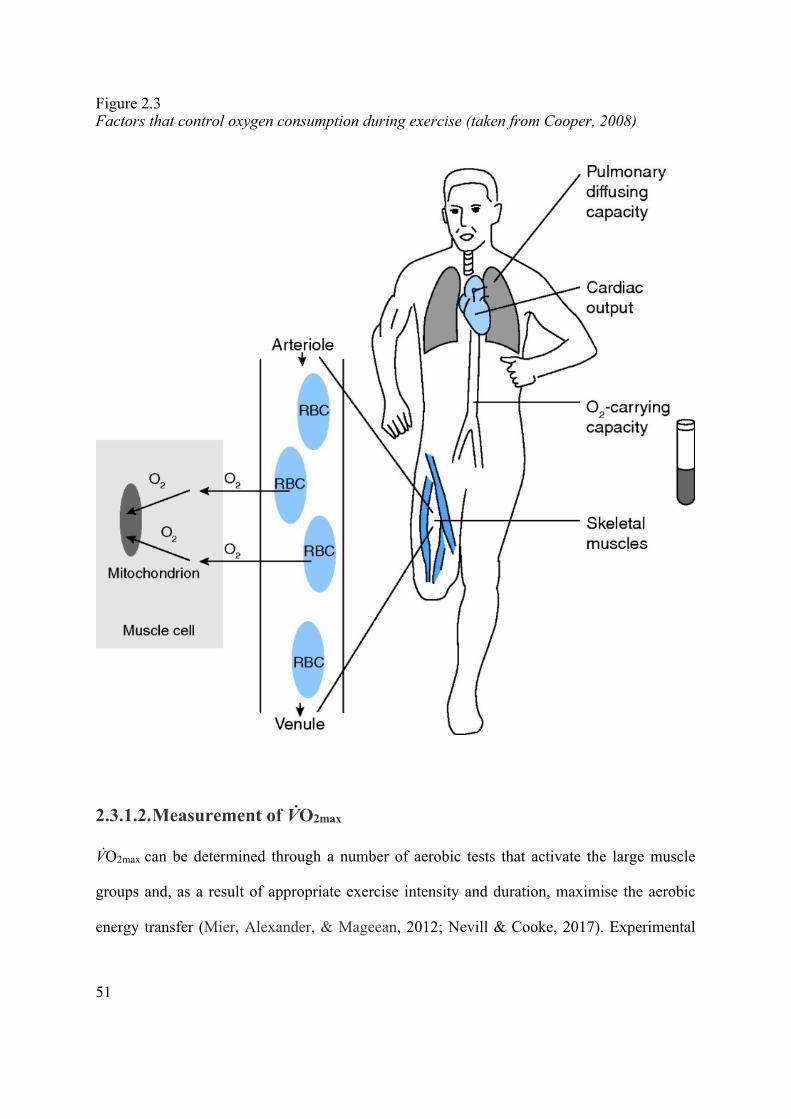
51
Figure 2.3 Factors that control oxygen consumption during exercise (taken from Cooper, 2008)
2.3.1.2. Measurement of V̇O2max V̇O2max can be determined through a number of aerobic tests that activate the large muscle
groups and, as a result of appropriate exercise intensity and duration, maximise the aerobic
energy transfer (Mier, Alexander, & Mageean, 2012; Nevill & Cooke, 2017). Experimental

52
testing to measure maximal aerobic uptake, usually rely on a continuous, supramaximal
exercise challenge, often on a treadmill or a stationary cycle, involving increasing increments
of difficultly, or load, until the participant reaches volitional exhaustion (Evans, Ferrar, Smith,
Parfitt, & Eston, 2015; Mier et al., 2012). V̇O2max scores usually differ depending on the mode
of exercise, and the muscle fibres and groups recruited, with the highest V̇O2 scores habitually
achieved when performed on a treadmill. The test protocol must be of sufficient duration to
reach a V̇O2 plateau, whilst increasing the load sufficiently quickly to ensure other mechanisms
of fatigue do not cause the participant to stop the test prior to reaching V̇O2max (Mier et al.,
2012). To achieve V̇O2max the participant must (a) reach a point where their V̇O2 becomes linear,
despite an increasing work rate, (b) achieve a heart rate within 10 beats of their maximum, (c)
reach a respiratory exchange ratio greater than 1.15, and (d) a rating of perceived exertion
above 17 on the Borg scale (Haff & Dumke 2012; Mier et al., 2012). Additional secondary
criteria, including blood lactate concentration, have been established, but concerns have been
raised regarding their reliability (Mier et al., 2012). Where a test is concluded without any of
the preceding conditions met, the term peak oxygen consumption (V̇O2peak) is adopted and could
be due to motivation or muscular factors (Mier et al., 2012).
Further detail of the protocol used in this programme of research to measure V̇O2max/peak is
given in Section 3.
53
2.3.1.3. Critical Appraisal of V̇O2max A large body of related research in sports science, has confirmed the value of quantifying
maximal aerobic uptake, with a significant variation in V̇O2max existing between the aerobically
trained and untrained (Schnohr et al., 2015). However, concerns have been raised regarding
the efficacy of existing maximal oxygen uptake test protocols, analysis of the data, and the lack
of consistency and accuracy of the equations used in the calculations (Evans et al., 2015).
Tsigilis (2005) suggests that the psychology of the participant is likely to impact the measure
of maximal oxygen uptake. Data from shuttle tests, a field-based assessment of maximal
oxygen uptake, have identified that perceived competence, an important antecedent of intrinsic
motivation, was a significant predictor of V̇O2max. Reaching a plateau in oxygen consumption
requires a high level of anaerobic energy output and dealing with the accompanying discomfort
may prove difficult for an untrained individual, relying heavily on motivational factors (Evans
et al., 2015; Mier et al., 2012).
Despite a plethora of training protocols placing a great deal of reliance on the outcome of
V̇O2max tests, doubts have been raised regarding the measures ability to predict success in
endurance events (Midgley et al., 2006). According to research by Knechtle et al. (2010, 2015)
maximal oxygen uptake was not the principal variable to predict the successful outcome of an
ultra-marathon, but instead reported, age, anthropometric characteristics, such as body mass
index, limb circumference, and training characteristics including running speed, training
volume and prior race experience.
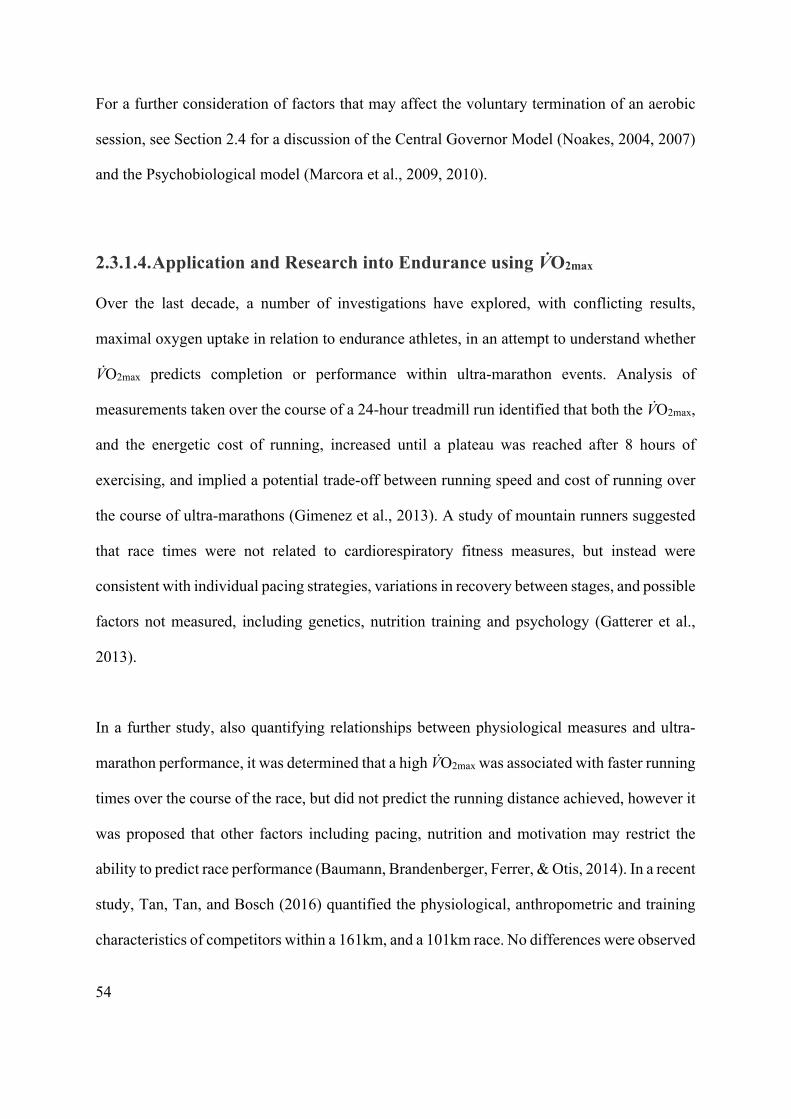
54
For a further consideration of factors that may affect the voluntary termination of an aerobic
session, see Section 2.4 for a discussion of the Central Governor Model (Noakes, 2004, 2007)
and the Psychobiological model (Marcora et al., 2009, 2010).
2.3.1.4. Application and Research into Endurance using V̇O2max Over the last decade, a number of investigations have explored, with conflicting results,
maximal oxygen uptake in relation to endurance athletes, in an attempt to understand whether
V̇O2max predicts completion or performance within ultra-marathon events. Analysis of
measurements taken over the course of a 24-hour treadmill run identified that both the V̇O2max,
and the energetic cost of running, increased until a plateau was reached after 8 hours of
exercising, and implied a potential trade-off between running speed and cost of running over
the course of ultra-marathons (Gimenez et al., 2013). A study of mountain runners suggested
that race times were not related to cardiorespiratory fitness measures, but instead were
consistent with individual pacing strategies, variations in recovery between stages, and possible
factors not measured, including genetics, nutrition training and psychology (Gatterer et al.,
2013).
In a further study, also quantifying relationships between physiological measures and ultra-
marathon performance, it was determined that a high V̇O2max was associated with faster running
times over the course of the race, but did not predict the running distance achieved, however it
was proposed that other factors including pacing, nutrition and motivation may restrict the
ability to predict race performance (Baumann, Brandenberger, Ferrer, & Otis, 2014). In a recent
study, Tan, Tan, and Bosch (2016) quantified the physiological, anthropometric and training
characteristics of competitors within a 161km, and a 101km race. No differences were observed
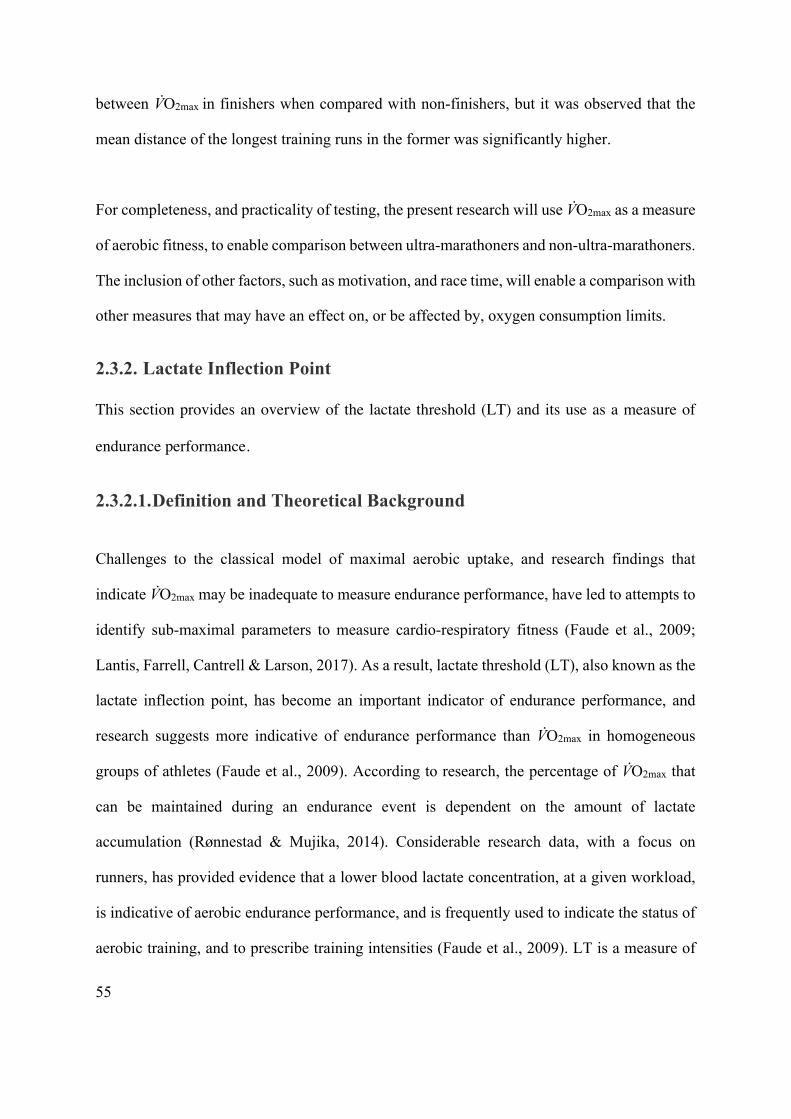
55
between V̇O2max in finishers when compared with non-finishers, but it was observed that the
mean distance of the longest training runs in the former was significantly higher.
For completeness, and practicality of testing, the present research will use V̇O2max as a measure
of aerobic fitness, to enable comparison between ultra-marathoners and non-ultra-marathoners.
The inclusion of other factors, such as motivation, and race time, will enable a comparison with
other measures that may have an effect on, or be affected by, oxygen consumption limits.
2.3.2. Lactate Inflection Point This section provides an overview of the lactate threshold (LT) and its use as a measure of
endurance performance.
2.3.2.1. Definition and Theoretical Background
Challenges to the classical model of maximal aerobic uptake, and research findings that
indicate V̇O2max may be inadequate to measure endurance performance, have led to attempts to
identify sub-maximal parameters to measure cardio-respiratory fitness (Faude et al., 2009;
Lantis, Farrell, Cantrell & Larson, 2017). As a result, lactate threshold (LT), also known as the
lactate inflection point, has become an important indicator of endurance performance, and
research suggests more indicative of endurance performance than V̇O2max in homogeneous
groups of athletes (Faude et al., 2009). According to research, the percentage of V̇O2max that
can be maintained during an endurance event is dependent on the amount of lactate
accumulation (Rønnestad & Mujika, 2014). Considerable research data, with a focus on
runners, has provided evidence that a lower blood lactate concentration, at a given workload,
is indicative of aerobic endurance performance, and is frequently used to indicate the status of
aerobic training, and to prescribe training intensities (Faude et al., 2009). LT is a measure of

56
the level of power output, V̇O2 or energy expenditure, where tissue hypoxia triggers an
imbalance between the formation, and the clearance, of lactate, leading to an increase in its
concentration in blood. As a result, lactate during low intensity exercise rarely exceed
sedentary levels, whilst excess lactate provides evidence of anaerobic metabolism (Brooks,
Fahey, & White, 2005).
Originally it was understood that lactate was a waste product resulting from glycolysis; the
process that converts glycogen into pyruvate, prior to being converted into Acetyl CoA and
subsequently entering the Krebs cycle to release energy (Brooks et al., 2005; Faude et al., 2009).
However, it is currently known that the process of lactate kinetics is ongoing, whether the body
is resting or active, and is closely linked to metabolic rate rather than oxygen availability
(Brooks et al., 2005). During intense exercise, lactate accumulates as a result of lactic acid
production being greater than removal (Brooks et al., 2005). As exercise intensity increases,
blood lactate concentration become higher, due to a number of factors, including: the extra
demand for ATP not being met aerobically by mitochondria; and an increased reliance on fast-
twitch fibres, which have less mitochondria and produce more lactate (Brooks, 1986; Brooks
et al., 2005; Robergs, Ghiasvand, & Parker, 2009).

57
Figure 2.4 Physiological Map (taken from Melzer, 2011)
Previously published work indicates that as aerobic exercise increases (see Figure 2.4), blood
lactate exceeds that of normal variation, and that multiple factors are likely to contribute to the
measurement of LT, including, depleted glycogen stores, muscle fibre composition, and
capillary and mitochondrial size and density (Faude et al., 2009). As measurement of LT is
mode, or task specific, due to the activation of differing muscle mass, values will vary
depending whether the protocol dictates using a static cycle or a treadmill. LT will be met at a
lower % of the V̇O2max in the untrained, and indeed aerobic training has been shown to impact
LT, even when there is little, or no, change to V̇O2max.

58
2.3.2.2. Measurement of Lactate Inflection Point The lactate threshold has become a standard measure for predicting aerobic capacity and
endurance performance, however there are other measures, including the maximal lactate
steady state (MLSS) and the onset of blood lactate accumulation (OBLA). MLSS is the
maximum power output that can be maintained without blood lactate accumulation and it has
been proposed as a reliable marker of endurance performance (Czuba et al., 2009; Faude et al.,
2009). OBLA is at a higher exercise intensity than the lactate threshold and is an indication of
the point at which lactate production exceeds the rate of clearance (Czuba et al., 2009). A close
relationship has been observed between LT, MLSS, and OBLA, however LT is widely used,
and accepted as an appropriate measure for predicting aerobic endurance (Czuba et al., 2009;
Faude et al., 2009;).
2.3.2.3. Application and Research into Lactate Inflection Point LT is widely used to determine the effects of multiple modes of training in endurance sports,
including running and cycling. Research by Rønnestad and Mujika (2013), used measurements
of LT, along with other physiological measures, to identify and report on the effects of both
strength, and aerobic training on endurance performance. Basset and Howley (2000) identified
the speed of running at LT, as the best measure for predicting endurance running performance,
whilst Faude et al. (2009) identified the anaerobic-aerobic transition as being integral for
assessing endurance performance.
Lactate threshold is a reliable and consistent measure, which can be used to predict endurance
capacity, and is utilised as part of this programme of research to compare both between ultra-
marathoners and non-ultra-marathoners, and within the ultra-marathoner group. Consequently,

59
the inclusion of psychological measures within the present research makes it viable to compare
with lactate accumulation measures and offer an insight into endurance performance.
2.3.3. Running Economy This section provides an overview of running economy (RE), the factors that affect its value,
and the potential impact it has on endurance performance.
2.3.3.1. Definition and Theoretical Background A growing body of literature investigating the multiple factors involved in sporting success in
endurance racing has postulated that performance in events is a product of both maximal
sustained power output and, the energy cost of maintaining speed (Bassett & Howley, 2000;
Rønnestad, & Mujika, 2014; Vernillo, Millet, & Millet, 2017). Research has identified three
physiological attributes that contribute to successful performance in distance running: (a) a
high cardiac output and oxygen delivery to working muscles, identified as the V̇O2max, that
results in a large aerobic adenosine triphosphate (ATP) regeneration capacity; (b) the fractional
utilization of V̇O2max, or the ability to maintain a high percentage of V̇O2max for the longest
time possible; and (c) the ability to move economically, known as the running economy (RE)
(Barnes & Kilding, 2014; Joyner & Cole, 2008). Whilst V̇O2max and the fractional utilisation of
V̇O2max, are well researched, RE has received only limited attention (Barnes & Kilding, 2014).
Research into ultra-marathoners has defined RE as a measure of energy demanded as a product
of the interaction between both biomechanical and physiological factors, expressed as the
submaximal oxygen uptake (V̇O2), to run at a given running velocity (Bassett & Howley, 2000).
RE explains, in part, the performance differences between athletes of comparable V̇O2max, and
may provide insight into study findings confirming that the highest V̇O2max does not necessarily
identify the athlete most likely to produce the best performances (Bassett & Howley, 2000;

60
Rønnestad, & Mujika, 2014). However according to a review by Joyner and Cole (2008) there
are no longitudinal studies on endurance athletes that confirm the trainability of running
economy over several years. Trained, as opposed to untrained, runners can however be
recognised through an improved RE: a likely response to a number of adaptations, including
oxidative muscle capacity, biomechanical changes and haematological changes, resulting in
increased red cell mass (Barnes & Kilding, 2014). However, studies into acute and chronic
interventions have reported that uphill, and high intensity running on flat-ground, alongside
plyometric and strength training, result in increased running economy (Barnes & Kilding,
2014; Rønnestad, & Mujika, 2014). Exercise training appears to increase endurance
performance partly as a result of improvements to neuromuscular activity, increased musculo-
tendinous stiffness, and the conversions of some fast-twitch fibres to more fatigue-resistance
fibres (Rønnestad, & Mujika, 2014; Barnes & Kilding, 2014). Analysis of research suggest
that positive changes to running economy reflect improved oxygen consumption at
submaximal exercise intensity levels and are likely to be accompanied by an increased long-
term endurance, brought about by delaying fatigue, and enhanced anaerobic capacity and
maximal speed (Rønnestad, & Mujika, 2014). However, Joyner and Cole (2008) offer a word
of caution against explanations resulting purely from scientific reductionism and impress the
importance of the role of motivation and sociological factors. Running economy is therefore
likely to be one of many interrelated psychophysiological factors and must not be considered
in isolation.
2.3.3.2. Measurement of Running Economy Concept RE is usually represented as the submaximal oxygen (V̇O2) at a pre-defined running velocity,
typically 16km per hour (Barnes & Kilding, 2014).
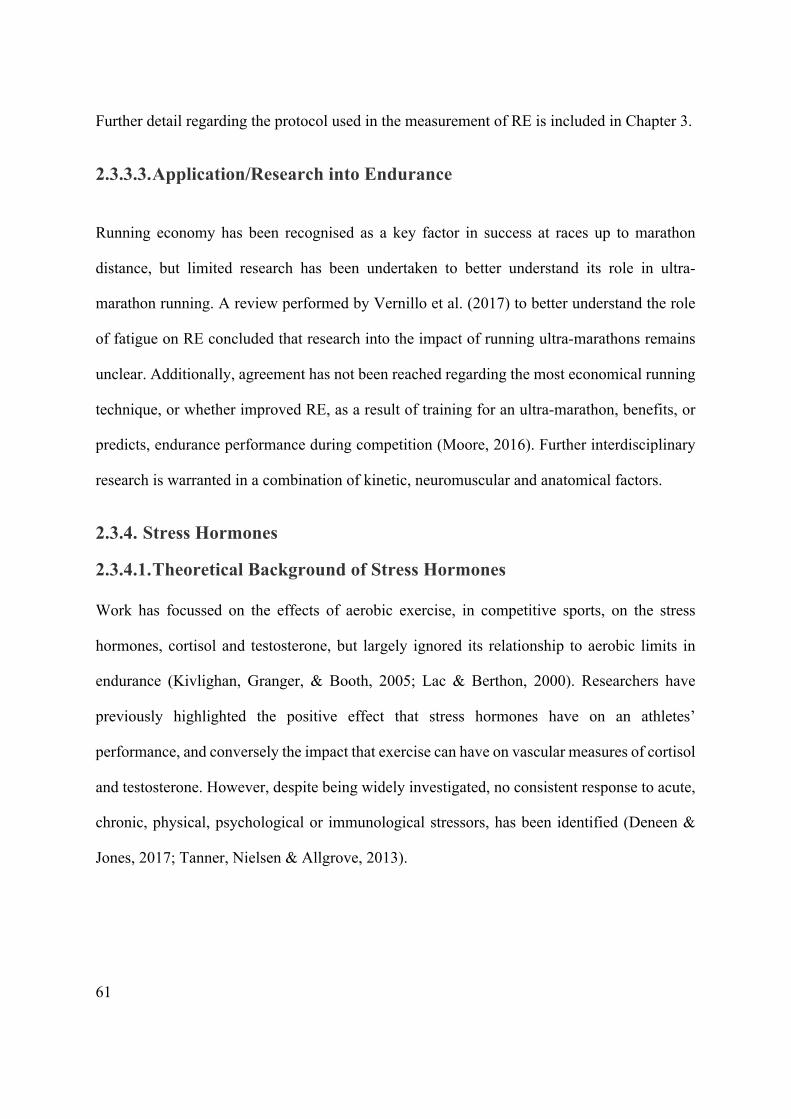
61
Further detail regarding the protocol used in the measurement of RE is included in Chapter 3.
2.3.3.3. Application/Research into Endurance Running economy has been recognised as a key factor in success at races up to marathon
distance, but limited research has been undertaken to better understand its role in ultra-
marathon running. A review performed by Vernillo et al. (2017) to better understand the role
of fatigue on RE concluded that research into the impact of running ultra-marathons remains
unclear. Additionally, agreement has not been reached regarding the most economical running
technique, or whether improved RE, as a result of training for an ultra-marathon, benefits, or
predicts, endurance performance during competition (Moore, 2016). Further interdisciplinary
research is warranted in a combination of kinetic, neuromuscular and anatomical factors.
2.3.4. Stress Hormones
2.3.4.1. Theoretical Background of Stress Hormones Work has focussed on the effects of aerobic exercise, in competitive sports, on the stress
hormones, cortisol and testosterone, but largely ignored its relationship to aerobic limits in
endurance (Kivlighan, Granger, & Booth, 2005; Lac & Berthon, 2000). Researchers have
previously highlighted the positive effect that stress hormones have on an athletes’
performance, and conversely the impact that exercise can have on vascular measures of cortisol
and testosterone. However, despite being widely investigated, no consistent response to acute,
chronic, physical, psychological or immunological stressors, has been identified (Deneen &
Jones, 2017; Tanner, Nielsen & Allgrove, 2013).

62
It is however, widely accepted that high intensity exercise impacts the gluco-corticoids, and
catecholamine biochemical pathways. Gluco-corticoids are corticosteroids involved in the
metabolism of carbohydrates, proteins and fats, through lipolysis, and have anti-inflammatory
benefits, whilst catecholamine biochemical pathways, cause general physiological changes that
prepare the body for exercise (Deneen & Jones, 2017). In response to physiological stress,
cortisol stimulates gluconeogenesis to initiate glucose maintenance (see Figure 2.5). Both
psychological and physiological stressors, can be a factor in the activation of the
Hypothalamic-Pituitary-Adrenal axis (HPA), and the subsequent release of the stress hormone,
cortisol. This hormone is the primary glucocorticoid present throughout the body, and once
released, can directly affect physiological functioning (Deneen & Jones, 2017). Typically,
cortisol continues to increase in response to elevated anxiety, exercise intensity, and duration
(Hill et al., 2008; Lac & Berthon, 2000).
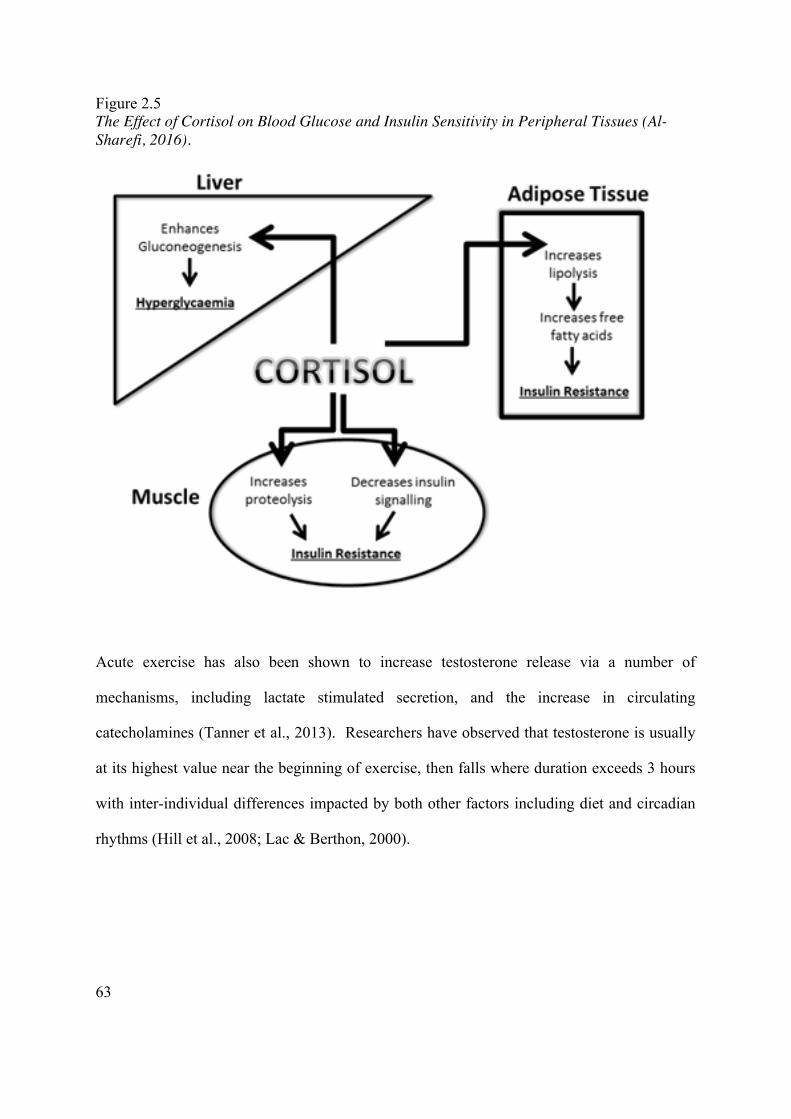
63
Figure 2.5 The Effect of Cortisol on Blood Glucose and Insulin Sensitivity in Peripheral Tissues (Al-Sharefi, 2016).
Acute exercise has also been shown to increase testosterone release via a number of
mechanisms, including lactate stimulated secretion, and the increase in circulating
catecholamines (Tanner et al., 2013). Researchers have observed that testosterone is usually
at its highest value near the beginning of exercise, then falls where duration exceeds 3 hours
with inter-individual differences impacted by both other factors including diet and circadian
rhythms (Hill et al., 2008; Lac & Berthon, 2000).
64
2.3.4.2. Measurement of Stress Hormones Whilst cortisol and testosterone concentrations can be quantified in both saliva and blood,
salivary samples provide additional, practical benefits by facilitating stress free, non-invasive
sampling and subsequent assay analysis, before, during and after competition (Kivlighan et al.,
2005; Tanner et al., 2013).
2.3.4.3. Application and Research into Endurance and Stress Hormones Although extensive research has been carried out on the effect of exercise on stress hormones,
results remain inconclusive. A recent study to investigate the effect of long duration racing on
the production of cortisol, identified an initial increase, followed by a subsequent reduction
over the course of the event (Deneen & Jones, 2017). Continued activation of the stress
response can have a negative effect; therefore, a reduction may result from an adaption to
prolonged aerobic training. Difficulties have arisen in stress hormone measurement resulting
from hormonal variances in response to the time of day, variations in mode of exercise, and
the training status of the athlete (Kivlighan et al., 2005; Tanner et al., 2013).
Hill et al. (2008) determined saliva cortisol in athletes at three exercise intensities. Findings
demonstrate that only exercise performed at a sufficiently high intensity, 76% of V̇O2max, and
a long duration, greater than 59 minutes, resulted in a significant increase in cortisol. Whilst,
in contrast, biochemistry measured before and after an international rugby match, showed no
significant changes in testosterone and cortisol taken both on the morning of the match and 24
hours post event (Crewther et al., 2013).

65
Further research is warranted to better understand changes in cortisol and testosterone in
response to laboratory-based testing, participation in endurance events, and its effect on
behaviour including heightened voluntary effort, and choice of workloads (Tanner et al., 2013).
This programme of research will also compare changes in stress hormones and other
physiological measures, along with psychological factors, to form an improved understanding
of the predictors of success in ultra-marathoners.
66
2.3.5. Genetics This section provides a brief overview of key research performed in the expanding field of
genetics and the impact of the human genome on sporting success.
2.3.5.1. Theoretical Background of Genetics Approximately 21,000 protein-coding genes within our genome define us as human and are
subject to variation as a result of DNA replication, or changes in nucleotide base-pairs
(Puthucheary et al., 2011; Willyard, 2018). Darwin’s Theory of Natural Selection states that
humans with traits most appropriate to their environment, are more likely to reproduce, and
subsequently pass on genes (Darwin, 1859; Lippi, Longo, & Maffuli, 2009). Such traits, or
phenotypes, result from a complex interaction between our genotype and stimuli from the
environment, many of which will impact performance in sport, such as height, muscle strength,
and heart and lung capacity (Puthucheary et al., 2011).
Several lines of research over the last decade have led to a growing body of knowledge
surrounding the genetic determinants of endurance performance. Findings indicate that an
individual’s genotype, along with appropriate training, nutrition, and other environmental
factors, determine an athlete’s phenotype, impacting strength, endurance, potential for injury,
and psychological functioning (Carpenter, Garcia & Lum, 2011; Eichhammer, Sand,
Stoertebecker, Langguth, 2005; Ghosh & Mahajan, 2016; Lippi et al., 2009). A large body of
research has been conducted to explore the genetic influence on both physiological and
psychological capacities to perform well in sport, with the HERITAGE family study
identifying 29 genes that predicted approximately 50% of the aerobic capacity gains, in
response to exercise training (Timmons, 2011).

67
2.3.5.2. Research into Genetics Impact on Endurance
According to published work, there is a plethora of genes identified that can impact human
endurance performance. Two of the most commonly tested with regards sporting performance
include the actinin alpha 3 ACTN3 and the angiotensin-converting enzyme ACE gene, the
former with regards power and strength in sports, and the latter with regards endurance
(Castilha et al., 2018). The polymorphism of the angiotensin-converting enzyme (ACE) gene
became one of the first genes identified, and subsequently received a large amount of attention
(Bouchard et al., 1995; Puthucheary et al., 2011). Where a polymorphism is a genetic marker
representing a molecular characteristic that differs between individuals as identified by two or
more alternative forms, or alleles of a gene that occur in the same place in the chromosome
(Castilha et al., 2018). Montgomery, Marshall, Hemingway, and Myerson (1998) identified the
insertion allele of the gene encoding angiotensin-converting enzyme (ACE) as being associated
with endurance performance amongst both mountaineer and elite endurance athletes, whilst
there is evidence that the deletion allele is associated with strength, and muscle growth.
However, in subsequent research, with military recruits performing a repetitive elbow flexion
exercise, success was ascertained as independent of the ACE gene polymorphism, prior to, but
not following, training (Puthucheary et al., 2011). Evidence therefore identifies that the
presence of the gene alone does not indicate superior performance but rather that it must be
coupled with appropriate training for any beneficial effect to be present. Despite Montgomery
and colleagues work (1998; 2011) the importance of the ACE gene polymorphism on
endurance remains inconclusive and warrants further research. Indeed, Ash et al., (2011)
demonstrated that the genomic analysis of world-class Kenyan and Ethiopian athletes, have
not reported an increased presence of the ACE gene polymorphism when compared to the
general population.

68
Other studies have examined the relationship between the human genome and psychological
factors, including personality. Despite the relatively small body of research concerned with the
genetics underpinning central functioning, analysis indicates that the four subscales of mental
toughness, challenge, control, commitment and confidence (Crust and Clough, 2005) and the
Big 5 personality dimensions, neuroticism, extraversion, agreeableness, conscientiousness, and
openness to experience, may be attributed to both genetic and non-shared environmental
factors (Horsburgh et al., 2009).
Despite challenges in identifying individual genes involved in sporting success, studies have
highlighted a limited number that appear to affect the psychological background impacting
training and competition. Researchers have suggested that the serotonin transporter gene 5HTT
may be linked with the ability to control emotion, and identified an association between the
5HTT polymorphism, neuroticism and stress, in athletes (Lippi et al., 2009; Petito et al., 2016).
The literature also suggests that the brain-derived neurotrophic factor BDNF may impact
perceived effort during aerobic activity; research by Oztasyonar (2017) identified that middle,
and long, distance runners had a higher basal BDNF than sedentary participants and Ulucan
(2016) speculated that, though the effect of BDNF is unclear, it may be one of the target
molecules for successful sporting performance and warrants further investigation. The
dopamine receptor gene (D4DR) appears to affect the dopaminergic system, involved in both
motivation, arousal and risk-taking behaviour (Carpenter et al., 2011; Eichhammer et al.,
2005). Whilst in a study by Çam et al. (2010) of high-risk sports athletes, openness to new
experience scores were significantly different for DRD4 genotypes and highlighted the
importance of future behavioural genetic studies to sport psychology.
69
Though many of the genes involved in endurance are not well understood, researchers have
concluded that heritability has a considerable impact on performance potential, and athletes,
elite or otherwise, may benefit from interventions, including training, injury prevent and
nutrition, individualised according to their genotype.
2.3.5.3. Critical Appraisal
Whilst the ACE gene has received considerable attention with regards endurance, results have
been inconsistent and further testing is warranted (Castilha, et al., 2018). In contrast, a lack of
research exists comparing the individual genes, believed to impact psychological factors in
endurance success, as outlined (BDNF, 5HTT, D4DR). This programme of research uses
quantitative measures to identify relationships and enhance understanding of the relationship
between genetics and endurance performance.
70
2.4. Psychophysiological Models of Endurance It is widely acknowledged that humans have a large capacity of psychological resources to deal
with challenges at many levels, but that it is not always possible to access such resources
deliberately (Weger & Loughnan, 2013). So far, in the current thesis, psychological and
physiological factors that relate to endurance performance of athletes have been described
separately. By doing so, the fullness of the endurance athlete performance experience is
restricted, therefore, Section 2.4 provides an overview of two interdisciplinary models that
have been proposed to integrate the psychological and physiological mechanisms that limit
endurance performance.
2.4.1. Mind over Matter An athletes’ mental state, and the mental strategies they utilise, have been shown to impact
endurance performance (Gucciardi, 2017; Hanson et al., 2015; McCormick et al., 2015).
2.4.2. Central Governor Model According to Noakes (2004; 2007), the widely held view that exercise performance is limited
by chemical factors in the muscles is incorrect, and the muscular, peripheral fatigue model
used to explain exercise tolerance, requires a re-think. Such peripheral fatigue is postulated to
be in response to a failure of the heart, during maximal exercise, to supply sufficient oxygen to
the muscles to avoid reaching skeletal muscle anaerobiosis, causing the accumulation of lactic
acid, resulting in muscle fatigue (Noakes, 2004; 2007). Consequently, this peripheral, or
classical model contends that homeostasis is relatively constant but during extreme aerobic
exercise there is an inability to anticipate, and take the necessary actions to avoid, catastrophic
metabolic failure. As a result, the peripheral model does not adequately explain the frequent
71
ability of athletes to increase pace, near the end of competition, despite all available muscles
having already been recruited and fatigued (Noakes, 2007, 2012).
In response, Noakes (2004) proposed the Central Governor Model (CGM), whereby sensory
feedback of metabolites, the intermediate products of metabolic reactions to the brain, or spinal
cord, actively regulate the recruitment of an appropriate numbers of muscle fibres to ensure
exercise is completed safely. CGM predicts such control systems manage the number of motor
units activated, to ensure homeostasis, irrespective of either exercise intensity or duration, and
that the perception of fatigue is generated by the brain to ensure increasing discomfort causes
exercise to cease in advance of homeostasis failure. According to the CGM model, during a
race, a subconscious element of the athlete’s brain sets the pace, based on the anticipation of
the duration, and intensity of the event (Noakes, 2004). CGM therefore predicts marathon
performance is set by the subconscious brain, to ensure the athlete makes it to the finish line,
whilst retaining physiological homeostasis, and completes the distance with a degree of
physiological reserve (Noakes, 2007). According to Noakes (2012) the pacing strategy of an
athlete is the outcome of a comparison between the actual sensations of fatigue, a conscious
epiphenomenon arising from the interpreting subconscious regulatory processes in the brain,
interpreted as the rating of perceived exertion (RPE), and the expected level of fatigue, see
Figure 2.6. Researchers suggest that the RPE may be set early on during exercise, as part of a
feedforward control mechanism, provides the link between the physiological parameters
impacted by exercise and the subsequent behaviours to maintain homeostasis, and is predictive
of the duration of exercise to exhaustion (Crewe et al., 2008; Noakes, 2007).

72
A recent paper by Robergs (2017) has criticised the CGM, citing a lack of evidence, and
insufficient provision of a precise and clear theoretical content to enable researchers to develop
research methods and questions to support falsification. Whilst St Clair Gibson, Swart and
Tucker (2017) propose the Integrative Governor Theory replacing the concept of a central
governor in regulating activity with dynamic negative activity feedback as the general
operational controller and homeostatic principles that underpin psychological and
physiological drives and requirements. Furthermore, they suggest that research has been
limited by a focus on central versus peripheral control mechanism models, and instead exercise
performance is a result of ‘weighting’ psychological and physiological homeostatic drives (St
Clair Gibson et al., 2017).
Figure 2.6 - Relation between the Teleoanticipatory Governor Centre in the Brain and Perceived Exertion During Exercise (Lambert, Gibson, & Noakes, 2005).

73
2.4.3. Psychobiological Model Marcora (2008) has also challenged both the popular view that the length of aerobic exercise
is limited by peripheral, or muscle fatigue, and furthermore the need for a central governor to
deter the conscious brain through increased RPE, and a subconscious element that controls
maximal neural recruitment of locomotor muscles, for a comparison see Figure 2.7 (Marcora,
2008).
According to the Psychobiological Model, which integrates both psychology and physiology,
exhaustion, and disengagement from the task, occurs when either the maximum effort the
individual is prepared to exert is reached, or perceived maximal effort is achieved, and
continuation impossible (Marcora, 2008). In addition, mental fatigue, rather than
cardiovascular, or muscular mechanisms, limits exercise tolerance by increasing the RPE
leading to a subsequent reduction in self-paced endurance performance (Marcora et al., 2009;
Pageaux, Lepers, Dietz & Marcora, 2014). Research findings report inhibitory tasks, that
mentally fatigue participants, such as performing a stroop test (a measure of attention), in
advance of endurance activities, increase RPE leading to early disengagement from physically
challenging tasks (Marcora et al., 2009; Pageaux et al., 2014). McCormick et al. (2015) also
concluded that in response to findings that mental fatigue limit endurance performance,
psychological skills training is of benefit.

74
Figure 2.7 - The Central Governor (a) and the Psychological-motivational (b) Models of Exercise Performance taken from Marcora, (2008)
75
2.4.4. Implications for Research Whilst both the CGM and the Psychobiological Model provide an integrated perspective,
including psychological and physiological factors involved in endurance performance, the
impact on perceived exertion, and its potential to limit aerobic activities, remains unclear and
warrants further research exploration.
The current research programme quantitatively measures factors that may both impact
endurance success, and interact with the perception of effort, including mental toughness,
motivation, personality, running economy, stress hormones, lactate, heart rate, along with
exercise intensity and duration. However, it is beyond the scope of this thesis, to directly test
the validity of either the Central Governor Model, or the Psychobiological Model, and from
the literature it remains unclear the measures required to adequately define, or distinguish
between the two (Clough et al., 2002; Crewe et al., 2008; Eston, 2012; Hutchinson &
Tenenbaum, 2006).

76
2.5. Summary and Aims of Thesis Researchers have identified that athletic performance is likely to be underpinned by both
psychological and physiological factors (Gucciardi, 2017; Marcora & Staiano, 2010; Mier et
al., 2012). According to the literature: (a) mental toughness is an important, multidimensional,
psychological construct impacting performance in sport (Gucciardi et al., 2016; Vaughan et al.,
2017); (b) motivation energises and directs our sporting behaviour (Ryan & Deci, 2017); and
(c), whilst research findings are inconclusive, personality dimensions appear to identify top
performing athletes (Freund et al., 2013). However, there is a lack of research exploring the
relationships between these psychological factors and endurance performance markers,
including maximum oxygen uptake, lactate threshold and running economy, in ultra-
marathoners.
Consequently, the aim of the current programme of research, is to provide an integrated
understanding of the factors involved in endurance through quantifying, and comparing,
psychophysiological factors. Psychological factors include mental toughness, personality and
motivation, and physiological factors, include V̇O2max scores, pain tolerance and threshold,
stress hormone, lactate threshold, running economy, and selected genes, that (a) affect success
in the ultra-marathoner, and (b) affect the limits of aerobic fitness. Indeed, according to Mauger
(2013) exercise induced pain may inform the conscious decision whether to increase or
decrease effort and contribute to fatigue during exercise performance.
The measures and research design detailed in Section 3 were based on the above literature
review to ensure an interdisciplinary view of factors previously identified, or potentially viable,
affecting successful endurance performance. These psychological and physiological factors

77
were subsequently measured in both competition, and controlled laboratory conditions, in non-
elite ultra-marathon runners, and non-ultra-marathon runners.

78
CHAPTER THREE

79
3. Experimental Design and Methodology
3.1. Overall Experimental Design Studies 1 and 2 were cross-sectional and aimed to identify differences between ultra-
marathoners and non-ultra-marathoners, whilst Field Study 3 was repeated measures,
measuring race participants at two time points. A quantitative, interdisciplinary approach was
adopted for all studies to identify significant differences between participant groups and
correlations between psychological and physiological factors.
3.2. Participants
3.2.1. Participant Number Sample size was determined based on a power calculation by Montgomery et al. (1988) into
pre and post–training performance in relation to the ACE gene polymorphism. Based on a pre-
training SD = 6.2, and a post training (II genotype) SD = 25.2, d = 1.2, alpha = 95%, p < .05
or 5% level, power at 0.85, a minimum participant number was calculated as 15 (Cohen, 1988).
The sample size estimation was used to inform how many participants were the minimum
number for the MANOVA’s and subsequent ANOVA’s performed in Studies 1 and 2, and the
paired-sample t-tests performed in Study 3 (see section 3.6.1).
3.2.2. Participant Consent and Screening All participants were provided with a written description of the study and consent forms, prior
to taking part. Informed consent was provided in advance of testing and participants were made
aware of their right to withdraw at any point. Participants completed a “Psychology &
Physiology in Endurance Health Questionnaire v1-0” and the “Psychology & Physiology in
80
Endurance Training Questionnaire v1-0” (See Appendix 8.1), to confirm suitability. Any
participants considered unhealthy, or with known cardiovascular related issues, were excluded
from participating in the study. This included, but was not limited to, suffering from any kind
of illness or infection – such as upper respiratory tract infections, or carrying any form of injury
– such as sprained ankles or broken bones. No inducements were offered in this study.

81
3.3. Psychological Measures
3.3.1. Mental Toughness The Mental Toughness Questionnaire 48 (MTQ48) (Crust & Clough, 2005) was completed by
all participants. Permission for use of the MTQ48 was granted by the authors. The 48-item
instrument, included in Appendix number 8.2.2, is comprised of four subscales measuring
confidence (abilities and interpersonal), commitment, challenge and control (life and
emotional). Each question is answered on a 5-point Likert scale - where 1 is equal to strongly
agree and 5 is equal to strongly disagree. Example questions include rating a number of
statements including “I usually find something to motivate me” and “I generally feel in
control”. The scale is considered to have sufficient internal reliability: Cronbach’s alpha for
individual subscales range from 0.71-0.79, mental toughness 0.89 (Crust & Clough, 2005).
As there have been some concerns regarding the conceptualisation that underpins the content
of the MTQ48, partly due to the question of lack of independent scrutiny of the underlying
factor structure raised by Sheard et al. (2009), the Sports Mental Toughness Questionnaire
(SMTQ) was also completed for Study 1 (See Appendix 8.2.1). The 14-item SMTQ comprises
of three subscales which assess confidence, constancy and control using 14 items and a 5-point
Likert scale. Each question is answered on a 5-point Likert scale - where 1 is equal to strongly
agree and 5 is equal to strongly disagree. SMTQ was discarded for Studies 2 and 3, due to the
high standard deviations and the strong associations with the MTQ48 (in Table 4.1), that
provided confidence in the latter as an instrument.

82
3.3.2. Personality Each participant completed the Big 5 Personality Inventory (Kaiseler et al., 2012). The
inventory consists of 44-items used to measure the five dimensions of personality on a 5-point
rating scale from 1- disagree strongly, to 5 – agree strongly. The dimensions have suitable
internal reliability: Cronbach’s alpha: 0.71 (Openness), 0.77 (Agreeableness), 0.79
(Neuroticism), 0.81 (Conscientiousness), and 0.82 (Extraversion) (Kaiseler et al., 2012).
Example items include rating a number of statements including “I am a person who is
talkative”, “I am a person who tends to find fault in others”, “I am someone who is reserved”.
The Big 5 Personality Inventory questionnaire is freely available for research purposes (See
Appendix 8.2.3).
3.3.3. Motivation – Self-determination Theory The General Causality Orientation Scale (GCOS) was developed as part of the Causality
Orientation Theory, a mini-theory of SDT, to assess the strength of three different orientations
towards the environment and one’s own motivation (Ryan & Deci, 2017). GCOS was utilised
to measure enduring motivational orientation, by testing 36 items, that describe typical, social
or achievement-oriented situations (e.g., job applications, relationships with friends) with
responses indicating either an autonomous, controlled, or impersonal type of motivation.
Examples of the questions asked (see Section 8.2.4) include: “You have been offered a new
position in a company where you have worked for some time. The first question that is likely
to come to mind is: - What if I can't live up to the new responsibility? OR Will I make more at
this position? OR ”I wonder if the work will be interesting”; another question asks “You have
a school-age daughter. On parents' night the teacher tells you that your daughter is doing poorly
and doesn't seem involved in the work. You are likely to: - Talk it over with your daughter to
understand further what the problem is OR Scold her and hope she does better. OR Make sure

83
she does the assignments, because she should be working harder.” Autonomy (Deci & Ryan,
1985) is defined as “A person high in autonomy orientation tends to display greater self-
initiation, seek activities that are interesting and challenging, and take greater responsibility for
his or her own behaviour”, control is defined as ‘Assesses the extent to which a person is
oriented toward being controlled by rewards, deadlines, structures, ego-involvements, and the
directives of others.”, impersonal is defined as ‘The extent to which a person believes that
attaining desired outcomes is beyond his or her control and that achievement is largely a matter
of luck or fate.” .
The SDT GCOS questionnaire is freely available for research purposes. (See Appendix 8.2.4).

84
3.4. Physiological Measurements
3.4.1. Aerobic Fitness - V̇O2max Test All participants performed an incremental exercise test to volitional fatigue on a motorised
treadmill (HP Cosmos Pulsar, Germany), in order to determine maximum oxygen uptake. For
Study 1, a running speed of 12 km/h was utilised throughout the test for all participants, while
after each one-minute interval the treadmill gradient was increased by 1%. For Study 2, the
gradient remained constant whilst the running speed increased by 1 km/hr for all participants,
from 12 km/hr, after each one-minute interval. Oxygen uptake was determined throughout
exercise using an on-line gas analysis system (Cosmed Quark CPET, Italy) whilst heart rate
was measured via a portable short-range telemetry device (Polar, Sweden). In Studies 1 and 2,
for a limited number of participants (9 of the 10 non-ultra-marathoners in Study 1), the ratio of
oxygen inhaled versus CO2 exhaled, known as the Respiratory Exchange Ratio (RER), did not
exceed 1.15 and the predicted maximum heart rate (MHR), based on 220 minus age at time of
test, was not exceeded. The highest V̇O2 (ml/min/kg) value will therefore be referred to as the
V̇O2peak (ml/min/kg) and taken as a record of the participants’ endurance.
3.4.2. Rating of Perceived Exertion Rating of Perceived Exertion (RPE) was recorded as a means to predict aerobic capacity
(Crewe et al., 2008; Eston, 2012). The most widespread method of quantifying the RPE in
order to provide subjective feedback of exercise intensity, is the Borg 6-20 scale (Borg, 1982;
Heath, 1998). RPE integrates both psychological and physiological factors to predict exercise
capacity and appears to predict changes in pace and pacing strategy adopted (Eston, 2012). The
RPE was recorded every minute throughout all exercise testing.
85
3.4.3. Running Economy Running economy (RE) was recorded as the submaximal oxygen (V̇O2) at a pre-defined
running velocity, typically 16km/hr (Barnes & Kilding, 2014), during the incremental exercise
test on a motorised treadmill to measure V̇O2max (Section 3.4.1). As a number of participants,
in the low aerobic group, failed to reach this running velocity on the V̇O2 test, 15km/hr was
chosen as the speed to record oxygen consumption as a means to predict exercise capacity.
3.4.4. Pain Tolerance/Threshold Pain threshold and tolerance was measured using an ice bath (Samuel & Ebenezer, 2013).
Participants were asked to place their non-dominant hand, up to the first wrist crease, into a
crushed-ice slurry at zero degrees centigrade. Pain threshold was the time taken until the
participant first verbalised pain, and pain tolerance was the time taken until the participant
withdrew their hand from the ice. Participants were not informed that there was a 5-minute
time limit on the pain test after which the participant was told to remove their hand as the test
had finished.
3.4.5. Lactate Inflection Point Capillary blood lactate concentration was measured using a portable lactate analyser (Lactate
Pro analyser by Arkray Inc, Kyoto, Japan), that can measure lactate from 0.3ul of blood and
results are available within 15 secs. The participant stepped off the treadmill at 3-minute
intervals, the blood samples were taken, prior to returning to the treadmill and running speed
increased by 1 km/hr. The blood was capillary blood taken using a sterile lancet and deposited
onto a lactate pro strip inserted into the portable analyser.

86
3.4.6. Stress Hormones Salivary, and blood cortisol are tightly correlated in response to acute exercise (Tanner et al.,
2013). Saliva was identified as a convenient means of collecting and quantifying cortisol and
testosterone levels and as a biomarker for physiological stress (Tanner et al., 2013).
Measurement of salivary cortisol and testosterone was taken immediately prior to, and
following, competition as per Crewther et al. (2013), and analysed using Salimetrics, Expanded
Range, High Sensitivity Salivary, Enzyme ELISA 96 well plate immunoassay kits for both
cortisol and testosterone.
Assay was performed following manufacturer’s instructions:
• Cortisol in standards and samples compete with cortisol conjugated to horseradish
peroxidase for the antibody binding sites on a microtiter plate.
• After incubation, unbound components are washed away.
• Bound cortisol enzyme conjugate is measured by the reaction of the horseradish
peroxidase enzyme to the substrate tetramethylbenzidine (TMB). This reaction
produces a blue colour. A yellow colour is formed after stopping the reaction with an
acidic solution.
• The optical density is read on a standard plate reader at 450 nm. The amount of cortisol
enzyme conjugate detected is inversely proportional to the amount of cortisol present,
in the sample.

87
3.5. Blood Extraction and Analysis DNA was extracted from 5 ml blood samples, taken using the single venepuncture method
from a prominent antecubital vein in the participants forearm, and collected into an EDTA
Vacutainer tube as described in Collins et al. (2004). White blood cells were subsequently
extracted and subsequently stored in 1ml of RNA later, and frozen in solution, and later genetic
analysis.
3.5.1. Angiotensin Converting Enzyme (ACE) Gene Quantification DNA was extracted from 4.5 ml of EDTA whole blood extracted from a prominent antecubital
forearm vein. Blood genomic DNA was quantified using a commercially available GenElute
Blood Genomic DNA kit (Sigma Aldrich, USA) as per manufacturer’s instructions. Each
sample was genotyped for the ACE gene allele insertion (I)/deletion (D) polymorphism, using
PCR with gene specific primers (Rigat, Hubert, Corvol & Soubrier, 1992). Primers were
designed that flank the insertion sequence on intron 16 of the ACE gene (sense primer 5’-
CTGGAGACCACTCCATCCTTTCT-3’ and antisense primer 5’-GATGTGGCCATCACA
TTCGTCAGAT-3’). PCR was performed in a 25-µl reaction containing Amplitaq Gold PCR
Mastermix (Applied Biosystems) as per manufacturer’s instructions. All reactions were
performed in a Techne TC-512 gradient cycler. Reaction conditions were as follows, initial
denaturation at 95°C for 5 minutes, followed by 40 cycles of denaturation at 95°C for 30
seconds, annealing at 56°C for 30 seconds, and extension at 72°C for 30 seconds. A final
extension step was employed at 72°C for 7 min before being held at 4°C. The amplified
products were separated by electrophoresis on a 2% agarose/1X TAE (Tris, Acetic acid,
EDTA) gel containing SYBRSafe DNA gel stain (Invitrogen). PCR products were
subsequently visualised using a under UV light and images captured via an InGenius gel

88
documentation system (Syngene). The PCR resulted in the amplification of a 190 bp amplicon
in the absence of the insertion (DD) and a 490 bp amplicon in the presence of the insertion (II).
PCR reactions in which 2 bands were present at 190 bp and 490 bp were classified as (ID)
heterozygotes. Previous studies in which this genotyping technique has been employed, report
misclassification of ID heterozygotes as DD due to preferential amplification of the smaller D
allele. Therefore, in order to prevent mistyping and to verify the DD samples, any sample found
to be DD was subjected to a second round of PCR with an insertion specific primer set (Sense
5’-TGGGACCACAGCGCCCGCCACTAC-3’ and antisense 5’-TCGCCAGCCCTCCCATG
CCCATAA-3’).
3.5.2. Genetic Testing for the 5HTT, BDNF and D4DR Genes Blood samples were taken using the single venepuncture method from the participants forearm
and collected into an EDTA Vacutainer tube as described in Collins et al. (2004). Addition of
Histopaque-1077 (Sigma) allowed for the separation and subsequent isolation of peripheral
blood mononuclear cells (PBMCs) as per manufacturers protocol. PBMCs were stored in
RNAlater (Invitrogen) for downstream processing. RNA was extracted from PBMCs via the
TRIZOL (Invitrogen) method, and this was subsequently quantified via the NanoDrop
Spectrophotometer System (ThermoFisher). All RNA samples were DNase treated, with
DNaseI to remove any contaminating genomic DNA. First-strand cDNA was prepared from
exactly 250 ng of RNA using the Superscript II Reverse Transcriptase kit (Invitrogen), with
200 µg/µl random hexamers used to reverse transcribe the RNA. PCR Primers were designed
in house against published sequences for Ubiquitin C (UBC) (Sense 5’-
CTGGAAGATGGTCGTACCCTG-3' and Antisense 5’-GGTCTTGCCAGTGAGTGTCT-
3’), Brain Derived Neurotrophic Factor (BDNF) (Sense 5’-GGCTATGTGGAGTTGGCATT-
89
3' and Antisense 5’-CTTCGAGGCCTTCGTTTTG-3’), Serotonin Transporter (5HTT) (Sense
5’-ACGGAGTTCTACAGAAGGTTGT-3' and Antisense 5’-ATAGAGTGCCGTGTGTCAT
CT-3’), and Dopamine D4 Receptor (D4DR) (Sense 5’-CTGCCGCTCTTCGTCTACTC -3'
and Antisense 5’-ATGGCGCACAGGTTGAAGAT -3’).
PCR was performed in a 25 µl reaction containing Amplitaq Gold PCR Mastermix (Applied
Biosystems) as per manufacturer’s instructions. All reactions were performed in a Techne TC-
512 gradient cycler. Exactly 2 µl of cDNA was used in each reaction.
The genes were amplified by 32 cycles of 95°C for 30 s, 60°C for 30 s, and 72°C for 20 s and,
finally, an extension step at 72°C for 10 min. 32 cycles was chosen as this was within the
exponential phase for each primer set. Following PCR exactly 10µl of the PCR products were
separated by electrophoresis on a 2% agarose/1X TAE (Tris, Acetic acid, EDTA) gel
containing SYBRSafe DNA gel stain (Invitrogen). PCR products were subsequently visualised
using a under UV light and images captured via an InGenius gel documentation system
(Syngene).
Semi quantitative densitometry analysis was performed on each of the PCR products from each
participant sample using ImageJ’s Gel Analysis function. Briefly a .TIF image of our PCR gel
was imported into ImageJ and converted to 8-bit grey-scale image. A rectangular selection was
placed over each PCR band, and a profile plot representing the relative density of the
rectangular selection was obtained.
Data was exported to MS Excel for analysis. Density of UBC was used as a standard and given
a value of 1, density of all other gene products was calculated relative to the calculated density
for UBC expression.

90
3.6. Statistical Analysis All analysis was performed using Statistical Package for the Social Sciences Version 24 (SPSS
Inc. Chicago, IL, USA). Data was screened for outliers, checked for equality of variance and
normality.
3.6.1. Comparative Statistics Study 1: Two multivariate analysis of variance (MANOVA) tests were performed to identify
whether the two groups, ultra-marathoners and non-ultra-marathoners differed significantly
based on their psychological measures, including mental toughness and personality, and
physiological measures, V̇O2peak score and training (see power calculation performed, section
3.2.1). Where the MANOVA tests were statistically significant, post-hoc ANOVAs were
performed on the dependent variables. A Chi-Square test for association was performed to test
for association between the two categorical variables, ultra-marathon group and having the
ACE gene allele – the latter being either II (homozygous insertion), ID (heterozygous) or DD
(homozygous deletion). Pearson Product Moment Correlation coefficients were utilised to
determine the strength and direction of linear relationships between the physiological measures
and the physiological measures.
Study 2: Multiple multivariate analysis of variance (MANOVA) tests were performed to
identify whether the three groups, ultra-marathoners, aerobic and low aerobic differed
significantly based on their psychological measures, including mental toughness, personality,
motivation, pain, RPE, and physiological measures, including V̇O2peak score, lactate inflection
point, selected genes (see power calculation performed, section 3.2.1). Where the MANOVA
tests were statistically significant, post-hoc ANOVAs were performed on the dependent

91
variables. The effect size, emphasising the size of the difference, was calculated using ηp2
(.01=small; .06=medium; .14=large) (Nakagawa & Cuthill, 2007).
Pearson Product Moment Correlation coefficients were calculated to determine the strength
and direction of linear relationships within, and between the physiological measures and the
physiological measures. Paired-sample t-tests were utilised to identify differences in salivary
cortisol prior to and following exercise.
Study 3: Paired-sample t-tests were utilised to compare differences in stress hormones, cortisol
and testosterone prior to and following completion (see power calculation performed, section
3.2.1). Pearson Product Moment Correlation coefficients were utilised to determine the
strength and direction of linear relationships between the psychological, and physiological
measures of mental toughness, personality, age, and levels of hormone change.

92
CHAPTER FOUR
93
4. Study 1: Psychological and Physiological Factors that Influence Performance in Ultra-Marathon Runners
Abstract Psychological and physiological factors were examined as part of a cross-sectional,
interdisciplinary study, to ascertain what influenced performance in ultra-marathoners and non-
ultra-marathoners. 20 participants were included all male (M age = 35.26, SD = 5.37), 10 had
previously taken part in an ultra-marathon and 10 had neither trained for, nor entered, such an
event. Participants completed psychological tests for mental toughness and personality,
including the Mental Toughness Questionnaire 48, the Sports Mental Toughness
Questionnaire, and the Big 5 Personality Inventory, along with physiological assessment of
V̇O2peak scores, and the ACE gene allele. There was a significant difference between groups
on V̇O2peak, however there were no differences between ultra- and non-ultra-marathoners on
mental toughness and personality scores. Furthermore, the ACE gene allele, usually associated
with physical endurance, was not present in one group more than the other. There were
significant positive correlations, for all participants, between V̇O2peak scores and the personality
trait conscientiousness (p < .01), and between V̇O2peak and commitment scores (p < .05).
Together these findings suggest that ultra-marathoners may achieve higher levels of endurance
as a result of physiological adaptions following increased training regimes, and differences in
psychological characteristics neither identify ultra-marathoners nor preclude participation in
an endurance event.
94
4.1. Introduction The last decade has seen considerable growth in both the quantity of endurance events and the
number of entrants, at both elite and non-elite levels (Baumann et al., 2014; Hurdiel et al.,
2018; Wardenaar et al., 2018; Wortley & Islas, 2011). Increased media attention, mass
participation, and the popularity of elite sports-men and women has led to a greater interest in
athletic performance and an awareness that success is likely to be underpinned by both
psychological and physiological factors (Gucciardi et al., 2016; Montgomery et al., 2011).
Top-level sports men and women, reaching the highest echelons of competition, are
comparable in terms of their training and aerobic fitness, with success reliant on their
psychological ability to manage stress, retain focus, clear thinking, and maintain consistency
(Jones et al., 2002).
Over the last decade researchers have shown an increased interest in endurance sports. This is
evident in a growing body of literature which has investigated: the trends in participation and
performance in ultra-marathons (Fonseca-Engelhardt et al., 2013), the links between
psychological parameters and endurance performance (Mccormick et al., 2015; Schüler,
Wegner, & Knechtle, 2014), and the effect of physiological parameters, such as exercise
training, anthropometric features, on performance in ultra-marathoners (Baumann et al., 2014;
; Knechtle, 2012; Tan et al., 2017). Collectively, the findings from these studies show an
association between psychological and physiological parameters, and endurance performance,
however little attempt has been made to quantitatively measure, and compare, the predictors of
optimum performance in ultra-marathoners. Furthermore, interdisciplinary research linking
psychological and physiological evidence together has been scant and, for studies that have, it
is difficult to be convinced by the conclusions based on the research methodologies adopted.

95
A more comprehensive understanding of psychological moderators described below, including
mental toughness, personality and genetic predispositions in endurance events may enable
coaches and sports scientists to provide improved support for new, and existing, athletes to
optimise performance.
The Big 5 personality dimensions: neuroticism, extraversion, agreeableness,
conscientiousness, and openness to experience are used as a common framework for
investigating personality (Kaiseler et al., 2017), with researchers indicating that higher-order
personality dimensions influence an athlete’s ability to cope with pressure (Allen et al., 2011).
However, a recent study ascertained that although athletes scored higher than non-athletes for
conscientiousness, no statistically significant differences were identified between groups for
the other four, of the Big 5, traits (Malinauskas et al., 2014). Analysis of the findings suggest
that personality may be an influencing contextual factor in sport (Kaiseler et al., 2012), whilst
the effect personality has on appraisal, coping effectiveness and the ability to handle stress
without a related performance degradation in endurance remains largely unexplored.
Supporting research by Horsburgh et al. (2009) also demonstrated there are strong correlations
between Big 5 variables and mental toughness, and importantly that both are heritable.
There is widespread consensus amongst researchers that mental toughness is one of the most
important, multidimensional, psychological constructs related to performance excellence in
sport (Connaughton et al., 2008; Perry et al., 2013; Gucciardi et al., 2016; Thelwell et al.,
2010). However, a number of concerns have been raised regarding mental toughness: its
definition and underlying conceptual framework; the assumption that elite athletes are mentally
tough; a lack of objective measures (Crust, 2008); caution regarding its multidimensionality;
96
and challenges regarding its permanence over time and across situations (Gucciardi et al.,
2014).
Despite the conceptual challenges to mental toughness and its measurement validity, as
discussed in Chapter 2 (Section 2.2.1), mental toughness remains highly valued by coaches and
athletes alike. According to the widely accepted view by researchers, an athlete that has mental
toughness exhibits an advantage over opponents by enabling the individual to cope better with
the demands that sport places on them, whilst maintaining consistency in determination, focus
and having control whilst under pressure (Connaughton et al., 2008; Gucciardi & Gordon,
2013; Gucciardi et al., 2016; Jones et al., 2002; Perry et al., 2013; Thelwell et al., 2010). A
conceptual model developed by Crust and Clough (2005) defined mental toughness as a trait-
like dimension of personality, made up of four psychological attributes, control, commitment,
challenge and confidence (4Cs). Despite concerns regarding the underlying structure (Sheard
et al., 2009), research using the Mental Toughness Questionnaire (MTQ48) showed a positive
correlation between mental toughness and, physical endurance and the tolerance of physical
pain (Crust & Clough, 2005). A recent study by Gucciardi et al. (2016) tested Australian
footballers using a series of performance tests, including a 20-metre sprint, agility run, vertical
jump, and multistage shuttle run, and supported the view that mental toughness predicted
behavioural perseverance. They further encouraged, for completeness, that future research
should include direct measurements of aerobic fitness, in the laboratory, through quantifying
maximal oxygen consumption.
Maximal oxygen consumption (V̇O2max) is a measure of aerobic fitness and is frequently
quantified in runners using a treadmill test of increasing workload and yields a standard means
to assess overall physical fitness. V̇O2max provides a representation of the ability of the body to

97
deliver oxygen to working muscles during exercise (Tsigilis, 2005), including running (Haff &
Dumke, 2012), and a measure of the maximum rate at which oxygen is consumed during
oxidative phosphorylation.
Human genetic identity is likely to be a strong factor in endurance success, with a large number
of phenotypes, including heart and lung capacity, musculature and tendon elasticity influencing
performance in sport (Puthucheary et al., 2011; Valdivieso et al., 2017). Horsburgh et al. (2009)
identified the average heritability for any given personality trait, including MT, as 50%, and
researchers have confirmed an estimated heritability for gains in aerobic capacity from
endurance training as also 50% and suggested genotype-tailored training interventions (Barry,
Church, & Blair, 2010; Sarzynski et al., 2017). Previous studies have established that
numerous, individual genes can impact sporting performance (Lippi et al., 2009; Puthucheary
et al., 2011), and even potentially, through gene doping, illegally improve the likelihood of
successful competition (Gronde, Hon, Haisma, & Pieters, 2013).
One such earlier, candidate gene study, by Montgomery et al., (1998) identified the insertion
allele of the gene encoding angiotensin-converting enzyme (ACE) as being associated with
endurance performance amongst both mountaineers and elite endurance athletes. Montgomery
et al., (1998) suggested that the presence of the gene alone does not necessarily indicate
superior performance, but rather that it must be coupled with appropriate training for any
beneficial effect to be present. Subsequent studies identified the insertion allele frequency as
being higher in endurance athletes, including ultra-distance swimmers, long-distance cyclists,
and Ironman triathletes (Montgomery et al., 2011). In contrast, others, such as Ash et al., (2011)
have demonstrated that the genomic analysis of world-class Kenyan and Ethiopian athletes,
98
have not reported an increased presence of the ACE gene polymorphism when compared to the
general population.
To date, the primary focus of research in the field of mental toughness and personality in sport
has been on elite athletes, and many of the studies have been qualitative (Anthony et al., 2016).
Relatively little attention has been directed towards quantitative research methodologies to
identify both the psychological and the physiological factors, and their interaction, that predict
performance in ultra-marathoners. The present study contributes to current understanding of
endurance athletes by comparing ultra-marathoner runners with non-ultra-marathon runners
using V̇O2max scores, mental toughness, Big 5 personality dimensions and the ACE gene allele
to identify if significant differences are present. Correlations were also calculated to identify
relationships between psychological and physiological attributes. This was the first study of
this nature to quantify, and compare, both psychological and physiological factors, between
ultra-marathoners and non-ultra-marathoners. Three hypotheses were tested: it was
hypothesised that: (a) there will be no statistically significant differences between the mental
toughness, and personality scores from questionnaires completed by ultra-marathon runners
and non-ultra-marathon runners; (b) there will be no significant differences in the
measurements of the V̇O2peak, and training volume between ultra-marathon runners and non-
ultra-marathon runners; and finally (c), there will be no significant differences in the incidence
of the allele of the ACE gene between ultra-marathon runners and non-ultra-marathon runners.

99
4.2. Methods
4.2.1. Participant Characteristics Twenty male participants aged between 20-45 (mean age 35.26 + SD 5.37) were selectively
allocated to one of two groups based on previous competitive race participation. Those
participants who had previously completed an ultra-marathon event were allocated to the ultra-
marathon group, whilst those with no experience were allocated to the non-ultra-marathon
group. The ultra-marathon group trained aerobically between 5.5 and 15 hours per week (mean
hours trained 9.2, + SD 2.96), though largely attributed to running, activity included cycling
and swimming. The non-ultra-marathon group trained aerobically between 0 and 3 hours per
week (mean hours trained 1.58 hours, + SD 0.91).
4.2.2. Experimental Design Ulster University Research Ethics Committee (UUREC) granted approval for this study
(REC.13.0182). Human tissue was sampled, tested and stored in accordance with the Human
Tissue Act (HTA) 2004.
A cross-sectional design was adopted to quantify the psychological and physiological
differences between ultra-marathoners and non-ultra-marathoners. A recruitment email was
distributed to participants who had previously completed an ultra-marathon event, and office
workers who had not previously trained for, or taken part in such races. An ultra-marathon was
defined as a running event exceeding the classical marathon distance of 42.20 km) in line with
existing research and often taking place over 50km, 100km, or longer, as part of multi-day
events.

100
4.2.3. Psychological Measures
Mental Toughness
Mental toughness was measured using the Mental Toughness Questionnaire (MTQ48) (Clough
et al., 2002) and the Sports Mental Toughness Questionnaire (SMTQ) (Sheard et al., 2009). A
detailed description can be obtained by referring to Methodology Section 3.3.1.
Personality
Personality was measured using the Big 5 personality inventory (Kaiseler et al., 2012). A
detailed description can be obtained by referring to the Methodology Section in 3.3.2.
4.2.4. Physiological Measures
Maximum Oxygen Uptake (V̇O2max Test)
Maximum oxygen uptake was measured using an incremental exercise on a motorised
treadmill, increasing the gradient after each one-minute interval. A detailed description can be
obtained by referring to Methodology Section 3.4.1.
Angiotensin Converting Enzyme (ACE) Gene Quantification
Blood genomic DNA was genotyped for the ACE gene allele insertion (I)/deletion (D)
polymorphism, using the polymerase chain reaction (PCR) method with gene specific primers
as previously described by Rigat et al. (1992). A detailed description can be obtained by
referring to Methodology Section 3.5.1.

101
4.2.5. Data Analysis During analysis, one participant in the non-ultra-marathon group, was excluded from further
data analysis due to excessive training levels, along with completion of a number of marathons.
Descriptive statistics were therefore calculated on data from the remaining 19 volunteers (age
35.26 ± 5.37), 10 in the ultra-marathon and 9 in the non-ultra-marathon group.
4.2.6. Learning and Development General areas of learning and development for the successful completion of Study 1 included:
(1) recruitment of participants, including communication, sharing and completion of health and
training questionnaires using SurveyMonkey created for this research; (2) ethics committee
submission and revision; (3) design and following of research protocol; (4) collection and
organisation of data; (5) creation and usage of health and training questionnaires.
Specific areas of learning and development included: (1) maximal oxygen uptake testing; (2)
SPSS data analysis; (3) analysis and calculation of MTQ48 and Big 5 scores; (4) performance
of wet lab analysis of ACE gene polymorphism (see Section 3.5.1).
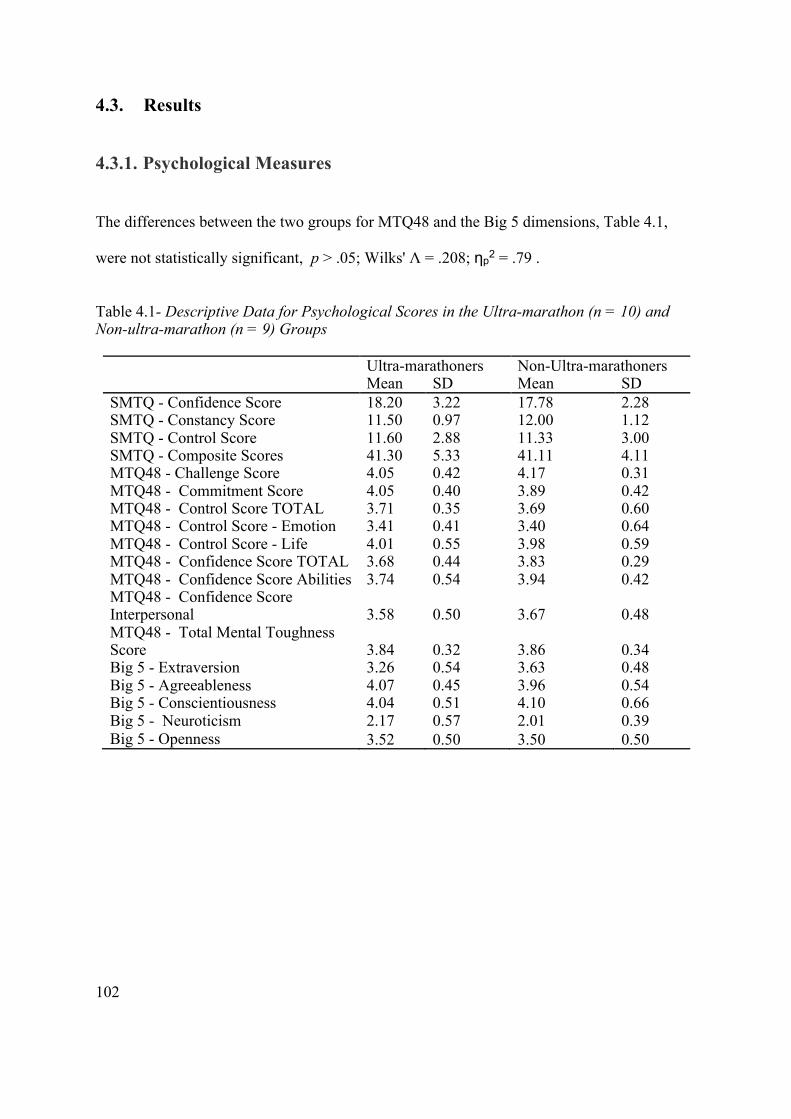
102
4.3. Results
4.3.1. Psychological Measures
The differences between the two groups for MTQ48 and the Big 5 dimensions, Table 4.1,
were not statistically significant, p > .05; Wilks' Λ = .208; ηp2 = .79 .
Table 4.1- Descriptive Data for Psychological Scores in the Ultra-marathon (n = 10) and Non-ultra-marathon (n = 9) Groups
Ultra-marathoners Non-Ultra-marathoners Mean SD Mean SD SMTQ - Confidence Score 18.20 3.22 17.78 2.28 SMTQ - Constancy Score 11.50 0.97 12.00 1.12 SMTQ - Control Score 11.60 2.88 11.33 3.00 SMTQ - Composite Scores 41.30 5.33 41.11 4.11 MTQ48 - Challenge Score 4.05 0.42 4.17 0.31 MTQ48 - Commitment Score 4.05 0.40 3.89 0.42 MTQ48 - Control Score TOTAL 3.71 0.35 3.69 0.60 MTQ48 - Control Score - Emotion 3.41 0.41 3.40 0.64 MTQ48 - Control Score - Life 4.01 0.55 3.98 0.59 MTQ48 - Confidence Score TOTAL 3.68 0.44 3.83 0.29 MTQ48 - Confidence Score Abilities 3.74 0.54 3.94 0.42 MTQ48 - Confidence Score Interpersonal 3.58 0.50 3.67 0.48 MTQ48 - Total Mental Toughness Score 3.84 0.32 3.86 0.34 Big 5 - Extraversion 3.26 0.54 3.63 0.48 Big 5 - Agreeableness 4.07 0.45 3.96 0.54 Big 5 - Conscientiousness 4.04 0.51 4.10 0.66 Big 5 - Neuroticism 2.17 0.57 2.01 0.39 Big 5 - Openness 3.52 0.50 3.50 0.50
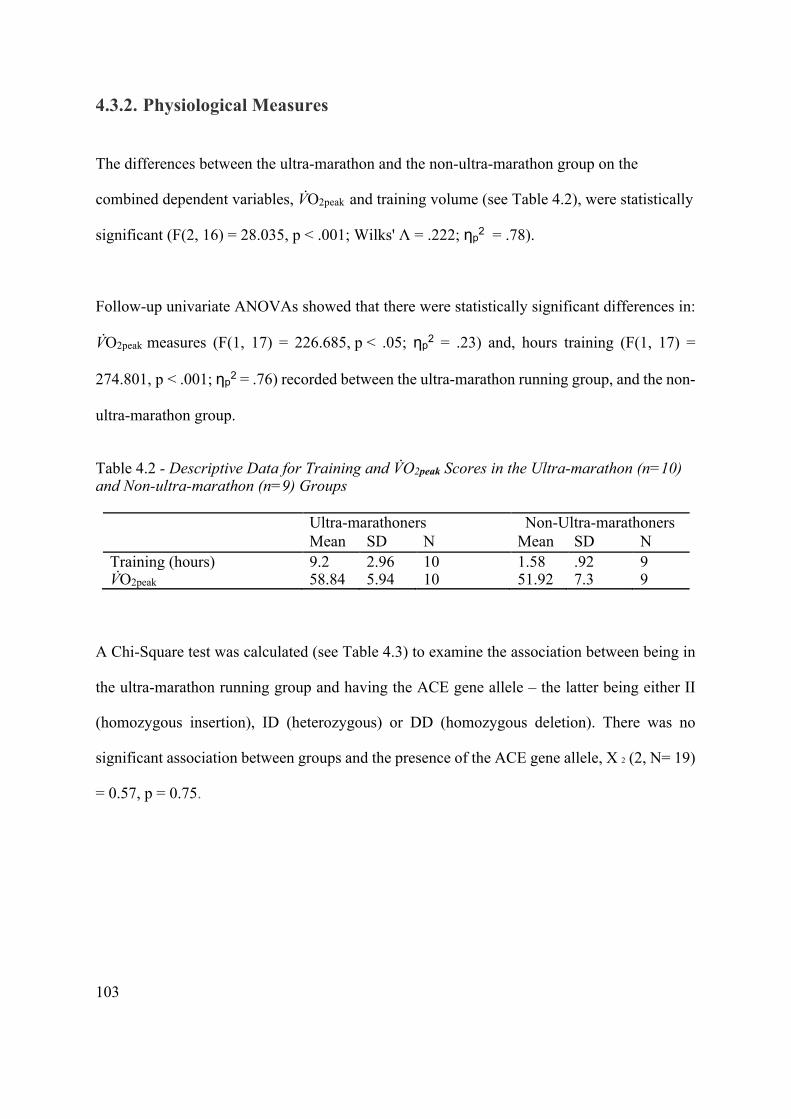
103
4.3.2. Physiological Measures
The differences between the ultra-marathon and the non-ultra-marathon group on the
combined dependent variables, V̇O2peak and training volume (see Table 4.2), were statistically
significant (F(2, 16) = 28.035, p < .001; Wilks' Λ = .222; ηp2 = .78).
Follow-up univariate ANOVAs showed that there were statistically significant differences in:
V̇O2peak measures (F(1, 17) = 226.685, p < .05; ηp2 = .23) and, hours training (F(1, 17) =
274.801, p < .001; ηp2 = .76) recorded between the ultra-marathon running group, and the non-
ultra-marathon group.
Table 4.2 - Descriptive Data for Training and V̇O2peak Scores in the Ultra-marathon (n=10) and Non-ultra-marathon (n=9) Groups
Ultra-marathoners Non-Ultra-marathoners Mean SD N Mean SD N Training (hours) 9.2 2.96 10 1.58 .92 9 V̇O2peak 58.84 5.94 10 51.92 7.3 9
A Chi-Square test was calculated (see Table 4.3) to examine the association between being in
the ultra-marathon running group and having the ACE gene allele – the latter being either II
(homozygous insertion), ID (heterozygous) or DD (homozygous deletion). There was no
significant association between groups and the presence of the ACE gene allele, X 2 (2, N= 19)
= 0.57, p = 0.75.
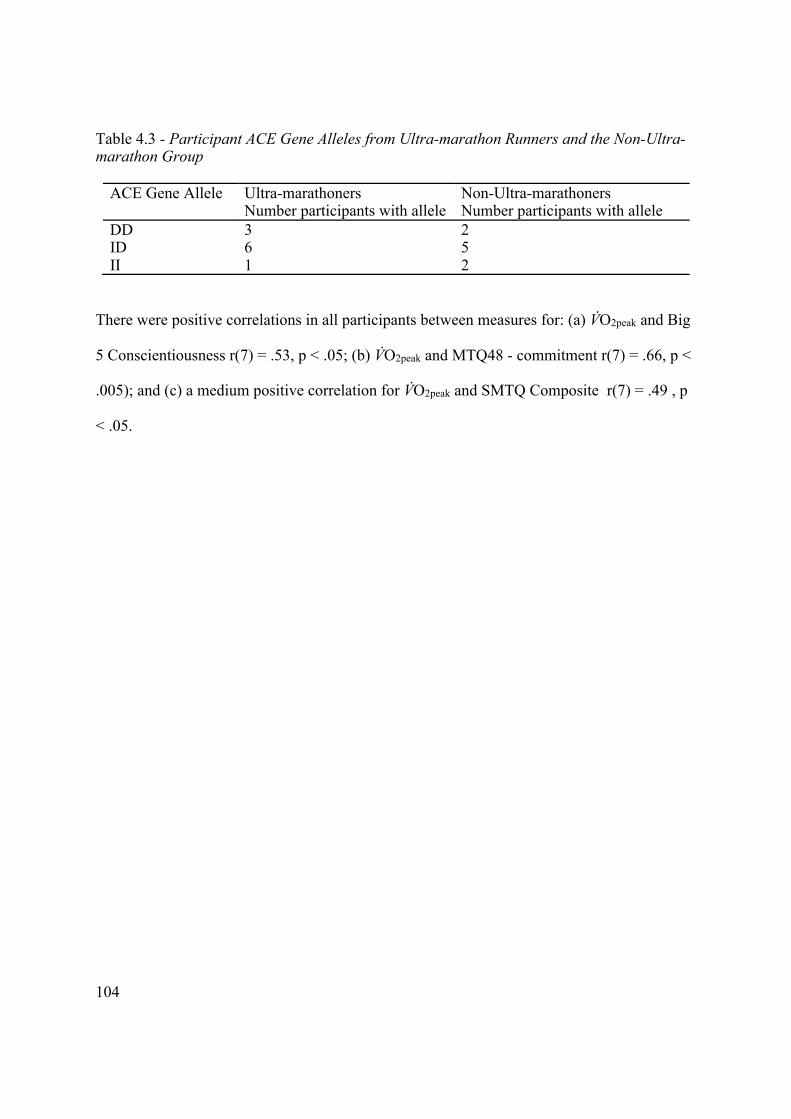
104
Table 4.3 - Participant ACE Gene Alleles from Ultra-marathon Runners and the Non-Ultra-marathon Group
ACE Gene Allele Ultra-marathoners Non-Ultra-marathoners Number participants with allele Number participants with allele DD 3 2 ID 6 5 II 1 2
There were positive correlations in all participants between measures for: (a) V̇O2peak and Big
5 Conscientiousness r(7) = .53, p < .05; (b) V̇O2peak and MTQ48 - commitment r(7) = .66, p <
.005); and (c) a medium positive correlation for V̇O2peak and SMTQ Composite r(7) = .49 , p
< .05.

105
4.4. Discussion The aim of Study 1 was to identify psychological and physiological differences between ultra-
marathoners and non-ultra-marathoners. From the findings, it can be suggested that ultra-
marathoners have a higher V̇O2peak than non-ultra-marathoners, this appears to be as a result of
a significantly higher volume of training rather than the psychological factors measured. The
results of this study support the idea that neither mental toughness, personality, nor the status
of the ACE gene allele, preclude participation in ultra-marathon events. Another finding is
that across all participants there was a strong relationship between V̇O2peak, and both
conscientiousness and commitment traits of personality.
In contrast to earlier research, an implication of this study is that ultra-marathoners are not
identifiable by their mental toughness or their personality traits (Crust et al., 2005; Jones et al.,
2002; Kaiseler et al., 2017). Though concerns have been raised around the MTQ48 regarding
the underlying structure (Sheard et al., 2009), none have been raised with regards to the validity
of the SMTQ, or the Big 5 Personality Inventory. Analysis of the data therefore suggests that
mental toughness is not a factor in successful completion of endurance events, and a lack of
significant differences in personality scores between the two groups indicates that an ultra-
marathoner is similar in personality to a non-ultra-marathoner participant. However, a possible
study limitation is that it is possible, that the SMTQ, MTQ48 and Big 5 Personality Inventory
questionnaires fail to capture a contextual element only present within the confines of an ultra-
endurance race, or related training. Furthermore, according to Gucciardi and Gordon (2013)
mental toughness may not be a holistic concept and should not be viewed in contextual
isolation. Crust (2008) suggests that the current limitation of studies is the ignorance of
contextual differences. The failure to identify ultra-marathoners as a result of mental toughness,
106
and a limitation of this research may, in part, be an issue of context. Mental toughness may be
specific to an environment or situation, and ignorance of this contextual factor may lead to
contradictory results (Crust, 2008, 2008a ; Gucciardi, 2017; Gucciardi & Gordon, 2013). There
are also risks associated with (1) the assumption that mental toughness and success, in this case
measured by maximal oxygen uptake, are strongly co-dependent, (2) that mental toughness is
an indicator of superior athletic ability rather than the capacity to overcome the challenges
found in training and competition. Furthermore, there is a lack of conceptual clarity
surrounding the definition of mental toughness, and the multidimensionality of mental
toughness (Clough et al., 2002; Crust, 2008, 2008a; Gucciardi et al., 2014).
We can speculate, that there may be a number of facets to Mental Toughness not identified
within this study: a trait that we are born with, an element that is context dependant, and even
factors which are shaped by the adoption of coping mechanisms, goal setting or attentional
focus. Attentional focus and motivation may therefore deserve further consideration in relation
to performance success in endurance events. Baden, Warwick-Evans, and Lakomy (2004)
suggest that fatigue is indeed subjective and can be influenced by expectations regarding task
duration. Such teleoanticipatory mechanisms may be influenced by coping strategies or
attentional focus and may be modified as a result of endurance-focused training. Baden et al.
(2004) reported that a lower rate of perceived exertion (RPE) is a result of dissociative thoughts
diverting attention from physical cues, whilst Brick et al. (2014) suggest that researchers may
wish to investigate whether or not cognitive strategies, including association, dissociation, self-
talk and goal setting, negate the impact of factors known to affect perceived exertion and
endurance performance. Mental fatigue appears to affect perceived exertion, and this may be a
result of its impact on the central processing of sensory inputs (Marcora et al, 2010). This leads

107
to speculation that appropriate mental training may reduce mental fatigue and thereby limit the
rate of perceived exertion (Mccormick et al., 2015).
According to the work of Montgomery et al. (1998), participants with the ACE gene insertion
allele are more likely to achieve greater endurance benefits from exercise training.
Surprisingly, though it had been hypothesised that, as per Montgomery et al. (1998, 2011), the
ultra-marathon group would have a higher incidence of the insertion allele of the ACE gene,
compared with the non-ultra-marathon group, there was no significant difference in the ACE
gene allele between the ultra-marathon group and the non-ultra-marathon group. An
implication of this is the possibility that both the D allele, linked with strength, and the I allele,
linked with endurance (Montgomery et al., 1998), are equally important and complimentary.
As many of the ultra-marathoners race in mountain environments that include considerable
ascent and descent both strength and endurance would provide benefit and value in training,
and participation in such events. Furthermore, a single gene test may not provide a sufficient
indication of the genetic predisposition of an individual to succeed in ultra-endurance events.
Indeed, as a result of advances in research methods, many studies into exercise response
phenotypes have rejected the candidate gene approach, and instead favoured a hypothesis-free,
genome-wide method of investigation (Gronde et al., 2013; Lippi et al., 2009; Puthucheary et
al., 2011). Due to cost and time limitations, this study was limited to an analysis of a single
gene, and therefore future hypothesis-free, genome-wide investigations is warranted to identify
the genetic predisposition of an individual to succeed in ultra-endurance events. Though
worthy of future study, the ACE gene is likely to be one of many possible genes that impact
human endurance. At present, both approaches are providing valuable insight into the
molecular basis of V̇O2max trainability, and research has indicated a degree of heritability
approaching 47% (Sarzynski et al., 2017).
108
The results of correlational analysis show that for all participants there is a positive relationship
between V̇O2peak and conscientiousness. It is not possible, based on analysis of results from,
and methodological limitations of, Study 1, to identify the direction of association between
aerobic capacity, as measured by maximal oxygen uptake, and conscientiousness. Indeed, it
may be speculated that mental toughness is heightened as a result of a prolonged programme
of endurance training and subsequently provides the individual with a number of factors that
improve the likelihood of success in an ultra-marathon. For the ultra-marathoners,
conscientiousness may be a prerequisite for determination and focus in training, to reach higher
levels of aerobic fitness, and during racing, to achieve maximal results. Conscientiousness may
provide an incentive to achieve optimal results in, what is for some a possibly unfamiliar,
aerobic environment during treadmill testing for both ultra-marathoners and non-ultra-
marathoners. Indeed, previous research has hypothesised that conscientious may be predictive
of endurance success due to its association with the ability to persist (Allen et al., 2011;
Malinauskas et al., 2014). Training in psychological based techniques including goal setting,
coping, and visualization may therefore provide useful mechanisms for ultra-marathoners, and
non-ultra-marathoners, to more easily achieve their potential. There were also strong, positive
correlations between V̇O2peak, and commitment and overall mental toughness for all
participants. Analysis therefore suggests, independent of whether or not an individual competes
in ultra-marathon events, that specific personality traits, and attributes of mental toughness may
influence aerobic fitness, or conversely that aerobic fitness impacts on the non-heritable
element of psychological traits, and they are indeed not fixed.
There are other explanations for the lack of significant differences between the two groups in
terms of psychological measures, and the single ACE gene allele: it could be that traits other
than those selected for inclusion within Study 1 could be examined; or, that the two populations
109
are homogeneous in terms of their measured traits. If the latter is true, then perhaps, as Bramble
and Lieberman (2004) suggest, we are, as a species, designed for endurance, with highly
developed, specialised features that may have provided a significant contribution to the
evolution of the human form. Evolutionary psychology has had some success in explaining
psychological traits as important evolutionary outcomes (Buss, 2009; 2009a; Penke & Jokela,
2016), with adaptations designed to solve the problems faced by our ancestors and may provide
some insight into the shared pre-prerequisites for endurance activities.
This study set out to establish whether the psychological and physiological factors as measured
influence performance in ultra-marathoners and non-ultra-marathoners. From the findings, it
can be suggested that for mental toughness, personality and the ACE gene allele, the two groups
are homogeneous, with the increased V̇O2peak in the ultra-marathoners likely to be a result of
the increased volume of training. An implication of this study, with consideration given to the
limitations cited, is that, based on the traits tested, any non-ultra-marathoner, with suitable
training and an absence of health problems, could become a competitor in ultra-marathons.
This study has limited ecological validity and therefore does not identify what it takes to
become a more highly ranked ultra-marathoner in a race. By measuring physiological and
psychological traits, when compared with race success, it may be possible to more
comprehensively understand the attributes that provide a competitive advantage, and how
improved race times, or more consistent results, can be achieved. Study 3 (Chapter 6), by
inclusion of race placings as an additional measure, will therefore differentiate between ultra-
running participants able to complete the event and those that are able to achieve a good
placing.

110
A further, and important, limitation of this study is the heterogeneity of the non-ultra-
marathoner group, including both sedentary individuals, and well trained runners that have not
participated in an ultra-marathon - potentially even marathon runners. Study 2 (Chapter 5) will
further delineate the non-ultra-marathon group to account for this limitation. Motivation is
likely to be a necessary precursor to the adoption, and the ongoing continuance, of training to
participate in ultra-running, endurance events defined by higher levels of aerobic endurance.
Such motivation may be present in all of us, as an inherited predisposition to participate, and
even enjoy, endurance activities, necessary to ensure the survival of our human ancestors. If
this is an inherited trait, then it is likely to be identified in all of us: something in our
development, situation or environment may be limiting its expression for the majority who do
not currently, and do not intend to, train for and participate in, such activities. Motivation has
not been explored previously with a protocol similar to Study 1, therefore Study 2 and 3 will
include measurements to help better understand whether motivation is a predicting factor in
ultra-marathon performance.
Although the findings should be treated with caution, for the limitations discussed, the results
of this study indicate, that psychological factors, including personality and mental toughness,
impacted by inheritability, are not factors in participation in ultra-marathons, and as they are
in contrast to an existing body of research (Allen et al., 2011; Crust & Clough, 2005; Kaiseler
et al., 2017; Montgomery et al., 2011) further investigation with a strengthened methodological
protocol to Study 1 is warranted.

111
CHAPTER FIVE

112
5. Study 2: Identification of the Psychological and Physiological Factors that Enable Endurance Performance Success in Trained Ultra-marathoners.
Abstract Psychological and physiological factors were examined, as part of a cross-sectional,
interdisciplinary study, to ascertain what influenced performance in ultra-marathon runners
who were aerobically trained compared with low aerobic participants. The 27 participants were
all male (M age = 39.41, SD = 6.95): 10 had previously taken part in an ultra-marathon; 10
participants had not competed in an ultra-marathon and averaged a minimum of 30 minutes of
moderate exercise on most, if not all days of the week; and 7 took part in physical activity for
less than 90 minutes over the course of a week. Participants completed the Mental Toughness
Questionnaire MTQ48, SDT GCOS Questionnaire, and the Big 5 Personality Inventory, along
with physiological assessment of V̇O2peak scores, pain tolerance and threshold, stress hormone,
lactate threshold, running economy, and the 5HTT, BDNF, D4DR gene expression
profile. There was a significant difference between the ultra-marathoner group and the low
aerobic group on V̇O2peak, running velocity at lactate inflection point, and rate of increase of
RPE, and the Big 5 dimension, openness. There were no differences between ultra-
marathoners, the aerobic, and the low aerobic groups on mental toughness, motivation scores,
and pain tolerance and threshold. There were significant positive correlations, for all
participants, between aspects of mental toughness and, pain tolerance and threshold (p < .05),
and running economy (p <.05). Together these findings suggest that ultra-marathoners are
identifiable by their openness to new experiences but not their mental toughness, or motivation
and achieved higher levels of endurance as a result of physiological adaptions following
increased training regimes.

113
5.1. Introduction The association between psychological and physiological parameters, with endurance
performance, is widely accepted and has been confirmed by a number of investigations to date
(McCormick et al., 2015; Schüler et al., 2014). Mental toughness, in particular, is recognised
as an important psychological concept in sporting success and, as a result, has received
considerable attention within research into enhancing performance in sport (Gucciardi, 2017;
Perry et al., 2013; Thelwell et al., 2010; 2008). However, despite work having identified mental
toughness as facilitating improved determination, focus, and the ability to manage pressure in
sport, there has been limited focus with those who run ultra-marathons. Indeed, analysis of data
from recent research by Marshal et al. (2017) suggested that mental toughness increased as a
result of training for a long-distance triathlon, and a study by Mahoney et al. (2014), of cross-
country runners, reported that increased mental toughness is related to reduced race times.
Motivation has also been linked to health and sporting behaviour (Hagger & Chatzisarantis,
2008; Ryan & Deci, 2017), and according to Deci and Ryan (2008) tends to be high when the
basic psychological needs, competence, autonomy, and relatedness, are met (Deci & Ryan,
2008). The Self-determination Theory (SDT) (Deci & Ryan, 1985) provides a framework to
study human motivation, and the General Causality Orientation Scale (GCOS) measures
enduring motivational orientation, by testing 36 items, that describe typical, social and
achievement-oriented situations, with responses indicating either an autonomous, controlled,
or impersonal type of motivation (Deci & Ryan, 1985).
Ultra-endurance events are long, and gruelling, and as with all aerobic activities involve a
number of complex, interrelated, physiological processes, resulting in, but not limited to, the
114
production of stress hormones, including cortisol, and an increase in lactate. Cortisol secretion
increases with exercise intensity, and helps counter hypoglycaemia, accelerates fat
mobilisation, and results in post-exercise levels usually being significantly higher than pre-
exercise (Tanner et al., 2013; Wortley & Islas, 2011). Salivary testing has been identified as a
convenient means of collecting and quantifying cortisol levels and is indicative of the amount
of stress athletes have put their body though during training, racing, and testing (Inder,
Dimeskit, Russell & Warrick, 2012; Tanner et al., 2013). Blood lactate, produced as a result of
glucose utilisation, serves as an important substrate in the generation and storage of energy,
during both rest, when lactate production is usually in balance with removal, and increasingly
during anaerobic exercise, when lactic clearance is insufficient to prevent its accumulation
(Brooks et al., 2005; McArdle, Katch & Katch, 2015).
Despite the tendency for long distance runners to maintain a pace well below anaerobic
threshold, participants frequently experience discomfort, and even pain, over the course of an
ultra-marathon (Simpson et al., 2014). Research into pain in sport may provide a greater
understanding of the challenges experienced by athletes and identify those strategies that
benefit tolerance and management. Evidence from psychophysiological studies examining
sports injury, have reported that mentally tough athletes are more likely to accept pain and
perceive it as less threatening (Levy, Polman, Clough, Marchant & Earle, 2006) and may, in
part, help explain the ability of ultra-marathoners to appear to push beyond previous boundaries
during races.
Athletes at all levels of training and competition have performance limits, however Marcora
and Staiano (2010) have challenged the popular view that the length of aerobic exercise is
constrained by muscle fatigue. Their research shows that the perception of effort, rather than

115
the inability of fatigued muscles to deliver the necessary power output, is the limiting factor
impacting endurance performance and predicting failure (Crewe et al., 2008; Eston, 2012;
Marcora et al., 2009; Pageaux et al., 2014). The Rate of Perceived Exertion (RPE) is commonly
utilised to provide subjective feedback of exercise intensity and integrates both psychological,
and physiological factors, to predict pacing strategy and the duration of exercise. Research
suggests the RPE is moderated by psychological factors, including cognition, memory,
previous experience, understanding of the task, and situational factors such as knowledge of
the end point, duration, temporal characteristics of the event or training session (Eston, 2012;
Noakes, 2007).
In Study 1 (Chapter 4), ultra-marathoners, and non-ultra-marathoners, completed
psychological tests for mental toughness, using the MTQ48 (Crust et al., 2005), and the Big 5
Personality Inventory, alongside the physiological assessment of aerobic capacity (V̇O2peak).
The failure to identify differences between groups for the psychological factors may result from
the study limitations, previously discussed, including the heterogeneity of the non-ultra-
marathoners (see Section 4.4). By enhancing the methodological research design and protocol
in Study 1, Study 2 further delineated the non-ultra-marathon group, into an aerobically trained
group, and a low aerobically trained group.
The Mental Toughness Questionnaire (MTQ48) (see Section 3.1) and the Self-determination
Theory (SDT), as measured by the GCOS scale, have been utilised extensively to study a wide
variety of sport-related behaviours, yet there have been few applications of such theoretical
frameworks in ultra-marathoners (Crust & Clough, 2005; Deci & Ryan, 1985). In this second
laboratory-based cross-sectional study, the aim was to further investigate factors that influence
performance in ‘trained’ ultra-marathoners, quantifying: (a) mental toughness; (b) personality

116
traits; (c) motivation that may impact performance; (d) cortisol; (e) pain threshold and
tolerance; (f) genes 5HTT, BDNF and D4DR, identified as potentially affecting emotional
control, perceived effort, and motivation; and (g) V̇O2peak, and lactate thresholds, as measures
of maximal aerobic capacity. Further research into the above psychological and physiological
factors may provide an improved understanding of the challenges experienced by athletes in
endurance events and enable scientists to provide more informed support to the athlete whilst
seeking performance improvements.
Three hypotheses were tested: a) it is hypothesised there will be no significant differences
between the mental toughness, personality, and motivation scores from questionnaires
completed by ultra-marathon runners, aerobic and those in the low aerobic group; b) there will
be no significant differences in the measurements of the V̇O2peak, lactate inflection point, stress
hormone cortisol and training volume; and finally c), there will be no significant differences in
the expression of the genes 5HTT, BDNF, D4DR between ultra-marathon runners, non-ultra-
marathon runners and those in the low aerobic group.
117
5.2. Methods
5.2.1. Participant Characteristics In response to the sample size estimation from the power calculation in Section 3.2.1, twenty-
seven adult male volunteers, aged between 25-60 years (mean age 39.41 + SD 6.95), were
recruited by word of mouth, or social media to take part. Participants were asked to complete
a health and training questionnaire and based on aerobic exercise and ultra-marathon race
participation, were consequently allocated to one of three groups. Those participants who had
(a) previously completed an ultra-marathon event within the last 8 months, (b) were training
for an event in the next 3 months, and (c) currently averaging more than four hours of
cardiovascular exercise per week, were allocated to the ultra-marathon group. Whilst those
that averaged a minimum of 30 minutes of moderate exercise on most, if not all days, of the
week, and had not taken part, and were not planning to take part, in an ultra-marathon were
allocated to the aerobic group. And finally, those participants that took part in physical activity
for less than 90 minutes, and had not taken part, and were not planning to take part, in an ultra-
marathon, were allocated to the minimal aerobic group.
The ultra-marathon group trained on average between 270 minutes and 720 minutes per week
(mean number of minutes trained 468.0 + SD 136.53), though largely attributed to running,
this did include cycling and swimming. The aerobic group trained on average aerobically
between 150 minutes and 450 minutes per week (mean number of minutes trained 291.0 + SD
93.86). The low aerobic group trained on average aerobically between 0 minutes and 90
minutes per week (mean number of minutes trained per week 47.14 + SD 29.28).
118
5.2.2. Experimental Design Ulster University Research Ethics Committee (UREC) approval was granted (REC.16.0041).
Human tissue was sampled, tested and stored in accordance with the Human Tissue Act (HTA)
2004.
5.2.3. Psychological Measures
Mental Toughness Mental toughness was measured using the Mental Toughness Questionnaire (MTQ48) (Clough
et al., 2002). A detailed description can be obtained by referring to Methodology Section 3.3.1.
Personality Personality was measured using the Big 5 Personality Inventory (Kaiseler et al., 2012). A
detailed description can be obtained by referring to Methodology Section 3.3.2.
Motivation Motivation was measured using the Self-determination Theory, General Causality Orientation
Scale (GCOS) (Deci & Ryan, 1985). A detailed description can be obtained by referring to
Methodology Section 3.3.3.
5.2.4. Physiological Measures
Maximum Oxygen Uptake (V̇O2max Test) Maximum oxygen uptake was measured using an incremental exercise on a motorised
treadmill, increasing the running speed after each one-minute interval. A detailed description
can be obtained by referring to Methodology Section 3.4.1.
Rating of Perceived Exertion (RPE)
119
RPE was recorded every minute through the maximum oxygen uptake test, based on the Borg
6-20 scale (Borg, 1982; Heath, 1998). A detailed description can be obtained by referring to
Methodology Section 3.4.2.
Running Economy Running Economy was recorded as the submaximal oxygen (V̇O2) at a running velocity of
15km/hr (Barnes & Kilding, 2014) and was achieved by all participants. A detailed description
can be obtained by referring to Methodology Section 3.4.3.
Pain Threshold and Tolerance Pain threshold and tolerance was measured using an ice bath (Samuel & Ebenezer, 2013). A
detailed description can be obtained by referring to Methodology Section 3.4.4.
Lactate Inflection Point Lactate inflection point was measured using a portable lactate analyser, at 3-minute intervals
on a treadmill. A detailed description can be obtained by referring to Methodology Section
3.4.5.
Stress Hormones Cortisol changes were determined, as a biomarker for physiological stress, following analysis
of saliva levels prior to, and following, the protocol for quantifying maximum oxygen uptake.
A detailed description can be obtained by referring to Methodology Section 3.4.6.

120
Genetic Testing for the Polymorphism of the 5HTT, BDNF and D4DR Genes Semi Quantitative PCR was performed to compare the expression patterns of the 5HTT, BDNF
and D4DR genes. A detailed description can be obtained by referring to Methodology Section
3.5.2.
5.2.5. Data Analysis A total of 10 participants were tested in the ultra-marathon group, 10 participants were tested
in the aerobic group, and 7 participants volunteered for testing in the low aerobic group.
Descriptive statistics were calculated for the 27 male participants.
Table 5.1 - General Descriptive Statistics Measurement Grouping Mean SD N
Height (cm) Ultra 179.89 9.23 10 Aerobic 178.66 3.38 10
Low 173.91 4.80 7
Total 177.89 6.69 27
Weight (kg)
Ultra 73.42 6.54 10
Aerobic 79.39 8.49 10
Low 86.74 15.47 7
Total 79.08 11.10 27
Average Aerobic exercise per week (minutes)
Ultra 468.00 136.53 10
Aerobic 291.00 93.86 10
Low 47.14 29.28 7
Total 293.33 194.30 27

121
5.2.6. Learning and Development Existing general areas of learning and development, completed for Study 1 were further
enhanced for the successful completion of Study 2, and included: (1) recruitment of
participants, including communication, sharing and completion of health and training
questionnaires using SurveyMonkey; (2) ethics committee submission and revision; (3) design
and following of research protocol; (4) collection and organisation of data; (5) usage of health
and training questionnaires created for Study 1; (6) taking and storage of bloods and saliva
according to Human Tissue Act.
Existing specific areas of learning and development, completed for Study 1 were further
enhanced for the successful completion of Study 2, and included: (1) maximal oxygen uptake
testing; (2) SPSS data analysis. Additional specific areas of learning and development, building
on Study 1 included: (3) taking and recording Lactate Threshold; (4) protocol and measurement
of pain threshold and tolerance; (5) analysis of RNA in a wet lab; (6) analysis of cortisol from
cortisol in lab (7); recording of Rating of Perceived Exertion; (8) analysis and calculation of
SDT GCOS scores.
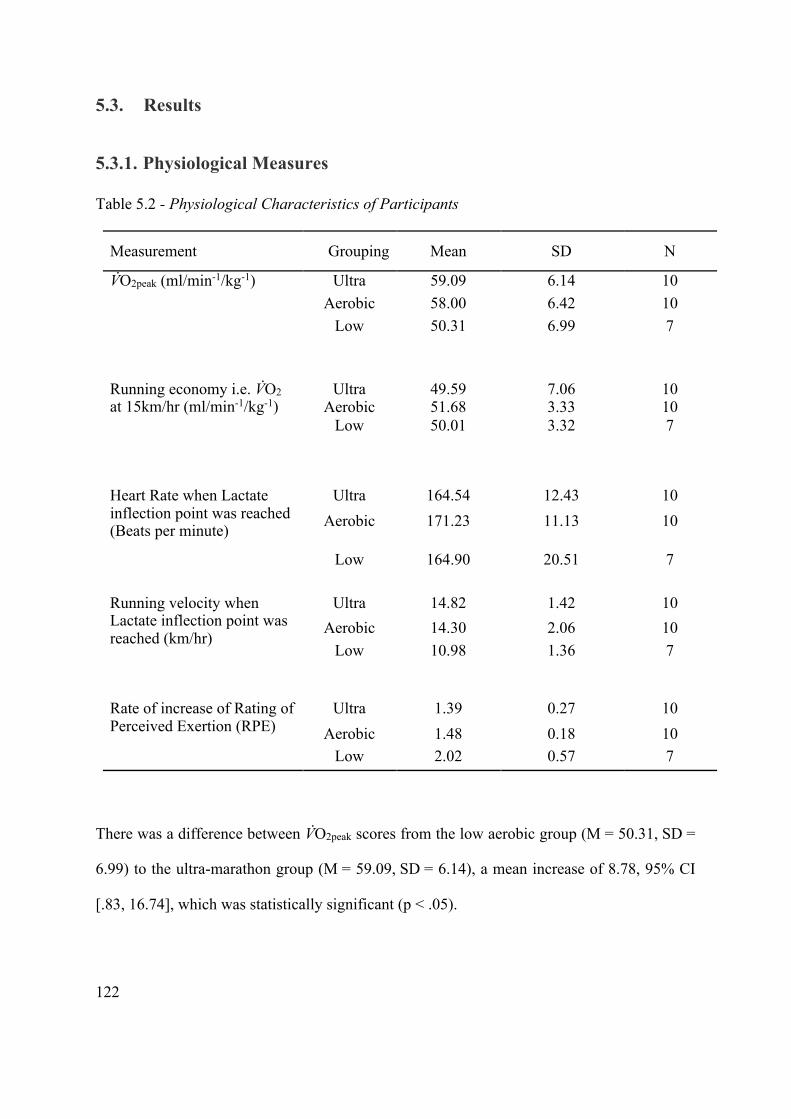
122
5.3. Results
5.3.1. Physiological Measures
Table 5.2 - Physiological Characteristics of Participants
Measurement Grouping Mean SD N
V̇O2peak (ml/min-1/kg-1) Ultra 59.09 6.14 10 Aerobic 58.00 6.42 10
Low 50.31 6.99 7
Running economy i.e. V̇O2 at 15km/hr (ml/min-1/kg-1)
Ultra 49.59 7.06 10 Aerobic 51.68 3.33 10
Low 50.01 3.32 7
Heart Rate when Lactate inflection point was reached (Beats per minute)
Ultra 164.54 12.43 10 Aerobic 171.23 11.13 10
Low 164.90 20.51 7
Running velocity when Lactate inflection point was reached (km/hr)
Ultra 14.82 1.42 10 Aerobic 14.30 2.06 10
Low 10.98 1.36 7
Rate of increase of Rating of Perceived Exertion (RPE)
Ultra 1.39 0.27 10 Aerobic 1.48 0.18 10
Low 2.02 0.57 7
There was a difference between V̇O2peak scores from the low aerobic group (M = 50.31, SD =
6.99) to the ultra-marathon group (M = 59.09, SD = 6.14), a mean increase of 8.78, 95% CI
[.83, 16.74], which was statistically significant (p < .05).

123
There was higher running velocity when lactate inflection point was reached from the low
aerobic group (M =10.98, SD =1.36) to the ultra-marathon group (M = 14.82, SD = 1.42), a
mean increase of 3.84, 95% CI [1.78, 5.9], which was statistically significant (p < .001).
There was a decrease in rate of increase of RPE, from the low aerobic group (M = 2.02, SD =
.57) to the ultra-marathon group (M = 1.39, SD = .27), a mean increase of -.62, 95% CI [-1.05,
-.19], which was statistically significant (p = .004). Rate of increase of RPE was defined as the
slope, or angle, of the line of best fit.
Pain Measures There were no statistically significant differences for pain tolerance and pain threshold between
ultra-marathon, aerobic and low aerobic groups on the combined dependent variables, F(4, 46)
=.174, p > .05; Wilks' Λ = .97; ηp2 = .01
Biochemical Indices There were no statistically significant differences for cortisol pre-testing, cortisol post-testing
and the change in cortisol between ultra-marathon, aerobic and low aerobic groups on the
combined dependent variables, F(4, 44) =.89, p > .05; Wilks' Λ = .95; ηp2 = .02
RNA Expression There were no statistically significant differences for BDNF, D4DR and 5HTT RNA
expression between ultra-marathon, aerobic and low aerobic groups on the combined
dependent variables, F(6, 20) =1.08, p > .05; Wilks' Λ = .57; ηp2 = .24

124
5.3.2. Psychological Measures Mental Toughness There were no statistically significant differences between ultra-marathon, aerobic and low
aerobic groups on the combined MTQ48 variables dependent variables, F(18, 32) =1.35, p >
.05; Wilks' Λ = .32; ηp2 = .43, see Table 5.3.
Table 5.3 - Partial-eta for each of the Individual ANOVA’s Performed
Psychological Measure
Type III Sum of Squares df
Mean Square F Sig.
Partial Eta Squared (ηp2)
MTQ48 Challenge
0.416 2 0.21 0.83 0.45 0.06
MTQ48 Commitment
0.730 2 0.36 1.15 0.33 0.09
MTQ48 Control Total
0.282 2 0.14 0.47 0.63 0.04
MTQ48 Control - emotion
0.050 2 0.02 0.08 0.93 0.01
MTQ48 Control - Life
1.235 2 0.62 1.46 0.25 0.11
MTQ48 Confidence Total
0.241 2 0.12 0.47 0.63 0.04
MTQ48 Confidence - Abilities
0.310 2 0.15 0.64 0.54 0.05
Confidence - Interpersonal
0.936 2 0.47 0.97 0.39 0.07
MTQ48 Total 0.306 2 0.15 0.72 0.50 0.06

125
Self-determination Theory There were no statistically significant differences for SDT scores for autonomy, control and
impersonal, between ultra-marathon, aerobic and low aerobic groups on the combined
dependent variables, SDT variables, F(6, 44) =.97, p > .05; Wilks' Λ = .78; ηp2 = .12.
Big 5 Personality Inventory There was a statistically significant difference in Big 5 Openness scores (see Table 5.4)
between the participants in each group, F(2, 24) = 3.93, p < .05; ηp2 = .247. The effect size is
large according to the partial eta-squared value.
There was an increase in Openness from the low aerobic group (M = 2.91 SD = .51) to the
ultra-marathon group (M = 3.59 SD = .54), a mean increase of -.67, 95% CI [.05, 1.3], which
was statistically significant (p < .05).
Table 5.4 Partial-eta Squared for each of the Individual ANOVA’s Performed
Source Type III Sum of Squares df
Mean Square F Sig.
Partial Eta Squared (ηp2)
Extraversion 0.82 2 0.41 0.62 0.54 0.05
Agreeableness 0.49 2 0.24 0.65 0.53 0.05
Conscientiousness 0.43 2 0.22 0.77 0.47 0.06
Neuroticism 0.10 2 0.50 0.89 0.42 0.07
Openness 2.00 2 1.00 3.93 0.03 0.24

126
Rating of Perceived Exertion (RPE) There was a decrease in Rate of increase of RPE, from the low aerobic group (M = 2.02 SD =
.57) to the ultra-marathon group (M = 1.39 SD = .27), a mean increase of -.62, 95% CI [-1.05,
-.193], which was statistically significant (p = .004).

127
5.3.3. Correlational Analysis
Correlations Between Psychological and Physiological Factors Table 5.5 shows the results of the correlational analyses performed between psychological and
physiological factors.
There were significant correlations between: (a) running economy and MT - control life r(25)
= -.409, p < .05; (b) pain threshold and MT challenge r(25) = .40, p < .05; (c) pain tolerance
and MT confidence interpersonal r (25) = .47, p <.05; (d) amount of weekly aerobic exercise
and, V̇O2peak r (25) = .57, p <.01, running velocity at lactate inflection point r(25)=.68, p < .01;
(e) cortisol pre-test, and agreeableness r (25) = -.55, p < .01
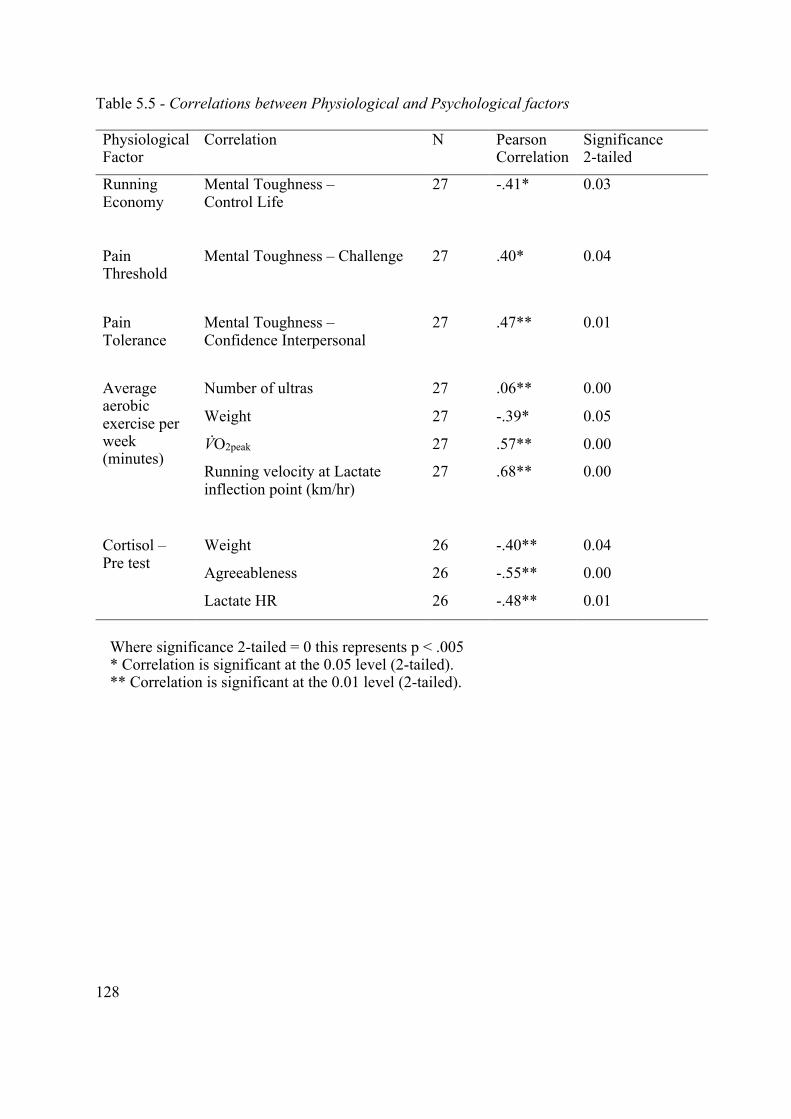
128
Table 5.5 - Correlations between Physiological and Psychological factors Physiological Factor
Correlation N Pearson Correlation
Significance 2-tailed
Running Economy
Mental Toughness – Control Life
27 -.41* 0.03
Pain Threshold
Mental Toughness – Challenge 27 .40* 0.04
Pain Tolerance
Mental Toughness – Confidence Interpersonal
27 .47** 0.01
Average aerobic exercise per week (minutes)
Number of ultras 27 .06** 0.00
Weight 27 -.39* 0.05
V̇O2peak 27 .57** 0.00
Running velocity at Lactate inflection point (km/hr)
27 .68** 0.00
Cortisol – Pre test
Weight 26 -.40** 0.04
Agreeableness 26 -.55** 0.00
Lactate HR 26 -.48** 0.01
Where significance 2-tailed = 0 this represents p < .005 * Correlation is significant at the 0.05 level (2-tailed). ** Correlation is significant at the 0.01 level (2-tailed).

129
There were significant positive correlations between Self-determination Theory (SDT) GCOS,
and Big 5 – Agreeableness and Openness, and MTQ48 Challenge, Commitment and
Confidence – Abilities scores shown in Table 5.6
Table 5.6 Correlations between Motivational Measures (SDT) and other Psychological Factors Physiological Factor
Correlation N Pearson Correlation
Significance 2-tailed
SDT – Autonomy
MTQ48 Challenge 27 .51** 0.01
MTQ48 Commitment 27 .38* 0.05
SDT – Impersonal
Big 5 Extraversion 27 -.73** 0.00
Big 5 Conscientiousness 27 -.40* 0.04 Big 5 Neuroticism 27 .53** 0.00 MTQ48 Challenge 27 -.48** 0.01 MTQ48 Commitment 27 -.43* 0.02 MTQ48 Control - Total 27 -.58** 0.00 MTQ48 Control - Emotion 27 -.43* 0.02 MTQ48 Control - Life 27 -.58** 0.00 MTQ48 Confidence Total 27 -.74** 0.00 MTQ48 Confidence -Abilities
27 -.65** 0.00
MTQ48 Confidence – Interpersonal
27 -.65** 0.00
SDT – Control
Big 5 Agreeableness 27 -.40* 0.04
MTQ48 Commitment 27 -.41* 0.03 MTQ48 Control – Total 27 -.42* 0.03
Where significance 2-tailed = 0 this represents p < .005 * Correlation is significant at the 0.05 level (2-tailed). ** Correlation is significant at the 0.01 level (2-tailed). There were significant positive correlations between Big 5 personality and both SDT and
MTQ48 shown in Table 5.7

130
Table 5.7 - Correlations between Big 5 Personality Measures and other Psychological Factors Physiological Factor Correlated with N Pearson
Correlation Significance Two--tailed
Big 5 – Extraversion SDT Impersonal 27 -.73** 0.00 MTQ48 Control Total 27 .60** 0.00 MTQ48 Control – Emotion 27 .45* 0.02 MTQ48 Control Life 27 .58** 0.00 MTQ48 Confidence – Total 27 .70** 0.00 MTQ48 Confidence – Abilities 27 .68** 0.00 MTQ48 Confidence – Interpersonal
27 .53**
0.00
Big 5 – Agreeableness
SDT Impersonal 27 -.40* 0.04 MTQ48 Control - Emotion 27 .39* 0.05
Big 5 – Conscientiousness
MTQ48 Challenge 27 .46* 0.01 MTQ48 Commitment 27 .81** 0.00 MTQ48 Control Total 27 .48* 0.01 MTQ48 Control Life 27 .54** 0.00 MTQ48 Confidence – Total 27 .42* 0.03 MTQ48 Confidence – Abilities 27 .43*
0.03
SDT Impersonal 27 -.40* 0.04
Big 5 – Neuroticism SDT Impersonal 27 .53** 0.00 MTQ48 Challenge 27 -.41* 0.03 MTQ48 Commitment 27 -.44* 0.02 MTQ48 Control – Total 27 -.83** 0.00 MTQ48 Control – Emotion 27 -.70** 0.00 MTQ48 Control – Life 27 -.75** 0.00 MTQ48 Confidence – Total 27 -.83** 0.00 MTQ48 Confidence – Abilities 27 -.73** 0.00 MTQ48 Confidence – Interpersonal
27 -.71**
0.00
Big 5 – Openness MTQ48 Challenge 27 .46* 0.01 MTQ48 Confidence – Abilities 27 .42*
0.03

131
Where significance 2-tailed = 0 this represents p < .005 * Correlation is significant at the 0.05 level (2-tailed). ** Correlation is significant at the 0.01 level (2-tailed). There were significant positive correlations within MTQ48 Mental Toughness, SDT and Big
5 shown in Table 5.8
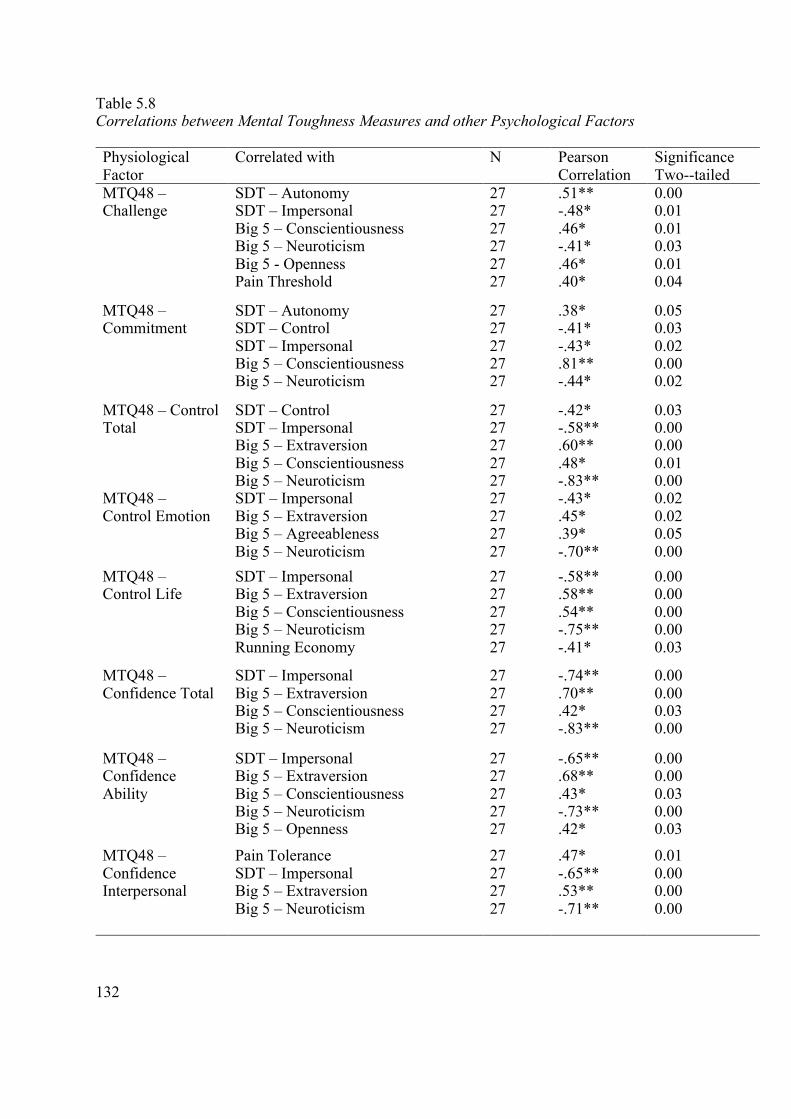
132
Table 5.8 Correlations between Mental Toughness Measures and other Psychological Factors Physiological Factor
Correlated with N Pearson Correlation
Significance Two--tailed
MTQ48 – Challenge
SDT – Autonomy 27 .51** 0.00 SDT – Impersonal 27 -.48* 0.01 Big 5 – Conscientiousness 27 .46* 0.01 Big 5 – Neuroticism 27 -.41* 0.03 Big 5 - Openness 27 .46* 0.01 Pain Threshold 27 .40* 0.04
MTQ48 – Commitment
SDT – Autonomy 27 .38* 0.05 SDT – Control 27 -.41* 0.03 SDT – Impersonal 27 -.43* 0.02 Big 5 – Conscientiousness 27 .81** 0.00 Big 5 – Neuroticism 27 -.44* 0.02
MTQ48 – Control Total
SDT – Control 27 -.42* 0.03 SDT – Impersonal 27 -.58** 0.00 Big 5 – Extraversion 27 .60** 0.00 Big 5 – Conscientiousness 27 .48* 0.01 Big 5 – Neuroticism 27 -.83** 0.00
MTQ48 – Control Emotion
SDT – Impersonal 27 -.43* 0.02 Big 5 – Extraversion 27 .45* 0.02 Big 5 – Agreeableness 27 .39* 0.05 Big 5 – Neuroticism 27 -.70** 0.00
MTQ48 – Control Life
SDT – Impersonal 27 -.58** 0.00 Big 5 – Extraversion 27 .58** 0.00 Big 5 – Conscientiousness 27 .54** 0.00 Big 5 – Neuroticism 27 -.75** 0.00 Running Economy 27 -.41* 0.03
MTQ48 – Confidence Total
SDT – Impersonal 27 -.74** 0.00 Big 5 – Extraversion 27 .70** 0.00 Big 5 – Conscientiousness 27 .42* 0.03 Big 5 – Neuroticism 27 -.83** 0.00
MTQ48 – Confidence Ability
SDT – Impersonal 27 -.65** 0.00 Big 5 – Extraversion 27 .68** 0.00 Big 5 – Conscientiousness 27 .43* 0.03 Big 5 – Neuroticism 27 -.73** 0.00 Big 5 – Openness 27 .42* 0.03
MTQ48 – Confidence Interpersonal
Pain Tolerance 27 .47* 0.01 SDT – Impersonal 27 -.65** 0.00 Big 5 – Extraversion 27 .53** 0.00 Big 5 – Neuroticism 27 -.71** 0.00

133
Where significance 2-tailed = 0 this represents p < .005 * Correlation is significant at the 0.05 level (2-tailed). ** Correlation is significant at the 0.01 level (2-tailed).
134
5.4. Discussion Study 2 was designed to identify the psychological and physiological differences between
ultra-marathoners and non-ultra-marathoners participating in either regular aerobic exercise or
completing a minimal volume of regular aerobic exercise. The present study ascertained that
ultra-marathoners are identifiable by their openness to new experiences but not their mental
toughness, or motivation. In support of the findings of Study 1 (Chapter 4), this study reported
that a higher volume of aerobic training appears to be associated with improved fitness, as
evidenced by V̇O2peak, running velocity at lactate inflection point, and RPE, for both the ultra-
marathon group, and the aerobic group, when compared with the group performing minimal
aerobic exercise. This study identified a moderate relationship between increased mental
toughness and running economy, pain threshold and tolerance. This suggests that although
mental toughness does not predict participation in ultra-marathons, it may benefit factors that
impact performance in ultra-marathon events.
This discussion will firstly consider the associated psychological measures, including mental
toughness, personality and motivation, of participants, and the lack of significant differences
between ultra-marathoners and non-ultra-marathoners, except openness. The second part of the
discussion will consider the physiological differences including aerobic capacity, running
velocity at lactate inflection point, and rate of increase in RPE. An examination of 5HTT,
BDNF, D4DR gene expression across groups will be outlined, along with a discussion of the
potential impact of the study findings on our understanding of how heritability impacts
endurance performance, both in test and under race conditions. The discussion will further
consider limitations of the study, and future research, throughout.

135
An implication of this study, is that ultra-marathoners are not higher in mental toughness, as
measured by the MTQ48 instrument, than non-ultra-marathoners. Findings are in contrast to
the majority of research into mental toughness in sport, that suggest mental toughness is
associated with sporting performance and success (Connaughton et al., 2008; Crust & Clough,
2005; Gucciardi et al., 2016; Jones et al., 2002). In contrast, to the vast majority of research,
which has focussed on elite athletes, a more recent study, including recreationally active
participants, also failed to identify any significant differences between levels of triathlon
training and mental toughness (Marshall et al., 2017). Lack of differences in mental toughness
may be a result of methodological limitations resulting from the validity, and accuracy, of
measuring mental toughness via the self-report nature of the MTQ48. Furthermore, if mental
toughness is indeed a state-like psychological resource, which though enduring, may vary
across situations or time (Gucciardi, 2017, 2017a), and measures are recorded at different point
in training or in completion, scoring may be affected. It is therefore questionable whether the
participants measured can be mentally tough all the time, leading to the suggestion that mental
toughness whilst some properties may persist, there may be study limitations in its
measurement (Gucciardi, 2017). Researchers have also raised a concern that the MTQ48 may
be less appropriate to specific populations that require language more apposite to the context
(Gucciardi et al., 2016), in this research, ultra-marathoners. There are therefore limitations
within this study, including the assumption that performance success can be measured via tests
in a lab, raising concerns regarding ecological validity, and therefore challenge the associations
identified between mental toughness and physiological. Additionally, fundamental concerns
have been raised regarding the arbitrariness of measures, validity, and usefulness, of the
concept of mental toughness itself, and the possibility that the conceptual underpinning of the
MTQ48 are unsubstantiated or that the metrics used are arbitrary (Blanton & Jaccard, 2006;
Gucciardi et al., 2012).
136
Limited research exists regarding either the ability of mentally tough athletes to manage pain,
or the quantitative, or qualitative, measurement of pain in ultra-marathoners. Research by Levy
et al. (2006) interviewed seventy patients undertaking a sports injury clinic for tendonitis and
ascertained that mentally tough athletes were more likely to accept pain and perceive it as less
threatening. However, pain measurements taken from athletes competing in extreme, multi-
day, foot race suggested, higher cold pain tolerances than controls (Freund et al., 2013), and
research into knee pain suggested that mental toughness impacted behaviour in response to
pain (Gucciardi et al., 2016). The current study however has failed to associate pain threshold
or tolerance with participation in ultra-marathons. However, inconsistencies may be due to the
nature of the pain, or discomfort experienced, and methodological limitations, due to a focus
on quantitative scoring. Measurement of pain through cold water immersion may differ
qualitatively from the discomfort, or pain, experienced during an endurance event, and this
may suggest the need for additional research to more comprehensively understand the nature
of suffering, within context, during an ultra-marathon. Indeed, research by O’Leary, Collett,
Howells & Morris (2017) muscle pain tolerance can be increase in response to multiple
exposure to high-intensity training and warrants further research.
Analysis of data from Study 2 suggests that ultra-marathoners are identifiable through
openness, and therefore are open to new challenges, but are not identifiable according to the
remaining Big 5 personality traits, comprised of conscientiousness, extraversion, agreeableness
and neuroticism. This is in contrast to findings of other, larger studies exploring personality,
although the vast majority of sports researchers focus on elite athletes, with a paucity of
research in to amateur sports (Allen et al., 2011; Kaiseler et al., 2012, 2017). Though
personality has been linked with sports performance, results have been contradictory, with
limited knowledge regarding the effect personality has on appraisal, coping effectiveness in

137
sport, and the ability to handle stress (Kaiseler et al., 2017). Furthermore, evidence from
population-based studies appears to be difficult to generalise and associations between
personality and success in sport have been unconvincing (Allen et al., 2011). In previous
research into exercise capacity, no differences were identified in openness, extraversion,
agreeableness and neuroticism when athletes scored against non-athletes, but higher scores
were observed for conscientiousness (Malinauskas et al., 2014). Allen et al. (2011) observed a
relationship between the Big 5 personality traits and the selection of coping strategies,
prediction of short-term behaviours and long-term success, and differences between higher and
lower level athletes. Effect sizes in this study indicate that if the population were larger there
may be a statistical significance between the ultra-marathon group, and the non-ultra-marathon
group.
Although used to study a wide variety of sport-related behaviours, there have been few
investigations into the application of motivational frameworks in ultra-marathoners. The
review performed by Roebuck (2018) identified only 9 studies, with a consensus that ultra-
marathoners took part in the sport: (1) to achieve personal goals, (2) for reasons related to
health, (3) for reasons of self-esteem. Analysis of the data from the current study shows that
motivation, as defined by the self-determination theory, is not a factor in training for, or the
completion of, an ultra-marathon. The General Causality Orientation Scale (Deci & Ryan,
1985) was utilised to measure enduring motivational orientation, by testing items, that describe
typical, social or achievement-oriented situations with responses indicating either an
autonomous, controlled, or impersonal type of motivation. Based on a review of the literature,
no other research has utilised the SDT GCOS instrument to measure motivation in ultra-
marathoners. This study is limited to measurement of the participants orientations, using the
SDT GCOS scale, and other instruments may have been more apposite. Indeed, a previous

138
study, attempting to better understand the motivation to run, using an alternative set of
instruments, did report increased intrinsic motivation in ultra-marathoners compared with half-
marathoners and marathoners (Hanson et al., 2015). In addition, Krouse et al. (2011) identified
ultra-marathoners as being more internally motivated, and Ferrer et al. (2015) found health-
related motivation were positively linked to the amount of distance covered in a time-limited
ultra-marathon.
Participation in ultra-endurance races places participants under varying levels of both
psychological and physiological stress (Lac & Berthon, 2000). Acute physical stress has been
shown to increase levels of the hormone cortisol, and testosterone, in the body, with post-
exercise levels typically observed to be significantly higher than pre-exercise levels when
participants took part in interval, tempo and circuit training (Tanner et al., 2013). Results of
previous studies indicate levels of cortisol tend to increase as a product of both the intensity
and duration of exercise, whilst testosterone tends to fall, following an initial increase, after 3
or more hours of exercise (Lac & Berthon, 2000). In contrast, the lack of positive correlations
between mental toughness and changes in the stress marker cortisol, measured prior to, and
following, maximal aerobic testing, suggests either, there is no increased ability by mentally
tough participants to push their physiology to a greater intensity, or, that other psychological
factors are involved in overall race success not included in Study 2.
The findings of this study suggest that participants, with increased levels of agreeableness,
have lower levels of pre-test stress. This may be as a result of a tendency to be more
cooperative, and less suspicious, resulting in lower levels of agitation, or according to other
research, athletes exposed previously to physiological stress from exercise may become
accustomed and exhibit reduced levels of stress hormones (Tanner et al., 2013). Also, other
research suggests cortisol levels may be suppressed at later stages of an ultra-marathon event,

139
potentially avoiding subsequent negative impacts of continually high cortisol levels (Deneen
& Jones, 2017). A reduction in pre-test stress may benefit participants in terms of reduced
interruption to mental preparation, though this was not evidenced by improved aerobic
measures in this study. However, it is believed that pre-competition, increased cortisol levels
may be an adaptive response, and can help athletes to meet the demands of competition
(Kivlighan et al., 2005). In addition, this study did not consider, or control for, other conflicting
factors, including time of day, or duration or intensity of training immediately prior to testing,
that may affect results (Lac & Berthon, 2000; Tanner et al., 2013).
V̇O2max measures the maximum rate at which oxygen is consumed during oxidative
phosphorylation, the metabolic pathway supplying energy used to reform adenosine
triphosphate (ATP), and is highly correlated with maximal cardiac output. Despite the frequent
use of maximal oxygen consumption (V̇O2max) to assess overall physical fitness and provide a
measure of the body’s ability to deliver oxygen to working muscles, questions have been raised
regarding its efficacy as a good predictor of performance in endurance events (Haff & Dumke
2012; Tsigilis, 2005). Analysis of results from the present programme of research indicate that
the maximum ability of the oxidative system to produce ATP during exercise, which is the
highest rate at which oxygen can be taken up, and transported to skeletal muscles and utilised
for running, is higher in ultra-marathoners than in those who perform little training (Haff &
Dumke 2012). Although a difference between groups was not evident for motivation, it is
worth noting that the termination of the V̇O2peak test may be driven by motivational factors,
rather than physiological parameters (McArdle et al., 2015). Prior research has identified a
strong association between intrinsic motivation and performance of a shuttle test, a commonly
used technique, to measure aerobic fitness and predict V̇O2max (Tsigilis, 2005). In addition, and
a further limitation of this study, for participants with less experience of aerobic training,
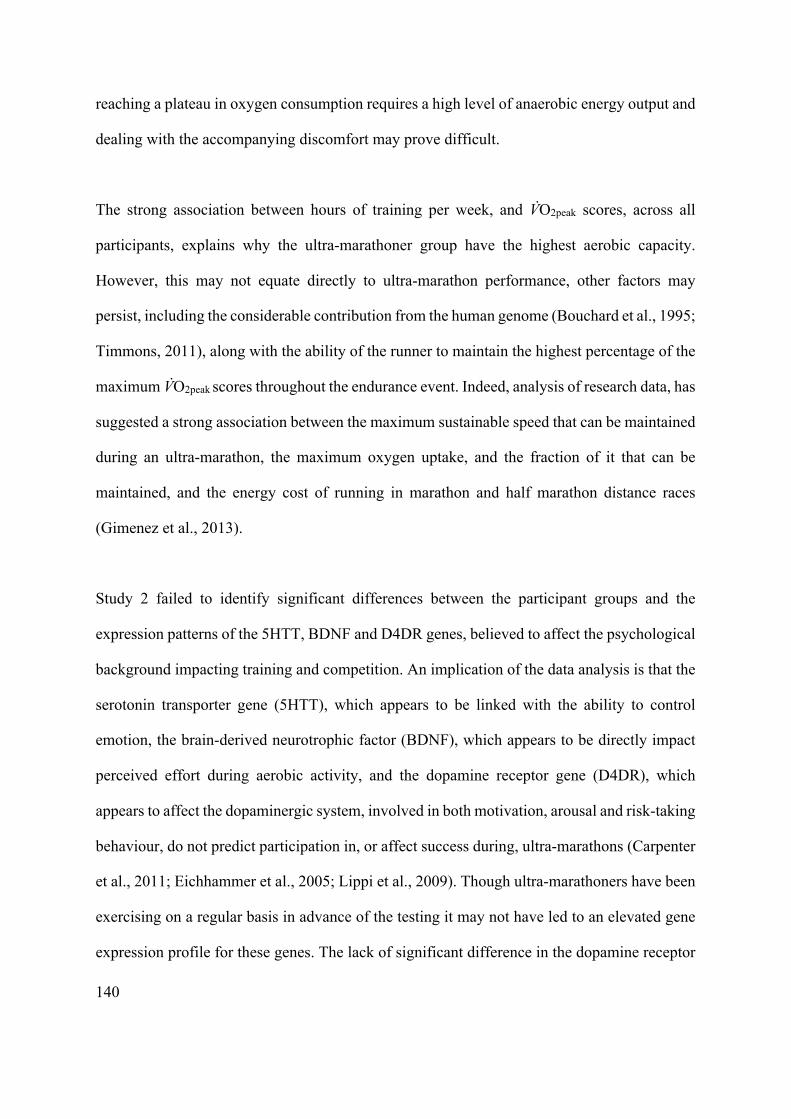
140
reaching a plateau in oxygen consumption requires a high level of anaerobic energy output and
dealing with the accompanying discomfort may prove difficult.
The strong association between hours of training per week, and V̇O2peak scores, across all
participants, explains why the ultra-marathoner group have the highest aerobic capacity.
However, this may not equate directly to ultra-marathon performance, other factors may
persist, including the considerable contribution from the human genome (Bouchard et al., 1995;
Timmons, 2011), along with the ability of the runner to maintain the highest percentage of the
maximum V̇O2peak scores throughout the endurance event. Indeed, analysis of research data, has
suggested a strong association between the maximum sustainable speed that can be maintained
during an ultra-marathon, the maximum oxygen uptake, and the fraction of it that can be
maintained, and the energy cost of running in marathon and half marathon distance races
(Gimenez et al., 2013).
Study 2 failed to identify significant differences between the participant groups and the
expression patterns of the 5HTT, BDNF and D4DR genes, believed to affect the psychological
background impacting training and competition. An implication of the data analysis is that the
serotonin transporter gene (5HTT), which appears to be linked with the ability to control
emotion, the brain-derived neurotrophic factor (BDNF), which appears to be directly impact
perceived effort during aerobic activity, and the dopamine receptor gene (D4DR), which
appears to affect the dopaminergic system, involved in both motivation, arousal and risk-taking
behaviour, do not predict participation in, or affect success during, ultra-marathons (Carpenter
et al., 2011; Eichhammer et al., 2005; Lippi et al., 2009). Though ultra-marathoners have been
exercising on a regular basis in advance of the testing it may not have led to an elevated gene
expression profile for these genes. The lack of significant difference in the dopamine receptor

141
gene (D4DR) expression, is in contrast to the findings that identify clear differences in the
personality trait, openness, despite links to risk-taking behaviour. On the basis of these results
it can be suggested that D4DR is not linked to openness. It should however be noted as a
methodological limitation, that bloods were not take before, and after, aerobic testing;
therefore, this study did not identify long term upregulation or downregulation, rather than
transient, changes to the genetic expression of the 5HTT, BDNF and D4DR genes, as seen in
existing research (Ulucan, 2016).
A further limitation arises from the participants included in the study. The findings cannot be
extrapolated beyond those tested; neither females nor elite athletes were included as
participants and warrants future research. In addition, this study’s aim was to measure and
compare psychophysiological factors between ultra-marathoners and non-ultra-marathoners,
the research design did not facilitate analysis of the intra-relationships between factors in
individual ultra-marathoners.
Key strengths of this study include the further delineation of non-ultra-marathoners tested in
Study 1, and the clear examination of participants from a variety of physical abilities, including
well-trained ultra-marathoners, aerobically fit non-ultra-marathoners, and minimally trained,
low aerobic participants. The analysis compares physiological measures against psychological
factors including motivation, mental toughness and personality. Analysis of the findings does
not provide support for the view that mental toughness is a key factor in endurance success, or
that mentally tough ultra-endurance runners are more likely to reach increased levels of
physiological stress. As discussed, limitations of this study include the recognition that all
testing was performed under laboratory conditions, which may lack ecological validity and not
be representative of success in the context of an endurance challenge, and that psychological

142
and physiological measurement was at a single time point, which is not likely to be consistent
across training schedules for all runners. Although the findings should be treated with caution,
for the limitations discussed, the results of this study indicate that psychological factors,
including personality and mental toughness, impacted by inheritability, are not factors in
participation in ultra-marathons in the current sample and as they are in contrast to an existing
body of research, warrant further investigation. Further research, detailed in Study 3 (Chapter
6), was required to more comprehensively understand the motivations of runners, the
personality and mental toughness measures, outside of the laboratory, when compared with
levels of success within an ultra-marathon race setting.

143
CHAPTER SIX

144
6. Study 3: Psychological and Physiological Factors Influencing Ultra-Marathon Race Performance: A Field Experiment
Abstract Psychological and physiological factors were examined, as part of a repeated measures,
interdisciplinary study, to ascertain what influenced successful performance in ultra-
marathoners, as measured by race placings, within a single event. Participants were all male
(M age = 41.82, SD = 10.02) participating in a 60km off road ultra-marathon. Participants
completed psychological tests for mental toughness (Mental Toughness Questionnaire 48),
motivation (Self-determination Theory, SDT GCOS Scale) and personality dimensions (Big 5
Personality Inventory), along with the physiological measurement of stress hormone changes,
including testosterone and cortisol, as biomarkers of physiological stress, and important
indicators of the effort expended. There were no differences between cortisol measures
recorded in advance of, and following the event, however there was a significant decrease in
testosterone. There were significant negative correlations, between pre-event cortisol and,
confidence (MTQ48) (p <.05) and extraversion (p <.05), and positive correlations between pre-
event cortisol and neuroticism (p <.05). There were significant negative correlations, between
post-event cortisol and, impersonal motivation (SDT) (p <.05), between age and absolute race
position (p <.05), and between age and all mental toughness factors (p <.05). Collectively,
these findings suggest that mental toughness, personality and motivational measurements did
not predict race success, but that some psychological characteristics impact the stress hormone,
cortisol. Additionally, the study demonstrated a significant relationship between age of the
participant and associated race times, wherein there was a decline in race performance with
increased age.

145
6.1. Introduction Completion of an ultra-marathon requires overcoming both psychological and physiological
challenges, with multiple factors influencing performance, including competition taking place
in difficult environments: extreme weather conditions, terrain, and considerable changes in
elevation (Baumann et al., 2014; Knechtle et al., 2010; Krouse et al., 2011; Zach et al., 2017).
There is a growing body of research quantifying the physiological and psychological factors
that predict performance success in sport, but little is known about the impact of these factors
outside of a laboratory setting and how they can predict race times in ultra-marathon events
(Holt et al., 2014; Pearson, 2006). At the cost of losing experimental control, conducting
research at an ultra-endurance event has its advantages, as it can increase ecological validity
and provide opportunities for generalisability to race performance.
Indeed, Holt et al. (2014) examined athletes’ experiences of running an ultra-marathon by
performing qualitative data collection techniques throughout the duration of an event, and
identified that runners use coping strategies, and psychological skills, including monitoring
pace, nutrition and hydration, and breaking down the demands of the race into achievable goals.
In another study, involving self-reported measures of trait emotional intelligence, during a
multi-day ultra-marathon, analysis of results suggested that runners accept fatigue as necessary
to achieve goals (Lane & Wilson, 2011). Few interdisciplinary studies have attempted to
compare psychological measures with either race success, or physiological stress, as measured
by the changes in the hormone, cortisol.
Researchers have shown that personality characteristics can, in part, predict whether an athlete
participates at a certain level of competition, and can also impact the selection of coping

146
mechanisms that may affect sporting performance (Allen et al., 2011). Analysis into the
benefits of individual traits in sport, has demonstrated that conscientious athletes are more
likely to use emotion-focussed strategies, and thereby change their personal reactions to the
stressor, whilst extraverted athletes, open to new experiences and emotionally stable, are more
likely to adopt problem-focussed strategies, concentrating on resolving the problem in an
attempt to reduce the stressors (Allen et al., 2011). Conscientiousness has been reported as
being significantly higher in athletes than non-athletes, underpinned by both common genetic
and non-shared environmental factors, and linked to mental toughness (Horsburgh et al., 2009;
Malinauskas et al., 2014).
Mental toughness has been described as a complex psychological concept linked to the ability
to consistently optimise human performance despite contextual demands (Crust & Keegan,
2010; Mahoney et al., 2014; 2014a). Early research by Crust and Clough (2005) into mental
toughness identified a strong link with physical endurance during a dumbbell holding task and
suggested that mentally tough participants benefit from a buffering effect that blocks out pain.
More recently, research by Cowden (2016) identified significant relationships between mental
toughness and performance indicators within tennis competitions; whilst in a subsequent
review (Cowden, 2017), three studies, out of ten that examined competitive standard
differences in mental toughness, used the MTQ48. A study of adolescent cross-country runners
reported that mental toughness was inversely associated with race times (Mahoney et al., 2014).
Based on their findings, Mahoney et al. (2014) suggested that mental toughness may be linked
to variables within the Self-determination Theory of motivation (see Section 3.3.3 for a
description), and that a more comprehensive understanding of both mental toughness and SDT
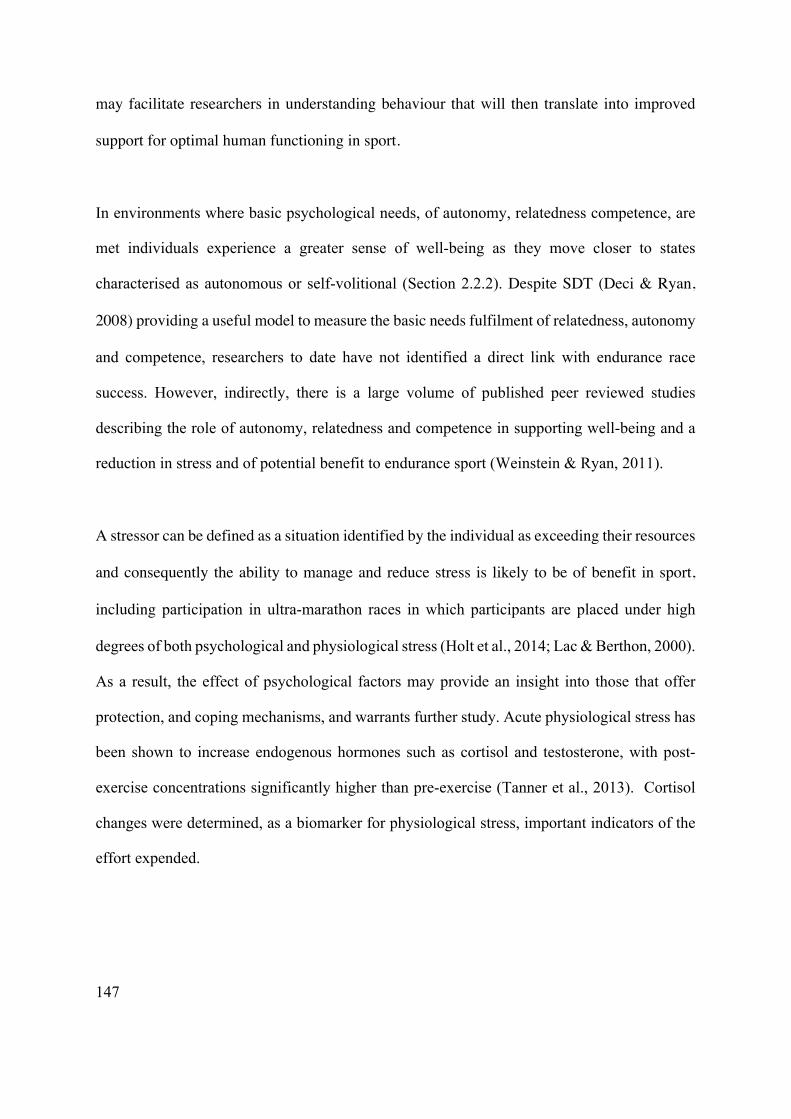
147
may facilitate researchers in understanding behaviour that will then translate into improved
support for optimal human functioning in sport.
In environments where basic psychological needs, of autonomy, relatedness competence, are
met individuals experience a greater sense of well-being as they move closer to states
characterised as autonomous or self-volitional (Section 2.2.2). Despite SDT (Deci & Ryan,
2008) providing a useful model to measure the basic needs fulfilment of relatedness, autonomy
and competence, researchers to date have not identified a direct link with endurance race
success. However, indirectly, there is a large volume of published peer reviewed studies
describing the role of autonomy, relatedness and competence in supporting well-being and a
reduction in stress and of potential benefit to endurance sport (Weinstein & Ryan, 2011).
A stressor can be defined as a situation identified by the individual as exceeding their resources
and consequently the ability to manage and reduce stress is likely to be of benefit in sport,
including participation in ultra-marathon races in which participants are placed under high
degrees of both psychological and physiological stress (Holt et al., 2014; Lac & Berthon, 2000).
As a result, the effect of psychological factors may provide an insight into those that offer
protection, and coping mechanisms, and warrants further study. Acute physiological stress has
been shown to increase endogenous hormones such as cortisol and testosterone, with post-
exercise concentrations significantly higher than pre-exercise (Tanner et al., 2013). Cortisol
changes were determined, as a biomarker for physiological stress, important indicators of the
effort expended.

148
Collectively these studies provide an insight into the physiological and psychological factors
that influence successful performance in sport but fall short of providing a model to predict
race success in endurance events. Indeed, despite research findings suggesting that training
intensity, improved running economy, and sufficient recovery time are positively linked with
race performance, a study of cardiorespiratory parameters in multi-stage mountain marathon
racers, measured in a laboratory environment, failed to predict race success (Barnes & Kilding,
2014; Gatterer et al., 2013; Knechtle et al., 2010). Gatterer et al., (2013) suggested that ultra-
marathoners need a moderate, but not an extraordinary V̇O2max, and that pain tolerance, mental
toughness, and pacing strategy should be explored further.
Despite considerable research in the field of mental toughness and personality in sport,
relatively little attention has been directed towards quantitative research to identify whether
mental toughness, personality and motivation anticipate success in an ultra-marathon race. The
main aim of this study was to test the use of MTQ48, Big-5 Personality Inventory, and the Self-
determination Theory GCOS for predicting success, as measured by time to finish, and placing,
in an ultra-marathon race. A secondary aim was to contribute to current understanding of
endurance athletes competing in an ultra-marathon event by exploring relationships between
mental toughness, personality, motivation, race times, and changes in stress hormone
biochemistry. This is the first study to quantify psychological factors in ultra-marathoners
participating in a single race and will contribute to knowledge by identifying those measures
that predict successful performance. Three hypotheses will be tested: a) it was hypothesised
that there will be no significant positive correlation between race success, as represented by a
lowered finishing race position and time, and mental toughness, personality scores and
motivational scores from questionnaires completed by ultra-marathon runners; b) it was
hypothesised that there will be no significant correlation between changes in the stress hormone

149
measurements taken from the ultra-marathon racers, and mental toughness, personality scores
and motivational scores from questionnaires completed by ultra-marathon runners; and finally
c) it was hypothesised there will be no significant differences in the measurements of the stress
hormones, cortisol and testosterone, between ultra-marathon participants prior to, and
following, competition.

150
6.2. Methods
6.2.1. Participant Characteristics With agreement from the race organiser (26 Extreme, Northern Ireland,
http://www.26extreme.com), an email was sent to 70 male race entrants registered for the 2015
Causeway Coast ultra-marathon in Northern Ireland to invite them to be involved in the study.
The ultra-marathon is an annual running race covering 40 miles of rugged, undulating
coastline, mostly off-road, on paths, tracks, beaches and cliff tops. 21 adult males got in contact
and were subsequently recruited via email, one subsequently decided not to proceed with the
study as a participant, leaving a total of 20 adult male participants (mean age 41.82 + SD 10.02)
who were asked to complete an online health questionnaire and training questionnaire (see
Section 9.1) using SurveyMonkey. If no pre-existing physical conditions prevented
participation, they were included in the study. All participants were fully briefed regarding the
testing protocol prior to measurement.
6.2.2. Experimental Design Ulster University Research Ethics Committee (UREC) granted approval for this study
(REC.15.0050). Human tissue was sampled, tested and stored in accordance with the Human
Tissue Act (HTA) 2004.
A repeated measures design was adopted. Psychological parameters were recorded in advance
of a chosen ultra-marathon race whilst cortisol and testosterone concentration were sampled at
2 time-points, immediately prior to, and following, successful competition.

151
6.2.3. Psychological Measures
Mental Toughness Mental toughness was measured using the Mental Toughness Questionnaire (MTQ48) (Clough
et al., 2002). A detailed description can be obtained by referring to Methodology Section 3.3.1.
Personality Personality was measured using the Big 5 Personality Inventory (Kaiseler et al., 2012). A
detailed description can be obtained by referring to Methodology Section 3.3.2.
Motivation Motivation was measured using the General Causality Orientation Scale (GCOS) (Deci &
Ryan, 1985). A detailed description can be obtained by referring to Methodology Section 3.3.3.
6.2.4. Physiological Measures
Stress Hormones Cortisol changes were determined, as a biomarker for physiological stress, and an indicator of
effort, following analysis of saliva levels prior to, and following, competition. A detailed
description can be obtained by referring to Methodology Section 3.4.6.
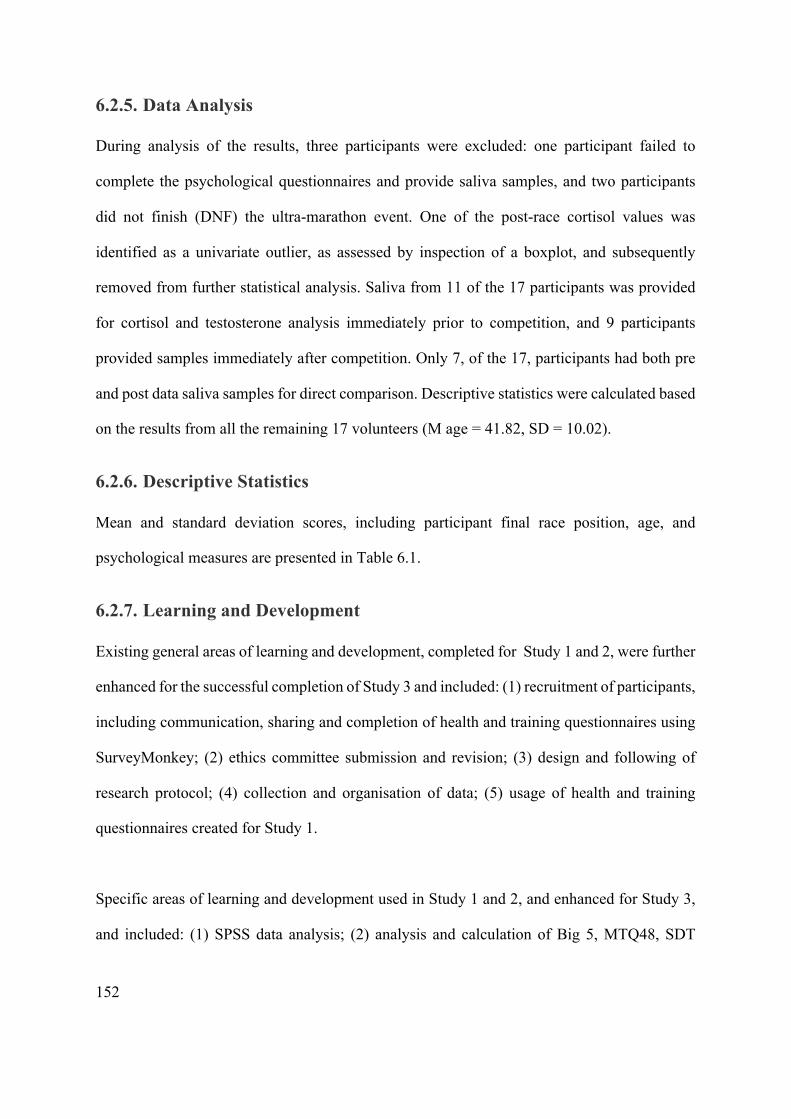
152
6.2.5. Data Analysis During analysis of the results, three participants were excluded: one participant failed to
complete the psychological questionnaires and provide saliva samples, and two participants
did not finish (DNF) the ultra-marathon event. One of the post-race cortisol values was
identified as a univariate outlier, as assessed by inspection of a boxplot, and subsequently
removed from further statistical analysis. Saliva from 11 of the 17 participants was provided
for cortisol and testosterone analysis immediately prior to competition, and 9 participants
provided samples immediately after competition. Only 7, of the 17, participants had both pre
and post data saliva samples for direct comparison. Descriptive statistics were calculated based
on the results from all the remaining 17 volunteers (M age = 41.82, SD = 10.02).
6.2.6. Descriptive Statistics Mean and standard deviation scores, including participant final race position, age, and
psychological measures are presented in Table 6.1.
6.2.7. Learning and Development Existing general areas of learning and development, completed for Study 1 and 2, were further
enhanced for the successful completion of Study 3 and included: (1) recruitment of participants,
including communication, sharing and completion of health and training questionnaires using
SurveyMonkey; (2) ethics committee submission and revision; (3) design and following of
research protocol; (4) collection and organisation of data; (5) usage of health and training
questionnaires created for Study 1.
Specific areas of learning and development used in Study 1 and 2, and enhanced for Study 3,
and included: (1) SPSS data analysis; (2) analysis and calculation of Big 5, MTQ48, SDT

153
GCOS scores; (3) analysis of cortisol from cortisol in lab (4). Additional specific areas of
learning and development, building on Study 1 and 2 included: (5) taking and storage of saliva
according to Human Tissue Act in a race environment.

154
Table 6.1 Age, Training, Psychological and Physiological Characteristics
Measures Mean SD N* Age 41.82 10.02 17 Hours Training (highest in last four weeks) 9.01 2.63 17 Race Position (Absolute) 32 23.55 17 Time to complete race (seconds) 27307.94 4688.39 17 Race Position (Relative) 9.00 5.05 17 Pre-race Cortisol (μg/dL) .37 0.15 11 Post-race Cortisol (μg/dL) .89 0.73 9 Difference between two measurements of cortisol (μg/dL) .26 0.36 7 Pre-race Testosterone (pg/mL) 115.27 38.56 11 Post-race Testosterone(pg/mL) 97.26 30.71 9 Difference between two measurements of testosterone (pg/mL)
-35.20 34.08 7
SDT - Autonomy 5.69 0.65 17 SDT - Control 3.7 0.63 17 SDT - Impersonal 3.02 0.99 17 Big 5 - Extraversion 3.23 0.86 17 Big 5 - Agreeableness 3.90 0.65 17 Big 5 - Conscientiousness 3.89 0.67 17 Big 5 - Neuroticism 2.55 0.88 17 Big 5 - Openness 3.53 0.58 17 MTQ48 - MT Total 3.68 0.51 17 MTQ48 – MT Challenge 3.94 0.61 17 MTQ48 – MT Commitment 3.93 0.54 17 MTQ48 – MT Control Total 3.57 0.54 17 MTQ48 – MT Control Emotion 3.34 0.67 17 MTQ48 – MT Control Life 3.79 0.60 17 MTQ48 – MT Confidence Total 3.48 0.62 17 MTQ48 – MT Confidence Ability 3.46 0.72 17 MTQ48 – MT Confidence Interpersonal 3.51 0.67 17
*Explanation of participant number Total of 17 participants remaining following the exclusion of 3 participants. 11 participants gave a pre-race saliva sample 9 participants have a post-race saliva sample 7 participants had both a pre-race and a post-race saliva sample

155
6.3. Results
6.3.1. Analysis of Stress Hormones Changes During Competition
The ultra-marathon race did not elicit a significant change in cortisol between measures taken
prior to (M = .40, SD= .16 N = 7) and following (M = .65, SD= .28, N = 7) competition t(6) =
-5.20, p= .109. (See Figure 6.1). However, as N = 7, this is below the minimum participant
number calculated in Section 3.2.1, and as a result underpowered.
Figure 6.1 Mean and Standard Deviation Scores for Cortisol prior to, and following, Competition, for Matched Samples
-0.2
0
0.2
0.4
0.6
0.8
1
Prior to event After the event Change in hormone
Cort
isol (
μg/d
L)
Cortisol Measure

156
However, the ultra-marathon race elicited a significant decrease in testosterone between
measures taken prior to (M = 127.41, SD= 41.35 N = 7) and following (M = 92.21, SD= 30.29,
N = 7) completion t(6) = 2.73, p < .05. (Figure 6.2). However, as N = 7, this is below the
minimum participant number calculated in Section 3.2.1, and as a result underpowered.
Figure 6.2 Mean and Standard Deviation Scores for Testosterone Prior to, and Following, Competition, for Matched Samples
-100
-50
0
50
100
150
200
Prior to event After the event Change in hormoneTest
oste
rone
(μg/
dL)
Testosterone measure

157
6.3.2. Correlational Analysis
Analysis of Stress Hormones Table 6.3 shows the results of the correlational analyses performed on stress hormones. There
were no significant correlations between testosterone variables and psychological variables,
or race success (p > .05).
The only statistically significant correlations (p < .05) between psychological measures and
cortisol are shown in Table 6.3. Analysis of the results indicated large negative correlations
between: (a) pre-race cortisol and, MT - total confidence r(9) = -.66, p < .05, MT - confidence
abilities r(9) = -.67, p < .05, and extraversion r(15) = -.66, p < .05; (b) post-competition cortisol
and SDT impersonal r(7) = -.70, p < .05; and (c) change in cortisol and SDT impersonal r(5) =
-.81, p < .05.
There was a further, moderate to large, significant positive correlation between pre-race
cortisol and neuroticism r(9) = .65, p < .05.

158
Table 6.3 Correlations between Hormonal Measures and Psychological Factors
* Correlation is significant at the 0.05 level ** Correlation is significant at the 0.01 level
Physiological Factor
Correlation N Pearson Correlation (r)
Significance 2-tailed
Pre Race Cortisol Mental Toughness – Confidence Total
11 -.66* .03
Mental Toughness – Confidence Abilities
11 -.67* .02
Neuroticism 11 .65* .03
Extraversion 11 -.66* .03
Post Race Cortisol SDT Impersonal 9 -.70* .04
Change in Cortisol SDT Impersonal 7 -.81* .03
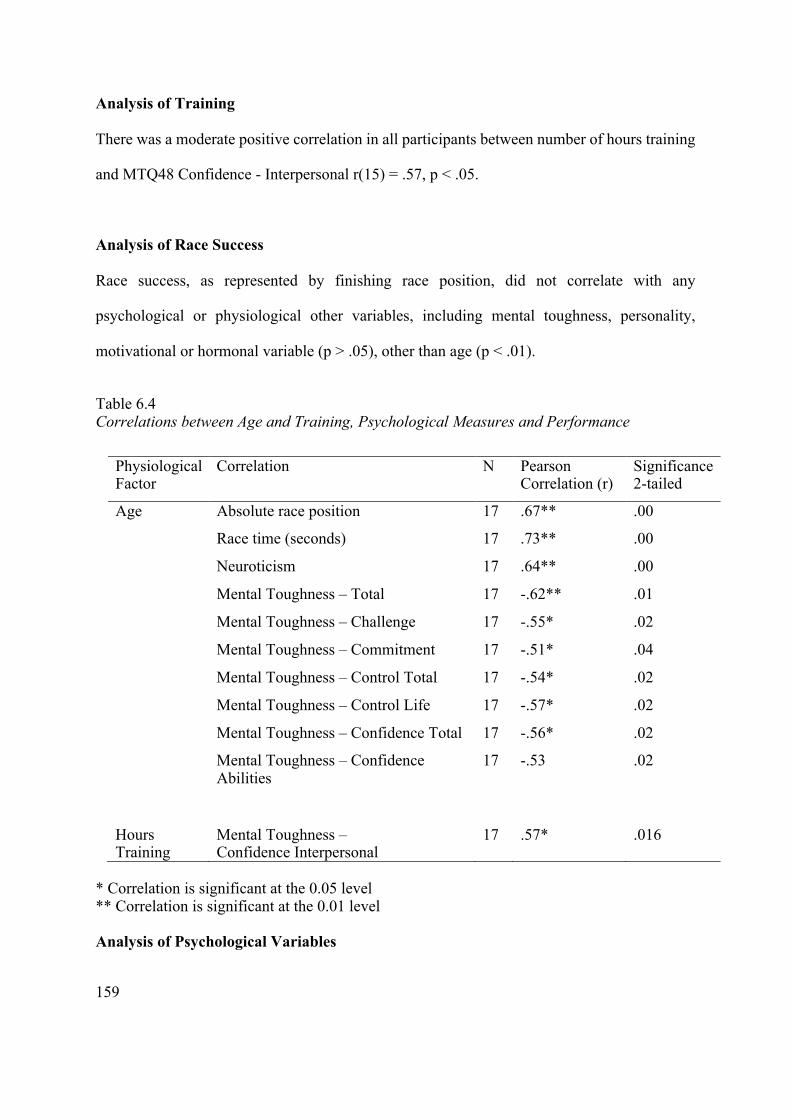
159
Analysis of Training There was a moderate positive correlation in all participants between number of hours training
and MTQ48 Confidence - Interpersonal r(15) = .57, p < .05.
Analysis of Race Success Race success, as represented by finishing race position, did not correlate with any
psychological or physiological other variables, including mental toughness, personality,
motivational or hormonal variable (p > .05), other than age (p < .01).
Table 6.4 Correlations between Age and Training, Psychological Measures and Performance
* Correlation is significant at the 0.05 level ** Correlation is significant at the 0.01 level Analysis of Psychological Variables
Physiological Factor
Correlation N Pearson Correlation (r)
Significance 2-tailed
Age Absolute race position 17 .67** .00
Race time (seconds) 17 .73** .00
Neuroticism 17 .64** .00
Mental Toughness – Total 17 -.62** .01
Mental Toughness – Challenge 17 -.55* .02
Mental Toughness – Commitment 17 -.51* .04
Mental Toughness – Control Total 17 -.54* .02
Mental Toughness – Control Life 17 -.57* .02
Mental Toughness – Confidence Total 17 -.56* .02
Mental Toughness – Confidence Abilities
17 -.53 .02
Hours Training
Mental Toughness – Confidence Interpersonal
17 .57* .016

160
All psychological variables were correlated, and the results show in Table 6.5, 6.6 and 6.7 a
number of relationships identified.
Table 6.5 Correlations between Motivational Measures (SDT) and other Psychological Factors Physiological Factor
Correlated with N Pearson Correlation
Significance 2-tailed
SDT – Autonomy
Big 5 Agreeableness 17 0.61** 0.01
Big 5 Openness 17 0.56* 0.02 MTQ48 Challenge 17 0.51* 0.04 MTQ48 Commitment 17 0.49* 0.05 MTQ48 Confidence – Interpersonal 17 0.55* 0.02
SDT – Impersonal
SDT – Autonomy 17 -0.55* 0.02
Big 5 Extraversion 17 -0.62* 0.01 Big 5 Neuroticism 17 0.56* 0.02 MTQ48 Total 17 -0.76** 0.00 MTQ48 Challenge 17 -0.71** 0.00 MTQ48 Commitment 17 -0.71** 0.00 MTQ48 Control - Total 17 -0.50* 0.04
MTQ48 Control – Life 17 -0.67** 0.00
MTQ48 Confidence – Total 17 -0.76** 0.00
MTQ48 Confidence – Abilities 17 -0.65** 0.00
MTQ48 Confidence – Interpersonal 17 -0.72** 0.00
Where significance 2-tailed = 0 this represents p < .005 * Correlation is significant at the 0.05 level ** Correlation is significant at the 0.01 level

161
Table 6.6 Correlations between Big 5 Personality, MTQ48 and SDT Physiological Factor
Correlation N Pearson Correlation
Significance Two-tailed
Big 5 – Extraversion
SDT Impersonal 17 -.62** 0.01
MTQ48 Total 17 0.52* 0.03
MTQ48 Challenge 17 0.53* 0.03 MTQ48 Control Life 17 0.49* 0.04 MTQ48 Confidence – Total 17 0.65* 0.00 MTQ48 Confidence – Abilities 17 0.60* 0.01 MTQ48 Confidence – Interpersonal
17 0.55* 0.02
Big 5 – Agreeableness
SDT – Autonomy 17 0.61** 0.01
Big 5 Openness 17 0.71** 0.00 MTQ48 Total 17 0.60* 0.03 MTQ48 Challenge 17 0.57* 0.02 MTQ48 Control – Life 17 0.70** 0.00 MTQ48 Confidence – Total 17 0.52* 0.03 MTQ48 Confidence – Abilities 17 0.56* 0.02
Big 5 – Conscientiousness
MTQ48 Challenge 17 0.51* 0.04
MTQ48 Commitment 17 0.63** 0.01 Big 5 – Neuroticism
SDT Impersonal 17 0.56* 0.03 MTQ48 Total 17 -0.85** 0.00 MTQ48 Challenge 17 -0.74** 0.00 MTQ48 Commitment 17 -0.52* 0.03 MTQ48 Control – Total 17 -0.79** 0.00 MTQ48 Control – Emotion 17 -0.69** 0.02 MTQ48 Control – Life 17 -0.66** 0.00 MTQ48 Confidence – Total 17 -0.87** 0.00 MTQ48 Confidence – Abilities 17 -0.87** 0.00 MTQ48 Confidence – Interpersonal
17 -0.62** 0.01
Big 5 – Openness SDT - Autonomy 17 0.56* 0.02 Big 5 – Agreeableness 17 0.71** 0.00 Mental Toughness – Control Life
17 .554* 0.02

162
Where significance 2-tailed = 0 this represents p < .005 * Correlation is significant at the 0.05 level (2-tailed). ** Correlation is significant at the 0.01 level (2-tailed).
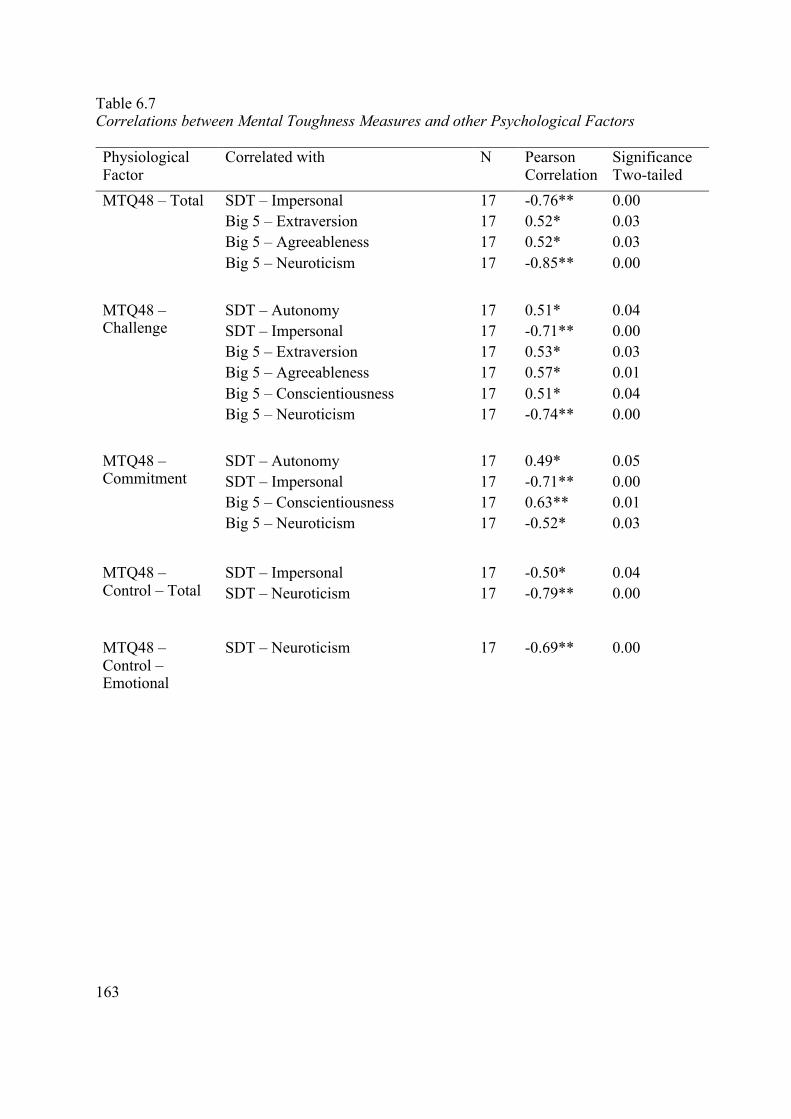
163
Table 6.7 Correlations between Mental Toughness Measures and other Psychological Factors Physiological Factor
Correlated with N Pearson Correlation
Significance Two-tailed
MTQ48 – Total
SDT – Impersonal 17 -0.76** 0.00 Big 5 – Extraversion 17 0.52* 0.03 Big 5 – Agreeableness 17 0.52* 0.03 Big 5 – Neuroticism 17 -0.85** 0.00
MTQ48 – Challenge
SDT – Autonomy 17 0.51* 0.04 SDT – Impersonal 17 -0.71** 0.00 Big 5 – Extraversion 17 0.53* 0.03 Big 5 – Agreeableness 17 0.57* 0.01 Big 5 – Conscientiousness 17 0.51* 0.04 Big 5 – Neuroticism 17 -0.74** 0.00
MTQ48 – Commitment
SDT – Autonomy 17 0.49* 0.05 SDT – Impersonal 17 -0.71** 0.00 Big 5 – Conscientiousness 17 0.63** 0.01 Big 5 – Neuroticism 17 -0.52* 0.03
MTQ48 – Control – Total
SDT – Impersonal 17 -0.50* 0.04 SDT – Neuroticism 17 -0.79** 0.00
MTQ48 – Control – Emotional
SDT – Neuroticism 17 -0.69** 0.00

164
MTQ48 – Control Life
SDT – Impersonal 17 -0.67** 0.00 Big 5 – Extraversion 17 0.49* 0.04 Big 5 – Agreeableness 17 0.70** 0.00 Big 5 – Neuroticism 17 -0.66** 0.00 Big 5 – Openness 17 0.55* 0.02
MTQ48 – Confidence Total
Cortisol – Pre –race (means filled) 17 -0.57* 0.02 SDT – Impersonal 17 -0.76** 0.00 Big 5 – Extraversion 17 0.65** 0.00 Big 5 – Agreeableness 17 0.52* 0.03 Big 5 – Neuroticism 17 -0.87** 0.00 SDT – Impersonal 17 -0.65** 0.00 Big 5 – Extraversion 17 0.60* 0.01 Big 5 – Agreeableness 17 0.56* 0.02 Big 5 – Neuroticism 17 -0.87** 0.00
MTQ48 – Confidence Interpersonal
SDT – Autonomy 17 0.55* 0.02 SDT – Impersonal 17 -0.72** 0.00 Big 5 – Extraversion 17 0.55* 0.02 Big 5 – Neuroticism 17 -0.62** 0.01
Where significance 2-tailed = 0 this represents p < .005 * Correlation is significant at the 0.05 level (2-tailed). ** Correlation is significant at the 0.01 level (2-tailed).
165
6.4. Discussion The aim of Study 3 was to test the effectiveness of the MTQ48, Big 5 personality model and
the SDT GCOS for predicting successful race performance. From the findings, mental
toughness, personality and motivational measurements did not predict race success, but that
some psychological characteristics impact the stress hormone, cortisol. Additionally, the study
demonstrated a significant relationship between age of the participant and associated race
times, wherein there was a decline in race performance with increased age.
This discussion will firstly consider the psychological measures, including mental toughness,
personality and motivation and the failure to predict race performance. The second part of the
discussion will consider the differences in stress hormones prior to, and following, competition
before considering the implications of both age and training on race performance. The
discussion will further consider limitations of the study, and future research, throughout.
Based on the findings of Crust and Clough (2005) and Jones et al. (2002) it was anticipated
that mentally tough ultra-marathoners would be more able to maximise their effort, and, as a
potential consequence, improve race placing, and time, during competition (Mahoney et al.,
2014). In addition, motivation, which according to SDT (Deci & Ryan, 2008), is based on an
inherent tendency towards growth, has been identified as one of the key characteristics of
mentally tough performers, and may function as a buffer, enabling the individual to observe
setbacks as part of the process to success and optimise an athlete’s performance (Jones et al.,
2002; Weinstein & Ryan, 2011).

166
The most significant finding of this study is the lack of a relationship between psychological
measures and ultra-marathon race success, and this can be explained by the proposition that
either scoring highly in measures of mental toughness, motivation, or personality traits, does
not identify top ultra-marathon performers, or a limitation of the study and the instruments
utilised, the MTQ48 (Crust & Clough, 2005), SDT GCOS (Deci & Ryan, 1985), and Big 5
Factor Model, are not appropriate tools for ultra-marathon races. With regards the former, it is
conceivable that optimum behaviours for ultra-marathon training and racing result from a
balance of psychological attributes across the mental toughness, motivation and personality
models utilised, producing the most appropriate behaviours, and resulting benefits. Extreme
scores may lead to detrimental behaviour, whilst a more balanced outlook may be more likely
to meet the needs of the ultra-marathoner, in not only commitments to the sport, but also in
adjacent areas of life. For example, excessive commitment may lead to a loss of judgment in
training and race decisions, and extreme confidence may result in unrealistic settings of goals,
leading to disappointment and subsequent disengagement from the sport. There may be an
optimum balance between mental toughness and mental sensitivity and diverse balances may
be beneficial to each sport, or situation (Clough & Strycharczyk, 2012). A balance of
personality traits, avoiding extremes, such as neurotic and extravert, may lead to an individual
using a moderate approach to training and racing, potentially avoiding injury. A limitation of
this study is that elite athletes were not included; such athletes, at the limits of preparedness
may have offered additional insights into the extremes of personality. Further limitations raise
a concern regarding the assumption that mental toughness, unlike personality, is context free.
It seems plausible that the mental toughness of the mountaineer is different from the elite
sprinter, or the ultra-marathoner (Crust, 2008, 2008a). If mental toughness varies by different
sports, and cannot be generalised in all areas of life, this raises a question regarding the
appropriateness of the MTQ48 as an instrument for testing mental toughness in endurance
167
sports. Despite the ecological validity of the race environment, the timings of the measures of
mental toughness, motivation and personality is a methodological limitation, as they were taken
a number of days prior to the event and would not have identified fluctuations resulting from
the proximity to the event that may have influenced results (Gucciardi, 2017; Gucciardi &
Gordon, 2013). Furthermore, this study made assumptions that performance success is linked
to race success, in contrast to the ability to overcome challenges both in training and during the
event (Crust, 2008; Jones et al., 2002, 2007; Gucciardi et al., 2009; Thelwell et al., 2005).
Finally, the information regarding training from participants provided detail of weekly
duration, but not the terrain or intensity, it is therefore not possible to identify the level of race
preparedness, or training, with race position.
In support of earlier research (Horsburgh et al., 2009), this study shows positive correlations
between SDT’s motivational subscale autonomy, measuring the extent someone takes
ownership of their actions and initiates novel activities, and mental toughness, agreeableness
and openness. The negative correlation between the motivational subscale impersonal, which
measures a belief that a desired outcome is contingent on luck, or that it is outside the
individual’s control, and mental toughness, extraversion, and, as a potentially logical
consequence, the increase in cortisol. According to Teixera, Carraca, Markland, Silva, and
Ryan (2012) extrinsic motivation, which focuses on the outcome of exercise, may be a key
factor in the adoption of exercise, whilst intrinsic motivation facilitates longer term
participation in exercise. The impersonal subscale may be viewed as focusing on extrinsic
conditions, and therefore be less important for endurance training, and racing, which requires
prolonged commitment. A negative correlation with factors that influence the ability to push
the limits of physiological stress would therefore seem a consequence.
168
Cortisol and testosterone are used widely as measures to assess the effects of differing types of
exercise, and varying intensities, present in training and competition (Crewther et al., 2013).
However, it has been recognised that limited research, particularly, outside of the laboratory,
has focussed on the effects of ultra-marathons on the neuroendocrine system, one of many
organ systems activated during an ultra-marathon (Deneen & Jones, 2017). It is difficult to
perform a detailed meta-analysis, with studies varying in mode of exercise, duration and
intensity, making generalisations difficult (Tanner et al., 2013). The lack of significant intra-
individual change in cortisol, and the significant decrease in testosterone, recorded prior to and
following competition, is in contrast to previous research, though it has been recognised that
other factors impact results, including time of day, duration and intensity of recent training
(Lac & Berthon, 2000; Tanner et al., 2013). In addition, the findings of this study show that
confident, extraverted participants, with reduced neuroticism, have lower pre-race stress.
Though it is understood that pre-competition, increased cortisol levels may be an adaptive
response, and can help athletes to meet the demands of competition (Kivlighan et al., 2005),
other research suggests that athletes exposed previously to a physiological stress from exercise,
may become accustomed and exhibit reduced stress hormones (Tanner et al., 2013). A
reduction in pre-race stress may benefit participants in terms of reduced interruption to mental
preparation, though this was not evidenced by improved running times in this study.
Surprisingly, the results of correlational analysis show that for all participants there is a positive
relationship between being motivated and believing attainment of our goals is outside of our
control, rather than taking responsibility for one’s own behaviour, and the increase in the size
of the change in cortisol over the course of the ultra-marathon. This increase in cortisol may
be linked to the individual’s preparation for action, which over the length of an endurance race,
could be ongoing, and prolonged, and the size of the increase may indicate reduced resilience
to a situation of potential stress (Kivlighan et al., 2005). However, failure to obtain saliva

169
samples on all participants prior to, and after, the event impacted the results of statistical
analysis, and resulted in a failure to reach the required sample size (see Section 3.2.1).
The study supports the findings of Knechtle at al. (2012), where they also report a decline in
race performance, as measured by increased time to finish, and mental toughness, with age.
Due to methodological limitations, and the study design, there are insufficient measures to
predict whether the increase in race times was a result of an age-related decline in physiological
or psychological mechanisms, but it does highlight that age, rather than mental toughness,
motivation, or Big 5 Personality Dimensions, is a more significant factor in this experiment in
predicting time to complete the race. Previous studies that have provided evidence for a decline
in physiology, Knechtle at al. (2011) commented that reduced endurance performance is
primarily a result of an age-related decline in V̇O2max along with a change in muscle mass tissue.
However, there are also likely to be psychological aspects, as per the observed reduction in
mental toughness, and increase in neuroticism, which may have negatively impacted aerobic
success, as per the findings of Study 1.
Collectively the findings show, that no single factor, other than age, directly affects the time
taken to complete the race, and consequently the race finisher’s position. Measures that
influence race success may therefore be either absent from the study, or success is reliant on
the interaction of multiple factors.
In addition, this study was limited to participants in a single ultra-marathon race of 64.37 km
across a variety of terrains on the north coast of Northern Ireland; other distances, in other
locations and climates, with alternate racers, may have yielded a different set of data. These

170
data may not therefore be generalisable to ultra-marathon races of greater differences,
including multi-day events, with a more varied, international field, or extremes in weather.
Study 3 has many strengths, including a clear examination of participants of a variety of
physical abilities, in the context of a single race situation, and measures their success against
psychological factors including motivation, mental toughness and personality. This study
provides no support to the view that a high score in mental toughness is a predictor of endurance
success. There may be an optimum set of scores, not necessarily all high, between mental
toughness, personality and motivation that enables an athlete to train and race to their physical
limits. The findings suggest that motivated ultra-marathoners are more likely to reach
increased physiological stress and realise their physical potential during an endurance race.
Further research, both in the field and in the laboratory, is required to more comprehensively
understand the rewards, reasons and motivations behind successful race training and
participation, and to better appreciate the interaction of multiple factors across the models of
personality, mental toughness and motivation, along with identifying the techniques that
subsequently support the athlete most appropriately.

171
CHAPTER SEVEN

172
7. General Discussion
7.1. Testing the Null Hypothesis (H0) The following section will consider the outcomes of the four hypotheses which were tested in
Studies 1, 2 and 3.
Null hypothesis A - There will be no statistically significant differences between the
psychological scores from questionnaires completed by ultra-marathon
and non-ultra-marathon runners in Studies 1 and 2.
Null Hypothesis Rejected Mental toughness and personality were not significantly different, in Study 1, between ultra-
marathoners and non-ultra-marathoners. However, in Study 2, Openness (Big 5 personality
dimension) was significantly different between the ultra-marathon group, and the low aerobic
group. The findings from Study 2 provide the basis to accept the alternative hypothesis as there
are significant differences in the measurements of openness (Big 5 personality dimension)
quantified between ultra-marathon and non-ultra-marathon runners.

173
Null hypothesis B - There will be no statistically significant differences in the
measurements of the physiological factors between ultra-marathon and
non-ultra-marathon runners in Studies 1 and 2.
Null Hypothesis Rejected
V̇O2peak, and running velocity at lactate threshold, were significantly different between ultra-
marathoners and non-ultra-marathoners in Studies 1 and 2, whilst running economy, pain
threshold and pain tolerance were not. The findings provide the basis to accept the alternative
hypothesis previously stated as there are significant differences in the measurements of the
physiological factors quantified between ultra-marathon runners and non-ultra-marathon
runners
Null hypothesis C - There will be no statistically significant association between the
incidents of the alleles, or the genetic expressions, and the ultra-
marathon and non-ultra-marathon runners in Studies 1 and 2.
Null Hypothesis Accepted There were no associations with being in the ultra-marathon group and either having the ACE
gene allele, or the expression of the genes 5HTT, BDNF, D4DR. The findings provide the basis
to accept the null hypothesis previous stated as there are no significant differences in the
incidents of the alleles, or the genetic expressions, tested between ultra-marathon runners and
non-ultra-marathon runners.

174
Null hypothesis D - There will be no statistically significant correlation between race
success, as represented by a lowered finishing race position and time,
and mental toughness, personality scores and motivational scores from
questionnaires completed by ultra-marathon runners in Study 3.
Null Hypothesis Accepted
Mental toughness, motivation and personality were not correlated with race success, as
measured by time to complete or race position. The findings provide the basis to accept the
null hypothesis previously stated as there is no significant correlation between race success, as
represented by a lowered finishing race position and time, and mental toughness, personality
scores and motivational scores from questionnaires completed by ultra-marathon runners.
175
7.2. General Discussion
The objectives of the general discussion are to integrate and summarise the research findings
of all three studies, and examine the relationships between psychological and physiological
factors, including measures of endurance performance, comprising of: mental toughness,
motivation, personality, V̇O2peak scores, pain tolerance and threshold, stress hormone, lactate
threshold, running economy, rating of perceived exertion, and selected genes. The findings
challenge existing psychological models of mental toughness, motivation and personality to
successfully identify ultra-marathoners, and provide support for an interdisciplinary model of
performance success in ultra-marathons, integrating measures from both psychology and
physiology. Consequently, findings from all four studies will be interpreted to propose a new
interdisciplinary Optimum Balanced Performance Model of Endurance success (OBPMES) in
ultra-marathons. Finally, the discussion will highlight methodological limitations and outline
recommendations for future research.
This is the first programme of research to use an interdisciplinary approach, to quantify, and
compare, psychological and physiological factors, in both trained ultra-marathoners and un-
trained non-ultra-marathoners, within multiple environments using a range of research designs,
which include, (a) controlled experimental laboratory settings, and (b) in the field during
participation in a competition.
The discoveries from this thesis make two unique contributions to the sport and exercise
science of ultra-endurance. Firstly, Studies 1, 2 and 3, examined the relationships between
psychological factors, including mental toughness, motivation and personality, and
physiological factors measuring endurance performance. This research identified that ultra-

176
marathoners achieved higher levels of endurance as a result of physiological adaptions
following increased training regimes, are identifiable by their openness to new experiences,
according to Study 2, but not their mental toughness, or motivation, and that the physiological
factors measured did not predict race success. Study 3 examined limited physiological
measures at multiple time points and identified that some psychological characteristics impact
the stress hormone, cortisol. Figure 7.1 identifies psychophysiological measures and associated
findings from this programme of research: Studies 1, 2, and 3, findings are boxed in red.
A major strength of this programme of research arises from the interdisciplinary research
methodology that combined multiple psychological and physiological outcome measures
across 3 studies. Psychological factors included a varied set of measures, including MTQ48
for mental toughness, Big 5 Personality Inventory, and SDT GCOS for motivation, and
physiological factors including running economy, stress hormones, lactate threshold, maximal
oxygen uptake, RPE, pain tolerance and threshold, and polymorphism and expression measures
of 4 selected genes.

177
Figure 7.1 Psychological and Physiological Measures and Corresponding Findings
178
7.3. Psychophysiological Integration and Summary of Research Findings
Studies 1 to 3 identified that the ultra-marathoner is open to new experiences and that mental
toughness is associated with running economy, pain threshold and tolerance, and supports
achieving individual limits.
Mental toughness
In support of the null hypothesis of Studies 1 and 2, a higher score in mental toughness does
not identify ultra-marathoners and is not a prerequisite for the successful participation or
completion of an ultra-marathon race. Across all participants, mental toughness was associated
with markers of increased aerobic fitness. Study 1 identified large, statistically significant
positive correlations between maximal oxygen uptake, and commitment, overall mental
toughness and conscientiousness, whilst Study 2 reported a large statistically significant
positive relationship between increased levels of mental toughness and running economy, pain
threshold and tolerance. Collectively these data provide evidence that, independent of whether
or not an individual competes in ultra-running events, personality traits, and attributes of
mental toughness are associated with maximising aerobic potential, but do not preclude
successful ultra-marathon participation or completion.
Personality
In support of the alternative hypothesis, the findings of Study 1 and 2 did not detect any
evidence for significant differences between ultra-marathoners and non-ultra-marathoners in
four of the Big 5 Personality traits: conscientiousness, extraversion, agreeableness and
neuroticism. However, in partial support of existing literature (Kaiseler et al., 2012, 2017),
Study 2 reported that ultra-marathoners were identified by an increased openness to experience
when compared to non-ultra-marathoners who were low in aerobic fitness.
179
Motivation
In support of the null hypothesis, analysis of the findings from Studies 1 and 2, suggest
motivation, as defined by the SDT GCOS, with its causality orientations, autonomy, control
and impersonal, does not differentiate the ultra-marathoner as more intrinsically or extrinsically
motivated from the non-ultra-marathoner. Furthermore, in Study 3, race success was also not
predicted by causality orientations, therefore the application of SDT, or the SDT GCOS, to
interpret differences between ultra-marathoners and non-ultra-marathoners appears to be
unsuitable.
Aerobic markers
Ultra-marathoners, in both Studies 1 and 2, were identified as having an increased maximum
rate at which oxygen can be taken up, transported and utilised for running, which is consistent
with existing research, and identified with increased aerobic performance (Schnohr et al., 2015;
Bassett & Howley, 2000). Heightened fitness, as measured through maximal oxygen uptake,
appears to be consistent with increased training, and associated physiological adaptations,
rather than the psychological factors measured (Billat, 1999; Rønnestad & Mujika, 2013;
Rowland, 2009). However, as previously discussed, maximal oxygen uptake may not equate
directly to ultra-marathon performance, with other factors likely to impact, including running
economy and the ability to maintain the highest percentage of the V̇O2max, for longest duration
of the event (Knechtle, 2010; 2015). More recently there have been challenges regarding the
legitimacy of V̇O2max as a practical measure of cardio-respiratory endurance, and whether it
identifies the maximum ability to transport oxygen.
180
Physiological Stress
In contrast to previous research, no differences in measures of stress either prior to, and
following, the aerobic testing, were observed between the ultra-marathoners and the non-ultra-
marathoners in Study 2. Interestingly, participants from both the ultra-marathon and the non-
ultra-marathon group, with increased levels of agreeableness, were observed to have reduced
pre-race stress. This may be as a result of a tendency to be more cooperative, and less
suspicious, resulting in lower levels of agitation. Study 3 in contrast, performed in the context
of a competitive event, observed that participants who were mentally tough, extraverted,
confident, with reduced measures of neuroticism, have lower pre-race stress. The lack of
significant intra-individual change in cortisol, and the significant increase in testosterone,
recorded prior to, and following, competition, was in contrast to previous research findings,
though it has been recognised that other conflicting factors, including time of day, may affect
results (Lac & Berthon, 2000; Tanner et al., 2013). Surprisingly, the results of a Pearson
Product Moment correlational analysis show that for all participants there is a significant
positive relationship between believing attainment of a goals is outside of control, rather than
taking responsibility for one’s own behaviour, and the increase in the size of the change in
cortisol over the course of the ultra-marathon. This increase in cortisol may be linked to the
individual’s preparation for action, which over the length of an endurance race, could be
ongoing, and prolonged, and the size of the increase may indicate reduced resilience to a
situation of potential stress (Kivlighan et al., 2005).
The effects of stress hormone changes on successful performance in endurance racing, and
conversely the impact of events on cortisol and testosterone, remains unclear as a result of this
study. Researchers have suggested that increased cortisol, pre-competition, may be an adaptive
response to endurance training and is beneficial to athletes to meet the demands of a race
181
(Kivlighan et al., 2005). However, a reduction in pre-race stress may benefit participants in
terms of diminished interruption to mental preparation, though this was not evidenced by
improved running times in this study. To avoid speculation, address a lack of clarity, and better
understand the co-dependency between hormone levels and aerobic capacity, further research
into physiological stress in endurance races is warranted.
Genetics
Approximately 21,000 protein coding and 23,000 non-protein coding genes (Willyard, 2018)
have been identified in the human genome, and despite research having identified 200 gene
variants with performance phenotypes, little is known about the influence of genetic
polymorphisms on performance in sport (Castilha et al., 2018). Possibly as a result of research
costs and duration, testing has typically focussed on a small number of genes, with the ACE
gene being the most widely studied gene for endurance performance (Ash et al., 2011). In
contrast to the findings of Montgomery et al. (1998), no significant differences were identified
in the polymorphism of ACE gene allele of ultra-marathoners and non-ultra-marathoners.
However, results have been inconsistent, more recent studies have failed to identify differences
between endurance athletes, and matched controls, suggesting that it is not likely that the ACE
II genotype provides an advantage in endurance running (Ash et al., 2011; Papadimitriou et al.,
2018). Study 2 found no support for existing literature that suggests the serotonin transporter
gene (5HTT) may be linked with the ability to control emotion, the brain-derived neurotrophic
factor (BDNF) may directly impact perceived effort during aerobic activity, and the dopamine
receptor gene (D4DR) appears to affect the dopaminergic system, involved in both motivation,
arousal and risk-taking behaviour. Indeed, Study 2, found no significant differences between
RNA expression associated with the genes, 5HTT, BDNF and D4DR, in ultra-marathoners and
non-ultra-marathoners, suggesting that the participation and completion of an ultra-marathon

182
is not conditional on any of these 4 single genes (Lippi et al., 2009; Eichhammer et al., 2005;
Carpenter et al., 2011). Researchers have established both a strong heritability of personality
traits and gains in aerobic capacity (Castilha et al., 2018; Horsburgh et al., 2009; Sarzynski et
al., 2017), as a result of endurance training, and identified multiple genes that can impact
sporting performance, however further investigation is warranted to identify the genetic
predisposition of an individual to succeed in ultra-marathons. Any future research should consider
that a single gene test may not provide a sufficient indication of the genetic predisposition of
an individual to succeed in ultra-endurance events and should be aligned with larger
hypothesis-free genetic testing. Furthermore, the testing protocol should clearly be aimed at
either testing transient, or long-term upregulation, or downregulation of the genes’ expression
(Sarzynski et al., 2017).
Pain
In Study 2 there was no difference in the quantification of pain threshold or pain tolerance,
between ultra-marathoners, and non-ultra-marathoners. This may in part be a result of the
challenges associated with objectively identifying the point at which stimulation, in this case
immersion in ice, becomes painful, and ultimately intolerable. According to Osborn and
Rodham (2010), as a result of the large number of contextual factors that are likely to impact
the subjective, multi-dimensional nature of pain perception, it may be more appropriate to
make use of qualitative research to uncover and explore the key aspects of the experience of
pain. The discomfort experienced during a race may differ considerably along with an
individual’s ability to tolerate it, between race conditions, state of mind or health of the
individual, and between a race setting and a laboratory. Furthermore, research suggests that
training, and its intensity, can in turn impact pain tolerance in muscles (O’Leary et al., 2017).

183
Race performance
Collectively the findings show that no single measure in Study 3, other than age affected the
time taken to complete an ultra-marathon race. Mental toughness, personality and motivational
measurements did not predict either race success or the changes in cortisol levels, though
motivation was associated with overall changes in testosterone. The decline in race
performance with age was consistent with previous studies that identified a related decline in
physiology, and theorised that reduced endurance performance is primarily a result of an age-
related decline in V̇O2max along with decreased muscle mass (Knechtle et al., 2012).
Rating of Perceived Exertion
Analysis of the findings from Study 2, are in support of existing research, and suggest that the
rate at which RPE increases is reduced in the aerobically trained ultra-marathoner. As discussed
in Section 2.4, it has been theorised that exercise intensity is regulated by perceived exertion
and ensures homeostasis is maintained within limits (Eston, 2012). The data provides support
for the theory that RPE is predictive of the duration of aerobic exercise prior to cessation due
to exhaustion, and, is (a) in line with the psychobiological model, that predicts increasing RPE
leads to reduced endurance performance (Marcora et al., 2009), and (b) the central governor
model, that speculates that it forms part of a feedforward control model limiting exercise
(Crewe et al., 2008).
The results of Studies 1, 2 and 3 are summarised in Table 7.1. The first column identifies the
psychological factors, while the second and third columns summarise the relationship with
success of the ultra-marathoner, and its effect on aerobic fitness in the general population,
respectively.

184
Table 7.1 Psychological Factors and their Effect on Success in Ultra-marathoners, and Aerobic Limits in the General Population
Factor Affect success in ultra-marathoners
Affect aerobic fitness /limits in everyone
Mental Toughness (according to MTQ48)
Mental toughness and constituent factors do not identify the ultra-marathoner
Mental toughness factors are predictive of aerobic success i.e. V̇O2peak / Running economy
Personality Big-5 (openness, conscientiousness, neuroticism, extraversion, agreeableness)
Openness identifies the ultra-marathoner (Study 2 only)
The Big 5 personality traits are not predictive of aerobic success (as measured by either V̇O2peak, running economy, lactate threshold)
Motivation Intrinsic/ extrinsic motivation does not identify the ultra-marathoner
Intrinsic/ extrinsic motivation is not predictive of aerobic success (as measured by either V̇O2peak, running economy, lactate threshold)
Selected Genes (ACE Gene allele, 5HTT, BDNF, D4DR)
Genes selected do not identify the ultra-marathoner
Selected genes are not predictive of aerobic success (as measured by either V̇O2peak, running economy, lactate threshold)
Rate of increase of RPE Ultra-marathoners identified by a lower rate of increase of RPE
A reduced rate of increase of RPE is indicative of increased V̇O2peak

185
7.4. Theoretical Impact of Psychological Models on Interpreting Endurance
This thesis does not reject the widely held view that mental toughness is an important,
multidimensional, psychological construct related to performance excellence in a multitude of
sporting environments. However, analysis of the findings does question the requirement to be
mentally tough to succeed in an endurance event, such as an ultra-marathon. In contrast to
previous research, this thesis therefore finds that being high in mental toughness, as measured
by the MTQ48, is not a prerequisite to either participate, or perform well, in ultra-marathons
(Connaughton et al., 2008; Gucciardi et al., 2016; Perry et al., 2013; Thelwell et al., 2010).
The MTQ48 model of mental toughness, and the SDT GCOS model of motivation do not
identify the ultra-marathoner, nor measure factors involved in successful performance during
an event. Alongside a number of existing concerns raised regarding the underlying conceptual
model of the MTQ48, recent literature has challenged the applicability of the MTQ48 for use
with athletes at differing levels of athletic experience (Anthony et al., 2016; Vaughan et al.,
2017). Researchers have speculated that the MTQ48, is a general measure of mental toughness,
and consequently may be less appropriate to specific populations that require language more
apposite to the context (Gucciardi et al., 2016). This may explain why ultra-marathoners, a
defined athletic sample, were not identified by their mental toughness, whilst mental toughness
was identified with improved aerobic fitness in the entire population. Gucciardi (2017)
theorised that mental toughness is state-like, rather than trait-like, and can fluctuate over time
depending on the context and, internal and external demands. Consequently, the development
of mental toughness, and aerobic fitness, warrants further research to better understand the
direction of causation. The failure to identify ultra-marathoners as a result of mental toughness

186
may, in part, be an issue of context. Mental toughness may be specific to an environment or
situation, and ignorance of this contextual factor may lead to contradictory results (Crust, 2008,
2008a ; Gucciardi, 2017; Gucciardi & Gordon, 2013). Jones et al., (2002) has suggested that a
mentally tough sports person has an advantage over opponents by providing protection to the
individual and ensuring an ability to cope better with the demands of sport, whilst maintaining
consistency in determination, focus and having control whilst under pressure. The present
findings clearly indicate that during a race, mentally tough ultra-endurance runners may not be
more likely to reach increased levels of physiological stress and realise their physical potential.
Further concerns have been raised regarding both the assumption that elite athletes are, by the
very nature of being at the top of their game, mentally tough, and that those interviewed have
a full, and consistent, conception of mental toughness, and, the belief that success is only
defined as beating the opponent (Crust, 2008; Jones et al., 2002, 2007; Gucciardi et al., 2009;
Thelwell et al., 2005). There is also a risk associated with the assumption that mental toughness
and success are strongly co-dependent and mental toughness is an indication of superior
athletic ability rather than the capacity to overcome the challenges faced during training and
competition. This issue is further compounded by both a lack of conceptual clarity surrounding
the meaning, or definition of mental toughness, and uncertainty regarding the
multidimensionality of mental toughness, its permanence over time, direct assessment, and
variation across situations (Clough et al., 2002; Crust, 2008, 2008a; Gucciardi et al., 2014).
In contrast, to the vast majority of studies, a key strength of this programme of research is the
focus on non-elite athletes, and the lack of assumption regarding participants’ level of mental
toughness. Recent research, also involving non-elites, measured mental toughness in
recreationally active participants; analysis of findings suggested the positive impact of long-
187
term endurance training, and competition, experience on mental toughness (Marshall et al.,
2017). The results of research into personality linked to sports performance remain
contradictory, with evidence from population-based studies difficult to generalise, and
associations between personality and success in sport unconvincing (Allen et al., 2011;
Kaiseler et al., 2017). It therefore remains unclear, as a result of this thesis, and previous
research, the size, or type of impact personality has on ultra-marathoners, their training, or
performance in competition.
This programme of research suggests that either, in contrast to existing literature (Hanson et
al., 2015), increased intrinsic motivation is not a characteristic of an ultra-marathoner, or that
it is a characteristic, and that both ultra-marathoners and non-ultra-marathoners are equally
high. It can be speculated, based on the findings of Study 1, 2, and 3, the Self-determination
Theory, either does not provide a framework for studying motivation in ultra-marathoners, or
that ultra-marathoners and non-ultra-marathoners are, in contrast to existing research,
homogeneous in both, the three causality orientations, autonomy, control and impersonal
measures, and the innate psychological needs of relatedness, competence and autonomy (Deci
& Ryan, 1985; Ryan & Deci , 2017). It may be theorised that ultra-marathoners are no more,
or less motivated as a result of opportunities for choice and determination, and do not focus on
social norms or pressures, or find environments uncontrollable or demotivating (Deci, 1985;
2000; 2008; 2017).
Study 2 identified the personality trait ‘openness’ as being a predictor of success in an ultra-
marathon and suggests there are benefits to being open to new experiences, possibly including
the ability to tackle issues that arise, rather than the use of avoidance strategies. According to
Hughes et al. (2003) attempts to define personality profiles in athletes and non-athletes have

188
been inconsistent. However, in their investigation into the personality profiles of participants
in a 100-mile race in the Alaskan wilderness, racers scored significantly higher in both
extraversion and openness. Consistent with the present findings, Hughes and colleagues
suggest that race participants choose novel experiences that provide challenge, possibly
involving more risk, than the norm sample. The failure to identify differences in the remaining
personality traits, of conscientiousness, extraversion, agreeableness and neuroticism, between
the two groups, is inconsistent to previous research, and leads to speculation that an ultra-
marathoner is similar in personality to a non-ultra-marathoner (Allen et al., 2011; Kaiseler et
al., 2017). There is limited research regarding the impact of personality traits in endurance
events, and research is warranted to better understand how the benefits of openness can be
strengthened.
The findings of the present research are consistent with both the Central Governor Model, and
the Psychobiological Model (Marcora & Staiano, 2010; Noakes, 2007) that perception of
effort, or RPE, is a predictor of time to exhaustion. Analysis of the data suggests that the ultra-
marathoner has a reduced rating of perception of fatigue, or RPE, and an increased time to
volitional exhaustion. Further research is required to better understand the models of aerobic
failure, (a) Noakes’ (2007) theory that RPE is generated by the brain to ensure that increasing
levels of discomfort cause exercise to be terminated prior to homeostatic failure, or (b) Marcora
& Staiano’s (2010) theory that exhaustion is a type of disengagement from the aerobic task in
response to the willingness to continue the effort required.

189
Interdisciplinary Optimum Balanced Performance Model of Endurance Success in Ultra-
marathoners
It may be speculated from this programme of research that the optimum behaviours for ultra-
marathon training and racing result from a balance of psychological attributes including mental
toughness, motivation and personality (Connaughton et al., 2008; Gucciardi & Gordon, 2013;
Gucciardi et al., 2016; Jones et al., 2002; Perry et al., 2013; Thelwell et al., 2010). Different
and diverse balances, involving these factors, may be beneficial to each sport, context, or
situation (Clough & Strycharczyk, 2012). The present research focussed on the differences
between ultra-marathoners and non-ultra-marathoners and did not facilitate the examination of
the profiles of the runners, and the intra-relationships between psychological attributes. More
extreme scores in individual, or grouped attributes, may lead to detrimental behaviour, whilst
a more balanced profile may result in a positive, fruitful, outcome for the ultra-marathoner, in
both the sport, and in closely impacting, and supporting areas, including work and family. A
balance of personality traits, avoiding extremes, such as neuroticism and extraversion, may
lead to an individual using a moderate approach to training and racing, potentially avoiding
injury with unplanned training increases, and a more measured approach to races that will last
many hours. Figure 7.2 presents an overview of the average psychological scores for ultra-
marathoners, and low aerobic participants, red and blue lines respectively, from Study 2.

190
Figure 7.2 Patterns of Psychological Measures from Study 2
The patterns of psychological measures between the ultra-marathon group and the low aerobic
group are similar, but average mental toughness, and openness values are lower, whilst the
average neuroticism value is higher, in the low aerobic group. Psychological measures, and
intra-relationships, may potentially, collectively identify ultra-marathoners. Further research is
recommended that profiles ultra-marathoners versus non-ultra-marathoners to help understand
the intra- and inter- individual characteristics.
0.00
1.00
2.00
3.00
4.00
5.00
6.00
7.00SDT Autonomy
SDT Control
SDTImpersonal
Extraversion
Agreeableness
Conscientiousness
Neuroticism
OpennessMTQ48
ChallengeMTQ48
Commitment
MTQ48Control Total
MTQ48Controlemotion
MTQ48ControlLife
MTQ48Confidence
Total
MTQ48Confidence Abilities
MTQ48Confidence
Interpersonal
MTQ48 Total

191
Building on the work of Fletcher (2005) (Figure 2.2), and analysis of the results of Studies 1,
2, and 3, this author proposes an interdisciplinary, Optimum Balanced Performance Model of
Endurance (see Figure 7.3). Fletcher’s (2005) facet model proposes that mental toughness
moderates the appraisal of, and coping with, stressors, and ultimately impacts performance.
The proposed interdisciplinary, Optimum Balanced Performance Model of Endurance
develops the idea of mental toughness moderating stress consistent with previous research
(Sheard, 2013) and speculates the integrated and moderating role of psychological factors,
including mental toughness, personality and motivation and their theoretical relationship with
performance. These psychological factors, along with physiological factors, including maximal
oxygen uptake, lactate threshold, running economy, RPE, stress hormones and genetic factors
moderate the relationship between environmental stressors, such as race distance and
conditions, and the cognitive, emotional and behavioural responses that affect endurance
performance outcomes.
According to this model (Figure 7.3) the cognitive, emotional and behavioural responses that
impact both participation and performance in ultra-marathons are therefore: determined by (a)
psychological and physiological factors, adapted as a result of genetic inheritance, (b) along
with the psychological, physiological and epigenetic effects during the development of the
individual, and (c) moderated by cognitive processes. Such processes are likely to include
appraisal and coping mechanisms, along with control systems balancing sensations of fatigue
(RPE) with expected fatigue, to ensure homeostasis and event completion.

192
Figure 7.3 Interdisciplinary Optimum Balanced Performance Model of Endurance Success in Ultra-marathons
Men
tal
Toug
hnes
sM
otiva
tion
Pers
onal
ity
EEA
/ Exi
stin
g En
viro
nmen
tal I
nflu
ence
s
Lact
ate
Thre
shol
d
Max
imal
Ox
ygen
Up
take
RPE
Phys
iolo
gica
l Fac
tors
(inc
ludi
ng)
Psyc
holo
gy Fa
ctor
s
Appr
aisa
lCo
ping
Cont
rol
Syst
ems
Cogn
itive
Pro
cess
es
Pain
To
lera
nce/
Th
resh
old
Hum
an R
espo
nses
Cogn
itive
Emot
iona
lBe
havi
our
Endu
ranc
e Pe
rform
ance
Ou
tcom
es
Envi
ronm
enta
l St
ress
ors
Trai
ning
,Ra
ce sp
ecifi
cs e
.g.
dura
tion/
te
mpe
ratu
re
Runn
ing
Econ
omy
193
Evolved Adaptations to Endurance
Chapter 2 reviewed the widely held theory that homo-sapiens are, as a species, designed for
endurance, with highly developed, specialised features that provided a significant contribution
to the evolution of the human form (Bramble & Lieberman, 2004; Brooks, 2012; Hawley et
al., 2014; Schulkin, 2016). If physiological adaptations evolved to facilitate endurance, and, if
according to evolutionary psychologists, psychological traits are important adaptations
designed to solve challenges faced by our ancestors (Buss, 2009; 2009a), then it may be
speculated that the psychology of modern humans is, in part, a consequence of evolutionary
adaptations for endurance.
According to evolutionary psychologists, at birth the human mind is neither a blank slate, nor
a general-purpose computer, but is instead a set of highly specific, and evolved adaptive
programmes (Cosmides & Tooby, 2013). Each mechanism within the brain has been shaped
through natural, and sexual, selection, to solve the problems encountered within the
environment of evolutionary adaptedness (EEA). Our ancestors evolved to survive over 4
million years of living as a nomadic hunter-gatherer, and only within the last 10,000 years have
we developed a more sedentary, less nomadic lifestyle. Natural selection overcame many
problems to ensure the survival of the species, adapting focussed, content-rich, highly
specialised architecture that meet specific information-processing requirements: cooperation
with our kin, dealing with our enemies, communication, including both language and non-
verbal, identification and location of food, hunting, mate selection and avoiding infectious
disease and poisonous food (Buss, 2009; 2009a; Cosmides & Tooby, 2013). Multiple adaptive
mechanisms may also have evolved specifically for endurance.

194
Collectively, the 3 studies suggest that only the psychological trait of openness identifies the
ultra-marathoner. Therefore, either there is a single psychological measure that predicts
endurance success within the study population, or there is one, or many combinations of
measures that have evolved to facilitate endurance performance. Figure 7.4 considers the
hypothetical, potential of multiple sets of psychological measures, or optimum profiles,
adapted to different, and unique, environments of evolutionary adaptation (EEA).
Assuming an organism’s ability to increase the frequency of their genes in the next generation
may be a result of one, or more, psychological adaptations to the EEA. Such adaptations, that
offered an advantage, would therefore ‘proliferate’ in subsequent generations, and may be
different between EEA’s. As an example, EEA ‘A’ may have been a time when food was in
plentiful supply, whilst EEA ‘B’ may have been during an extended period of drought, climatic
extremes and human migration. Very different psychological measures could have adapted to
meet the endurance requirements of each environment. As a result, though endurance may have
been crucial to the survival of the human species, there may be no one trait, or set of traits, that
predicts successful performance.

195
Figure 7.4 ‘Hypothetical’ example of Measures Best Suited for Different Environments of Evolutionary Adaptation (EEA)

196
In summary
In order to provide a deeper understanding of the sport and exercise science of ultra-marathon
success, it is necessary to adopt a psychophysiological approach to develop models that
combine methods, theories and concepts (Balagué et al., 2017). Psychological factors should
not be analysed out of context, but within an interdisciplinary model, including techniques,
expertise and knowledge from fields as diverse as psychology, genetics, physiology, cognitive
science and evolutionary biology. Continued interdisciplinary research is likely to both expand
and refine our understanding, irrespective of scientific field and, facilitate the development of
models that are testable and predictive.
This programme of research suggests an Optimum Balanced Performance Model of Endurance
Success and the subsequent benefits of adopting an interdisciplinary approach. The
psychophysiological data suggests that ultra-marathoners and non-ultra-marathoners are
largely homogeneous, other than measures of aerobic fitness, in response to significant aerobic
training, and an openness to new experiences. It is therefore predicted from this body of
research that, with suitable training and an absence of health problems, any individual could
become a competitor in an ultra-marathon. This is perhaps unsurprising given our evolutionary
background. If, as discussed in Chapter 2, endurance running was important in the evolution
of early hominins, with key physiological adaptions evolving over millions of years to benefit
long distance running, it can therefore be the case that we have also evolved psychologically
to facilitate the performance feats of endurance (Bramble & Lieberman, 2004; Hawley et al.,
2014; Schulkin, 2016). However, the possibility of identifying measurable evidence of this
inheritance, is limited, with reliance likely to be placed on genetics to provide further clarity
regarding the DNA underpinning existing and prior phenotypes. Evolutionary psychology has

197
had some success in explaining psychological traits as important evolutionary outcomes, with
adaptations designed to solve the problems faced by our ancestors and may provide some
insight into the shared pre-prerequisites for endurance activities (Buss, 2009, 2009a). The
psychology of modern man and woman may therefore be a consequence of adaptations evolved
to enable, or because of, endurance related activities.

198
7.5. Limitations, and Future Work Required in this Area The present programme of research included an extensive, but not exhaustive, set of
psychophysiological measures. Further interdisciplinary research is encouraged to extend
testing to include other factors that may influence performance in endurance events, including:
(a) mental fatigue; (b) the capacity to maintain the highest fraction of maximal oxygen uptake
over the duration of the competition; (c) energy cost and running economy; (d) previous race
experience; and (e) their interaction with mental toughness, motivation and personality.
Studies 1 and 2 focussed on the differences between ultra-marathoners and non-ultra-
marathoners and did not facilitate the examination of the profiles of the runners, and the intra-
relationships between psychological attributes. Further research is recommended that profiles
ultra-marathoners, and elite ultra-marathoners, versus non-ultra-marathoners to help
understand the intra- and inter- individual characteristics. Lack of differences in mental
toughness may be a result of the validity, and accuracy, of quantifying mental toughness via
the self-report nature of the MTQ48 and contextual influences. Future research is warranted to
identify ecologically valid, objective measures of mental toughness, affected by environmental
and physiological factors. This may lead to an improved understanding of mental toughness,
within context, not only situational and the environmental stressors, but also in relation to the
physiological state of the body.
A strength of this programme of research is that all factors were measured quantitively,
allowing comparison both between groups of ultra-marathoners and non-ultra-marathoners,
and between psychological and physiological measures. However, future research is warranted
to examine individual experiences of running an ultra-marathon using qualitative collection
199
methods and offer an insight into cognitive processes including attentional focus, perception
of effort and explore aspects of the experience of pain.
Due to time and resource considerations Studies 1 and 2 were restricted to testing 4 genes.
There is a need to extend testing, using hypothesis-free, genome-wide investigations, along
with their expression, to identify the genetic predisposition of an individual to succeed in ultra-
endurance events.
It should be noted that two of the three studies were performed under laboratory conditions,
which may not be representative of success in the context of an endurance challenge. Research
into ultra-marathoners to push themselves to their limits, in situ, has been largely overlooked,
and it is suggested that future studies undertake quantifying stress hormone changes in varying
race conditions, including multi-day events, 24-hour track, mountain, desert and arctic events,
and compare with both times to complete the race and psychological factors.
In this programme of research, maximal oxygen uptake, along with lactate threshold were used
as an indication of aerobic fitness. There is a need to further determine the extent to which
termination of the V̇O2peak testing may be driven by motivational factors, rather than
physiological ones.
The interdisciplinary Optimum Balanced Performance Model of Endurance Success is
speculated in response to analysis of the findings from the present research and needs to be
developed to predict aerobic success in ultra-marathoners. Further testing is recommended to
identify all factors that may impact performance in ultra-marathon events, and the interaction
between measures, including a general need to determine the extent to which the brain regulates

200
exercise and the extent to which mental fatigue, and perceived exertion impairs physical
performance.

201
APPENDICES

202
8. Appendices
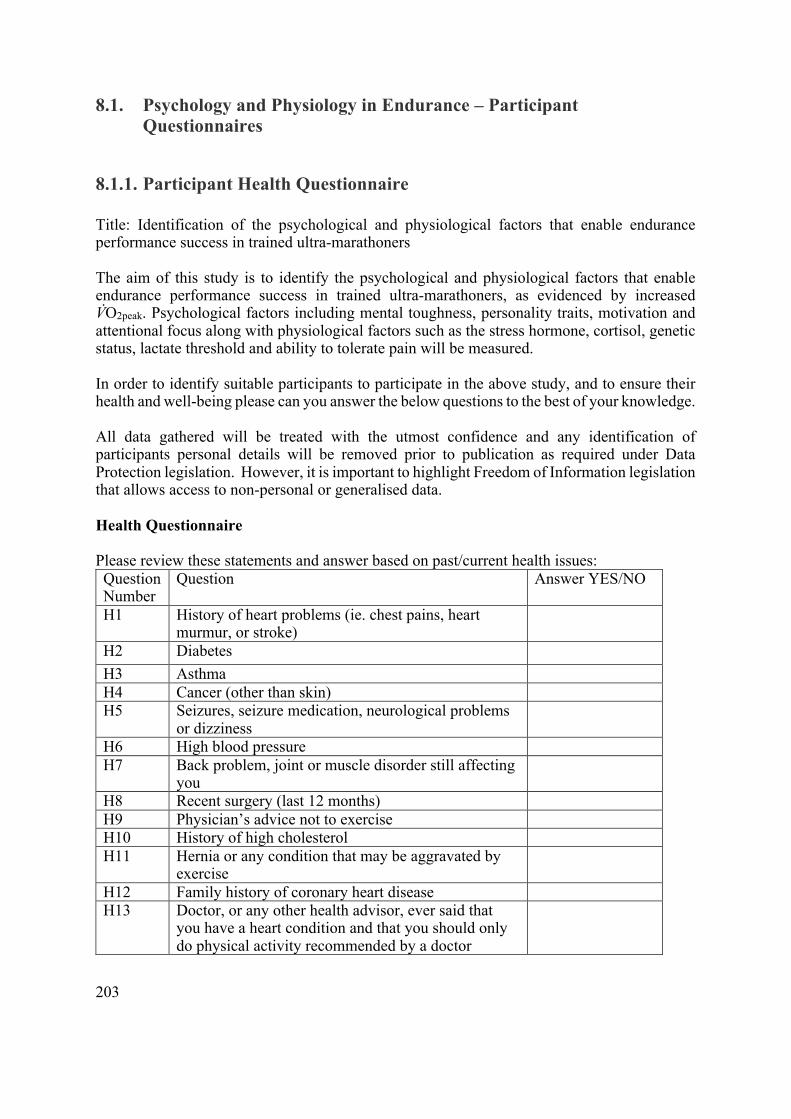
203
8.1. Psychology and Physiology in Endurance – Participant Questionnaires
8.1.1. Participant Health Questionnaire Title: Identification of the psychological and physiological factors that enable endurance performance success in trained ultra-marathoners The aim of this study is to identify the psychological and physiological factors that enable endurance performance success in trained ultra-marathoners, as evidenced by increased V̇O2peak. Psychological factors including mental toughness, personality traits, motivation and attentional focus along with physiological factors such as the stress hormone, cortisol, genetic status, lactate threshold and ability to tolerate pain will be measured. In order to identify suitable participants to participate in the above study, and to ensure their health and well-being please can you answer the below questions to the best of your knowledge. All data gathered will be treated with the utmost confidence and any identification of participants personal details will be removed prior to publication as required under Data Protection legislation. However, it is important to highlight Freedom of Information legislation that allows access to non-personal or generalised data. Health Questionnaire
Please review these statements and answer based on past/current health issues: Question Number
Question Answer YES/NO
H1 History of heart problems (ie. chest pains, heart murmur, or stroke)
H2 Diabetes H3 Asthma H4 Cancer (other than skin) H5 Seizures, seizure medication, neurological problems
or dizziness
H6 High blood pressure H7 Back problem, joint or muscle disorder still affecting
you
H8 Recent surgery (last 12 months) H9 Physician’s advice not to exercise H10 History of high cholesterol H11 Hernia or any condition that may be aggravated by
exercise
H12 Family history of coronary heart disease H13 Doctor, or any other health advisor, ever said that
you have a heart condition and that you should only do physical activity recommended by a doctor

204
H14 Feel pain in your chest when you do any physical activity
H15 Lose balance because of dizziness or do you ever lose consciousness
H16 Bone or joint problems that could be made worse by a change in your physical activity level
H17 Prescribed any medication for your blood pressure or a heart condition
H18 Current, or pre-existing, injury that would prevent you from taking part in exercise on a treadmill
H19 Know of any reason why you should not do physical activity or take part in this test
If you require any further information re this study, please do not hesitate to contact myself Jeremy Sutton either by phone or e-mail on (07909996420) or [email protected]

205
8.1.2. Psychology and Physiology in Endurance – Training Questionnaire Participant Endurance Training Questionnaire
Title: Identification of the psychological and physiological factors that enable endurance performance success in trained ultra-marathoners The aim of this study is to identify the psychological and physiological factors that enable endurance performance success in trained ultra-marathoners as evidenced by increased V̇O2peak. Psychological factors including mental toughness, personality traits, motivation and attentional focus along with physiological factors such as the stress hormone, cortisol, genetic status, lactate threshold and ability to tolerate pain will be measured. In order to identify suitable participants to participate in the above study, and to ensure their health and well-being please can you answer the below questions to the best of your knowledge. All data gathered will be treated with the utmost confidence and any identification of participants personal details will be removed prior to publication as required under Data Protection legislation. However, it is important to highlight Freedom of Information legislation that allows access to non-personal or generalised data. Training Questionnaire
Question Number
Question Answer
T1 How many hours and minutes of planned cardio-vascular exercise do you perform on average a week? Please specify the names of the activities?
e.g. X hours & Y minutes– Running X hours & Y minutes- Swimming X hours & Y minutes- Cycling
T2 When was the last time you completed an ultra-marathon i.e. a running race greater than 26.2 miles? If never, please state ‘N/A’
X months ago,
If you answered ‘N/A’ for question T2, then continue to question T5 T3 How many miles was the last ultra-marathon
race you took part in? Did you complete the entire race? If NO how many miles did you complete? How long did it take you to complete the distance?
X miles Yes/No X miles X hours & Y Minutes
T4 How many ultra-marathons have you completed? When was your first ultra-marathon
X number DD/MM/YYYY

206
T5 Are you currently training for an ultra-marathon? What is it called? When is it? How many miles are in the race?
Yes/No Name of event Day/Month/Year X miles
T6 How many miles are you running on average per week? (i.e. an average week over the course of the last month)
X miles
T7 How many miles is your longest run per week? (i.e. an average week over the course of the last month)
X miles
If you require any further information re this study, please do not hesitate to contact myself Jeremy Sutton either by phone or e-mail on (07909996420) or [email protected]

207
8.2. Psychological Tests
8.2.1. Sport Mental Toughness Questionnaire (SMTQ) item wording (Sheard, 2013)
Question number
Questions Very True
Mostly True
A little True
Not at all True
1 I interpret threats as positive opportunities
A B C D
2 I have an unshakeable confidence in my ability
A B C D
3 I have qualities that set me apart from other competitors
A B C D
4 I have what it takes to perform well while under pressure
A B C D
5 Under pressure, I am able to make decisions with confidence and commitment
A B C D
6 I can regain my composure if I have momentarily lost it
A B C D
7 I am committed to completing the tasks I have to do
A B C D
8 I take responsibility for setting myself challenging targets
A B C D
9 I give up in difficult situations A B C D 10 I get distracted easily and lose
my concentration A B C D
11 I worry about performing poorly
A B C D
12 I am over-come by self doubt A B C D 13 I get anxious by events I did
not expect or cannot control A B C D
14 I get angry and frustrated when things do not go my way
A B C D
Items 1-6 measure Confidence. Scores range from 6-24. Items 7-10 measure Constancy. Scores range from 4-16 Items 11-14 measure Control. Scores range from 4-16. Composite scores range from 14-56. Items 1-8 are positively scored (i.e. A = 4, B = 3, C = 2, D = 1) Items 9-14 are negatively scored (i.e. A = 1, B = 2, C = 3, D = 4)
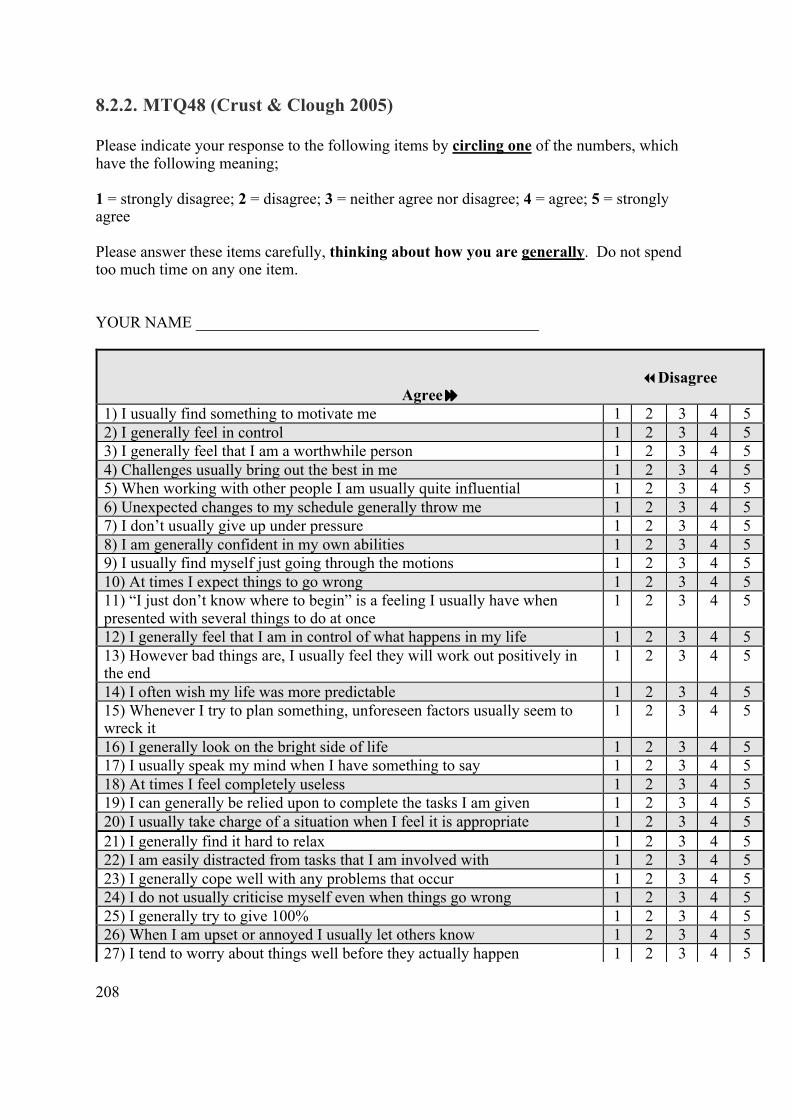
208
8.2.2. MTQ48 (Crust & Clough 2005) Please indicate your response to the following items by circling one of the numbers, which have the following meaning; 1 = strongly disagree; 2 = disagree; 3 = neither agree nor disagree; 4 = agree; 5 = strongly agree Please answer these items carefully, thinking about how you are generally. Do not spend too much time on any one item. YOUR NAME ___________________________________________
7Disagree
Agree8 1) I usually find something to motivate me 1 2 3 4 5 2) I generally feel in control 1 2 3 4 5 3) I generally feel that I am a worthwhile person 1 2 3 4 5 4) Challenges usually bring out the best in me 1 2 3 4 5 5) When working with other people I am usually quite influential 1 2 3 4 5 6) Unexpected changes to my schedule generally throw me 1 2 3 4 5 7) I don’t usually give up under pressure 1 2 3 4 5 8) I am generally confident in my own abilities 1 2 3 4 5 9) I usually find myself just going through the motions 1 2 3 4 5 10) At times I expect things to go wrong 1 2 3 4 5 11) “I just don’t know where to begin” is a feeling I usually have when presented with several things to do at once
1 2 3 4 5
12) I generally feel that I am in control of what happens in my life 1 2 3 4 5 13) However bad things are, I usually feel they will work out positively in the end
1 2 3 4 5
14) I often wish my life was more predictable 1 2 3 4 5 15) Whenever I try to plan something, unforeseen factors usually seem to wreck it
1 2 3 4 5
16) I generally look on the bright side of life 1 2 3 4 5 17) I usually speak my mind when I have something to say 1 2 3 4 5 18) At times I feel completely useless 1 2 3 4 5 19) I can generally be relied upon to complete the tasks I am given 1 2 3 4 5 20) I usually take charge of a situation when I feel it is appropriate 1 2 3 4 5 21) I generally find it hard to relax 1 2 3 4 5 22) I am easily distracted from tasks that I am involved with 1 2 3 4 5 23) I generally cope well with any problems that occur 1 2 3 4 5 24) I do not usually criticise myself even when things go wrong 1 2 3 4 5 25) I generally try to give 100% 1 2 3 4 5 26) When I am upset or annoyed I usually let others know 1 2 3 4 5 27) I tend to worry about things well before they actually happen 1 2 3 4 5

209
28) I often feel intimidated in social gatherings 1 2 3 4 5 29) When faced with difficulties I usually give up 1 2 3 4 5 30) I am generally able to react quickly when something unexpected happens
1 2 3 4 5
31) Even when under considerable pressure I usually remain calm 1 2 3 4 5 32) If something can go wrong, it usually will 1 2 3 4 5 33) Things just usually happen to me 1 2 3 4 5 34) I generally hide my emotion from others 1 2 3 4 5 35) I usually find it difficult to make a mental effort when I am tired 1 2 3 4 5 36) When I make mistakes I usually let it worry me for days after 1 2 3 4 5 37) When I am feeling tired I find it difficult to get going 1 2 3 4 5 38) I am comfortable telling people what to do 1 2 3 4 5 39) I can normally sustain high levels of mental effort for long periods 1 2 3 4 5 40) I usually look forward to changes in my routine 1 2 3 4 5 41) I feel that what I do tends to make no difference 1 2 3 4 5 42) I usually find it hard to summon enthusiasm for the tasks I have to do 1 2 3 4 5 43) If I feel somebody is wrong, I am not afraid to argue with them 1 2 3 4 5 44) I usually enjoy a challenge 1 2 3 4 5 45) I can usually control my nervousness 1 2 3 4 5 46) In discussions, I tend to back-down even when I feel strongly about something
1 2 3 4 5
47) When I face setbacks I am often unable to persist with my goal 1 2 3 4 5 48) I can usually adapt myself to challenges that come my way 1 2 3 4 5
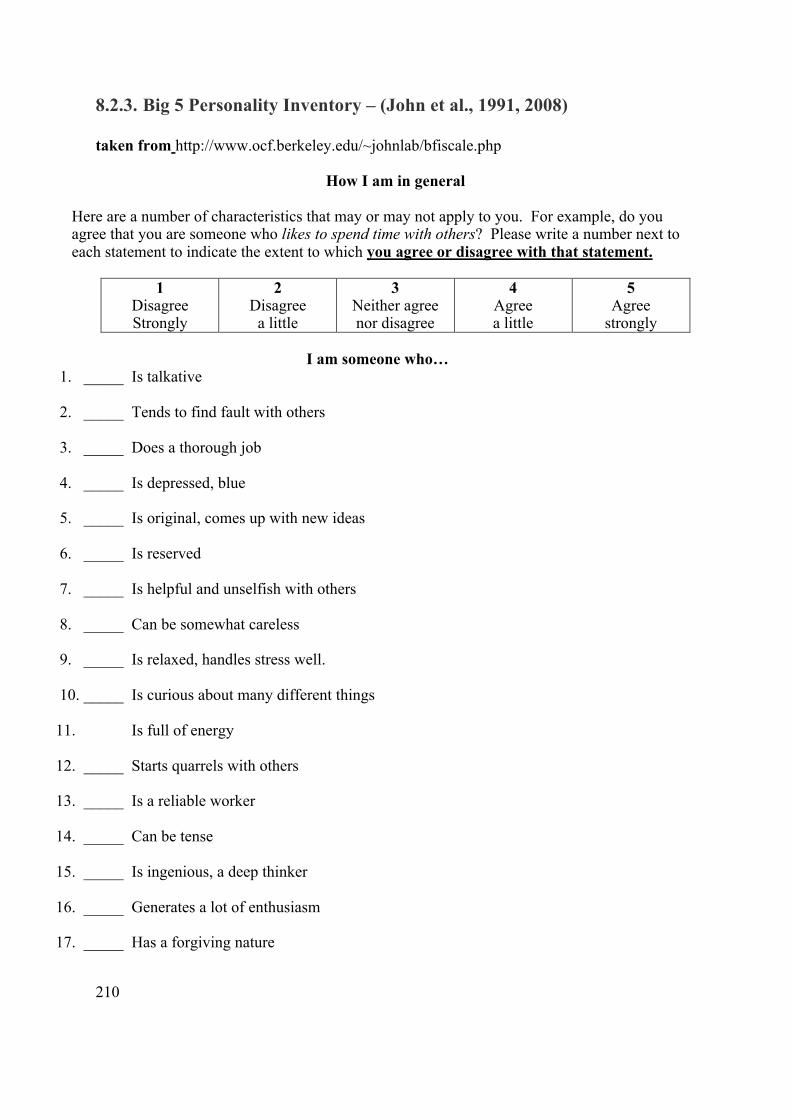
210
8.2.3. Big 5 Personality Inventory – (John et al., 1991, 2008) taken from http://www.ocf.berkeley.edu/~johnlab/bfiscale.php
How I am in general
Here are a number of characteristics that may or may not apply to you. For example, do you agree that you are someone who likes to spend time with others? Please write a number next to each statement to indicate the extent to which you agree or disagree with that statement.
1
Disagree Strongly
2 Disagree
a little
3 Neither agree nor disagree
4 Agree a little
5 Agree
strongly
I am someone who… 1. _____ Is talkative
2. _____ Tends to find fault with others
3. _____ Does a thorough job
4. _____ Is depressed, blue
5. _____ Is original, comes up with new ideas
6. _____ Is reserved
7. _____ Is helpful and unselfish with others
8. _____ Can be somewhat careless
9. _____ Is relaxed, handles stress well.
10. _____ Is curious about many different things
11. Is full of energy
12. _____ Starts quarrels with others
13. _____ Is a reliable worker
14. _____ Can be tense
15. _____ Is ingenious, a deep thinker
16. _____ Generates a lot of enthusiasm
17. _____ Has a forgiving nature

211
18. _____ Tends to be disorganized
19. _____ Worries a lot
20. _____ Has an active imagination
21. _____ Tends to be quiet 22. _____ Is generally trusting
23. _____ Tends to be lazy
24. _____ Is emotionally stable, not easily upset
25. _____ Is inventive
26. _____ Has an assertive personality
27. _____ Can be cold and aloof
28. _____ Perseveres until the task is finished
29. _____ Can be moody
30. _____ Values artistic, aesthetic experiences
31. _____ Is sometimes shy, inhibited
32. _____ Is considerate and kind to almost everyone
33. _____ Does things efficiently
34. _____ Remains calm in tense situations
35. _____ Prefers work that is routine
36. _____ Is outgoing, sociable
37. _____ Is sometimes rude to others
38. _____ Makes plans and follows through with them
39. _____ Gets nervous easily 40. _____ Likes to reflect, play with ideas 41. _____ Has few artistic interests

212
42. _____ Likes to cooperate with others 43. _____ Is easily distracted 44. _____ Is sophisticated in art, music, or literature

213
8.2.4. General Causality Orientation Scale (GCOS) – (Deci & Ryan, 1985)
The Scale (12-vignette version)
These items pertain to a series of hypothetical sketches. Each sketch describes an incident and lists three ways of responding to it. Please read each sketch, imagine yourself in that situation, and then consider each of the possible responses. Think of each response option in terms of how likely it is that you would respond that way. (We all respond in a variety of ways to situations, and probably most or all responses are at least slightly likely for you.) If it is very unlikely that you would respond the way described in a given response, you should circle answer 1 or 2. If it is moderately likely, you would select a number in the mid range, and if it is very likely that you would respond as described, you would circle answer 6 or 7.
For each question, answer as follows:
1 2 3 4 5 6 7
very moderately very unlikely likely likely
1. You have been offered a new position in a company where you have worked for some time. The first question that is likely to come to mind is:
a) What if I can't live up to the new responsibility?
b) Will I make more at this position?
c) I wonder if the new work will be interesting.
2. You have a school-age daughter. On parents' night the teacher tells you that your daughter is doing poorly and doesn't seem involved in the work. You are likely to:
a) Talk it over with your daughter to understand further what the problem is.
b) Scold her and hope she does better.
c) Make sure she does the assignments, because she should be working harder.
3. You had a job interview several weeks ago. In the mail you received a form letter which states that the position has been filled. It is likely that you might think:
a) It's not what you know, but who you know.
b) I'm probably not good enough for the job.

214
c) Somehow they didn't see my qualifications as matching their needs.
4. You are a plant supervisor and have been charged with the task of allotting coffee breaks to three workers who cannot all break at once. You would likely handle this by:
a) Telling the three workers the situation and having them work with you on the schedule.
b) Simply assigning times that each can break to avoid any problems.
c) Find out from someone in authority what to do or do what was done in the past.
5. A close (same-sex) friend of yours has been moody lately, and a couple of times has become very angry with you over "nothing." You might:
a) Share your observations with him/her and try to find out what is going on for him/her.
b) Ignore it because there's not much you can do about it anyway.
c) Tell him/her that you're willing to spend time together if and only if he/she makes more effort to control him/herself.
6. You have just received the results of a test you took, and you discovered that you did very poorly. Your initial reaction is likely to be:
a) "I can't do anything right," and feel sad.
b) "I wonder how it is I did so poorly," and feel disappointed.
c) "That stupid test doesn't show anything," and feel angry.
7. You have been invited to a large party where you know very few people. As you look forward to the evening, you would likely expect that:
a) You'll try to fit in with whatever is happening in order to have a good time and not look bad.
b) You'll find some people with whom you can relate.
c) You'll probably feel somewhat isolated and unnoticed.
8. You are asked to plan a picnic for yourself and your fellow employees. Your style for approaching this project could most likely be characterized as:
a) Take charge: that is, you would make most of the major decisions yourself.

215
b) Follow precedent: you're not really up to the task so you'd do it the way it's been done before.
c) Seek participation: get inputs from others who want to make them before you make the final plans.
9. Recently a position opened up at your place of work that could have meant a promotion for you. However, a person you work with was offered the job rather than you. In evaluating the situation, you're likely to think:
a) You didn't really expect the job; you frequently get passed over.
b) The other person probably "did the right things" politically to get the job.
c) You would probably take a look at factors in your own performance that led you to be passed over.
10.You are embarking on a new career. The most important consideration is likely to be:
a) Whether you can do the work without getting in over your head.
b) How interested you are in that kind of work.
c) Whether there are good possibilities for advancement.
11. A woman who works for you has generally done an adequate job. However, for the past two weeks her work has not been up to par and she appears to be less actively interested in her work. Your reaction is likely to be:
a) Tell her that her work is below what is expected and that she should start working harder.
b) Ask her about the problem and let her know you are available to help work it out.
c) It's hard to know what to do to get her straightened out.
12. Your company has promoted you to a position in a city far from your present location. As you think about the move you would probably:
a) Feel interested in the new challenge and a little nervous at the same time.
b) Feel excited about the higher status and salary that is involved.
c) Feel stressed and anxious about the upcoming changes.
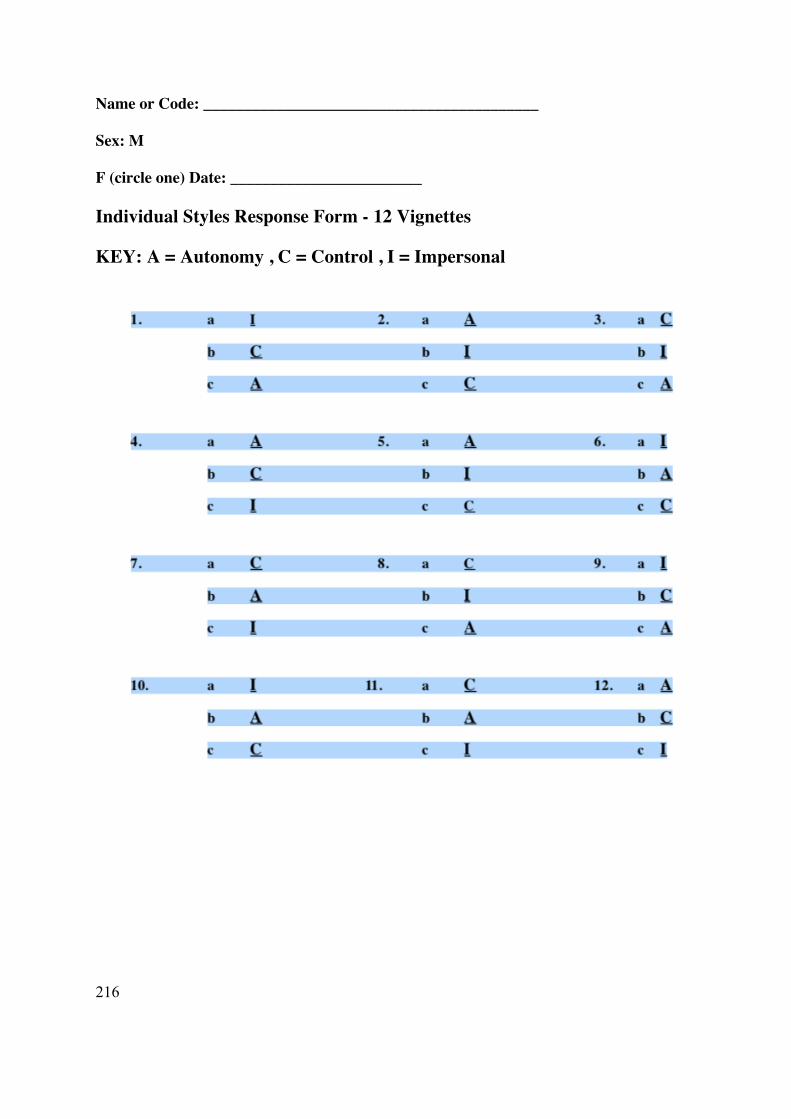
216
Name or Code: __________________________________________
Sex: M
F (circle one) Date: ________________________
Individual Styles Response Form - 12 Vignettes
KEY: A = Autonomy , C = Control , I = Impersonal

217
8.3. References Ash, G. I., Scott, R. A., Deason, M., Dawson, T. A., Wolde, B., Bekele, Z., . . . Pitsiladis, Y. P. (2011). No Association between ACE Gene Variation and Endurance Athlete Status in Ethiopians. Medicine & Science in Sports & Exercise,43(4), 590-597. Ajzen, I. (1985). From intentions to action: a theory of planned behavior. In J. Huhl, & J. Beckman (Eds.), Will; performance; control (psychology); motivation (psychology) (pp. 11–39). Berlin and New York: Springer-Verlag. Ajzen, I. (1987). Attitudes, Traits, and Actions: Dispositional Prediction of Behavior in Personality and Social Psychology. Advances in Experimental Social Psychology Advances in Experimental Social Psychology, 20, 1-63. Ajzen, I. (2002). Perceived Behavioral Control, Self-Efficacy, Locus of Control, and the Theory of Planned Behavior. Journal of Applied Social Psychology,32(4), 665-683. Al-Sharefi, A. (2016). Late Onset Diabetes of Adults (LADA) Masked By Co-Existed Adrenal Failure in the Context of Autoimmune Polyglandular Syndrome 2. Journal of Diabetes, Metabolic Disorders & Control,3(3). Allen, M. S., Greenless I., & Jones M.V. (2011). An investigation of the five-factor model of personality and coping behaviour in sport. Journal of Sports Sciences, 29(8), 841–850. Allen, M. S., Greenlees, I., & Jones, M.V. (2013 ) Personality in sport: a comprehensive review. International Review of Sport and Exercise Psychology, 6, 184- 208. Allen, M. S., Vella, S. A., & Laborde, S. (2015). Health-related behaviour and personality trait development in adulthood. Journal of Research in Personality,59, 104-110. Anderson, A. G. (2013) ‘Who’s mental, who’s tough and who’s both? Mutton dressed up as lamb’ in Daniel F Gucciardi and Sandy Gordon (Eds.), Mental Toughness in Sport – Developments in Theory and Sport (pp69-88), Abingdon: Routledge. Anderson, A. G., & Lavallee, D. (2008). Applying the Theories of Reasoned Action and Planned Behavior to Athlete Training Adherence Behavior. Applied Psychology, 57(2), 304-312. Anthony, D. R., Gucciardi, D. F., & Gordon, S. (2016). A meta-study of qualitative research on mental toughness development. International Review of Sport and Exercise Psychology, 9(1), 160-190. Armstrong, L. E., Casa, D. J., Emmanuel, H., Ganio, M. S., Klau, J. F., Lee, E. C., . . . Yamamoto, L. M. (2012). Nutritional, Physiological, and Perceptual Responses During a Summer Ultraendurance Cycling Event. Journal of Strength and Conditioning Research,26(2), 307-318.

218
Baddeley, A.D. (2012). Working memory: Theories, models and controversies. Annual Review of Psychology, 63: 1-20 Baden, D. A., Warwick-Evans, L., & Lakomy, J. (2004). Am I Nearly There? The Effect of Anticipated Running Distance on Perceived Exertion and Attentional Focus. Journal of Sport and Exercise Psychology,26(2), 215-231. Balagué, N., Torrents, C., Hristovski, R., & Kelso, J. A. (2017). Sport science integration: An evolutionary synthesis. European Journal of Sport Science, 17(1), 51-62. Bandura, A. (1977). Self-efficacy: Toward a unifying theory of behavioral change. Psychological Review, 84(2), 191-215. Bandura, A. (1986). Social foundations of thought and action: A social cognitive theory. Englewood Cliffs, NJ: Prentice-Hall. Barnes, K. R., & Kilding, A. E. (2014). Strategies to Improve Running Economy. Sports Medicine, 45(1), 37-56. Barr, R., Clark, C. C., Corbett, J., & Draper, S. B. (2018). Artefactual incidence of V˙O2 plateau and VO2max in historical studies. Science & Sports, 33(3). Barry, V. W., Church, T., & Blair, S. N. (2010). Using Molecular Classification to Predict Gains in Maximal Aerobic Capacity Following Endurance Exercise Training in Humans. Current Cardiovascular Risk Reports, 4(5), 319-320. Bartone P., Valdes, J., & Sandvik, A. (2016). Psychological hardiness predicts cardiovascular health. Psychology, Health & Medicine, 21(6), 743-749. Bassett, D. R. (2000). Limiting factors for maximum oxygen uptake and determinants of endurance performance. Medicine & Science in Sports & Exercise,70. Baumann, C. W., Brandenberger, K. J., Ferrer, D. A., Otis, J. S. (2014). Physiological parameters associated with 24 hour run performance. International Journal of Sport Studies. 4, 1450–4. Bell, J. J., Hardy, L., & Beattie, S. (2013). Enhancing mental toughness and performance under pressure in elite young cricketers: A 2-year longitudinal intervention. Sport, Exercise, and Performance Psychology, 2(4), 281-297. Biddle, S. J., Mutrie, N., & Gorely, T. (2015). Psychology of Physical Activity: Determinants, Well-Being and Interventions. Florence: Taylor and Francis. Billat, L. V., Koralsztein, J. P., & Morton, R. H. (1999). Time in Human Endurance Models. Sports Medicine, 27(6), 359-379. Blanton, H., & Jaccard, J. (2006). Arbitrary metrics in psychology. American Psychologist, 61(1), 27-41.

219
Borg, G. A. (1982). Psychophysical bases of perceived exertion. Medicine & Science in Sports & Exercise,14(5). Bouchard, C., Leon, A. S., Rao, D. C., Skinner, J. S., Wllmore, J. H., & Gagnon, J. (1995). Aims, design, and measurement protocol. Medicine & Science in Sports & Exercise, 27(5). Bramble, D. M., & Lieberman, D. E. (2004). Endurance running and the evolution of Homo. Nature,432(7015), 345-352. Breslin, G., Murphy, M. H., Kremer, J., Mcclean, C., & Davison, G. (2014). Providing Sport Psychology Support to an Athlete in a Unique, Ultra-Endurance Event. Journal of Sport Psychology in Action,5(2), 59-72. Brick, N., Macintyre, T., & Campbell, M. (2014). Attentional focus in endurance activity: New paradigms and future directions. International Review of Sport and Exercise Psychology,7(1), 106-134. Brooks, G. A. (1986). The lactate shuttle during exercise and recovery. Medicine & Science in Sports & Exercise,18(3), 360-368. Brooks, G. A. (2012). Bioenergetics of Exercising Humans. Comprehensive Physiology, 2(1), 537-562. Brooks, G. A., Fahey, T. D., & White, T. P. (2005). Exercise physiology: Human bioenergetics and its applications. Boston, MD: McGraw-Hill Higher Education Bryan, C., O’Shea, D., & Macintyre, T. (2017). Stressing the relevance of resilience: A systematic review of resilience across the domains of sport and work. International Review of Sport and Exercise Psychology, 1-41. Bull, S. J., Albinson, J. G., & Shambrook, C. J. (2005). Towards an understanding of mental toughness in elite English cricketers. Journal of Applied Sport Psychology, 17, 209–227. Buss, D. M., (2009). The great struggles of life: Darwin and the emergence of evolutionary psychology. American Psychologist, 64, 140-148. Buss D. M. (2009). How can evolutionary psychology successfully explain personality and individual differences? Perspectives on Psychological Science, 4(4), 359-366. Çam, F. S., Çolakoğlu, M., Tok, S., Tok, I., Kutlu, N., & Berdeli, A. (2010). Personality Traits and DRD4, DAT1, 5-HT2A Gene Polymorphisms in Risky and Non Risky Sports Participation. Turkiye Klinikleri Journal of Medical Sciences,30(5), 1459-1464. Caputo, F., & Denadai, B. S. (2004). Effects of aerobic endurance training status and specificity on oxygen uptake kinetics during maximal exercise. European Journal of Applied Physiology, 93(1-2), 87-95.

220
Carpenter, J. P., Garcia J. R., & Lum, J. K. (2011) Dopamine receptor genes predict risk preferences, time preferences, and related economic choices. Journal of Risk and Uncertainty,42, 233–261. Castilha, F. A., Ferreira, H. R., Oliveira, G., Oliveira, T., Fernandes, P. R.., & Filho J. F. (2018). The Influence of Gene Polymorphisms and Genetic Markers in the Modulation of Sports Performance: A Review. Journal of Exercise Physiology Online, 21 (2), 248+. Chang, K.-H., Lu, F. J. H., Chyi, T., Hsu, Y.-W., Chan, S.-W., & Wang, E. T. W. (2017). Examining the stress-burnout relationship: the mediating role of negative thoughts. PeerJ, 5, e4181. Clough, P., Earle, K. & Sewell, D. (2002). Mental toughness: The concept and its measurement. In I. Cockerill (Eds.) Solutions in Sport Psychology (pp32-45). London, Thomson. Clough, P. & Strycharczyk, D. (2012). Developing Mental Toughness – Improving performance, well being and positive behaviour in others, Kogan Page, London, UK Cohen, J. (1988). Statistical power analysis for the behavioural sciences (2nd ed.). Hillsdale, NJ: Erlbaum. Cona, G., Cavazzana, A., Paoli, A., Marcolin, G., Grainer, A., & Bisiacchi, P. S. (2015). It’s a Matter of Mind! Cognitive Functioning Predicts the Athletic Performance in Ultra-Marathon Runners. Plos One,10(7). Collins, M., Xenophontos, S. L., Cariolou, M. A., Mokone, G. G., Hudson, D. E., Anastasiades, L., & Noakes, T. D. (2004). The ACE Gene and Endurance Performance during the South African Ironman Triathlons. Medicine & Science in Sports & Exercise,36(8), 1314-1320. Connaughton, D., Wadey, R., Hanton, S., & Jones, G. (2008). The development and maintenance of mental toughness: Perceptions of elite performers. Journal of Sport Sciences, 26(1), 83–95. Connaughton, D., Hanton, S., & Jones, G. (2010). The Development and Maintenance of Mental Toughness in the World’s Best Performers. The Sport Psychologist,24(2), 168-193. doi:10.1123/tsp.24.2.168 Connaughton D., Thelwell R., & Hanton S. (2013) ‘Mental Toughness Development – Issues, practical Implications and future directions’ in Daniel F Gucciardi and Sandy Gordon (Eds.), Mental Toughness in Sport – Developments in Theory and Sport (pp135-162), Abingdon: Routledge. Cooper, C. E. (2008). The biochemistry of drugs and doping methods used to enhance aerobic sport performance. Essays In Biochemistry,44, 63-84. Cooper, S., Lavaysse, L. M., & Gard, D. E. (2015). Assessing motivation orientations in schizophrenia: Scale development and validation. Psychiatry Research, 225(1-2), 70-78.
221
Cosmides, L., & Tooby, J. (2013). Evolutionary Psychology: New Perspectives on Cognition and Motivation. Annual Review of Psychology, 64(1), 201-229. Crewe, H., Tucker, R., & Noakes, T. D. (2008). The rate of increase in rating of perceived exertion predicts the duration of exercise to fatigue at a fixed power output in different environmental conditions. European Journal of Applied Physiology, 103(5), 569-577. Crust, L (2007). Mental Toughness in Sport: A review. International journal of sport and exercise psychology, 5(3), 270-290. Crust, L. (2008). A review and conceptual re-examination of mental toughness: Implications for future researchers. Personality and Individual Differences, 45, 576–583. Crust, L. (2008b) Mental toughness and coping in an ultra-endurance event. In: BPS Division of Sport and Exercise Psychology Inaugural Conference, December 11th-12th 2008, London. Crust, L., & Clough, P. J. (2005). Relationship between Mental Toughness and Physical Endurance. Perceptual and Motor Skills, 100(1), 192-194. Crust, L., & Keegan, R. (2010). Mental toughness and attitudes to risk-taking. Personality and Individual Differences,49(3), 164-168. Crust, L., & Swann, C. (2011). Comparing two measures of mental toughness. Personality and Individual Differences, 50(2), 217-221. Cowden, R. G. (2016). Competitive Performance Correlates of Mental Toughness in Tennis. Perceptual and Motor Skills,123(1), 341-360. Cowden, R. G. (2017). Mental Toughness and Success in Sport: A Review and Prospect. The Open Sports Sciences Journal,10(1), 1-14. Crewther, B. T., Al-Dujaili, E., Smail, N. F., Anastasova, S., Kilduff, L. P., & Cook, C. J. (2013). Monitoring salivary testosterone and cortisol concentrations across an international sports competition: Data comparison using two enzyme immunoassays and two sample preparations. Clinical Biochemistry,46(4-5), 354-358. Csikszentmihalyi, M. (2009). Flow: The psychology of optimal experience. New York: Harper Row. Czuba, M., Zając, A., Cholewa, J., Poprzęcki, S., Waśkiewicz, Z., & Mikołajec, K. (2009). Lactate Threshold (D-Max Method) and Maximal Lactate Steady State in Cyclists. Journal of Human Kinetics, 21(1). Darwin, C. (1859). The Origin of Species. Oxford: Oxford University Press, 155, 158. Deci, E. L., & Ryan, R. M. (2000). The What and Why of Goal Pursuits: Human needs and the Self-Determination of behaviour. Psychological Inquiry, 11(4), 227-268.
222
Deci, E. L., & Ryan, R. M. (2008). Facilitating optimal motivation and psychological well-being across life's domains. Canadian Psychology ,49(1), 14-23. Deci, E. L., & Ryan, R. M. (1985). The general causality orientations scale: Self-determination in personality. Journal of Research in Personality, 19, 109-134. Deci, E. L., & Ryan, R. M. (1980). The Empirical Exploration of Intrinsic Motivational Processes. Advances in Experimental Social Psychology Advances in Experimental Social Psychology,13, 39-80. Deci, E. L., & Ryan, R. M. (1985a). Intrinsic motivation and self-determination in human behavior. New York: Plenum. DeNeen, W. P., & Jones, A. (2017). Cortisol and Alpha-amylase changes during an Ultra-Running Event. International Journal of Exercise Science. 10(4), 531 - 540. Eichhammer, P., Sand P. G., Stoertebecker P., & Langguth B. (2005) Variation at the DRD4 promoter modulates extraversion in Caucasians. Molecular Psychiatry 10, 520–522. Eston, R. (2012). Use of Ratings of Perceived Exertion in Sports. International Journal of Sports Physiology and Performance, 7(2), 175-182. Evans, H. J., Ferrar, K. E., Smith, A. E., Parfitt, G., & Eston, R. G. (2015). A systematic review of methods to predict maximal oxygen uptake from submaximal, open circuit spirometry in healthy adults. Journal of Science and Medicine in Sport,18(2), 183-188. Eysenk, M. W., & Keane, M. T. (2015). Cognitive Psychology: A Student’s Handbook (7th Ed.). Florence, KY: Psychology Press. Faude, O., Kindermann, W., & Meyer, T. (2009). Lactate Threshold Concepts. Sports Medicine, 39(6), 469-490. Ferrer, D. A., Baumann, C. W., Brandenberger, K. J., Ellis, R., & Otis, J. S. (2015). Physical motivation influences race performance over a 24-hour ultra-marathon. International Journal of Sport Studies, 5(10), 1162–1169. Fletcher, D. (2005). 'Mental Toughness' and human performance: Definitional, conceptual and theoretical issues. Journal of Sports Sciences, 23, 1246-1247 Fletcher, D., & Sarkar, M. (2016). Mental fortitude training: An evidence-based approach to developing psychological resilience for sustained success. Journal of Sport Psychology in Action, 7(3), 135-157. Fonseca-Engelhardt, K. D., Knechtle, B., Rüst, C., Knechtle, P., Lepers, R., & Rosemann, T. (2013). Participation and performance trends in ultra-endurance running races under extreme conditions - ‘Spartathlon’ versus ‘Badwater’. Extreme Physiology & Medicine, 2(1), 15.

223
Freund, W., Weber, F., Billich, C., Birklein, F., Breimhorst, M., & Schuetz, U. H. (2013). Ultra-Marathon Runners Are Different: Investigations into Pain Tolerance and Personality Traits of Participants of the TransEurope FootRace 2009. Pain Practice, 13(7), 524-532. Gatterer, H., Schenk, K., Wille, M., Raschner, C., Faulhaber, M., Ferrari, M., & Burtscher, M. (2013). Race Performance and Exercise Intensity of Male Amateur Mountain Runners During a Multistage Mountain Marathon Competition Are Not Dependent on Muscle Strength Loss or Cardiorespiratory Fitness. Journal of Strength and Conditioning Research, 27(8), 2149-2156. Ghosh, A., & Mahajan, P. B. (2016). Can genotype determine the sports phenotype? A paradigm shift in sports medicine. Journal of Basic and Clinical Physiology and Pharmacology, 27(4):333-9. Gimenez, P., Kerhervé, H., Messonnier, L. A., Féasson, L., & Millet, G. Y. (2013). Changes in the Energy Cost of Running during a 24-h Treadmill Exercise. Medicine & Science in Sports & Exercise, 45(9), 1807-1813. Gong, T., Shuai, L., & Comrie, B. (2014). Evolutionary linguistics: Theory of language in an interdisciplinary space. Language Sciences, 41, 243-253. Gronde, T. V., Hon, O. D., Haisma, H. J., & Pieters, T. (2013). Gene doping: An overview and current implications for athletes. British Journal of Sports Medicine, 47(11), 670-678. Gucciardi, D. F. (2017). Mental toughness: progress and prospects. Current Opinion in Psychology, 16, 17-23. Gucciardi DF, Gordon S (2013). Mental Toughness in Sport – Developments in Theory and Research. (1st ed.) New York. Routledge. Gucciardi, D.F., Gordon, S., & Dimmock, J.A. (2008). Towards an understanding of mental toughness in Australian football. Journal of Applied Sport Psychology, 20, 261-281. Gucciardi, D. F., Gordon, S., & Dimmock, J. A. (2009). Advancing mental toughness research and theory using personal construct psychology International review of sport and exercise psychology, 2, 54-72. Gucciardi, D. F., Hanton, S., & Mallett, C. J. (2012). Progressing measurement in mental toughness: A case example of the Mental Toughness Questionnaire 48. Sport, Exercise, and Performance Psychology, 1(3), 194-214. Gucciardi, D. F., Hanton, S., Gordon, S., Mallett, C. J., & Temby, P. (2014). The Concept of Mental Toughness: Tests of Dimensionality, Nomological Network, and Traitness. Journal of Personality, 83(1), 26-44. Gucciardi, D. F., & Jackson, B. (2013). Understanding sport continuation: An integration of the theories of planned behaviour and basic psychological needs. Journal of Science and Medicine in Sport, 18(1), 31-36.

224
Gucciardi, M., Hanrahan and Gordon (2013a) ‘Measuring Mental Toughness in Sport’ in Daniel F Gucciardi and Sandy Gordon (Eds.), Mental Toughness in Sport – Developments in Theory and Sport (pp135-162), Abingdon: Routledge. Gucciardi, D. F., Peeling, P., Ducker, K. J., & Dawson, B. (2016). When the going gets tough: Mental toughness and its relationship with behavioural perseverance. Journal of Science and Medicine in Sport, 19 (1), 81-6. Gucciardi, D. F., Stamatis, A., & Ntoumanis, N. (2017a). Controlling coaching and athlete thriving in elite adolescent netballers: The buffering effect of athletes’ mental toughness. Journal of Science and Medicine in Sport, 20(8), 718-722. Hackney, A. C. (2006). Stress and the neuroendocrine system: the role of exercise as a stressor and modifier of stress. Expert Review of Endocrinology & Metabolism, 1(6), 783-792. Haff, G. G., & Dumke, C. (2012). Laboratory manual for exercise physiology. Champaign, IL: Human Kinetics. Hagger, M., & Chatzisarantis, N. (2008). Self-determination Theory and the psychology of exercise. International Review of Sport and Exercise Psychology, 1(1), 79-103. Hans, T. A. (2000). A meta-analysis of the effects of adventure programming on locus of control. Journal of Contemporary Psychotherapy, 30(1), 33. Hanson, N., Madaras, L., Dicke, J., Buckworth, J., (2015). Motivational differences between half, full and ultramarathoners. Journal of Sport Behavior, 38 (2), 180-191. Harter, S., Effectance motivation reconsidered: Toward a developmental model. Human Development, 1978. 1: pp. 34-64. Hashimoto, M., Hagura, N., Kuriyama, T., & Nishiyamai, M. (2006). Motivations and psychological characteristics of Japanese ultra-marathon runners using Myers-Briggs type indicator. Japanese Journal of Health and Human Ecology,72(1), 15-24. Hawley, J.A., Hargreaves, M., Joyner MJ., & Zierath, JR. (2014). Integrative Biology of Exercise. Cell, 159(4), 738-749 Heath, E. M. (1998). Borgs Perceived Exertion and Pain Scales. Medicine& Science in Sports & Exercise, 30(9), 1461. Hill, A. V., Long, C. N. H & Lupton, H. (1924). Muscular exercise, lactic acid and the supply and utilisation of oxygen: Parts VII-VIII. Proc. Roy. Soc. B 97:155–176, 1924. Hill, A. V., & Lupton, H (1923). Muscular exercise, lactic acid, and the supply and utilization of oxygen. Q. J. Med. 16:135–171.

225
Hill, E. E., Zack, E., Battaglini, C., Viru, M., Viru, A., & Hackney, A. C. (2008). Exercise and circulating Cortisol levels: The intensity threshold effect. Journal of Endocrinological Investigation,31(7), 587-591. Hoffman, M. D., & Krishnan, E. (2013). Exercise Behavior of Ultramarathon Runners. Journal of Strength and Conditioning Research, 27(11), 2939-2945. Hoffman, M. D., Ong, J. C., & Wang, G. (2010). Historical Analysis of Participation in 161 km Ultramarathons in North America. The International Journal of the History of Sport, 27(11), 1877-1891. Holt, N. L., Lee, H., Kim, Y., & Klein, K. (2014). Exploring Experiences of Running an Ultramarathon. The Sport Psychologist, 28(1), 22-35. Horsburgh, V.A., Schermer, J.A., Veselka, L., Vernon, P.A. (2009). A behavioural genetic study of mental toughness and personality. Personality and Individual Differences, 46, 100-105. Hristovski, R. (2013). Synthetic thinking in (sports) science: The self-organization of the scientific language. Research in Physical Education Sport and Health, 2, 27–34. Hristovski, R., & Balagué, N. (2010). Fatigue-induced spontaneous termination point – Nonequilibrium phase transitions and critical behavior in quasi-isometric exertion. Human Movement Science, 29(4), 483-493. Hughes, S., Case, H. S., Stuempfle, K., & Evans, D. (2003). Personality Profiles of Iditasport Ultra-Marathon Participants. Journal of Applied Sport Psychology,15(3), 256-261. Hurdiel, R., Riedy, S. M., Millet, G. P., Mauvieux, B., Pezé, T., Elsworth-Edelsten, C., . . . Dupont, G. (2018). Cognitive performance and self-reported sleepiness are modulated by time-of-day during a mountain ultramarathon. Research in Sports Medicine,1-8. Hutchinson, J. C., & Tenenbaum, G. (2006). Perceived effort — Can it be considered gestalt? Psychology of Sport and Exercise, 7(5), 463-476. Inder, W. J., Dimeski, G., & Russell, A. (2012). Measurement of salivary cortisol in 2012 - laboratory techniques and clinical indications. Clinical Endocrinology,77(5), 645-651. Inzlicht, M., & Marcora, S. M. (2016). The Central Governor Model of Exercise Regulation Teaches Us Precious Little about the Nature of Mental Fatigue and Self-Control Failure. Frontiers in Psychology,7. Jackson, R., & Watkin, C. (2004) The resilience inventory: Seven essential skills for overcoming life’s obstacles and determining happiness. Selection and Development Review, 20 (6), 13-17. John, O. P., Donahue, E. M., & Kentle, R. L. (1991). The Big Five Inventory--Versions 4a and 54. Berkeley, CA: University of California, Berkeley, Institute of Personality and Social Research.

226
John, O. P., Naumann, L. P., & Soto, C. J. (2008). Paradigm shift to the integrative Big Five trait taxonomy: History, measurement, and conceptual issues. In O. P. John, R. W. Robins, & L. A. Pervin (Eds.), Handbook of personality: Theory and research (pp. 114-158). New York, NY: Guilford Press. Jones, G., Hanton, S., & Connaughton, D (2002). What is this thing called mental toughness? An investigation with elite performers. Journal of Applied Sport Psychology, 14, 211 – 224. Jones, G., Hanton, S., & Connaughton, D. (2007). A framework of mental toughness in the world’s best performers. The Sport Psychologist, 21, 243-264. Joyner, M. J., & Coyle, E. F. (2008). Endurance exercise performance: The physiology of champions. The Journal of Physiology, 586(1), 35-44. Kaiseler, M., Levy, A., Nicholls, A., & Madigan, D. (2017). The independent and interactive effects of the Big-Five personality dimensions upon dispositional coping and coping effectiveness in sport. International Journal of Sport and Exercise Psychology,1-17. Kaiseler, M., Polman RCJ., Nicholls AR. (2012). Effects of the Big Five personality dimensions on appraisal coping, and coping effectiveness in sport. European Journal of Sport Science. 12(1), 62-72. Kelly, G.A. (1991). The psychology of personal constructs: A theory of personality (Vol 1). London: Routledge (Original work published 1955). Kenney, W. L., Wilmore, J. H., & Costill, D. L. (2015). Physiology of sport and exercise. Champaign, IL: Human Kinetics. Kivlighan, K. T., Granger, D. A., & Booth, A. (2005). Gender differences in testosterone and cortisol response to competition. Psychoneuroendocrinology, 30(1), 58-71. Klint, K. A., & Weiss, M. R. (1987). Perceived Competence and Motives for Participating in Youth Sports: A Test of Harters Competence Motivation Theory. Journal of Sport Psychology,9(1), 55-65. Knechtle, B. (2012). Ultramarathon Runners: Nature or Nurture? International Journal of Sports Physiology and Performance, 7(4), 310-312. Knechtle, B., Rosemann, T., Knechtle, P., & Lepers, R. (2010). Predictor Variables for A 100-km Race Time in Male Ultra-Marathoners. Perceptual and Motor Skills, 111(3), 681-693. Knechtle, B., Rüst, C. A., Rosemann, T., & Lepers, R. (2011). Age-related changes in 100-km ultra-marathon running performance. Age,34(4), 1033-1045. Knechtle, B., Wirth, A., Knechtle, P., Rüst, C. A., & Rosemann, T. (2012). A Comparison of Ultra-Endurance Cyclists in a Qualifying Ultra-Cycling Race for Paris-Brest-Paris and Race across America—Swiss Cycling Marathon. Perceptual and Motor Skills, 114(1), 96-110.

227
Knechtle, B. (2015). Ultra-marathon running. Dansk Sportsmedicin. 4(19). Kobasa, S. C. (1979) Stressful life events, personality and health: an inquiry into hardiness. Journal of personality and social psychology, 37 (1), 1-11. Kobasa, S. C., Maddi, S. R., Kahn, S. (1982). Hardiness and Health : a prospective study, Journal of personality and social psychology, 42, 168-77. Kobasa, S.C., Maddi, S.R., Puccetti, M.C., & Zola, M.A. (1985) Effectiveness of hardiness, exercise and social support as resources against illness, Journal of Psychosomatic Research, 29, 525-33. Koestner, R., Bernieri, F., & Zuckerman, M. (1992). Self-Regulation and Consistency between Attitudes, Traits, and Behaviors. Personality and Social Psychology Bulletin, 18(1), 52-59. Kremer, J., & Moran, A. (2013). Pure sport: Practical sport psychology. Hove, East Sussex: Routledge. Krouse, R. Z., Ransdell, L. B., Lucas, S. M., & Pritchard, M. E. (2011). Motivation, Goal Orientation, Coaching, and Training Habits of Women Ultrarunners. Journal of Strength and Conditioning Research,25(10), 2835-2842. Lac, G., & Berthon, P. (2000). Changes in cortisol and testosterone levels and T/C ratio during an endurance competition and recovery. Journal of Sports Medicine and Physical Fitness, 40(2), 139-44. Lambert, E. V. Gibson, A. S, Noakes, T. D. (2005). Complex systems model of fatigue: integrative homoeostatic control of peripheral physiological systems during exercise in humans. British Journal of Sports Medicine, 39(1), 52-62. Lane, A.M., & Wilson, M. (2011). Emotions and trait emotional intelligence among ultra-endurance runners. Journal of Science and Medicine in Sport, 14(4), 358–362. Lantis, D. J., Farrell, J. W., Cantrell, G. S., & Larson, R. D. (2017). Eight Weeks of High-Volume Resistance Training Improves Onset of Blood Lactate in Trained Individuals. Journal of Strength and Conditioning Research, 31(8), 2176-2182. Levy, A. R., Polman, R. C. J., Clough, P. J., Marchant, D. C. & Earle, K. (2006). Mental Toughness as a Determinant of Beliefs, Pain, and Adherence in Sport Injury Rehabilitation. Journal of Sport Rehabilitation, 15, 246-254. Lippi, G., Longo, U. G., & Maffulli, N. (2009). Genetics and sports. British Medical Bulletin, 93(1), 27-47. Loehr, J. E. (1982). Mental toughness training for Sports: Achieving athletic excellence. New York: Plume.

228
Loehr, J.E. (1986). Mental Toughness Training for Sports: Achieving Athletic Excellence, Lexington, MA: Stephen Greene Press. Lonsdale, C., Hodge, K., & Rose, E. (2009) Athlete burnout in elite sport: A self-determination perspective. Journal of Sports Sciences, 27(8), 785-795, Magness, Steve. The Science of Running: How to Find Your Limit and Train to Maximize Your Performance. Origin Press, 2014. Mahoney, J. W., Gucciardi, D. F., Ntoumanis, N., & Mallet, C. J. (2014). Mental Toughness in Sport: Motivational Antecedents and Associations with Performance and Psychological Health. Journal of Sport and Exercise Psychology,36(3), 281-292. Mahoney, J., Ntoumanis, N., Mallett, C., & Gucciardi, D. (2014a). The motivational antecedents of the development of mental toughness: A self-determination theory perspective. International Review of Sport and Exercise Psychology,7(1), 184-197. Malinauskas, R., Dumciene, A., Mamkus, G., & Venckunas, T. (2014). Personality Traits and Exercise Capacity in Male Athletes and Non-Athletes. Perceptual and Motor Skills, 118(1), 145-161. Marcora, S. M. (2008). Do we really need a central governor to explain brain regulation of exercise performance? European Journal of Applied Physiology,104(5), 929-931. Marcora, S. M., Staiano, W., & Manning, V. (2009). Mental fatigue impairs physical performance in humans. Journal of Applied Physiology,106(3), 857-864. Marcora, S. M., & Staiano, W. (2010). The limit to exercise tolerance in humans: Mind over muscle? European Journal of Applied Physiology,109(4), 763-770. Marshall, T., Roberts, J., Pack, Stephen., Basevitch, I., Rossato, C., Suckling, C., Dawkins, T., Roberts, M. (2017). The Effect of Long Term Physical Training on the Development of Mental Toughness in Recreational Active Participants. Journal of Multidisciplinary Research, 9(2), 29-43. Martinez, C. T., & Scott, C. (2016). Trail and Ultrarunning: The Impact of Distance, Nature, and Personality on Flow and Well-Being. Psi Chi Journal of Psychological Research, 21(1), 6-15. Mazzoleni, M. J., Battaglini, C. L., Martin, K. J., Coffman, E. M., Ekaidat, J. A., Wood, W. A., & Mann, B. P. (2017). A dynamical systems approach for the submaximal prediction of maximum heart rate and maximal oxygen uptake. Sports Engineering, 21(1), 31-41. McArdle, W. D., Katch, F. I., & Katch, V. L. (2015). Exercise physiology: nutrition, energy, and human performance. Philadelphia: Wolters Kluwer Health/Lippincott Williams & Wilkins. Mccormick, A., Meijen, C., & Marcora, S. (2015). Psychological Determinants of Whole-Body Endurance Performance. Sports Medicine, 45(7), 997-1015.

229
Mccormick, A., Meijen, C., & Marcora, S. (2018). Effects of a Motivational Self-Talk Intervention for Endurance Athletes Completing an Ultramarathon. The Sport Psychologist,32(1), 42-50. McCrae, R. R., & John, O. P. (1992). An introduction to the five-factor model and its applications. Journal of Personality, 60, 175-215. Melzer, K. (2011). Carbohydrate and fat utilization during rest and physical activity. E-SPEN, the European E-Journal of Clinical Nutrition and Metabolism ,6(2). Midgley, A. W., Mcnaughton, L. R., & Wilkinson, M. (2006). Is there an Optimal Training Intensity for Enhancing the Maximal Oxygen Uptake of Distance Runners? Sports Medicine, 36(2), 117-132. Mier, C. M., Alexander, R. P., & Mageean, A. L. (2012). Achievement of V[Combining Dot Above]O2max Criteria During a Continuous Graded Exercise Test and a Verification Stage Performed by College Athletes. Journal of Strength and Conditioning Research, 26(10), 2648-2654. Montgomery HE, Marshall R, Hemingway H, Myerson S (1998). Human Gene for Physical Performance’. Nature, 393. 221. Montgomery, H.E., Puthucheary, Z., Skipworth, J. R. A., Rawal, J., Loosemore, M, & Van Someren, K. (2011). The ACE Gene and Human Performance. Sports Medicine. 41 (6), 433-448. Moore, I. S. (2016). Is There an Economical Running Technique? A Review of Modifiable Biomechanical Factors Affecting Running Economy. Sports Medicine,46(6), 793-807. Moran, A., Guillot, A., Macintyre, T., & Collet, C. (2011). Re-imagining motor imagery: Building bridges between cognitive neuroscience and sport psychology. British Journal of Psychology, 103(2), 224-247. Murphy, M. H., Breslin, G., Trinick, T., Mcclean, C., Moore, W., Duly, E., & Davison, G. W. (2011). The biochemical, physiological and psychological consequences of a “1,000 miles in 1,000 hours” walking challenge. European Journal of Applied Physiology, 112(2), 781-788. Nagashima, J. (2006). Left ventricular chamber size predicts the race time of Japanese participants in a 100 km ultramarathon Commentary. British Journal of Sports Medicine,40(4), 331-333. Nakagawa, S. & Cuthill, I. C. (2007), Effect size, confidence interval and statistical significance: a practical guide for biologists. Biological Reviews. 82, 591–605. Nevill, A. M., & Cooke, C. B. (2017). The Dangers of Estimating VO2max Using Linear, Nonexercise Prediction Models. Medicine & Science in Sports & Exercise, 49(5), 1036-1042.

230
Nia, M. E., & Besharat, M. A. (2010). Comparison of athletes’ personality characteristics in individual and team sports. Procedia - Social and Behavioral Sciences, 5, 808-812. Noakes, T. D. (2007). The Central Governor Model of Exercise Regulation Applied to the Marathon. Sports Medicine, 37(4), 374-377. Noakes, Timothy D. (2011). The Central Governor Model in 2012: eight new papers deepen our understanding of the regulation of human exercise performance. British Journal of Sports Medicine, 46(1), 1-3. Noakes, T. D, St Clair Gibson, A. (2004) Logical limitations to the “catastrophe” models of fatigue during exercise in humans. British Journal of Sports Medicine, 38(5), 648–649. O’Leary, T. J., Collett, J., Howells, K., & Morris, M. G. (2017). High but not moderate-intensity endurance training increases pain tolerance: A randomised trial. European Journal of Applied Physiology,117(11), 2201-2210. Osborn, M., & Rodham, K. (2010). Insights into Pain: A Review of Qualitative Research. Reviews in Pain, 4(1), 2-7. Oztasyonar, Y. (2017). Interaction between different sports branches such as taekwondo, box, athletes and serum brain derived neurotrophic factor levels. Journal Of Sports Medicine And Physical Fitness, 57(4), 457-460. Pageaux, B., Lepers, R., Dietz, K. C., & Marcora, S. M. (2014). Response inhibition impairs subsequent self-paced endurance performance. European Journal of Applied Physiology, 114(5), 1095-1105. Palmer, C. L., Burwitz, L., Dyer, A. N., & Spray, C. M. (2005). Endurance training adherence in elite junior netball athletes: A test of the theory of planned behaviour and a revised theory of planned behaviour. Journal of Sports Sciences, 23(3), 277-288. Papadimitriou, I. D., Lockey, S. J., Voisin, S., Herbert, A. J., Garton, F., Houweling, P. J., . . . Eynon, N. (2018). No association between ACTN3 R577X and ACE I/D polymorphisms and endurance running times in 698 Caucasian athletes. BMC Genomics,19(1). Pearson, H. (2006). Physiology: Freaks of nature? Nature, 444(7122), 1000-1. Penke, L., & Jokela, M. (2016). The evolutionary genetics of personality revisited. Current Opinion in Psychology, 7, 104-109. Perry, J. L., Clough, P. J., Crust, L., Earle, K., & Nicholls, A. R. (2013). Factorial validity of the Mental Toughness Questionnaire-48. Personality and Individual Differences,54(5), 587-592.
231
Petito, A., Altamura, M., Iuso, S., Padalino, F. A., Sessa, F., Dandrea, G., . . . Bellomo, A. (2016). The Relationship between Personality Traits, the 5HTT Polymorphisms, and the Occurrence of Anxiety and Depressive Symptoms in Elite Athletes. Plos One,11(6). Piacentini, M. F., Minganti, C., Ferragina, A., Ammendolia, A., Capranica, L., & Cibelli, G. (2015). Stress related changes during a half marathon in master endurance athletes. Journal of Sports Medicine and Physical Fitness, 55, 329-336. Pontzer, H., Brown, M. H., Raichlen, D. A., Dunsworth, H., Hare, B., Walker, K., . . . Ross, S. R. (2016). Metabolic acceleration and the evolution of human brain size and life history. Nature, 533(7603), 390-392. Puthucheary, Z., Skipworth, J. R. A., Rawal, J., Loosemore, M., Van Someren, K., & Montgomery, H. E., (2011). The ACE Gene and Human Performance. Sports Medicine. 41 (6), 433-448. Rendon, J. (2016). Upside: The new science of post-traumatic growth. New York: Touchstone. Rheinberg, F., & Engeser, S. (2010). Motive Training and Motivational Competence. Implicit Motives,510-548. Rigat, B., Hubert, ,C., Corvol, P., & Soubrier, F. (1992). PCR detection of the insertion/ deletion polymorphism of the human angiotensin converting enzyme gene (DCP1). Nucleic Acids Res, 20, 1433. Robergs, R. A. (2017). Lessons from Popper for science, paradigm shifts, scientific revolutions and exercise physiology. BMJ Open Sport & Exercise Medicine, 3(1). Robergs, R.A., Ghiasvand, F., & Parker, D. (2004). Biochemistry of exercise-induced metabolic acidosis. American Journal Physiology: Regulatory, Integrative and Comparitive Physiology, 287 (3), 502 -16. Robertson, I. T., Cooper, C. L., Sarkar, M., & Curran, T. (2015). Resilience training in the workplace from 2003 to 2014: A systematic review. Journal of Occupational and Organizational Psychology, 88(3) , 533-562. Roebuck, G. S., Fitzgerald, P. B., Urquhart, D. M., Ng, S., Cicuttini, F. M., & Fitzgibbon B. M. (2018). The psychology of ultra-marathon runners: A systematic review. Psychology of Sport and Exercise, 37, 43-58 Rønnestad, B. R., & Mujika, I. (2013). Optimizing strength training for running and cycling endurance performance: A review. Scandinavian Journal of Medicine & Science in Sports, 24(4), 603-612. Rosário, R., Araújo, A., Padrão, P., Lopes, O., Moreira, A., Pereira, B., & Moreira, P. (2016). Health Promotion Intervention to Improve Diet Quality in Children. Health Promotion Practice,18(2), 253-262.
232
Rowland, T. (2009). Endurance Athletesʼ Stroke Volume Response to Progressive Exercise. Sports Medicine, 39(8), 687-695. Rutter, M. (1985). Resilience in the face of adversity: Protective factors and resistance in psychiatric disorder, British Journal of Psychiatry, 147 (6), 598-611. Rutter, M. (2012). Resilience as a dynamic concept. Development and psychopathology, 24(2), 335-44. Ryan, R. M., & Connell, J. P. (1989). Perceived locus of causality and internalization: Examining reasons for acting in two domains. Journal of Personality and Social Psychology, 57(5), 749-761. Ryan, R.M., Connell, J.P., & Deci, E.L. (1985). A motivational analysis of self-determination and self-regulation in education. In C. Ames & R.E. Ames (Eds.), Research on motivation in education: The classroom milieu (pp. 13-51). Waltham, MA: Academic Press. Ryan, R. M., & Deci, E. L. (2017). Self-determination theory: Basic psychological needs in motivation, development, and wellness. New York: Guilford Press. Samuel, C.A., & Ebenezer, I. S. (2013). Exploratory study on the efficacy of reflexology for pain threshold and tolerance using an ice-pain experiment and sham TENS control. Complementary Therapies in Clinical Practice, 19. 57-62. Sarzynski, M. A., Ghosh, S. & Bouchard, C. (2017), Genomic and transcriptomic predictors of response levels to endurance exercise training. The Journal of Physiology, 595, 2931–2939. Schnohr, P., O’Keefe, J. H., Marott, J. L., Lange, P., & Jensen, G. B. (2015). Dose of Jogging and Long-Term Mortality. Journal of the American College of Cardiology, 65(5), 411-419. Schulkin, J. (2016). Evolutionary Basis of Human Running and Its Impact on Neural Function. Frontiers in Systems Neuroscience,10. Schüler, J., Wegner, M., & Knechtle, B. (2014). Implicit Motives and Basic Need Satisfaction in Extreme Endurance Sports. Journal of Sport and Exercise Psychology, 36(3), 293-302. Seiler, S., Katch, F., Hopkins, W., & Buchheit, M. (2011). A Brief History of Endurance Testing in Athletes. Sportscience, 15, 40-86 Seligman, M. E. P., & Csikszentmihalyi, M. (2000). Positive psychology: An introduction. American Psychology, 55, 5–14. Sheard, M., Golby, J., & Van Wersch, A. (2009). Progress towards construct validation of the Sports Mental Toughness Questionnaire (SMTQ). European Journal of Psychological Assessment, 25, 186–193.

233
Sheard, M. (2009b). A Cross-National Analysis of Mental Toughness and Hardiness in Elite University Rugby League Teams. Perceptual and Motor Skills, 109(1), 213-223. Sheard, M. (2013). Mental toughness: the mindset behind sporting achievement. London: Routledge. Simpson, D., Post, P. G., Young, G., & Jensen, P. R. (2014). “It’s Not about Taking the Easy Road”: The Experiences of Ultramarathon Runners. The Sport Psychologist, 28(2), 176-185. Specht, J., Egloff, B., & Schmukle, S. C. (2012). Examining Mechanisms of Personality Maturation: The Impact of Life Satisfaction on the Development of the Big Five Personality Traits. SSRN Electronic Journal. St Clair Gibson, A. S., Swart, J., & Tucker, R. (2017). The interaction of psychological and physiological homeostatic drives and role of general control principles in the regulation of physiological systems, exercise and the fatigue process – The Integrative Governor theory. European Journal of Sport Science,18(1), 25-36. Tan, P. S., Tan, F. Y., & Bosch, A. N. (2016). Similarities and Differences in Racing Patterns in a 161-km and 101-km Ultra-distance Road Race. The Journal of Strength and Conditioning. 30(8), 2145-2155. Tanner, A.V., Nielsen, B.V. & Allgrove, J. (2013). Salivary and plasma cortisol and testosterone responses to interval and tempo runs and a bodyweight-only circuit session in endurance-trained men. Journal of Sports Sciences. 32(7), 680-689. Taylor J. (2010). Sports and cardiac function 1: exercise is a potent stressor on the heart. European Heart Journal. 31(1), 6-8. Teixera, P. J., Carraca, E. V., Markland, D., Silva, M. N., & Ryan, R. M. (2012). Exercise, physical activity, and self-determination theory: A systematic review. International Journal of Behavioral Nutrition and Physical Activity, 9:78. Thelwell, R. C., Such, B. A., Weston, N. J., Such, J. D., & Greenlees, I. A. (2010). Developing mental toughness: Perceptions of elite female gymnasts. International Journal of Sport and Exercise Psychology,8(2), 170-188. Thelwell, R., Weston, N., & Greenlees, I. (2005). Defining and understanding mental toughness within soccer. Journal of Applied Sport Psychology, 17, 326-332. Timmons, J. A. (2011). Variability in training-induced skeletal muscle adaptation. Journal of Applied Physiology,110(3), 846-853. Ulucan, K. (2016). Brain-Derived Neurotrophic Factor and Exercise, Can It Be a New Biomarker for Athletic Performance? The Journal of Neurobehavioral Sciences,3(1), 44. Tsigilis, N. (2005). The influence of intrinsic motivation on an endurance field test. Journal of Sports Medicine and Physical Fitness, 45(2), 213-6.
234
Valdivieso, P., Vaughan, D., Laczko, E., Brogioli, M., Waldron, S., Rittweger, J., & Flück, M. (2017). The Metabolic Response of Skeletal Muscle to Endurance Exercise Is Modified by the ACE-I/D Gene Polymorphism and Training State. Frontiers in Physiology,8. Vanhove, A. J., Herian, M. N., Perez, A. L., Harms, P. D., & Lester, P. B. (2015). Can resilience be developed at work? A meta-analytic review of resilience-building programme effectiveness. Journal of Occupational and Organizational Psychology, 89(2), 278-307. Vaughan, R., Carter, G. L., Cockroft, D., & Maggiorini, L. (2018). Harder, better, faster, stronger? Mental toughness, the dark triad and physical activity. Personality and Individual Differences,131, 206-211. Vaughan, R., Hanna, D., & Breslin, G. (2018). Psychometric properties of the Mental Toughness Questionnaire 48 (MTQ48) in elite, amateur and nonathletes. Sport, Exercise, and Performance Psychology,7(2), 128-140. Vernillo, G., Millet, G. P., & Millet, G. Y. (2017). Does the Running Economy Really Increase after Ultra-Marathons? Frontiers in Physiology,8. Wan, Y., Chen, Y., Shi, X., & Zhou, C. (2018). Constructing and validating word similarity datasets by integrating methods from psychology, brain science and computational linguistics. Soft Computing, 22(21), 6967-6979. Wardenaar, F. C., Hoogervorst, D., Versteegen, J. J., Burg, N. V., Lambrechtse, K. J., & Bongers, C. C. (2018). Real-Time Observations of Food and Fluid Timing During a 120 km Ultramarathon. Frontiers in Nutrition, 5. Weger, U. W., & Loughnan, S. (2013). Mobilizing unused resources: Using the placebo concept to enhance cognitive performance. The Quarterly Journal of Experimental Psychology, 66(1), 23-28. Weinstein, N., & Ryan, R. M. (2011). A self-determination theory approach to understanding stress incursion and responses. Stress and Health, 27(1), 4-17. Willyard, C. (2018). New human gene tally reignites debate. Nature, 558(7710), 354-355. Wortley, G., & Islas, A. A. (2011). The problem with ultra-endurance athletes. British Journal of Sports Medicine,45(14), 1085-1085. Young, M. D., Plotnikoff, R. C., Collins, C. E., Callister, R., & Morgan, P. J. (2014). Social cognitive theory and physical activity: a systematic review and meta-analysis. Obesity Reviews, 15(12), 983-995. Zach, S., Xia, Y., Zeev, A., Arnon, M., Choresh, N., & Tenenbaum, G. (2017). Motivation dimensions for running a marathon: A new model emerging from the Motivation of Marathon Scale (MOMS). Journal of Sport and Health Science, 6(3), 302-310. Zaryski, C., & Smith, D. J. (2005). Training Principles and Issues for Ultra-endurance Athletes. Current Sports Medicine Reports, 4(3), 165-170.