PSSA Jeopardy Probability Combination Mean Circle Graphs Line Graphs $100 $200 $300 $400.
24
PSSA Jeopardy
-
Upload
dortha-day -
Category
Documents
-
view
221 -
download
3
Transcript of PSSA Jeopardy Probability Combination Mean Circle Graphs Line Graphs $100 $200 $300 $400.

PSSA Jeopardy
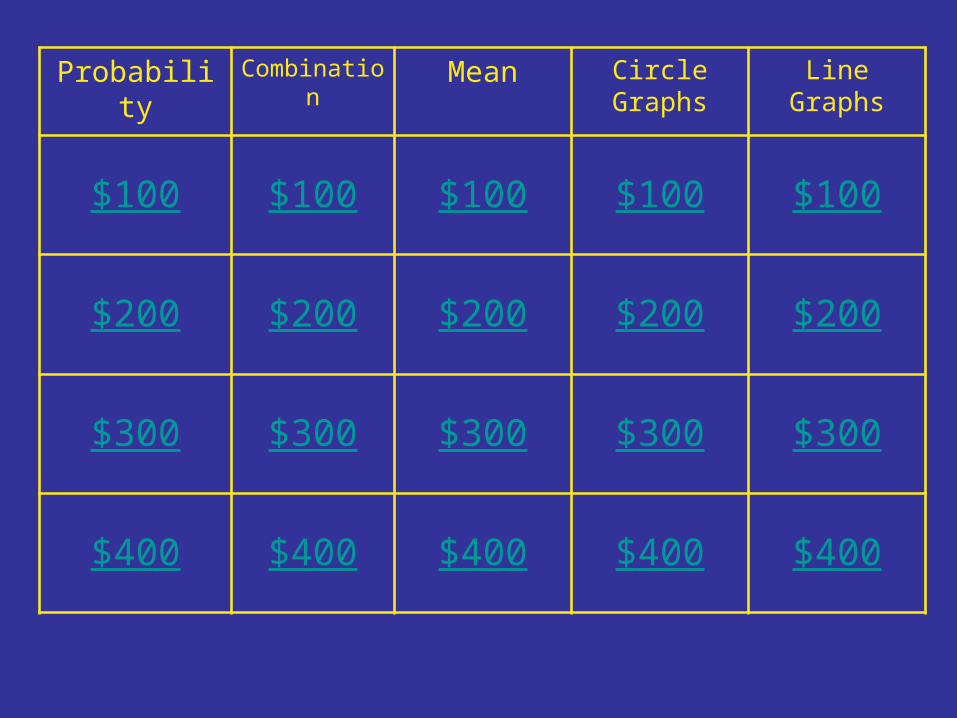
Probability Combination
Mean Circle Graphs
Line Graphs
$100 $100 $100 $100 $100
$200 $200 $200 $200 $200
$300 $300 $300 $300 $300
$400 $400 $400 $400 $400

Final Jeopardy
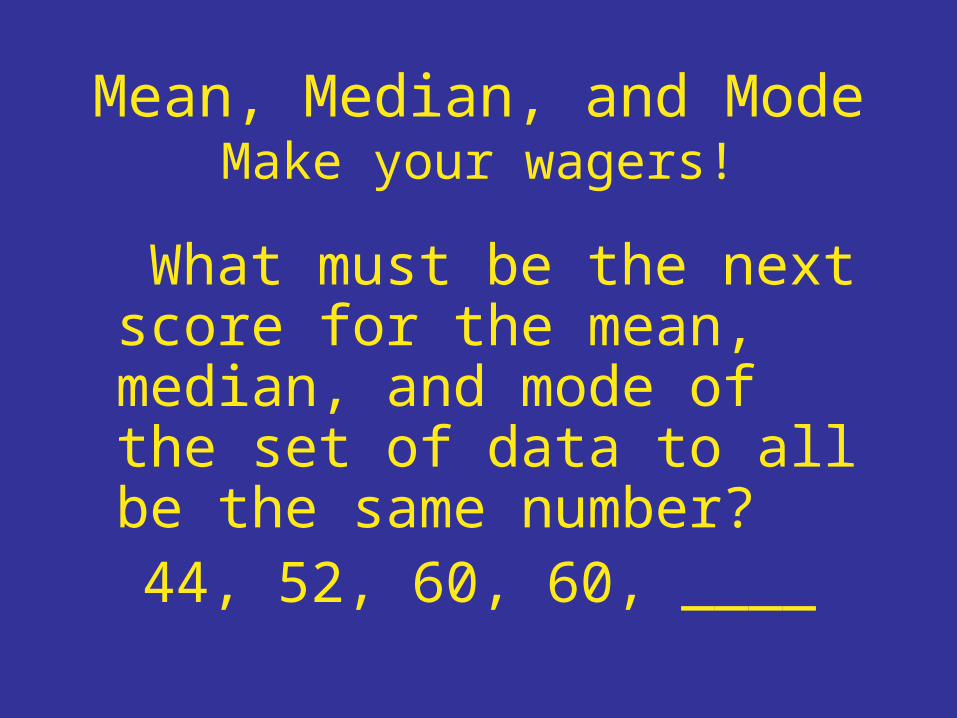
Mean, Median, and ModeMake your wagers!
What must be the next score for the mean, median, and mode of the set of data to all be the same number?
44, 52, 60, 60, ____
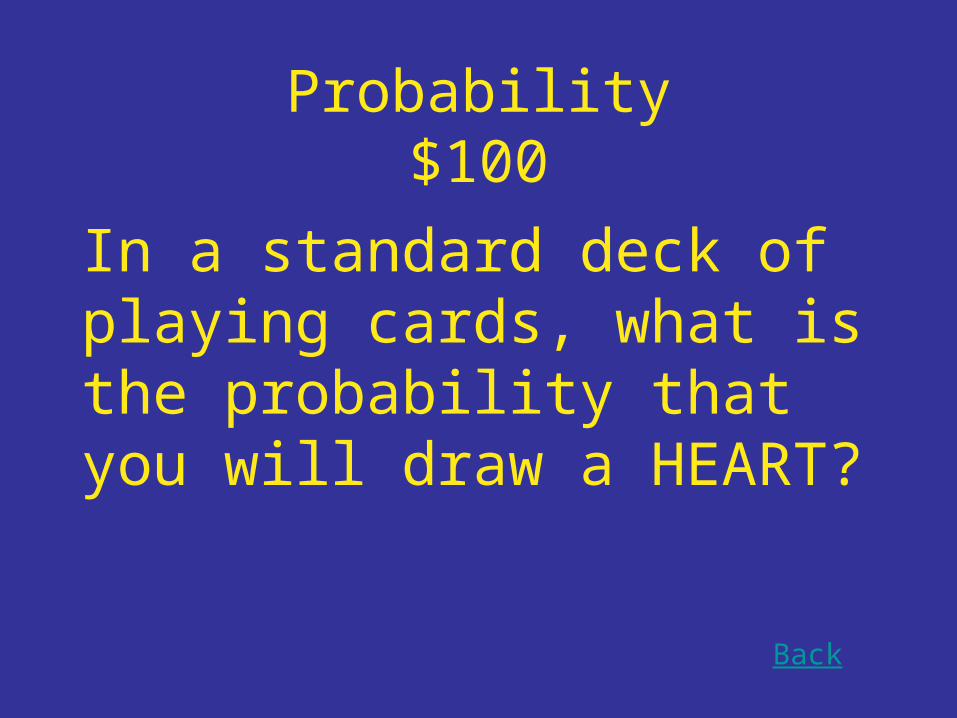
Probability$100
In a standard deck of playing cards, what is the probability that you will draw a HEART?
Back
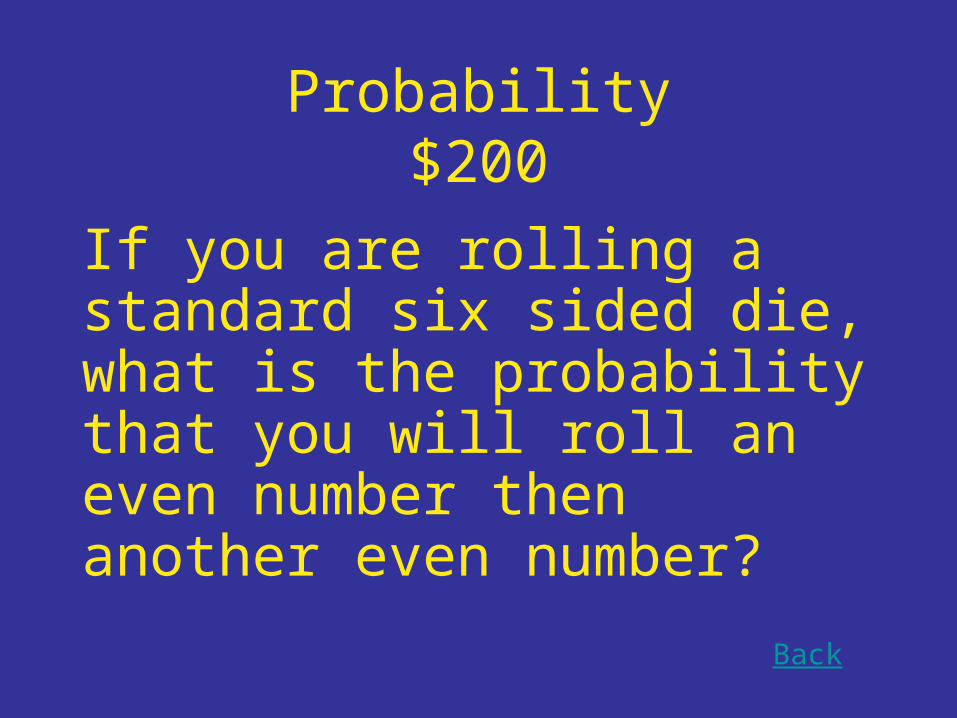
Probability$200
If you are rolling a standard six sided die, what is the probability that you will roll an even number then another even number?
Back
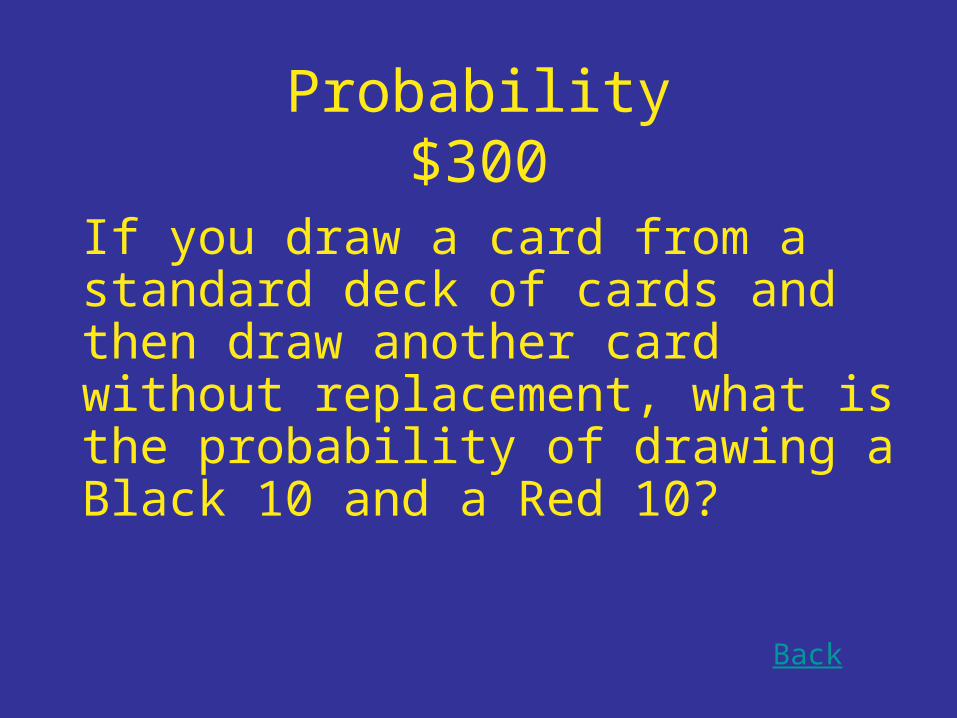
Probability$300
If you draw a card from a standard deck of cards and then draw another card without replacement, what is the probability of drawing a Black 10 and a Red 10?
Back
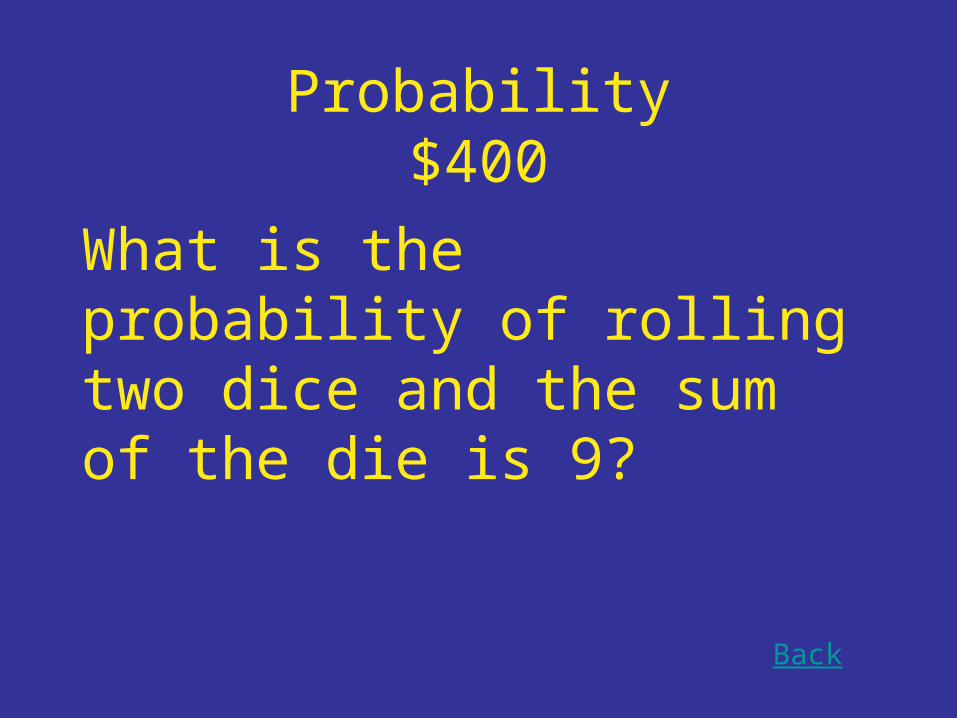
Probability$400
What is the probability of rolling two dice and the sum of the die is 9?
Back

Combinations$100
How many ways can I arrange the letters in the word BOAT?
Back

Combinations$200
A child has each letter of the alphabet cut out on pieces of paper. If he picks up an A on his first try and puts it back into the pile of letters, what is the probability that he picks an A on his next try?
Back
Combinations$300
A certain teacher has a wardrobe that consists of 5 pairs of pants, 9 shirts, and 6 ties. How many different outfits can he make from these articles of clothing if he needs to wear a pair of pants, a shirt, and a tie for each outfit?
Back

Combinations$400
Each student is going to get a new ID code that will consist of 3 different letters and then 2 different numbers (in that order). How many different ID codes can I make?
Back
Mean$100
Back
Find the mean of the following set of data.
93, 87, 90, 76, 100
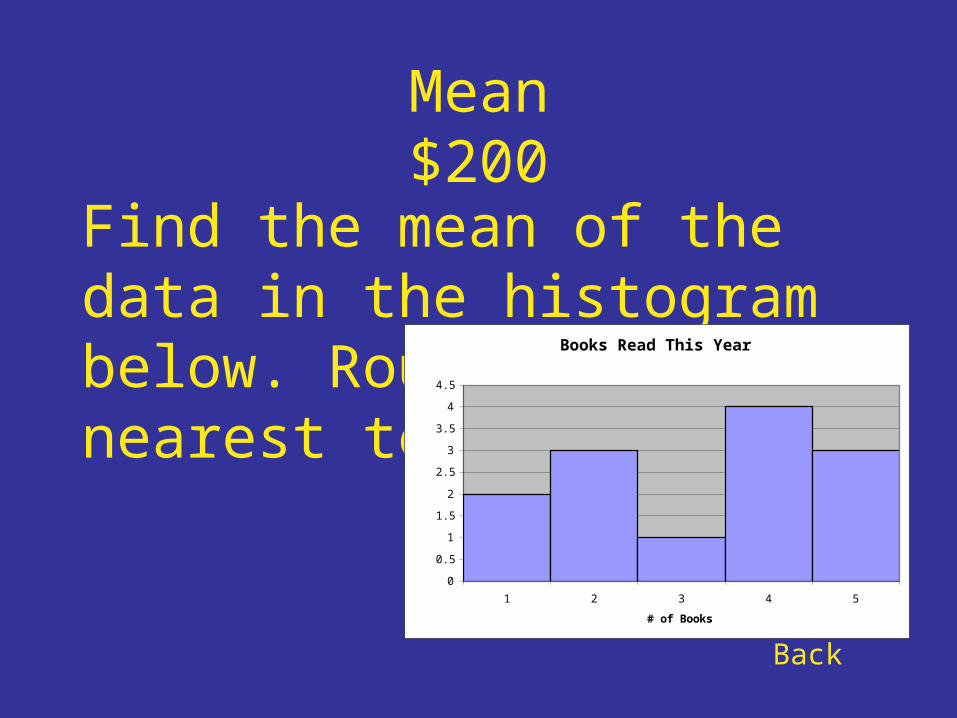
Mean$200
Find the mean of the data in the histogram below. Round to the nearest tenth.
Back
Books Read This Year
0
0.5
1
1.5
2
2.5
3
3.5
4
4.5
1 2 3 4 5
# of Books
Fre
qu
en
cy
Mean$300
Find the sum of 6 pieces of data whose mean is 35.
Back
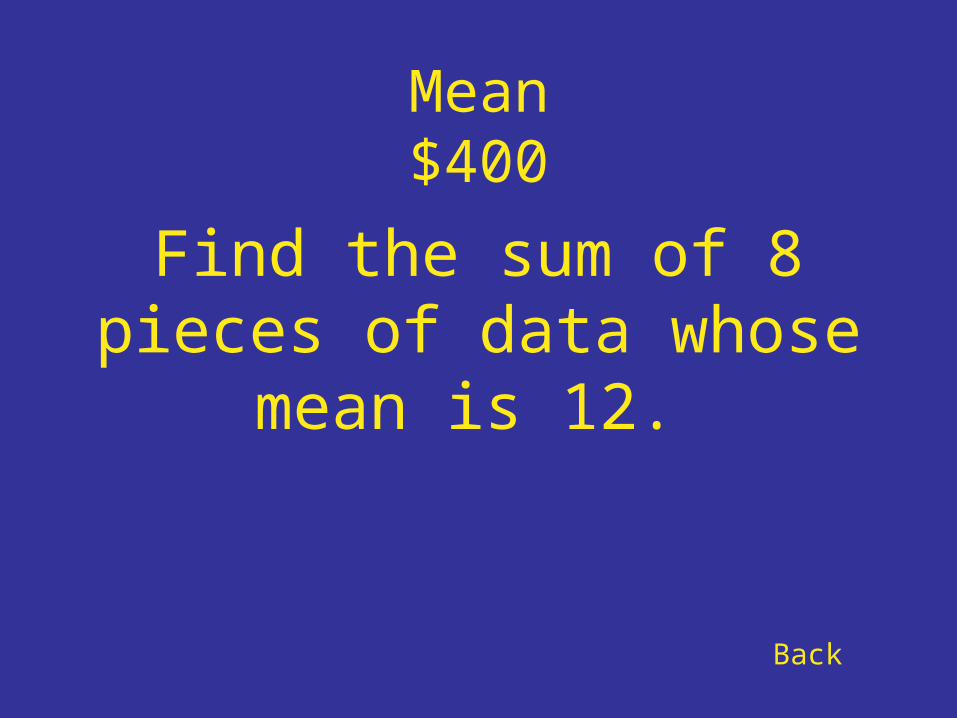
Mean$400
Find the sum of 8 pieces of data whose mean is 12.
Back

Circle Graphs$100
1200 Ridley students were surveyed and the results were put into a circle graph. Using these results, how many students said vanilla was their favorite ice cream flavor?
Back
Favorite Ice Cream Flavors
50%
25%
15%
5%5%
Vanilla
Chocolate
Strawberry
Cookie Dough
Other

Circle Graphs$200
1200 Ridley students were surveyed. How many said Cookie Dough was their favorite?
Back
Favorite Ice Cream Flavors
50%
25%
15%
5%5%
Vanilla
Chocolate
Strawberry
Cookie Dough
Other
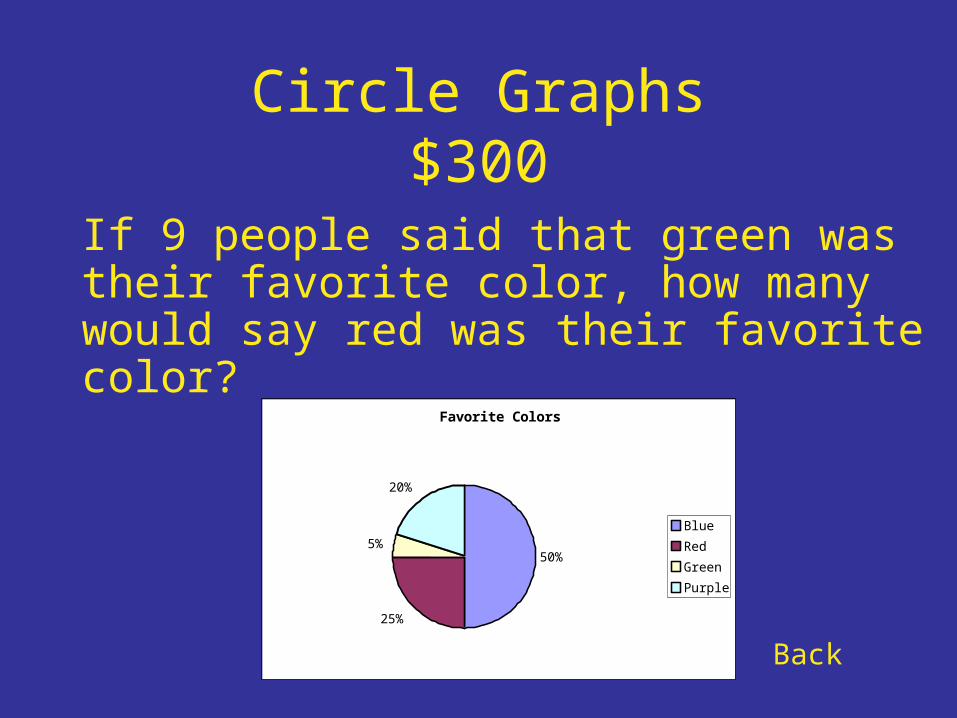
Circle Graphs$300
If 9 people said that green was their favorite color, how many would say red was their favorite color?
Back
Favorite Colors
50%
25%
5%
20%
Blue
Red
Green
Purple
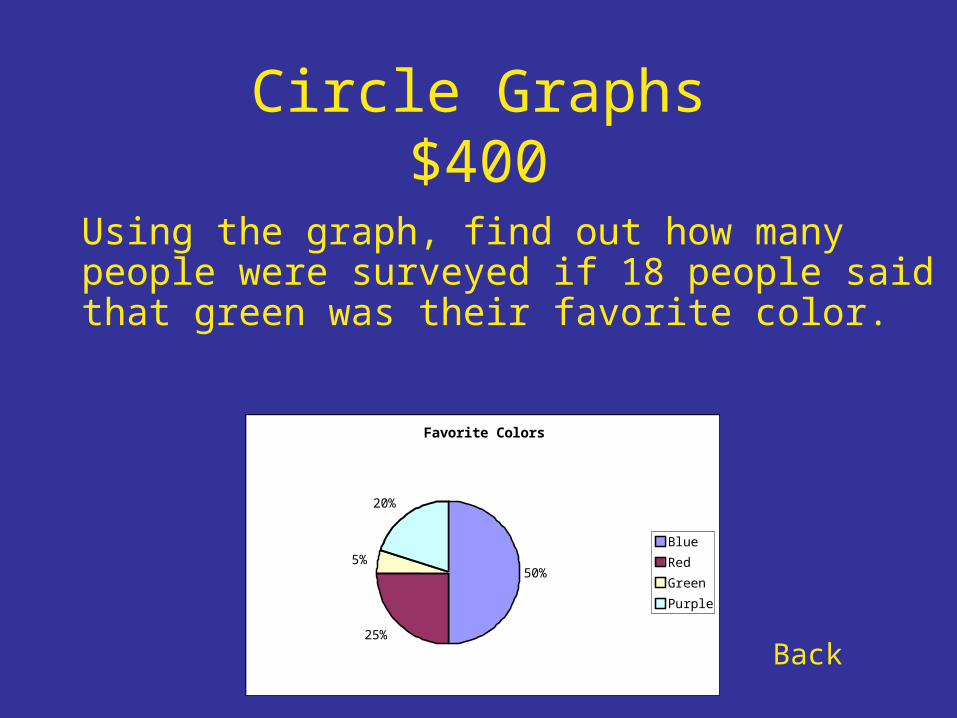
Circle Graphs$400
Using the graph, find out how many people were surveyed if 18 people said that green was their favorite color.
Back
Favorite Colors
50%
25%
5%
20%
Blue
Red
Green
Purple
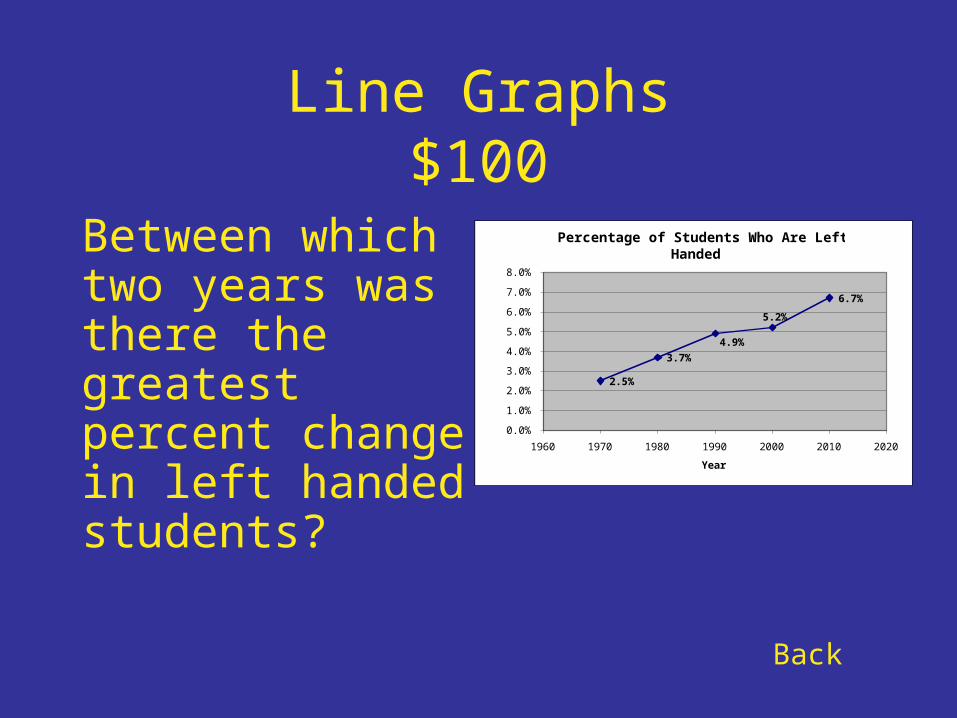
Line Graphs$100
Between which two years was there the greatest percent change in left handed students?
Back
Percentage of Students Who Are Left Handed
2.5%
3.7%
6.7%
5.2%
4.9%
0.0%
1.0%
2.0%
3.0%
4.0%
5.0%
6.0%
7.0%
8.0%
1960 1970 1980 1990 2000 2010 2020
Year
Perc
en
tag
e
Line Graphs$200
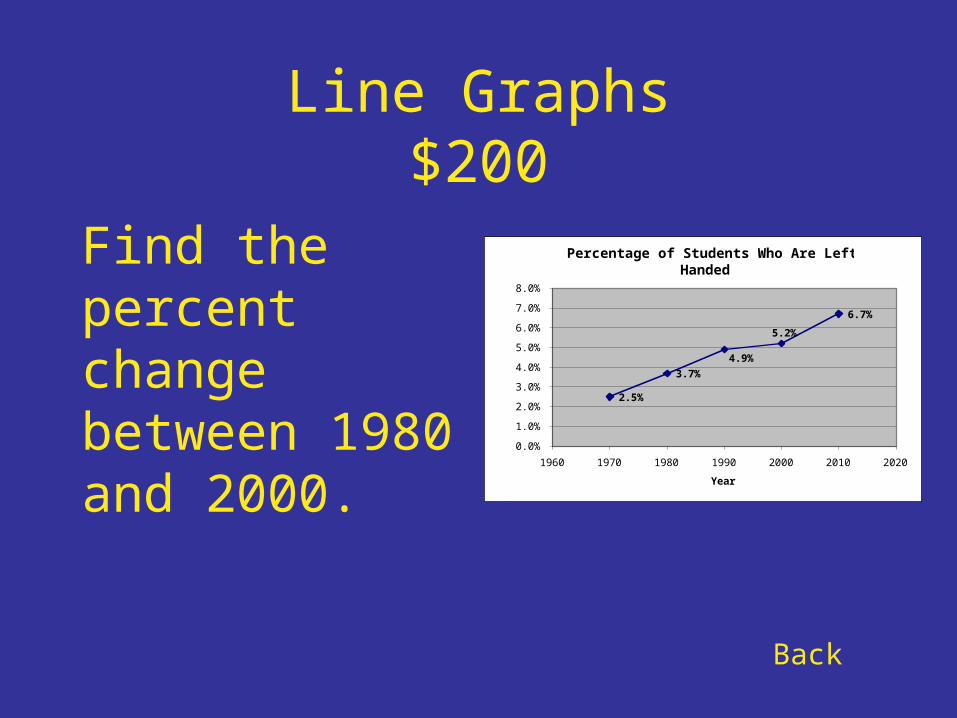
Find the percent change between 1980 and 2000.
Back
Percentage of Students Who Are Left Handed
2.5%
3.7%
6.7%
5.2%
4.9%
0.0%
1.0%
2.0%
3.0%
4.0%
5.0%
6.0%
7.0%
8.0%
1960 1970 1980 1990 2000 2010 2020
Year
Perc
en
tag
e
Line Graphs$300
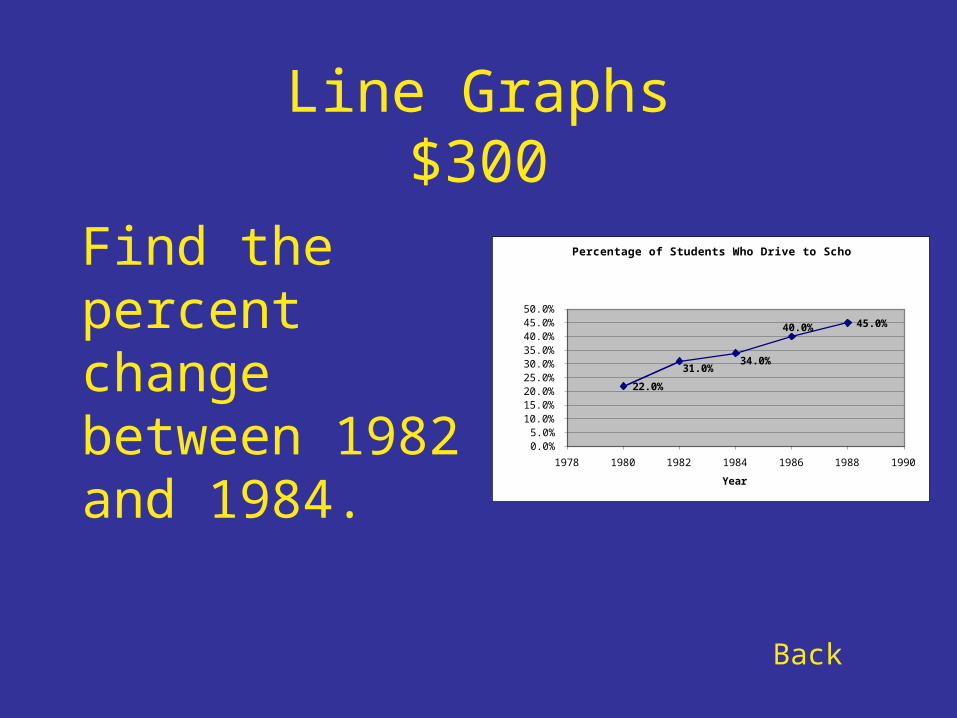
Find the percent change between 1982 and 1984.
Back
Percentage of Students Who Drive to School
22.0%
45.0%40.0%
34.0%31.0%
0.0%5.0%
10.0%15.0%20.0%25.0%30.0%35.0%40.0%45.0%50.0%
1978 1980 1982 1984 1986 1988 1990
Year
Perc
en
tag
e
Line Graphs$400
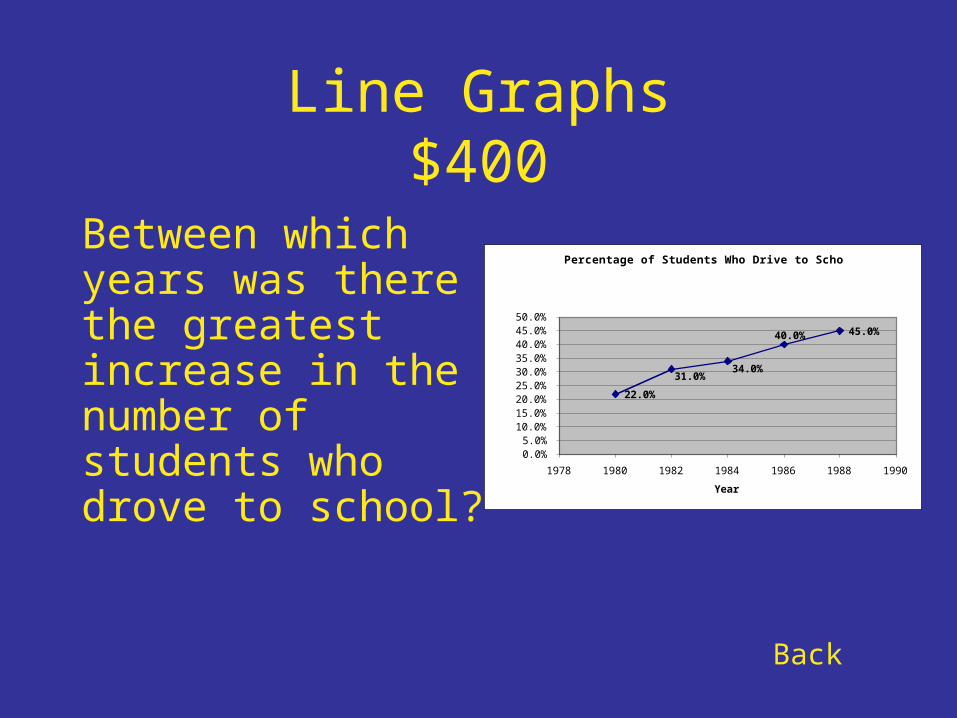
Between which years was there the greatest increase in the number of students who drove to school?
Back
Percentage of Students Who Drive to School
22.0%
45.0%40.0%
34.0%31.0%
0.0%5.0%
10.0%15.0%20.0%25.0%30.0%35.0%40.0%45.0%50.0%
1978 1980 1982 1984 1986 1988 1990
Year
Perc
en
tag
e