PSI Re-use in the Cultural Sector
43
-
Upload
epsi-platform -
Category
Documents
-
view
219 -
download
0
Transcript of PSI Re-use in the Cultural Sector

8/6/2019 PSI Re-use in the Cultural Sector
http://slidepdf.com/reader/full/psi-re-use-in-the-cultural-sector 1/43
8/6/2019 PSI Re-use in the Cultural Sector
http://slidepdf.com/reader/full/psi-re-use-in-the-cultural-sector 2/43
Version Date Description of Revision
0.1 5 April 2011 Draft for internal use based on draft report CC462D010-0.1
0.2 11 April 2011 Revised draft for internal use
0.3 14 April 2011 Revised draft with review comments
0.4 15 April 2011 Final draft
1.0 21 April 2011 Release version
1.1 10 May 2011 Final version including feedback from Commission
Disclaimer
The opinions expressed in this study are those of the authors and do not necessarily reflect the views of the European Commission.

8/6/2019 PSI Re-use in the Cultural Sector
http://slidepdf.com/reader/full/psi-re-use-in-the-cultural-sector 3/43
CC462D011-1.1 1
1 Curtis+Cartwright Consulting Limited (with Ithaka S+R and the Collections Trust) was engaged bythe European Commission, under a contract dated 10 December 2010, to investigate the extent,
type, and financial significance of re-use of Public Sector Information (PSI) by cultural institutionsin Europe. This is an input to a review of directive 2003/98/EC.
2 The objectives of the study were to:
– estimate the importance of re-use in terms of revenues for cultural institutions;
– estimate trends in the development of the re-use market for cultural material.
3 This is the final report, setting out the findings from the study.
Methodology
4 Initially, six member states were selected for investigation to ensure a range of views: France,
Hungary, The Netherlands, Romania, Sweden and The United Kingdom. From each country, arange of cultural institutions was invited to take part. These institutions received a surveyinstrument in two parts: an introductory survey addressed to the institution’s director, which was
then followed up with a detailed survey addressed to an individual nominated by the director. Togain a broader range of views, surveys were also distributed to an additional group of cultural
institutions (both within the original six countries, and in other countries in the European Union).
5 Responses were analysed to provide specific information meeting the objectives of this study.The small size of the sample population, combined with the great diversity of the cultural sector
in Europe precludes broad generalisation, so applying statistical approaches would be unhelpful
in understanding the data generated. The analysis has therefore focused on understanding thepatterns of re-use from a qualitative perspective, rather than coming to overall values or
estimates of the size of the re-use market across Europe.
6 This approach has proven effective for developing an understanding of the range of activitiesundertaken by cultural institutions, and in identifying the financial importance of re-use.
Current importance of re-use
7 Very few institutions are dependent on the income1 they receive from re-use to enable them to
undertake their public task. However, the income that they receive from re-use is in many casesessential to enable future re-use and development of services.
8 The approach that institutions have taken appears to depend on a very wide range of intrinsic
and extrinsic factors – from the strategy of the state they are located in, through the nature of the collections, right down to the personalities of the people involved at an institution. It isimportant to bear in mind that a sample of this size cannot be representative of such a diverse
community. These results should not be seen as statistically representative or significant; rather,they provide a first empirical view of possible trends and practices concerning re-use of cultural
materials in several European Union member states.
1Within this document, “income” refers to gross income/revenue, unless otherwise qualified.
8/6/2019 PSI Re-use in the Cultural Sector
http://slidepdf.com/reader/full/psi-re-use-in-the-cultural-sector 4/43
2 CC462D011-1.1
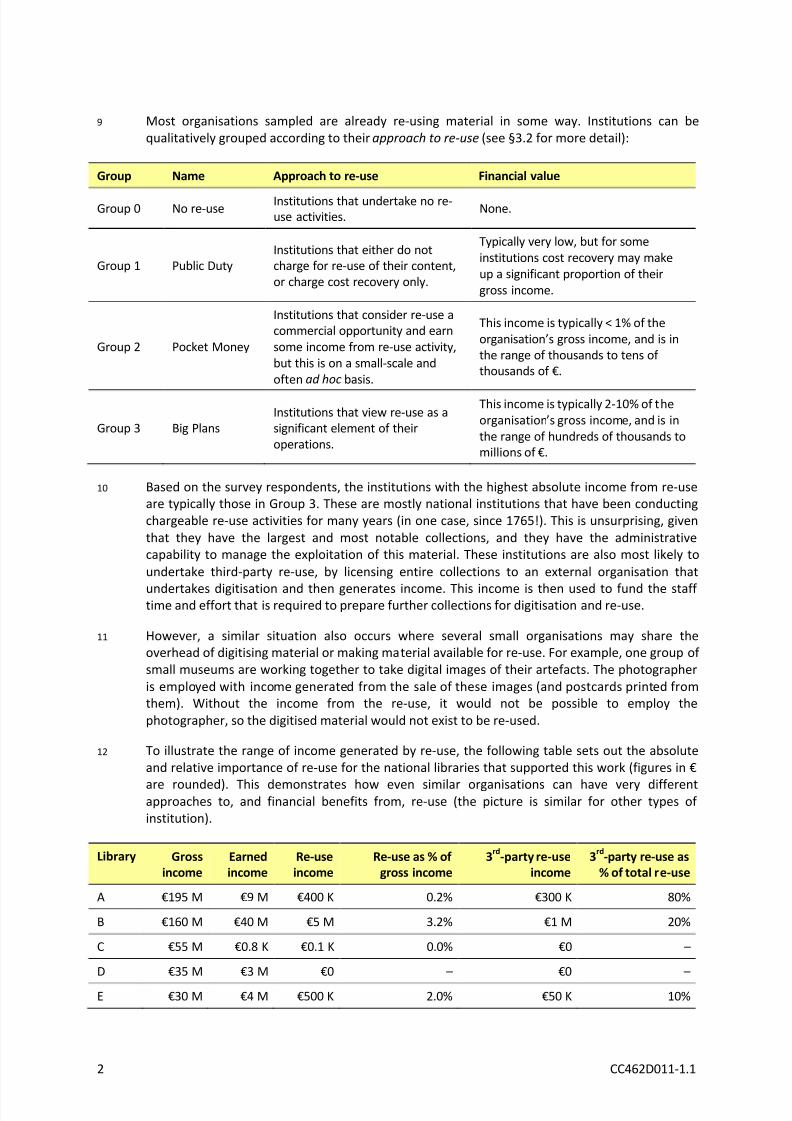
9 Most organisations sampled are already re-using material in some way. Institutions can bequalitatively grouped according to their approach to re-use (see §3.2 for more detail):
Group Name Approach to re-use Financial value
Group 0 No re-use Institutions that undertake no re-use activities.
None.
Group 1 Public DutyInstitutions that either do notcharge for re-use of their content,or charge cost recovery only.
Typically very low, but for someinstitutions cost recovery may makeup a significant proportion of theirgross income.
Group 2 Pocket Money
Institutions that consider re-use acommercial opportunity and earnsome income from re-use activity,but this is on a small-scale andoften ad hoc basis.
This income is typically < 1% of theorganisation’s gross income, and is inthe range of thousands to tens of thousands of €.
Group 3 Big PlansInstitutions that view re-use as asignificant element of theiroperations.
This income is typically 2-10% of theorganisation’s gross income, and is inthe range of hundreds of thousands tomillions of €.
10 Based on the survey respondents, the institutions with the highest absolute income from re-useare typically those in Group 3. These are mostly national institutions that have been conductingchargeable re-use activities for many years (in one case, since 1765!). This is unsurprising, given
that they have the largest and most notable collections, and they have the administrativecapability to manage the exploitation of this material. These institutions are also most likely to
undertake third-party re-use, by licensing entire collections to an external organisation that
undertakes digitisation and then generates income. This income is then used to fund the staff time and effort that is required to prepare further collections for digitisation and re-use.
11 However, a similar situation also occurs where several small organisations may share theoverhead of digitising material or making material available for re-use. For example, one group of small museums are working together to take digital images of their artefacts. The photographer
is employed with income generated from the sale of these images (and postcards printed fromthem). Without the income from the re-use, it would not be possible to employ the
photographer, so the digitised material would not exist to be re-used.
12 To illustrate the range of income generated by re-use, the following table sets out the absoluteand relative importance of re-use for the national libraries that supported this work (figures in €
are rounded). This demonstrates how even similar organisations can have very differentapproaches to, and financial benefits from, re-use (the picture is similar for other types of institution).
Library Gross
income
Earned
income
Re-use
income
Re-use as % of
gross income
3rd
-party re-use
income
3rd
-party re-use as
% of total re-use
A €195 M €9 M €400 K 0.2% €300 K 80%
B €160 M €40 M €5 M 3.2% €1 M 20%
C €55 M €0.8 K €0.1 K 0.0% €0 –
D €35 M €3 M €0 – €0 –
E €30 M €4 M €500 K 2.0% €50 K 10%

8/6/2019 PSI Re-use in the Cultural Sector
http://slidepdf.com/reader/full/psi-re-use-in-the-cultural-sector 5/43
CC462D011-1.1 3
13 The institution (in the overall sample) with the highest income from re-use generated ~€10 M in2009, representing 7.1% of total income. The institution with the highest proportion of incomefrom re-use generated ~€6 M, representing 11.1% of total income.
Trends in re-use
14 Of the organisations reporting financial data for this report, between 2005 and 2009 some
showed growth in revenue from re-use activities, while others showed a decline. As a proportionof overall income, however, re-use remained approximately level (<1% change) for all of thoseinstitutions that reported to us.
15 Many respondents stressed that they were trying to balance their public task of disseminatinginformation with their requirement to generate income to fund future development of services.As expected, many new projects have been started since 2005, and many more are currently
being planned. Many of these are not yet generating income and, indeed, many are not intendedto generate income. It is clear, however, that institutions are actively seeking out opportunities
to re-use their content regardless of whether they are intending to generate income from this re-use.
16 Many respondents expressed in qualitative sections of the survey a sense that digitisation of content was synonymous with enabling re-use. Respondents have generally expressed the view
that material must be digitised to reach as wide an audience as possible. Nonetheless, there aregood examples of “analogue” re-use, such as reproduction fees, selling prints, catalogues etc.
17 There was a general view that the cost and effort of digitisation was the major factor limiting re-use of their material. Depending on the capability and nature of the organisation, this typicallyeither has prevented the re-use of the material, or has led to third-party re-use.
18 Although not an emerging type of re-use, a range of respondents expressed their current plans asto do “more of the same” – digitise more collections and more types of collections.
Compatibility with PSI directive
19 At this time, cultural institutions are not required to meet the terms of directive 2003/98/EC, and
are correspondingly unlikely to have structured their processes around meeting its specificrequirements. As such, in consultation with the Commission, we have selected indicators listed
below that describe conformance with the principles of the directive rather than the detailedobligations.
20 Cultural institutions hold a very wide variety of materials, and operate within very different
regulatory and cultural environments and their approaches to these aspects are similarly diverse.
Discoverability
21 Cataloguing and discoverability of material is an established challenge for the cultural sector. Allinstitutions recognise that it is beneficial (and in fact necessary) for potential users and re-users
to identify appropriate resources. Most respondents have physical catalogues or staff thatpatrons can approach to find holdings, but a smaller number of respondent institutions are ableto make a majority of their holdings findable through electronic catalogues or an institutional
website.
22 In some cases, discoverability of resources is restricted by an organisation’s income-generating
activities. For example, in libraries, the metadata for their holdings is a tool for discoverability,but for some national libraries, this metadata is itself a product that they sell. A library that sells

8/6/2019 PSI Re-use in the Cultural Sector
http://slidepdf.com/reader/full/psi-re-use-in-the-cultural-sector 6/43
4 CC462D011-1.1
its metadata by definition places greater restrictions on how that metadata is released and used;
the re-users may provide new routes to the library’s content, but they may not – it dependsgreatly on the uses that the metadata is put to.
Availability
23 The IPR status of holdings provides a challenge that can limit the availability of collections for re-
use. In addition to the IP presenting a barrier to re-use, some organisations who providedqualitative input to this study are deeply concerned about the administrative overhead in
managing requests for re-use that require rights clearance activities.
Charging
24 The approaches that cultural institutions take to charging vary, often driven by mission. Forexample, two national libraries charge for re-use of their bibliographic metadata, whereas
another two do not.
25 Those institutions that hold material with well-developed commercial markets – such as imagesand archives of use in genealogy – are correspondingly more likely to adopt commercial pricingmodels.
Licensing
26 Many respondents appear to have carefully considered the type of exclusivity in licences they
offer, and are able to justify their choices. Exclusivity is concentrated in the larger organisations,which also have the skill and administrative resource to manage the negotiations and
administration required to establish such relationships.
Process
27 Most organisations in this study report that they respond to requests for re-use in a timelymanner. Further discussion with some of the respondents highlighted that although day-to-day
re-use requests could be met within 20 days, more complex types of re-use such as developingnew services, negotiating with delivery partners, etc, often took much longer. Some organisations
initiated the process of re-use by tendering a contract, which was then subject to EUprocurement processes and the associated timelines.
Views and concerns
28 The collection of attitudinal data was not a principal aim of this project. However, we gaverespondents the opportunity to share their views and concerns, and some common issues were
identified.
Poor understanding of the PSI directive
29 Many respondents were not familiar with the directive 2003/98/EC, which is understandablegiven that it does not currently apply to them. There is significant confusion regarding the
implications of a loss of their current exemption.
Applicability of the PSI directive to the cultural sector
30 Several respondents noted that the PSI directive, as currently drafted, would be difficult to applyto the cultural sector, due to definitions used within the directive, and the greater maturity of
markets for cultural material compared to other PSI.

8/6/2019 PSI Re-use in the Cultural Sector
http://slidepdf.com/reader/full/psi-re-use-in-the-cultural-sector 7/43
CC462D011-1.1 5
Concern about reduction of income
31 Given the current financial climate in particular, many respondents were deeply concerned about
the potential impact on their income that inclusion within the directive would cause.
Concern over administrative overhead
32 A range of institutions of all sizes expressed concerns regarding the administrative burden thatinclusion within the directive would bring. These concerns particularly related to the effort
required to clear Intellectual Property Rights, the effort required to negotiate complex third-party re-uses, and a concern about receiving a large number of requests from members of the
public.

8/6/2019 PSI Re-use in the Cultural Sector
http://slidepdf.com/reader/full/psi-re-use-in-the-cultural-sector 8/43
6 CC462D011-1.1
Executive summary 1
List of contents 6
1 Introduction 7
1.1 General 7
1.2 Objectives 7
1.3 Timeline 7
1.4 Background 7
1.5 Approach 8
1.6 Overview of this document 8
2 Methodology 9
2.1 Sample selection 9 2.2 Data collection 10
2.3 Analysis 10
3 Findings 12
3.1 Introduction 12
3.2 Current importance of re-use 14
3.3 Trends in re-use 17
3.4 Compatibility with the PSI directive 22
3.5 Questions raised during this study 26
4 Case studies 28
4.1 Introduction 28 4.2 Audiovisual licensing 28
4.3 Access to archives for genealogy etc 29
4.4 Mobile content/apps 30
4.5 Printing postcards 31
4.6 Reproduction fees 31
5 Views and concerns 33
5.1 Introduction 33
5.2 Poor understanding of the PSI directive 33
5.3 Applicability of the PSI directive to the cultural sector 33
5.4 Concern about reduction of income 33 5.5 Concern over administrative overhead 34
A Sample statistics 35
A.1 Introduction 35
A.2 Part 1 35
A.3 Part 2 37

8/6/2019 PSI Re-use in the Cultural Sector
http://slidepdf.com/reader/full/psi-re-use-in-the-cultural-sector 9/43
CC462D011-1.1 7
1
1.1 General
1.1.1 Curtis+Cartwright Consulting Limited (with Ithaka S+R and the Collections Trust) has beenengaged by the European Commission, under a contract dated 10 December 2010, to investigatethe extent, type, and financial significance of re-use of Public Sector Information (PSI) by cultural
institutions in Europe. The opinions expressed in this study are those of the authors and do notnecessarily reflect the views of the European Commission.
1.1.2 This document presents findings from that study. This version of the document (1.1) is the final,release version.
1.2 Objectives
1.2.1 The objectives of the study are to:
– Estimate the importance of re-use in terms of revenues for cultural institutions;
– Estimate trends in the development of the re-use market for cultural material.
1.3 Timeline
1.3.1 The project began in December 2010. Information gathering has been conducted between
February and March 2011.
1.4 Background
European legislation for re-use of PSI
1.4.1 Public sector information (PSI) is the single largest source of information in Europe.2 In November2003, Directive 2003/98/EEC on the re-use of public sector information was adopted with the
aim to establish an internal market to fully unlock the economic potential of PSI and removebarriers such as discriminatory practices, monopoly markets and a lack of transparency. All 27 EU
Member States have implemented the PSI Directive into their national legal orders. Article 1(2)(f)excludes documents3 held by cultural establishments from the scope of this Directive.
The need for an evidence base
1.4.2 In 2009, the Commission reviewed the way in which EU PSI rules were being applied, which
confirmed that PSI re-use has been on the rise but also that to realise the full potential of PSI forthe EU economy, EU Member States must remove remaining barriers to re-use. The Commission
announced on 7 July 2010 that a second review of Directive 2003/98/EC would shortlycommence with a public consultation,4 and will consider legislative amendments. It has beenlabelled as one of the key actions of the “Digital Agenda for Europe”.
2
See <http://ec.europa.eu/information_society/policy/psi/index_en.htm >, accessed on 11 October 2010.3
The directive uses the term document for all materials held or created.4
See <http://ec.europa.eu/yourvoice/ipm/forms/dispatch?form=psidirective2010 >, accessed on 13 October 2010.

8/6/2019 PSI Re-use in the Cultural Sector
http://slidepdf.com/reader/full/psi-re-use-in-the-cultural-sector 10/43
8 CC462D011-1.1
1.4.3 Some evidence is available relating to re-use in the cultural sector but these studies are eitheroutdated or not focused enough for this review, and the statistical frameworks used at Europeanand national levels are not tailored for the cultural sector.5 A new evidence base is now required
to understand the importance of re-use to the budgets of cultural institutions.
1.5 Approach
Information gathering
1.5.1 At the request of the European Commission, six member states were selected for investigation,to ensure a range of views: France, Hungary, The Netherlands, Romania, Sweden and The United
Kingdom. From each country, a range of cultural institutions was invited to take part. Theseinstitutions received a survey instrument in two parts: an introductory survey addressed to the
institution’s director, which was then followed up with a detailed survey addressed to anindividual they nominated. The surveys were also distributed to an additional group of cultural
institutions (both within the original six countries, and in other countries in the European Union).
1.5.2 Further details of the study methodology are provided at Section 2.
Analysis
1.5.3 Responses were analysed to provide specific information to meet the objectives of this study.
The small size of the sample population, combined with the great diversity of the cultural sectorin Europe precludes broad generalisation, so applying statistical approaches would be unhelpful
in understanding the data generated. The analysis is therefore focused on understanding thepatterns of re-use, rather than coming to overall values or estimates of the size of the re-use
market across Europe. A selection of brief case studies were generated to illustrate somecommon and novel approaches to re-use.
Reporting
1.5.4 This document is the final report for the project.
1.6 Overview of this document
1.6.1 The rest of this report is set out as follows:
– Section 2 describes the methodology in detail;
– Section 3 sets out the key findings of the project;
– Section 4 describes a set of case studies of re-use activities;
– Section 5 presents the views and concerns of survey respondents as expressed in the surveyand through interviews.
5For example <http://ec.europa.eu/culture/key-documents/doc873_en.htm > and <http://ec.europa.eu/culture/key-
documents/doc975_en.htm > accessed on 14 April 2011.

8/6/2019 PSI Re-use in the Cultural Sector
http://slidepdf.com/reader/full/psi-re-use-in-the-cultural-sector 11/43
CC462D011-1.1 9
2
2.1 Sample selection
2.1.1 The Commission requested that we select exemplar cultural institutions from “6 Member States,4 big and 2 small”. To achieve this, we ranked the European Union Member States by GDP per
capita and identified 6 which satisfy these criteria:
– France (Large);
– Hungary (Small);
– The Netherlands (Large);
– Romania (Small);
– Sweden (Large);
– The United Kingdom (Large).
2.1.2 The Commission requested that the study should address a total of 25 large and 25 small culturalinstitutions. To ensure coverage across the full spectrum of institutions, and a viable rate of return, we proposed an initial target list of 120 institutions. To ensure good coverage within each
country studied of different types of institutions, sizes and governance models, we applied theselection framework in the following table.
Class DefinitionNumber
invited
Pre-eminent Very large institutions with internationally significant collections. 18
Large
Large institutions with important collections.
Where appropriate/relevant, factor in a spread of cultural institutions acrossdifferent types/governance (ie independent, publicly funded, museum, library,archive or other)
42
SmallSmaller cultural institutions, which may serve a local area, or a niche market.Collections may have local significance, or broader significance to a smallergroup of users.
60
Total cultural institutions 120
Table 2-1: selection framework for invited institutions
2.1.3 The categorisation of institutions into pre-eminent, large and small classes is qualitative, anddrawn from the experience of the project team and our contacts in each country.
2.1.4 In addition to these invited institutions, we promoted the study at a range of events in which theproject team were involved. This has resulted in a few responses from institutions that were not
invited, and from countries that were not included: Austria, Belgium, Estonia, Germany andLithuania. These responses are included within the analysed data, as we believe that they addfurther detail to the range of re-use undertaken.
8/6/2019 PSI Re-use in the Cultural Sector
http://slidepdf.com/reader/full/psi-re-use-in-the-cultural-sector 12/43
10 CC462D011-1.1
2.2 Data collection
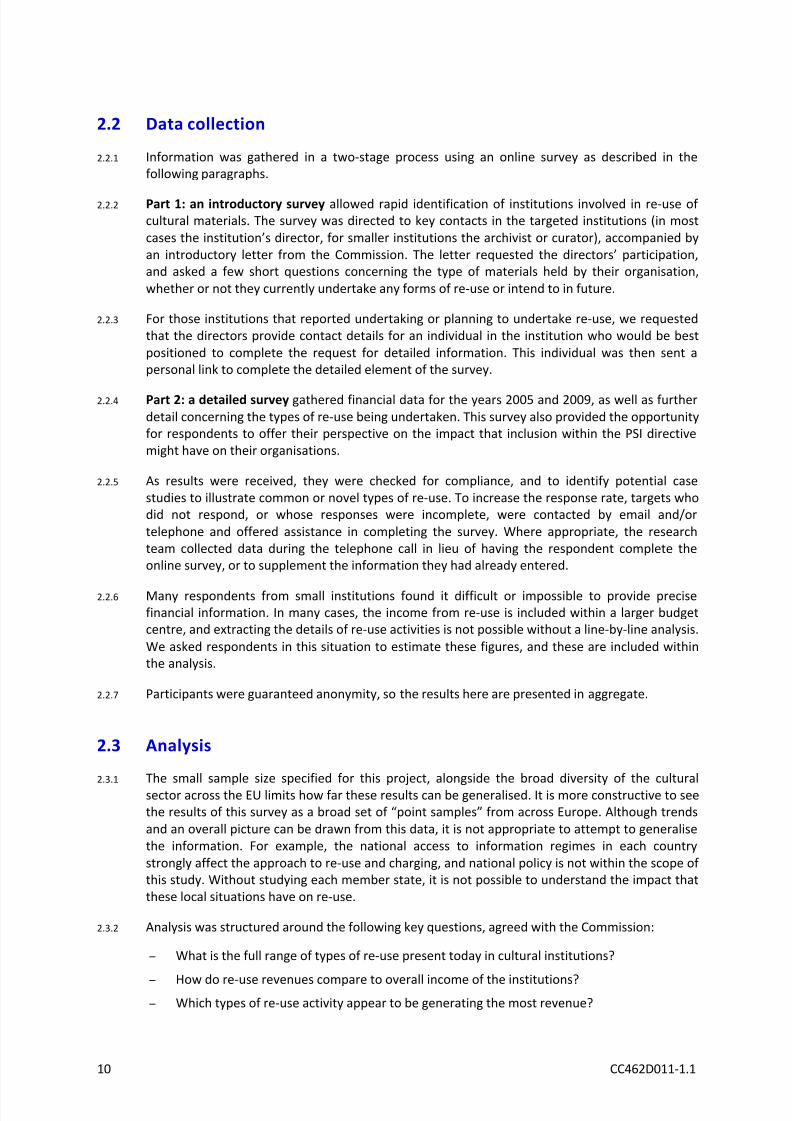
2.2.1 Information was gathered in a two-stage process using an online survey as described in thefollowing paragraphs.
2.2.2 Part 1: an introductory survey allowed rapid identification of institutions involved in re-use of cultural materials. The survey was directed to key contacts in the targeted institutions (in most
cases the institution’s director, for smaller institutions the archivist or curator), accompanied byan introductory letter from the Commission. The letter requested the directors’ participation,and asked a few short questions concerning the type of materials held by their organisation,
whether or not they currently undertake any forms of re-use or intend to in future.
2.2.3 For those institutions that reported undertaking or planning to undertake re-use, we requestedthat the directors provide contact details for an individual in the institution who would be best
positioned to complete the request for detailed information. This individual was then sent apersonal link to complete the detailed element of the survey.
2.2.4 Part 2: a detailed survey gathered financial data for the years 2005 and 2009, as well as further
detail concerning the types of re-use being undertaken. This survey also provided the opportunityfor respondents to offer their perspective on the impact that inclusion within the PSI directivemight have on their organisations.
2.2.5 As results were received, they were checked for compliance, and to identify potential casestudies to illustrate common or novel types of re-use. To increase the response rate, targets whodid not respond, or whose responses were incomplete, were contacted by email and/or
telephone and offered assistance in completing the survey. Where appropriate, the researchteam collected data during the telephone call in lieu of having the respondent complete theonline survey, or to supplement the information they had already entered.
2.2.6 Many respondents from small institutions found it difficult or impossible to provide precisefinancial information. In many cases, the income from re-use is included within a larger budgetcentre, and extracting the details of re-use activities is not possible without a line-by-line analysis.
We asked respondents in this situation to estimate these figures, and these are included withinthe analysis.
2.2.7 Participants were guaranteed anonymity, so the results here are presented in aggregate.
2.3 Analysis
2.3.1 The small sample size specified for this project, alongside the broad diversity of the culturalsector across the EU limits how far these results can be generalised. It is more constructive to seethe results of this survey as a broad set of “point samples” from across Europe. Although trends
and an overall picture can be drawn from this data, it is not appropriate to attempt to generalisethe information. For example, the national access to information regimes in each country
strongly affect the approach to re-use and charging, and national policy is not within the scope of this study. Without studying each member state, it is not possible to understand the impact thatthese local situations have on re-use.
2.3.2 Analysis was structured around the following key questions, agreed with the Commission:
– What is the full range of types of re-use present today in cultural institutions?
– How do re-use revenues compare to overall income of the institutions? – Which types of re-use activity appear to be generating the most revenue?
8/6/2019 PSI Re-use in the Cultural Sector
http://slidepdf.com/reader/full/psi-re-use-in-the-cultural-sector 13/43
CC462D011-1.1 11
– Which are most commonly attempted?
– Which have shown the most growth over the interval studied?
– Which are relatively recent entrants, and should be watched for future growth?
–
Which activities are undertaken by the institution, and which revenues are derived fromthird-party uses?
– Which metrics appropriately reflect re-use across Europe?
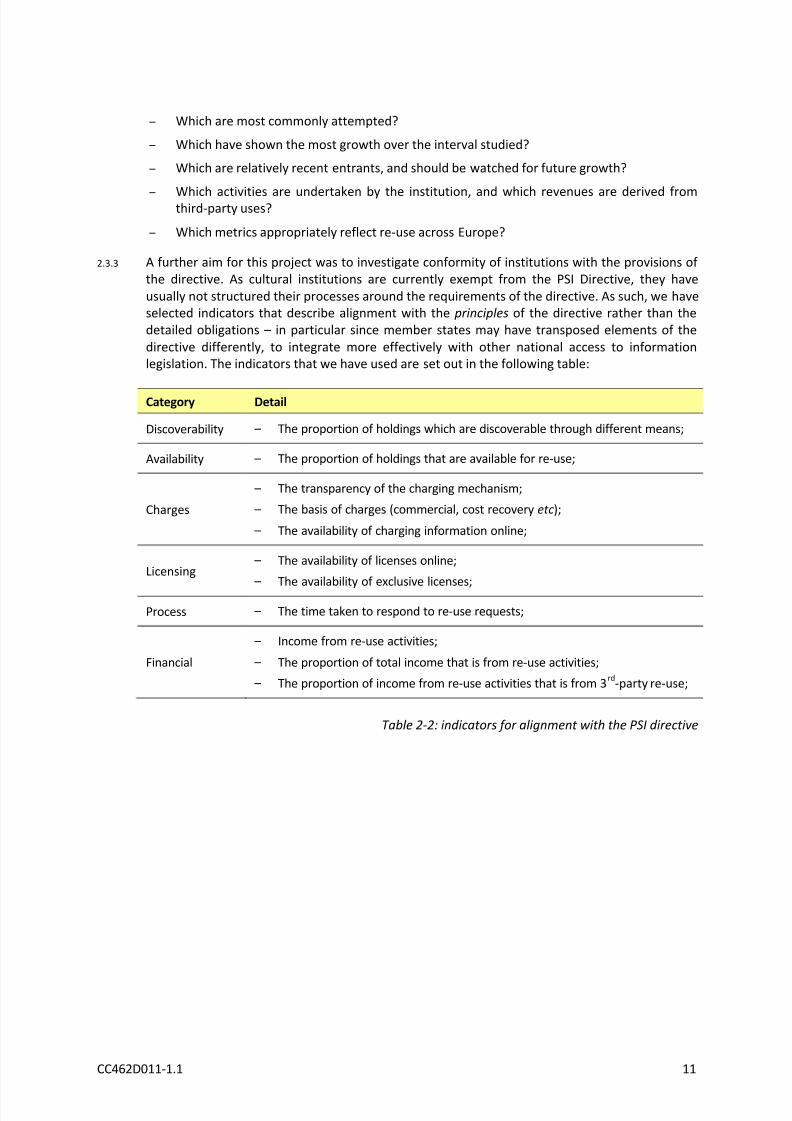
2.3.3 A further aim for this project was to investigate conformity of institutions with the provisions of the directive. As cultural institutions are currently exempt from the PSI Directive, they have
usually not structured their processes around the requirements of the directive. As such, we haveselected indicators that describe alignment with the principles of the directive rather than thedetailed obligations – in particular since member states may have transposed elements of the
directive differently, to integrate more effectively with other national access to informationlegislation. The indicators that we have used are set out in the following table:
Category Detail
Discoverability – The proportion of holdings which are discoverable through different means;
Availability – The proportion of holdings that are available for re-use;
Charges
– The transparency of the charging mechanism;
– The basis of charges (commercial, cost recovery etc);
– The availability of charging information online;
Licensing – The availability of licenses online;
– The availability of exclusive licenses;
Process – The time taken to respond to re-use requests;
Financial
– Income from re-use activities;
– The proportion of total income that is from re-use activities;
– The proportion of income from re-use activities that is from 3rd
-party re-use;
Table 2-2: indicators for alignment with the PSI directive
8/6/2019 PSI Re-use in the Cultural Sector
http://slidepdf.com/reader/full/psi-re-use-in-the-cultural-sector 14/43
12 CC462D011-1.1
3
3.1 Introduction
3.1.1 As discussed above (sub-section 2.3), it is extremely difficult to generalise from the results of thissurvey. The approach that institutions have taken appears to depend on a very wide range of
intrinsic and extrinsic factors – from the strategy of the state they are located in, through thenature of the collections, right down to the personalities of the people involved at an institution.
It is important to bear in mind that a sample of this size cannot be representative of such adiverse community. These results should not be seen as statistically significant: they areillustrations of the situation across Europe.
Sample characteristics
Part 1: introductory survey
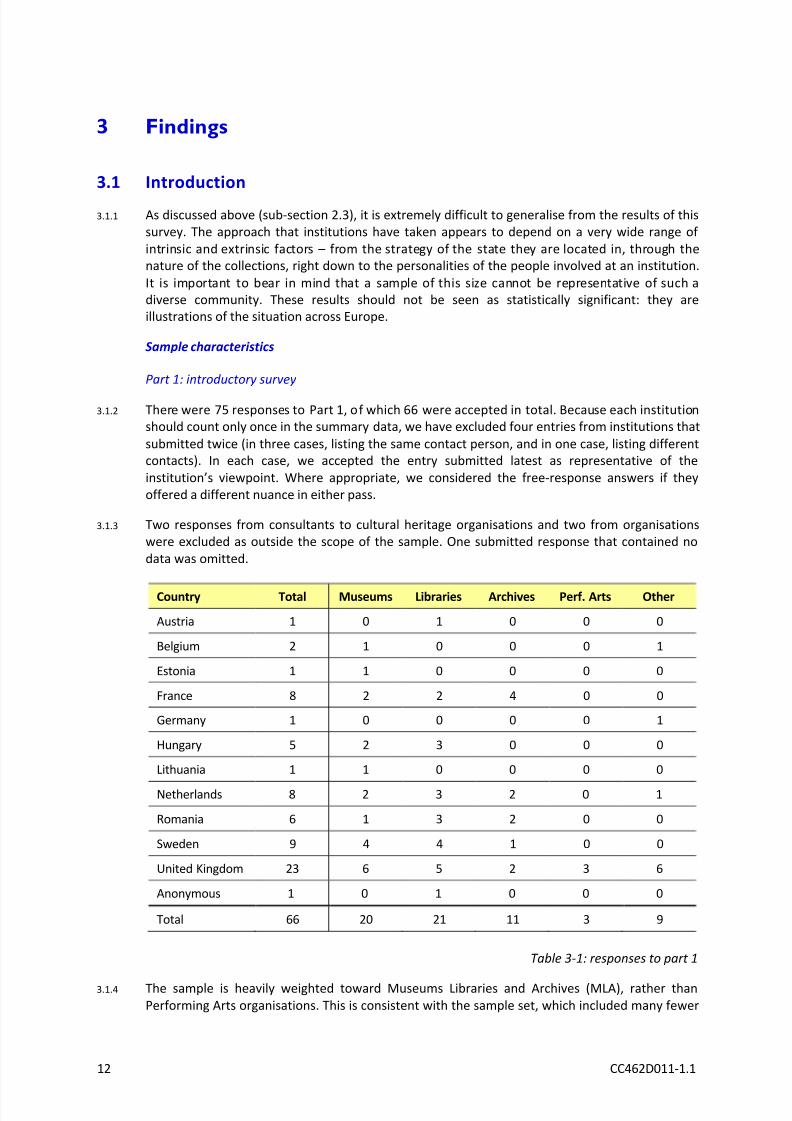
3.1.2 There were 75 responses to Part 1, of which 66 were accepted in total. Because each institutionshould count only once in the summary data, we have excluded four entries from institutions that
submitted twice (in three cases, listing the same contact person, and in one case, listing differentcontacts). In each case, we accepted the entry submitted latest as representative of the
institution’s viewpoint. Where appropriate, we considered the free-response answers if theyoffered a different nuance in either pass.
3.1.3 Two responses from consultants to cultural heritage organisations and two from organisationswere excluded as outside the scope of the sample. One submitted response that contained no
data was omitted.
Country Total Museums Libraries Archives Perf. Arts Other
Austria 1 0 1 0 0 0
Belgium 2 1 0 0 0 1
Estonia 1 1 0 0 0 0
France 8 2 2 4 0 0
Germany 1 0 0 0 0 1
Hungary 5 2 3 0 0 0
Lithuania 1 1 0 0 0 0
Netherlands 8 2 3 2 0 1
Romania 6 1 3 2 0 0
Sweden 9 4 4 1 0 0
United Kingdom 23 6 5 2 3 6
Anonymous 1 0 1 0 0 0
Total 66 20 21 11 3 9
Table 3-1: responses to part 1
3.1.4 The sample is heavily weighted toward Museums Libraries and Archives (MLA), rather thanPerforming Arts organisations. This is consistent with the sample set, which included many fewer

8/6/2019 PSI Re-use in the Cultural Sector
http://slidepdf.com/reader/full/psi-re-use-in-the-cultural-sector 15/43
CC462D011-1.1 13
performing arts organisations than MLA organisations. The sample is weighted toward UKrespondents, which we believe to be due to using English as a working language.
3.1.5 Large and small countries are well represented, although the sample is too small to discuss thesituation in a sub set (such as museums in the Netherlands).
3.1.6 Large and small institutions are represented, although large and pre-eminent institutions havebeen more willing and more able to respond, typically requiring less support or persuasion to
take part.
Country Total Pre-eminent Large Small
Austria 1 1 - -
Belgium 1 - 1 -
Estonia 1 1 - -
France 8 2 1 5
Germany 1 - - 1
Hungary 5 1 3 1
Lithuania 1 - 1 -
Netherlands 9 3 1 5
Romania 6 2 3 1
Sweden 8 2 2 4
United Kingdom 24 5 12 7
Anonymous 1Total 66 17 24 24
Table 3-2: respondents to part 1 broken down by size
Part 2: detailed survey
3.1.7 As expected, not all of the respondents to Part 1 completed Part 2. Although some individuals
responded very rapidly, in many cases it has taken several weeks to provide responses. This isusually due to the need to consult a range of individuals from several functions ( eg finance,
business development, retail) to provide a comprehensive response.
3.1.8 In some cases, we received responses from different parts of organisations than those we invited.In several instances, we invited a small organisation who referred the question to a larger
organisation – for example, one response to Part 2 was directed to a small museum, but theresponse we received provided information for 13 small museums, galleries, monuments andhistoric buildings.
8/6/2019 PSI Re-use in the Cultural Sector
http://slidepdf.com/reader/full/psi-re-use-in-the-cultural-sector 16/43
14 CC462D011-1.1
Country Total Museums Libraries Archives Perf. Arts Other
Austria 1 - 1 - - -
Belgium 1 1 - - - -
Estonia 1 1 - - - -
France 3 - 2 1 - -
Germany - - - - - -
Hungary 1 - 1 - - -
Lithuania 1 1 - - - -
Netherlands 4 1 1 1 - 1
Romania 5 1 3 1 - -
Sweden 5 2 2 1 - -
United Kingdom 13 4 2 2 1 4
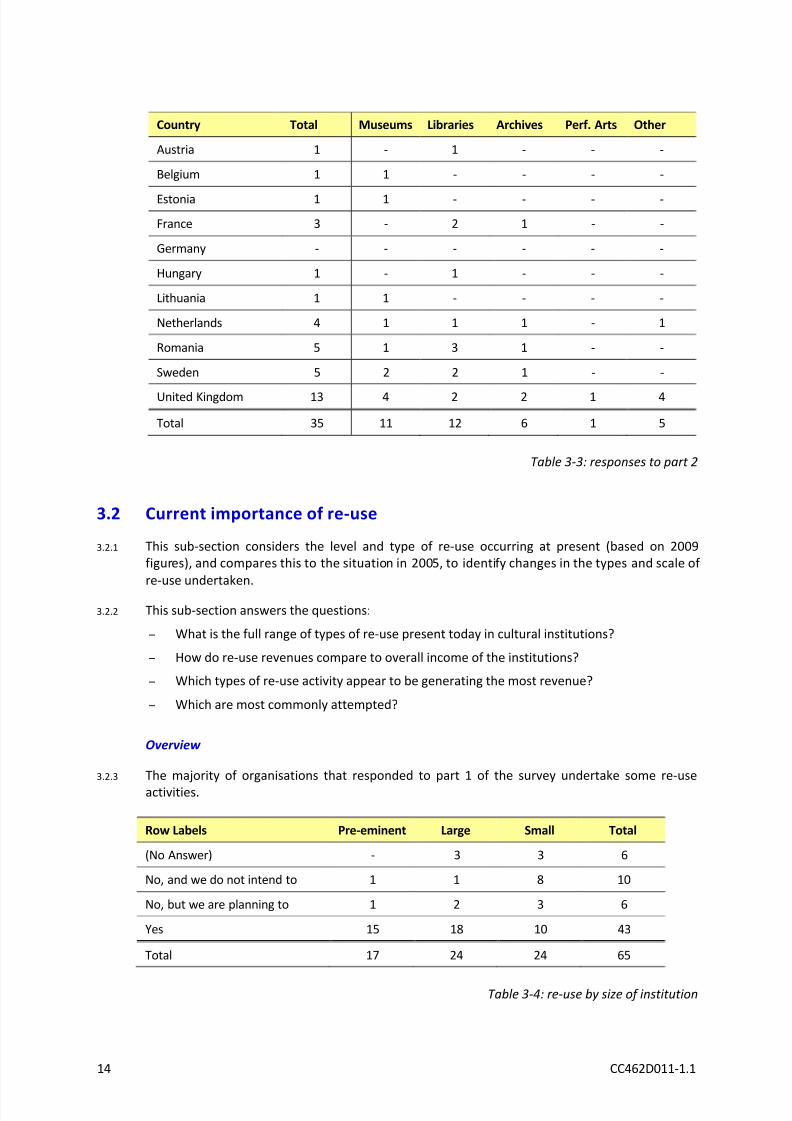
Total 35 11 12 6 1 5
Table 3-3: responses to part 2
3.2 Current importance of re-use
3.2.1 This sub-section considers the level and type of re-use occurring at present (based on 2009figures), and compares this to the situation in 2005, to identify changes in the types and scale of
re-use undertaken.
3.2.2 This sub-section answers the questions:
– What is the full range of types of re-use present today in cultural institutions?
– How do re-use revenues compare to overall income of the institutions?
– Which types of re-use activity appear to be generating the most revenue?
– Which are most commonly attempted?
Overview
3.2.3 The majority of organisations that responded to part 1 of the survey undertake some re-use
activities.
Row Labels Pre-eminent Large Small Total
(No Answer) - 3 3 6
No, and we do not intend to 1 1 8 10
No, but we are planning to 1 2 3 6
Yes 15 18 10 43
Total 17 24 24 65
Table 3-4: re-use by size of institution
8/6/2019 PSI Re-use in the Cultural Sector
http://slidepdf.com/reader/full/psi-re-use-in-the-cultural-sector 17/43
CC462D011-1.1 15
3.2.4 The remainder of this section is based only on responses to part 2 of the survey, which comprisesonly institutions that reported that they undertake re-use.
Types of re-use
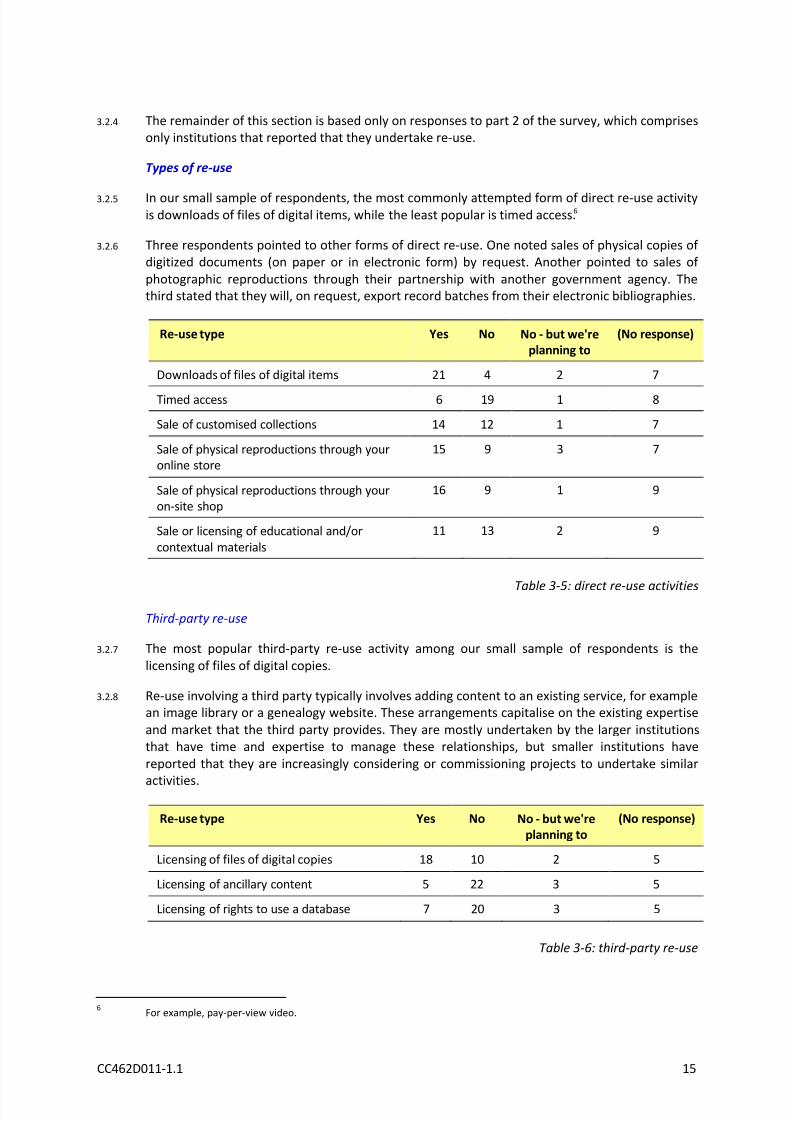
3.2.5 In our small sample of respondents, the most commonly attempted form of direct re-use activityis downloads of files of digital items, while the least popular is timed access.6
3.2.6 Three respondents pointed to other forms of direct re-use. One noted sales of physical copies of digitized documents (on paper or in electronic form) by request. Another pointed to sales of
photographic reproductions through their partnership with another government agency. Thethird stated that they will, on request, export record batches from their electronic bibliographies.
Re-use type Yes No No - but we're
planning to
(No response)
Downloads of files of digital items 21 4 2 7
Timed access 6 19 1 8
Sale of customised collections 14 12 1 7
Sale of physical reproductions through youronline store
15 9 3 7
Sale of physical reproductions through youron-site shop
16 9 1 9
Sale or licensing of educational and/orcontextual materials
11 13 2 9
Table 3-5: direct re-use activities
Third-party re-use
3.2.7 The most popular third-party re-use activity among our small sample of respondents is the
licensing of files of digital copies.
3.2.8 Re-use involving a third party typically involves adding content to an existing service, for examplean image library or a genealogy website. These arrangements capitalise on the existing expertise
and market that the third party provides. They are mostly undertaken by the larger institutionsthat have time and expertise to manage these relationships, but smaller institutions have
reported that they are increasingly considering or commissioning projects to undertake similar
activities.
Re-use type Yes No No - but we're
planning to
(No response)
Licensing of files of digital copies 18 10 2 5
Licensing of ancillary content 5 22 3 5
Licensing of rights to use a database 7 20 3 5
Table 3-6: third-party re-use
6For example, pay-per-view video.

8/6/2019 PSI Re-use in the Cultural Sector
http://slidepdf.com/reader/full/psi-re-use-in-the-cultural-sector 18/43
16 CC462D011-1.1
Financial significance
3.2.9 Of the 35 respondents to part 2, 26 provided at least some level of financial data.
3.2.10 In our sample, re-use (in 2009) accounts for approximately 0-4% of total income, with two
responses at around 7 and 11%. This represents re-use incomes of up to €10M.
3.2.11 Institutions appear to fall into several qualitative groups (which we have named, for ease of discussion) based on their approach to re-use:
– Group 0: “no re-use”
– Institutions that undertake no re-use activities.
– These are mostly small institutions, including for example several local public libraries
that only hold material covered by third-party IPR.
– Group 1: “public duty”
– Institutions of any size that do not charge for re-use of their content.
– Institutions that recover costs only. This is often a “per page” copying fee.
– It is important to note that re-use for these institutions is not necessarily a minor
component of income – cost recovery may make up a significant proportion of an
institution’s income, but without generating any profit for re-investment.
– Group 2: “pocket money”
– Institutions that earn some income from re-use activity, but this is on a small-scale and
often ad hoc basis. This may include activities such as digitising and then licensing localphotography, or selling postcards. The income from these activities may be used to
develop the service, or may go back into general funds, but it is not of strategicimportance to the organisation.
– This income is typically < 1% of the organisation’s total income, and is in the range of
tens of thousands of €.
– Group 3: “big plans”
– Institutions that view re-use as a significant element of their operations. These
institutions typically see the income from re-use as an opportunity to invest in newservices or capabilities. These are exclusively preeminent and large institutions, with thebusiness and technical skills to conduct complex procurement and project management.
– This income is typically 2-10% of the organisation’s total income, and is in the range of
hundreds of thousands to millions of Euros.
3.2.12 These appear to be similar across types of institution and different countries – for the most part,there is no particular pattern of how different types of institution lie within these categories.
However, based on this sample, the institutions with the highest income from re-use are typicallythose in the “big plans” category. These are mostly pre-eminent or large national institutions—including museums, libraries, and archives—that have been conducting chargeable re-use
activities for many years (in one case, since 1765!).
3.2.13 The institution with the highest income from re-use generated ~€10 M in 2009, representing7.1% of total income. The institution with the highest proportion of income from re-use
generated ~€6 M, representing 11.1% of total income.
3.2.14 To illustrate the range of income generated by re-use, the following table sets out the absolute
and relative importance of re-use for the national libraries that supported this work (figures in €

8/6/2019 PSI Re-use in the Cultural Sector
http://slidepdf.com/reader/full/psi-re-use-in-the-cultural-sector 19/43
CC462D011-1.1 17
are rounded). This demonstrates how even similar organisations can have very differentapproaches to, and income from, re-use.
Library Gross
income
Earned
income
Re-use
income
Re-use as % of
gross income
3rd
-party re-use
income
3rd
-party re-use as
% of total re-useA €195 M €9 M €400 K 0.2% €300 K 80%
B €160 M €40 M €5 M 3.2% €1 M 20%
C €55 M €800 €100 0.0% 0 –
D €35 M €3 M 0 – 0 –
E €30 M €4 M €500 K 2.0% €50 K 10%
Table 3-7: national libraries’ income from re-use
Analysis
3.2.15 Very few institutions are dependent on the income they receive from re-use in order to
undertake their public task. However, the income that they receive from re-use is in many casesessential to enable future re-use and development of re-use services. This is true for large andsmall institutions, and for “pocket money” as well as “big plans”.
3.2.16 It is unsurprising that the largest institutions have the most income from re-use: they have thelargest and most notable collections, and they have the administrative capability to manage theexploitation of this material. These institutions are most likely to undertake third-party re-use,
licensing entire collections to an external organisation that undertakes digitisation and thengenerates income. This income is then used to fund the staff time and effort that is required to
prepare further collections for digitisation and re-use.
3.2.17 However, we have also observed examples of this in smaller organisations, where several smallorganisations may share the overhead of digitising material. For example, one group of smallmuseums are working together to take digital images of their artefacts. The photographer is
employed with income generated from the sale of these images (and postcards printed fromthem). Without the income from the re-use, it would not be possible to employ the
photographer, so the digitised material would not exist to be re-used.
3.2.18 Discussions with institutions have revealed a relatively open approach to considering partners forre-use. Those institutions that are actively considering wider re-use of their materials have also
been proactive in considering how to achieve this most effectively. Most institutions recognisethat third parties can potentially add value to collections, and bring these collections toindividuals that the organisation themselves cannot currently reach.
3.3 Trends in re-use
3.3.1 Many institutions had difficulty in identifying income from 2005, which further limits the degreeto which the scale of re-use can be measured quantitatively. Figures within this report are notinflation-corrected.
3.3.2 This sub-section answers the questions:
– Which [activities] have shown the most growth over the interval studied?
– Which are relatively recent entrants, and should be watched for future growth?

8/6/2019 PSI Re-use in the Cultural Sector
http://slidepdf.com/reader/full/psi-re-use-in-the-cultural-sector 20/43
18 CC462D011-1.1
– Which activities are undertaken by the institution, and which revenues are derived fromthird-party uses?
Overall financial importance
3.3.3 Overall income from re-use activities has varied between 2005 and 2009, with someorganisations reporting growth and some reporting reductions. As a proportion of overall
income, however, re-use has remained approximately level (<1% change) for all of thoseinstitutions that provided financial data for this question.
3.3.4 The institutions with the greatest income are those in the “big plans” category, who have well-
established products and services, and have often been offering these for many years. Theseinstitutions have typically seen small decreases in the proportion of their income that comes fromre-use: although overall income from re-use is level or increased, it has not lagged behind growth
of the institution’s overall income.
3.3.5
In summary, there does not appear to have been a significant change between 2005 and 2009 inthe proportion of institutions’ income that is generated from re-use.
Strategy and selection of individual projects
3.3.6 Many respondents stressed that they were trying to balance their public task of disseminatinginformation with their requirement to generate income, including income to fund future
development of re-use services. As expected, many projects have been started since 2005, andmany more are currently being planned. It is clear that institutions are actively seeking outopportunities to re-use their content.
3.3.7 To understand the picture of re-use fully, it is necessary to consider the range of re-uses that do
not generate income, as some institutions are investing in such activities as they see this as partof their public task. This raises the question of when re-use is simply use, since different
institutions have different perspectives on what is within their task: for example, some museumssee disseminating knowledge as a key task, whereas some are primarily focused on theirpreservation and curation activities.
3.3.8 In the survey, we asked respondents to list examples of discrete re-use projects being undertakenat their institution. Of the detailed re-use activities that respondents described, approximatelyone-third began after 2005, and thus no comparative figures exist for these.

8/6/2019 PSI Re-use in the Cultural Sector
http://slidepdf.com/reader/full/psi-re-use-in-the-cultural-sector 21/43
CC462D011-1.1 19
Year project
started
Number of
examples
older 10
2001 12002 –
2003 2
2004 2
2005 1
2006 2
2007 2
2008 2
2009 52010 1
(Unknown) 5
Table 3-8: year projects began
3.3.9 The oldest projects are typically of two types: “big plans” institutions that have been deliveringservices for decades or centuries, and traditional “pocket money” activities such as the sale of postcards.
3.3.10 Perhaps unsurprisingly, the three re-use types that have become more commonly adopted by the
surveyed institutions over the past ten years include downloads of files of digital copies, licensingof files of digital copies, licensing of rights to a database, and sales of physical re-productionsthrough an institution’s online shop. It is difficult to gauge the financial success of a given re-use
type in our sample because institutions often reported using multiple re-use mechanisms (eg licensing of rights to a database and sales of physical re-productions) for a single re-use project.
With that said, respondents gave the anecdotal sense that licensing activities, particularly for filesof digital copies held by the institution, is becoming more prevalent. Several respondents alsonoted that they expect licensing of copies of digital files to private entities to become a more
important revenue source for them in the future. Table 3-9 overleaf shows when different typesof project began.

8/6/2019 PSI Re-use in the Cultural Sector
http://slidepdf.com/reader/full/psi-re-use-in-the-cultural-sector 22/43
20 CC462D011-1.1
Year started
( U n
k n o w n )
2 0 0
0 o r e a r l i e r
2 0 0
1
2 0 0
2
2 0 0
3
2 0 0
4
2 0 0
5
2 0 0
6
2 0 0
7
2 0 0
8
2 0 0
9
Downloads of files of
digital copies3 6 1 1 3 1 0 2 2 2 3
Timed access to
collections of digital
content
0 2 1 1 2 0 0 1 0 0 1
Sales of customized
collections1 4 1 0 0 1 0 1 0 0 0
Sale of physical
reproductions through
your online store
3 4 0 0 2 0 0 0 1 1 0
Sale of physical
reproductions through
your on-site shop
5 5 0 0 0 0 1 0 0 0 0
Sale of educational
and/or contextual
materials
2 6 0 0 0 0 0 1 0 0 0
Licensing of files of
digital copies0 7 0 0 1 1 0 1 0 1 4
Licensing of ancillary
content, commentary,or teaching tools
0 2 1 0 0 0 0 0 0 1 0
Licensing of rights to
use a database0 2 1 0 1 0 0 0 0 2 3
Other 0 6 0 1 2 1 1 0 0 0 0
Total reported re-use
types (multiple types
per reported project)
15 44 5 3 11 4 2 6 3 7 11
Table 3-9: re-use types reported-, grouped by start date (individual activities may be listed
under several categories)
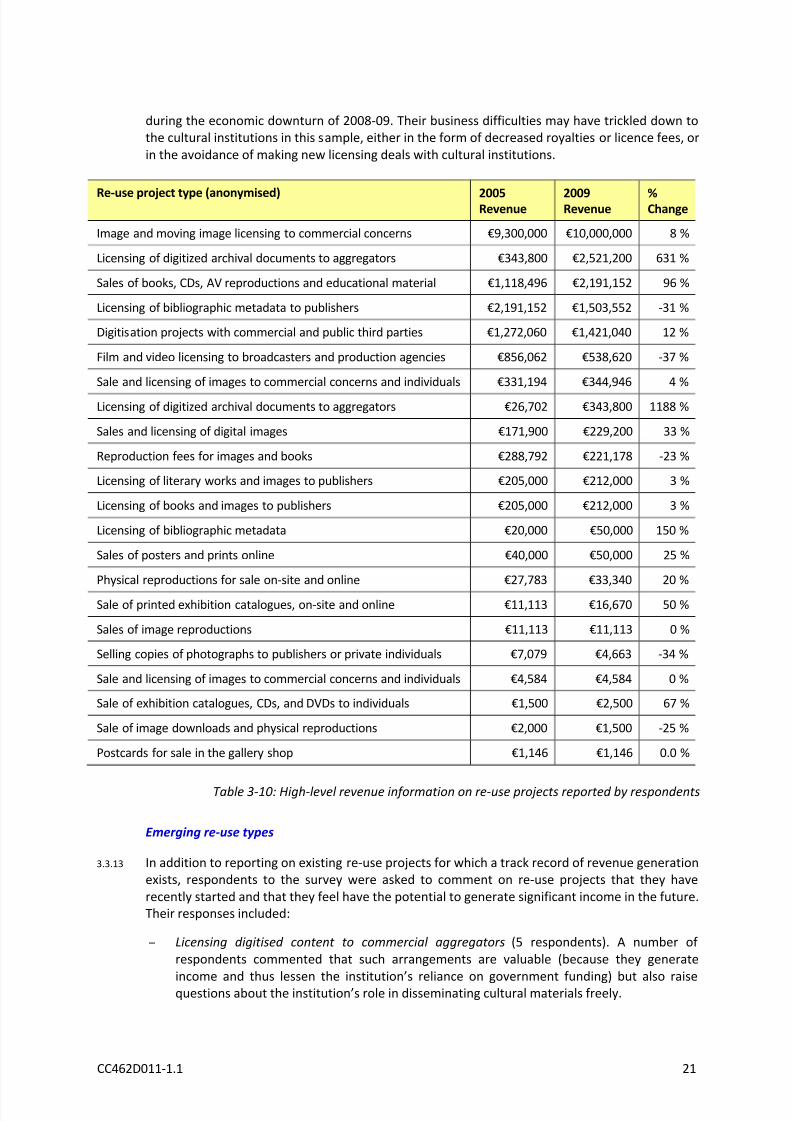
3.3.11 Considering the projects started before 2005 that provided financial data, in the period between2005 and 2009 there is no clear pattern of growth or decline: 14 grew, 5 shrank, and 3 showed nochange in income. Although the definition of a “project” was largely at the discretion of the
respondent, these re-use types ranged from the modest (less than € 2,000 in annual revenue forsales of postcards at a small institution) to significant (€ 10 million in revenue for an audiovisuallicensing program). Data on the anonymised projects is reported in Table 3-8.
3.3.12 The small size of the dataset makes it impossible to identify unambiguous relationships betweenproject type and the project’s change in fortunes. However, in this small sample, the five projects
that saw a decrease in revenue from 2005 to 2009 all involved licensing to production agencies,publishers, or other commercial concerns—entities that may have been severely challenged
8/6/2019 PSI Re-use in the Cultural Sector
http://slidepdf.com/reader/full/psi-re-use-in-the-cultural-sector 23/43
CC462D011-1.1 21
during the economic downturn of 2008-09. Their business difficulties may have trickled down tothe cultural institutions in this sample, either in the form of decreased royalties or licence fees, or
in the avoidance of making new licensing deals with cultural institutions.
Re-use project type (anonymised) 2005Revenue
2009Revenue
%Change
Image and moving image licensing to commercial concerns €9,300,000 €10,000,000 8 %
Licensing of digitized archival documents to aggregators €343,800 €2,521,200 631 %
Sales of books, CDs, AV reproductions and educational material €1,118,496 €2,191,152 96 %
Licensing of bibliographic metadata to publishers €2,191,152 €1,503,552 -31 %
Digitisation projects with commercial and public third parties €1,272,060 €1,421,040 12 %
Film and video licensing to broadcasters and production agencies €856,062 €538,620 -37 %
Sale and licensing of images to commercial concerns and individuals €331,194 €344,946 4 %
Licensing of digitized archival documents to aggregators €26,702 €343,800 1188 %
Sales and licensing of digital images €171,900 €229,200 33 %
Reproduction fees for images and books €288,792 €221,178 -23 %
Licensing of literary works and images to publishers €205,000 €212,000 3 %
Licensing of books and images to publishers €205,000 €212,000 3 %
Licensing of bibliographic metadata €20,000 €50,000 150 %
Sales of posters and prints online €40,000 €50,000 25 %
Physical reproductions for sale on-site and online €27,783 €33,340 20 %
Sale of printed exhibition catalogues, on-site and online €11,113 €16,670 50 %
Sales of image reproductions €11,113 €11,113 0 %
Selling copies of photographs to publishers or private individuals €7,079 €4,663 -34 %
Sale and licensing of images to commercial concerns and individuals €4,584 €4,584 0 %
Sale of exhibition catalogues, CDs, and DVDs to individuals €1,500 €2,500 67 %
Sale of image downloads and physical reproductions €2,000 €1,500 -25 %
Postcards for sale in the gallery shop €1,146 €1,146 0.0 %
Table 3-10: High-level revenue information on re-use projects reported by respondents
Emerging re-use types
3.3.13 In addition to reporting on existing re-use projects for which a track record of revenue generationexists, respondents to the survey were asked to comment on re-use projects that they have
recently started and that they feel have the potential to generate significant income in the future.Their responses included:
– Licensing digitised content to commercial aggregators (5 respondents). A number of
respondents commented that such arrangements are valuable (because they generate
income and thus lessen the institution’s reliance on government funding) but also raisequestions about the institution’s role in disseminating cultural materials freely.

8/6/2019 PSI Re-use in the Cultural Sector
http://slidepdf.com/reader/full/psi-re-use-in-the-cultural-sector 24/43
22 CC462D011-1.1
– Sales of ebooks and print-on-demand books (5 respondents).
– Licensing of metadata (2 respondents). One of the respondents noted that although they
aim to make their metadata freely available for use by developers and others, they are open
to charging for cost recovery in the future: “Our vision is that [although] discovery should be
free, delivery may be charged (depending on the kind of material, copyright issues and theefforts we have to undertake to deliver).”
Digitisation and re-use
3.3.14 Many respondents expressed in qualitative sections of the survey a sense that digitisation of content was synonymous with enabling re-use. Respondents have generally expressed the view
that material must be digitised to reach as wide an audience as possible. Nonetheless, there aregood examples of “analogue” re-use, such as reproduction fees, selling prints, catalogues etc.
3.3.15 There was a general view that the cost and effort of digitisation was the major factor limiting re-use of their material. Depending on the capability and nature of the organisation, this typically
either has prevented the re-use of the material, or has led to third-party re-use.
3.3.16 Although not an emerging type of re-use, a range of respondents expressed their current plans to
be “more of the same” – digitise more collections and more types of collections.
3.4 Compatibility with the PSI directive
3.4.1 A further aim for this project was to investigate conformity of institutions with the provisions of the directive. As cultural institutions are currently exempt from the PSI Directive, they have
usually not structured their processes around the requirements of the directive. As such, we haveselected indicators that describe compatibility with the principles of the directive rather than the
detailed obligations – in particular since member states may have transposed elements of thedirective differently, to integrate more effectively with other national access to informationlegislation.
3.4.2 This section discusses how the respondents to part 2 of our survey manage the key issues of discoverability, availability, charging, licensing, and having a suitable process to manage re-userequests.
Discoverability
3.4.3 The cultural institutions in this sample have invested in making their content findable through a
variety of mechanisms, both traditional and electronic.
7
3.4.4 In our small sample, approximately two-thirds (26 out of 35 respondents) reported that “all” or
“most” of their collections can be discovered via consultation with a staff member (where “most”was defined as more than 50% of their holdings). Twenty out of 35 reported that all or most of their content is available via physical catalogues.
3.4.5 Fewer institutions have made a substantial proportion of their content discoverable throughnetworked resources. Of the 35 respondents, twelve have records for almost all of their itemsavailable via electronic catalogues at their institutions. Fourteen out of the 35 respondents make
almost all their collections available through their website. Those respondents sit at verydifferent points along the spectrum of overall budgets when measured against the other
7This question asked only about content held at the institution that is not covered by third-party intellectual property
rights.

8/6/2019 PSI Re-use in the Cultural Sector
http://slidepdf.com/reader/full/psi-re-use-in-the-cultural-sector 25/43
CC462D011-1.1 23
respondents that provided such figures – three are near the top of the income table (whichmakes sense, given the substantial investment needed to provide metadata for a great volume of
content), while two sit near the bottom of the income table.
3.4.6 From a similar but slightly different angle, the data suggests a weak correlation between re-use
revenue and discoverability via institutional website and electronic catalogues that may be worthfurther exploration. Of the 23 institutions that reported re-use revenue figures for 2009, four of the top five (and five of the top 10) reported that more than 50% of their in-scope holdings arediscoverable via their website (compared with just 41% of the overall response pool). Similarly,
four of the top five (and seven of the top ten) reported that more than 50% of their in-scopeholdings are discoverable via electronic catalogues available at their institution (compared with
just 53% of the overall response pool).Four other discovery methods were reported, including useof OAI-PMH metadata harvesting, “by request”, and the use of an extranet that is open only toprofessionals who register with the institution in question.
Analysis
3.4.7 The financial and other resources needed to catalogue materials and otherwise make materialsdiscoverable are an established challenge for the cultural sector.
3.4.8 We suspect, based on the weak correlation in our data and our practical experience, that strongdiscoverability via networked resources is a pre-requisite for generating successful re-use(although in some cases of re-use through a third party, it is the third party that enables
discoverability after negotiating for access to an entire collection) . As such, we would expect thatthe best-resourced institutions – that is, those in a position to make large outlays for metadataand other networked discoverability mechanisms—would be best positioned to exploit re-use
revenue from their holdings. Of course, these institutions often have larger, more complicatedcollections that require more effort to catalogue.
3.4.9 With that said, discoverability has a wide range of meanings, depending on context, and thesecannot easily be captured by a survey. For example, does ’discoverability’ mean knowing that amuseum holds a collection of papyrus scripts, or does it mean that item-level descriptions of
these scripts are available? The quality of the metadata and discoverability mechanisms wouldobviously be crucial for exposing the materials to a wider audience of re-users, but it is difficultfor a survey like ours to capture that qualitative aspect.
3.4.10 Finally, in some cases, discoverability of resources is strongly tied to the material that can be re-used. For example, in libraries, the metadata for their holdings is a tool for discoverability butalso a product that they license or sell (Indeed, one of the institutions in our sample derived
approximately € 1.5 million from licensing bibliographic metadata in 2009). Libraries that sellaccess to their metadata in some cases may be making a trade-off between revenue generationand greater discoverability of their content (by making their metadata freely and unrestrictedly
available to any re-user).
Availability
3.4.11 We considered availability from the perspective of whether the IPR status of the collection would
permit its re-use. Out of our small sample, only one institution reported that all of their holdingsare covered by third-party copyright (this institution is a library, and when we clarified this point,
they reported that they also have metadata for their holdings which is either IPR-free, or theyown the IPR for). Most institutions reported that “most” or “some” of their collections werecovered by third-party copyright. One institution (an archive) reported that their institution either
owns the IPR for all of their holdings or the materials in question are out of copyright.

8/6/2019 PSI Re-use in the Cultural Sector
http://slidepdf.com/reader/full/psi-re-use-in-the-cultural-sector 26/43
24 CC462D011-1.1
3.4.12 The question “Do you have any plans to audit the IPR in your collections?,” was only asked to thesingle respondent who reported that they did not know what the IPR status of their holdings was
– and that organisation plans to do so but has not yet begun. Discussions with institutionsrevealed that the IPR status of holdings was known at a collection level – in the sense that they
knew that collections were partly- or mostly-covered by third-party copyright, but did not haveper-item records.
Analysis
3.4.13 The IPR status of holdings provides a challenge that will limit the availability of collections for re-
use. Some organisations who provided qualitative input to this study are deeply concerned aboutthe administrative overhead in managing requests for re-use that require rights clearance
activities.
3.4.14 Libraries typically have an easier task of managing IPR: the majority of their holdings arepublished materials that have a clear status. Libraries have varying views of IPR in their metadata
– some hold that it has IPR, some do not.8 The materials that local libraries hold which is of lesscertain IPR status is also that which often has most re-use potential: local studies information, forexample local photographs.
3.4.15 Museums and archives have typically more complex collections, and more complex IPR statusassociated with them.
Charging
3.4.16 In this small sample, 13 of the 35 respondents reported that they “always” or “for some
collections” charge a commercial rate for re-use. (Five of these were museums, for which imagelicensing is a significant re-use activity, and one for which they are serving customers in the
commercial sector.)
3.4.17 In response to a question asking institutions that charge a commercial rate to explain how theydetermine that rate:
– Three reported relying on market research (two benchmark against peer cultural heritage
institutions, while a third relies on a “competitive analysis” that may or may not include aconsideration of the commercial rates charged).
– Two reported that partner institutions who handle sales/licensing and fulfilment determine
the commercial rates.
– One institution indicated that they set their commercial fees in accordance with guidelinesoffered by their nation’s treasury.
– One institution indicated that the institution charges a flat fee according to the medium inwhich the material will be re-used (TV, home video, advertising, etc.), the territories inwhich the materials will be re-used, and the duration of the license for re-use. In certain
cases, the same institution asks for a revenue-sharing agreement.
3.4.18 Fifteen of the 35 respondents have a firm fee structure. Three institutions negotiate all re-usesindividually, and three institutions do not charge re-use fees. Nine institutions chose “other” and
offered more nuanced answers, including:
– One reported waiving fees for educational and research use, while negotiating rates forcommercial use on a case-by-case basis.
– Two institutions reported charging only for high-resolution materials.
8We investigated this issue in greater depth in an earlier study for JISC: <http://goo.gl/BZOUX> [accessed 15 March 2011]

8/6/2019 PSI Re-use in the Cultural Sector
http://slidepdf.com/reader/full/psi-re-use-in-the-cultural-sector 27/43
CC462D011-1.1 25
– One reported that, although their fee structure is posted online, there is such a largenumber of possible combinations of fees that the institution nearly always must devote staff
time to helping the consumer understand the charges. (This institution was near the topamong institutions that reported their 2009 revenue, an indicator that they likely hold a
great amount and diversity of content types.)
– One reported applying “a number of approaches” to charging.
Analysis
3.4.19 Cultural institutions hold a very wide variety of materials, and operate within very different
regulatory and cultural environments. The approaches that they take to charging are similarlydiverse. For example, two national libraries charge for re-use of their bibliographic metadata,
whereas another two do not (and in fact, needed to be prompted to consider sharing theirmetadata as re-use – both viewed sharing their metadata as an obvious activity. As one put it,“There are not so many requests for use of our metadata, but we do contribute [it] eg to
Europeana - free of charge, of course”).
3.4.20 Those institutions that hold material with well-developed commercial markets – such as imagesand archives of use in genealogy – are correspondingly more likely to adopt commercial pricing
models.
Licensing
3.4.21 Of the 35 respondents to a question asking whether they enter into exclusive licensing
arrangements:
– 25 respondents do not enter into exclusive licensing arrangements.
– Two respondents enter into exclusive licensing arrangements for individual items. These
were different institution types – a library and a museum. One’s gross income for 2009 wasapproximately €2.5 million—near the bottom of the sample of those respondents whoanswered this question—while the other’s was €90 million—near the top of the sample.
– Two respondents enter into exclusive licensing arrangements for entire collections (a pre-eminent library and a large archive). In both cases, there are complexities in the exclusivityagreement: the library’s contract allows the content to be made freely available to users
within the library’s country while the third party monetises the content by selling orlicensing to customers outside the country; the archive’s contract allows them to break theexclusivity clause but levies financial penalties for doing so (in the form of a lower royalty
rate).
– Two institutions who selected “other” indicated that they enter into exclusive licensing
arrangements for limited periods. One of these two respondents indicated that the purposeof doing so is “to attract private funds to digitise public assets, with a view to increasingaccess, at no cost to the public purse at a time of constrained public expenditure”.
– One institution who selected “other” indicated that they license to television stations that“insist on having control of the images they have purchased from us (ie in terms of use overtheir networks/programmes) but this is not exclusive in that it does not affect our right to
use the images or the copyright”.
– One institution indicated that they grant exclusive rights for “programmes” (presumablyfull-length, edited television programs) but non-exclusive rights for footage.

8/6/2019 PSI Re-use in the Cultural Sector
http://slidepdf.com/reader/full/psi-re-use-in-the-cultural-sector 28/43
26 CC462D011-1.1
Analysis
3.4.22 Respondents appear to have carefully considered the type of exclusivity in licences they offer,and are likely to be able to justify their choices. Exclusivity appears to be linked to two key cases:
1) Media licensing, where exclusivity is well-established in the commercial market;
2) Public/private partnerships where the private partner undertakes the digitisation. This case
demands some exclusivity (perhaps only for a short period) in order to provide commercialincentive for the private partner.
3.4.23 These cases are concentrated in the larger organisations, which also have the skill and
administrative resource to manage the negotiations and administration required for suchservices.
3.4.24 The data set is too small to determine whether exclusivity drives higher revenue, but therespondents who entered into exclusive agreements felt that this exclusivity enabled the re-use
in the first place.
3.4.25 In a separate question on the survey, respondents pointed to licensing arrangements withcommercial entities as one of the most likely re-use types to be of increasing financial importance
in the near future. This indicates that even institutions that do not yet depend on sucharrangements expect that they will need to in the future.
Process
3.4.26 Of the 23 respondents to a question about the length of time needed to respond to re-use
requests:
– 27 reported responding to re-use requests in less than 20 working days.
– One reported responding in 21 or more working days.
– Four reported fulfilling license agreements immediately via an online automated procedure.
– One reported not receiving any requests.
– Two institutions did not respond.
Analysis
3.4.27 Organisations are responding to requests for re-use in a timely manner. Further discussion withsome of the respondents highlighted that although day-to-day re-use requests could be metwithin 20 days, developing new services, negotiating with delivery partners, etc, often took much
longer. Some organisations led the process of re-use by tendering a contract, which was thensubject to EU procurement processes.
3.5 Questions raised during this study
3.5.1 Several issues have been identified during this study that may need to be considered whenconsidering these results, and in any future work to understand the complete picture of re-useand public duty within the cultural sector across Europe. These are in addition to the views of
respondents, which are discussed in section 5.
1) In many cases, the approach taken to income generation is defined by an institution’s task,
which in some cases is set down in legislation. It may be instructive to consider the situationregarding re-use from a member-state perspective in addition to this organisational

8/6/2019 PSI Re-use in the Cultural Sector
http://slidepdf.com/reader/full/psi-re-use-in-the-cultural-sector 29/43
CC462D011-1.1 27
perspective – what access to information legislation, or legislation establishing nationalinstitutions exists in each member state? How compatible is this with 2003/98/EC?
2) As the directive was not written with cultural institutions in mind, the language and logic is
not directly applicable to the material held by these institutions. In particular, the extent to
which an activity falls within the public task of an organisation is a matter of significantuncertainty for many respondents. Respondents to this survey found it difficult to engage
with the concept of re-use. This study has investigated the current re-use activities, butbefore assessing how any loss of the exemption of the cultural sector would affect
institutions, it would be necessary to define more clearly what activities would be affected.
3) This study was designed to identify current re-use activities, from the perspective of cultural
organisations. There is a related question about which re-use activities have ceased orreduced, and why. For example, some metadata sets have been released openly due to
government pressure, whereas the income from some licensing activities has fallen due tothe economic environment.
4) It may be instructive to investigate some of the high-income activities in more detail acrossEurope, to see things from the service perspective rather than the organisationalperspective. In particular, competitive markets are developing or established in some typesof re-use, it would be interesting to investigate these markets directly.

8/6/2019 PSI Re-use in the Cultural Sector
http://slidepdf.com/reader/full/psi-re-use-in-the-cultural-sector 30/43
28 CC462D011-1.1
4
4.1 Introduction
4.1.1 This section presents brief case studies that investigate i) common re-use approaches, and ii) newapproaches felt to have significant potential. They have been selected to illustrate the kinds of
activities undertaken, rather than as a comprehensive set.
4.1.2 These provide some organisational context, and describe one individual use case within theorganisation: they are not comprehensive overviews of the full range of activities that these
institutions undertake.
4.2 Audiovisual licensing
Context
4.2.1 L’Institut national de l’audiovisuel (INA) in Paris holds as an archive of French television and radiorecordings stretching back over 70 years (http://www.ina.fr). INA holds historical recordings from
French public broadcasters, and also has a role as a legal deposit archive where current materialfrom both public and private broadcasters is lodged.
4.2.2 INA is a not-for-profit organisation, but earns a significant proportion of its income fromcommercial activities including the production of films, education, professional training and thelicensing of audio visual content.
4.2.3 Over the last decade or so, there has been an increasing focus within INA on the service delivery
aspect of their work – the value of the archive material that they hold can only be realised if potential users can find and gain access to material in a way that suites them. INA has been pro-active in experimenting with new ways to provide this material both to professional users and to
the general public.
Audiovisual licensing
4.2.4 The largest single source of earned income for INA is commercial licensing activities, generating
more than €14M this year. INA has licensed its content for commercial use since the organisationwas established in 1974, and is gradually digitising the entire archive.
4.2.5 Since 2004, INA has provided access to this material through the website Inamédiapro
(http://www.inamediapro.fr). This provides a workflow management, ordering and deliverysystem for professional users. All of INA’s archive (but not the legal deposit) material is availablethrough Inamédiapro, including approximately 675,000 hours of digitised TV and radio material.
4.2.6 While INA offers 35,000 hours of content free to the general public via its public website, ina.fr,Inamédiapro has a clear set of professional customers, including advertising agencies,broadcasters, production companies and others who license this content for re-use in film,
television, internet and other productions. This allows inamédiapro to focus marketing andproduct development activities on the needs of this specific group of users.

8/6/2019 PSI Re-use in the Cultural Sector
http://slidepdf.com/reader/full/psi-re-use-in-the-cultural-sector 31/43
CC462D011-1.1 29
4.2.7 INA has found that it is not enough simply to make content available – in a competitivecommercial sector, it is necessary to focus clearly on customer requirements. INA has delivered
this by ensuring that it provides high quality service to customers, as well as high-quality material.
4.2.8 Inamédiapro has been described more fully at <http://goo.gl/dKc0W>
4.3 Access to archives for genealogy etc
Context
4.3.1 The National Archives (http://www.nationalarchives.gov.uk) is a government department and an
executive agency of the Ministry of Justice. As the official archives of the UK government, it caresfor, makes available and ‘brings alive’ a collection of over 1000 years of historical records,
including the treasured Domesday Book.
4.3.2 It also manages current digital information and devises new technological solutions for keepinggovernment records readable now and in the future. It provides world class research facilities and
expert advice, publishes all UK legislation and official publications, and is a leading advocate forthe archive sector.
4.3.3 The National Archives sets standards of best practice that promote and encourage public access
to, and the re-use of information. It has also been instrumental in developing effective businessmodels which enable improved accessibility and encourage re-use, in addition to providingguidance to other archives across the UK about how they could re-use their holdings
4.3.4 Through actively compiling new collections of content for imaging for the market and explorationof the potential of the content with commercial investors, The National Archives has sought to
increase revenues over time. In the light of the current economic climate and the subsequentreduction in government funding over the next four years such work has become moreimportant. As a result of its activity in this area, The National Archives has been able to continueto innovate and move forwards in many areas of their expertise despite these funding changes.
Access for genealogy
4.3.5 The Licensed Internet Associates programme (LIA) enables digitisation of archival holdings at TheNational Archives through the use of commercial partners. In the LIA model, digitisation of and
collaboration on specific collections (e.g. the Census data from 1911) is put out to tender with thecommercial partner bearing all costs of digitisation. Access to online services are provided by
commercial partners to their customers for a charge, however all users onsite at The NationalArchives are able to access these services free from the reading rooms. This reduces handling anddamage to the original paper records.
4.3.6 As the digitisation can be carried out at no cost to The National Archives, it enables materials tobe digitised and provided to a worldwide audience on a scale that would never have beenpossible otherwise. Without outside investment, The National Archives would be unable to
digitise collections as large as the British army service records of Chelsea Pensioners, for example.This project, completed in November, involved the release online of 8 million images.
4.3.7 Licensed Internet Associates are granted 10-year non-exclusive licences for digitising the content
and developing a website through which they deliver the images to customers. This ensures astable and long-term relationship for provision of access to the images to a wide range of peoplearound the world - many more than would be able to visit the archives in order to view the

8/6/2019 PSI Re-use in the Cultural Sector
http://slidepdf.com/reader/full/psi-re-use-in-the-cultural-sector 32/43
30 CC462D011-1.1
originals. In fact, the cumulative ratio for the financial year 2010/11 is over 220 online imagesdelivered for every 1 document viewed in the reading rooms at Kew.
4.3.8 Licensed Internet Associates provide back to The National Archives digital files of the imagescreated (but not any metadata they produce to support those files) as well as paying a royalty on
income. The National Archives stores the images for business continuity purposes (e.g. in case acompany becomes unable to provide an online service anymore) and can also at the same timere-license the images to other companies as secondary licensees. This encourages competition inthe marketplace, helping to deliver a better deal for the end users who pay for access to online
services. Royalties are paid to The National Archives and these are reinvested in the servicesprovided by The National Archives.
4.3.9 In exchange, the Licensed Internet Associate receives the benefit of The National Archivesbranding on their site, as well as links to their services from The National Archives website. TheNational Archives brand is very trusted and the website receives over 22 million online visits a
year. These are valuable benefits to the commercial partners who are able to present themselvesas the “official” provider of the content online and so the licences are mutually beneficial as wellas in demand. Secondary licensees do not have the benefit of this branding and links from the
website and therefore pay a lower royalty rate. As second-to-market, they do not need to investin digitising the material in the first place but they also do not receive the benefit of the
excitement and impetus generated by newly launched material.
4.3.10 The TNA LIA programme has been described more fully at <http://goo.gl/lZojW>
4.4 Mobile content/apps
Context
4.4.1 The Natural History Museum (NHM) in the UK is a world-class museum with extensive collectionscovering botany, entomology, mineralogy, palaeontology and zoology (http://www.nhm.ac.uk).
The main collections are housed in London, and receive approximately 4 million visitors per year.
4.4.2 The museum is “trying to build a relationship with people that goes beyond the dinosaurs”, and isactive in using technology to increase the value and impact of their collections. This is in both the
evelopment of participatory social media systems that extend the visitor journey online and allowvisitors to interact with each other and Museum Scientists such as NaturePlus and administrative
systems such as Digital Asset Management
4.4.3 At present, interactive media at NHM is not an income stream, although some online services(such as ticketing and retail) do support established streams. There is a drive to consideropportunities for generating income, but this does not override the museum’s public education
and science responsibilities: the public service and commercial aspects are both considered whenassessing new activities.
Mobile content
4.4.4 NHM has been following the growth of mobile platforms for internet access, and is aware that
their visitors include an above average number of smartphone users. NHM is in the process of updating its online presence to reach this group better. There are two distinct strands to this
activity:
– Optimising existing web content to make it more accessible from mobiles, smartphones and
tablets. This is the first priority, and work is underway. – Developing “apps” to run directly on smartphones.

8/6/2019 PSI Re-use in the Cultural Sector
http://slidepdf.com/reader/full/psi-re-use-in-the-cultural-sector 33/43
CC462D011-1.1 31
4.4.5 At present, NHM sees no clear commercial case for the development of apps, and as such, thedevelopment is seen as primarily an opportunity for increasing awareness of the museum,
marketing, and increasing awareness and experience of the process of app design within themuseum. There is a sense that there might be a “killer app” for the NHM, but this has not been
identified yet. Nonetheless, the museum intends to proceed with app development during 2011,with the aim of launching a product this year.
4.5 Printing postcards
Context
4.5.1 The University of Uppsala is one of the pre-eminent research institutions in Scandinavia, and the
university library (Uppsala universitetsbibliotek) was founded in 1620 (http://www.ub.uu.se/).The library has, alongside a collection of approximately 5.5 million books, extensive special
collections including early imprints, manuscripts, images, maps and music scores. The
organisation also has a role as a legal deposit library for Swedish publications.
4.5.2 As an academic library, the mission of the library is tightly focused on the support of researchers,teachers and students. Its remit goes more widely, however, and the library has a goal to develop
active interaction with the wider society – the library is open to users from outside the university,and has a duty to present its cultural heritage collections through exhibitions, tours, and online.
Printing postcards
4.5.3 For many years, the library has produced postcards of objects from their cultural heritagecollections. These are produced by the university, and are available for sale in the library building,
and through their online shop.
4.5.4 A new issue of postcards (and other similar objects such as correspondence cards) is createdapproximately once a year. This is a relatively informal process, with one member of staff with aninterest in design discussing the opportunities with staff from the departments of the library
holding cultural heritage material, in order to select objects and images for use.
4.5.5 As a department of a state university, the library is prohibited by law from making a profit. Assuch, income-generating activities are limited to cost recovery, including the full cost of
producing and marketing the materials.
4.6 Reproduction fees
Context
4.6.1 The Austrian National Library (Österreichische Nationalbibliothek, ÖNB) is the central academiclibrary for Austria (http://www.onb.at). The library holds approximately 8 million objects, and
employs approximately 330 staff (FTE). The holdings include around 3 million books, but alsospecial collections including manuscripts, incunabula, music archives, photographs and images,
maps and globes.
4.6.2 The ÖNB has a semi-autonomous status as a scientific institution, but its activities are regulatedby the Federal Ministry of Education, Arts and Culture (Bundesministerium für Unterricht, Kunst
und Kultur). Due to legislation, history and mission, any income-generating service that ÖNB
operates may not exceed cost-recovery, which can place constraints on any new services that

8/6/2019 PSI Re-use in the Cultural Sector
http://slidepdf.com/reader/full/psi-re-use-in-the-cultural-sector 34/43
32 CC462D011-1.1
ÖNB considers starting. However, the basis for cost-recovery is the operation of a departmentwithin the library – it need not be calculated on a marginal per-transaction basis.
Reproduction fees
4.6.3 The ÖNB has a well-established photographic and image department, which has provided formany years prints of holdings, and licences for the use of holdings elsewhere. Historically, images
of library holdings were created by photography of the original material – this has now beenalmost entirely replaced by scanning of the original source material direct to digital. The imagelibrary acts as the central digitisation service for the entire organisation.
4.6.4 Although the library is prevented from making a profit, as cost-recovery is considered for anentire activity, it is possible to charge reasonable commercial fees for image reproduction. Assuch, the library has a clear set of tariffs for different types of use. Charges for scans and prints
are on a basic per-image charge, and in some cases the library charges different rates forpersonal use, for academic or scientific use, or for commercial use.
4.6.5 The library also generates income through licensing its content for publication elsewhere – this isalso subject to a transparent fee structure. In some cases, the library develops specialreproductions with third parties, for example producing limited-run facsimile editions of historicalpublications.

8/6/2019 PSI Re-use in the Cultural Sector
http://slidepdf.com/reader/full/psi-re-use-in-the-cultural-sector 35/43
CC462D011-1.1 33
5
5.1 Introduction
5.1.1 The collection of attitudinal data was not a principal aim of this project. However, we gaverespondents the opportunity to share their views and concerns, and common issues are
identified in this section.
5.2 Poor understanding of the PSI directive
5.2.1 Many respondents were not familiar with the directive 2003/98/EC, which is understandablegiven that it does not currently apply to them. There is significant confusion regarding what the
implications of a loss of their current exemption would be. Particular areas of confusionencountered repeatedly include:
– a belief that material covered by third party IPR would be included;
– a belief that the directive would require material to be given away at no charge;
– a failure to recognise that assets such as metadata would be covered by the directive;
– a belief that the directive would only apply to material that was already digitised.
5.3 Applicability of the PSI directive to the cultural sector
5.3.1 Several respondents noted that the PSI directive as currently drafted would be difficult orimpossible to apply to the cultural sector. There are concerns on two main points:
– Many re-uses of cultural materials are within mature markets with existing commercial
frameworks. There is a feeling that the directive is drafted from the perspective of administrative government documents that have less well developed markets;
– The wording of the directive would be difficult to apply to cultural materials. One
respondent expressed this well:
“As an aside, it has to be noted that the actual re-use definition of the Directive seemsto apply only to documents that were produced within a public task. For libraries, thiswould apply to (digital) surrogates or metadata generated by the Public Body, but not tothe original materials collected. The mere collection of third-party materials does not
stand on a par with documents generated by the public sector. However, thisdifferentiation is easily blurred (eg reproduction of objects on demand comprises digitalobjects and analogue objects - the digital object may or may not be saved, the analoguecopy is delivered to the customer).”
5.4 Concern about reduction of income
5.4.1 Given the current financial climate in particular, many respondents were deeply concerned aboutthe potential impact on their income that inclusion within the directive would cause. These
concerns ranged from the “big plans” organisations that have significant income streams from re-
use through to “pocket money” organisations that have a sense of the potential value of theircollections, but have not yet exploited them.

8/6/2019 PSI Re-use in the Cultural Sector
http://slidepdf.com/reader/full/psi-re-use-in-the-cultural-sector 36/43
34 CC462D011-1.1
5.4.2 These concerns are primarily expressed in terms of the risk to future re-use: as discussed above(para 3.2.15 onwards), the revenue streams from re-use are often invested in enabling further re-
use.
5.4.3 On a related note, a small number of institutions commented on the importance of the re-use
income stream for supporting the costs of digital preservation for re-used content:
“Generation of digital content does not necessarily mean that this content is thenarchived and available at no costs for an indefinite future, because long term archiving
costs for digital items are not to be neglected.”
5.4.4 More generally, several large/preeminent institutions described a tension between the publicgood of releasing material as widely as possible and the requirement to generate income to
support their work. One respondent described this tension:
“The biggest challenge is striking the balance between the Museum's role in publicengagement - through the dissemination and interpretation of the collection - with theneed to protect and exploit IP rights. IP offers a means to generate revenue, and this hasto be considered as an option to help us increase the proportion of self-generatedincome and thus independence from central funding. On the other hand, unrestricteddissemination of images across the web can bring its own less tangible benefits in brand
awareness, and indirect revenue.”
5.4.5 Several respondents expressed the view that re-use should be free or cheap for private
individuals and scholars, but that commercial re-users should pay more. This appears to be drivenby a concept of fairness: if a company can make profit from the materials, they should share this
profit with the institution that “owns” them.
5.5 Concern over administrative overhead
5.5.1 A range of institutions of all sizes expressed concerns regarding the administrative burden thatinclusion within the directive would bring. Several specific issues were raised:
– Clearing IPR is an expensive and time-consuming activity, and could potentially be required
before any re-use request could be accepted. This is problematic for large and small
institutions: the large institutions have very complex collections whereas the smallinstitutions are lacking staff skill or effort to undertake rights clearance.
– Managing third-party re-use is often a complex and lengthy procedure that involves IPRclearance, contractual negotiations, due diligence and other activities. It would not bepossible to respond to these kinds within the timeframe described in the directive.
– There is a concern that some institutions would receive a large volume of re-use requestsfrom members of the public, and that responding to these requests would be a significantuse of staff effort.
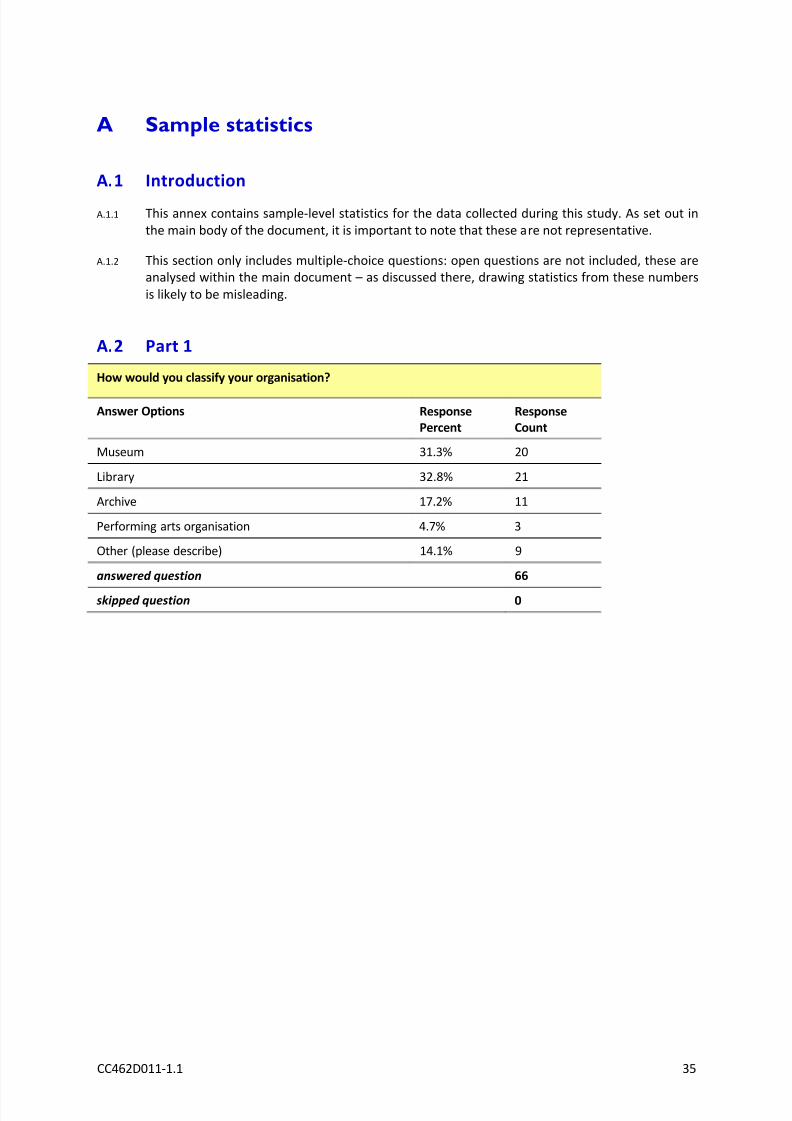
8/6/2019 PSI Re-use in the Cultural Sector
http://slidepdf.com/reader/full/psi-re-use-in-the-cultural-sector 37/43
CC462D011-1.1 35
A.1 Introduction
A.1.1 This annex contains sample-level statistics for the data collected during this study. As set out inthe main body of the document, it is important to note that these are not representative.
A.1.2 This section only includes multiple-choice questions: open questions are not included, these areanalysed within the main document – as discussed there, drawing statistics from these numbers
is likely to be misleading.
A.2 Part 1
How would you classify your organisation?
Answer Options Response
Percent
Response
Count
Museum 31.3% 20
Library 32.8% 21
Archive 17.2% 11
Performing arts organisation 4.7% 3
Other (please describe) 14.1% 9
answered question 66
skipped question 0

8/6/2019 PSI Re-use in the Cultural Sector
http://slidepdf.com/reader/full/psi-re-use-in-the-cultural-sector 38/43
36 CC462D011-1.1
What material do you hold (please select all that apply)?
Answer Options Physical
objects
Digital
objects
Digital
surrogates
Metadata Contextual
content
Response
Count
Public recordsand archivaldocuments of any kind(includinggenealogicalrecords)
54 23 33 40 23 55
Databases 31 42 19 41 18 56
Photographs andimages
58 38 47 48 31 62
Paintings and/ordrawings 46 16 34 39 23 49
Books 62 24 28 47 22 64
Periodicalarticles
47 20 20 36 14 51
Newspapers andmagazines
56 22 24 39 14 58
Other printedmaterials
44 15 24 32 13 47
Sculpture 25 5 19 23 15 27
Historical objects 40 7 27 27 18 43
Audio or Movingpicture(video/film)recordings
46 27 26 33 14 50
Other (please describe) 18
answered question 70
skipped question 6
Does your organisation undertake any re-use activities?
Answer Options Response
Percent
Response
Count
Yes 72.9% 43
No, but we are planning to 16.9% 6
No, and we do not intend to 10.2% 10
answered question 59
skipped question 7

8/6/2019 PSI Re-use in the Cultural Sector
http://slidepdf.com/reader/full/psi-re-use-in-the-cultural-sector 39/43
CC462D011-1.1 37
A.3 Part 2
How would you classify your organisation?
Answer Options ResponsePercent
ResponseCount
Museum 31.4% 11
Library 31.4% 11
Archive 17.1% 6
Performing arts organisation 2.9% 1
Other (please describe) 17.1% 6
answered question 35
skipped question 0
What proportion of your holdings is covered by 3rd-party Intellectual Property Rights
(where somebody other than you owns the Intellectual Property)?
Answer Options ResponsePercent
ResponseCount
None - either we own the IPR for all of our holdings, or itis out-of-copyright
2.9% 1
Some individual items 14.3% 5
Some collections 51.4% 18
Most collections 28.6% 10
All of our holdings 2.9% 1
We do not know 0.0% 0
answered question 35
skipped question 0
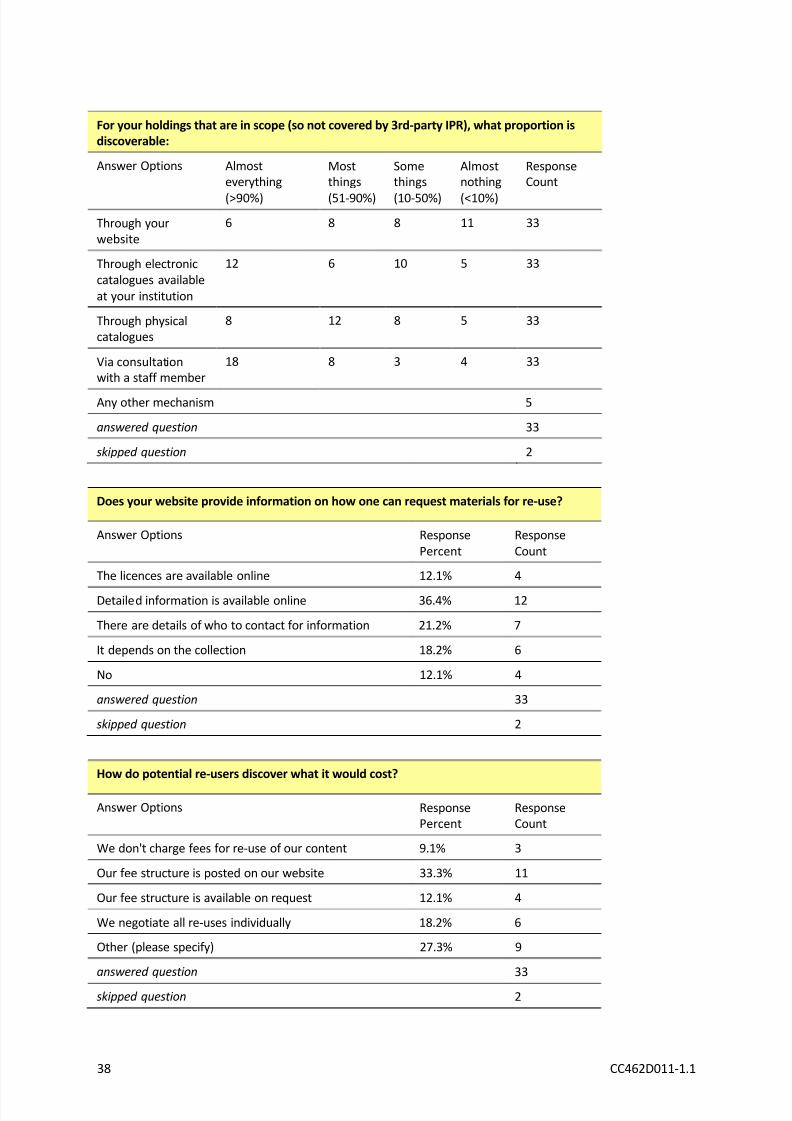
8/6/2019 PSI Re-use in the Cultural Sector
http://slidepdf.com/reader/full/psi-re-use-in-the-cultural-sector 40/43
38 CC462D011-1.1
For your holdings that are in scope (so not covered by 3rd-party IPR), what proportion is
discoverable:
Answer Options Almosteverything
(>90%)
Mostthings
(51-90%)
Somethings
(10-50%)
Almostnothing
(<10%)
ResponseCount
Through yourwebsite
6 8 8 11 33
Through electroniccatalogues availableat your institution
12 6 10 5 33
Through physicalcatalogues
8 12 8 5 33
Via consultationwith a staff member
18 8 3 4 33
Any other mechanism 5
answered question 33
skipped question 2
Does your website provide information on how one can request materials for re-use?
Answer Options ResponsePercent
ResponseCount
The licences are available online 12.1% 4
Detailed information is available online 36.4% 12
There are details of who to contact for information 21.2% 7
It depends on the collection 18.2% 6
No 12.1% 4
answered question 33
skipped question 2
How do potential re-users discover what it would cost?
Answer Options ResponsePercent
ResponseCount
We don't charge fees for re-use of our content 9.1% 3
Our fee structure is posted on our website 33.3% 11
Our fee structure is available on request 12.1% 4
We negotiate all re-uses individually 18.2% 6
Other (please specify) 27.3% 9
answered question 33
skipped question 2

8/6/2019 PSI Re-use in the Cultural Sector
http://slidepdf.com/reader/full/psi-re-use-in-the-cultural-sector 41/43
CC462D011-1.1 39
How do you decide how much to charge?
Answer Options We charge a
commercialrate
We
chargefor costrecovery
We
charge atokenfee
It
dependson thecustomer
We do
notcharge
Response
Count
Always 6 8 1 9 3 26
For somecollections
7 9 4 12 7 21
Never 2 0 1 5 2 10
answered question 32
skipped question 3
Do you ever enter into exclusive licenses with re-users of your content?
Answer Options ResponsePercent
ResponseCount
No 75.8% 25
Yes - for individual items 6.1% 2
Yes - for entire collections 6.1% 2
Other (please specify) 12.1% 4
answered question 33
skipped question 2
How long does it take you to respond to a request to re-use your content?
Answer Options ResponsePercent
ResponseCount
It's immediate - licences (and payment if necessary) arehandled online automatically
12.1% 4
Less than 20 working days 81.8% 2721 working days or longer 3.0% 1
We don't receive any requests 3.0% 1
answered question 33
skipped question 2

8/6/2019 PSI Re-use in the Cultural Sector
http://slidepdf.com/reader/full/psi-re-use-in-the-cultural-sector 42/43
40 CC462D011-1.1
Direct re-use (direct to end-users)
Answer Options Yes No No - but we'replanning to
ResponseCount
Downloads of files of digital items - for afee or free of charge (images,documents, music files, video)
22 4 2 28
Timed access, rental or subscription tocollections of digital copies or databaseof content
7 19 1 27
Sale of customized collections madefrom digitized copies of items in yourcollection
15 12 1 28
Sale of physical reproductions through
your online store
16 9 3 28
Sale of physical reproductions throughyour on-site shop
16 10 1 27
Sale or licensing of educational and/orcontextual materials to support ourcore collection
13 13 2 28
Other (please specify) 5
answered question 29
skipped question 6
Re-use activities via a third party (the institution licenses rights to use its content or
other data to a third party, who in turn adds value and brings it to market)
Answer Options Yes No No - but we'replanning to
ResponseCount
Licensing of files of digital copies of items in your collection for use infilm, publication, broadcast,advertisement, merchandise, etc..
18 10 2 30
Licensing of ancillary content,commentary, or teaching toolsdeveloped to contextualize yourcollection
5 22 3 30
Licensing of rights to use a database(of content, of metadata, of usagestatistics, etc..)
7 20 3 30
Other (please specify) 6
answered question 30
skipped question 5

8/6/2019 PSI Re-use in the Cultural Sector
http://slidepdf.com/reader/full/psi-re-use-in-the-cultural-sector 43/43
What proportion of this income was from third-party re-use?
AnswerOptions
0% - weonly
selldirectlyto end-users
10% 20% 30% 40% 50% 60% 70% 80% 90% 100% Unknown ResponseCount
2005 12 3 1 0 0 1 0 0 1 0 3 9 30
2009 12 3 2 0 0 0 0 0 2 2 2 7 30
answered question 30
skipped question 5