Pseudo-static lateral earth pressures on broken- back ... · Pseudo-static lateral earth pressures...
12
Pseudo-static lateral earth pressures on broken- back retaining walls Abouzar Sadrekarimi Abstract: Displacement of retaining walls during earthquakes causes damage to the structures founded on their backfill. The displacement of the wall can be reduced by decreasing the lateral earth pressure applied on its back. This can be achieved in a broken-back wall as the size of the failure wedge formed behind the wall is reduced; therefore, the calcula- tion of lateral earth pressures is essential in assessing the safety of and designing broken-back retaining walls. In this study, a series of reduced-scale shaking table model experiments were performed on broken-back quay walls composed of concrete blocks with two different rear-face shapes. In comparison with a vertical-back wall, earth pressures increased at the upper forward (i.e., seaward) leaning rear-face segments of the wall, whereas they decreased at lower backward (i.e., landward) leaning elevations. Because of the wide application of the pseudo-static method of Mononobe–Okabe in engi- neering practice and design codes, lateral earth pressures have also been estimated using this approach. The comparison between the measured lateral earth pressures and those calculated using the Mononobe–Okabe method shows fairly good agreement in predicting the overall distribution of lateral active earth pressure during and after the shaking. Key words: Mononobe–Okabe method, retaining wall, lateral earth pressure, earthquake, shake table test, broken-back wall. Re ´sume ´: Le de ´placement des murs de soute `nement durant un se ´isme cause des dommages aux structures ayant des fonda- tions installe ´es sur le remblai de ces murs de soute `nement. Le de ´placement du mur peut e ˆtre re ´duit en diminuant la pres- sion late ´rale des terres applique ´es au dos du mur. Cette diminution peut e ˆtre accomplie par l’utilisation d’un mur a ` dos brise ´, puisque la zone de fracture forme ´e derrie `re le mur est re ´duite. Ainsi, il devient essentiel de calculer les pressions la- te ´rales des terres pour e ´valuer la se ´curite ´ et pour concevoir des murs de soute `nement a ` dos brise ´. Dans cette e ´tude, des es- sais a ` l’e ´chelle re ´duite a ` l’aide d’un mode `le de table a ` secousses sont effectue ´s sur des murs a ` dos brise ´ de quais faits de blocs de be ´ton avec deux formes de dos diffe ´rentes. Comparativement a ` un mur a ` dos vertical, la pression des terres aug- mente dans les sections de la face arrie `re du mur oriente ´es vers le devant et le haut (c.-a `-d. vers la mer), tandis que la pression des terres diminue dans les sections oriente ´es vers le derrie `re et vers le bas (c.-a `-d. vers le sol). Les pressions late ´- rales des terres sont aussi estime ´es a ` l’aide de l’approche pseudo-statique de Mononobe–Okabe, puisque cette approche est largement utilise ´e dans l’inge ´nierie et la conception. La comparaison entre les pressions late ´rales des terres mesure ´es et celles calcule ´es a ` l’aide de la me ´thode Mononobe–Okabe montre la concordance des re ´sultats a ` pre ´dire la distribution glo- bale des pressions late ´rales actives des terres pendant et apre `s les secousses. Mots-cle ´s : me ´thode Mononobe–Okabe, mur de soute `nement, pression late ´rale des terres, se ´isme, essai sur table a ` secous- ses, mur a ` dos brise ´. [Traduit par la Re ´daction] Introduction Retaining walls are one of the most important structures in ports and harbors, transportation systems, lifelines, and many other civil engineering facilities. However, these structures may suffer disastrous damage during earthquakes; for example, severe damage was incurred on quay walls dur- ing the 1964 Niigata earthquake in Niigata Port, Niigata, Ja- pan (Bureau of Ports and Harbours 1989), at Puerto Montt, Chile, during the Chilean earthquake of 1960 (Duke and Leeds 1963), and during the Lefkada, Greece, 2003 earth- quake (Gazetas et al. 2005). Similar failures happened after the 1995 Kobe, Japan, earthquake (Hamada and Wakamatsu 1996; Inagaki et al. 1996; Kamon et al. 1996) in which the displaced quay walls caused significant settlement of their backfill and damage to offshore facilities (e.g., cranes and rail tracks) and also collapsed the deck of the Nishinomiya Bridge, Japan. Such displacements have resulted primarily from the increased lateral earth pressures behind the walls (Seed and Whitman 1970; Pitilakis and Moutsakis 1989; Da- koulas and Gazetas 2008). Therefore, estimating the earth pressures acting on retaining walls is very important in eval- uating the seismic safety and design of the wall. However, predicting the earth pressure acting on a retain- ing wall during earthquakes is a complicated problem. Some simplified approaches have been proposed to calculate the earth loads on retaining walls (Coulomb 1776; Rankine 1857; Okabe 1924; Mononobe and Matsuo 1929; Caquot and Kerisel 1948; Steedman and Zeng 1990a; Wood 1973). Among them, Coulomb (1776) was the first one to study static lateral earth pressures on retaining walls. Later, Okabe Received 9 November 2007. Accepted 10 March 2010. Published on the NRC Research Press Web site at cgj.nrc.ca on 27 October 2010. A. Sadrekarimi. Golder Associates Ltd., 500–4260 Still Creek Dr., Burnaby, BC V5C 6C6, Canada (e-mail: [email protected]). 1247 Can. Geotech. J. 47: 1247–1258 (2010) doi:10.1139/T10-025 Published by NRC Research Press
Transcript of Pseudo-static lateral earth pressures on broken- back ... · Pseudo-static lateral earth pressures...

Pseudo-static lateral earth pressures on broken-back retaining walls
Abouzar Sadrekarimi
Abstract: Displacement of retaining walls during earthquakes causes damage to the structures founded on their backfill.The displacement of the wall can be reduced by decreasing the lateral earth pressure applied on its back. This can beachieved in a broken-back wall as the size of the failure wedge formed behind the wall is reduced; therefore, the calcula-tion of lateral earth pressures is essential in assessing the safety of and designing broken-back retaining walls. In thisstudy, a series of reduced-scale shaking table model experiments were performed on broken-back quay walls composed ofconcrete blocks with two different rear-face shapes. In comparison with a vertical-back wall, earth pressures increased atthe upper forward (i.e., seaward) leaning rear-face segments of the wall, whereas they decreased at lower backward (i.e.,landward) leaning elevations. Because of the wide application of the pseudo-static method of Mononobe–Okabe in engi-neering practice and design codes, lateral earth pressures have also been estimated using this approach. The comparisonbetween the measured lateral earth pressures and those calculated using the Mononobe–Okabe method shows fairly goodagreement in predicting the overall distribution of lateral active earth pressure during and after the shaking.
Key words: Mononobe–Okabe method, retaining wall, lateral earth pressure, earthquake, shake table test, broken-backwall.
Resume : Le deplacement des murs de soutenement durant un seisme cause des dommages aux structures ayant des fonda-tions installees sur le remblai de ces murs de soutenement. Le deplacement du mur peut etre reduit en diminuant la pres-sion laterale des terres appliquees au dos du mur. Cette diminution peut etre accomplie par l’utilisation d’un mur a dosbrise, puisque la zone de fracture formee derriere le mur est reduite. Ainsi, il devient essentiel de calculer les pressions la-terales des terres pour evaluer la securite et pour concevoir des murs de soutenement a dos brise. Dans cette etude, des es-sais a l’echelle reduite a l’aide d’un modele de table a secousses sont effectues sur des murs a dos brise de quais faits deblocs de beton avec deux formes de dos differentes. Comparativement a un mur a dos vertical, la pression des terres aug-mente dans les sections de la face arriere du mur orientees vers le devant et le haut (c.-a-d. vers la mer), tandis que lapression des terres diminue dans les sections orientees vers le derriere et vers le bas (c.-a-d. vers le sol). Les pressions late-rales des terres sont aussi estimees a l’aide de l’approche pseudo-statique de Mononobe–Okabe, puisque cette approche estlargement utilisee dans l’ingenierie et la conception. La comparaison entre les pressions laterales des terres mesurees etcelles calculees a l’aide de la methode Mononobe–Okabe montre la concordance des resultats a predire la distribution glo-bale des pressions laterales actives des terres pendant et apres les secousses.
Mots-cles : methode Mononobe–Okabe, mur de soutenement, pression laterale des terres, seisme, essai sur table a secous-ses, mur a dos brise.
[Traduit par la Redaction]
IntroductionRetaining walls are one of the most important structures
in ports and harbors, transportation systems, lifelines, andmany other civil engineering facilities. However, thesestructures may suffer disastrous damage during earthquakes;for example, severe damage was incurred on quay walls dur-ing the 1964 Niigata earthquake in Niigata Port, Niigata, Ja-pan (Bureau of Ports and Harbours 1989), at Puerto Montt,Chile, during the Chilean earthquake of 1960 (Duke andLeeds 1963), and during the Lefkada, Greece, 2003 earth-quake (Gazetas et al. 2005). Similar failures happened after
the 1995 Kobe, Japan, earthquake (Hamada and Wakamatsu1996; Inagaki et al. 1996; Kamon et al. 1996) in which thedisplaced quay walls caused significant settlement of theirbackfill and damage to offshore facilities (e.g., cranes andrail tracks) and also collapsed the deck of the NishinomiyaBridge, Japan. Such displacements have resulted primarilyfrom the increased lateral earth pressures behind the walls(Seed and Whitman 1970; Pitilakis and Moutsakis 1989; Da-koulas and Gazetas 2008). Therefore, estimating the earthpressures acting on retaining walls is very important in eval-uating the seismic safety and design of the wall.
However, predicting the earth pressure acting on a retain-ing wall during earthquakes is a complicated problem. Somesimplified approaches have been proposed to calculate theearth loads on retaining walls (Coulomb 1776; Rankine1857; Okabe 1924; Mononobe and Matsuo 1929; Caquotand Kerisel 1948; Steedman and Zeng 1990a; Wood 1973).Among them, Coulomb (1776) was the first one to studystatic lateral earth pressures on retaining walls. Later, Okabe
Received 9 November 2007. Accepted 10 March 2010.Published on the NRC Research Press Web site at cgj.nrc.ca on27 October 2010.
A. Sadrekarimi. Golder Associates Ltd., 500–4260 Still CreekDr., Burnaby, BC V5C 6C6, Canada (e-mail:[email protected]).
1247
Can. Geotech. J. 47: 1247–1258 (2010) doi:10.1139/T10-025 Published by NRC Research Press

(1924) and Mononobe and Matsuo (1929) extended Cou-lomb’s force equilibrium theory to consider seismic forcesas equivalent pseudo-static inertial forces by applying theearthquake loads as uniform coefficients of the weight ofthe active failure wedge. Their method is hereafter referredto as the M–O method.
Despite some limitations (Wood 1973; Steedman andZeng 1990a; Veletsos and Younan 1994; Kramer 1996; The-odorakopoulos et al. 2001a, 2001b), the M–O method isused widely in building codes and guidelines (e.g., ATC1978; NAVFAC 1982; U.S. Army Corps of Engineer 1989;NZS 1992 ; FHWA 1997; CSA 1998; Ministry of Transport,Japan 1999; ASCE 2000; EAU 1996 2000; FEMA 2000;PIANC 2001; CEN 2002; AASHTO 2006; IBC 2006; NTC2008) and has been the basic approach for seismic design ofretaining structures (Whitman and Christian 1990; Mylona-kis et al. 2007) because of its simplicity in practical applica-tions and reasonable prediction of the actual dynamicpressures acting on vertical-back walls (Mononobe and Mat-suo 1929; Ishii et al. 1960; Seed and Whitman 1970; Ichi-hara and Matsuzawa 1973; Sheriff et al. 1982; Ishibashi andFang 1987; Pitilakis and Moutsakis 1989; Ebeling et al.1992; Veletsos and Younan 1994; Fujiwara et al. 1999; Da-koulas and Gazetas 2008). However, all of the above studieshave focused on walls with vertical rear faces and very littledata is available regarding the effect of the wall’s rear-faceshape on lateral earth pressures and the application and per-formance of the M–O method for broken-back walls.
According to Fig. 1, compared with a vertical-back wall,a backward (i.e., landward) leaning wall has a smaller fail-ure wedge and therefore, a smaller lateral thrust to retain.Similarly, a larger failure wedge and lateral thrust form be-hind a forward (e.g., seaward for quay walls) leaning wall.However, in comparison to the more common vertical-backwalls, large backward-leaning gravity walls would be con-siderably more expensive as they would require significantamounts of material (e.g., concrete and steel reinforcement)to construct, may have soil bearing capacity problems due totheir heavier weight, and because of their larger mass,greater inertial forces would be applied on them duringearthquakes. A remedy to these limitations, while taking ad-vantage of the reduced lateral earth pressure on the back-ward-leaning rear face of the wall, is a broken-back wall. In abroken-back wall, the increasing lateral earth pressures at thedeeper elevations of the wall are reduced by the backward-leaning rear face of the wall, while the cost, weight, andmass of the wall are reduced by using a forward-leaningrear face for the wall at shallower elevations where lateralearth pressures are smaller. The stability of a broken-backretaining wall in comparison with that of a vertical-backwall is also improved as the center of gravity of the wallis drawn landwards, thereby increasing the stabilizing mo-ment and developing a higher friction between its base andthe foundation soil. However, to the author’s knowledge,the seismic response and performance of broken-back wallshave not been thoroughly investigated. In this paper, theearth pressures acting on reduced-scale broken-back modelquay walls are estimated using the pseudo-static method ofM–O and the results are compared with the measured earthpressures, to evaluate the M–O method for broken-backwalls. Hydrodynamic pressures on seawalls have been ex-
tensively studied (Westergaard 1933; Amano et al. 1956;Matsuo and Ohara 1960; Steedman and Zeng 1990b) andare not discussed in this paper.
Physical model experimentsReduced-scale shaking table model tests offer the advant-
age of simulating complex geotechnical engineering systemsunder controlled conditions, and they are used here to pro-vide a source for gaining insight into the behaviour of bro-ken-back retaining walls and confirming the M–O pseudo-static method for these walls. It has been found (e.g., Gibsonand Scott 1995; Hayashi et al. 1997) that the results of 1gshaking table tests agree reasonably well with those of cen-trifuge model experiments, thus conforming to scaling rela-tions, and if carefully performed, such tests can be used tostudy complicated soil–structure interaction problems.
Figure 2 shows the cross sections of the model walls.Wall type I has a larger broken-back hunch and the inflec-tion point of the wall’s rear face is at the mid-height of thewall, (block number 6), while wall type II has a smaller bro-ken-back hunch with the inflection point of the wall’s rearface at the lower one-third of its height (block number 3).Both walls are made of concrete blocks with a unit weightof 24 kN/m3. The concrete blocks have shear keys on theirtop and bottom surfaces to prevent any relative displace-ments between them and preserve the structural integrity ofthe wall.
InstrumentationFigure 2 also shows the miniature pore-water pressure, P,
total pressure, E, and acceleration, A, transducers, as well asthe high-resolution displacement transducers, L, that wereused to record the response of the model tests. The earthpressure transducers (model P325SV-05) were manufacturedby SSK Co. Ltd., Japan, and had a capacity of 98.1 kPa. Thepore-water pressure transducers (model BPR-A-50) weremanufactured by Kyowa, Japan, and had a capacity of50 kPa. Both sets of transducers were calibrated by immers-ing them in a cylindrical water tube. The water head wasraised in increments up to a maximum height of 2 m as themeasured earth and water pressures (e.g., see the figures inthe section titled ‘‘Testing procedure’’) were all less than9 kPa (<1 m head of water) in the model tests and the corre-sponding voltage changes were recorded to determine thecalibrations. These earth pressure and pore-water pressuretransducers showed a linear and repeatable variation with in-creasing water head and a resolution of about 0.2 kPa aftercalibration. On the rear face of walls, each pore-water pres-sure transducer was mounted beside a total pressure trans-ducer to find the effective lateral earth pressure. Thediaphragm diameters of the total pressure and pore-waterpressure transducers were 25 and 20 mm, respectively. Sand-filled small bags were placed on the diaphragm of the totalpressure transducers to distribute the pressures uniformlyand avoid stress concentrations caused by angular backfillparticles, and low air-entry filters covered the diaphragm sur-face of the pore-water pressure transducers to ensure mini-mum pore-water pressure response time after saturation.
The acceleration transducer was from Kyowa (modelASW-2GB) with a maximum capacity of 19.6 m/s2. Manu-
1248 Can. Geotech. J. Vol. 47, 2010
Published by NRC Research Press

facturer’s calibration was used for this transducer, whichwas confirmed by placing the acceleration transducer side-ways on a flat surface and measuring the acceleration ofgravity at that location. The displacement transducers wereDP-500C models from Tokyo Sokki Kenkyujo, Japan, witha capacity of 500 mm. These transducers were calibrated us-ing a caliper with a resolution of 0.01 mm. Dynamic dataloggers (model DRA-101C from Tokyo Sokki Kenkyujo)were used to record (at a frequency of 100 Hertz) and trans-fer the data to a personal computer.
MaterialsA silica sand with the specific gravity of particles, Gs =
2.658; maximum void ratio, emax = 0.943; minimum void ra-tio, emin = 0.603; and mean grain diameter D50 = 0.3 mmwas used as the subsoil beneath the model walls. To avoidbackfill liquefaction, each wall was backfilled with crushedlimestone having Gs = 2.630, emax = 0.960, emin = 0.670,D50 = 12 mm, and hydraulic conductivity, k = 0.5 m/s. Theaverage particle-size distributions of these materials are plot-ted in Fig. 3. A medium-to-coarse (D50 = 3 mm) crushedstone foundation with a thickness of about 2 cm was depos-ited on the subsoil sand before placing the wall to distributethe weight of the wall uniformly on the sand. A 4 cm thickquarry stone layer with a maximum particle size of 40 mmwas also placed in front of the wall’s toe (see Fig. 2).
Model preparationThe Plexiglas model container was 180 cm long, 45 cm
wide, and 70 cm high and was equipped with carbon dioxideand water inlets and outlets. The models were intended tosimulate a plane strain condition, thus the main concernwas to avoid side effects of the test container. This was ac-complished by polishing and lubricating the Plexiglas sidesof the container before each test. To achieve a wide rangeof subsoil sand relative densities while maintaining uniform-ity, the undercompaction moist tamping method (Ladd 1978)was adopted to prepare the subsoil. Ladd (1978) showed thatundercompaction would create more uniform moist-tampedspecimens. In this method, the difference in density betweensuccessive layers is defined as the ‘‘percent undercompac-tion.’’ Based on this value, the lower layers were initiallycompacted more loosely than the final target density so thatthe final density of each layer, even with the effects of com-paction of the successive overlying layers, would be equal tothe target density (Frost and Park 2003). The model subsoilwas constructed in four layers of equal height. For eachlayer, according to its undercompacted density, a predeter-
mined weight of moist sand (5% moisture content) was uni-formly poured into the model container and a tamping footand guide rail (resting on the sides of the model container)were used to compact and level each lift, working from theboundaries of the model towards the middle. A referencecollar attached to the tamping rod was adjusted prior to thecompaction of each layer to ensure that the tamping disccould not be advanced beyond the desired elevation duringcompaction of that layer. Initially, a light tamping forcewas used to distribute and seat the material uniformly in themold. The force was then increased gradually until the collaruniformly hit the top of the tamping rod guide rail. The sur-face of each lift was scarified before placement of the sub-sequent lift. To minimize evaporation of the moisture duringcompaction, predetermined weights of moist sand wereplaced in bins and covered with a lid before being used. Ta-ble 1 shows the percent undercompactions of the first moist-tamped subsoil sand layer and average subsoil relative den-sities produced in each model test. Note that using advancedimaging techniques, Frost and Park (2003) showed that thestandard deviation of relative density within a moist-tampedspecimen was about 6% for both loose and dense specimensprepared using a similar undercompaction method and sucha standard deviation may apply to the relative densities pro-duced for the subsoil sand in Table 1.
After completing the subsoil preparation, the medium-to-coarse crushed stone base was poured and leveled, then thefirst row of wall concrete blocks were placed gently fol-lowed by placing of the quarry stone layer in front of thewall’s toe (see Fig. 2). Similar to the saturation procedurein undrained triaxial testing (e.g., Chaney et al. 1979; Sladenand Handford 1987; Lacasse and Berre 1988), to ensure bet-ter saturation of the model and subsoil with water, carbondioxide gas was circulated first through the model from thelower inlet, followed by water circulation. Then, the rest ofthe wall concrete blocks were placed and the backfill waspoured into the container behind the wall to complete themodel. Using the same pluviation method and drop height,a uniform relative density of 52% was produced in the back-fill soil of the model tests. No wall movement was observedduring the preparation of the models. In field construction,loose shallow subsoil is usually excavated to place the wallon a relatively denser subsoil, which is why a caved subsoilprofile was constructed in these model tests.
Note that one of the major shortcomings of reduced-scale1g shaking table model tests is the reduced level of effectivestresses. This is a problem because the stress–strain–strengthcharacteristics of granular soils are substantially affected by
Fig. 1. Types of wall rear-face shapes (hatched area, wall; grey area, backfill soil failure wedge).
Sadrekarimi 1249
Published by NRC Research Press

dilatancy, which varies with effective stress level and den-sity (Verdugo and Ishihara 1996). Limited by the lower ef-fective stresses in reduced-scale 1g shaking table tests, theeffect of dilatancy can be dealt with by employing smallermodel relative densities (Ghalandarzadeh et al. 1998; Tow-hata et al. 1999). Here, the critical state soil mechanics andthe concept of state parameter, j (Roscoe and Poorooshasb1963; Jefferies and Been 2006), are used to quantify the ef-fects of dilatancy and compare model soil behaviour withthat in a prototype scale. With respect to Fig. 4, we assumedcritical state line (CSL) slopes, l (= De/Dlogp’, where e isvoid ratio, effective mean stress p’ = ½ð1þ 2KoÞ=3�s 0vo, coef-ficient of earth pressure at rest K0 = 1 – sinf, s 0v0 is initial
vertical effective stress, and f is internal friction angle)of –0.02 (for Banding sand (Castro et al. 1982) that is similarto the subsoil sand used here) and –0.053 (for Ticino sand(Sukumaran and Ashmawy 2001), which has a similar coef-ficient of uniformity and particle shapes (i.e., factors control-ling CSL, Kramer 1996) as the backfill soil used in thisstudy) for the subsoil sand and the crushed stone backfill,respectively, and a prototype to model dimensions scalingfactor of 25. Thus, the results of this study could be appliedto prototypes with subsoil relative densities about 8% largerthan those in Table 1 and a backfill relative density about25% larger than that used (52%) in these model experiments,as in this case similar j would be obtained for the subsoilsand and backfill in both the model and prototype.
Testing procedureA variety of model tests with different intensities of shaking
acceleration and subsoil relative densities were performed.Two different shapes of broken-back walls were tested. As thedominant frequency of shaking in earthquakes ranges from 2to 5 Hertz (Psarropoulos et al. 2005), in all of the model testsperformed in this study horizontal sinusoidal excitations witha constant frequency of 2.8 Hertz were applied for about10 seconds. The specifications of each model test are noted inTable 1, and Figs. 5 and 6 show example time histories of themeasured data in tests QW01 and QW06, respectively.
M–O lateral earth pressuresAccording to the International Building Code (IBC 2006)
the natural frequency of the retaining walls tested in this
Fig. 2. Model sections and instrumentations: (a) wall type I; (b) wall type II. Transducers: A, acceleration; E, total earth pressure; L, dis-placement; P, pore-water pressure.
Fig. 3. Average particle-size distributions of backfill and subsoilused in physical models of this study.
Table 1. Specifications of the model tests.
TestNo.
Walltype
Peak wallacceleration(g)
Subsoilrelativedensity(%)a
Undercompaction(%)b
QW1 I 0.25 90 2QW2 I 0.41 60 7QW3 I 0.18 10 15QW4 I 0.35 90 2QW5 II 0.20 90 2QW6 II 0.24 35 10QW7 II 0.13 35 10QW8 II 0.39 90 2
aA standard deviation of 6% may apply (Frost and Park 2003).bThese are the initial undercompaction values used in the first moist-
tamped subsoil sand layer. Percent undercompaction decreases in thesubsequent layers (Ladd 1978).
Fig. 4. Assumed critical state lines (CSL) and states of subsoil andbackfill in model, jmodel, and prototype, jprototype.
1250 Can. Geotech. J. Vol. 47, 2010
Published by NRC Research Press

study can be roughly calculated from the following equa-tion:
½1� f ¼ 20
H0:75
where f is the natural frequency in Hertz and H is the heightof the wall in metres. Using H = 0.44 m (see Fig. 2), a nat-ural frequency of 37 Hertz was obtained that is considerablylarger than the frequency of the input motion applied in
these model tests (2.8 Hertz); therefore, the soil–structuresystem of these models could be assumed to be rigid and theearth pressures could be determined using the M–O pseudo-static method (Zeng and Steedman 1993). In addition, as thefinal horizontal displacements of the model walls (e.g., seeFigs. 5 and 6) were all greater than 3H/1000 (& 1.3 mm),an active state was developed in the backfill soil during and
Fig. 5. Time histories of acceleration, total lateral pressures, pore-water pressures, and horizontal displacements in model test QW01.
Fig. 6. Time histories of acceleration, total lateral pressures, pore-water pressures, and horizontal displacements in model test QW06.
Sadrekarimi 1251
Published by NRC Research Press
after the shaking in these model tests (Matsuo et al. 1978)and thus, the M–O method was applicable to determine theactive earth pressures during and after the excitation.
In the M–O method, the horizontal effective active pres-sure acting on a wall with a cohesionless backfill is calcu-lated as follows:
½2� pAE ¼ KAEð1� ruÞðgsubÞz cosS
where KAE is the pseudo-static seismic active earth pressurecoefficient, ru is the excess pore-water pressure ratio(¼ uexcess=s
0vo, where uexcess is the excess pore-water pres-
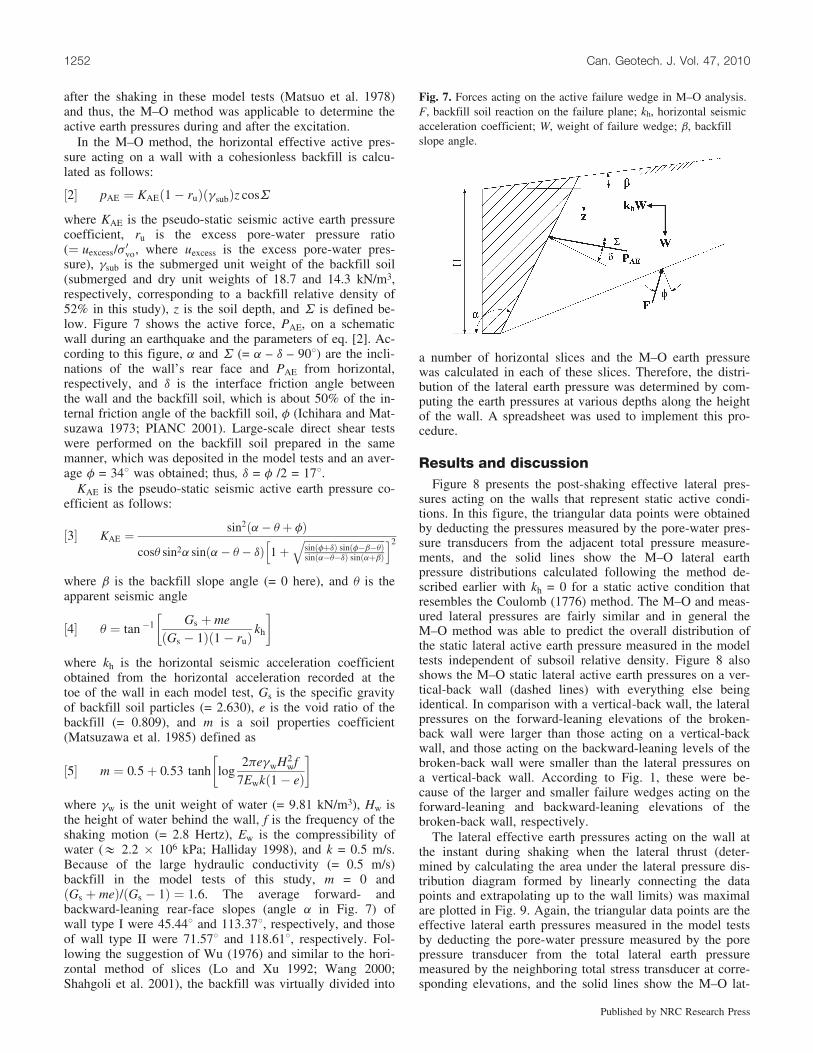
sure), gsub is the submerged unit weight of the backfill soil(submerged and dry unit weights of 18.7 and 14.3 kN/m3,respectively, corresponding to a backfill relative density of52% in this study), z is the soil depth, and S is defined be-low. Figure 7 shows the active force, PAE, on a schematicwall during an earthquake and the parameters of eq. [2]. Ac-cording to this figure, a and S (= a – d – 908) are the incli-nations of the wall’s rear face and PAE from horizontal,respectively, and d is the interface friction angle betweenthe wall and the backfill soil, which is about 50% of the in-ternal friction angle of the backfill soil, f (Ichihara and Mat-suzawa 1973; PIANC 2001). Large-scale direct shear testswere performed on the backfill soil prepared in the samemanner, which was deposited in the model tests and an aver-age f = 348 was obtained; thus, d = f /2 = 178.
KAE is the pseudo-static seismic active earth pressure co-efficient as follows:
½3� KAE ¼sin2ða� q þ fÞ
cosq sin2a sinða� q � dÞ 1þffiffiffiffiffiffiffiffiffiffiffiffiffiffiffiffiffiffiffiffiffiffiffiffiffiffiffiffiffiffiffisinðfþdÞ sinðf�b�qÞsinða�q�dÞ sinðaþbÞ
qh i2
where b is the backfill slope angle (= 0 here), and q is theapparent seismic angle
½4� q ¼ tan �1 Gs þ me
ðGs � 1Þð1� ruÞkh
� �
where kh is the horizontal seismic acceleration coefficientobtained from the horizontal acceleration recorded at thetoe of the wall in each model test, Gs is the specific gravityof backfill soil particles (= 2.630), e is the void ratio of thebackfill (= 0.809), and m is a soil properties coefficient(Matsuzawa et al. 1985) defined as
½5� m ¼ 0:5þ 0:53 tanh log2pegwH2
wf
7Ewkð1� eÞ
� �
where gw is the unit weight of water (= 9.81 kN/m3), Hw isthe height of water behind the wall, f is the frequency of theshaking motion (= 2.8 Hertz), Ew is the compressibility ofwater (& 2.2 � 106 kPa; Halliday 1998), and k = 0.5 m/s.Because of the large hydraulic conductivity (= 0.5 m/s)backfill in the model tests of this study, m = 0 andðGs þ meÞ=ðGs � 1Þ ¼ 1:6. The average forward- andbackward-leaning rear-face slopes (angle a in Fig. 7) ofwall type I were 45.448 and 113.378, respectively, and thoseof wall type II were 71.578 and 118.618, respectively. Fol-lowing the suggestion of Wu (1976) and similar to the hori-zontal method of slices (Lo and Xu 1992; Wang 2000;Shahgoli et al. 2001), the backfill was virtually divided into
a number of horizontal slices and the M–O earth pressurewas calculated in each of these slices. Therefore, the distri-bution of the lateral earth pressure was determined by com-puting the earth pressures at various depths along the heightof the wall. A spreadsheet was used to implement this pro-cedure.
Results and discussionFigure 8 presents the post-shaking effective lateral pres-
sures acting on the walls that represent static active condi-tions. In this figure, the triangular data points were obtainedby deducting the pressures measured by the pore-water pres-sure transducers from the adjacent total pressure measure-ments, and the solid lines show the M–O lateral earthpressure distributions calculated following the method de-scribed earlier with kh = 0 for a static active condition thatresembles the Coulomb (1776) method. The M–O and meas-ured lateral pressures are fairly similar and in general theM–O method was able to predict the overall distribution ofthe static lateral active earth pressure measured in the modeltests independent of subsoil relative density. Figure 8 alsoshows the M–O static lateral active earth pressures on a ver-tical-back wall (dashed lines) with everything else beingidentical. In comparison with a vertical-back wall, the lateralpressures on the forward-leaning elevations of the broken-back wall were larger than those acting on a vertical-backwall, and those acting on the backward-leaning levels of thebroken-back wall were smaller than the lateral pressures ona vertical-back wall. According to Fig. 1, these were be-cause of the larger and smaller failure wedges acting on theforward-leaning and backward-leaning elevations of thebroken-back wall, respectively.
The lateral effective earth pressures acting on the wall atthe instant during shaking when the lateral thrust (deter-mined by calculating the area under the lateral pressure dis-tribution diagram formed by linearly connecting the datapoints and extrapolating up to the wall limits) was maximalare plotted in Fig. 9. Again, the triangular data points are theeffective lateral earth pressures measured in the model testsby deducting the pore-water pressure measured by the porepressure transducer from the total lateral earth pressuremeasured by the neighboring total stress transducer at corre-sponding elevations, and the solid lines show the M–O lat-
Fig. 7. Forces acting on the active failure wedge in M–O analysis.F, backfill soil reaction on the failure plane; kh, horizontal seismicacceleration coefficient; W, weight of failure wedge; b, backfillslope angle.
1252 Can. Geotech. J. Vol. 47, 2010
Published by NRC Research Press

eral pressures. Note that because of the large hydraulic con-ductivity of the coarse backfill soil, the excess pore-waterpressure developed during shaking (associated with soilliquefaction) was negligible.
In both Figs. 8 and 9, due to the conversion from dry unitweight to submerged unit weight, the slope of the M–O lat-eral earth pressure distribution changes at the level of thewater surface. According to Fig. 9, the effective lateral earthpressures obtained by the M–O method agree with the meas-ured lateral pressures on the forward-leaning elevations ofthe wall. However, on the backward-leaning elevations, theM–O earth pressures tend to be larger (particularly in mod-els QW04, QW05, QW07, and QW08) than the measured
lateral pressures; this is likely because of the backfill soilarching between the subsoil sand and the wall and stress re-distribution around the lower parts of the wall leading tolower lateral stresses during the excitation period. Therewas less arching at the end of the tests (measured and M–Opressures agreed in Fig. 8) as sufficiently large wall dis-placements achieved at the end of shaking reduced the arch-ing action (Toyosawa et al. 2002). Despite arching effects,the M–O method captured the overall trend of the effectivelateral earth pressure distribution in the model tests inde-pendent of subsoil relative density and hence, it can be usedto provide a conservative estimate of the lateral thrust onbroken-back walls. Dakoulas and Gazetas (2008) also found
Fig. 8. Post-shaking effective lateral pressure distributions acting on the walls. Triangle symbols, physical model tests; solid lines, M–Opressures for broken-back walls with kh = 0; dashed lines, M–O pressures for vertical-back walls with kh = 0.
Sadrekarimi 1253
Published by NRC Research Press

that the applied earth pressures were independent of subsoilrelative density in effective stress dynamic analyses. Com-paring the M–O pressures for a vertical-back wall with thosecalculated (or measured) for the broken-back walls showsthat during the shaking period the effective lateral pressureson the forward-leaning elevations of the broken-back wallswere larger than those acting on a vertical-back wall, andthose acting on the backward-leaning levels of the broken-back walls were smaller than the lateral pressures on a vertical-back wall. This was because of the larger (or smaller) sizesof the failure wedges associated with the forward (or back-ward) leaning rear faces of the broken-back walls. Notethat triangular M–O pressure distributions have been used
here for the vertical-back wall and each of the forward-and backward-leaning segments of the broken-back walls,as the model walls of this study displaced sufficiently tomobilize a triangular lateral earth pressure distribution(Veletsos and Younan 1997; Dakoulas and Gazetas 2008).
Figures 10 and 11 compare the horizontal resultant thrustsacting on broken-back wall types I and II versus those on avertical-back wall, respectively. As described earlier, the lat-eral resultant thrusts were determined by calculating the areaof the pressure distribution diagrams.
Figure 10 shows that the post-shaking horizontal thrustacting on wall type I was more or less equal to that appliedon a vertical-back wall. However, a larger thrust was applied
Fig. 9. Effective lateral pressure distributions acting on the walls during shaking at the instant of maximum lateral thrust. Triangle symbols,physical model tests; solid lines, M–O pressures for broken-back walls; dashed lines, M–O pressures for vertical-back walls.
1254 Can. Geotech. J. Vol. 47, 2010
Published by NRC Research Press

on wall type I during shaking. Figure 11 shows that thepost-shaking lateral thrust measured on wall type II wasgreater than that applied on a vertical-back wall, and moreor less similar lateral thrusts were applied on wall type IIand a vertical-back wall during the excitation.
The overturning moment on the wall was calculated bymultiplying the horizontal thrust by the distance of its pointof application (centroid of the pressure distribution diagram)from the base of the wall. Figures 12 and 13 show the over-turning moments on wall types I and II versus those on avertical-back wall, respectively. Larger overturning momentswere applied on the broken-back walls when compared withthose on the vertical-back wall, both during and after theshaking period. This was because of the larger magnitudeand higher point of application of the resultant lateral thrustapplied on the broken-back walls.
Figures 10–13 also demonstrate that in the broken-backwalls tested in this study, the decrease in lateral pressuresalong the backward-leaning rear face of the wall was not
sufficient to compensate for the larger pressures on theforward-leaning rear face of the wall, resulting in larger (orequal) resultant thrusts and overturning moments on broken-back walls when compared with those acting on vertical-back walls. Therefore, the broken-back wall shapes in thisstudy were not effective in reducing the lateral thrusts andoverturning moments on the wall. To reduce the lateralthrust and overturning moment, the M–O method can beused to design the rear-face shape of a broken-back wall.Perhaps, if the forward-leaning rear faces of these broken-back walls were steeper (or even vertical), the resultant lat-eral thrusts and overturning moments could have beensmaller than those on a vertical-back wall.
Summary and conclusionsIn this paper, the earth pressures acting on broken-back
retaining walls were studied. The rear face of a broken-back
Fig. 10. Resultant lateral earth thrusts on broken-back (type I) andvertical-back walls. (Abscissa shows values of horizontal resultantthrusts acting on a vertical-back wall calculated by the M–Omethod. Horizontal resultant thrusts acting on the broken-back wallare plotted on the ordinate.)
Fig. 11. Resultant lateral earth thrusts on broken-back (type II) andvertical-back walls. (Abscissa shows values of horizontal resultantthrusts acting on a vertical-back wall calculated by the M–Omethod. Horizontal resultant thrusts acting on the broken-back wallare plotted on the ordinate.)
Fig. 13. Overturning moments on broken-back (type II) and verti-cal-back walls. (Abscissa shows values of overturning momentsacting on a vertical-back wall calculated by the M–O method.Overturning moments acting on the broken-back wall are plotted onthe ordinate.)
Fig. 12. Overturning moments on broken-back (type I) and verti-cal-back walls. (Abscissa shows values of overturning momentsacting on a vertical-back wall calculated by the M–O method.Overturning moments acting on the broken-back wall are plottedon the ordinate.)
Sadrekarimi 1255
Published by NRC Research Press

wall was divided into two parts: below the break where thewall’s rear face leans backwards toward the backfill andabove the break where the wall’s rear face leans forwardsaway from the backfill. Eight 1g reduced-scale shaking tablemodel experiments were performed on two types of broken-back walls. One of the walls had a larger hunch than theother, such that it had flatter forward- and backward-leaningrear faces and a larger backward-leaning rear-face segment.
The M–O pseudo-static method was used to estimate thelateral earth pressures acting on the broken-back walls bothduring and after the application of the shaking motion. Lat-eral earth pressures on a vertical-back model wall were alsocalculated using this method. These predictions were com-pared with the lateral earth pressures measured in the phys-ical model tests. The comparisons indicated that the M–Omethod was in general able to predict the magnitude andoverall distribution of the lateral active pressure measuredin the model tests after shaking (static active state) andsomewhat conservatively (due to the effects of soil arching)during shaking.
The results showed that when compared with a vertical-back wall, the lateral earth pressure was smaller on thebackward-leaning rear face and greater along the forward-leaning rear face of a broken-back wall. This was becauseof the larger and smaller soil failure wedges acting on theforward-leaning and backward-leaning elevations of thebroken-back wall, respectively.
The outcomes of this study indicate that the effective lat-eral thrust and overturning moment on a broken-back wallduring and after shaking can be controlled by the rear-faceshape of the wall and the M–O method can be used to de-sign the shape of a broken-back wall.
ReferencesAASHTO. 2006. Recommended LRFD guidelines for the seismic
design of highway bridges. American Association of State High-way and Transportation Officials (AASHTO), National Coopera-tive Highway Research Program (NCHRP), and TransportationResearch Board.
Amano, R., Azuma, H., and Ishii, Y. 1956. Aseismic design of wallsin Japan. In Proceedings of the 1st World Conference on Earth-quake Engineering, Berkeley, Calif. Earthquake Engineering Re-search Institute, San Francisco, Calif. pp. 1–17. Paper No. 32.
ASCE. 2000. Seismic analysis of safety related nuclear structuresand commentary. ASCE standard 4-98. American Society of Ci-vil Engineers, Reston, Va.
ATC. 1978. Tentative provisions for the development of seismicregulations for buildings. Applied Technology Council (ATC),Berkeley, Calif. Report No. ATC-3-06.
Bureau of Ports and Harbours 1989. Earthquake resistant design forquay walls and piers in Japan. Ministry of Transportation, To-kyo, Japan.
Caquot, A., and Kerisel, J. 1948. Tables for the calculation of pas-sive pressure, active pressure and bearing capacity of founda-tions. (Translated from French by Maurice A. Bec.) Gauthier-Villars, Paris.
Castro, A., Poulos, S. J., France, J. W., and Enos, J. L. 1982. Lique-faction induced by cyclic loading. Report to the National ScienceFoundation, Washington, D.C. Report No. NSF/CEE-82018.
CEN. 2002. Eurocode 7 geotechnical design — Part 1: Generalrules. Standard EN 1997. CEN European Committee for Stan-dardization, Bruxelles, Belgium.
Chaney, R.C., Stevens, E., and Sheth, N. 1979. Suggested testmethod for determination of degree of saturation of soil samplesby B value measurement. Geotechnical Testing Journal, 2(3):158–162. doi:10.1520/GTJ10448J.
Coulomb, C.A. 1776. Essai sur une application des regles des max-imis et minimis a quelques problemes de statique relatifs a l’ar-chitecture. In Memoires Academie Royale Presentes par DiversSavants, Paris. Vol. 7, pp. 343–382.
CSA. 1998. Canadian highway bridge design code. Canadian Stan-dards Association, Mississauga, Ont.
Dakoulas, P., and Gazetas, G. 2008. Insight into seismic earth andwater pressures against caisson quay walls. Geotechnique, 58(2):95–111. doi:10.1680/geot.2008.58.2.95.
Duke, C.M., and Leeds, D.J. 1963. Response of soils, foundations,and earth structures. Bulletin of the Seismological Society ofAmerica, 53(2): 309–357.
EAU 1996. 2000. Recommendations of the Committee for Water-front Structures, Harbours, and Waterways. 7th ed. Ernst &Sohn, Berlin, Germany.
Ebeling, R.M., Morrison, E.E., Whitman, R.V., and Finn, L.W.D.1992. A manual for seismic design of waterfront retaining struc-tures. US Army Corps of Engineers, Washington, D.C. Techni-cal report ITL-92-11.
FEMA. 2000. The 2000 NEHRP recommended provisions for newbuildings and other structures. Part 2: Commentary. FEMA 369.Federal Emergency Management Agency, Hyattsville, Md.
FHWA. 1997. Design guidance: Geotechnical earthquake engineer-ing for highways, design principles. Geotechnical engineeringcircular No. 3, FHWA-SA-97-076, Vol. 1. Federal Highway Ad-ministration, U.S. Department of Transportation, Washington,D.C.
Frost, J.D., and Park, J.-Y. 2003. A critical assessment of the moisttamping technique. Geotechnical Testing Journal, 26(1): 1–14.doi:10.1520/GTJ11108J.
Fujiwara, T., Horikoshi, K., and Sueoka, T. 1999. Centrifuge mod-eling of dynamic earth pressure acting on gravity type wall dur-ing large earthquake. In Proceedings of the 2nd InternationalConference On Earthquake Geotechnical Engineering, Lisbon,Portugal, 21–25 June 1999. Balkema, Rotterdam, the Nether-lands. Vol. 1, pp. 401–406.
Gazetas, G., Anastasopoulos, I., and Dakoulas, P. 2005. Failure ofharbour quay walls in the Lefkada 2003 earthquake. In Perfor-mance Based Design in Earthquake Geotechnical Engineering:Concepts and Research, Proceedings of the GeotechnicalEarthquake Engineering Satellite Conference, Osaka, Japan, 10September 2005. Japanese Geotechnical Society, Tokyo.pp. 62–69.
Ghalandarzadeh, A., Orita, T., Towhata, I., and Yun, F. 1998.Shaking table tests on seismic deformation of gravity quaywalls. Soils and Foundations 2: 115–132.
Gibson, A.D., and Scott, R.F. 1995. Comparison of a 1g and centri-fuge model dynamic liquefaction test: Preliminary results. InProceedings of the First International Conference on EarthquakeGeotechnical Engineering, Tokyo, Japan, 14–16 November1995. Edited by K. Ishihara. Balkema, Rotterdam, the Nether-lands. pp. 773–778.
Halliday, D. 1998. Fundamentals of physics. 5th ed. John Wileyand Sons Inc., London. pp. 1176
Hamada, M., and Wakamatsu, K. 1996. Liquefaction, ground de-formation and their caused damage to structures. In The 1995Hyogoken–Nanbu Earthquake. Committee of Earthquake Engi-neering, Japan Society of Civil Engineers, Tokyo, Japan.pp. 45–91.
Hayashi, K., Fujii, N., Murakami, T., and Houjyou, K. 1997. Direct
1256 Can. Geotech. J. Vol. 47, 2010
Published by NRC Research Press

comparison of gravity model and centrifuge model for the seis-mic problem. Journal of Geotechnical Engineering, Japan So-ciety of Civil Engineers, 41: 207–216.
IBC. 2006. International Building Code. International Code Coun-cil, Country Club Hills, Ill.
Ichihara, M., and Matsuzawa, H. 1973. Earth pressure during earth-quake. Soils and Foundations, 13(4): 75–86.
Inagaki, H., Iai, S., Sugano, T.,Yamazaki, H., and Inatomi, T. 1996.Performance of caisson type quay walls at Kobe port. Soils andFoundations, 1(Special issue on geotechnical aspects of the Jan-uary 17, 1995 Hyogoken–Nambu earthquake): 119–136.
Ishibashi, I., and Fang, Y.-S. 1987. Dynamic earth pressures with dif-ferent wall movement modes. Soils and Foundations, 27(4): 11–22.
Ishii, Y., Arai, H., and Tsuchida, H. 1960. Lateral earth pressure inan earthquake. In Proceedings of the 2nd World Conference onEarthquake Engineering, Tokyo, Japan, 11–18 July 1960.Science Council of Japan, Tokyo, Japan. pp. 211–230.
Jefferies, M.G., and Been, L. 2006. Soil liquefaction — a criticalstate approach. Taylor & Francis, London.
Kamon, M., Wako, T., Isemura, K., Sawa, K., Mimura, M., Ta-teyama, K., and Kobayashi, S. 1996. Geotechnical disasters onthe waterfront. Soils and Foundations, 1(Special issue on geo-technical aspects of the January 17, 1995 Hyogoken–Nambuearthquake): 137–147.
Kramer, S.L. 1996. Geotechnical Earthquake Engineering. Prentice-Hall, Inc., Englewood Cliffs, N.J.
Lacasse, S., and Berre, T. 1988. State-of-the-art paper: triaxial test-ing methods for soils. In Advanced triaxial testing of soil androck. STP 977. Edited by R.T. Donaghe, R.C. Chaney, andM.L. Silver. American Society for Testing and Materials, WestConshohocken, Pa. pp. 264–289.
Ladd, R.S. 1978. Preparing specimens using undercompaction.Geotechnical Testing Journal, 1(1): 16–23. doi:10.1520/GTJ10364J.
Lo, S.-C.R., and Xu, D.-W. 1992. A strain-based method for thecollapse limit state of reinforced soil walls or slopes. CanadianGeotechnical Journal, 29(5): 832–842. doi:10.1139/t92-090.
Matsuo, M., and Ohara, S. 1960. Lateral earth pressure and stabi-lity of quay walls during earthquakes. In Proceedings of the 2ndWorld Conference on Earthquake Engineering, Tokyo, Japan,11–18 July 1960. Science Council of Japan, Tokyo, Japan. Vol.1, pp. 165–181.
Matsuo, M., Kenmochi, S., and Yagi, H. 1978. Experimental studyon earth pressure of retaining wall by field tests. Soils and Foun-dations, 18(3): 27–41.
Matsuzawa, H., Ishibashi, I., and Kawamura, M. 1985. Dynamicsoil and water pressures of submerged soils. Journal of Geotech-nical Engineering, 111(10): 1161–1176. doi:10.1061/(ASCE)0733-9410(1985)111:10(1161).
Ministry of Transport, Japan. 1999. Design standards for ports andharbor facilities and commentaries. Japan Port and Harbour As-sociation, Tokyo. [In Japanese.] (English edition (2001) by theOversea Coastal Area Development Institute of Japan.)
Mononobe, N. and Matsuo, M. 1929. On the determination of earthpressures during earthquakes. In Proceedings of the World Engi-neering Congress, Tokyo, Japan, October–November 1929. In-ternational Association for Earthquake Engineering, Japan. Vol.9, pp. 177–185.
Mylonakis, G., Kloukinas, P., and Papantonopoulos, C. 2007. Analternative to the Mononobe–Okabe equations for seismic earthpressures. Soil Dynamics and Earthquake Engineering, 27(10):957–969. doi:10.1016/j.soildyn.2007.01.004.
NAVFAC. 1982. Foundations and earth structures. Design manual7.2. U.S. Department of the Navy, Alexandria, Va.
NTC. 2008. Approvazione delle nuove norme tecniche per le cost-ruzioni. Gazzetta Ufficiale della Repubblica Italiana, n. 29 del 4febbraio 2008 - Suppl. Ordinario n. 30, Italian Building Code.[In Italian.]
NZS. 1992. General structural design loadings for buildings. Stan-dard NZS 4203. New Zealand Standards, Wellington, New Zeal-and.
Okabe, S. 1924. General theory of earth pressure and seismic stabi-lity of retaining wall and dam. Journal of the Japanese Societyof Civil Engineers, 10(5): 1277–1323.
PIANC. 2001. Seismic design guidelines for port structures, Inter-national Navigation Institute (PIANC), Tokyo. A. A. Balkema,Rotterdam, the Netherlands.
Pitilakis, K., and Moutsakis, A. 1989. Seismic analysis and beha-vior of gravity retaining walls — the case of Kalamata harborquaywall. Soils and Foundations, 29(1): 1–17.
Psarropoulos, P.N., Klonaris, G., and Gazetas, G. 2005. Seismicearth pressures on rigid and flexible retaining walls. Soil Dy-namics and Earthquake Engineering, 25(7–10): 795–809.doi:10.1016/j.soildyn.2004.11.020.
Rankine, W.J.M. 1857. On the stability of loose earth. Philosophi-cal Transactions of the Royal Society of London, 147(1 Janu-ary): 9–27. doi:10.1098/rstl.1857.0003.
Roscoe, K.H., and Poorooshasb, H.B. 1963. A theoretical and ex-perimental study of strains in triaxial tests on normally consoli-dated clays. Geotechnique, 13(1): 12–38. doi:10.1680/geot.1963.13.1.12.
Seed, H.B., and Whitman, R.V. 1970. Design of earth retainingstructures for dynamic loads. In Proceedings of the ASCE Speci-alty Conference on Lateral Stresses in the Ground and Design ofEarth Retaining Structures, Ithaca, N.Y., 22–24 June 1970.American Society of Civil Engineers (ASCE), New York.pp. 103–147.
Shahgoli, M., Fakher, A., and Jones, C.J.F.P. 2001. Horizontal slicemethod of analysis. Geotechnique, 51(10): 881–885.
Sheriff, M.A., Ishibashi, I., and Lee, C.D. 1982. Earth pressuresagainst rigid retaining walls. Journal of Geotechnical Engineer-ing, 108(GT5): 679–696.
Sladen, J.A., and Handford, G. 1987. A potential systematic errorin laboratory testing if very loose sands. Canadian GeotechnicalJournal, 24(3): 462–466. doi:10.1139/t87-058.
Steedman, R.S., and Zeng, X. 1990a. The influence of phase on thecalculation of pseudo-static earth pressure on a retaining wall.Geotechnique, 40(1): 103–112. doi:10.1680/geot.1990.40.1.103.
Steedman, R.S., and Zeng, X. 1990b. Hydrodynamic pressures on aflexible quay wall. In Proceedings of the First European confer-ence on structural dynamics, Bochum, Germany, 5–7 June 1990.Edited by W.B. Kratzig, O.T. Bruhms, H.L. Jessberger, K. Mes-kouris, H.J. Niemann, G. Schmid, F. Stangenberg, A.N. Kouna-dis, and G.I. Schueller. A.A. Balkema, Rotterdam, theNetherlands. pp. 843–850.
Sukumaran, B., and Ashmawy, A.K. 2001. Quantitative characteri-sation of the geometry of discrete particles. Geotechnique,51(7): 619–627. doi:10.1680/geot.2001.51.7.619.
Theodorakopoulos, D.D., Chassiakos, A.P., and Beskos, D.E.2001a. Dynamic pressures on rigid cantilever walls retainingporoelastic soil media. Part I: first method of solution. Soil Dy-namics and Earthquake Engineering, 21(4): 315–338. doi:10.1016/S0267-7261(01)00009-4.
Theodorakopoulos, D.D., Chassiakos, A.P., and Beskos, D.E.2001b. Dynamic pressures on rigid cantilever walls retainingporoelastic soil media. Part II: second method of solution. SoilDynamics and Earthquake Engineering, 21(4): 339–364. doi:10.1016/S0267-7261(01)00010-0.
Sadrekarimi 1257
Published by NRC Research Press

Towhata, I., Vargas-Monge, W., Orense, R.P., and Yao, M. 1999.Shaking table tests on subgrade reaction of pipe embedded insandy liquefied subsoil. Soil Dynamics and Earthquake Engi-neering, 18(5): 347–361. doi:10.1016/S0267-7261(99)00008-1.
Toyosawa, Y., Horii, N., Tamate, S., Suemasa, N., Katada, T., andIchikawa, T. 2002. Lateral earth pressures with wall movementsin centrifuge tests (sands). In Proceedings of the InternationalConference on Physical Modeling in Geotechnics, St John’s,N.L., 10–12 July 2002. Balkema, Rotterdam, the Netherlands.Vol. 1, pp. 881–885.
U.S. Army Corps of Engineer. 1989. Engineering and design: Re-taining and floodwalls. Engineering manual 1110-2-2502, U.S.Army Corps of Engineers, Washington, D.C.
Veletsos, A.S., and Younan, A.H. 1994. Dynamic soil pressures onrigid vertical walls. Earthquake Engineering and Structural Dy-namics, 23(3): 275–301. doi:10.1002/eqe.4290230305.
Veletsos, A.S., and Younan, A.H. 1997. Dynamic response of can-tilever retaining walls. Journal of Geotechnical and Geoenviron-mental Engineering, 123(2): 161–172. doi:10.1061/(ASCE)1090-0241(1997)123:2(161).
Verdugo, R., and Ishihara, K. 1996. The steady state of sandy soils.Soils and Foundations, 36(2): 81–91.
Wang, Y.Z. 2000. Distribution of earth pressure on a retaining wall.Geotechnique, 50(1): 83–88. doi:10.1680/geot.2000.50.1.83.
Westergaard, H.M. 1933. Water pressure on dams during earth-quakes. Transactions of the American Society of Civil Engi-neers, 98: 418–472.
Whitman, R.V., and Christian, J.T. 1990. Seismic response of re-taining structures. In Proceedings of the Port of Los AngelesSeismic Workshop on Seismic Engineering, San Pedro, Calif.,21–23 March 1990. Edited by R.C. Wittcop and G.R. Martin.Port of Los Angeles, Los Angeles, Calif. pp. 427–452.
Wood, J.H. 1973. Earthquake induced soil pressures on structures.Ph.D. dissertation, California Institute of Technology, Pasadena,Calif.
Wu, T.H. 1976. Soil mechanics. 2nd ed. Allyn and Bacon, Boston,Mass.
Zeng, X., and Steedman, R.S. 1993. On the behavior of quay wallsin earthquakes. Geotechnique, 43(3): 417–431. doi:10.1680/geot.1993.43.3.417.
1258 Can. Geotech. J. Vol. 47, 2010
Published by NRC Research Press