PSAK 68 Fair Value Measurement - Website Staff...
54
PSAK 68 Fair Value Measurement (Adopted from IFRS 13)
Transcript of PSAK 68 Fair Value Measurement - Website Staff...
PSAK 68 Fair Value Measurement
(Adopted from IFRS 13)

Page 2
Agenda
► Objectives & Transition Rule
► Scope
► Measurement
► Fair Value Measurement Approach
► The Asset & Liability
► Highest & Best Use and Valuation Premise
► Principal Market or Most Advantageous Market
► Market Participants
► The Transaction
► Valuation Techniques
► Fair Value Hierarchy
► Disclosures
PSAK 68 Fair Value Measurement

Page 3
Objectives and transition rule
► IASB’s objectives for issuing IFRS 13:
A. Clarifies definition of fair value.
B. Provide single framework for how to measure fair value
i. Previously, requirements were dispersed throughout IFRS and were not consistent.
ii. Does not change when fair value is required.
C. Increases disclosures about fair value measurements, especially non-financial
assets.
► Transition rule:
1. Effective for annual periods beginning on or after January 1, 2015
2. Applied prospectively as of beginning of annual period
3. Disclosures are not required for comparative periods
PSAK 68 Fair Value Measurement
Page 4
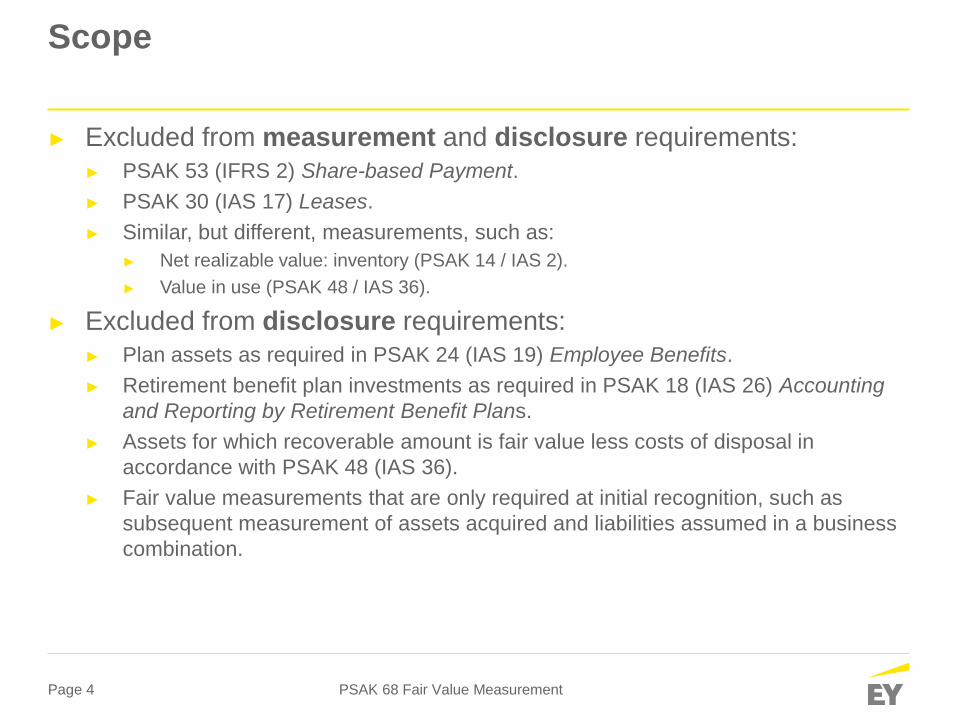
Scope
► Excluded from measurement and disclosure requirements:
► PSAK 53 (IFRS 2) Share-based Payment.
► PSAK 30 (IAS 17) Leases.
► Similar, but different, measurements, such as:
► Net realizable value: inventory (PSAK 14 / IAS 2).
► Value in use (PSAK 48 / IAS 36).
► Excluded from disclosure requirements:
► Plan assets as required in PSAK 24 (IAS 19) Employee Benefits.
► Retirement benefit plan investments as required in PSAK 18 (IAS 26) Accounting
and Reporting by Retirement Benefit Plans.
► Assets for which recoverable amount is fair value less costs of disposal in
accordance with PSAK 48 (IAS 36).
► Fair value measurements that are only required at initial recognition, such as
subsequent measurement of assets acquired and liabilities assumed in a business
combination.
PSAK 68 Fair Value Measurement
Page 5
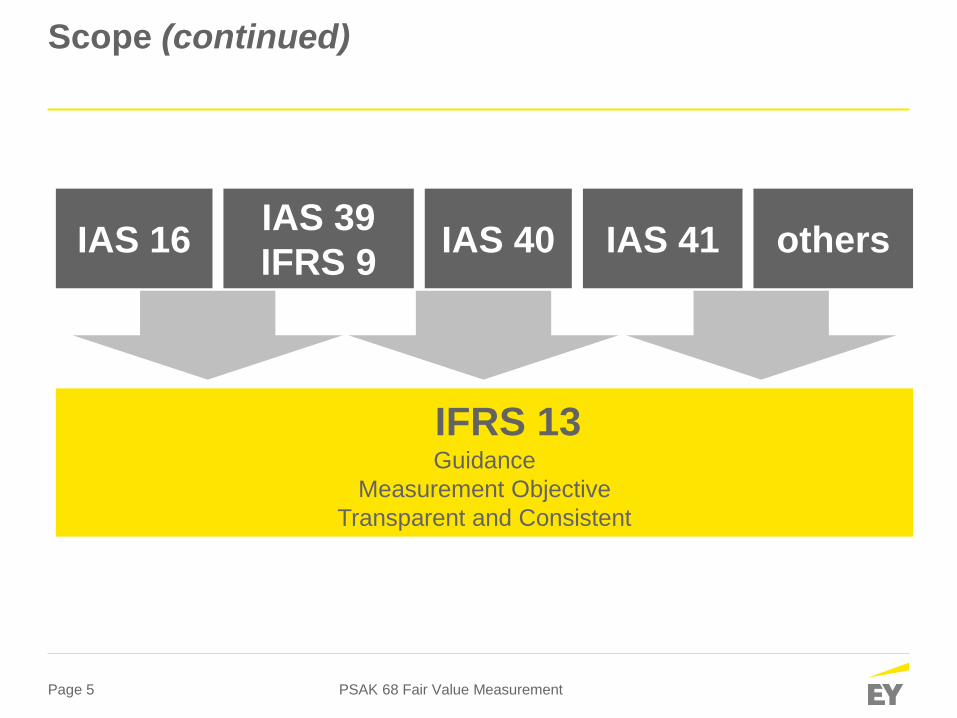
Scope (continued)
PSAK 68 Fair Value Measurement
IAS 16 IAS 39
IFRS 9 IAS 40 IAS 41 others
IFRS 13 Guidance
Measurement Objective
Transparent and Consistent

Page 6
Measurement
PSAK 68 Fair Value Measurement
Before IFRS 13
New Fair value
definition
The price that
would be received
to sell an asset
or paid to
transfer a
liability in an
orderly
transaction
between market
participants at
the
measurement
date.
Its
improvements
It specifies that the
entity is selling the
asset.
It refers to the
transfer of a liability.
It is not a forced or
distressed sale.
It is clear it is
market-based.
It states explicitly
when the sale or
transfer takes place.
Fair value
definition
The amount for
which an asset
could be
exchanged or a
liability settled
between
knowledgeable,
willing parties in
an arms length
transaction
Its
weaknesses
It did not specify
whether an entity is
buying or selling the
asset.
It was unclear about
what settling meant
because it did not
refer to the creditor.
It was unclear about
whether it was
market-based.
It did not state
explicitly when the
exchange or
settlement takes
place.
?

Page 7
Measurement (continued)
PSAK 68 Fair Value Measurement
Fair value: price that
would be received to sell
an asset or paid to
transfer a liability in an
orderly transaction
between market
participants at the
measurement date (an
exit price)
Framework
Page 8
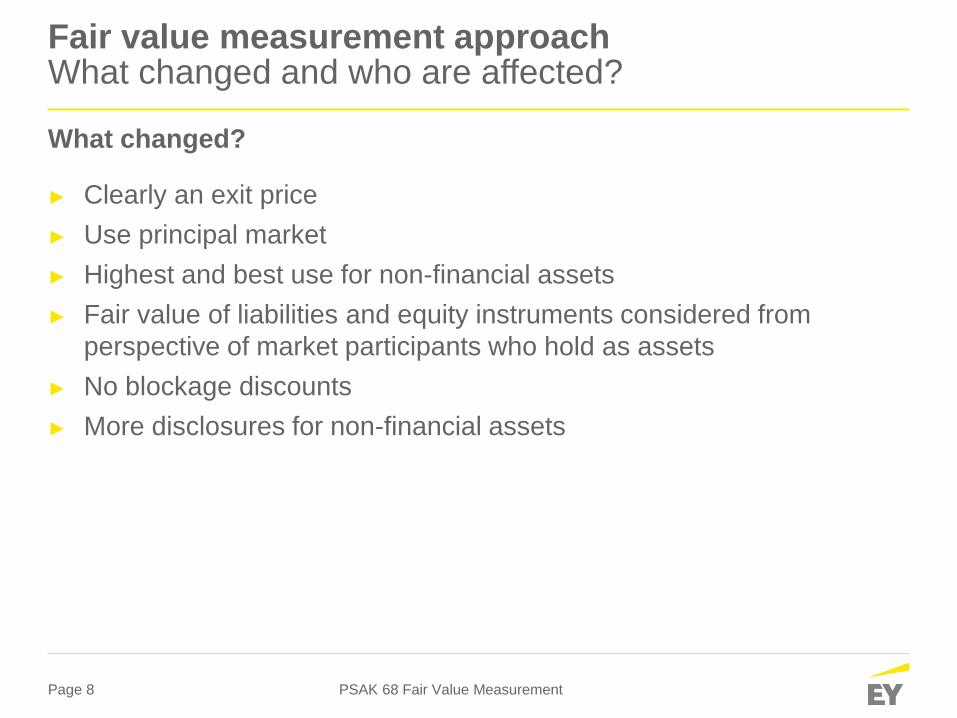
Fair value measurement approach What changed and who are affected?
What changed?
► Clearly an exit price
► Use principal market
► Highest and best use for non-financial assets
► Fair value of liabilities and equity instruments considered from
perspective of market participants who hold as assets
► No blockage discounts
► More disclosures for non-financial assets
PSAK 68 Fair Value Measurement
Page 9
Fair value measurement approach (continued)
Transaction costs are:
► Not included in a fair value measurement
► Not a characteristic of an asset or a liability
► Specific to a transaction and differ depending on how an entity enters
into a transaction for the asset or liability
► Accounted for in accordance with other IFRS
Transaction costs are:
If location is a characteristic of the asset, the price in the principal (or
most advantageous) market is adjusted for the costs incurred to transport
the asset from its current location to that market.
Relevant for commodities, agricultural produce, biological assets
PSAK 68 Fair Value Measurement

Page 10
Fair value measurement approach (continued)
► Credit Valuation Adjustment (CVA)
Is an adjustment to the measurement of derivative assets to reflect the default
(credit) risk of the counterparty
► Debit Valuation Adjustment (DVA)
Is an adjustment to the measurement of derivative liabilities to reflect the own
default (credit) risk of the entity
► Own Credit Adjustment (OCA)
Is an adjustment made to issued debt instruments designated at fair value to
reflect the default (credit) risk of the reporting entity
PSAK 68 Fair Value Measurement

Page 11
The asset or liability
► Asset or liability measured at fair value might be:
► A stand-alone asset or liability
► A group of assets, a group of liabilities or a group of assets and liabilities
► Examples:
► Condition and location of the asset
► Restrictions on the sale or use of the asset
► Unit of account is determined in accordance with the IFRS that
requires or permits fair value measurement
PSAK 68 Fair Value Measurement
Characteristics of asset or liability are considered if market
participants would consider those characteristics when pricing the
asset or liability at the measurement date.
Page 12
The asset or liability continued
Illustrative example 1a: Consideration of condition and location
Fact pattern: An entity owns a forest where the trees take approximately 25 years to
mature, after which they can be cut down and sold. The average age of the trees in the
forest is 14 years at the end of the reporting period.
The current use of the forest is presumed to be its highest and best use. There is no
market for the trees in their current form (i.e., 14 years old), but, there is a market for the
harvested timber from trees aged 25 years or older.
Analysis: To measure the fair value of the forest, the entity uses an income approach and
uses the price for 25 year-old harvested timber in the market today as an input. Since the
trees are not yet ready for harvest, the cash flows must be adjusted for the costs a market
participant would incur.
Thus, the estimated cash flows would include costs to manage the forest (including
fertilizing and pruning the trees) until they reach maturity; costs to harvest the trees; and
costs to transport the harvested logs to the market. The entity estimates these costs using
market participant assumptions.
PSAK 68 Fair Value Measurement

Page 13
The asset or liability continued
Illustrative example 1a: Consideration of condition and location
continued
The entity also adjusts the value for a normal profit margin because a market participant
acquiring the forest today would expect to be compensated for the cost and effort of
managing the forest for the 11 years before the trees will be harvested and the timber is
sold (i.e., this would include compensation for costs incurred and a normal profit margin for
the effort of managing the forest).
Illustrative example 1b: Entity-specific restrictions on assets
Fact pattern: A donor of land specifies that the land must be used by a sporting
association as a playground in perpetuity. Upon review of relevant documentation, the
association determines that the donor’s restriction would not transfer to market participants
if the association sold the asset (i.e., the restriction on the use of the land is specific to the
association).
Furthermore, the association is not restricted from selling the land. Without the restriction
on the use of the land, it could be used as a site for residential development. In addition,
the land is subject to an easement (a legal right that enables a utility to run power lines
across the land).
PSAK 68 Fair Value Measurement
Page 14
The asset or liability continued
Illustrative example 1b: Entity-specific restrictions on assets continued
The entity also adjusts the value for a normal profit margin because a market participant
acquiring the forest today would expect to be compensated for the cost and effort of
managing the forest for the 11 years before the trees will be harvested and the timber is
sold (i.e., this would include compensation for costs incurred and a normal profit margin for
the effort of managing the forest).
Illustrative example 1b: Entity-specific restrictions on assets
Fact pattern: A donor of land specifies that the land must be used by a sporting
association as a playground in perpetuity. Upon review of relevant documentation, the
association determines that the donor’s restriction would not transfer to market participants
if the association sold the asset (i.e., the restriction on the use of the land is specific to the
association).
Furthermore, the association is not restricted from selling the land. Without the restriction
on the use of the land, it could be used as a site for residential development. In addition,
the land is subject to an easement (a legal right that enables a utility to run power lines
across the land).
PSAK 68 Fair Value Measurement
Page 15
The asset or liability continued
Illustrative example 1b: Entity-specific restrictions on assets continued
Analysis: Under these circumstances, the effect of the restriction and the easement on
the fair value measurement of the land is as follows:
a) Donor restriction on use of land — The donor restriction on the use of the land is
specific to the association and thus would not transfer to market participants.
Therefore, regardless of the restriction on the use of the land by the association, the
fair value of the land would be measured based on the higher of its indicated value:
i. As a playground (i.e., the maximum value of the land is through its use in combination with
other assets or with other assets and liabilities), or
ii. As a residential development (i.e., the fair value of the asset would be maximized through its
use by market participants on a standalone basis)
b) Easement for utility lines — Because the easement for utility lines is a characteristic of
the land, this easement would be transferred to market participants with the land. The
fair value of the land would include the effect of the easement, regardless of whether
the land’s valuation premise is as a playground or as a site for residential development.
PSAK 68 Fair Value Measurement

Page 16
Highest and best use & valuation premise
The highest and best use of a non-financial asset might provide
maximum value to market participants through its valuation premise to
be used:
► In combination with other assets and/or liabilities,
► Assumed that the complementary assets and liabilities would be available to
market participants
► Complementary liabilities include liabilities that fund working capital, but do not
include liabilities to fund assets other than those within the group
► Assumptions for highest and best use must be consistent for all assets and/or
liabilities of the group
► on a stand-alone basis.
A fair value measurement assumes asset is sold based on applicable
unit of account
PSAK 68 Fair Value Measurement
Highest and best use is a valuation concept that considers how
market participants would use a non-financial asset to maximize its
benefit or value.
Page 17
Highest and best use & valuation premise continued
► Its highest and best use considers a use that is:
► Physically possible
► Legally permissible
► Financially feasible
► Current use is presumed to be highest and best use, unless factors
suggest that a different use would maximize the value of the asset
► Highest and best use is always considered when measuring fair
value, even if entity intends a different use
► Disclose the reason(s) that the asset is being used in a manner that differs from its
highest and best use
PSAK 68 Fair Value Measurement
Page 18
Highest and best use & valuation premise
Illustrative example 2a: Highest and best use vs current use
Fact pattern: An entity acquires land in a business combination, which is currently
developed for industrial use as a site for a factory, and therefore is presumed to be its
highest and best use unless market or other factors suggest a different use. Nearby sites
have recently been developed for residential use as sites for high-rise apartment buildings.
Analysis: Accordingly, the entity determines that the land could be developed as a site for
residential use because market participants would take into account the potential to
develop the site for residential use when pricing the land.
The highest and best use of the land would be determined based on the higher of those
values, CU 4,000,000 as a manufacturing operation and CU 5,000,000 as a vacant site
that can be used for residential purposes.
In order to convert the land from a manufacturing operation to a vacant site for residential
use, the manufacturing facility must be removed with demolition and other costs of CU
500,000, and thus the fair value of the land as a vacant lot for residential use would be CU
4,500,000, and therefore considered to be its highest and best use.
PSAK 68 Fair Value Measurement
Page 19
Highest and best use & valuation premise continued
Illustrative example 2b: Consistent assumptions about highest and best
use in an asset group (Important note: the example is using IAS 41 pre-
bearer plants amendment)
Fact pattern: A wine producer owns and manages a vineyard and produces its own wine
on site. The vines are measured at fair value less costs to sell in accordance with IAS 41
at the end of each reporting period. The grapes are measured at the point of harvest at fair
value less costs to sell in accordance with IAS 41 (being its cost when transferred to IAS
2).
The wine producer elects to measure its land using IAS 16’s revaluation model. All other
non-financial assets are measured at cost.
At the end of the reporting period, the entity assesses the highest and best use of the
vines and the land from the perspective of market participants, either at their current use,
or to be converted into residential property, which would include removing the vines and
plant and equipment from the land.
PSAK 68 Fair Value Measurement
Page 20
Highest and best use & valuation premise continued
Illustrative example 2b: Consistent assumptions about highest and best
use in an asset group continued
Analysis:
Scenario A - The entity determines that the highest and best use of these assets is their
current use. Thus, the highest and best use of all non-financial assets in the group is to
produce and sell wine, even if conversion into residential property might yield a higher
value for the land on its own.
Scenario B - The entity determines that the highest and best use of these assets is to
convert the land into residential property, even if the current use might yield a higher value
for the vines on their own.
The entity would need to consider what a market participant would do to convert the land,
such as the cost of rezoning, selling cuttings from the vines or simply removing the vines,
and the sale of the buildings and equipment either individually or as an asset group. Since
the highest and best use of these assets is not their current use, the entity would disclose
that fact, as well as the reason why those assets are being used in a manner that differs
from their highest and best use.
PSAK 68 Fair Value Measurement

Page 21
Principal market or most advantageous market
PSAK 68 Fair Value Measurement
Most advantageous market:
The market that maximizes the amount that would be received to sell
the asset or minimizes the amount that would be paid to transfer the
liability, after taking into account transaction costs and transport costs
Principal market:
The market with the greatest volume and level of activity for the asset
or liability.
a) Entity must have access to the principal market at the
measurement date
b) Rebuttable presumption that the principal market is the market in
which the entity normally transacts
Page 22
Principal market or most advantageous market
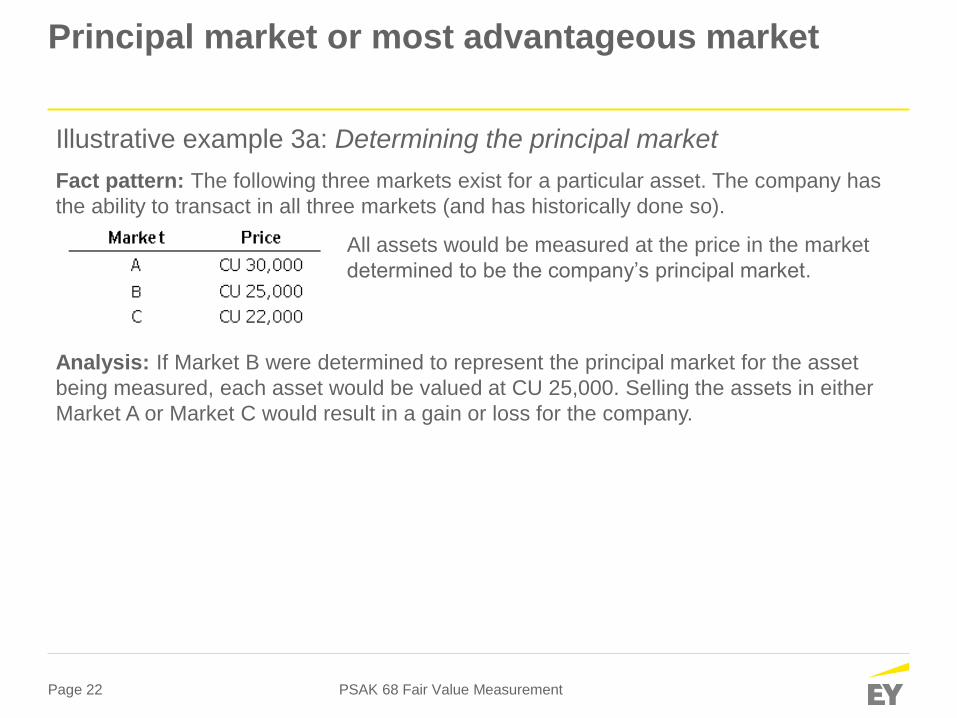
Illustrative example 3a: Determining the principal market
Fact pattern: The following three markets exist for a particular asset. The company has
the ability to transact in all three markets (and has historically done so).
All assets would be measured at the price in the market
determined to be the company’s principal market.
Analysis: If Market B were determined to represent the principal market for the asset
being measured, each asset would be valued at CU 25,000. Selling the assets in either
Market A or Market C would result in a gain or loss for the company.
PSAK 68 Fair Value Measurement

Page 23
Principal market or most advantageous market continued
Illustrative example 3b: Determining the most advantageous market
Fact pattern: If neither market is the principal market for the asset the fair value of the
asset would be measured using the price in the most advantageous market.
The most advantageous market is the market that maximizes the amount that would be
received to sell the asset, after taking into account transaction costs and transport costs
(i.e., the net amount that would be received in the respective markets).
Analysis:
Because the entity would maximize the net amount that would be received for the asset in
Market B (CU 22), that is the most advantageous market.
Market B is the most advantageous market even though the fair value that would be
recognized in that market (CU 23 = CU 25 – CU 2) is lower than in Market A (CU 24 = CU
26 — CU 2).
PSAK 68 Fair Value Measurement
Page 24
Market participants
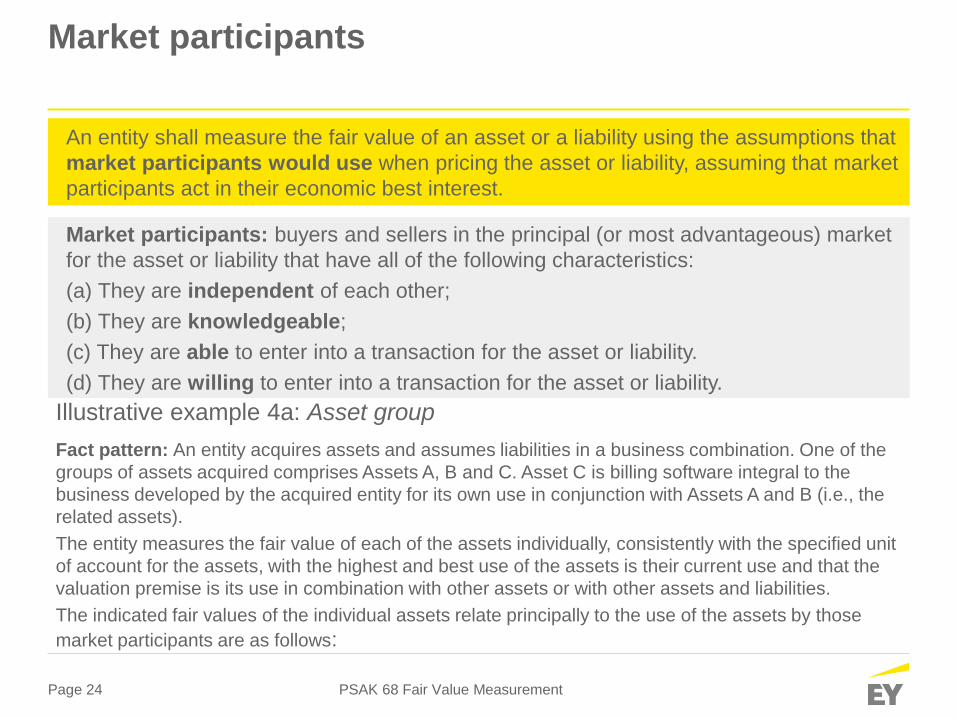
Illustrative example 4a: Asset group
Fact pattern: An entity acquires assets and assumes liabilities in a business combination. One of the
groups of assets acquired comprises Assets A, B and C. Asset C is billing software integral to the
business developed by the acquired entity for its own use in conjunction with Assets A and B (i.e., the
related assets).
The entity measures the fair value of each of the assets individually, consistently with the specified unit
of account for the assets, with the highest and best use of the assets is their current use and that the
valuation premise is its use in combination with other assets or with other assets and liabilities.
The indicated fair values of the individual assets relate principally to the use of the assets by those
market participants are as follows:
PSAK 68 Fair Value Measurement
An entity shall measure the fair value of an asset or a liability using the assumptions that
market participants would use when pricing the asset or liability, assuming that market
participants act in their economic best interest.
Market participants: buyers and sellers in the principal (or most advantageous) market
for the asset or liability that have all of the following characteristics:
(a) They are independent of each other;
(b) They are knowledgeable;
(c) They are able to enter into a transaction for the asset or liability.
(d) They are willing to enter into a transaction for the asset or liability.

Page 25
Market participants continued
Illustrative example 4a: Asset group continued
Analysis:
► Strategic buyer asset group — Assumed as to have related assets that would enhance the value of
the group within which the assets would be used, which include a substitute asset for Asset C (the
billing software) that would be used for only a limited transition period and could not be sold on its
own at the end of that period.
The indicated fair values of Assets A, B and C (reflecting the synergies resulting from the use of the
assets within that group) are CU 360, CU 260 and CU 30, respectively, while the indicated fair value
of the assets as a group is CU 650.
► Financial buyer asset group — Assume as do not have related or substitute assets that would
enhance the value of the group within which the assets would be used, and therefore Asset C would
be used for its full remaining economic life.
The indicated fair values of Assets A, B and C within the financial buyer asset group are CU 300, CU
200 and CU 100, respectively, while the indicated fair value of the assets as a group is CU 600.
The fair values of Assets A, B and C would be determined on the basis of the use of the assets as a
group within the strategic buyer group (CU 360, CU 260 and CU 30). Although the use of the assets
within the strategic buyer group does not maximize the fair value of each of the assets individually, it
maximizes the fair value of the assets as a group (CU 650).
PSAK 68 Fair Value Measurement
Page 26
The transaction
PSAK 68 Fair Value Measurement
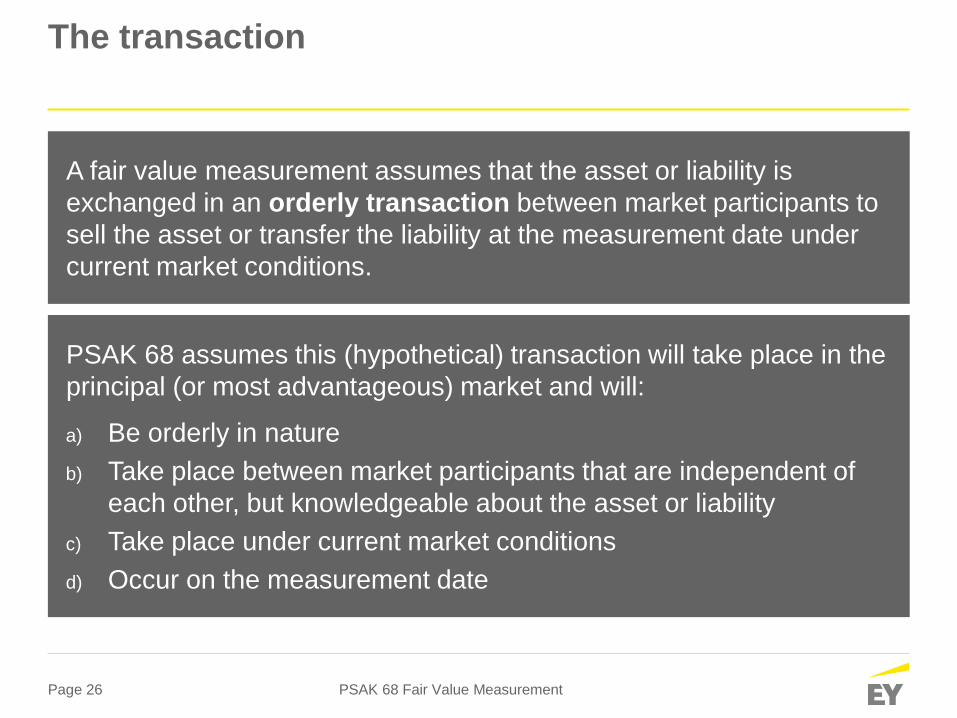
PSAK 68 assumes this (hypothetical) transaction will take place in the
principal (or most advantageous) market and will:
a) Be orderly in nature
b) Take place between market participants that are independent of
each other, but knowledgeable about the asset or liability
c) Take place under current market conditions
d) Occur on the measurement date
A fair value measurement assumes that the asset or liability is
exchanged in an orderly transaction between market participants to
sell the asset or transfer the liability at the measurement date under
current market conditions.

Page 27
The transaction continued
Illustrative example 5a: Estimating a market rate of return when the volume or
level of activity for an asset has significantly decreased
Fact pattern: Entity A invests in a junior AAA-rated tranche of a residential mortgage-backed security
on 1 January 20X8 (the issue date of the security). The underlying collateral for the residential
mortgage-backed security is unguaranteed non-conforming residential mortgage loans that were issued
in the second half of 20X6.
At 31 March 20X9 (the measurement date) the junior tranche is now A-rated, and the trading volume in
that market was infrequent, with only a few transactions taking place per month from 1 January 20X8 to
30 June 20X8 and little, if any, trading activity during the nine months before 31 March 20X9.
Entity A concludes that the volume and level of activity of the junior tranche of the residential mortgage-
backed security have significantly decreased, as it is judged that there was little, if any, trading activity
for an extended period before the measurement date.
Analysis: Accordingly, Entity A decides to use an income approach by applying the discount rate
adjustment technique to the contractual cash flows to measure the fair value of the financial asset at the
measurement date. The discount rate is estimated by Entity A as follows:
a) Starts with the risk-free rate of interest, at 300 basis points,
b) Apply estimated adjustments for differences between the available market data and the financial
asset that reflect available market data about expected non-performance and other risks
PSAK 68 Fair Value Measurement
Page 28
The transaction continued
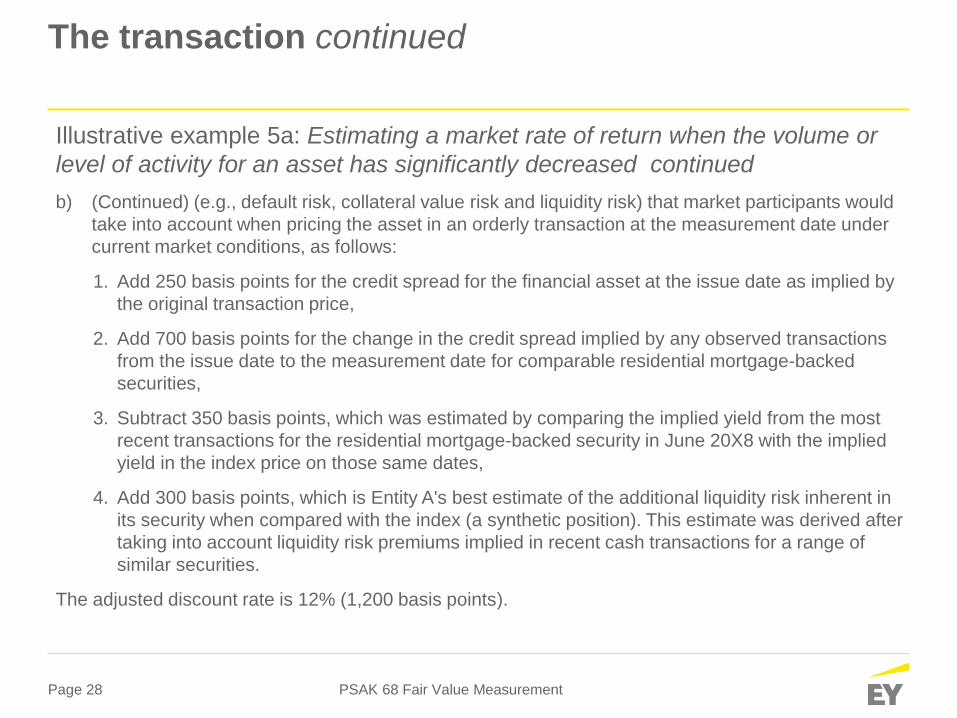
Illustrative example 5a: Estimating a market rate of return when the volume or
level of activity for an asset has significantly decreased continued
b) (Continued) (e.g., default risk, collateral value risk and liquidity risk) that market participants would
take into account when pricing the asset in an orderly transaction at the measurement date under
current market conditions, as follows:
1. Add 250 basis points for the credit spread for the financial asset at the issue date as implied by
the original transaction price,
2. Add 700 basis points for the change in the credit spread implied by any observed transactions
from the issue date to the measurement date for comparable residential mortgage-backed
securities,
3. Subtract 350 basis points, which was estimated by comparing the implied yield from the most
recent transactions for the residential mortgage-backed security in June 20X8 with the implied
yield in the index price on those same dates,
4. Add 300 basis points, which is Entity A's best estimate of the additional liquidity risk inherent in
its security when compared with the index (a synthetic position). This estimate was derived after
taking into account liquidity risk premiums implied in recent cash transactions for a range of
similar securities.
The adjusted discount rate is 12% (1,200 basis points).
PSAK 68 Fair Value Measurement

Page 29
Valuation techniques
PSAK 68 Fair Value Measurement
► Might use one or several valuation techniques
► If range of values are indicated, select point within that range most representative
of fair value
► Change in valuation technique = change in estimate
► BUT disclosures for change in accounting estimate are not required
An entity shall use valuation techniques that are:
a) appropriate in the circumstances,
b) for which sufficient data are available,
c) maximizing the use of relevant observable inputs, and
d) minimizing the use of unobservable inputs.
Three widely used valuation techniques are the market approach, the cost
approach and the income approach.
Page 30
Valuation techniques continued
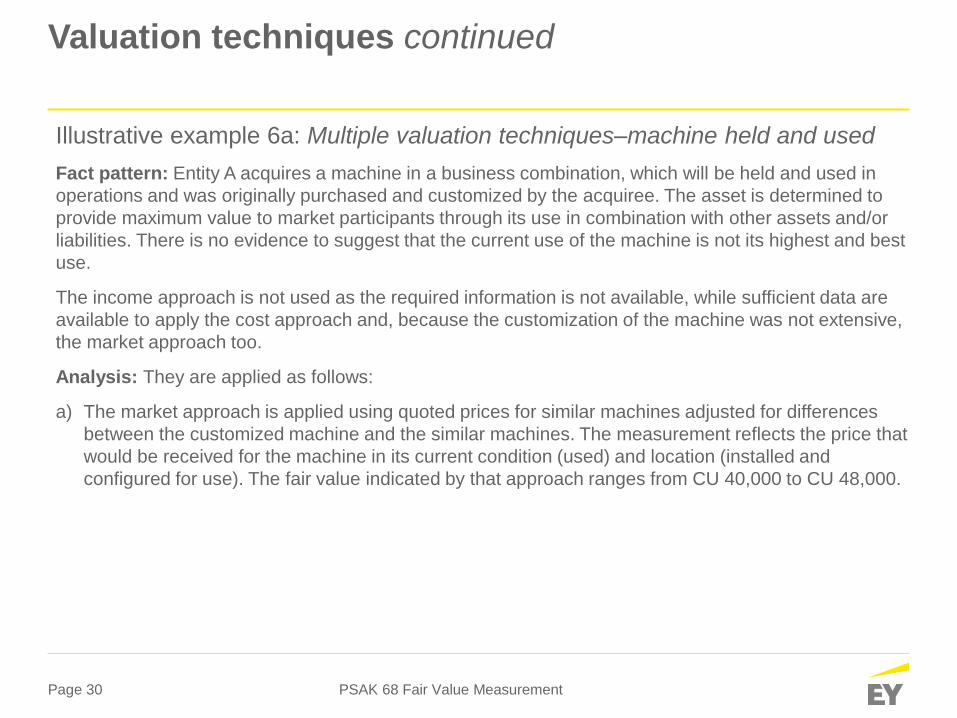
Illustrative example 6a: Multiple valuation techniques–machine held and used
Fact pattern: Entity A acquires a machine in a business combination, which will be held and used in
operations and was originally purchased and customized by the acquiree. The asset is determined to
provide maximum value to market participants through its use in combination with other assets and/or
liabilities. There is no evidence to suggest that the current use of the machine is not its highest and best
use.
The income approach is not used as the required information is not available, while sufficient data are
available to apply the cost approach and, because the customization of the machine was not extensive,
the market approach too.
Analysis: They are applied as follows:
a) The market approach is applied using quoted prices for similar machines adjusted for differences
between the customized machine and the similar machines. The measurement reflects the price that
would be received for the machine in its current condition (used) and location (installed and
configured for use). The fair value indicated by that approach ranges from CU 40,000 to CU 48,000.
PSAK 68 Fair Value Measurement
Page 31
Valuation techniques continued
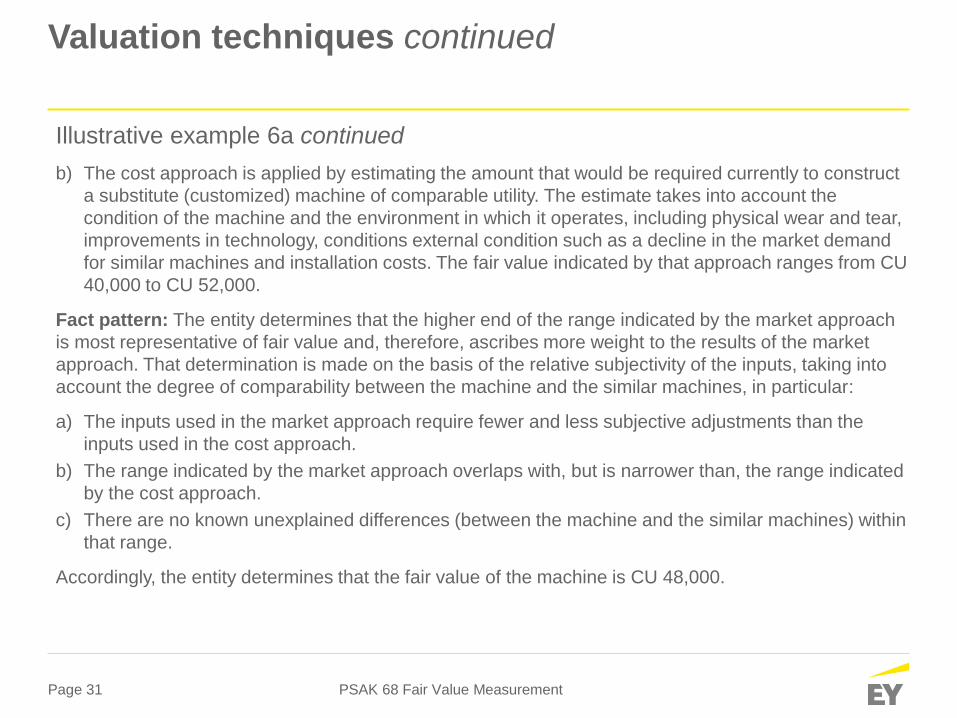
Illustrative example 6a continued
b) The cost approach is applied by estimating the amount that would be required currently to construct
a substitute (customized) machine of comparable utility. The estimate takes into account the
condition of the machine and the environment in which it operates, including physical wear and tear,
improvements in technology, conditions external condition such as a decline in the market demand
for similar machines and installation costs. The fair value indicated by that approach ranges from CU
40,000 to CU 52,000.
Fact pattern: The entity determines that the higher end of the range indicated by the market approach
is most representative of fair value and, therefore, ascribes more weight to the results of the market
approach. That determination is made on the basis of the relative subjectivity of the inputs, taking into
account the degree of comparability between the machine and the similar machines, in particular:
a) The inputs used in the market approach require fewer and less subjective adjustments than the
inputs used in the cost approach.
b) The range indicated by the market approach overlaps with, but is narrower than, the range indicated
by the cost approach.
c) There are no known unexplained differences (between the machine and the similar machines) within
that range.
Accordingly, the entity determines that the fair value of the machine is CU 48,000.
PSAK 68 Fair Value Measurement

Page 32
Valuation techniques continued
PSAK 68 Fair Value Measurement
The income approach converts future amounts (eg cash flows or income and expenses)
to a single current (ie discounted) amount.
This technique includes present value technique, option pricing models and the multi-
period excess earnings method.
The cost approach reflects the amount that would be required currently to replace the
service capacity of an asset (often referred to as current replacement cost), and is
typically used to measure the fair value of tangible assets, such as plant or equipment.
From the perspective of a market participant seller, the price that would be received for
the asset is based on the cost to a market participant buyer to acquire or construct a
substitute asset of comparable utility, adjusted for obsolescence, such as Physical
deterioration, functional (technological) obsolescence, economic (external) obsolescence.
The market approach uses prices and other relevant information generated by market
transactions involving identical or comparable (ie similar) assets, liabilities or a group of
assets and liabilities, such as a business.
This technique includes revenue, or EBITDA multiples and matrix pricing.
Page 33
Valuation techniques continued
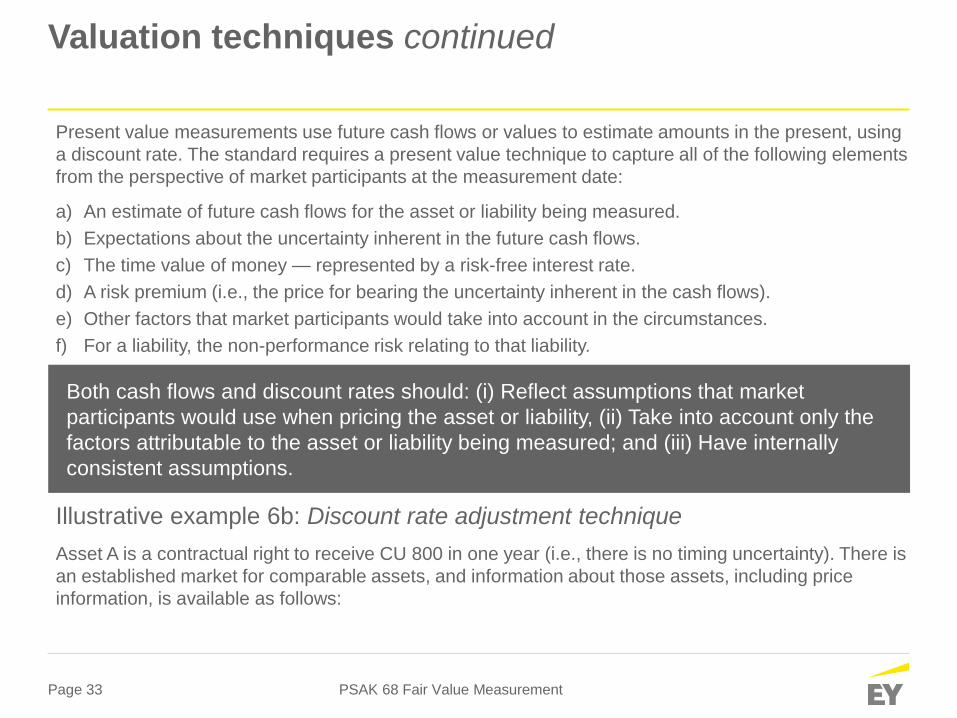
Present value measurements use future cash flows or values to estimate amounts in the present, using
a discount rate. The standard requires a present value technique to capture all of the following elements
from the perspective of market participants at the measurement date:
a) An estimate of future cash flows for the asset or liability being measured.
b) Expectations about the uncertainty inherent in the future cash flows.
c) The time value of money — represented by a risk-free interest rate.
d) A risk premium (i.e., the price for bearing the uncertainty inherent in the cash flows).
e) Other factors that market participants would take into account in the circumstances.
f) For a liability, the non-performance risk relating to that liability.
PSAK 68 Fair Value Measurement
Both cash flows and discount rates should: (i) Reflect assumptions that market
participants would use when pricing the asset or liability, (ii) Take into account only the
factors attributable to the asset or liability being measured; and (iii) Have internally
consistent assumptions.
Illustrative example 6b: Discount rate adjustment technique
Asset A is a contractual right to receive CU 800 in one year (i.e., there is no timing uncertainty). There is
an established market for comparable assets, and information about those assets, including price
information, is available as follows:
Page 34
Valuation techniques continued
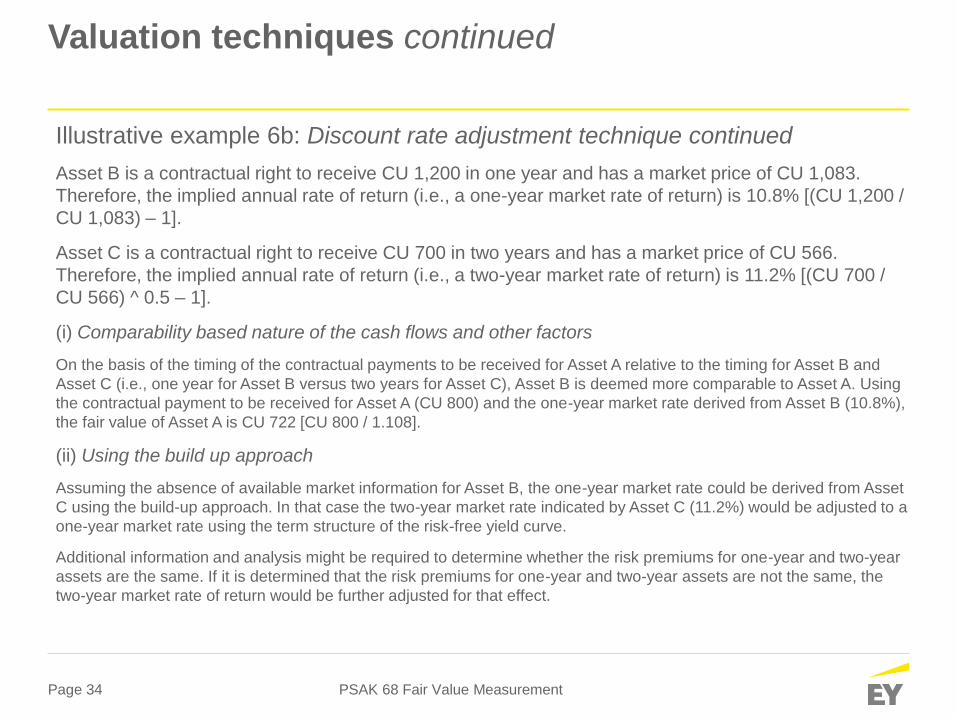
Illustrative example 6b: Discount rate adjustment technique continued
Asset B is a contractual right to receive CU 1,200 in one year and has a market price of CU 1,083.
Therefore, the implied annual rate of return (i.e., a one-year market rate of return) is 10.8% [(CU 1,200 /
CU 1,083) – 1].
Asset C is a contractual right to receive CU 700 in two years and has a market price of CU 566.
Therefore, the implied annual rate of return (i.e., a two-year market rate of return) is 11.2% [(CU 700 /
CU 566) ^ 0.5 – 1].
(i) Comparability based nature of the cash flows and other factors
On the basis of the timing of the contractual payments to be received for Asset A relative to the timing for Asset B and
Asset C (i.e., one year for Asset B versus two years for Asset C), Asset B is deemed more comparable to Asset A. Using
the contractual payment to be received for Asset A (CU 800) and the one-year market rate derived from Asset B (10.8%),
the fair value of Asset A is CU 722 [CU 800 / 1.108].
(ii) Using the build up approach
Assuming the absence of available market information for Asset B, the one-year market rate could be derived from Asset
C using the build-up approach. In that case the two-year market rate indicated by Asset C (11.2%) would be adjusted to a
one-year market rate using the term structure of the risk-free yield curve.
Additional information and analysis might be required to determine whether the risk premiums for one-year and two-year
assets are the same. If it is determined that the risk premiums for one-year and two-year assets are not the same, the
two-year market rate of return would be further adjusted for that effect.
PSAK 68 Fair Value Measurement
Page 35
Valuation techniques continued
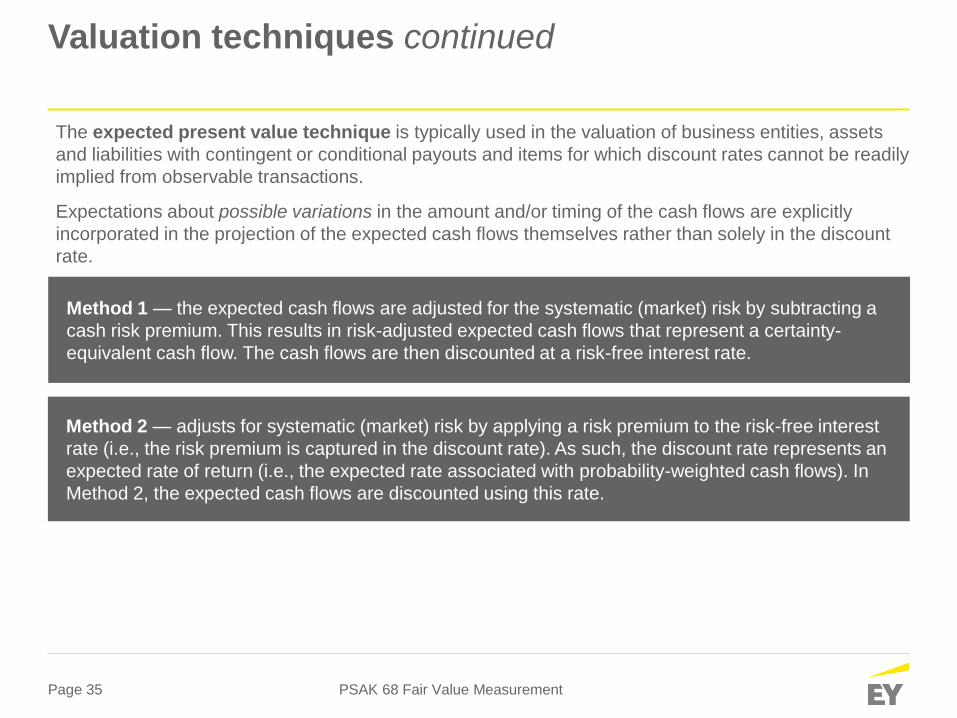
The expected present value technique is typically used in the valuation of business entities, assets
and liabilities with contingent or conditional payouts and items for which discount rates cannot be readily
implied from observable transactions.
Expectations about possible variations in the amount and/or timing of the cash flows are explicitly
incorporated in the projection of the expected cash flows themselves rather than solely in the discount
rate.
PSAK 68 Fair Value Measurement
Method 1 — the expected cash flows are adjusted for the systematic (market) risk by subtracting a
cash risk premium. This results in risk-adjusted expected cash flows that represent a certainty-
equivalent cash flow. The cash flows are then discounted at a risk-free interest rate.
Method 2 — adjusts for systematic (market) risk by applying a risk premium to the risk-free interest
rate (i.e., the risk premium is captured in the discount rate). As such, the discount rate represents an
expected rate of return (i.e., the expected rate associated with probability-weighted cash flows). In
Method 2, the expected cash flows are discounted using this rate.

Page 36
Valuation techniques continued
PSAK 68 Fair Value Measurement
Illustrative example 6c: Expected present value techniques
Fact pattern: An asset has expected cash flows of CU 780 in one year determined on the basis of the
possible cash flows and probabilities shown below. The applicable risk-free interest rate for cash flows
with a one-year horizon is 5%, and the systematic risk premium for an asset with the same risk profile is
3%.
Analysis:
In this simple example, the expected cash flows of CU 780 represent the probability-weighted average
of the three possible outcomes. In more realistic situations, there could be many possible outcomes.
To apply the expected present value technique, it is not always necessary to take into account
distributions of all possible cash flows using complex models and techniques. Rather, it might be
possible to develop a limited number of discrete scenarios and probabilities that capture the array of
possible cash flows.
In theory, the present value (i.e., the fair value) of the asset’s cash flows is the same whether
determined using Method 1 or Method 2, as follows:
Page 37
Valuation techniques continued
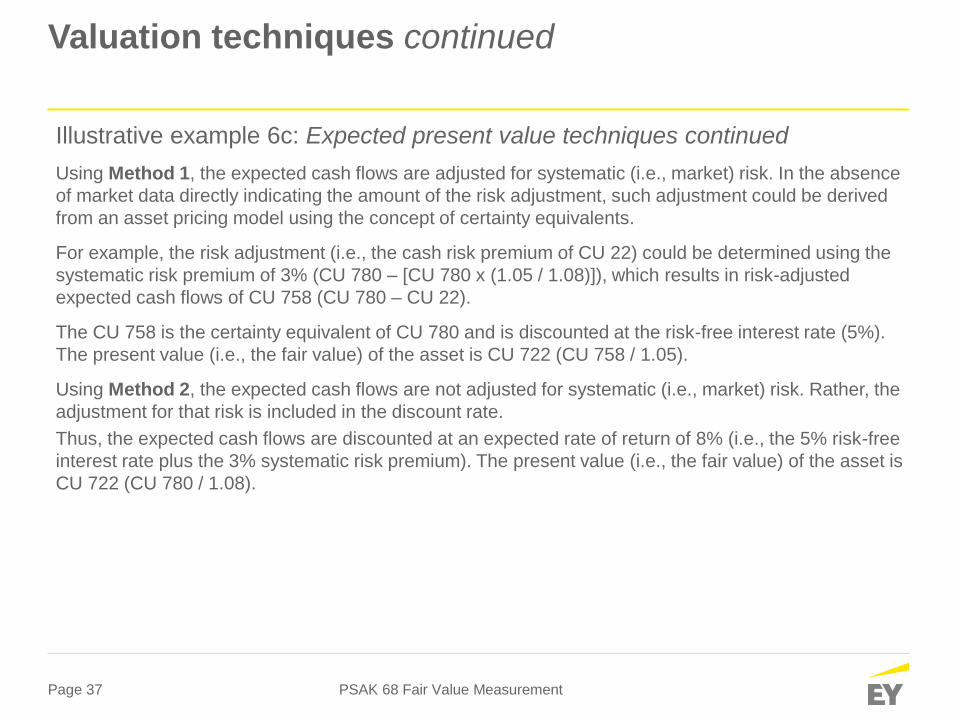
Illustrative example 6c: Expected present value techniques continued
Using Method 1, the expected cash flows are adjusted for systematic (i.e., market) risk. In the absence
of market data directly indicating the amount of the risk adjustment, such adjustment could be derived
from an asset pricing model using the concept of certainty equivalents.
For example, the risk adjustment (i.e., the cash risk premium of CU 22) could be determined using the
systematic risk premium of 3% (CU 780 – [CU 780 x (1.05 / 1.08)]), which results in risk-adjusted
expected cash flows of CU 758 (CU 780 – CU 22).
The CU 758 is the certainty equivalent of CU 780 and is discounted at the risk-free interest rate (5%).
The present value (i.e., the fair value) of the asset is CU 722 (CU 758 / 1.05).
Using Method 2, the expected cash flows are not adjusted for systematic (i.e., market) risk. Rather, the
adjustment for that risk is included in the discount rate.
Thus, the expected cash flows are discounted at an expected rate of return of 8% (i.e., the 5% risk-free
interest rate plus the 3% systematic risk premium). The present value (i.e., the fair value) of the asset is
CU 722 (CU 780 / 1.08).
PSAK 68 Fair Value Measurement

Page 38
Fair value hierarchy
► To increase consistency and comparability in fair value measurements and related disclosures, this
IFRS establishes a fair value hierarchy that categorizes into three levels the inputs to valuation
techniques used to measure fair value.
► Application of the hierarchy requires an entity to prioritize observable inputs over those that are
unobservable when measuring fair value. In addition, for disclosures, it provides a framework for
users to consider the relative subjectivity of the fair value measurements made by the reporting
entity.
PSAK 68 Fair Value Measurement
Level 1 inputs are quoted prices (unadjusted) in active markets for identical assets or liabilities that
the entity can access at the measurement date.
Level 2 inputs are inputs other than quoted prices included within Level 1 that are observable for the
asset or liability, either directly or indirectly. Adjustments to Level 2 inputs will vary depending on
factors specific to the asset or liability. Those factors include the following:
a) the condition or location of the asset;
b) the extent to which inputs relate to items that are comparable to the asset or liability (including
those factors described in paragraph 39); and
c) the volume or level of activity in the markets within which the inputs are observed
Page 39
Fair value hierarchy continued
PSAK 68 Fair Value Measurement
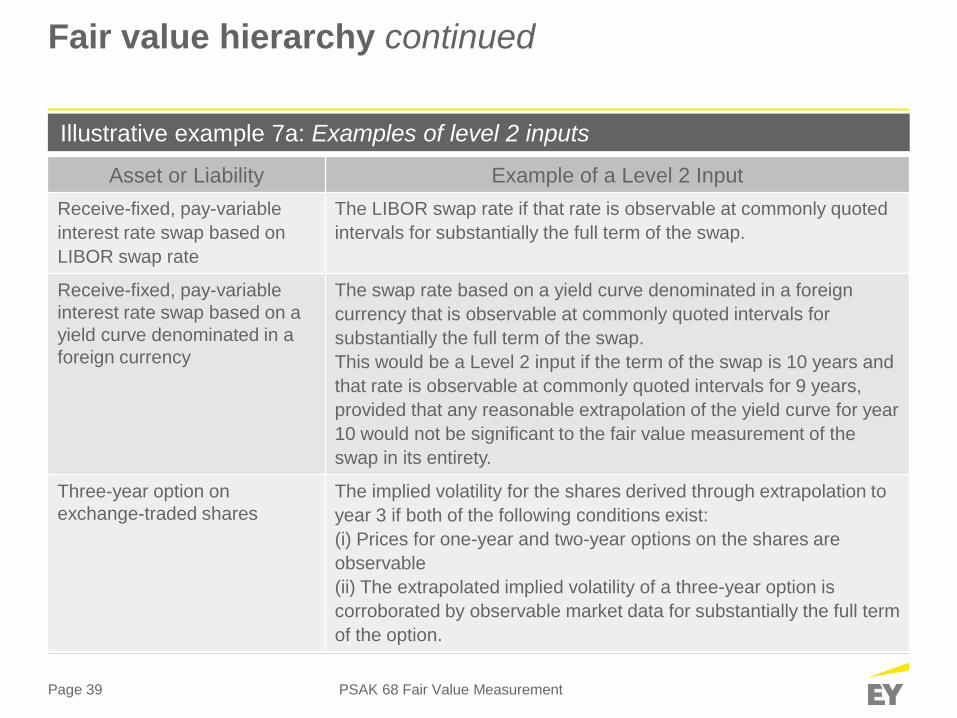
Illustrative example 7a: Examples of level 2 inputs
Asset or Liability Example of a Level 2 Input
Receive-fixed, pay-variable
interest rate swap based on
LIBOR swap rate
The LIBOR swap rate if that rate is observable at commonly quoted
intervals for substantially the full term of the swap.
Receive-fixed, pay-variable
interest rate swap based on a
yield curve denominated in a
foreign currency
The swap rate based on a yield curve denominated in a foreign
currency that is observable at commonly quoted intervals for
substantially the full term of the swap.
This would be a Level 2 input if the term of the swap is 10 years and
that rate is observable at commonly quoted intervals for 9 years,
provided that any reasonable extrapolation of the yield curve for year
10 would not be significant to the fair value measurement of the
swap in its entirety.
Three-year option on
exchange-traded shares
The implied volatility for the shares derived through extrapolation to
year 3 if both of the following conditions exist:
(i) Prices for one-year and two-year options on the shares are
observable
(ii) The extrapolated implied volatility of a three-year option is
corroborated by observable market data for substantially the full term
of the option.

Page 40
Fair value hierarchy continued
PSAK 68 Fair Value Measurement
Illustrative example 7a: Examples of level 2 inputs continued
Asset or Liability Example of a Level 2 Input
Receive-fixed, pay-variable
interest rate swap based on a
specific bank’s prime rate
The bank’s prime rate derived through extrapolation if the
extrapolated values are corroborated by observable market data, for
example, by correlation with an interest rate that is observable over
substantially the full term of the swap.
Licensing arrangement Royalty rate in the contract with the unrelated party at inception of
the arrangement.
Building held and used The price per square metre for the building (a valuation multiple)
derived from observable market data, e.g., multiples derived from
prices in observed transactions involving comparable (i.e., similar)
buildings in similar locations.
Cash-generating unit
A valuation multiple (e.g., a multiple of earnings or revenue or a
similar performance measure) derived from observable market data,
e.g., multiples derived from prices in observed transactions involving
comparable (i.e., similar) businesses, taking into account
operational, market, financial and non-financial factors.
Page 41
Fair value hierarchy continued
PSAK 68 Fair Value Measurement
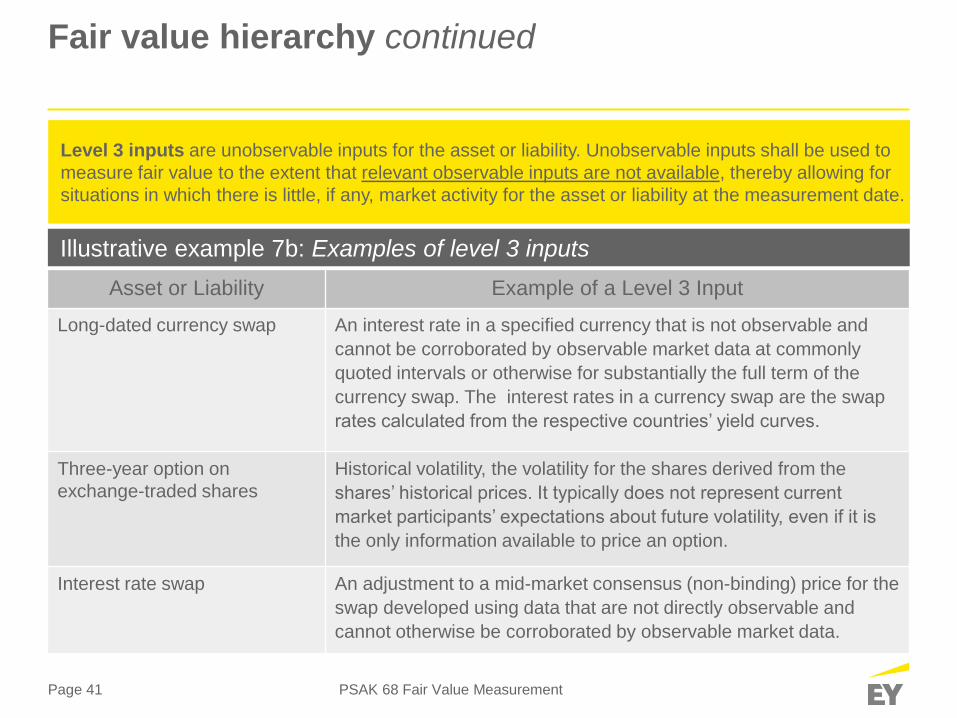
Illustrative example 7b: Examples of level 3 inputs
Asset or Liability Example of a Level 3 Input
Long-dated currency swap An interest rate in a specified currency that is not observable and
cannot be corroborated by observable market data at commonly
quoted intervals or otherwise for substantially the full term of the
currency swap. The interest rates in a currency swap are the swap
rates calculated from the respective countries’ yield curves.
Three-year option on
exchange-traded shares
Historical volatility, the volatility for the shares derived from the
shares’ historical prices. It typically does not represent current
market participants’ expectations about future volatility, even if it is
the only information available to price an option.
Interest rate swap An adjustment to a mid-market consensus (non-binding) price for the
swap developed using data that are not directly observable and
cannot otherwise be corroborated by observable market data.
Level 3 inputs are unobservable inputs for the asset or liability. Unobservable inputs shall be used to
measure fair value to the extent that relevant observable inputs are not available, thereby allowing for
situations in which there is little, if any, market activity for the asset or liability at the measurement date.
Page 42
Fair value hierarchy continued
PSAK 68 Fair Value Measurement
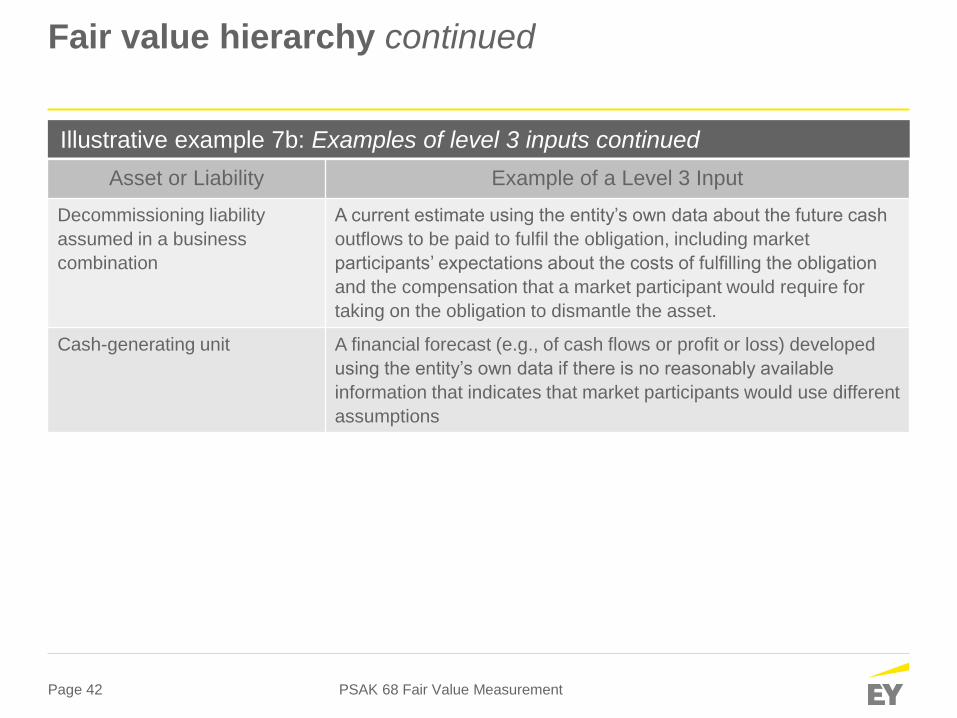
Illustrative example 7b: Examples of level 3 inputs continued
Asset or Liability Example of a Level 3 Input
Decommissioning liability
assumed in a business
combination
A current estimate using the entity’s own data about the future cash
outflows to be paid to fulfil the obligation, including market
participants’ expectations about the costs of fulfilling the obligation
and the compensation that a market participant would require for
taking on the obligation to dismantle the asset.
Cash-generating unit A financial forecast (e.g., of cash flows or profit or loss) developed
using the entity’s own data if there is no reasonably available
information that indicates that market participants would use different
assumptions
Page 43
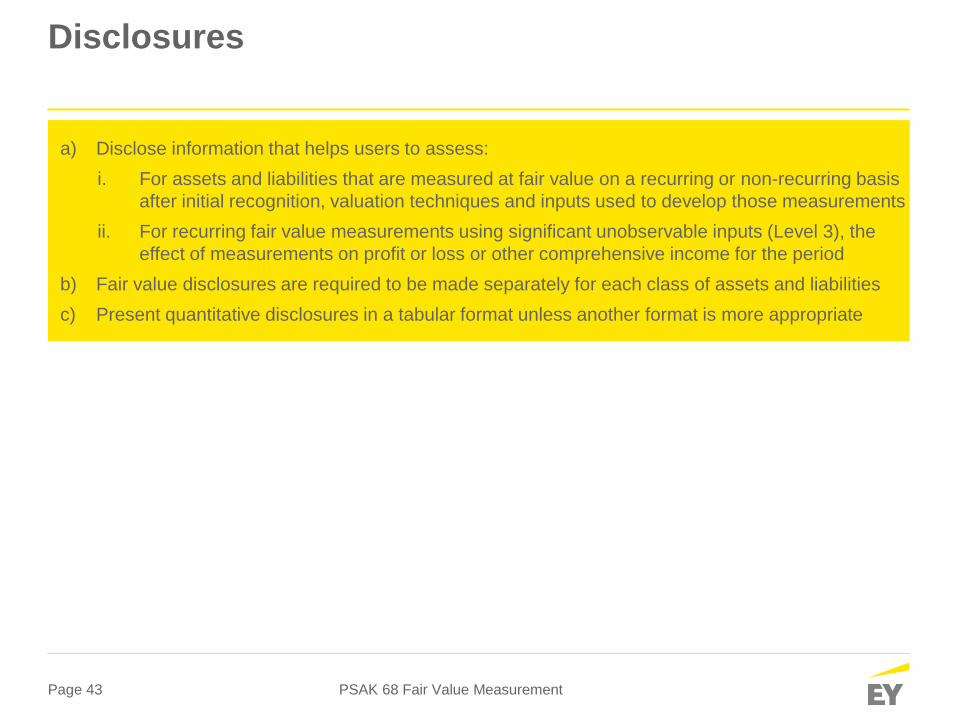
a) Disclose information that helps users to assess:
i. For assets and liabilities that are measured at fair value on a recurring or non-recurring basis
after initial recognition, valuation techniques and inputs used to develop those measurements
ii. For recurring fair value measurements using significant unobservable inputs (Level 3), the
effect of measurements on profit or loss or other comprehensive income for the period
b) Fair value disclosures are required to be made separately for each class of assets and liabilities
c) Present quantitative disclosures in a tabular format unless another format is more appropriate
Disclosures
PSAK 68 Fair Value Measurement
Page 44
Disclosures
PSAK 68 Fair Value Measurement
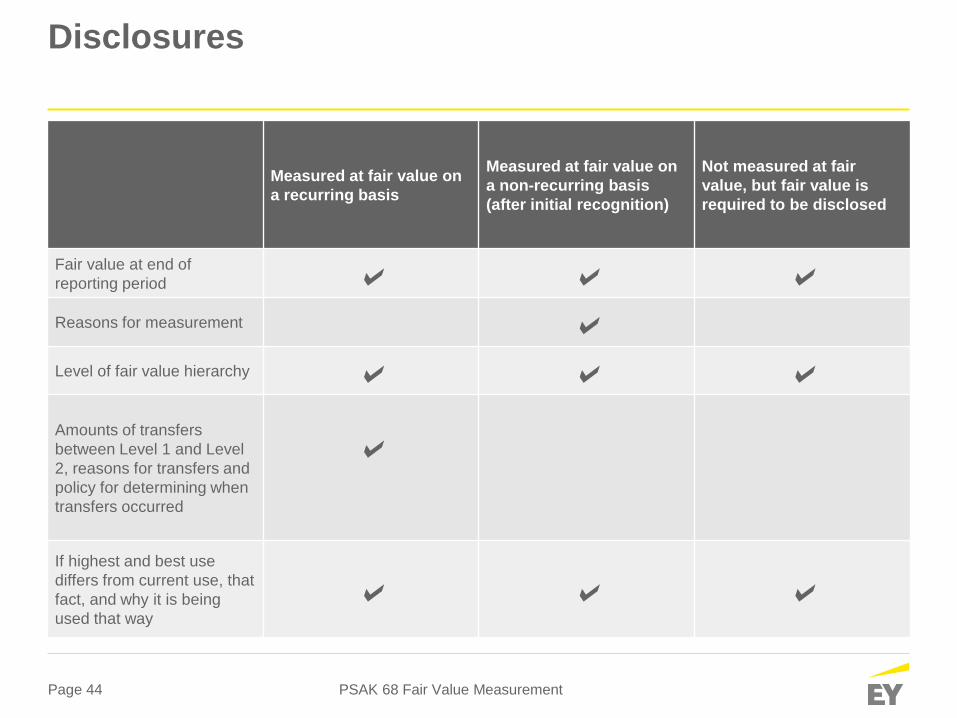
Measured at fair value on
a recurring basis
Measured at fair value on
a non-recurring basis
(after initial recognition)
Not measured at fair
value, but fair value is
required to be disclosed
Fair value at end of
reporting period Reasons for measurement Level of fair value hierarchy
Amounts of transfers
between Level 1 and Level
2, reasons for transfers and
policy for determining when
transfers occurred
If highest and best use
differs from current use, that
fact, and why it is being
used that way

Page 45
Disclosures
PSAK 68 Fair Value Measurement
Measured at fair value on
a recurring basis
Measured at fair value on
a non-recurring basis
(after initial recognition)
Not measured at fair
value, but fair value is
required to be disclosed
For Level 2 and 3, a
description of valuation
technique(s) and inputs
used
For Level 2 and 3, any
changes in valuation
technique(s), and reasons
for change
For Level 3, quantitative
information about significant
unobservable inputs
For Level 3, description of
valuation processes

Page 46
Disclosures continued
PSAK 68 Fair Value Measurement
Illustrative example 8a: Disclosure of assets measured at fair value
Page 47
Disclosures continued
PSAK 68 Fair Value Measurement
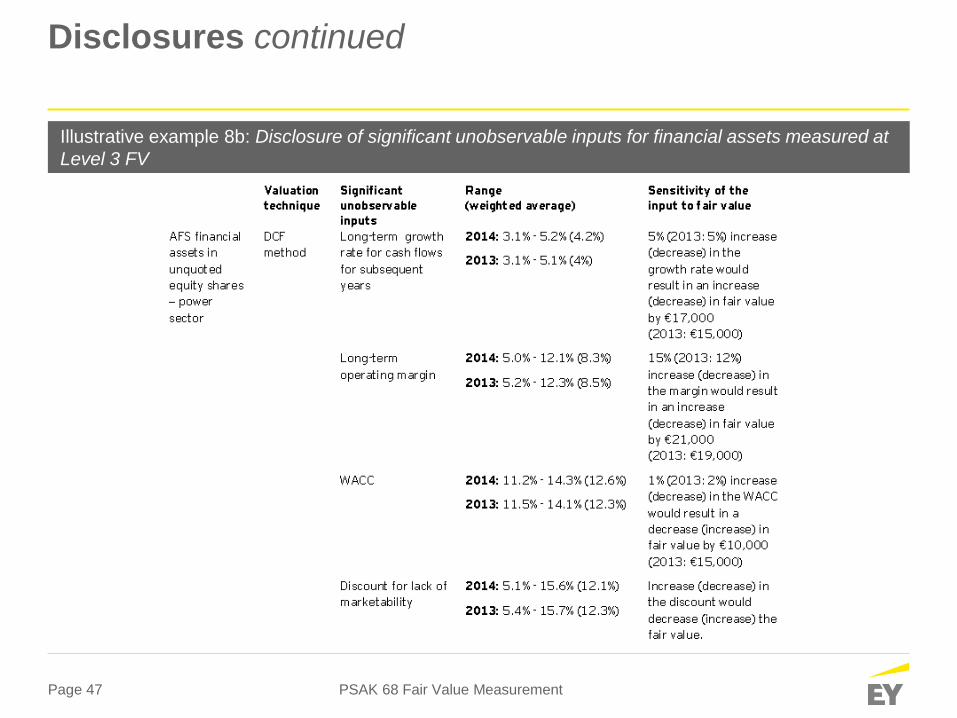
Illustrative example 8b: Disclosure of significant unobservable inputs for financial assets measured at
Level 3 FV

Page 48
Disclosures continued
PSAK 68 Fair Value Measurement
Illustrative example 8b: Disclosure of significant unobservable inputs for financial assets measured at
Level 3 FV continued
Page 49
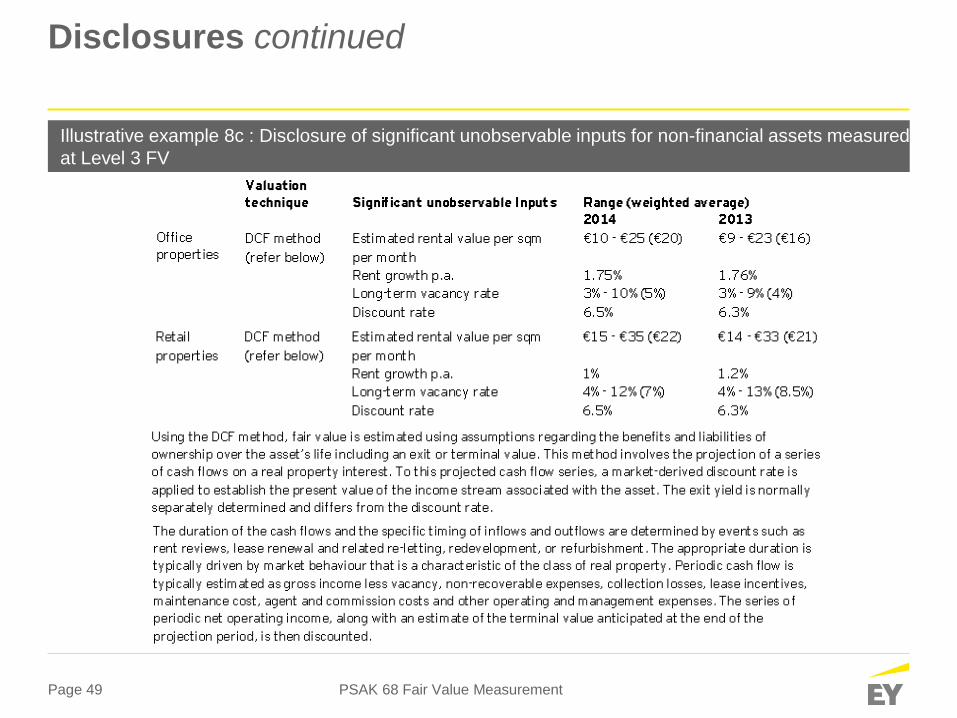
Disclosures continued
PSAK 68 Fair Value Measurement
Illustrative example 8c : Disclosure of significant unobservable inputs for non-financial assets measured
at Level 3 FV
Page 50
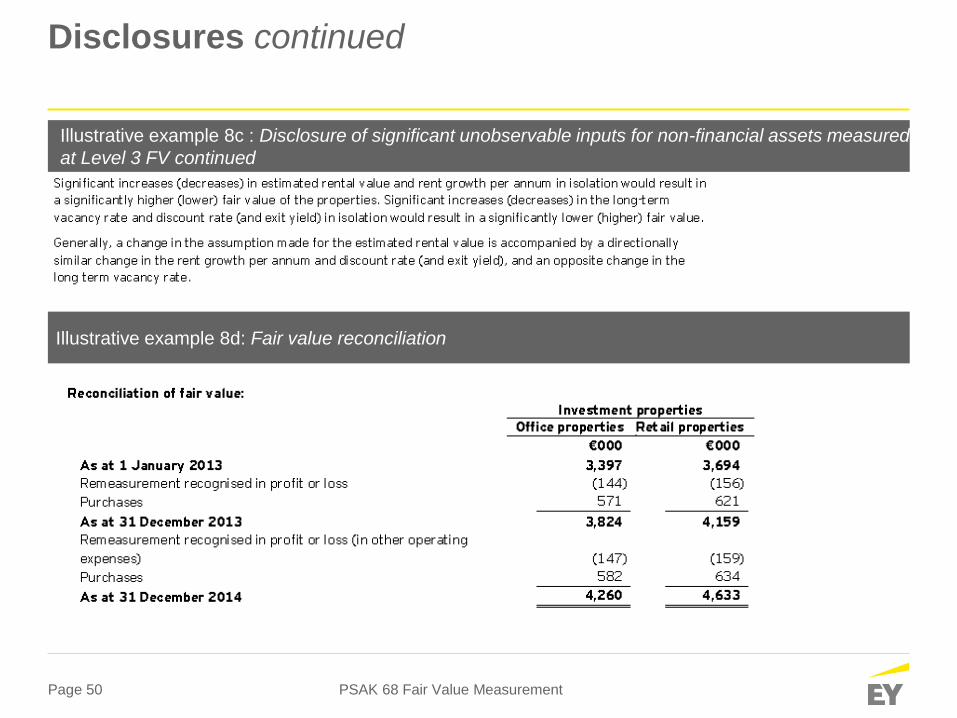
Disclosures continued
PSAK 68 Fair Value Measurement
Illustrative example 8d: Fair value reconciliation
Illustrative example 8c : Disclosure of significant unobservable inputs for non-financial assets measured
at Level 3 FV continued

Page 51
Disclosures continued
PSAK 68 Fair Value Measurement
Illustrative example 8e: Level 3 reconciliation
Page 52
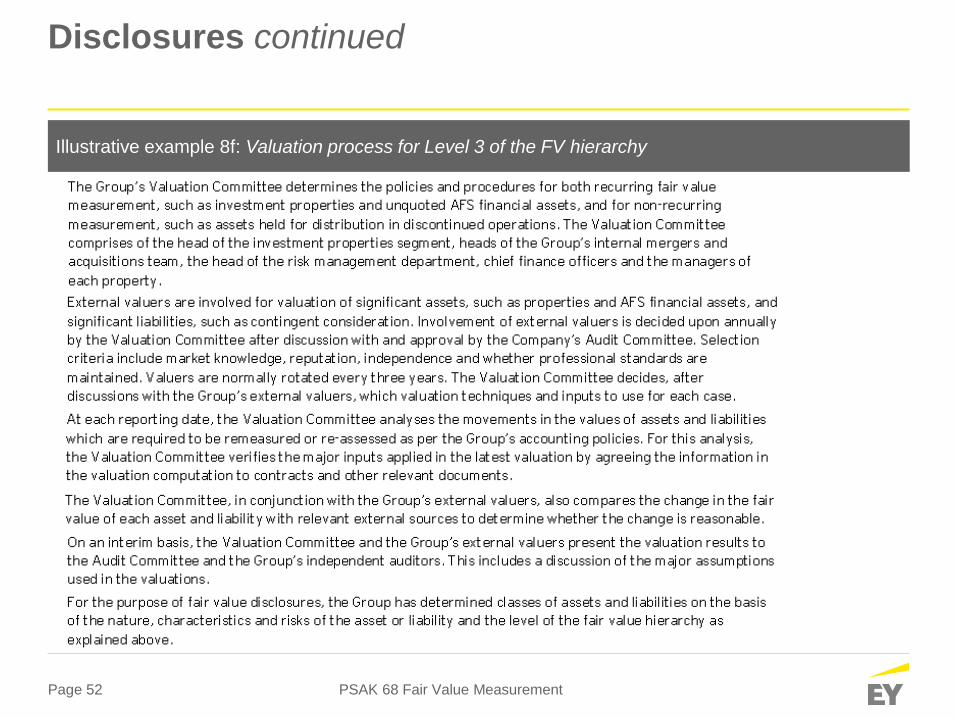
Disclosures continued
PSAK 68 Fair Value Measurement
Illustrative example 8f: Valuation process for Level 3 of the FV hierarchy

Thank you
EY | Assurance | Tax | Transactions | Advisory
About EY
EY is a global leader in assurance, tax, transaction and advisory
services. The insights and quality services we deliver help build
trust and confidence in the capital markets and in economies the
world over. We develop outstanding leaders who team to deliver
on our promises to all of our stakeholders. In so doing, we play a
critical role in building a better working world for our people, for our
clients and for our communities.
EY refers to the global organization, and may refer to one or more,
of the member firms of Ernst & Young Global Limited, each of
which is a separate legal entity. Ernst & Young Global Limited, a
UK company limited by guarantee, does not provide services to
clients. For more information about our organization, please visit
ey.com.
© 2015 Purwantono, Sungkoro & Surja.
A member firm of Ernst & Young Global Limited.
All Rights Reserved.
APAC no. 00000131
ED NONE
In line with EY’s commitment to minimize its impact on the environment, this
document has been printed on paper with a high recycled content.
This material has been prepared for general informational purposes only and is not
intended to be relied upon as accounting, tax, or other professional advice. Please
refer to your advisors for specific advice.
ey.com/id