PRZIX Emerging Markets Stock Fund–I Class · Raia Drogasil reported disappointing sales as...
48
T. ROWE PRICE April 30, 2018 PRMSX Emerging Markets Stock Fund PRZIX Emerging Markets Stock Fund–I Class The fund invests in companies in developing markets worldwide. For more insights from T. Rowe Price investment professionals, go to troweprice.com. SEMIANNUAL REPORT
Transcript of PRZIX Emerging Markets Stock Fund–I Class · Raia Drogasil reported disappointing sales as...

T. ROWE PRICE
April 30, 2018
PRMSX Emerging Markets Stock Fund
PRZIX Emerging MarketsStock Fund–I Class
The fund invests in companies in developing markets worldwide.
For more insights from T. Rowe Price investment professionals, go to troweprice.com.
SEMIANNUAL REPORT
Proof #5

T. RowE PRICE EMERgIng MaRkETS SToCk Fund
CIo Market Commentary
T. RowE PRICE EMERgIng MaRkETS SToCk Fund
HIGHLIGHTS
n Emerging markets rose during the period, buoyed by indications of strong global growth and market-friendly outcomes in various elections.
n Your fund returned 4.38% over the six-month period ended April 30, 2018, underperforming its benchmark but outperforming its peer group average. The underperformance was largely the result of our stock selection in Brazil.
n Amid the uncertainty created by elections and geopolitical risks, we have consolidated into our highest-conviction holdings, seeking companies that we believe stand to benefit from secular growth trends and the buying habits of the emerging consumer class.
n We remain optimistic about the outlook for emerging markets over the medium to long term, and we expect to see a greater divergence in the performance of countries, sectors, and companies within the asset class.
Log in to your account at troweprice.com for more information.
* Certain mutual fund accounts that are assessed an annual account service fee can also save money by switching to e-delivery.
It’s fast—receive your statements and confirmations faster than U.S. mail.
It’s convenient—access your important account documents whenever you need them.
It’s secure—we protect your online accounts using “True Identity” to confirm new accounts and make verification faster and more secure.
It can save you money—where applicable, T. Rowe Price passes on the cost savings to fund holders.*
TO ENROLL:If you invest directly with T. Rowe Price, go to troweprice.com/paperless.
If you invest through an investment advisor, a bank, or a brokerage firm, please contact that organization and ask if it can provide electronic documentation.
Go PaperlessSign up for e-delivery of your statements, confirmations, and prospectuses or shareholder reports.
Proof #5

1
T. RowE PRICE EMERgIng MaRkETS SToCk Fund
CIo Market Commentary
T. RowE PRICE EMERgIng MaRkETS SToCk Fund
dear Shareholder
Global markets experienced an abrupt reversal in early 2018, as a prolonged stretch of slow and steady gains in many equity markets gave way to a spike in volatility. In February, the S&P 500 Index broke its longest streak of positive monthly total returns on record and briefly declined by over 10% from its recent highs, putting it in correction territory. Overseas markets broadly followed Wall Street lower, and global stocks remained volatile through April. Strong results from November through January helped most markets end with gains for the first half of your fund’s fiscal year, however.
Several factors appeared to have unsettled investors, but the impact of tighter monetary policy and fears about heightened trade tensions were primary among them. Data in early February showing faster wage gains in the U.S. fostered speculation that the Federal Reserve might accelerate its pace of interest rate hikes in order to fight inflation. While most other central banks continued to keep short-term rates steady at very low levels, longer-term rates in many countries crept up as economic growth solidified. Investors around the world began to consider how the normalization of monetary policy might potentially impact stock and bond prices.
Uncertainties deepened in early March after the Trump administration surprised many with the announcement of tariffs on imported steel and aluminum, only to later grant select trading partners temporary exemptions. The trade conflict between China and the U.S. intensified, however, with the U.S. announcing additional tariffs on Chinese goods and China responding with its own tariffs in a tit-for-tat escalation that proceeded through April.
World currencies fluctuated amid increased market volatility, geopolitical swings, and concerns about rising U.S. protectionism. The greenback began to strengthen late in the period as the 10-year U.S. Treasury yield broke through 3%; but for the full six months ended April 30, the dollar declined almost 4% against the euro, British pound, and Japanese yen. The rise in other currencies boosted returns for U.S. investors in overseas markets.
Emerging markets, supported by good earnings growth, proved resilient for much of the period and outperformed their developed peers over the last six months. Oil exporters and other commodity producers benefited from rising prices, and improving fiscal conditions lowered borrowing costs in a number of emerging economies. The month of April proved tougher for emerging markets, though, as U.S. yields and the dollar began to rise.
Proof #5

2
T. RowE PRICE EMERgIng MaRkETS SToCk Fund
Notably, the shift in market sentiment beginning in February did not correspond to a widespread deterioration in economic conditions or corporate fundamentals. Indeed, corporate profit growth accelerated across many markets, and the world’s major economies continued to expand in sync for the first time in several years. Market strength in the first three months of the period was largely based on the expectation of this improvement; conversely, weakness in the back half of the period appears to have largely reflected growing skepticism about whether this pace of improvement is sustainable.
Time will tell if the recent turbulence was signaling trouble ahead or if the market was simply consolidating the strong gains over the past several years before moving higher. Among the developments we will be watching closely are election results in the U.S., Europe, and elsewhere, and whether a continuing populist backlash results in a wave of protectionism. On the economic front, the possibility that inflation finally takes hold in developed markets and how consumers and businesses adjust to an end of extreme monetary accommodation will help determine if growth can sustain its momentum. In historical terms, equity and bond valuations remain generally elevated, posing the risk that asset prices won’t keep pace with improving fundamentals over the short term.
Many investors have been asking our view on the recent return to more normal levels of market volatility. It’s important to underscore that volatility, while sometimes unsettling, can be the friend of long-term, patient investors. More volatility can benefit active management, and I am confident that our dedicated, worldwide team of investment professionals are taking advantage of this period to discover new opportunities. Moreover, I have no doubt that your fund’s experienced manager will continue to make the best use of those insights, putting the long-term interests of our shareholders above the short-term instincts that too often drive markets.
Thank you for your continued confidence in T. Rowe Price.
Sincerely,
Robert SharpsGroup Chief Investment Officer
Proof #5
3
T. RowE PRICE EMERgIng MaRkETS SToCk Fund
Management’s discussion of Fund Performance
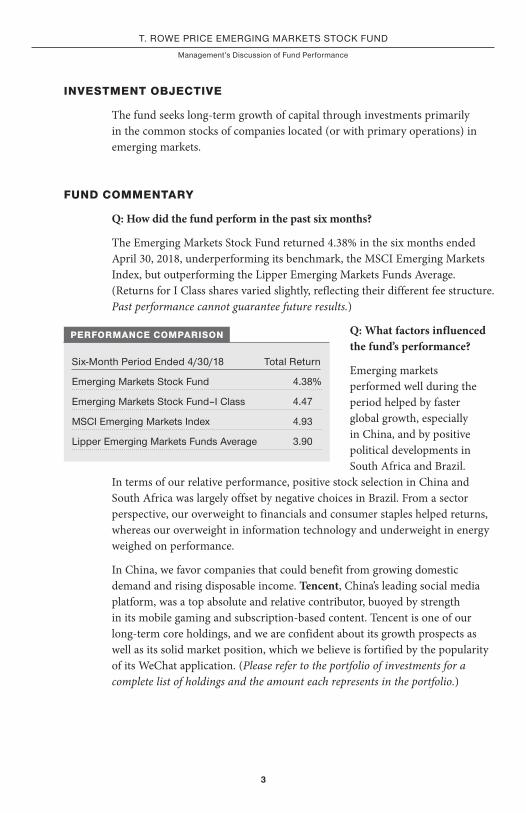
INVESTMENT OBJECTIVE
The fund seeks long-term growth of capital through investments primarily in the common stocks of companies located (or with primary operations) in emerging markets.
FUND COMMENTARY
Q: How did the fund perform in the past six months?
The Emerging Markets Stock Fund returned 4.38% in the six months ended April 30, 2018, underperforming its benchmark, the MSCI Emerging Markets Index, but outperforming the Lipper Emerging Markets Funds Average. (Returns for I Class shares varied slightly, reflecting their different fee structure. Past performance cannot guarantee future results.)
Q: What factors influenced the fund’s performance?
Emerging markets performed well during the period helped by faster global growth, especially in China, and by positive political developments in South Africa and Brazil.
In terms of our relative performance, positive stock selection in China and South Africa was largely offset by negative choices in Brazil. From a sector perspective, our overweight to financials and consumer staples helped returns, whereas our overweight in information technology and underweight in energy weighed on performance.
In China, we favor companies that could benefit from growing domestic demand and rising disposable income. Tencent, China’s leading social media platform, was a top absolute and relative contributor, buoyed by strength in its mobile gaming and subscription-based content. Tencent is one of our long-term core holdings, and we are confident about its growth prospects as well as its solid market position, which we believe is fortified by the popularity of its WeChat application. (Please refer to the portfolio of investments for a complete list of holdings and the amount each represents in the portfolio.)
Six-Month Period Ended 4/30/18 Total Return
Emerging Markets Stock Fund 4.38%
Emerging Markets Stock Fund‒I Class 4.47
MSCI Emerging Markets Index 4.93
Lipper Emerging Markets Funds average 3.90
PERFORMANCE COMPARISON
Proof #5

4
T. RowE PRICE EMERgIng MaRkETS SToCk Fund
Thailand’s stocks produced top gains in Asia as the economy picked up, thanks to a rise in exports and recovery in domestic demand. CP ALL, the 7-Eleven convenience-store chain, benefited from the uptick in consumer sentiment and was a top absolute and relative contributor. South Korean consumer goods company LG Household & Health Care was another top performer in absolute and relative terms. The company reported strong results and secured access to the difficult-to-enter Japanese beauty product space with its acquisition of Avon Japan.
In Taiwan, our stock selection hurt results. Largan Precision was the largest absolute and relative detractor amid worries about the impact of surprisingly weak iPhone sales. Largan makes high-precision camera lenses used in smartphones. However, we believe the company is well positioned to benefit from the adoption of dual-camera and augmented-reality smartphones.
The rally in oil prices helped lift Russia’s economy and stock market, which gained more than 7% during the period. Russia’s dominant bank, Sberbank, contributed to performance as it benefited from both the rally in stocks and oil prices as well as from stronger earnings reports. Overall, however, our stock selection was negative as food retailer Magnit underperformed after reporting disappointing earnings and after the founder and chief executive stepped down and sold most of his stake in the company.
In South Africa, our investments continue to focus on high-quality financial and consumer names. Food retailer Shoprite contributed as its stock benefited from the market’s rally, as did integrated financial services group FirstRand. Both companies were among our top absolute and relative contributors.
In Latin America, our stock selection among Brazilian companies detracted primarily because we did not own state-owned oil company Petroleo Brasileiro and iron ore producer Vale, both of which benefited from higher commodity prices. However, we believe that these cyclical companies are currently overearning, and we find better opportunities in other areas. Two longtime Brazil holdings also hurt absolute and relative performance following unfavorable earnings results. Raia Drogasil reported disappointing sales as drug-price inflation slowed and competition increased. Apparel retailer Lojas Renner came under pressure from increased operating costs in part due to its investments in its online platforms. We think these investments will further improve the company’s competitive position.
Among Brazilian financial companies, private bank Itau Unibanco was a top absolute and relative contributor, thanks to increased loan growth and a decline in nonperforming loans.
Proof #5
5
T. RowE PRICE EMERgIng MaRkETS SToCk Fund
Our top Mexican holding Wal-Mart de Mexico (Walmex) held up well, increasing sales and gaining market share in Mexico and Central America. Walmex is a defensive, high-quality company that we believe will be a resilient performer regardless of a new presidential administration or potential economic slowdown.
Q: How is the fund positioned?
We made only minor shifts to the portfolio’s positioning during the six-month period, maintaining our largest absolute positions in China, South Korea, Taiwan, and Brazil. Amid the uncertainty of myriad presidential elections throughout emerging markets and the geopolitical risks that could ensue, we continue to focus our biggest bets to our highest-conviction holdings that stand to benefit from secular growth trends and the buying habits of the emerging consumer class. These include financial companies, such as Itau and FirstRand
as well as companies that we expect to benefit from a growing middle class, such as apparel retailer Lojas Renner.
In Brazil, the government has enacted important reforms this year that should help it achieve more sustainable growth. While Brazil remains our largest relative overweight, we reduced exposure due to stretched valuations and the upcoming October presidential election, an event that could create market volatility.
In South Africa, we believe the new government of Cyril Ramaphosa is on track to boost economic growth. We increased our exposure to South Africa during the
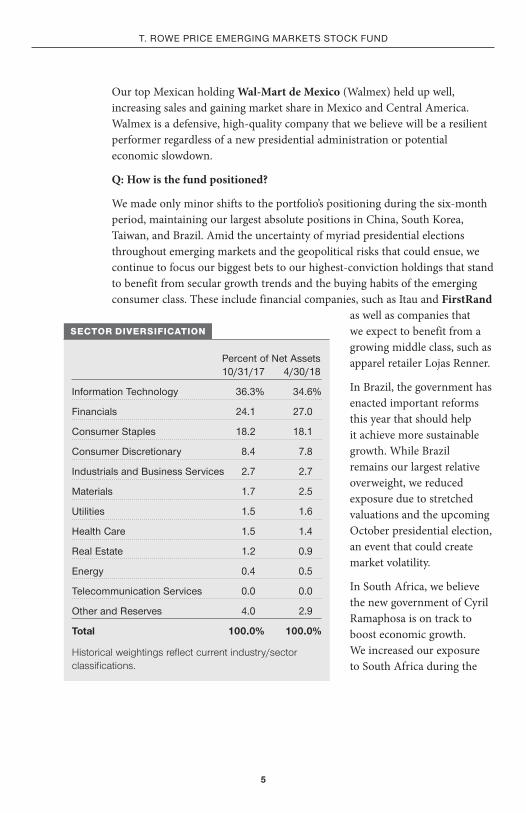
Percent of net assets 10/31/17 4/30/18
Information Technology 36.3% 34.6%
Financials 24.1 27.0
Consumer Staples 18.2 18.1
Consumer discretionary 8.4 7.8
Industrials and Business Services 2.7 2.7
Materials 1.7 2.5
utilities 1.5 1.6
Health Care 1.5 1.4
Real Estate 1.2 0.9
Energy 0.4 0.5
Telecommunication Services 0.0 0.0
other and Reserves 4.0 2.9
Total 100.0% 100.0%
Historical weightings reflect current industry/sector classifications.
SECTOR DIVERSIFICATION
Proof #5
6
T. RowE PRICE EMERgIng MaRkETS SToCk Fund
period, seizing on the positive political change to add to some of the well-run companies that also offer exposure to faster-growing sub-Saharan African markets. Amid the improvements in the South Africa political and economic landscape, we initiated a position in Barclays Africa, one of South Africa’s largest financial services groups.
Q: What is portfolio management’s outlook?
While we are optimistic about the outlook for emerging markets, risks include escalating trade tensions and a possible slowdown in China. Any surprises in the pace of Federal Reserve interest rate hikes or a stronger-than-expected U.S. dollar could also create headwinds.
However, the past six months have shown how these markets are better positioned to withstand challenges, due to their improved current accounts, greater foreign-exchange reserves, higher real interest rates, and freely floating currencies.
We expect that countries that push forward with reforms should do well. While valuations are not as cheap as they were a year ago or even six months ago, they remain at a slight discount relative to their history and to their developed market peers.
The views expressed reflect the opinions of T. Rowe Price as of the date of this report and are subject to change based on changes in market, economic, or other conditions. These views are not intended to be a forecast of future events and are no guarantee of future results.
Proof #5

7
T. RowE PRICE EMERgIng MaRkETS SToCk Fund
RISKS OF INTERNATIONAL INVESTING
Funds that invest overseas generally carry more risk than funds that invest strictly in U.S. assets. Funds investing in a single country or limited geographic region tend to be riskier than more diversified funds. Risks can result from varying stages of economic and political development; differing regulatory environments, trading days, and accounting standards; and higher transaction costs of non-U.S. markets. Non-U.S. investments are also subject to currency risk, or a decline in the value of a foreign currency versus the U.S. dollar, which reduces the dollar value of securities denominated in that currency.
The risks of international investing are heightened for securities of issuers in emerging market countries. Emerging market countries tend to have economic structures that are less diverse and mature and political systems that are less stable than those of developed countries. In addition to all of the risks of investing in international developed markets, emerging markets are more susceptible to governmental interference, local taxes being imposed on international investments, restrictions on gaining access to sales proceeds, and less liquid and less efficient trading markets.
BENCHMARK INFORMATION
Note: MSCI makes no express or implied warranties or representations and shall have no liability whatsoever with respect to any MSCI data contained herein. The MSCI data may not be further redistributed or used as a basis for other indices or any securities or financial products. This report is not approved, reviewed, or produced by MSCI.
Proof #5

8
T. RowE PRICE EMERgIng MaRkETS SToCk Fund
TWENTY-FIVE LARGEST HOLDINGS
Percent of net assets 4/30/18
Samsung Electronics, South korea 6.9%Tencent, China 6.2alibaba group Holding, China 5.6Taiwan Semiconductor Manufacturing, Taiwan 5.0Itau unibanco, Brazil 3.8
aIa group, Hong kong 3.0Lg Household & Health Care, South korea 2.8Sberbank, Russia 2.8Largan Precision, Taiwan 2.2CP aLL, Thailand 2.1
Lojas Renner, Brazil 2.1Baidu, China 2.0Ping an Insurance, China 1.8Raia drogasil, Brazil 1.8Shoprite, South africa 1.8
FirstRand, South africa 1.6naspers, South africa 1.5Housing development Finance, India 1.5Bank Central asia, Indonesia 1.4wal-Mart de Mexico, Mexico 1.3
Sanlam, South africa 1.3SM Investments, Philippines 1.2anhui Conch Cement, China 1.2HdFC Bank, India 1.2First abu dhabi Bank, united arab Emirates 1.2
Total 63.3%
Note: The information shown does not reflect any exchange-traded funds (ETFs), cash reserves, or collateral for securities lending that may be held in the portfolio.
PORTFOLIO HIGHLIGHTS
Proof #5

9
T. RowE PRICE EMERgIng MaRkETS SToCk Fund
This chart shows the value of a hypothetical $10,000 investment in the fund over the past 10 fiscal year periods or since inception (for funds lacking 10-year records). The result is compared with benchmarks, which includes a broad-based market index and may also include a peer group average or index. Market indexes do not include expenses, which are deducted from fund returns as well as mutual fund averages and indexes.
Since InceptionPeriods Ended 4/30/18 1 Year 5 Years 10 Years Inception date
Emerging Markets Stock Fund 22.51% 6.65% 1.95% – –
Emerging Markets Stock Fund‒I Class 22.71 ‒ ‒ 18.85% 8/28/15
This table shows how the fund would have performed each year if its actual (or cumulative) returns for the periods shown had been earned at a constant rate. Returns do not reflect taxes that the shareholder may pay on fund distributions or the redemption of fund shares. Past performance cannot guarantee future results.
AVERAGE ANNUAL COMPOUND TOTAL RETURN
GROWTH OF $10,000
As of 4/30/18
$12,133
$12,816
$12,328
Emerging Markets Stock Fund
MSCI Emerging Markets Index
Lipper Emerging Markets Funds Average
10,000
13,750
17,500
21,250
$25,000
4/184/174/164/154/144/134/124/114/104/094/08
EMERGING MARKETS STOCK FUND
Note: Performance for the I Class will vary due to its differing fee structure. See returns table below.
Proof #5

10
T. RowE PRICE EMERgIng MaRkETS SToCk Fund
Emerging Markets Stock Fund 1.23%
Emerging Markets Stock Fund‒I Class 1.07
The expense ratio shown is as of the fund’s fiscal year ended 10/31/17. This number may vary from the expense ratio shown elsewhere in this report because it is based on a different time period and, if applicable, includes acquired fund fees and expenses but does not include fee or expense waivers.
EXPENSE RATIO
FUND EXPENSE EXAMPLE
As a mutual fund shareholder, you may incur two types of costs: (1) transaction costs, such as redemption fees or sales loads, and (2) ongoing costs, including management fees, distribution and service (12b-1) fees, and other fund expenses. The following example is intended to help you understand your ongoing costs (in dollars) of investing in the fund and to compare these costs with the ongoing costs of investing in other mutual funds. The example is based on an investment of $1,000 invested at the beginning of the most recent six-month period and held for the entire period.
Please note that the fund has two share classes: The original share class (Investor Class) charges no distribution and service (12b-1) fee, and the I Class shares are also available to institutionally oriented clients and impose no 12b-1 or administrative fee payment. Each share class is presented separately in the table.
Actual ExpensesThe first line of the following table (Actual) provides information about actual account values and expenses based on the fund’s actual returns. You may use the information on this line, together with your account balance, to estimate the expenses that you paid over the period. Simply divide your account value by $1,000 (for example, an $8,600 account value divided by $1,000 = 8.6), then multiply the result by the number on the first line under the heading “Expenses Paid During Period” to estimate the expenses you paid on your account during this period.
Hypothetical Example for Comparison PurposesThe information on the second line of the table (Hypothetical) is based on hypothetical account values and expenses derived from the fund’s actual expense ratio and an assumed 5% per year rate of return before expenses (not the fund’s actual return). You may compare the ongoing costs of investing in the fund with other funds by contrasting this 5% hypothetical example and the 5% hypothetical examples that appear in the shareholder reports of the other funds. The hypothetical account values and expenses may not be used to estimate the actual ending account balance or expenses you paid for the period.
Proof #5

11
T. RowE PRICE EMERgIng MaRkETS SToCk Fund
FUND EXPENSE EXAMPLE (CONTINUED)
Note: T. Rowe Price charges an annual account service fee of $20, generally for accounts with less than $10,000. The fee is waived for any investor whose T. Rowe Price mutual fund accounts total $50,000 or more; accounts electing to receive electronic delivery of account statements, transaction confirmations, prospectuses, and shareholder reports; or accounts of an investor who is a T. Rowe Price Personal Services or Enhanced Personal Services client (enrollment in these programs generally requires T. Rowe Price assets of at least $250,000). This fee is not included in the accompanying table. If you are subject to the fee, keep it in mind when you are estimating the ongoing expenses of investing in the fund and when comparing the expenses of this fund with other funds.
You should also be aware that the expenses shown in the table highlight only your ongoing costs and do not reflect any transaction costs, such as redemption fees or sales loads. Therefore, the second line of the table is useful in comparing ongoing costs only and will not help you determine the relative total costs of owning different funds. To the extent a fund charges transaction costs, however, the total cost of owning that fund is higher.
Beginning Ending Expenses Paid account Value account Value during Period* 11/1/17 4/30/18 11/1/17 to 4/30/18
Investor Classactual $1,000.00 $1,043.80 $6.18
Hypothetical (assumes 5% return before expenses) 1,000.00 1,018.74 6.11
I Classactual 1,000.00 1,044.70 5.37
Hypothetical (assumes 5% return before expenses) 1,000.00 1,019.54 5.31
* Expenses are equal to the fund’s annualized expense ratio for the 6-month period, multiplied by the average account value over the period, multiplied by the number of days in the most recent fiscal half year (181), and divided by the days in the year (365) to reflect the half-year period. The annualized expense ratio of the Investor Class was 1.22%, and the I Class was 1.06%.
EMERGING MARKETS STOCK FUND
Proof #5

12
T. RowE PRICE EMERgIng MaRkETS SToCk Fund
Since InceptionPeriods Ended 3/31/18 1 Year 5 Years 10 Years Inception date
Emerging Markets Stock Fund 30.75% 7.56% 3.07% ‒ ‒
Emerging Markets Stock Fund‒I Class 30.93 ‒ ‒ 20.91% 8/28/15
The fund’s performance information represents only past performance and is not necessarily an indication of future results. Current performance may be lower or higher than the performance data cited. Share price, principal value, and return will vary, and you may have a gain or loss when you sell your shares. For the most recent month-end performance, please visit our website (troweprice.com) or contact a T. Rowe Price representative at 1-800-225-5132 or, for I Class shares, 1-800-638-8790. The performance information shown does not reflect the deduction of a 2% redemption fee on shares held for 90 days or less. If it did, the performance would be lower. This table provides returns through the most recent calendar quarter-end rather than through the end of the fund’s fiscal period. It shows how the fund would have performed each year if its actual (or cumulative) returns for the periods shown had been earned at a constant rate. Average annual total return figures include changes in principal value, reinvested dividends, and capital gain distributions. Returns do not reflect taxes that the shareholder may pay on fund distributions or the redemption of fund shares. When assessing performance, investors should consider both short- and long-term returns.
QUARTER-END RETURNS
Proof #5

13
FINANCIAL HIGHLIGHTS For a share outstanding throughout each period
T. RowE PRICE EMERgIng MaRkETS SToCk Fund
Unaudited
Investor Class
6 Months Ended
4/30/18
Year Ended
10/31/17 10/31/16 10/31/15 10/31/14 10/31/13 NET ASSET VALUE
Beginning of period $ 43.24 $ 34.04 $ 29.96 $ 34.69 $ 33.61 $ 32.31
Investment activities
Net investment income(1) 0.05 0.19 0.15(2) 0.17 0.19 0.24
Net realized and unrealized gain / loss 1.84 9.23 4.09 (4.62) 1.13 1.22
Total from investment activities 1.89 9.42 4.24 (4.45) 1.32 1.46
Distributions
Net investment income (0.18) (0.16) (0.15) (0.19) (0.24) (0.16)
Net realized gain (0.08) (0.06) (0.01) (0.09) – –
Total distributions (0.26) (0.22) (0.16) (0.28) (0.24) (0.16)
NET ASSET VALUE
End of period $ 44.87 $ 43.24 $ 34.04 $ 29.96 $ 34.69 $ 33.61
Ratios/Supplemental Data Total return (3) 4.38% 27.92% 14.25%(2) (12.85)% 3.99% 4.52%
Ratio of total expenses to average net assets 1.22%(4) 1.23% 1.26%(2) 1.24% 1.24% 1.25%
Ratio of net investment income to average net assets 0.24%(4) 0.53% 0.50%(2) 0.52% 0.58% 0.72%
Proof #5

14
FINANCIAL HIGHLIGHTS For a share outstanding throughout each period
The accompanying notes are an integral part of these financial statements.
T. RowE PRICE EMERgIng MaRkETS SToCk Fund
Unaudited
6 Months Ended
4/30/18
Year Ended
10/31/17 10/31/16 10/31/15 10/31/14 10/31/13
Portfolio turnover rate 10.3% 30.9% 24.4% 15.8% 23.3% 29.9%
Net assets, end of period (in millions) $ 8,565 $ 8,695 $ 7,448 $ 8,726 $ 7,953 $ 7,306
(1) Per share amounts calculated using average shares outstanding method. (2) Excludes expenses waived related to the waiver of fund-level expenses ratably across all classes
in accordance with SEC rules. (3) Total return reflects the rate that an investor would have earned on an investment in the fund
during each period, assuming reinvestment of all distributions and payment of no redemption or account fees. Total return is not annualized for periods less than one year.
(4) Annualized
Proof #5

15
FINANCIAL HIGHLIGHTS For a share outstanding throughout each period
The accompanying notes are an integral part of these financial statements.
T. RowE PRICE EMERgIng MaRkETS SToCk Fund
Unaudited
I Class
6 Months Ended
4/30/18 10/31/17 10/31/16
8/28/15(1) Through 10/31/15
NET ASSET VALUE
Beginning of period $ 43.26 $ 34.10 $ 29.97 $ 28.93
Investment activities
Net investment income (2) 0.10 0.25(5) 0.27(6) –(3)
Net realized and unrealized gain / loss 1.83 9.21 4.03 1.04
Total from investment activities 1.93 9.46 4.30 1.04
Distributions
Net investment income (0.24) (0.24) (0.16) –
Net realized gain (0.08) (0.06) (0.01) –
Total distributions (0.32) (0.30) (0.17) –
NET ASSET VALUE
End of period $ 44.87 $ 43.26 $ 34.10 $ 29.97
Ratios/Supplemental Data Total return(4) 4.47%(5) 28.08%(5) 14.45%(6) 3.59%
Ratio of total expenses to average net assets 1.06%(7) 1.08%(5) 1.09%(6) 1.09%(7)
Ratio of net investment income to average net assets 0.45%(7) 0.68%(5) 0.89%(6) 0.05%(7)
Portfolio turnover rate 10.3% 30.9% 24.4% 15.8%
Net assets, end of period (in millions) $ 2,875 $ 2,039 $ 1,559 $ 9
(1) Inception date (2) Per share amounts calculated using average shares outstanding method. (3) Amounts round to less than $0.01 per share. (4) Total return reflects the rate that an investor would have earned on an investment in the fund
during each period, assuming reinvestment of all distributions and payment of no redemption or account fees. Total return is not annualized for periods less than one year.
(5) See Note 6. Includes expenses repaid (0.00% of average net assets) related to its contractual expense limitation.
(6) See Note 6. Excludes expenses in excess of a 0.05% contractual operating expense limitation in effect through 2/29/20.
(7) Annualized
Proof #5

T. RowE PRICE EMERgIng MaRkETS SToCk Fund
April 30, 2018 (Unaudited)
PORTFOLIO OF INVESTMENTS‡ Shares $ Value
(Cost and value in $000s)
16
ARGENTINA 1.6%
Common Stocks 1.6%
Loma Negra Cia Industrial Argentina, ADR (USD) (1) 1,471,610 30,521
MercadoLibre (USD) 292,300 99,268
Tenaris, ADR (USD) 1,414,400 52,871
Total Argentina (Cost $99,143) 182,660
BELGIUM 0.4%
Common Stocks 0.4%
Anheuser-Busch InBev 441,993 43,905
Total Belgium (Cost $53,131) 43,905
BRAZIL 9.4%
Common Stocks 4.6%
BR Malls Participacoes 12,652,302 39,439
Lojas Renner 25,597,326 238,276
Multiplan Empreendimentos Imobiliarios 2,167,559 41,158
Raia Drogasil 10,332,343 202,860
521,733
Preferred Stocks 4.8%
Banco Bradesco (2) 11,296,714 111,477
Itau Unibanco Holding (2) 29,762,212 433,367
544,844
Total Brazil (Cost $784,875) 1,066,577
CHILE 1.9%
Common Stocks 1.9%
Banco Santander Chile, ADR (USD) 4,018,861 132,743
Proof #5

T. RowE PRICE EMERgIng MaRkETS SToCk Fund
Shares $ Value
(Cost and value in $000s)
17
SACI Falabella 8,739,060 84,723
Total Chile (Cost $165,876) 217,466
CHINA 25.1%
Common Stocks 23.2%
58.com, ADR (USD) (1) 690,300 60,325
AAC Technologies Holdings (HKD) 3,530,000 50,665
Alibaba Group Holding, ADR (USD) (1) 3,590,074 640,972
Anhui Conch Cement, H Shares (HKD) 13,143,500 82,035
Baidu, ADR (USD) (1) 917,100 230,100
China Longyuan Power, H Shares (HKD) 46,372,000 45,548
China Mengniu Dairy (HKD) 38,632,000 124,541
CSPC Pharmaceutical (HKD) 30,160,000 76,819
Ctrip.com International, ADR (USD) (1) 2,378,100 97,264
Hengan International Group (HKD) 14,258,000 126,801
Huaneng Renewables, H Shares (HKD) 105,412,000 46,814
Ping An Insurance, H Shares (HKD) 20,986,500 205,068
Sunny Optical Technology (HKD) 5,292,600 86,363
TAL Education, ADR (USD) 1,386,200 50,485
Tencent Holdings (HKD) 14,524,900 714,087
Wuxi Biologics (HKD) (1) 1,346,000 12,210
2,650,097
Common Stocks - China A shares 1.9%
Anhui Conch Cement (3) 9,953,666 53,217
Hangzhou Hikvision Digital Technology (3) 12,806,850 77,427
Hangzhou Hikvision Digital Technology (CNH) 815,900 4,934
Kweichow Moutai (3) 591,284 61,457
Midea (CNH) 1,799,983 14,610
Midea (3) 967,200 7,849
219,494
Total China (Cost $1,596,787) 2,869,591
Proof #5

T. RowE PRICE EMERgIng MaRkETS SToCk Fund
Shares $ Value
(Cost and value in $000s)
18
COLOMBIA 0.3%
Common Stocks 0.3%
Grupo Aval Acciones y Valores, ADR (USD) 4,241,514 37,580
Total Colombia (Cost $49,256) 37,580
HONG KONG 3.0%
Common Stocks 3.0%
AIA Group 38,040,000 339,971
Total Hong Kong (Cost $214,934) 339,971
HUNGARY 0.5%
Common Stocks 0.5%
OTP Bank 1,333,387 58,140
Total Hungary (Cost $53,491) 58,140
INDIA 7.0%
Common Stocks 7.0%
Axis Bank 7,997,148 61,853
HDFC Bank 4,478,808 134,433
Housing Development Finance 6,011,416 169,035
ICICI Bank 18,519,659 78,918
Infosys 2,906,381 52,109
Maruti Suzuki India 680,011 89,420
NTPC Limited 13,586,697 34,956
Power Grid Corp of India 17,450,518 54,192
Yes Bank 23,610,791 127,078
Total India (Cost $514,902) 801,994
INDONESIA 2.2%
Common Stocks 2.2%
Astra International 193,870,100 99,228
Proof #5
T. RowE PRICE EMERgIng MaRkETS SToCk Fund
Shares $ Value
(Cost and value in $000s)
19
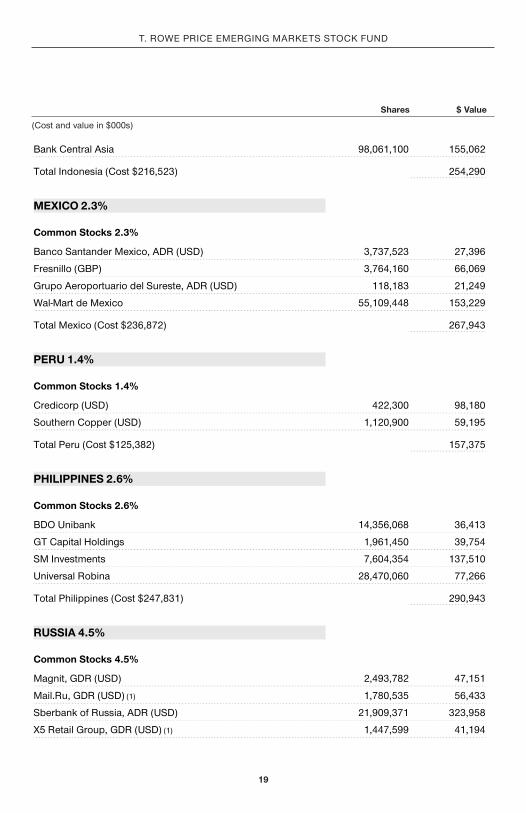
Bank Central Asia 98,061,100 155,062
Total Indonesia (Cost $216,523) 254,290
MEXICO 2.3%
Common Stocks 2.3%
Banco Santander Mexico, ADR (USD) 3,737,523 27,396
Fresnillo (GBP) 3,764,160 66,069
Grupo Aeroportuario del Sureste, ADR (USD) 118,183 21,249
Wal-Mart de Mexico 55,109,448 153,229
Total Mexico (Cost $236,872) 267,943
PERU 1.4%
Common Stocks 1.4%
Credicorp (USD) 422,300 98,180
Southern Copper (USD) 1,120,900 59,195
Total Peru (Cost $125,382) 157,375
PHILIPPINES 2.6%
Common Stocks 2.6%
BDO Unibank 14,356,068 36,413
GT Capital Holdings 1,961,450 39,754
SM Investments 7,604,354 137,510
Universal Robina 28,470,060 77,266
Total Philippines (Cost $247,831) 290,943
RUSSIA 4.5%
Common Stocks 4.5%
Magnit, GDR (USD) 2,493,782 47,151
Mail.Ru, GDR (USD) (1) 1,780,535 56,433
Sberbank of Russia, ADR (USD) 21,909,371 323,958
X5 Retail Group, GDR (USD) (1) 1,447,599 41,194
Proof #5

T. RowE PRICE EMERgIng MaRkETS SToCk Fund
Shares $ Value
(Cost and value in $000s)
20
Yandex (USD) (1) 1,497,230 49,948
Total Russia (Cost $430,068) 518,684
SOUTH AFRICA 8.5%
Common Stocks 8.5%
Aspen Pharmacare Holdings 3,343,453 72,090
Barclays Africa 3,403,120 49,846
Bid 2,092,351 48,099
Clicks Group 3,454,578 59,063
FirstRand 35,030,541 187,607
Mr Price Group 1,533,800 33,658
Naspers, N Shares 719,444 175,271
Sanlam 23,166,157 146,341
Shoprite Holdings 10,125,969 201,465
Total South Africa (Cost $836,952) 973,440
SOUTH KOREA 11.2%
Common Stocks 10.1%
AmorePacific 405,229 54,000
LG Household & Health Care 253,728 323,980
NAVER 163,870 109,275
Samsung Electronics 267,634 663,360
1,150,615
Preferred Stocks 1.1%
Samsung Electronics (2) 62,209 123,696
123,696
Total South Korea (Cost $671,608) 1,274,311
Proof #5

T. RowE PRICE EMERgIng MaRkETS SToCk Fund
Shares $ Value
(Cost and value in $000s)
21
TAIWAN 9.7%
Common Stocks 9.7%
Catcher Technology 9,555,000 105,967
Largan Precision 2,178,000 253,319
President Chain Store 9,590,000 94,265
Taiwan Semiconductor Manufacturing 75,557,111 575,545
Uni-President Enterprises 35,399,410 85,194
Total Taiwan (Cost $855,405) 1,114,290
THAILAND 3.0%
Common Stocks 3.0%
Airports of Thailand 43,382,700 98,044
CP ALL 89,141,200 245,731
Total Thailand (Cost $196,353) 343,775
TURKEY 0.7%
Common Stocks 0.7%
BIM Birlesik Magazalar 4,933,114 83,817
Total Turkey (Cost $74,969) 83,817
UNITED ARAB EMIRATES 1.9%
Common Stocks 1.9%
DP World (USD) 2,356,463 52,314
Emaar Malls PJSC (1) 48,092,656 29,054
First Abu Dhabi Bank 39,770,877 134,059
Total United Arab Emirates (Cost $184,712) 215,427
Proof #5

T. RowE PRICE EMERgIng MaRkETS SToCk Fund
Shares $ Value
(Cost and value in $000s)
22
SHORT-TERM INVESTMENTS 2.5%
Money Market Funds 2.5%
T. Rowe Price Government Reserve Fund, 1.72% (4)(5) 288,806,124 288,806
Total Short-Term Investments (Cost $288,806) 288,806
Total Investments in Securities
99.7% of Net Assets (Cost $7,897,876) $ 11,400,985
‡
Country classifications are generally based on MSCI categories or another unaffiliated third party data provider; Shares are denominated in the currency of the country presented unless otherwise noted.
(1) Non-income producing (2)
Preferred stocks are shares that carry certain preferential rights. The dividend rate may not be consistent each pay period and could be zero for a particular year.
(3)
China A shares held through the QFII are subject to certain restrictions. See Note 3.
(4) Seven-day yield (5) Affiliated Company
ADR American Depositary Receipts CNH Offshore China Renminbi GBP British Pound GDR Global Depositary Receipts HKD Hong Kong Dollar USD U.S. Dollar
Proof #5

AFFILIATED COMPANIES
($000s)
T. RowE PRICE EMERgIng MaRkETS SToCk Fund
23
The accompanying notes are an integral part of these financial statements.
The fund may invest in certain securities that are considered affiliated companies. As defined by the 1940 Act, an affiliated company is one in which the fund owns 5% or more of the outstanding voting securities, or a company that is under common ownership or control. The following securities were considered affiliated companies for all or some portion of the six months ended April 30, 2018. Net realized gain (loss), investment income, change in net unrealized gain/loss, and purchase and sales cost reflect all activity for the period then ended.
Affiliate
Net Realized Gain(Loss)
Change in NetUnrealizedGain/Loss
InvestmentIncome
T. Rowe Price Government Reserve Fund $ — $ — $ 2,099 Totals $ —# $ — $ 2,099+ Supplementary Investment Schedule
Affiliate
Value10/31/17
PurchaseCost
SalesCost
Value4/30/18
T. Rowe Price Government Reserve Fund $ 448,313 ¤ ¤ $ 288,806 $ 288,806^
# Capital gain/loss distributions from mutual funds represented $0 of the net realized gain
(loss). + Investment income comprised $2,099 of dividend income and $0 of interest income. ¤ Purchase and sale information not shown for cash management funds. ^ The cost basis of investments in affiliated companies was $288,806.
Proof #5

T. RowE PRICE EMERgIng MaRkETS SToCk Fund
April 30, 2018 (Unaudited)
The accompanying notes are an integral part of these financial statements.
($000s, except shares and per share amounts)
STATEMENT OF ASSETS AND LIABILITIES
24
Assets
Investments in securities, at value (cost $7,897,876) $ 11,400,985
Foreign currency (cost $23,070) 22,999
Dividends receivable 19,009
Receivable for shares sold 13,389
Receivable for investment securities sold 12,842
Other assets 16,850
Total assets 11,486,074
Liabilities
Payable for investment securities purchased 11,705
Investment management fees payable 9,893
Payable for shares redeemed 6,840
Due to affiliates 512
Payable to directors 5
Other liabilities 17,221
Total liabilities 46,176
NET ASSETS $ 11,439,898 Net Assets Consist of:
Undistributed net investment income $ 9,488
Accumulated undistributed net realized gain 15,140
Net unrealized gain 3,502,685
Paid-in capital applicable to 254,954,837 shares of $0.01 par value capital stock outstanding; 18,000,000,000 shares of the Corporation authorized 7,912,585
NET ASSETS $ 11,439,898 NET ASSET VALUE PER SHARE Investor Class ($8,565,084,571 / 190,889,423 shares outstanding) $ 44.87
I Class ($2,874,813,760 / 64,065,414 shares outstanding) $ 44.87
Proof #5

T. RowE PRICE EMERgIng MaRkETS SToCk Fund
($000s)
STATEMENT OF OPERATIONS
The accompanying notes are an integral part of these financial statements.
25
Unaudited
6 Months Ended
4/30/18Investment Income (Loss)
Income
Dividend (net of foreign taxes of $11,211) $ 84,190
Expenses Investment management 59,520 Shareholder servicing
Investor Class $ 7,094 I Class 11 7,105
Prospectus and shareholder reports Investor Class 99 I Class 37 136
Custody and accounting 680 Registration 52 Legal and audit 23 Directors 19 Proxy and annual meeting 54 Miscellaneous 344
Total expenses 67,933
Net investment income 16,257 Realized and Unrealized Gain / Loss
Net realized gain (loss) Securities 132,324 Foreign currency transactions (865)
Net realized gain 131,459 Change in net unrealized gain / loss
Securities 330,445 Other assets and liabilities denominated in foreign currencies (150)
Change in net unrealized gain / loss 330,295
Net realized and unrealized gain / loss 461,754 INCREASE IN NET ASSETS FROM OPERATIONS $ 478,011
Proof #5

T. RowE PRICE EMERgIng MaRkETS SToCk Fund
($000s)
STATEMENT OF CHANGES IN NET ASSETS
26
Unaudited
6 MonthsEnded
4/30/18
Year Ended
10/31/17Increase (Decrease) in Net Assets
Operations Net investment income $ 16,257 $ 48,546 Net realized gain 131,459 768,049 Change in net unrealized gain / loss 330,295 1,304,765 Increase in net assets from operations 478,011 2,121,360
Distributions to shareholders
Net investment income Investor Class (35,676) (32,234) I Class (13,059) (11,166)
Net realized gain Investor Class (15,856) (12,088) I Class (4,353) (2,792)
Decrease in net assets from distributions (68,944) (58,280) Capital share transactions*
Shares sold Investor Class 849,336 1,976,832 I Class 1,128,452 811,762
Distributions reinvested Investor Class 44,838 43,424 I Class 15,571 13,522
Shares redeemed Investor Class (1,362,158) (2,416,257) I Class (379,464) (765,924)
Redemption fees received 551 432 Increase (decrease) in net assets from capital share transactions 297,126 (336,209)
Net Assets
Increase during period 706,193 1,726,871
Beginning of period 10,733,705 9,006,834 End of period $ 11,439,898 $ 10,733,705
Proof #5

T. RowE PRICE EMERgIng MaRkETS SToCk Fund
The accompanying notes are an integral part of these financial statements.
($000s)
STATEMENT OF CHANGES IN NET ASSETS
27
Unaudited
6 MonthsEnded
4/30/18
Year Ended
10/31/17 Undistributed net investment income 9,488 41,966 *Share information
Shares sold Investor Class 18,541 50,559 I Class 24,800 21,889
Distributions reinvested Investor Class 1,016 1,384 I Class 353 431
Shares redeemed Investor Class (29,770) (69,621) I Class (8,210) (20,904)
Increase (decrease) in shares outstanding 6,730 (16,262)
Proof #5
T. RowE PRICE EMERgIng MaRkETS SToCk Fund
NOTES TO FINANCIAL STATEMENTS
28
Unaudited
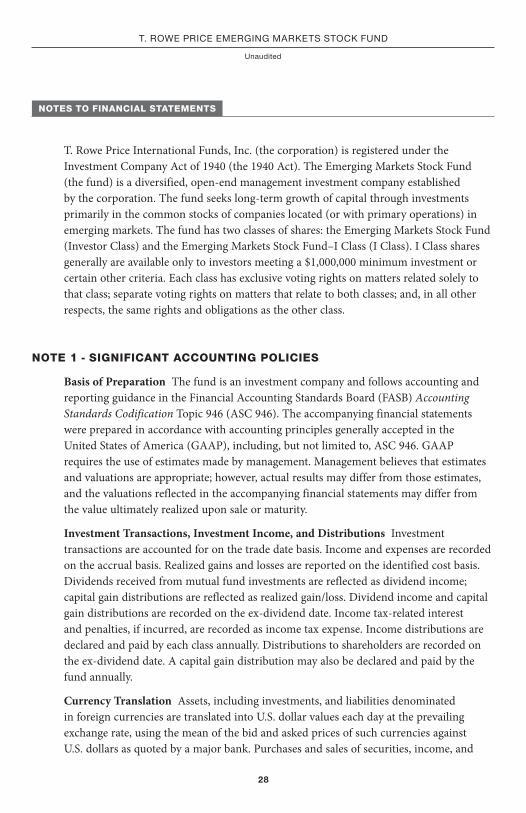
T. Rowe Price International Funds, Inc. (the corporation) is registered under the Investment Company Act of 1940 (the 1940 Act). The Emerging Markets Stock Fund (the fund) is a diversified, open-end management investment company established by the corporation. The fund seeks long-term growth of capital through investments primarily in the common stocks of companies located (or with primary operations) in emerging markets. The fund has two classes of shares: the Emerging Markets Stock Fund (Investor Class) and the Emerging Markets Stock Fund–I Class (I Class). I Class shares generally are available only to investors meeting a $1,000,000 minimum investment or certain other criteria. Each class has exclusive voting rights on matters related solely to that class; separate voting rights on matters that relate to both classes; and, in all other respects, the same rights and obligations as the other class.
NOTE 1 - SIGNIFICANT ACCOUNTING POLICIES
Basis of Preparation The fund is an investment company and follows accounting and reporting guidance in the Financial Accounting Standards Board (FASB) Accounting Standards Codification Topic 946 (ASC 946). The accompanying financial statements were prepared in accordance with accounting principles generally accepted in the United States of America (GAAP), including, but not limited to, ASC 946. GAAP requires the use of estimates made by management. Management believes that estimates and valuations are appropriate; however, actual results may differ from those estimates, and the valuations reflected in the accompanying financial statements may differ from the value ultimately realized upon sale or maturity.
Investment Transactions, Investment Income, and Distributions Investment transactions are accounted for on the trade date basis. Income and expenses are recorded on the accrual basis. Realized gains and losses are reported on the identified cost basis. Dividends received from mutual fund investments are reflected as dividend income; capital gain distributions are reflected as realized gain/loss. Dividend income and capital gain distributions are recorded on the ex-dividend date. Income tax-related interest and penalties, if incurred, are recorded as income tax expense. Income distributions are declared and paid by each class annually. Distributions to shareholders are recorded on the ex-dividend date. A capital gain distribution may also be declared and paid by the fund annually.
Currency Translation Assets, including investments, and liabilities denominated in foreign currencies are translated into U.S. dollar values each day at the prevailing exchange rate, using the mean of the bid and asked prices of such currencies against U.S. dollars as quoted by a major bank. Purchases and sales of securities, income, and
Proof #5

T. RowE PRICE EMERgIng MaRkETS SToCk Fund
29
expenses are translated into U.S. dollars at the prevailing exchange rate on the respective date of such transaction. The portion of the results of operations attributable to changes in foreign exchange rates on investments is not bifurcated from the portion attributable to changes in market prices. The effect of changes in foreign currency exchange rates on realized and unrealized security gains and losses is reflected as a component of security gains and losses.
Class Accounting Shareholder servicing, prospectus, and shareholder report expenses incurred by each class are charged directly to the class to which they relate. Expenses common to both classes and investment income and realized and unrealized gains and losses are allocated based upon the relative daily net assets of each class. To the extent any expenses are waived or reimbursed in accordance with an expense limitation (see Note 6), the waiver or reimbursement is charged to the applicable class or allocated across the classes in the same manner as the related expense.
In-Kind Redemptions In accordance with guidelines described in the fund’s prospectus, and when considered to be in the best interest of all shareholders, the fund may distribute portfolio securities rather than cash as payment for a redemption of fund shares (in-kind redemption). Gains and losses realized on in-kind redemptions are not recognized for tax purposes and are reclassified from undistributed realized gain (loss) to paid-in capital. During the six months ended April 30, 2018, the fund realized $94,079,000 of net gain on $172,359,000 of in-kind redemptions.
Redemption Fees A 2% fee is assessed on redemptions of fund shares held for 90 days or less to deter short-term trading and to protect the interests of long-term shareholders. Redemption fees are withheld from proceeds that shareholders receive from the sale or exchange of fund shares. The fees are paid to the fund and are recorded as an increase to paid-in capital. The fees may cause the redemption price per share to differ from the net asset value per share.
New Accounting Guidance In March 2017, the FASB issued amended guidance to shorten the amortization period for certain callable debt securities held at a premium. The guidance is effective for fiscal years and interim periods beginning after December 15, 2018. Adoption will have no effect on the fund’s net assets or results of operations.
Indemnification In the normal course of business, the fund may provide indemnification in connection with its officers and directors, service providers, and/or private company investments. The fund’s maximum exposure under these arrangements is unknown; however, the risk of material loss is currently considered to be remote.
Proof #5

T. RowE PRICE EMERgIng MaRkETS SToCk Fund
30
NOTE 2 - VALUATION
The fund’s financial instruments are valued and each class’s net asset value (NAV) per share is computed at the close of the New York Stock Exchange (NYSE), normally 4 p.m. ET, each day the NYSE is open for business. However, the NAV per share may be calculated at a time other than the normal close of the NYSE if trading on the NYSE is restricted, if the NYSE closes earlier, or as may be permitted by the SEC.
Fair Value The fund’s financial instruments are reported at fair value, which GAAP defines as the price that would be received to sell an asset or paid to transfer a liability in an orderly transaction between market participants at the measurement date. The T. Rowe Price Valuation Committee (the Valuation Committee) is an internal committee that has been delegated certain responsibilities by the fund’s Board of Directors (the Board) to ensure that financial instruments are appropriately priced at fair value in accordance with GAAP and the 1940 Act. Subject to oversight by the Board, the Valuation Committee develops and oversees pricing-related policies and procedures and approves all fair value determinations. Specifically, the Valuation Committee establishes procedures to value securities; determines pricing techniques, sources, and persons eligible to effect fair value pricing actions; oversees the selection, services, and performance of pricing vendors; oversees valuation-related business continuity practices; and provides guidance on internal controls and valuation-related matters. The Valuation Committee reports to the Board and has representation from legal, portfolio management and trading, operations, risk management, and the fund’s treasurer.
Various valuation techniques and inputs are used to determine the fair value of financial instruments. GAAP establishes the following fair value hierarchy that categorizes the inputs used to measure fair value:
Level 1 – quoted prices (unadjusted) in active markets for identical financial instruments that the fund can access at the reporting date
Level 2 – inputs other than Level 1 quoted prices that are observable, either directly or indirectly (including, but not limited to, quoted prices for similar financial instruments in active markets, quoted prices for identical or similar financial instruments in inactive markets, interest rates and yield curves, implied volatilities, and credit spreads)
Level 3 – unobservable inputs
Observable inputs are developed using market data, such as publicly available information about actual events or transactions, and reflect the assumptions that market participants would use to price the financial instrument. Unobservable inputs are those for which market data are not available and are developed using the best information available about the assumptions that market participants would use to price the financial
Proof #5

T. RowE PRICE EMERgIng MaRkETS SToCk Fund
31
instrument. GAAP requires valuation techniques to maximize the use of relevant observable inputs and minimize the use of unobservable inputs. When multiple inputs are used to derive fair value, the financial instrument is assigned to the level within the fair value hierarchy based on the lowest-level input that is significant to the fair value of the financial instrument. Input levels are not necessarily an indication of the risk or liquidity associated with financial instruments at that level but rather the degree of judgment used in determining those values.
Valuation Techniques Equity securities listed or regularly traded on a securities exchange or in the over-the-counter (OTC) market are valued at the last quoted sale price or, for certain markets, the official closing price at the time the valuations are made. OTC Bulletin Board securities are valued at the mean of the closing bid and asked prices. A security that is listed or traded on more than one exchange is valued at the quotation on the exchange determined to be the primary market for such security. Listed securities not traded on a particular day are valued at the mean of the closing bid and asked prices for domestic securities and the last quoted sale or closing price for international securities.
For valuation purposes, the last quoted prices of non-U.S. equity securities may be adjusted to reflect the fair value of such securities at the close of the NYSE. If the fund determines that developments between the close of a foreign market and the close of the NYSE will affect the value of some or all of its portfolio securities, the fund will adjust the previous quoted prices to reflect what it believes to be the fair value of the securities as of the close of the NYSE. In deciding whether it is necessary to adjust quoted prices to reflect fair value, the fund reviews a variety of factors, including developments in foreign markets, the performance of U.S. securities markets, and the performance of instruments trading in U.S. markets that represent foreign securities and baskets of foreign securities. The fund may also fair value securities in other situations, such as when a particular foreign market is closed but the fund is open. The fund uses outside pricing services to provide it with quoted prices and information to evaluate or adjust those prices. The fund cannot predict how often it will use quoted prices and how often it will determine it necessary to adjust those prices to reflect fair value. As a means of evaluating its security valuation process, the fund routinely compares quoted prices, the next day’s opening prices in the same markets, and adjusted prices.
Actively traded equity securities listed on a domestic exchange generally are categorized in Level 1 of the fair value hierarchy. Non-U.S. equity securities generally are categorized in Level 2 of the fair value hierarchy despite the availability of quoted prices because, as described above, the fund evaluates and determines whether those quoted prices reflect fair value at the close of the NYSE or require adjustment. OTC Bulletin Board securities, certain preferred securities, and equity securities traded in inactive markets generally are categorized in Level 2 of the fair value hierarchy.
Proof #5

T. RowE PRICE EMERgIng MaRkETS SToCk Fund
32
Investments in mutual funds are valued at the mutual fund’s closing NAV per share on the day of valuation and are categorized in Level 1 of the fair value hierarchy. Assets and liabilities other than financial instruments, including short-term receivables and payables, are carried at cost, or estimated realizable value, if less, which approximates fair value.
Thinly traded financial instruments and those for which the above valuation procedures are inappropriate or are deemed not to reflect fair value are stated at fair value as determined in good faith by the Valuation Committee. The objective of any fair value pricing determination is to arrive at a price that could reasonably be expected from a current sale. Financial instruments fair valued by the Valuation Committee are primarily private placements, restricted securities, warrants, rights, and other securities that are not publicly traded.
Subject to oversight by the Board, the Valuation Committee regularly makes good faith judgments to establish and adjust the fair valuations of certain securities as events occur and circumstances warrant. For instance, in determining the fair value of an equity investment with limited market activity, such as a private placement or a thinly traded public company stock, the Valuation Committee considers a variety of factors, which may include, but are not limited to, the issuer’s business prospects, its financial standing and performance, recent investment transactions in the issuer, new rounds of financing, negotiated transactions of significant size between other investors in the company, relevant market valuations of peer companies, strategic events affecting the company, market liquidity for the issuer, and general economic conditions and events. In consultation with the investment and pricing teams, the Valuation Committee will determine an appropriate valuation technique based on available information, which may include both observable and unobservable inputs. The Valuation Committee typically will afford greatest weight to actual prices in arm’s length transactions, to the extent they represent orderly transactions between market participants, transaction information can be reliably obtained, and prices are deemed representative of fair value. However, the Valuation Committee may also consider other valuation methods such as market-based valuation multiples; a discount or premium from market value of a similar, freely traded security of the same issuer; or some combination. Fair value determinations are reviewed on a regular basis and updated as information becomes available, including actual purchase and sale transactions of the issue. Because any fair value determination involves a significant amount of judgment, there is a degree of subjectivity inherent in such pricing decisions, and fair value prices determined by the Valuation Committee could differ from those of other market participants. Depending on the relative significance of unobservable inputs, including the valuation technique(s) used, fair valued securities may be categorized in Level 2 or 3 of the fair value hierarchy.
Proof #5

T. RowE PRICE EMERgIng MaRkETS SToCk Fund
33
Valuation Inputs The following table summarizes the fund’s financial instruments, based on the inputs used to determine their fair values on April 30, 2018:
($000s) Level 1 Level 2 Level 3 Total Value
Quoted Prices
Significant Observable
Inputs
Significant Unobservable
Inputs
Investments in Securities, except: $ — $ 6,860,880 $ — $ 6,860,880
argentina 182,660 — — 182,660
Chile 132,743 84,723 — 217,466
China 1,079,146 1,790,445 — 2,869,591
Colombia 37,580 — — 37,580
Mexico 48,645 219,298 — 267,943
Peru 157,375 — — 157,375
Russia 49,948 468,736 — 518,684
Short-Term Investments 288,806 — — 288,806
Total $ 1,976,903 $ 9,424,082 $ — $ 11,400,985
There were no material transfers between Levels 1 and 2 during the six months ended April 30, 2018.
NOTE 3 - OTHER INVESTMENT TRANSACTIONS
Consistent with its investment objective, the fund engages in the following practices to manage exposure to certain risks and/or to enhance performance. The investment objective, policies, program, and risk factors of the fund are described more fully in the fund’s prospectus and Statement of Additional Information.
Emerging and Frontier Markets The fund may invest, either directly or through investments in T. Rowe Price institutional funds, in securities of companies located in, issued by governments of, or denominated in or linked to the currencies of emerging and frontier market countries; at period-end, approximately 92% of the fund’s net assets were invested in emerging markets and 2% in frontier markets. Emerging markets, and to a greater extent frontier markets, generally have economic structures that are less diverse and mature, and political systems that are less stable, than developed countries. These markets may be subject to greater political, economic, and social uncertainty and differing regulatory environments that may potentially impact the fund’s ability to buy
Proof #5

T. RowE PRICE EMERgIng MaRkETS SToCk Fund
34
or sell certain securities or repatriate proceeds to U.S. dollars. Such securities are often subject to greater price volatility, less liquidity, and higher rates of inflation than U.S. securities. Investing in frontier markets is significantly riskier than investing in other countries, including emerging markets.
China A Shares The fund invests in certain Chinese equity securities (A shares) that have limited availability to investors outside of China. The fund gains access to the A share market through the Shanghai-Hong Kong Stock Connect program (Shanghai Stock Connect), through the Shenzhen-Hong Kong Stock Connect program (Shenzhen Stock Connect), or through a wholly owned subsidiary of Price Associates, which serves as the registered Qualified Foreign Institutional Investor (QFII) for all participating T. Rowe Price-sponsored products (each a participating account). Related to A shares held through the QFII, investment decisions are specific to each participating account, and each account bears the economic consequences of its holdings and transactions in A shares. Further, the fund’s ability to repatriate cash associated with its A shares held through the QFII is subject to certain restrictions and administrative processes involving the Chinese government; consequently, the fund may experience substantial delays in gaining access to its assets or incur a loss of value in the event of noncompliance with governmental requirements. A shares acquired through the QFII are valued using the onshore renminbi exchange rate (CNY), and those acquired through the Shanghai Stock Connect and the Shenzhen Stock Connect are valued using the offshore renminbi exchange rate (CNH). CNY and CNH exchange rates may differ; accordingly, A shares of the same issue purchased through different channels may not have the same U.S. dollar value. Generally, the fund is not subject to capital gains tax related to its A share investments.
Other Purchases and sales of portfolio securities other than short-term securities aggregated $1,496,625,000 and $1,147,174,000, respectively, for the six months ended April 30, 2018.
NOTE 4 - FEDERAL INCOME TAXES
No provision for federal income taxes is required since the fund intends to continue to qualify as a regulated investment company under Subchapter M of the Internal Revenue Code and distribute to shareholders all of its taxable income and gains. Distributions determined in accordance with federal income tax regulations may differ in amount or character from net investment income and realized gains for financial reporting purposes. Financial reporting records are adjusted for permanent book/tax differences to reflect tax character but are not adjusted for temporary differences. The amount and character of tax-basis distributions and composition of net assets are finalized at fiscal year-end; accordingly, tax-basis balances have not been determined as of the date of this report.
Proof #5

T. RowE PRICE EMERgIng MaRkETS SToCk Fund
35
At April 30, 2018, the cost of investments for federal income tax purposes was $7,959,193,000. Net unrealized gain aggregated $3,441,368,000 at period-end, of which $3,742,573,000 related to appreciated investments and $301,205,000 related to depreciated investments.
NOTE 5 - FOREIGN TAXES
The fund is subject to foreign income taxes imposed by certain countries in which it invests. Additionally, certain foreign currency transactions are subject to tax, and capital gains realized upon disposition of securities issued in or by certain foreign countries are subject to capital gains tax imposed by those countries. All taxes are computed in accordance with the applicable foreign tax law, and, to the extent permitted, capital losses are used to offset capital gains. Taxes attributable to income are accrued by the fund as a reduction of income. Taxes incurred on the purchase of foreign currencies are recorded as realized loss on foreign currency transactions. Current and deferred tax expense attributable to capital gains is reflected as a component of realized or change in unrealized gain/loss on securities in the accompanying financial statements. At April 30, 2018, the fund had no deferred tax liability attributable to foreign securities and $8,708,000 of foreign capital loss carryforwards that expire in 2024.
NOTE 6 - RELATED PARTY TRANSACTIONS
The fund is managed by T. Rowe Price Associates, Inc. (Price Associates), a wholly owned subsidiary of T. Rowe Price Group, Inc. (Price Group). Price Associates has entered into a sub-advisory agreement(s) with one or more of its wholly owned subsidiaries, to provide investment advisory services to the fund. The investment management agreement between the fund and Price Associates provides for an annual investment management fee, which is computed daily and paid monthly. The fee consists of an individual fund fee, equal to 0.75% of the fund’s average daily net assets, and a group fee. The group fee rate is calculated based on the combined net assets of certain mutual funds sponsored by Price Associates (the group) applied to a graduated fee schedule, with rates ranging from 0.48% for the first $1 billion of assets to 0.265% for assets in excess of $650 billion. The fund’s group fee is determined by applying the group fee rate to the fund’s average daily net assets. At April 30, 2018, the effective annual group fee rate was 0.29%.
The I Class is subject to an operating expense limitation (I Class limit) pursuant to which Price Associates is contractually required to pay all operating expenses of the I Class, excluding management fees, interest, expenses related to borrowings, taxes, brokerage, and other non-recurring expenses permitted by the investment management agreement,
Proof #5

T. RowE PRICE EMERgIng MaRkETS SToCk Fund
36
to the extent such operating expenses, on an annualized basis, exceed 0.05% of average net assets. This agreement will continue until February 29, 2020, and may be renewed, revised, or revoked only with approval of the fund’s Board. The I Class is required to repay Price Associates for expenses previously paid to the extent the class’s net assets grow or expenses decline sufficiently to allow repayment without causing the class’s operating expenses (after the repayment is taken into account) to exceed both: (1) the expense limitation in place at the time such amounts were paid; and (2) the class’s current expense limitation. However, no repayment will be made more than three years after the date of a payment or waiver. For the six months ended April 30, 2018, the I Class operated below its expense limitation.
In addition, the fund has entered into service agreements with Price Associates and two wholly owned subsidiaries of Price Associates, each an affiliate of the fund (collectively, Price). Price Associates provides certain accounting and administrative services to the fund. T. Rowe Price Services, Inc. provides shareholder and administrative services in its capacity as the fund’s transfer and dividend-disbursing agent. T. Rowe Price Retirement Plan Services, Inc. provides subaccounting and recordkeeping services for certain retirement accounts invested in the Investor Class and I Class. For the six months ended April 30, 2018, expenses incurred pursuant to these service agreements were $46,000 for Price Associates; $587,000 for T. Rowe Price Services, Inc.; and $91,000 for T. Rowe Price Retirement Plan Services, Inc. The total amount payable at period-end pursuant to these service agreements is reflected as Due to Affiliates on the accompanying Statement of Assets and Liabilities.
Additionally, the fund is one of several mutual funds in which certain college savings plans managed by Price Associates may invest. As approved by the fund’s Board of Directors, shareholder servicing costs associated with each college savings plan are borne by the fund in proportion to the average daily value of its shares owned by the college savings plan. For the six months ended April 30, 2018, the fund was charged $166,000 for shareholder servicing costs related to the college savings plans, of which $134,000 was for services provided by Price. The total amount payable at period-end pursuant to this agreement is reflected as Due to Affiliates on the accompanying Statement of Assets and Liabilities. At April 30, 2018, approximately 2% of the outstanding shares of the Investor Class were held by college savings plans.
The fund is also one of several mutual funds sponsored by Price Associates (underlying Price funds) in which the T. Rowe Price Spectrum Funds (Spectrum Funds) and T. Rowe Price Retirement Funds (Retirement Funds) may invest. None of the Spectrum Funds or Retirement Funds invest in the underlying Price funds for the purpose of exercising management or control. Pursuant to special servicing agreements, expenses associated
Proof #5

T. RowE PRICE EMERgIng MaRkETS SToCk Fund
37
with the operation of the Spectrum Funds and Retirement Funds are borne by each underlying Price fund to the extent of estimated savings to it and in proportion to the average daily value of its shares owned by the Spectrum Funds and Retirement Funds. Expenses allocated under these special servicing agreements are reflected as shareholder servicing expense in the accompanying financial statements. For the six months ended April 30, 2018, the fund was allocated $66,000 of Spectrum Funds’ expenses and $3,865,000 of Retirement Funds’ expenses. Of these amounts, $1,335,000 related to services provided by Price. At period-end, the total amount payable to Price pursuant to these special servicing agreements is reflected as Due to Affiliates on the accompanying Statement of Assets and Liabilities. Additionally, redemption fees received by the Spectrum Funds are allocated to each underlying Price fund in proportion to the average daily value of its shares owned by the Spectrum Funds. Less than $1,000 of redemption fees reflected in the accompanying financial statements were received from the Spectrum Funds. At April 30, 2018, approximately 52% of the outstanding shares of the Investor Class were held by the Spectrum Funds and Retirement Funds.
In addition, other mutual funds, trusts, and other accounts managed by Price Associates or its affiliates (collectively, Price funds and accounts) may invest in the fund and are not subject to the special servicing agreements disclosed above. No Price fund or account may invest for the purpose of exercising management or control over the fund. At April 30, 2018, approximately 28% of the fund’s I Class’s outstanding shares were held by Price funds and accounts.
The fund may invest its cash reserves in certain open-end management investment companies managed by Price Associates and considered affiliates of the fund: the T. Rowe Price Government Reserve Fund or the T. Rowe Price Treasury Reserve Fund, organized as money market funds, or the T. Rowe Price Short-Term Fund, a short-term bond fund (collectively, the Price Reserve Funds). The Price Reserve Funds are offered as short-term investment options to mutual funds, trusts, and other accounts managed by Price Associates or its affiliates and are not available for direct purchase by members of the public. Cash collateral from securities lending is invested in the T. Rowe Price Short-Term Fund. The Price Reserve Funds pay no investment management fees.
The fund may participate in securities purchase and sale transactions with other funds or accounts advised by Price Associates (cross trades), in accordance with procedures adopted by the fund’s Board and Securities and Exchange Commission rules, which require, among other things, that such purchase and sale cross trades be effected at the independent current market price of the security. During the six months ended April 30, 2018, the fund had no purchases or sales cross trades with other funds or accounts advised by Price Associates.
Proof #5

38
T. RowE PRICE EMERgIng MaRkETS SToCk Fund
INFORMATION ON PROXY VOTING POLICIES, PROCEDURES, AND RECORDS
A description of the policies and procedures used by T. Rowe Price funds and portfolios to determine how to vote proxies relating to portfolio securities is available in each fund’s Statement of Additional Information. You may request this document by calling 1-800-225-5132 or by accessing the SEC’s website, sec.gov.
The description of our proxy voting policies and procedures is also available on our corporate website. To access it, please visit the following Web page:
https://www3.troweprice.com/usis/corporate/en/utility/policies.html
Scroll down to the section near the bottom of the page that says, “Proxy Voting Policies.” Click on the Proxy Voting Policies link in the shaded box.
HOW TO OBTAIN QUARTERLY PORTFOLIO HOLDINGS
The fund files a complete schedule of portfolio holdings with the Securities and Exchange Commission for the first and third quarters of each fiscal year on Form N-Q. The fund’s Form N-Q is available electronically on the SEC’s website (sec.gov); hard copies may be reviewed and copied at the SEC’s Public Reference Room, 100 F St. N.E., Washington, DC 20549. For more information on the Public Reference Room, call 1-800-SEC-0330.
Proof #5

39
T. RowE PRICE EMERgIng MaRkETS SToCk Fund
APPROVAL OF INVESTMENT MANAGEMENT AGREEMENT AND SUBADVISORY AGREEMENT
Each year, the fund’s Board of Directors (Board) considers the continuation of the investment management agreement (Advisory Contract) between the fund and its investment advisor, T. Rowe Price Associates, Inc. (Advisor), as well as the continuation of the investment subadvisory agreement (Subadvisory Contract) that the Advisor has entered into with T. Rowe Price International Ltd (Subadvisor) on behalf of the fund. In that regard, at an in-person meeting held on March 5–6, 2018 (Meeting), the Board, including a majority of the fund’s independent directors, approved the continuation of the fund’s Advisory Contract and Subadvisory Contract. At the Meeting, the Board considered the factors and reached the conclusions described below relating to the selection of the Advisor and Subadvisor and the approval of the Advisory Contract and Subadvisory Contract. The independent directors were assisted in their evaluation of the Advisory Contract and Subadvisory Contract by independent legal counsel from whom they received separate legal advice and with whom they met separately.
In providing information to the Board, the Advisor was guided by a detailed set of requests for information submitted by independent legal counsel on behalf of the independent directors. In considering and approving the Advisory Contract and Subadvisory Contract, the Board considered the information it believed was relevant, including, but not limited to, the information discussed below. The Board considered not only the specific information presented in connection with the Meeting but also the knowledge gained over time through interaction with the Advisor and Subadvisor about various topics. The Board meets regularly and, at each of its meetings, covers an extensive agenda of topics and materials and considers factors that are relevant to its annual consideration of the renewal of the T. Rowe Price funds’ advisory contracts, including performance and the services and support provided to the funds and their shareholders.
Services Provided by the Advisor and SubadvisorThe Board considered the nature, quality, and extent of the services provided to the fund by the Advisor and Subadvisor. These services included, but were not limited to, directing the fund’s investments in accordance with its investment program and the overall management of the fund’s portfolio, as well as a variety of related activities such as financial, investment operations, and administrative services; compliance; maintaining the fund’s records and registrations; and shareholder communications. The Board also reviewed the background and experience of the Advisor’s and Subadvisor’s senior management teams and investment personnel involved in the management of the fund, as well as the Advisor’s compliance record. The Board concluded that it was satisfied with the nature, quality, and extent of the services provided by the Advisor and Subadvisor.
Proof #5

40
T. RowE PRICE EMERgIng MaRkETS SToCk Fund
APPROVAL OF INVESTMENT MANAGEMENT AGREEMENT AND SUBADVISORY AGREEMENT (CONTINUED)
Investment Performance of the Fund The Board took into account discussions with the Advisor and reports that it receives throughout the year relating to fund performance. In connection with the Meeting, the Board reviewed the fund’s net annualized total returns for the 1-, 2-, 3-, 4-, 5-, and 10-year periods as of September 30, 2017, and compared these returns with the performance of a peer group of funds with similar investment programs and a wide variety of other previously agreed-upon comparable performance measures and market data, including those supplied by Broadridge, which is an independent provider of mutual fund data.
On the basis of this evaluation and the Board’s ongoing review of investment results, and factoring in the relative market conditions during certain of the performance periods, the Board concluded that the fund’s performance was satisfactory.
Costs, Benefits, Profits, and Economies of ScaleThe Board reviewed detailed information regarding the revenues received by the Advisor under the Advisory Contract and other benefits that the Advisor (and its affiliates, including the Subadvisor) may have realized from its relationship with the fund, including any research received under “soft dollar” agreements and commission-sharing arrangements with broker-dealers. The Board considered that the Advisor and Subadvisor may receive some benefit from soft-dollar arrangements pursuant to which research is received from broker-dealers that execute the fund’s portfolio transactions. The Board received information on the estimated costs incurred and profits realized by the Advisor from managing the T. Rowe Price funds. The Board also reviewed estimates of the profits realized from managing the fund in particular, and the Board concluded that the Advisor’s profits were reasonable in light of the services provided to the fund.
The Board also considered whether the fund benefits under the fee levels set forth in the Advisory Contract from any economies of scale realized by the Advisor. Under the Advisory Contract, the fund pays a fee to the Advisor for investment management services composed of two components—a group fee rate based on the combined average net assets of most of the T. Rowe Price funds (including the fund) that declines at certain asset levels and an individual fund fee rate based on the fund’s average daily net assets—and the fund pays its own expenses of operations (subject to a contractual expense limitation agreed to by the Advisor with respect to the I Class). Under the Subadvisory Contract, the Advisor may pay the Subadvisor up to 60% of the advisory fee that the Advisor receives from the fund. The Board concluded that the advisory fee structure for the fund continued to provide for a reasonable sharing of benefits from any economies of scale with the fund’s investors.
Proof #5

41
T. RowE PRICE EMERgIng MaRkETS SToCk Fund
APPROVAL OF INVESTMENT MANAGEMENT AGREEMENT AND SUBADVISORY AGREEMENT (CONTINUED)
Fees and ExpensesThe Board was provided with information regarding industry trends in management fees and expenses. Among other things, the Board reviewed data for peer groups that were compiled by Broadridge, which compared: (i) contractual management fees, total expenses, actual management fees, and nonmanagement expenses of the Investor Class of the fund with a group of competitor funds selected by Broadridge (Expense Group); and (ii) total expenses, actual management fees, and nonmanagement expenses of the Investor Class of the fund with a broader set of funds within the Lipper investment classification (Expense Universe). The Board considered the fund’s contractual management fee rate, actual management fee rate (which reflects the management fees actually received from the fund by the Advisor after any applicable waivers, reductions, or reimbursements), operating expenses, and total expenses (which reflects the net total expense ratio of the fund after any waivers, reductions, or reimbursements) in comparison with the information for the Broadridge peer groups. Broadridge generally constructed the peer groups by seeking the most comparable funds based on similar investment classifications and objectives, expense structure, asset size, and operating components and attributes and ranked funds into quintiles, with the first quintile representing the funds with the lowest relative expenses and the fifth quintile representing the funds with the highest relative expenses. The information provided to the Board indicated that the fund’s contractual management fee ranked in the fifth quintile (Expense Group), the fund’s actual management fee rate ranked in the fourth quintile (Expense Group and Expense Universe), and the fund’s total expenses ranked in the second and fifth quintiles (Expense Group) and second and third quintiles (Expense Universe).
The Board requested additional information from management with respect to the fund’s relative management fee and total expenses ranking in the fourth and fifth quintiles and reviewed and considered the information provided relating to the fund, other funds in the peer groups, and other factors that the Board determined to be relevant.
The Board also reviewed the fee schedules for institutional accounts and private accounts with similar mandates that are advised or subadvised by the Advisor and its affiliates. Management provided the Board with information about the Advisor’s responsibilities and services provided to subadvisory and other institutional account clients, including information about how the requirements and economics of the institutional business are fundamentally different from those of the mutual fund business. The Board considered information showing that the Advisor’s mutual fund business is generally more complex from a business and compliance perspective than its institutional account business and considered various relevant factors, such as the broader scope of operations and oversight, more extensive shareholder communication infrastructure, greater asset flows, heightened business risks, and differences in applicable laws and regulations associated
Proof #5

42
T. RowE PRICE EMERgIng MaRkETS SToCk Fund
with the Advisor’s proprietary mutual fund business. In assessing the reasonableness of the fund’s management fee rate, the Board considered the differences in the nature of the services required for the Advisor to manage its mutual fund business versus managing a discrete pool of assets as a subadvisor to another institution’s mutual fund or for an institutional account and that the Advisor generally performs significant additional services and assumes greater risk in managing the fund and other T. Rowe Price funds than it does for institutional account clients.
On the basis of the information provided and the factors considered, the Board concluded that the fees paid by the fund under the Advisory Contract are reasonable.
Approval of the Advisory Contract and Subadvisory ContractAs noted, the Board approved the continuation of the Advisory Contract and Subadvisory Contract. No single factor was considered in isolation or to be determinative to the decision. Rather, the Board concluded, in light of a weighting and balancing of all factors considered, that it was in the best interests of the fund and its shareholders for the Board to approve the continuation of the Advisory Contract and Subadvisory Contract (including the fees to be charged for services thereunder).
APPROVAL OF INVESTMENT MANAGEMENT AGREEMENT AND SUBADVISORY AGREEMENT (CONTINUED)
Proof #5

This page intentionally left blank.
Proof #5

This page intentionally left blank.
Proof #5

This page intentionally left blank.
Proof #5

STOCK FUNDSDomestic Blue Chip GrowthCapital Appreciation‡
Capital OpportunityCommunications & TechnologyDiversified Mid-Cap GrowthDividend GrowthEquity IncomeEquity Index 500Extended Equity Market IndexFinancial ServicesGrowth & IncomeGrowth StockHealth SciencesMid-Cap Growth‡
Mid-Cap Value‡
New America GrowthNew EraNew Horizons‡
QM U.S. Small & Mid-Cap Core Equity
QM U.S. Small-Cap Growth EquityQM U.S. Value EquityReal EstateScience & TechnologySmall-Cap Stock‡
Small-Cap ValueTax-Efficient Equity Total Equity Market IndexU.S. Large-Cap CoreValue
ASSET ALLOCATION FUNDSBalanced Global AllocationMulti-Strategy Total ReturnPersonal Strategy BalancedPersonal Strategy GrowthPersonal Strategy IncomeReal AssetsSpectrum GrowthSpectrum IncomeSpectrum InternationalTarget Date Fundsˆ
BOND FUNDSDomestic TaxableCorporate IncomeCredit OpportunitiesFloating RateGNMA High Yield‡
Inflation Protected BondLimited Duration Inflation
Focused BondNew IncomeShort-Term BondTotal ReturnUltra Short-Term BondU.S. Bond Enhanced IndexU.S. High YieldU.S. Treasury IntermediateU.S. Treasury Long-Term
Domestic Tax-FreeCalifornia Tax-Free BondGeorgia Tax-Free BondIntermediate Tax-Free High YieldMaryland Short-Term Tax-Free BondMaryland Tax-Free BondNew Jersey Tax-Free BondNew York Tax-Free BondSummit Municipal IncomeSummit Municipal IntermediateTax-Free High YieldTax-Free IncomeTax-Free Short-IntermediateVirginia Tax-Free Bond
MONEY MARKET FUNDSTaxableCash Reserves1
Government Money2
U.S. Treasury Money2
MONEY MARKET FUNDS (cont.)Tax-FreeCalifornia Tax-Free Money1
Maryland Tax-Free Money1
New York Tax-Free Money1
Summit Municipal Money Market1
Tax-Exempt Money1
INTERNATIONAL/GLOBAL FUNDSStockAfrica & Middle EastAsia OpportunitiesEmerging EuropeEmerging Markets StockEmerging Markets Value StockEuropean Stock Global ConsumerGlobal Growth StockGlobal IndustrialsGlobal Real EstateGlobal StockGlobal Technology‡
International Concentrated EquityInternational Discovery‡
International Equity IndexInternational StockInternational Value EquityJapanLatin AmericaNew AsiaOverseas StockQM Global Equity
BondDynamic Global BondEmerging Markets BondEmerging Markets Corporate BondEmerging Markets Local Currency
BondGlobal High Income BondGlobal Multi-Sector BondInternational BondInternational Bond (USD Hedged)
201806-488657F111-051 6/18 T. Rowe Price Investment Services, Inc. | 100 East Pratt Street | Baltimore, MD 21202-1009
T. Rowe Price Mutual Funds This page contains supplementary information that is not part of the shareholder report.
Call 1-800-225-5132 to request a prospectus or summary prospectus; each includes investment objectives, risks, fees, expenses, and other information that you should read and consider carefully before investing.
‡ Subject to certain exceptions, the fund is currently closed to new investors and new accounts.ˆ The Target Date Funds are inclusive of the Retirement Funds, the Target Funds, and the Retirement Balanced Fund.1 Retail Funds: You could lose money by investing in the Fund. Although the Fund seeks to preserve the value of your
investment at $1.00 per share, it cannot guarantee it will do so. Beginning October 14, 2016, the Fund may impose a fee upon the sale of your shares or may temporarily suspend your ability to sell shares if the Fund’s liquidity falls below required minimums because of market conditions or other factors. An investment in the Fund is not insured or guaranteed by the Federal Deposit Insurance Corporation or any other government agency. The Fund’s sponsor has no legal obligation to provide financial support to the Fund, and you should not expect that the sponsor will provide financial support to the Fund at any time.
2 Government Funds: You could lose money by investing in the Fund. Although the Fund seeks to preserve the value of your investment at $1.00 per share, it cannot guarantee it will do so. An investment in the Fund is not insured or guaranteed by the Federal Deposit Insurance Corporation or any other government agency. The Fund’s sponsor has no legal obligation to provide financial support to the Fund, and you should not expect that the sponsor will provide financial support to the Fund at any time.
Proof #5


