Proxy Sniffer User's Guide
171
Ingenieurbüro David Fischer AG | A Company of the Apica Group www.proxy-sniffer.com Apica ProxySniffer User's Guide Version 5.0 English Edition © 2012, 2013 Ingenieurbüro David Fischer AG May 15, 2013 All Rights Reserved
Transcript of Proxy Sniffer User's Guide

Ingenieurbüro David Fischer AG | A Company of the Apica Group www.proxy-sniffer.com
Apica ProxySniffer User's Guide Version 5.0 English Edition
© 2012, 2013 Ingenieurbüro David Fischer AG May 15, 2013 All Rights Reserved

Apica ProxySniffer V5.0 User’s Guide English Edition
© 2012, 2013 Ingenieurbüro David Fischer AG, Switzerland All Rights Reserved Page 2 / 171
Table of Contents 1 Introduction ................................................................................................................................................................................................................. 6
1.1 Menu and Navigation Overview ............................................................................................................................................................................ 6 2 Recording Web Surfing Sessions without using the Firefox Recoding Extension ......................................................................................................... 9
2.1 Recording the First Web Page.............................................................................................................................................................................. 9 2.2 Recording Subsequent Web Pages .................................................................................................................................................................... 11
3 Further Hints for Recording Web Surfing Sessions .................................................................................................................................................... 12 3.1.1 Support of Technical Client Programs and Web Services (SOAP and XML Data Communication over HTTP/S) ........................................ 12 3.1.2 Proxy Recorder Settings and GUI Settings (Personal Settings Menu) ......................................................................................................... 13
3.1.2.1 Connect to Next Proxy (Proxy Recorder) .............................................................................................................................................. 14 3.1.2.2 HTTPS Settings (Proxy Recorder) ........................................................................................................................................................ 14 3.1.2.3 HTTPS Client Certificate-based Authentication - PKCS#12 Files (Proxy Recorder) ............................................................................. 15 3.1.2.4 HTTPS Client Certificate Authentication - PKCS#11 Device (Proxy Recorder) ..................................................................................... 15 3.1.2.5 NTLM Authentication (Proxy Recorder) ................................................................................................................................................ 16 3.1.2.6 Kerberos Authentication (Proxy Recorder) ........................................................................................................................................... 16 3.1.2.7 GUI Settings ......................................................................................................................................................................................... 17
4 Next Steps after Recording a Web Surfing Session ................................................................................................................................................... 18 4.1 Saving the Recorded Web Surfing Session ........................................................................................................................................................ 18 4.2 Reviewing the Recorded Web Surfing Session .................................................................................................................................................. 19
4.2.1 Reviewing the Stressed Web Servers ......................................................................................................................................................... 19 4.2.2 Reviewing the Automatically-Applied Content Test...................................................................................................................................... 20 4.2.3 Configuring Parallel or Serial URL Execution with Web Pages .................................................................................................................... 23
4.3 Executing a First Load Test ................................................................................................................................................................................ 26 5 Session Cutter ........................................................................................................................................................................................................... 30
5.1 Importing Web Surfing Sessions from External Definition Files .......................................................................................................................... 31 6 Inner Loops ............................................................................................................................................................................................................... 34
6.1 Conditional Execution of Parts of the Web Surfing Session ................................................................................................................................ 36 6.2 Break and Continue Conditions in Inner Loops ................................................................................................................................................... 37
7 Dynamic Session Parameters ................................................................................................................................................................................... 39 7.1 Variable Handler (Var Handler) .......................................................................................................................................................................... 41 7.2 Input Files .......................................................................................................................................................................................................... 42
7.2.1 More Hints for using Input Files ................................................................................................................................................................... 47 7.3 User Input Fields ................................................................................................................................................................................................ 47
7.3.1 More Hints for using User Input Fields......................................................................................................................................................... 50 7.3.1.1 Example – Adjustable User’s Think Time ............................................................................................................................................. 50
7.4 Load Test Plug-Ins ............................................................................................................................................................................................. 52 7.5 Dynamically-Exchanged Session Parameters .................................................................................................................................................... 54
7.5.1 Automated Handling of Dynamically-Exchanged Session Parameters (Var Finder)..................................................................................... 55

Apica ProxySniffer V5.0 User’s Guide English Edition
© 2012, 2013 Ingenieurbüro David Fischer AG, Switzerland All Rights Reserved Page 3 / 171
7.5.2 Manual Extraction of Dynamically-Exchanged Session Parameters ............................................................................................................ 57 7.6 Replacing Text Patterns ..................................................................................................................................................................................... 62
7.6.1 Extracting and Assigning Values of XML and SOAP Data ........................................................................................................................... 63 7.7 HTTP File Uploads ............................................................................................................................................................................................. 64 7.8 Overview of most commonly used Extract and Assign Options .......................................................................................................................... 65 7.9 Directly-Defined Variables (stand-alone Variables) ............................................................................................................................................. 66 7.10 J2EE URL Rewriting ........................................................................................................................................................................................... 67
8 Generating Load Test Programs ............................................................................................................................................................................... 69 8.1 Load Test Programs with Dependent Files ......................................................................................................................................................... 74
9 Executing Load Test Programs ................................................................................................................................................................................. 75 9.1 Starting Exec Agent Jobs ................................................................................................................................................................................... 80
9.1.1 Real-Time Job Statistics (Exec Agent Jobs) ................................................................................................................................................ 81 9.1.1.1 Response Time Overview Diagrams (Real-Time) ................................................................................................................................. 84 9.1.1.2 URL Response Time Diagram (Real-Time) .......................................................................................................................................... 86 9.1.1.3 Error Overview Diagrams (Real-Time).................................................................................................................................................. 88 9.1.1.4 Statistical Overview Diagrams (Real-Time) .......................................................................................................................................... 90 9.1.1.5 Real-Time Comments .......................................................................................................................................................................... 91
9.1.2 Loading the Statistics File............................................................................................................................................................................ 93 9.2 Starting Cluster Jobs .......................................................................................................................................................................................... 94
9.2.1 Real-Time Cluster Job Statistics.................................................................................................................................................................. 95 9.2.2 Loading the Statistics File of Cluster Jobs ................................................................................................................................................... 96
9.3 Jobs Menu.......................................................................................................................................................................................................... 98 9.3.1 Load Test Program Arguments ................................................................................................................................................................... 99
9.4 Scripting Load Test Jobs .................................................................................................................................................................................. 101 9.5 Rerun of Load Tests Jobs (Job Templates) ...................................................................................................................................................... 101 9.6 Project Navigator .............................................................................................................................................................................................. 104
9.6.1 Configuration of the Project Navigator Main Directory ............................................................................................................................... 106 9.7 More Hints for Executing Load Tests ................................................................................................................................................................ 107
10 Analyzing Measurement Results .......................................................................................................................................................................... 108 10.1 Detail Results ................................................................................................................................................................................................... 109
10.1.1 Test Scenario ............................................................................................................................................................................................ 110 10.1.2 Diagram: Response Time per Page .......................................................................................................................................................... 111 10.1.3 Results per URL Call (Overview) ............................................................................................................................................................... 112
10.1.3.1 Response Content Throughput / In-Depth Measurement of HTTP(S) Response-Streams ................................................................. 113 10.1.4 Results per URL Call (Details) ................................................................................................................................................................... 117 10.1.5 Diagram: Response Time Percentiles ....................................................................................................................................................... 118 10.1.6 Diagram: Top Time-Consuming URLs ....................................................................................................................................................... 119 10.1.7 Diagram: Concurrent Users ....................................................................................................................................................................... 120 10.1.8 Diagram: Session Time ............................................................................................................................................................................. 121

Apica ProxySniffer V5.0 User’s Guide English Edition
© 2012, 2013 Ingenieurbüro David Fischer AG, Switzerland All Rights Reserved Page 4 / 171
10.1.9 Diagram: Web Transaction Rate ............................................................................................................................................................... 121 10.1.10 Diagram Users Waiting for Response .................................................................................................................................................... 122 10.1.11 Diagram: Completed Loops ................................................................................................................................................................... 122 10.1.12 Diagram: TCP Socket Connect Time ..................................................................................................................................................... 123 10.1.13 Diagram: Network Throughput ............................................................................................................................................................... 123 10.1.14 Diagram: HTTP Keep-Alive Efficiency .................................................................................................................................................... 124 10.1.15 Diagram: SSL Cache Efficiency ............................................................................................................................................................. 124 10.1.16 Diagram: Session Failures ..................................................................................................................................................................... 125 10.1.17 Diagram: Error Types ............................................................................................................................................................................ 126 10.1.18 Diagram: Number of Errors per Page ..................................................................................................................................................... 127 10.1.19 Diagram: Number of Errors per URL ...................................................................................................................................................... 127
10.2 Error Snapshots ............................................................................................................................................................................................... 128 10.3 Load Curve Diagrams ...................................................................................................................................................................................... 133
10.3.1 Overall Load Curves .................................................................................................................................................................................. 135 10.3.2 Response Time per Page .......................................................................................................................................................................... 136 10.3.3 Response Time per URL ........................................................................................................................................................................... 137 10.3.4 Session Failures ........................................................................................................................................................................................ 138
10.4 Comparison Diagrams ...................................................................................................................................................................................... 139 10.4.1 Response Time ......................................................................................................................................................................................... 139 10.4.2 Performance Overview .............................................................................................................................................................................. 140 10.4.3 Session Failures ........................................................................................................................................................................................ 140
11 Distributed Load Tests – Architecture and Configuration ..................................................................................................................................... 141 11.1 Configuring Additional Load-Releasing Systems (Exec Agents) ....................................................................................................................... 142 11.2 Configuring Load-Releasing Clusters ............................................................................................................................................................... 143 11.3 Starting Distributed Load Tests ........................................................................................................................................................................ 144
12 Using Multiple Client IP Addresses per Load-Releasing System .......................................................................................................................... 145 12.1.1 Step1: Configuring Multiple IP Addresses at the Operating System Level ................................................................................................. 146
12.1.1.1 Windows ............................................................................................................................................................................................ 146 12.1.1.2 Unix-like Systems ............................................................................................................................................................................... 146
12.1.2 Step 2: Assigning Multiple IP Addresses to an Exec Agent ....................................................................................................................... 147 12.2 Sending Email and SMS Alert Notifications during Test Execution ................................................................................................................... 148
12.2.1 Alert Conditions ......................................................................................................................................................................................... 149 12.2.2 Message Headlines ................................................................................................................................................................................... 150
13 Page Scanner ...................................................................................................................................................................................................... 151 13.1.1 Input Parameter, Progress Display and Saving the Scan Result ............................................................................................................... 152 13.1.2 Analyzing the Scan Result ......................................................................................................................................................................... 155
13.1.2.1 Scan Result Details ............................................................................................................................................................................ 157 13.1.3 Converting a Scan Result into a Web Surfing Session .............................................................................................................................. 162
14 Web Tools ........................................................................................................................................................................................................... 164

Apica ProxySniffer V5.0 User’s Guide English Edition
© 2012, 2013 Ingenieurbüro David Fischer AG, Switzerland All Rights Reserved Page 5 / 171
15 Modifying Load Test Programs Manually ............................................................................................................................................................. 165 16 Direct Access to Measured Data .......................................................................................................................................................................... 167
16.1 Example 1 – Extracting Performance Data ....................................................................................................................................................... 167 16.2 Example 2 – Extracting Error Snapshots .......................................................................................................................................................... 169
17 Manufacturer........................................................................................................................................................................................................ 171 UNIX is a trademark of The Open Group. Solaris and Java are trademarks of Sun Microsystems, Inc.. Windows is a trademark of Microsoft Corporation.

Apica ProxySniffer V5.0 User’s Guide English Edition
© 2012, 2013 Ingenieurbüro David Fischer AG, Switzerland All Rights Reserved Page 6 / 171
1 Introduction
Thank you for choosing Proxy Sniffer. You now have a powerful product to perform professional web load tests. The product is easy-to-use and intuitive. However, for a better understanding of the concepts behind Proxy Sniffer, we suggest that you read this manual.
1.1 Menu and Navigation Overview
The Proxy Sniffer menu structure is somewhat different from other applications. Menu options are always context-sensitive; that is, only options relevant to the current operation are displayed. Also, there is no "main menu" or "main application window" (even though one of the menus has the title "Main Menu"). That said, there are, however, three important menus: The Main Menu enables recording of web surfing sessions with any web browser, as well as the editing of web surfing sessions and applying functional enhancements. The sub-menu Generate Load Test Program converts a recorded web surfing session into a ready-to-run load test program. The Project Navigator allows the management of stored web surfing sessions and load test programs. Furthermore, load test programs can be started from this menu, and the corresponding test results and measurements are then also available from this menu. The Analyse Load Test Menu allows the analysis of load test results and measurements, including comparisons of the results of different load test runs. Of the three central menus described above, only the "Project Navigator" deals with permanent data; that is,
data persisted to disk. The other two menus, as well as most of all other menus, work only with transient data stored in memory. The other Proxy Sniffer menus, shown in the figure above, are described below:

Apica ProxySniffer V5.0 User’s Guide English Edition
© 2012, 2013 Ingenieurbüro David Fischer AG, Switzerland All Rights Reserved Page 7 / 171
Page Scanner: allows the automatic scanning of entire web sites, including all web pages contained therein – similar to a Web Spider or a Web Crawler. The result of the scan can be converted directly into a web surfing session, out of which a ready-to-run load test program can be created. This is a fast and convenient alternative instead of recording web surfing sessions manually using the "Main Menu". However, this option is suitable only for testing relatively simple web sites. In general, real-world web applications can only be tested using manually recorded web browser sessions via the "Main Menu".
Var Finder: provides a convenient overview of all CGI and form parameters passed between client and server in a complete web surfing session. Using this menu, dynamic session parameters such as the .NET VIEWSTATE parameter can be managed with a single mouse-click.
URL Details / Var Handler: "URL Details" displays all recorded details about a URL. The "Var Handler" allows Input Files to be defined with URL parameter allocations, useful in situations such as logging-in to web applications using different user accounts. The "Var Handler" also allows many additional load test program options to be dynamically changed; or example, changing the name of the target web application server.
Response Verification: In addition to checking only status HTTP codes during a load test, Proxy Sniffer also checks the received content of web pages by an automatically applied heuristic algorithm designed to exclude "false positive" results. This menu allows to modify the response verification algorithm.
Session Cutter: allows one or more recorded web surfing sessions to be combined into a single new web surfing session, using a process analogous to the splicing of motion picture film. Additionally, this menu allows to import web surfing sessions from external definition files, from which load test programs can be created.
Execute Load Test: displays the most important statistics during the execution of a load test. Errors can be displayed and analyzed in real-time, as they occur.
Load Curve Diagrams: displays the performance curve of a web server or web application under load, showing how response time, throughput and stability behave under various load conditions. The maximum performance capacity of a web server or web application can be determined using this menu.
Comparison Diagrams: provides a graphical comparison of the response times of the same load test program which was executed at different times; for example, before and after server tuning activities, allowing the effect of the tuning on response times to be determined.
Detail Statistics & Diagrams: displays in detail all collected measurements related to a single load test. Over 21 different statistics and diagrams are available.
Error Details: shows the details of all errors occurring during a load test (error snapshots). This menu can be invoked during the load test as well as after the completion of a load test.
Please note that the above list of menus is not exhaustive. There are many other menus available; for example, menus to export data, generate PDF reports, control search-, delete- or filter-functionality, and perform configuration of the Proxy Sniffer product itself. In addition, there are menus to enable and control the execution of load test programs on remote computer systems, including the combination of load test execution systems configured in a cluster. These menus are all described in this User Guide.

Apica ProxySniffer V5.0 User’s Guide English Edition
© 2012, 2013 Ingenieurbüro David Fischer AG, Switzerland All Rights Reserved Page 8 / 171
All menus provide context specific help text, available using the Help Icon. Example:
The following chapters contain a step-by-step guide to using the Proxy Sniffer product.
Brief Instructions if you are in a hurry:
The easiest way to use Proxy Sniffer is to use a Firefox web browser and to download and install the Firefox Recording Extension from https://www.proxy-sniffer.com/download/PrxRecExt1.xpi (enter this URL into Firefox) After that you should start the Proxy Sniffer Console. Then click on the icon inside the Firefox Recording Extension and follow the instructions:
Don’t miss to return back to this user’s manual. We recommend that you read at least chapter 7 completely – inclusive all subchapters (in particular subchapter 7.5) – because the usage of dynamic variables is a little bit tricky. If you are using an Internet Explorer or a Safari web browser for recording of web surfing sessions you should also read the next chapter 2.

Apica ProxySniffer V5.0 User’s Guide English Edition
© 2012, 2013 Ingenieurbüro David Fischer AG, Switzerland All Rights Reserved Page 9 / 171
2 Recording Web Surfing Sessions without using the Firefox Recoding Extension
Hint: you can skip this chapter 2 if you use a Firefox web browser AND have also installed the Firefox Recording Extension. Load tests against web servers or web applications are usually based on recorded web surfing sessions. This means that you usually first record a web surfing session before you can execute a load test. In simple cases – when no login is required and no HTML forms need to be submitted – you may alternatively use the Page Scanner tool (described in chapter 12.2) instead of recording a web surfing session manually. Recording of web surfing sessions is supported by using any web browser, such as Internet Explorer or Safari. You can use also Firefox without installing the Firefox Recording Extension. You must reconfigure your web browser before you will be able to record a web surfing session as described in the Installation and Configuration Guide, chapter 2 (proxy host 127.0.0.1, proxy port 7999 for HTTP and proxy port 7997 for HTTPS, do not use Proxy for 127.0.0.1).
2.1 Recording the First Web Page
1. Start a second web browser window
2. Clear the web browser cache and all cookies ¹
3. Click on the Start Recording icon in the Web Admin GUI in the first web browser window
4. Enter the desired start page of the web server or web application in the second web browser window
The first web page should now be recorded. Click on the Refresh Display icon in the right upper corner inside the Web Admin GUI to see if the recording of the web page was successful. If no data was recorded, you should check the proxy configuration of the web browser.
¹ Please note that you must first clear the web browser cache and all cookies every time you start recording a new web surfing session. Chapter 3 in the Installation
and Configuration Guide contains some illustrations about how to clear the web browser cache and all cookies.

Apica ProxySniffer V5.0 User’s Guide English Edition
© 2012, 2013 Ingenieurbüro David Fischer AG, Switzerland All Rights Reserved Page 10 / 171
First Web Browser Window – Web Admin GUI
Second Web Browser Window – Web Application

Apica ProxySniffer V5.0 User’s Guide English Edition
© 2012, 2013 Ingenieurbüro David Fischer AG, Switzerland All Rights Reserved Page 11 / 171
2.2 Recording Subsequent Web Pages
You must insert a page break before the next web page is called. The reason for this is that the local proxy server cannot not recognize when a web page starts, and when it finishes. The local proxy server only sees singe URL calls, such as requests for HTML data or image files. Adding a page break manually here is necessary in order to record the session properly. Use the following strategy during the recording of a web surfing session over several web pages:
1. First plan which URL or hyperlink you will call (and record) next, but don't click on it just yet!
2. Then, insert a page break comment into the Web Admin GUI. Enter a comment describing the expected result of the next recorded web page.
3. Now call the desired URL by clicking on a hyperlink or submitting a form. Repeat this strategy for each web page that you call during recording. Remember that you must insert the page break before you click on the next hyperlink or submit the next form.
The time in seconds near the page break comment is the user’s think time which will be applied during the load test. This is the time which a (human) user needs to study the content of the web page before clicking on the subsequent page. The percentage value near the time is the randomized range of the think time which will be calculated new every time, for each user and page-call during the test. This means that concurrent users will not use the same think time. Click on the Stop Recording icon in Web Admin after you have finished recording all web pages.
First Web Browser Window – Web Admin GUI
Second Web Browser Window – Web Application
?

Apica ProxySniffer V5.0 User’s Guide English Edition
© 2012, 2013 Ingenieurbüro David Fischer AG, Switzerland All Rights Reserved Page 12 / 171
3 Further Hints for Recording Web Surfing Sessions
3.1.1 Support of Technical Client Programs and Web Services (SOAP and XML Data Communication over HTTP/S)
A web browser is only required in order to use the Web Admin GUI. This means that you can also record web surfing sessions of (non web browser based) technical client programs which exchange ASCII, SOAP or XML data with the web server by using the HTTP/S protocol. Please note that you have to configure the proxy settings of the technical client program to record web surfing sessions (proxy host 127.0.0.1, proxy port 7999 for HTTP and proxy port 7997 for HTTPS). In case if the technical web client uses encrypted HTTPS connections, please take also a look at the Application Reference Manual, chapter 3.12 CA Root Certificate Export Tool. Furthermore, as a second option, it is also supported to create manually a text file by using any text editor which contains definitions of SOAP and/or XML requests. Such a file can then be converted to a web surfing session by using the import functionality of the Session Cutter (see chapter 5).

Apica ProxySniffer V5.0 User’s Guide English Edition
© 2012, 2013 Ingenieurbüro David Fischer AG, Switzerland All Rights Reserved Page 13 / 171
3.1.2 Proxy Recorder Settings and GUI Settings (Personal Settings Menu)
The “Personal Settings” menu allows you to configure non form-based authentication methods (NTLM, Kerberos, PKCS#11 and PKCS#12 based client certificates) and some SSL options for the proxy recorder which may be necessary in order to successfully record a web surfing session.
Furthermore, cascading the proxy recorder with another (outbound) proxy server of your company is also supported.
Note 1: the credentials for Basic and Digest authentication are directly requested by the web browser during recoding of a web surfing session. This means that no special configuration is required for these two authentication methods inside this menu. Note 2: the authentication credentials entered in this menu can also be transferred into the generated load test programs. The allocation of individual credentials per simulated user can be selected when generating the HTTP(S) Load Test Programs (see chapter 8) The “Web GUI” part of the menu allows you to set the default time zone, and the default number format, which will be used by the GUI and by the load test programs. Additionally, also Alert Notifications can be configured which are send during the execution of a job as Emails or as SMS messages (see chapter 12.2)

Apica ProxySniffer V5.0 User’s Guide English Edition
© 2012, 2013 Ingenieurbüro David Fischer AG, Switzerland All Rights Reserved Page 14 / 171
3.1.2.1 Connect to Next Proxy (Proxy Recorder)
Checkbox in Title: if checked, Proxy Sniffer cascades the proxy recorder with another, "next", outbound proxy server of your company. Note: to execute a load test through a proxy server, you must also enable the option "Load Test over HTTP(S) Proxy" in the Generate HTTP(S) Load Test Program menu (see chapter 8). Input Fields:
Next Proxy HTTP Host: (DNS) hostname or TCP/IP address of the next proxy server (for unencrypted connections).
Next Proxy HTTP Port: HTTP TCP/IP port number of the next proxy server (for unencrypted connections).
Next Proxy HTTP Cache disabled: if checked, request the next proxy server to disable its internal cache.
Next Proxy HTTPS Host: (DNS) hostname or TCP/IP address of the next proxy server (for encrypted connections).
Next Proxy HTTPS Port: HTTPS (secure) TCP/IP port number of the next proxy server (for encrypted connections).
Next Proxy Auth Username: basic authentication username, used for proxy authentication on the next proxy server.
Next Proxy Auth Password: basic authentication password, used for proxy authentication on the next proxy server.
No Next Proxy for Host/Domain: allows you to set a list of hosts, or domain names, for which the proxy settings must not be applied. The entries must be separated by commas or semicolons.
For Kerberos Authentication against an outbound proxy server: Add additionally the full DNS name of the next proxy server to the host names in the Kerberos Configuration and set as alias the IP Address or the simple DNS name of the proxy server which is used in the "Next Proxy HTTP/S Host" input fields. Set the username and the password in the Kerberos configuration. Enable both checkboxes in such a case: "Connect to Next Proxy" as well as "Kerberos Authentication". You have also to configure the Kerberos Domain Name and the IP address or the DNS name of the Kerberos KDC (Active Directory Server) inside the Kerberos configuration file krb5.conf .
3.1.2.2 HTTPS Settings (Proxy Recorder)
Allows you to adjust the HTTPS settings of the proxy recorder (used when recording encrypted network connections). Input Fields:
SSL Version: allows you to select the SSL protocol version.
SSL Session Cache enabled: if checked, enables the SSL session cache (keeping the same SSL session ID over multiple Web pages).
SSL Session Cache Timeout: lifetime of the SSL sessions within the session cache.
Enhanced Compatibility Mode: if checked, enables workarounds to support poorly-implemented SSL server libraries.

Apica ProxySniffer V5.0 User’s Guide English Edition
© 2012, 2013 Ingenieurbüro David Fischer AG, Switzerland All Rights Reserved Page 15 / 171
HTTPS Response Timeout: response timeout per HTTPS URL call. If this timeout expires, the corresponding HTTPS URL call will be aborted.
3.1.2.3 HTTPS Client Certificate-based Authentication - PKCS#12 Files (Proxy Recorder)
Allows you to load X509 SSL/TLS client certificates, in PKCS#12 file-format, into the proxy recorder. Because the proxy recorder operates as a "man in the middle" between the web browser and the web server, the client certificate must be loaded and activated before a web surfing session requiring such a certificate can be recorded. Note:” normal” HTTPS sessions do not require client certificates. The PKCS#12 file must first be loaded by using the Personal Settings menu. Also ensure that the certificate is active by clicking inside the red bar on the certificate. The red bar will change to a green check mark when the certificate is properly active.
Note: to execute a load test which uses client certificates, you must also enable the option "HTTPS Client Certificates" in the Generate HTTP(S) Load Test Program menu (see chapter 8). The allocation of individual client certificates per simulated user is supported when generating load test programs.
3.1.2.4 HTTPS Client Certificate Authentication - PKCS#11 Device (Proxy Recorder)
Allows to you to use in Proxy Recorder X509 SSL/TLS client certificates which are embedded in PKCS#11 Security Devices (support for HSMs and smart cards). Note:” normal” HTTPS sessions do not require client certificates. Because the proxy recorder operates as a "man in the middle" between the web browser and the web server, the client certificate must be loaded and activated before a web surfing session requiring such a certificate can be recorded. Please read the separate documentation "Using PKCS#11 Security Devices" for further information.

Apica ProxySniffer V5.0 User’s Guide English Edition
© 2012, 2013 Ingenieurbüro David Fischer AG, Switzerland All Rights Reserved Page 16 / 171
3.1.2.5 NTLM Authentication (Proxy Recorder)
Checkbox in Title: if checked, enables NTLM authentication against Web servers during recording. Note: to execute a load test which uses NTLM authentication, you must also enable the option "NTLM Authentication" in the Generate HTTP(S) Load Test Program menu (see chapter 8). The allocation of individual NTLM accounts per simulated user is supported when generating load test programs. Input Fields:
Domain: Windows domain name.
Username: username of domain account.
Password: password of domain account.
3.1.2.6 Kerberos Authentication (Proxy Recorder)
Checkbox in Title: if checked, enables Kerberos authentication during recording of web surfing sessions against web servers and against next, outbound proxy servers.
Note: to execute a load test which uses Kerberos authentication you have additionally to enable the option "Kerberos Authentication" in the Generate HTTP(S) Load Test Program menu (see chapter 8). The allocation of individual Kerberos accounts per simulated user is supported when generating load test programs.
Input Fields:
Username: the username of a domain account.
Password: the password of a domain account.
Web Server Host Name (Full DNS Name): Required. In order that a Kerberos authentication can be successfully done against a web server or against an outbound proxy server, a so named "Kerberos Ticket" first must be issued by a KDC (by an Active Directory Server). However acquiring such a ticket requires that always the full DNS host name of the web server is transferred to the KDC - even if only an IP address or a short DNS name (alias) is used for the HTTP/S requests during recording of a web surfing session. Therefore, you have to add all full DNS host names of all web servers for which Kerberos authentication is required to the Kerberos configuration (Example: "www.domainname.net" is a full DNS host name, in contrast to "server23" which is only an alias).
Additional IP Addresses and Aliases: Optional. Allows to configure a list of IP addresses and/or aliases for the corresponding full DNS host name. The entries in the list must be separated by commas (,) or by semicolons (;). The configured IP addresses and/or aliases can be used when recording web surfing sessions as well as when executing load tests.

Apica ProxySniffer V5.0 User’s Guide English Edition
© 2012, 2013 Ingenieurbüro David Fischer AG, Switzerland All Rights Reserved Page 17 / 171
Kerberos Configuration (krb5.conf): you must configure inside this file the name of the Kerberos Domain and the DNS name or the IP address of the KDC server (Active Directory Server). Modifications in this file are immediately applied at runtime which means that no restart of Proxy Sniffer is required.
Additional Settings (krb5LoginModule.conf): normally there is no need to make any modifications in this file. This file contains some generic Kerberos settings. If you modify this file you must restart the Proxy Sniffer GUI (restart the Proxy Sniffer Console).
Additional Requirements for Kerberos Authentication: the Kerberos tickets are acquired by the web clients by using DNS as communication protocol to the KDC. This means that all computers on which Proxy Sniffer is running (the GUI and the Exec Agents) - and which are using Kerberos - must be able to open a DNS network connection to the KDC. This is the only additional requirement. It is not required that the computers are registered as a member of the domain, and it is also not required to configure any other things inside the operating system. Kerberos authentication against a web server located in a Windows domain is also supported for all non Windows operating systems like for example Mac OS X, Linux and Solaris.
3.1.2.7 GUI Settings
Input Fields:
Time Zone: ¹ allows you to set the default time zone to be used by the load test programs, and by the GUI.
Number Format: ¹ allows you to set the default decimal grouping separator character for numbers; for example 123’456.00 or 123,456.00.
Background Color: allows you to choose your desired background color for all windows. ¹ only temporarily applied until program termination - for Windows, Mac OS X and Ubuntu systems: modify the startup settings file prxsniff.dat to change these values permanently. For other Unix-like systems: set the program arguments -tz and -dgs to the corresponding values (see Application Reference Manual).

Apica ProxySniffer V5.0 User’s Guide English Edition
© 2012, 2013 Ingenieurbüro David Fischer AG, Switzerland All Rights Reserved Page 18 / 171
4 Next Steps after Recording a Web Surfing Session
4.1 Saving the Recorded Web Surfing Session
Proxy Sniffer keeps the entire recorded web surfing session in its transient memory cache.
For this reason, you should save the recorded web surfing session to disk by using the Save Session icon inside the Web Admin GUI. All data from the web surfing session are saved, including all HTTP request- and response-headers, all recorded HTTP content data, and all page break definitions. Any special session enhancements made by using the Variable Handler (chapter 7.1), or by using the content test configuration menu (chapter 4.2.2), are also saved. We recommend that you also enter a small comment describing the recorded session.
After saving the session, the Project Navigator menu appears. You can later restore the web surfing session by clicking on the icon of a saved session inside the Project Navigator.

Apica ProxySniffer V5.0 User’s Guide English Edition
© 2012, 2013 Ingenieurbüro David Fischer AG, Switzerland All Rights Reserved Page 19 / 171
4.2 Reviewing the Recorded Web Surfing Session
After you have recorded a web surfing session, you should review the results by checking the following:
1. Does the recorded session contain only URL calls to the web server(s) you want to test?
2. Has the automatically-applied content test check for the recorded web pages been correctly configured?
4.2.1 Reviewing the Stressed Web Servers
Some of the recorded web pages may contain, embedded in them, images with a size of 1x1 pixels originating from an external web session-tracking server. Or – if you have recorded an encrypted HTTPS session – Microsoft Internet Explorer may have first made a call to a server at Microsoft corporation to check the validity of the root certificates, instead of directly calling the web server whose web session is being recorded. In order to not stress external tracking servers and/or Microsoft servers, we recommend that you remove these URL from the recorded web surfing session. You should also review the host names, or the IP addresses, of all recorded URLs. If you find some unnecessary or unwanted hosts, you should remove such URLs by clicking on the red cross near the item number at the left side of the URL. Alternatively, you can use the host field of the URL filter to suppress any unwanted URL. You can enter also an exclamation mark “!” in front of an unwanted hostname to achieve that all URLs from this host are suppressed. Additionally, several host names can be entered, separated by commas.
?

Apica ProxySniffer V5.0 User’s Guide English Edition
© 2012, 2013 Ingenieurbüro David Fischer AG, Switzerland All Rights Reserved Page 20 / 171
4.2.2 Reviewing the Automatically-Applied Content Test
Avoid executing load tests without controlling the received content of URL calls by comparing them to the originally recorded data. Many errors from web server applications are embedded inside valid HTTP 200 responses. Therefore, the content of the responses must be also be checked to detect content errors under load. For this reason, Proxy Sniffer examines the content of all recorded URL calls, and automatically applies a content check per each URL call using a heuristic algorithm. This algorithm performs content checks by searching for an ASCII-text string inside the received content; however, if this seems to be impossible, or if this doesn't seem to make sense, the received content is checked by its size (content length) instead of by searching an ASCII-text string. After clicking on the View icon inside the Web Admin GUI main menu, the display of the recorded web surfing session changes, and the automatically applied content test methods are displayed for the URL calls at right. Binary data, such as images, are checked by their size - this is fast and works well in most cases. You should always review content tests where an ASCII text fragment is searched for inside HTML data (web pages), and check whether the pre-configured search text makes sense.
The content test configuration can be modified by clicking on the magnifier icon.
?

Apica ProxySniffer V5.0 User’s Guide English Edition
© 2012, 2013 Ingenieurbüro David Fischer AG, Switzerland All Rights Reserved Page 21 / 171
During the execution of a load test program, the HTTP response code and the received MIME type of each URL call is always compared with the originally-recorded response from the web surfing session (if not disabled manually). The response verification menu allows the specification of how received content is to be tested:
Disable Content Verification: the received content will not be checked. Normally this option should not be used.
Verify Content by Size: only the size of the content is checked. This is a good, fast approach for completely static content such as images. You may also set an acceptable size derivation of ±0% if the content never changes.
Verify Content by Test String: a test string is searched for inside the received content. This is the best method for testing dynamically-generated HTML pages. If the content contains HTML or XML text, the Proxy Sniffer program analyses the recorded content, and gives rated suggestions (0..1) for advisable string fragments. Alternatively, you can enter your own desired test string.
In addition to searching for the occurrence of a simple text string inside the received response content of an URL call, the following special search patterns are supported:
![<search text>] The search text must not occur inside the received content.
#<int>[<search text>] The search text must occur exactly <int> times inside the received content.
#<int>-[<search text>] The search text must occur a minimum of <int> times inside the received content.
#<int1>-<int2>[<search text>] The search text must occur a minimum of <int1> times, but not more than <int2> times, inside the received content.

Apica ProxySniffer V5.0 User’s Guide English Edition
© 2012, 2013 Ingenieurbüro David Fischer AG, Switzerland All Rights Reserved Page 22 / 171
Search Text Examples:
hello The search text "hello" must occur at least once inside the received content
![ORA-01652] The search text "ORA-01652" must not occur inside the received content
#1[Dear Mr.] The search text "Dear Mr." must occur exactly one time inside the received content
#1-2[Order Number] The search text "Order Number" must occur a minimum of one time and a maximum of two times inside the received content
#3-[new order] The search text "new order" must occur a minimum of three times inside the received content
Note: one or more variable text patterns in the form of ${<variable name>} are supported as a part of the search text; for example: “Welcome ${sex} {$name}”. More information about variables can be found in chapter 7.1.
Failure Action:
The Failure Action determines what happens in case the URL call fails.
Abort Loop >> Next Loop means that the current loop (repetition of web surfing session) of the simulated user is aborted and that the simulated user executes subsequent to that the next loop (if more loops per user are planned, or if the duration of the load test is not exceeded). Such failures are also named fatal errors.
None - Continue Loop means that the simulated user continues to execute the current loop (repetition of web surfing session). Such failures are also named non-fatal errors. This option should only be used if no variables have to be extracted from the response of the URL call - or in other words - only if the succeeding URL calls do not depend on the response of this URL.
Reset Settings:
By clicking on the Apply Default Settings button at the bottom of the window you can undo your changes and the default settings are reapplied.

Apica ProxySniffer V5.0 User’s Guide English Edition
© 2012, 2013 Ingenieurbüro David Fischer AG, Switzerland All Rights Reserved Page 23 / 171
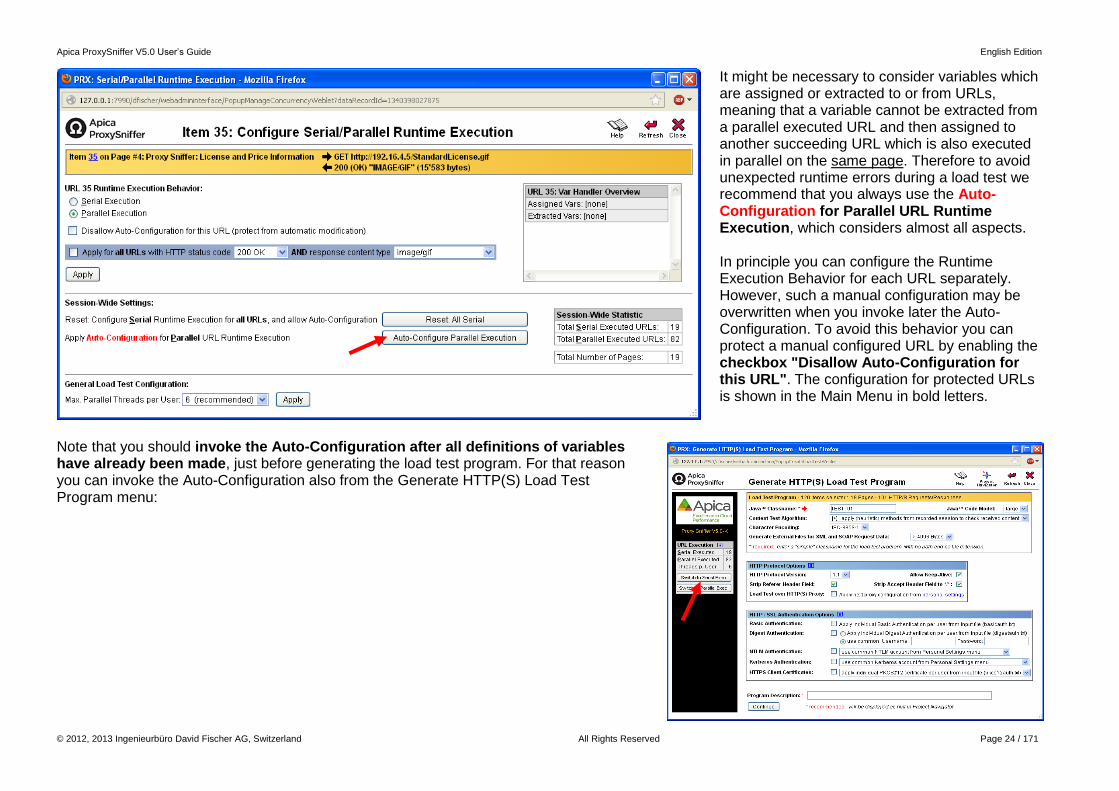
4.2.3 Configuring Parallel or Serial URL Execution with Web Pages
This function allows to configure the Runtime Execution Behavior (serial or parallel execution order) for one URL, or for a group of URLs, or for all URLs – which will be applied per simulated user during the execution of the load test. Normally the first URL of a standard Web page should always be executed serial - analog to the behavior of a normal Web browser. Additionally, any redirects located at the start of a Web page should also be executed serial. Subsequently following URLs of a Web page such as images can then be executed in parallel. The synchronization point for all in parallel executed URLs is always at the end of the page.
Apica ProxySniffer V5.0 User’s Guide English Edition
© 2012, 2013 Ingenieurbüro David Fischer AG, Switzerland All Rights Reserved Page 24 / 171
It might be necessary to consider variables which are assigned or extracted to or from URLs, meaning that a variable cannot be extracted from a parallel executed URL and then assigned to another succeeding URL which is also executed in parallel on the same page. Therefore to avoid unexpected runtime errors during a load test we recommend that you always use the Auto-Configuration for Parallel URL Runtime Execution, which considers almost all aspects. In principle you can configure the Runtime Execution Behavior for each URL separately. However, such a manual configuration may be overwritten when you invoke later the Auto-Configuration. To avoid this behavior you can protect a manual configured URL by enabling the checkbox "Disallow Auto-Configuration for this URL". The configuration for protected URLs is shown in the Main Menu in bold letters.
Note that you should invoke the Auto-Configuration after all definitions of variables have already been made, just before generating the load test program. For that reason you can invoke the Auto-Configuration also from the Generate HTTP(S) Load Test Program menu:

Apica ProxySniffer V5.0 User’s Guide English Edition
© 2012, 2013 Ingenieurbüro David Fischer AG, Switzerland All Rights Reserved Page 25 / 171
Depending if all URLs of a page are executed in serial order - or some of the URLs are executed in parallel, Proxy Sniffer measures the response time of a page in different ways.
If all URLs are executed in serial order the response time of the page is calculated as the simple sum of all response times of the URLs, without considering any internal overhead time between the URLs.
On the other hand, if some of the URLs are executed in parallel, the response time of the page is measured as the time difference between the start of the page and the end of the page and includes also the internal overhead time:

Apica ProxySniffer V5.0 User’s Guide English Edition
© 2012, 2013 Ingenieurbüro David Fischer AG, Switzerland All Rights Reserved Page 26 / 171
4.3 Executing a First Load Test
You can now execute a first try of the load test if your recorded web surfing session does not contain dynamically exchanged session parameters (see also chapter 7.5). For this here only a short overview is shown. More detailed information about executing load tests is documented in the chapters 8, 9 and 10. First of all you have to convert the recorded web surfing session into a load test program. Normally, you should only have to enter the name of the load test program with an annotation or description of what the program does, without having to choose or modify any other options:

Apica ProxySniffer V5.0 User’s Guide English Edition
© 2012, 2013 Ingenieurbüro David Fischer AG, Switzerland All Rights Reserved Page 27 / 171
After that the load test program can be started. It is recommended that you choose for the first test run only a few number of simulated users and a short execution time:

Apica ProxySniffer V5.0 User’s Guide English Edition
© 2012, 2013 Ingenieurbüro David Fischer AG, Switzerland All Rights Reserved Page 28 / 171

Apica ProxySniffer V5.0 User’s Guide English Edition
© 2012, 2013 Ingenieurbüro David Fischer AG, Switzerland All Rights Reserved Page 29 / 171
Hint: if a permanent error occurs at the same URL you should call the Var Finder menu (see chapter 7.5) and verify if the handling for dynamically exchanged session variables must be applied.

Apica ProxySniffer V5.0 User’s Guide English Edition
© 2012, 2013 Ingenieurbüro David Fischer AG, Switzerland All Rights Reserved Page 30 / 171
5 Session Cutter
The Session Cutter Menu allows to combine one or more web surfing sessions to form a new session, similar to splicing motion picture film together to create a complete movie. This process can only be performed using "raw" web surfing sessions; that is, recorded sessions which have not yet been enhanced using the "Var Finder“ (described in chapter 7.5.1) or using the "Var Handler“ (described in chapter 7.1). If a “enhanced" web surfing session is loaded into the
Session Cutter Menu, a warning message will be displayed. If the warning is ignored, all enhancements will be deleted; that is, after using the Session Cutter, the "Var Finder" and/or "Var Handler" enhancements will have to be done over again.
Individual web pages can be selected by clicking on the name or the number of the Web-Page. The selected web page(s) can be moved or copied by using the "move here" or "copy here" button. After the splicing of the new web surfing sessions is complete, the Session Cutter Menu can be closed by clicking on the "Close" button or by clicking again on the Session Cutter icon.

Apica ProxySniffer V5.0 User’s Guide English Edition
© 2012, 2013 Ingenieurbüro David Fischer AG, Switzerland All Rights Reserved Page 31 / 171
5.1 Importing Web Surfing Sessions from External Definition Files
The Session Cutter allows additionally to import web surfing sessions from external definition files:
Data Format of Definition Files:
Definition Files are written in ASCII format. Each line contains either a command, or a URL definition. Commands always begin with a hyphen (-). URL definitions must contain at least 3 arguments:
1. HTTP method (GET, POST ...)
2. absolute or relative URL
3. expected HTTP response status code of the URL call (200, 302 ...)
4. Argument 4 of a URL definition is optional and contains the request content
All further arguments are optional and contain URL options which begin with a hyphen (-) <-command> [<argument 1>..<argument n>]
<HTTP method> <URL> <HTTP status code> [<request content>] [<-URLoption 1>..<-URLoption n>]
...
<HTTP method> <URL> <HTTP status code> [<request content>] [<-URLoption 1>..<-URLoption n>]
<-command> [<argument 1>..<argument n>]
<HTTP method> <URL> <HTTP status code> [<request content>] [<-URLoption 1>..<-URLoption n>]
...
Apica ProxySniffer V5.0 User’s Guide English Edition
© 2012, 2013 Ingenieurbüro David Fischer AG, Switzerland All Rights Reserved Page 32 / 171
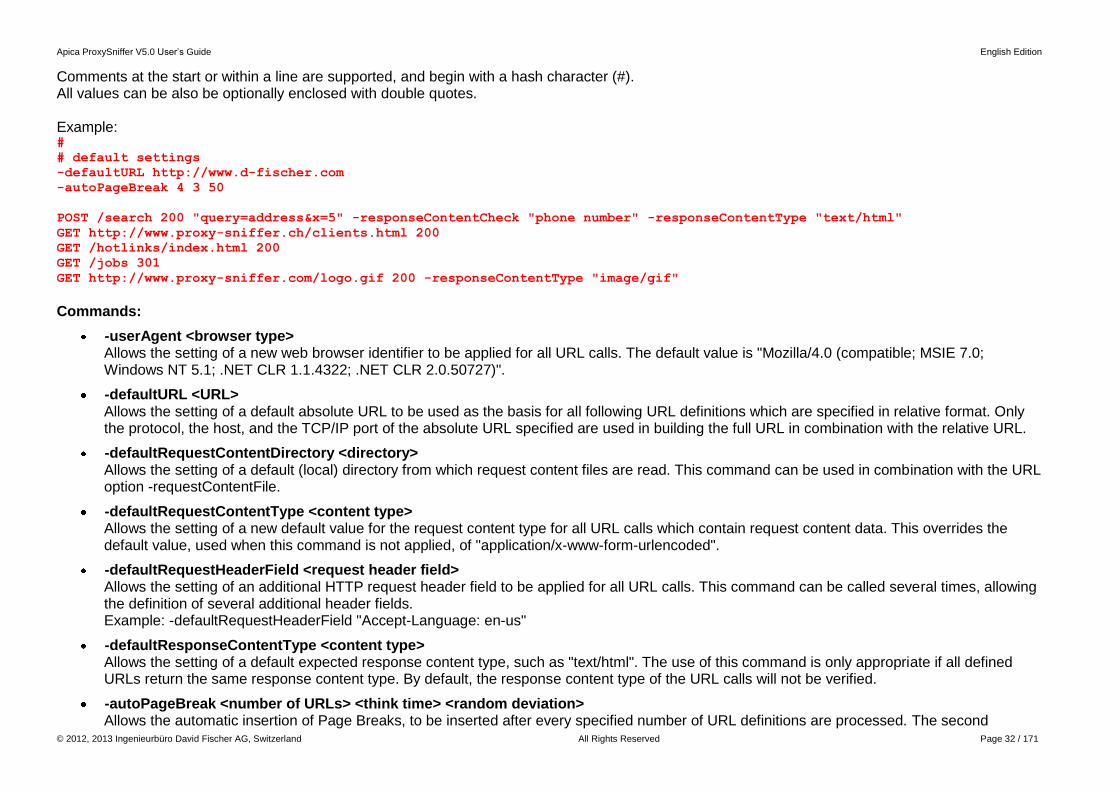
Comments at the start or within a line are supported, and begin with a hash character (#). All values can be also be optionally enclosed with double quotes. Example: #
# default settings
-defaultURL http://www.d-fischer.com
-autoPageBreak 4 3 50
POST /search 200 "query=address&x=5" -responseContentCheck "phone number" -responseContentType "text/html"
GET http://www.proxy-sniffer.ch/clients.html 200
GET /hotlinks/index.html 200
GET /jobs 301
GET http://www.proxy-sniffer.com/logo.gif 200 -responseContentType "image/gif"
Commands:
-userAgent <browser type> Allows the setting of a new web browser identifier to be applied for all URL calls. The default value is "Mozilla/4.0 (compatible; MSIE 7.0; Windows NT 5.1; .NET CLR 1.1.4322; .NET CLR 2.0.50727)".
-defaultURL <URL> Allows the setting of a default absolute URL to be used as the basis for all following URL definitions which are specified in relative format. Only the protocol, the host, and the TCP/IP port of the absolute URL specified are used in building the full URL in combination with the relative URL.
-defaultRequestContentDirectory <directory> Allows the setting of a default (local) directory from which request content files are read. This command can be used in combination with the URL option -requestContentFile.
-defaultRequestContentType <content type> Allows the setting of a new default value for the request content type for all URL calls which contain request content data. This overrides the default value, used when this command is not applied, of "application/x-www-form-urlencoded".
-defaultRequestHeaderField <request header field> Allows the setting of an additional HTTP request header field to be applied for all URL calls. This command can be called several times, allowing the definition of several additional header fields. Example: -defaultRequestHeaderField "Accept-Language: en-us"
-defaultResponseContentType <content type> Allows the setting of a default expected response content type, such as "text/html". The use of this command is only appropriate if all defined URLs return the same response content type. By default, the response content type of the URL calls will not be verified.
-autoPageBreak <number of URLs> <think time> <random deviation> Allows the automatic insertion of Page Breaks, to be inserted after every specified number of URL definitions are processed. The second

Apica ProxySniffer V5.0 User’s Guide English Edition
© 2012, 2013 Ingenieurbüro David Fischer AG, Switzerland All Rights Reserved Page 33 / 171
parameter - the user's think time - must be set (in seconds), and the third parameter - the random deviation of the think time - must be set (in percent: 0..100).
-addPageBreak <comment> <think time> <random deviation> Allows the insertion of a Page Break. This command can be called multiple times, before or after URL definitions. The first parameter is the comment for the page break, the second parameter is the user's think time (in seconds), and the third parameter is the random deviation of the think time (in percent: 0..100).
-eof Stops processing of the definition file at this point. This command can be used when only a part of the URL definitions should be processed.
URL Options:
-requestContentFile <file name> Allows the use of the content of a (local) file as request content. Argument 4 of the URL definition is not used, and not required, if this option is set. If the command -defaultRequestContentDirectory was previously called, the file name is only allowed to be the simple name of a file within the default request content directory.
-requestContentType <content type> Allows the setting of a specific value for the request content type for this URL call. The default value, used when this option is not set, is that set by the command -defaultRequestContentType or, failing that, "application/x-www-form-urlencoded" if the command -defaultRequestContentType was not previously used.
-requestHeaderField <request header field> Allows the setting of an additional HTTP request header field for this URL call. This option can be specified several times, allowing the addition of several HTTP request header fields.
-responseContentType <content type> Allows the setting of the expected response content type. If this option is not used, and if the command -defaultResponseContentType has not been previously used, the response content type will not be verified.
-responseContentCheck <text fragment> Checks to see if the response content contains a specified text fragment. The response content will not be verified if this option is not set.
-responseContentSize <content size> <deviation> Checks the size of the response content. The size of the response content will not be verified if this option is not set. Argument 1 contains the size in bytes, and argument 2 contains the maximum allowed deviation of the size in percent (0..100).
Hint: the URL option -requestContentFile can for example be used to POST XML data. Example:
-defaultURL http://www.d-fischer.com
-defaultRequestContentDirectory "D:\XmlData"
POST /putDataDo?action=addAddress 200 -requestContentFile requestData.xml -requestContentType "text/xml"

Apica ProxySniffer V5.0 User’s Guide English Edition
© 2012, 2013 Ingenieurbüro David Fischer AG, Switzerland All Rights Reserved Page 34 / 171
6 Inner Loops
It is possible to define “inner loops” which include only some web pages of a recorded web surfing session. As an example, inner loops can be used during a load test after the point where the users did login, to repeat the web pages between login and logout several times, before logout. During the load test, inner loops execute within the "outer", normal loops (repetitions of the web surfing session per user); for example, if you run a load test with 10 users and 3 loops (with an unlimited test duration), each user will execute the recorded web surfing session 3 times. Within each repetition (outer loop), the inner loop(s) will be executed. Inner loops must be composed of entire web pages, and not only a subset of URL calls to a single web page; however, you can define additional page breaks between URL calls after the recording has been completed. You can define an inner loop by clicking on the item index at the left side of a page break. Inner Loop Configuration:
Inner Loop Description: description of the inner loop (mandatory)
Inner Loop End Page: the end page of the inner loop, including all URL calls on the end page itself.
Loop Iterations: number of iterations. This can be a fixed value, or a variable value which can be extracted; for example, from an Input File, or from a User Input Field (see Chapters 7.2 and 7.3).
Action if planned duration of Load Test exceeded: the option "Abort current loop after current iteration" means that at the end of the load test – when the maximum duration of the test has elapsed – the inner loop is aborted after the end of the current iteration, and remaining iterations are not executed. The option "Continue with iterations" means that the end of the load test will be postponed until all iterations have been completed.
Enable Pacing: enabling this option sets a minimum elapsed time for all "in one iteration" executed page breaks and URL calls, before the next iteration can start. If the iteration is done faster than the pacing time, the "user" will be inactive until the pacing time has elapsed.

Apica ProxySniffer V5.0 User’s Guide English Edition
© 2012, 2013 Ingenieurbüro David Fischer AG, Switzerland All Rights Reserved Page 35 / 171
Inner loops are marked by black bars at the left side in the Web Admin GUI main menu. Nested inner loops are also supported.

Apica ProxySniffer V5.0 User’s Guide English Edition
© 2012, 2013 Ingenieurbüro David Fischer AG, Switzerland All Rights Reserved Page 36 / 171
6.1 Conditional Execution of Parts of the Web Surfing Session
If the number of iterations of an inner loop is controlled by a variable, the value of such a variable can also be 0 (zero). A value of zero means that a simulated user does not execute (enter) the inner loop. This can be used in combination with an Input File (see chapter 7.2) whose file scope is “new line per user” or “new line per loop” and whose lines contain values of zero and one which are assigned to the variables of the iterations; that is, some of the users skip parts of the recorded web surfing session during the load test. However, to get valid statistical data it is required that, at least once during the load test, at least one user executes the inner loop one or more times.

Apica ProxySniffer V5.0 User’s Guide English Edition
© 2012, 2013 Ingenieurbüro David Fischer AG, Switzerland All Rights Reserved Page 37 / 171
6.2 Break and Continue Conditions in Inner Loops
After you have defined an inner loop, you can also define additional conditions which allow you to control the run-time behavior inside of an inner loop. If such an additional condition applies (becomes true) the corresponding action can be break or continue. Break means: jump out of the inner loop. After a "break", the simulated user will call the next URL Call subsequent to the end of the inner loop. Continue means: jump back at the start of the inner loop, without calling the subsequent URL Calls of the current iteration inside the inner loop. However such a jump is not executed during the last iteration of an inner loop. In such a case the inner loop is immediately finished (similar to the "break" condition, but inclusive incrementing the inner loop iteration counter).

Apica ProxySniffer V5.0 User’s Guide English Edition
© 2012, 2013 Ingenieurbüro David Fischer AG, Switzerland All Rights Reserved Page 38 / 171
In addition, it is also supported to report a "red" fatal error after all iterations of an inner loop have been executed (no "break" was made in an iteration before the last iteration). If such a "red" fatal error is reported, the simulated user will abort the current "Outer Loop" and will start the next "Outer Loop".
The Text Input Fields of the conditions can contain fixed text as well as placeholders for variables. Example: "Dear {$vTitle} {$vName}". In addition it is also supported to define a NOT condition for an absence of a text. This can be done by enfolding the whole text with an exclamation mark and square brackets. Example: "![Dear {$vTitle} {$vName}]". Restrictions: if nested inner loops have been defined, a "continue" or a "break" action will only change the run-time behavior of the deepest inner loop. Breaking through several inner loop levels is not supported. Further Hint for Using Variables: when using variables, please consider also the scope of the variables (page 40). If the scope is global all simulated users will see the same value for such a variable and therefore the same condition will be become true or false for all users. On the other hand, if the scope of a variable is user or loop, each simulated user will see a different value for such a variable and therefore the conditions will be calculated on a per user basis.
Text Input Fields

Apica ProxySniffer V5.0 User’s Guide English Edition
© 2012, 2013 Ingenieurbüro David Fischer AG, Switzerland All Rights Reserved Page 39 / 171
7 Dynamic Session Parameters
After a web surfing session has been recorded, the load test program can be generated (see chapter 8). However it is often desirable - or even required - that the recorded web surfing session must first be edited. Some possible cases are:
o The web application contains HTML form-based authentication, and it is required that each user use an own username and password to login into the web application (see example in chapter 7.2).
o You wish to make a parameter of an URL call variable in order to set the value of the parameter each time before starting the load test. For example a booking date of a flight (see example in chapter 7.3)
o The recorded session contains dynamically-exchanged session parameters which must be extracted at run-time from the web pages, and then assigned to succeeding URL calls in order that the load test program runs successfully (see chapter 7.4)
All of these tasks, and many more, can be performed by using the "central variable handler menu", called Var Handler, which manages all dynamically- applied modifications to web surfing sessions. The process involves two steps:
1. First a variable must be defined or extracted, and then
2. The variable must be assigned In other words, a variable must first be extracted before it can be assigned; however, some of the most commonly-used dialogs also support making automatic and/or global assignments. The process of extracting variables is completely independent from assignment; thus, many combinations are possible, providing maximum flexibility. Variables can be extracted, by using the Web Admin GUI, from the following sources:
- from Input Files, whose data are read at run-time during the load test (chapter 7.2)
- from HTML form parameters; for example, hidden form fields (chapter 7.8)
- from values of received XML and SOAP data (chapter 7.6.1)
- from CGI parameters contained in hyperlinks, form actions, or HTTP redirects (chapter 7.8)
- from any text fragments of received HTML and XML data (chapter 7.5.2)
- from User Input Fields – which are arbitrary configurable load test input parameters (chapter 7.3)
- from HTTP response header fields
- from output parameters of Load Test Plug-Ins (chapter 7.4)
Additionally, it is also possible to define stand-alone variables which have constant or dynamic initial values (chapter 7.9).

Apica ProxySniffer V5.0 User’s Guide English Edition
© 2012, 2013 Ingenieurbüro David Fischer AG, Switzerland All Rights Reserved Page 40 / 171
A variable can be assigned as follows, irrespective of how it was extracted:
- to the value of an HTML form field (chapter 7.8)
- to the value of a CGI Parameter of a URL call (chapter 7.8)
- to values of XML and SOAP data of a URL call (chapter 7.6.1)
- to a text fragment of a URL call (within the HTTP request header or the HTTP request content, chapter 7.6)
- to the protocol (http/https), the host name or the TCP/IP port of one or all URL calls (chapter 7.8)
- to the user’s think time of a web page (chapter 7.3.1)
- to the response verification algorithm of a URL call (searched text fragment or size of received content, chapter 4.2.2)
- to the number of iterations, and/or the pacing delay, of an inner loop (chapter 0)
- to some HTTP request header fields (most request header fields are automatically handled by Proxy Sniffer)
- to an input parameter of a Load Test Plug-In (chapter 7.4)
Each variable has also a scope. Possible scopes are:
- global: all users will see the same value of the variable during the load test
- user: although the variable has been defined only once, each user will see its own value during the load test. There are as many virtual instances of the variable as there are concurrent users used during the load test.
- loop: the variable is bound to the current loop (surf session repetition) of a user, and its value can change during each loop
- inner loop: the variable is bound to an inner loop of a user, and can change its value during each iteration of the inner loop
Although seemingly complicated, the Var Handler is a powerful tool which is easy to use. It is possible to satisfy complex requirements in a short period of time with a few mouse clicks, as described in the next sections. Programming knowledge is not required.

Apica ProxySniffer V5.0 User’s Guide English Edition
© 2012, 2013 Ingenieurbüro David Fischer AG, Switzerland All Rights Reserved Page 41 / 171
7.1 Variable Handler (Var Handler)
The variable handler can be invoked by clicking on any recorded URL call in the main menu. At the left side of the window, all details of the URL call which change from call to call are displayed. On the right side of the window, the Variable Handler is displayed and shows a summary of all extracted and assigned variables. This right hand side part of the window remains constant (static) for all URL calls:

Apica ProxySniffer V5.0 User’s Guide English Edition
© 2012, 2013 Ingenieurbüro David Fischer AG, Switzerland All Rights Reserved Page 42 / 171
7.2 Input Files
Input Files can be used to extract variables from a text file, such as a username and a password per simulated user - which can be assigned to a login form. However the functionality of input files is generic which means that variables for any purposes can be extracted. Click on the Add File… button inside the Var Handler to define of a new Input File and enter a simple file name, without a directory path. Please note that this action creates only the definition of the input file, but that it does not create the input file itself on disk. This means that the input file must also exist on disk and that it must be placed inside the same Project Navigator directory where the load test program is stored. You can create the input file on disk before, or during, or after the definition is made – or you can also copy an existing file to the corresponding Project Navigator directory. Please note that the name of the input file should have the file extension *.txt (recommended) or *.dat.
Name of the Input File (Definition)
Create a new Input File on disk inside the current Project Navigator directory.
Select an already on disk existing Input File which is located in the current Project Navigator directory
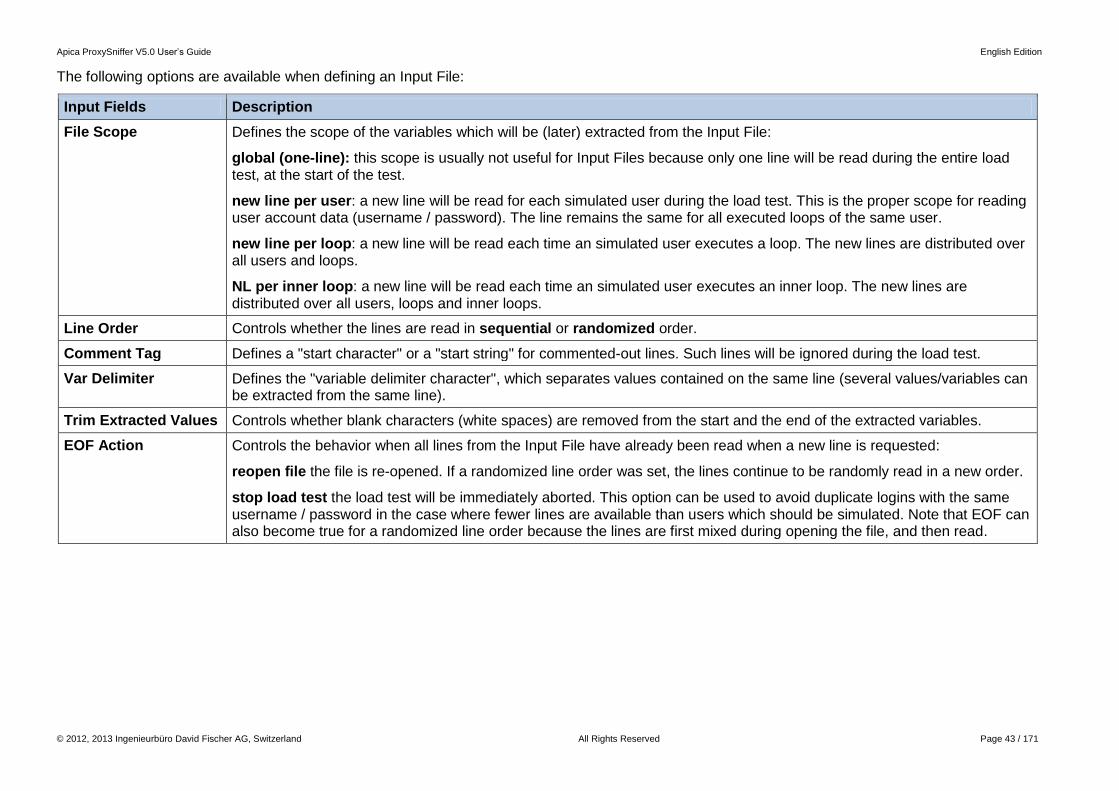
Apica ProxySniffer V5.0 User’s Guide English Edition
© 2012, 2013 Ingenieurbüro David Fischer AG, Switzerland All Rights Reserved Page 43 / 171
The following options are available when defining an Input File:
Input Fields Description
File Scope Defines the scope of the variables which will be (later) extracted from the Input File:
global (one-line): this scope is usually not useful for Input Files because only one line will be read during the entire load test, at the start of the test.
new line per user: a new line will be read for each simulated user during the load test. This is the proper scope for reading user account data (username / password). The line remains the same for all executed loops of the same user.
new line per loop: a new line will be read each time an simulated user executes a loop. The new lines are distributed over all users and loops.
NL per inner loop: a new line will be read each time an simulated user executes an inner loop. The new lines are distributed over all users, loops and inner loops.
Line Order Controls whether the lines are read in sequential or randomized order.
Comment Tag Defines a "start character" or a "start string" for commented-out lines. Such lines will be ignored during the load test.
Var Delimiter Defines the "variable delimiter character", which separates values contained on the same line (several values/variables can be extracted from the same line).
Trim Extracted Values Controls whether blank characters (white spaces) are removed from the start and the end of the extracted variables.
EOF Action Controls the behavior when all lines from the Input File have already been read when a new line is requested:
reopen file the file is re-opened. If a randomized line order was set, the lines continue to be randomly read in a new order.
stop load test the load test will be immediately aborted. This option can be used to avoid duplicate logins with the same username / password in the case where fewer lines are available than users which should be simulated. Note that EOF can also become true for a randomized line order because the lines are first mixed during opening the file, and then read.

Apica ProxySniffer V5.0 User’s Guide English Edition
© 2012, 2013 Ingenieurbüro David Fischer AG, Switzerland All Rights Reserved Page 44 / 171
Next, you should test to ensure that the parsing of the Input File works correctly. This can be done by clicking on the icon for an Input File definition:
Afterwards, you can extract variables from the Input File by clicking one or more times on the variable extractor icon :
Input Fields: Line Column #: the column number (of a line) from which the variable is extracted (1, 2, 3 ..) Var Name: any new variable name, but with the following naming restrictions:
- The name can only contain the characters A..Z, a..z, 0..9 and _ . Spaces are not permitted.
- The name must not start with an underline character _

Apica ProxySniffer V5.0 User’s Guide English Edition
© 2012, 2013 Ingenieurbüro David Fischer AG, Switzerland All Rights Reserved Page 45 / 171
The following example shows the definition of an Input File, (first) without the assignment of variables:
The "read bars" with the title texts “password“ and “username“ are the names of the extracted variables. The variable scope is shown in brackets next to the title text. The blue left arrow indicates that the value of the variable has been extracted. More details about how the variable was extracted can be displayed by clicking on the corresponding magnifier icon. A variable, or the Input File definition itself, can be deleted by clicking on the red bar. The Input File definition can be displayed and modified by clicking on the corresponding magnifier icon.
To finish this example, it is now necessary for the username and password to be assigned to the URL call which performs the login. All URL calls can be reviewed in the main menu. Click on the corresponding URL to display the URL's "details menu" in which the assignment can be done. Alternatively – if you do not know on which URL the login was made – you can search for a specific text in the entire recorded session. In this example, you should use as the search string the password which was entered during recording. Click on the Search Overall icon and enter the password as the search string:
Afterwards, click on the red right arrow ( ) inside the search result to see the URL details of the login.
Note: a red right arrow ( ) inside the search result means that the search string has been sent by a URL call to the web server. Blue left arrows ( ) inside the search result mean that the search text was found in a response to a URL call which was received from the web server.

Apica ProxySniffer V5.0 User’s Guide English Edition
© 2012, 2013 Ingenieurbüro David Fischer AG, Switzerland All Rights Reserved Page 46 / 171
After the login URL call has been found, the variables “username“ and “password” can be assigned to the form parameters (HTTP Request Content) by clicking on the corresponding icons.
Assignment Options:
Assign from Var: select the variable which should be assigned.
Var value conversion:
none: the value of the variable will be assigned unchanged.
encode: the value of the variable will first be URL-encoded and then assigned; for example, “Zürich HB“ will be transformed to “Z%FCrich+HB“. This is the appropriate option when the value of the variable may contain spaces or special characters.
decode: this is the reverse of encode. This option is normally not used.
Assign var to all request parameters with same recorded value: by enabling this option, all URL calls in the recorded web surfing session are searched to see if any other URL calls use the same recorded value. If so, the variable will also be assigned to the other URL calls, resulting in the global replacement of recorded parameter values, irrespective of the parameter name. After this, the complete extract and assignment definition appears as follows:

Apica ProxySniffer V5.0 User’s Guide English Edition
© 2012, 2013 Ingenieurbüro David Fischer AG, Switzerland All Rights Reserved Page 47 / 171
7.2.1 More Hints for using Input Files
Because the extraction of variables from Input Files is completely independent from their assignments, there are many other scenarios where Input Files are useful; for example:
o Testing search forms, where the search text is read from the first variable of a line, and the response content test of the search result is compared to a second variable on the same line.
o To set the emulated user’s "think time" variable on a per-user basis, or on a per-loop basis for each user.
o To control the number of inner loop iterations.
o To enter user-specific data into forms, such as an article number during a purchase transaction. It is also possible to define several Input Files for the same load test program.
7.3 User Input Fields
User Input Fields are arbitrary global variables whose values are requested each time a load test is started. The following example uses a User Input Field to make the host name of the URL calls variable, in order that the same load test program can be executed against a development system and a test system, without the need to record two web surfing sessions.
Input Fields:
Var Name: arbitrary new variable name.
- The name can only contain the characters A..Z, a..z, 0..9 and _ . Spaces are not permitted.
- The name must not start with an underline character _ Var Label Text: denotes the label (description) which is displayed on the GUI when starting the load test. Default Value: the default value of the variable which is also displayed on the GUI when starting the load test.

Apica ProxySniffer V5.0 User’s Guide English Edition
© 2012, 2013 Ingenieurbüro David Fischer AG, Switzerland All Rights Reserved Page 48 / 171
After the User Input Field has been defined, it can then be assigned to the host name (in this example). You can click on any recorded URL in the main menu which contains the "correct“ host name; that is, the host name which you want to make variable. Then click on the assign icon in the HTTP request header.
Input Fields:
Assign to: whether the variable should be assigned to the protocol (http/https), to the host name, or to the TCP/IP port. In case you want to make more than one of these items variable, you must create additional User Input Fields.
Assign from Var: select the variable which was created when the User Input Field was defined.
Assign var to all requests with same protocol, host and port: when checked, the variable will be assigned to all URL calls which use the same protocol and the same host name and the same TCP/IP port. It may be necessary to assign the host name again to https requests if you have recorded a session which uses both the http and https protocols within the same web surfing session. .

Apica ProxySniffer V5.0 User’s Guide English Edition
© 2012, 2013 Ingenieurbüro David Fischer AG, Switzerland All Rights Reserved Page 49 / 171
The User Input Field will be displayed when the load test program is started. A maximum of 12 User Input Fields can be defined.

Apica ProxySniffer V5.0 User’s Guide English Edition
© 2012, 2013 Ingenieurbüro David Fischer AG, Switzerland All Rights Reserved Page 50 / 171
7.3.1 More Hints for using User Input Fields
User Input Fields are also often used to vary the “user’s think time". Another example would be the setting of the booking date for financial transactions. Note: if you start a load test job optionally from a script (see Application Reference Manual), you must pass the User Input Field as an additional argument to the load test program. The name of the program argument is the name of the variable which was created when the User Input Field was defined; for example, for a variable named "hostname" the corresponding argument specification would be:
java PrxJob transmitClusterJob “Cluster 1“ Test01 -u 100 -d 300 -t 60 -nolog -hostname “testsys.ggjhkjg.com“
7.3.1.1 Example – Adjustable User’s Think Time
The following example shows how the user’s think time of the page breaks (web pages) can be dynamically set every time when starting a load test:
1. Create a User Input Field and set a default value (in this case in seconds)
2. In the main menu, assign the variable of the User Input Field to the user’s think time of the first page break by using the option “Apply new user's think time values for all page breaks [2..n]”
3. After that you can freely choose the user’s think time of the web pages every time when starting the load test. The value of the User Input Field is also shown in the load test result detail menu (test scenario).

Apica ProxySniffer V5.0 User’s Guide English Edition
© 2012, 2013 Ingenieurbüro David Fischer AG, Switzerland All Rights Reserved Page 51 / 171

Apica ProxySniffer V5.0 User’s Guide English Edition
© 2012, 2013 Ingenieurbüro David Fischer AG, Switzerland All Rights Reserved Page 52 / 171
7.4 Load Test Plug-Ins
Proxy Sniffer Load Test Plug-Ins are Extension Modules to the Proxy Sniffer product. Plug-Ins are configured using the GUI, and are executed during a Load Test. The following Plug-Ins are already predefined and delivered as part of the Proxy Sniffer installation:
Plug-In Designation in the GUI Plug-In Functionality
Abort Failed Test Aborts a running Load Test if too many errors occur within a configured time interval.
Assign File Data to Request Content Read the data of a file from disk and assign it to the request content of an URL call (only useful for HTTP/S POST requests and some WebDAV methods).
Cookie Injector Sets a Cookie before, or during, the execution of a Load Test.
Get Cookie Value Extracts the value of a Cookie into a GUI Variable. The extracted value can be later assigned to a CGI parameter of a succeeding HTTP/S Request (among other targets).
Defer Load Test Start Delays the start of a Load Test Program for a configured time, expressed in minutes.
Delay Full Load Limits the load - respectively the number of the simulated users - for a configurable time. After this time is elapsed the load is increased to the originally number of planned users.
DNS Round Robin Load Balancing Supports web servers which are using DNS Round Robin for load balancing.
dynaTrace Integration Creates additional data during a Load Test for analysis using "dynaTrace Diagnostics". The dynaTrace Integration Handbook – which is available on our website – contain further information about how to integrate Proxy Sniffer with dynaTrace.
Generic Output File During a Load Test, writes the values of up to 6 GUI Variables line-by-line to a text file. The file scope is freely configurable - lines can be written per virtual test user, per loop execution, or per URL call.
Input File List Reads from a meta file a list of input files and assigns each simulated user a own input file. The simulated users are reading a new line from their input file each time before they are executing a new loop.
Large Input File Reads data from a large input file which has an unlimited size (> 1 GB)
Large Response Content Allows to receive response content data of a large size (up to 2 GB) for one or several URLs. Note that all response data are read as usual during load test execution, but that only a part of them are stored internally.
Limit Response Content
Limit the receiving of response content data to a specified size. Further reading of data from the web server during load test execution is aborted (skipped) for the configured URL when the maximum size is reached.
PKCS#11 Security Device Support for Smart Cards / PKCS#11 Security Devices which contain a SSL Client Certificate used for authentication against web servers.
Remove Cookie Removes a cookie from the cookie store of a simulated user.

Apica ProxySniffer V5.0 User’s Guide English Edition
© 2012, 2013 Ingenieurbüro David Fischer AG, Switzerland All Rights Reserved Page 53 / 171
User Synchronization Point 1 Retains all active users at a configurable synchronization point until all of the users have reached this point. After that, the users are rereleased, by applying a configurable deblock delay which is multiplied with the no. of the actual user (0, 1, 2 ...).
The configuration of a Plug-In, respectively adding a Plug-In to a recorded web surfing session, can be done in the Var Handler:
Some Plug-Ins require input-parameter. Therefore it may be necessary to define additional variables. One option to define such variables is to create global visible stand-alone variables with constant initial values (see chapter 7.9) – in case that only constant values are required as Plug-In input parameters (see chapter 7.9). Of course, such additional variables can also be extracted from other sources, for example from Input Files, or User Input Fields, or from responses of previous URL calls. Furthermore it is also possible to develop and add self-written Plug-Ins. You will find the corresponding documentation in the "Load Test Plug-In Developer Handbook” (PDF) and in the “Proxy Sniffer Java API Documentation” which both are included in the installation kit.

Apica ProxySniffer V5.0 User’s Guide English Edition
© 2012, 2013 Ingenieurbüro David Fischer AG, Switzerland All Rights Reserved Page 54 / 171
7.5 Dynamically-Exchanged Session Parameters
The HTTP protocol by itself is stateless – there is no memory from URL call to URL call; however, most web applications require state information, such as the stage in a process that a user has reached - before login, after login, placed an order, and so on. Usually, cookies are used to keep state information. Cookies are set by the web server as additional HTTP response header fields, and sent by the web browser back to the web server, along with the HTTP requests of succeeding URL calls. This is normally not a problem because the correct handling of cookies is automatically done by the load test program. However, some web applications use, as a special "session context", dynamically-generated CGI- or form-parameter values which are exchanged between the web application and the web browser in such a way that, if you repeat the same web surfing session, the values of these parameters are changed by a more or less random algorithm. If you use, during a load test, these "burned-in" values of dynamically-generated server-side CGI- or form-parameters, the load test will fail. A good example of this is the "__VIEWSTATE" parameter used by Microsoft web servers. The solution to this problem is that the values of these dynamically-exchanged session parameters must be extracted at runtime (during the load test), and then assigned to the corresponding parameters of succeeding URL calls. To make this task easier, Proxy Sniffer provides the Var Finder menu. You can invoke the Var Finder either from the main menu, or from the Var Handler:

Apica ProxySniffer V5.0 User’s Guide English Edition
© 2012, 2013 Ingenieurbüro David Fischer AG, Switzerland All Rights Reserved Page 55 / 171
7.5.1 Automated Handling of Dynamically-Exchanged Session Parameters (Var Finder)
The Var Finder menu provides an overview of all URL request parameters, and their values, used anywhere in the entire recorded web surfing session. In this view, a parameter "name-value" pair is shown only once, even if the same "name-value" pair is used by more than one URL call. If the same parameter(-name) is used with different values, it will be shown multiple times, once for each distinct value. Proceed as follows: 1. First, review the recorded values and try to judge which values could be dynamically-exchanged session parameters. If the value contains a long
number, or is a cryptic hexadecimal string, the value has a good chance of being a dynamically- exchanged session parameter
In the example at left, levid, id and __VIEWSTATE are dynamically-exchanged session parameters. But type and “Status1:ins_step22:txtPolicyNumber” are not because their values have been entered manually into forms during the recording of the web surfing session..
2. Try next to perform an automated handling of the dynamically-exchanged session parameters. This succeeds in approximately 50% of all cases. To do this, click on the icons which are shown at the left of the parameter names.
If you receive a success message, there is nothing more to do for this parameter:
The corresponding definitions inside the Var Handler are automatically created.
On the other hand, if you receive an error message, you must manually extract the value of the dynamically-exchanged session parameter (see the next subchapter):

Apica ProxySniffer V5.0 User’s Guide English Edition
© 2012, 2013 Ingenieurbüro David Fischer AG, Switzerland All Rights Reserved Page 56 / 171
In this example, the parameter __VIEWSTATE could be handled automatically, but the parameter id must be extracted manually. Since this parameter is listed twice - the same name with different values - the extraction must also be done twice, once for each distinct value. Hint: you can use this menu as a checklist of parameters which are already dynamically handled, irrespective of whether the extraction done automatically or manually. The handling is already done if the line contains a blue (extract) arrow and a red (assign) arrow.

Apica ProxySniffer V5.0 User’s Guide English Edition
© 2012, 2013 Ingenieurbüro David Fischer AG, Switzerland All Rights Reserved Page 57 / 171
7.5.2 Manual Extraction of Dynamically-Exchanged Session Parameters
The documentation in this subchapter 7.5.2 is still applicable, but not more up to date. Starting from Proxy Sniffer Version 4.4-G a new function named "Var Extractor Wizard" had been added to the product. Further information is provided in the new manual about Handling of "Dynamically-Exchanged Session Parameters" (PDF document: HandlingDynamicSessionParameterEN.pdf)
If the automated handling did not succeed, you should click on the magnifier icon at the left of the desired parameter. All of the URLs in the web session are searched, looking for the recorded value.
Blue arrows pointing to the left ( ) indicate that the value of the parameter was found in a response received from the web server (HTTP response header or HTTP response content). Red arrows pointing to the right ( ) indicate that the value of the parameter was found in a request which was sent to the web server (HTTP request header or HTTP request content). You now need to extract the value from a response before it is sent the first time back to the web server. In this example, this must be done on item 19 (URL 19). Important also is whether the value must be extracted from the HTTP response header (for example a 302 redirection with URL CGI parameters), or from the HTTP response content (for example HTML or XML data …). A helpful hint is displayed near the arrows (in this example: “Found in Response content”). As can be seen in this example, the parameter must be extracted from URL 19 and assigned to the URLs 33, 35 and 38.

Apica ProxySniffer V5.0 User’s Guide English Edition
© 2012, 2013 Ingenieurbüro David Fischer AG, Switzerland All Rights Reserved Page 58 / 171
Click next on the first blue arrow ( ). Then the URL Details / Var Handler menu is displayed: Click on the search button in the HTTP response content. The search results are marked in red. Because automatic handling failed, you probably cannot extract the value by using the form parser (HTTP Response Content Forms Extract) , or by using the hyperlink parser (HTTP Response Content Unique Hyperlinks Extract); therefore, you must use the text pattern-based token extractor. Proceed as follows:
1. Scroll left to the beginning of the line where the result is found, and memorize the line number (in this case 232)
2. Locate a unique text pattern near the place where the variable text fragment (the search result) should be extracted. This text pattern can also be located on a preceding or succeeding line. Please note that the variable text fragment itself must not be part of the text pattern. If the text pattern is not on the same line as the text fragment to be extracted, you must also memorize the negative or positive line offset (.. -1, -2, +1, +2 ..)
3. Mark the unique text pattern and click on the var extractor
icon
4. Wait 3 seconds. The selected text pattern will be copied into the Var Handler input form (field Search Text). At this point, if a negative or positive line offset is needed, select the line offset in the field Extract Var on.

Apica ProxySniffer V5.0 User’s Guide English Edition
© 2012, 2013 Ingenieurbüro David Fischer AG, Switzerland All Rights Reserved Page 59 / 171
5. Now try clicking on Test Extract in the Var Handler input form, and check to see if the value of “Extracted on Line” has the same line number within the HTTP response content as the line number where the variable text fragment (the result) should be extracted. If the line numbers are not identical, your “unique text pattern” is not unique, and you will have to find another text pattern.
6. Inspect the HTTP response content for the preceding and succeeding characters which bracket the
variable text fragment. In this example, these characters are r and ’.
Enter these characters into the field Token Delimiters. After this, click again on Test Extract and then click on the blue question mark ?
7. At this point, a pop-up window is displayed which
shows a list of text fragments (tokens). Enter the number of the token containing the desired variable text fragment into the field Extract Token Nr, and then click again on Test Extract.
?

Apica ProxySniffer V5.0 User’s Guide English Edition
© 2012, 2013 Ingenieurbüro David Fischer AG, Switzerland All Rights Reserved Page 60 / 171
8. Check to see if the blue marked value is exactly the same as the recorded value of the parameter which should be extracted; that is, if it is the same as the variable test fragment / search result.
9. Finally, enter an arbitrary variable name into the field Map to Var Name. In this example, the
name id_1 is chosen because the parameter must be extracted twice, once each into two different variables, as was shown in the Var Finder. Activate the checkbox Assign var to all request parameter with same recorded value, and let the checkbox Try URL-Encoding remain activated. Then click on Extract.
The configuration inside the Var Handler now shows that the value of the parameter is extracted from URL 19, and assigned to the URLs 33, 35 and 38. This matches exactly with the first estimate, which was made by clicking on the magnifier icon inside the Var Finder. Hint: in this example you would have to repeat the same steps to handle the second value of the parameter id. It is recommended that you save the recorded web surfing session periodically after making changes inside the Var Handler.
?
?
?

Apica ProxySniffer V5.0 User’s Guide English Edition
© 2012, 2013 Ingenieurbüro David Fischer AG, Switzerland All Rights Reserved Page 61 / 171
Further Hints: Dynamically-Exchanged Session Parameters can also be extracted in an easy way from redirections, from forms, and from hyperlinks:
You should always use the option “Assign var automatically to all HTTP requests which contain form or CGI parameters with the same recorded value"
The Search Overall menu gives you an excellent overview if you know already the name or the value of a Dynamically-Exchanged Session Parameter. Thus it is easy to determine the first URL from which the session parameter should be extracted: Paste the value or the name of the session parameter into the input field and extract it from the response in which the first occurrence is found.

Apica ProxySniffer V5.0 User’s Guide English Edition
© 2012, 2013 Ingenieurbüro David Fischer AG, Switzerland All Rights Reserved Page 62 / 171
7.6 Replacing Text Patterns
In rare cases, the name of an HTTP request parameter is variable, instead of the parameter value being variable. Even rarer are cases where a file path of a URL call contains variable parts. You can handle such cases as follows:
1. Use the text pattern-based variable extractor as described in the previous sub-chapter.
2. At the last step, use the checkbox Assign var to all matching request file and request content patterns with same recorded value, instead of Assign var to all request parameter with same recorded value.
There are also other rare cases in which a text pattern must be extracted from an HTTP response header because a variable HTTP redirection occurs, on which only a part of the URL file path, or a part of a CGI parameter, is variable. This is also supported – if two extractor icons are present, you simply use the second one.

Apica ProxySniffer V5.0 User’s Guide English Edition
© 2012, 2013 Ingenieurbüro David Fischer AG, Switzerland All Rights Reserved Page 63 / 171
7.6.1 Extracting and Assigning Values of XML and SOAP Data
In case that XML or SOAP data have been recorded, Proxy Sniffer parses such data automatically and displays an additional XML Icon within the title of the “HTTP response Content” and the “HTTP request content” box:

Apica ProxySniffer V5.0 User’s Guide English Edition
© 2012, 2013 Ingenieurbüro David Fischer AG, Switzerland All Rights Reserved Page 64 / 171
7.7 HTTP File Uploads
If a recorded web surfing sessions contain HTTP file uploads, you can also use a variable for each file upload which allows to select the uploaded file dynamically during the load test. Such a variable is often extracted from an input file whose lines contain different file names (without file paths).
Note: before you start the load test, you have to place all files which should be uploaded into the same project navigator directory where the compiled load test program resides. Then – before you start the load test – you have to zip the compiled *.class of the load test program together with all files which should be uploaded (and also together with all used input files). After this execute the zipped archive itself as load test program.

Apica ProxySniffer V5.0 User’s Guide English Edition
© 2012, 2013 Ingenieurbüro David Fischer AG, Switzerland All Rights Reserved Page 65 / 171
7.8 Overview of most commonly used Extract and Assign Options
The following illustration is not exhaustive.
Assign variable to a CGI-Parameter zuweisen
Replace a text pattern of an URL call with a variable
Assign variable to the protocol, host name or TCP/IP port of an URL call
Replace a text pattern of a form parameter with a variable
Assign variable to a form parameter
Extract variable from a CGI parameter of a HTTP redirection
Extract a text pattern from a HTTP redirection into a variable
Extract a text pattern from the response content (HTML or XML data) into a variable
Extract a variable from a form parameter
Extract variable from a CGI parameter of a hyperlink

Apica ProxySniffer V5.0 User’s Guide English Edition
© 2012, 2013 Ingenieurbüro David Fischer AG, Switzerland All Rights Reserved Page 66 / 171
7.9 Directly-Defined Variables (stand-alone Variables)
Variables are usually defined implicitly by creating Input Files, User Input Fields, using the Var Finder, or by extracting values using the Var Handler. However, it is also possible to define variables directly for special-purpose use. Depending on the scope, directly-defined variables can have special initial values which are set during the load test by the load test program itself. Supported combinations of scope and initial values are:
Initial Value G U L IL
constant value
null
current user counter -
loop counter ¹ ² - -
inner loop counter - - -
system time milliseconds
load source IP host name ³ ³ -
load source IP address ³ ³ -
G = [global var] U = [user var] L = [loop var] IL = [inner loop var]
¹ = (outer) loop counter overall users
² = (outer) loop counter of the user
³ = inclusive multi-homing support (chapter 12)
Initial Values:
- constant value: the variable is initialized with an arbitrary constant value
- null: the value of the variable is not valid / undefined at initialization time
- current user counter: the variable is initialized with the sequence number of the simulated user (0, 1, 2 ..)
- loop counter: global var scope: the variable is initialized with the outer loop counter (0, 1, 2 ..) – counted over all simulated user / user var scope: the variable is initialized with the outer loop counter of the actual simulated user (0, 1, 2 ..)
- inner loop counter: the variable is initialized with the iteration counter of the inner loop (0, 1, 2 ..) – of the actual simulated user
- system time milliseconds: the variable is initialized with the current operating system time, in milliseconds since 1970
- load source IP host name: the variable is initialized with the Exec Agent host name
- load source IP address: the variable is initialized with the Exec Agent IP address

Apica ProxySniffer V5.0 User’s Guide English Edition
© 2012, 2013 Ingenieurbüro David Fischer AG, Switzerland All Rights Reserved Page 67 / 171
7.10 J2EE URL Rewriting
A Java (J2EE) application server can be configured by the developers of the web application such that a procedure called "URL rewriting" is used to build the session context, instead of using session cookies. In this case, the server will assign at runtime a special dynamic session parameter to every returned hyperlink, and to every form, which contains the session context. An example of a hyperlink with applied URL rewriting is as follows: <A HREF="http://www.d-fischer.com:8080/prxtool/servlet/WebMainMenu;jsessionid=bu3fy0bbj1?currentDir=344">weiter</A> The URL rewriting parameter is appended to the URL file path, separated by a semicolon, and appears before the normal CGI parameters which start with a question mark. Usually a Java application server supports both session cookies and URL rewriting; however, only one of these procedures is applied, on a per-user basis, to build the session context. The inner algorithm of the application server works as follows:
1. When a web browser requests any page from the server for the first time, the server does not know if the web browser supports session cookies. For this reason, the server sends a session cookie to web the browser and performs additionally URL rewriting for all hyperlinks and forms for the first web page.
2. When the web browser requests a second page from the server, and transmits the received session cookie back to the server, the server will then know that the browser supports cookies. For the current and all succeeding web pages, URL rewriting will no longer be done.
3. If on the second page request, the web browser does not send back the cookie, or if the application server is configured to disable the use of session cookies (in which case an initial cookie will not have been sent anyway), the web server notes the absence of the session cookie and does URL rewriting for the current web page, and all succeeding web pages.
You do not usually have to do anything special in this case because most Java application servers support session cookies. However, if session cookies are disabled, you must first enable the support of URL rewriting inside the Var Handler before the load test can be executed successfully. You will recognize the need for this when you review the recorded URLs in the main menu – if the URL rewriting parameter is found in all URL calls in the majority of web pages, you will have to enable URL rewriting support in the Var Handler. To do this, proceed as follows:
1. Click, in any URL detail menu, on the URL rewriting icon inside the Var Handler
2. Enter the name of the URL rewriting parameter in the field Rewrite Parameter
3. Enter an arbitrary variable name in the field Map to Var Name
4. Use the option automatically for the field Dynamic Handling

Apica ProxySniffer V5.0 User’s Guide English Edition
© 2012, 2013 Ingenieurbüro David Fischer AG, Switzerland All Rights Reserved Page 68 / 171
After URL rewriting has been enabled, the Var Handler shows only the first extraction of the URL rewriting parameter - but not its assignment. This is normal behavior because the assignment in succeeding URL calls will be done automatically later in the load test, without the need for additional configuration.
Note: the URL rewriting parameter may also have a name other than jsessionid because the name itself can be configured inside the web application server. You must enter the actual parameter name in the field Rewrite Parameter. It is also possible that the value of the URL rewriting parameter can change during the web surfing session; for example, after logging in to the web application, or after logging out. In this case, you will see two or more extractors for the URL rewriting parameter inside the Var Handler.

Apica ProxySniffer V5.0 User’s Guide English Edition
© 2012, 2013 Ingenieurbüro David Fischer AG, Switzerland All Rights Reserved Page 69 / 171
8 Generating Load Test Programs
Note that only URLs which are visible in the main menu are used by the load test program. This means that you can use the URL filter to exclude certain types of URLs from being executed by the load test program:
Filter Input Fields:
No Binary Data (Images ...): suppresses all URLs which are received along with a 200 (ok) HTTP status code, but with non-ASCII content data. This will strip away all images and other kinds of binary data, such as flash animations.
No CSS, JS (Only HTML): suppresses all successfully-received (200 ok HTTP status code) ASCII text-data which are not in HTML format. This will strip away style sheets (CSS) and JavaScript files.
No Cached Data (304): suppresses all browser-side cached URLs received with a 304 (found) HTTP status code from the web server (recommended option).
No Errors: suppresses all URLs with an incomplete response from the web server, and also suppresses all error responses from the web server (HTTP status codes equal to or greater than 400). If you do not activate this option, the load test will check that error is still there; that is, an error = success.
Host: suppresses all URLs which are not received from a given hostname. You may use this option to strip away foreign content such as advertisements from a banner server. Additionally, the usage of an exclamation mark “!” in front of the hostname is also supported, which means that items from this host are suppressed. Several host names can be entered, separated by commas (,) - with or without an exclamation mark.
Click on the Generate Load Test icon in the main menu or in the URL Details / Var Handler menu to generate the load test program.

Apica ProxySniffer V5.0 User’s Guide English Edition
© 2012, 2013 Ingenieurbüro David Fischer AG, Switzerland All Rights Reserved Page 70 / 171
Normally, you should only have to enter the name of the load test program and to configure the Runtime Execution Behavior (serial or parallel execution order of the URLs within the Web pages – applied per simulated user), without having to choose or modify any other options. Special options are only needed if:
o you have to execute the load test over an outbound proxy server (see chapter 3.1.2.1)
o you want to use more than one user account for Basic Authentication or if Digest Authentication is required against the web server
o NTLM or Kerberos authentication was required to record the web surfing session (see chapter 3.1.2.5 and 3.1.2.6)
o an X509 client certificate was required to record the web surfing session (see chapter 3.1.2.3)
Input Fields:
Java™ Classname: desired name of the (new) load test program.
Content Test Algorithm: defines how the received content of the URL calls will be verified during the load test:
[+] apply (heuristic) methods from recorded session: means that the automatically-applied content test algorithms will be used, including for modifications which have been done manually (see section 4.2.2). Additionally, the received HTTP status code (200, 302..) and the MIME type (text/html, image/gif ..) of each URL call will also be verified. This is the only option which ensures that the received web pages are correctly verified.
[±] compare all URL calls with recorded size (+/- 5%): means that only the size of the received content is compared with the recorded size. The automatically-applied test algorithms will not be applied during the load test; however, the HTTP status code and the MIME type will be verified. The allowed tolerance range of the received size is implicitly set to +/- 5% for all URL calls. This option is not recommended because you may get misleading errors if a dynamically-generated HTML page changes in size, or you may not detect some errors which are embedded within a HTML page which is of the correct size.
[–] none - content test disabled: means that only the HTTP status code and the MIME type will be verified during the load test. The results of such tests are often invalid because errors embedded within an HTML page will not be detected.

Apica ProxySniffer V5.0 User’s Guide English Edition
© 2012, 2013 Ingenieurbüro David Fischer AG, Switzerland All Rights Reserved Page 71 / 171
Character Encoding: defines which character set is used to search for strings within the received content, and for data read from Input Files. Usually you can use the default option "OS Default" which means that the default character set of the (local) operating system is used; however, if you execute remote tests on other operating systems different from your local OS (Windows -> Unix), it is recommended that you use the character set ISO-8859-1 to avoid problems with special characters, such as umlauts
HTTP Protocol Version: usually the HTTP protocol version 1.1 should be used for load tests. This protocol version is supported by all newer web browser and web server products, and allows the re-use of network connections over several URL calls (HTTP keep alive option). If HTTP protocol version 1.0 is chosen, the network connections cannot be re-used, and a new network connection is opened and closed for each URL call.
Allow Keep-Alive: the re-use of network connections can also be disabled for HTTP protocol version 1.1 using this option; however, this is not recommended.
Strip Referer Header Field: the HTTP referer header field is not commonly used by web applications, and therefore often dropped by (local) internet security tools. Enabling this option reduces the data transfer and makes the load test program smaller.
Accept */* Header Field: the HTTP accept header field is not commonly used by web applications, but contains a long text string. Setting the accept header field to */* reduces the data transfer and makes the load test program smaller.
Load Test over HTTP(S) Proxy: this option allows the execution of a load test through an (outgoing) proxy server by applying the next proxy configuration from the menu "Personal Settings". You should use this option only if you have no direct TCP/IP connection between the load test program and the web server.
Basic Authentication: this option enables user-specific, individual, basic authentication against the web server. Please note that Proxy Sniffer already automatically supports "common" basic authentication. If all simulated users use the same username and password for basic authentication, this option must not be enabled. If this option has been enabled, you must manually create an Input File - named basicauth.txt - which contains a line for the username and the password for each simulated user. These two elements on each line must be separated by semicolons (;). The Input File must be located in the same directory as the generated load test program. After compiling the load test program inside the Project Navigator, you must first ZIP the compiled class of the load test program together with the basicauth.txt file and then execute the zipped archive itself as the load test program.
Digest Authentication: Digest Authentication: this option enables digest authentication against the web server. If you choose the option use common Username / Password, the same username and password is used for all simulated users. By choosing the option Apply individual Digest Authentication per user from input file, each simulated user uses its own username and password. In such a case you must manually create an input file - named digestauth.txt - which contains on each line the username and the password per simulated user. These two line-elements must be separated by semicolons (;). The input file must be located in the same directory where the generated load test program is stored. After compiling the load test program inside the Project Navigator, you must ZIP the compiled class of the load test program together with the digestauth.txt file and then you must execute the zipped archive itself as load test program.
NTLM Authentication: this option enables NTLM (Windows) authentication. If you choose the option use common NTLM account from Personal Settings menu (see chapter 0), the same NTLM username and password is used for all concurrent users. By choosing the option apply individual NTLM account per user from input file, each simulated user uses its own username and password, in which case you must manually create an Input File - named ntlmauth.txt - which contains a line for the domain, the username, and the password for each simulated user. These three elements on each line must be separated by semicolons (;). The Input File must be located in the same directory as the generated load test program.
Apica ProxySniffer V5.0 User’s Guide English Edition
© 2012, 2013 Ingenieurbüro David Fischer AG, Switzerland All Rights Reserved Page 72 / 171
After compiling the load test program inside the Project Navigator, you must first ZIP the compiled class of the load test program together with the ntlmauth.txt file and then execute the zipped archive itself as load test program.
Kerberos Authentication: this option enables Kerberos authentication against web servers and/or for outbound proxy servers. If you choose the option use common Kerberos account from Personal Settings menu, the same username and password is used for all simulated users. By choosing the option apply individual Kerberos account per user from input file, each simulated user uses its own username and password. In such a case you must manually create a file - named kerberosauth.txt - which contains on each line the username and the password of a user account. These two line-elements must be separated by semicolons (;). The file must be located in the same directory where the generated load test program is stored. After compiling the load test program inside the Project Navigator, you are requested to ZIP the compiled class of the load test program together with all Kerberos configuration files. After that the load test can be started by clicking on the corresponding ZIP file
HTTPS Client Certificates: this option enables HTTPS X509 client certificate authentication on the load test program. If you choose the option use common, active PKCS#12 certificate from Personal Settings menu (see chapter 3.1.2.3), the same client certificate is used for all simulated users, and this certificate will be automatically transferred into the source code of the load test program. If you choose the option apply individual PKCS#12 certificate per user from input file, each simulated user uses its own certificate, in which case you must manually create two Input Files:
- pkcs12auth.txt - a text-file which contains a line for the PKCS#12 filename, and the password of the PKCS#12 file, for each simulated user. These two elements on each line must be separated by semicolons (;)
- pkcs12certs.zip – a zip-file containing, in one archive, all PKCS#12 client certificate files which are referenced in pkcs12auth.txt.
Both Input Files must be located in the same directory as the generated load test program. After compiling the load test program inside the Project Navigator, you must first ZIP the compiled class of the load test program together with the pkcs12auth.txt file and pkcs12certs.zip files. Then you must execute the zipped archive itself as load test program.
Program Description: optional, arbitrary text description of the load test program. The description will be transferred to the generated Java code.
Hint: instead of clicking on the Continue button, you can also just press the enter key. The following dialogue will then be displayed:

Apica ProxySniffer V5.0 User’s Guide English Edition
© 2012, 2013 Ingenieurbüro David Fischer AG, Switzerland All Rights Reserved Page 73 / 171
On the left-hand side, you can choose the Project Navigator directory in which the load test program will be stored. The current directory is marked in blue. You can also create new subdirectories by clicking on the icon.
On the right-hand side, the title Display Load Test Program is shown. This allows you to view/examine the automatically- generated load test program before it is stored.
Directly below this, the Response Verification Summary is shown. This contains an extract of the automatically-applied content test configuration. The overview contains only URLs
a) whose received content is verified by a search string (text fragment), or
b) whose content test configuration was manually modified; for example, a disabled content test configuration for a particular GIF image because it was a rotating banner advertisement
Here you can again modify the content test configuration by clicking on the corresponding magnifier icons. It is recommended that you save the web session after you have made any changes. This can be done by clicking on the icon.
Enable the checkbox Overwrite & Compile and then click on the Save Load Test Program button to store and compile the automatically-generated load test program. The Project Navigator menu will then be displayed:
The newly-created (and compiled) load test program is marked with a dark blue background and can now be
started by clicking on the icon.

Apica ProxySniffer V5.0 User’s Guide English Edition
© 2012, 2013 Ingenieurbüro David Fischer AG, Switzerland All Rights Reserved Page 74 / 171
8.1 Load Test Programs with Dependent Files
Executable load test programs (*.class files) which use dependent files such as Input Files or Plug-Ins must first be zipped together with the dependent files into a single ZIP archive. Thereafter, the ZIP archive itself must be started as the load test program. The GUI checks every time when a simple load test program (*.class file) is started to see if Input Files or Plug-Ins are needed. If so, you will receive an appropriate information message, with the hint that you must build a ZIP archive for the load test. This can easily be done by just clicking on the “>> ZIP and execute…” button:
Background information: load test programs can also be transferred and executed on remote systems in the same manner as on the local system; therefore, all data which are needed during program execution must be packed to one ZIP archive.
If the load test program contains other dependent files which are not Input Files and not Plug-Ins – for example files which should be uploaded to the web server – you have create the ZIP archive manually by using the ZIP functionality of the Project Navigator. The corresponding instructions are displayed in the lower part of the window.
Hint: if the date of one of the files which has been added to the ZIP archive is newer than the date of archive itself, you will be asked, at the start of the load test, if the archive should be automatically re-zipped. This means that you only have to create the ZIP archive once; afterwards, you can just start the zipped load test program directly:

Apica ProxySniffer V5.0 User’s Guide English Edition
© 2012, 2013 Ingenieurbüro David Fischer AG, Switzerland All Rights Reserved Page 75 / 171
9 Executing Load Test Programs
After the load test program has been called by the Project Navigator, you must enter the test input parameters for the test run (a single execution of the load test program is also called “test run”). The most important parameters are Number of Concurrent Users and Load Test Duration. You should also enter a small comment about the test run into the input field Annotation. Input Fields:
- save as template: stores all load test input parameters additionally inside a XML template (see chapter 9.5). Later, this template can be used to rerun (repeat) the same load test.
- Execute Test Form: denotes from which computer or load releasing cluster the load test will be executed. If you did not define additional remote Exec Agents or Exec Agent Clusters (chapter 11), only the option “Host: Local Exec Agent“ is available, indicating that the load test program is executed by your local system.
- Number of Concurrent Users: number of users which are simulated during the load test.
- Load Test Duration: planned test duration. After the test duration has elapsed, each user will terminate the current loop (repetition of the web surfing session) before the test run completes; thus, the duration of the test run will be a little bit longer than the planned test duration given here. If the value of the input field Max. Loops per User is not set to unlimited, the test run may complete before the planned test duration elapses because all users have already executed their maximum number of loops.
- Max. Loops per User: maximum number of surf session repetitions per user. If the value of the input field Load Test Duration is not set to unlimited, the test run may complete before the planned test duration elapses because all users have already executed their maximum number of loops.

Apica ProxySniffer V5.0 User’s Guide English Edition
© 2012, 2013 Ingenieurbüro David Fischer AG, Switzerland All Rights Reserved Page 76 / 171
- Startup Delay per User: usually concurrent users are not started at exactly the same time because this, rather unusual, scenario will overload the web server immediately. This parameter controls how much time will elapse before an additional user will be started (ramp-up of load at start).
- Max. Network Bandwidth per User: allows you to reduce the maximum network bandwidth per user in order to simulate slow network connections to the web server; for example, connections over DSL or modem lines. The downlink and the uplink speeds can be adjusted separately to simulate asymmetric network bandwidths.
- Request Timeout per URL: timeout in seconds per single URL call. If this timeout expires, the URL call will be reported as failed (no response from web server), and the emulated user will abort the current loop and continue with the next loop.
- Max. Error-Snapshots: limits the maximum number of error snapshots taken during load test execution (see chapter 10.2). Either the maximum memory used to store error snapshots can be configured (recommended - for cluster jobs: value overall cluster members), or alternatively the maximum number of error snapshots per URL can be configured (not recommended - for cluster jobs: value per Exec Agent).
- Statistic Sampling Interval: statistic sampling interval during the load test in seconds (interval-based sampling). Used for time-based overall diagrams like for example the measured network throughput. If you run a load test over several hours, it is required that you increase the statistic sampling interval up to 10 minutes (600 seconds) to save memory. If the load test runs only some minutes you may decrease the statistic sampling interval.
- Additional Sampling Rate per Page Call: captures the measured response time of a web page each time when a simulated user calls a web page (event based sampling). Used to display the response time diagrams at real-time as well as in the Analyse Load Test Details menu. For endurance tests over several hours it is strongly recommended that the sampling rate for web pages is set between 1% and 5%. For shorter tests 100% sampling rate is recommended.
- Additional Sampling Rate per URL Call: captures the measured response time of a URL each time when a simulated user calls a URL (event based sampling). Used to display the response time diagrams at real-time as well as in the Analyse Load Test Details menu. For endurance tests over several hours it is strongly recommended that the sampling rate for URL calls is disabled or set to 1% or 2%. For shorter tests 100% sampling rate is recommended. In addition to capturing the response time of the URL calls further data can be captured by using one of the following Add options
o --- recommended: no additional data are captured.
o Performance Details per Call: additionally collects the network connect time, the request transmit time, the response header wait time, the response header receive time, and the response content receive time of the URL calls.
o Request Headers: additionally collects the request headers of the URL calls.
o Request Content (Form Data): additionally collects the request content (form data) of the URL calls.
o Req. Headers & Content: additionally collects the request headers and request content (form data) of the URL calls.
o Response Headers: additionally collects the response headers of the URL calls.
o Resp. Headers & Content: additionally collects the response headers and the response content of the URL calls.

Apica ProxySniffer V5.0 User’s Guide English Edition
© 2012, 2013 Ingenieurbüro David Fischer AG, Switzerland All Rights Reserved Page 77 / 171
o All - without Resp. Content: additionally collects the request headers, the request content, and the response headers of the URL calls.
o All - full URL Snapshots: additionally collects all data of the URL calls.
Warning: capturing additional URL data takes much memory and uses also much CPU. Therefore the test duration should not exceed 10 minutes if you use one of these add-options in combination with 100% sampling rate per URL call. Reducing the sampling rate to 10% may allow a load test duration up to 30 minutes.
Hint: these additional URL data can be displayed and/or exported in the form of an HTML table when the test run has been completed (see Chapter 10.1.5).
- Debug Options: these options allow you to debug the inner workings of the load- test program. The result is written to the "job_*.out" file, which is usually only used to analyze internal errors in the load test program:
o none – recommended: recommended default value. Note that all measured performance data, and all error snapshots, are already stored inside the result file (*.prxres); therefore, special debug options are not necessary in order to analyze the load test result.
o debug loops (including var handler): writes the log data of all executed web surfing sessions (loops) to standard output, including information about dynamically-extracted session parameters and Input Files.
o debug headers & loops: includes the above option “debug loops” and, in addition, writes out all transmitted and received HTTP headers to standard output.
o debug content & loops: includes the above option “debug loops” and, in addition, writes out all transmitted and received HTTP content data to standard output; however, this option only writes out data which has been transmitted or received in ASCII format, such as HTML form parameters and HTML, XML, SOAP, or CSS style sheet data - but no binary data, such as images.
o debug cookies & loops: includes the above option “debug loops” and, in addition, writes out all received and transmitted cookies to standard output.
o debug keep-alive & loops: includes the above option “debug loops” and, in addition, writes out additional debug information about re-used network connections to standard output.
o debug SSL handshake & loops: includes the above option “debug loops” and, in addition, writes out additional debug information about SSL handshakes to standard output.
- Additional Options: these options allow you to enter special options. All special options keywords begin with a minus sign. Several options can also be combined (separated by space characters):
o -multihomed Forces the Exec Agent(s) to use multiple local IP addresses when executing the load test. This option is only used by the Exec Agent(s) if multiple IP addresses are configured at the operating system level, and are assigned to the Exec Agent configuration (see Chapter 12). The effect of this option is that each user uses, during the load test, its own client IP address. If fewer IP addresses are available than concurrent users are running, the IP addresses are averaged across the users.

Apica ProxySniffer V5.0 User’s Guide English Edition
© 2012, 2013 Ingenieurbüro David Fischer AG, Switzerland All Rights Reserved Page 78 / 171
o -dnshosts <file-name> Effects that the load test job uses an own DNS hosts file to resolve host names - rather than using the hosts file of the underlying operating system. Note that you have to ZIP the hosts file together with the compiled class of the load test program. To automate the ZIP it's recommended to declare the hosts file as an external resource (w/o adding it to the CLASSPATH).
o -dnssrv <IP-name-server-1>[,<IP-name-server-N>] Effects that the load test job uses specific (own) DNS server(s) to resolve host names - rather than using the DNS library of the underlying operating system. When using this option, at least one IP address of a DNS server must be specified. Multiple DNS servers can be configured separated by commas. If a resolved DNS host name contains multiple IP addresses the stressed Web servers are called in a round-robin order (user 1 uses resolved IP Address no. 1, user 2 uses resolved IP Address no. 2, etc.).
o -dnsenattl Enable consideration of DNS TTL by using the received TTL-values from the DNS server(s). This option cannot be used in combination with the option -dnsperloop. Note: when using this option the resolved IP addresses (and therefore the stressed Web servers) may alter inside the executed loop of a simulated user at any time - suddenly from one URL call to the next one.
o -dnsfixttl <seconds> Enable DNS TTL by using a fixed TTL-value of seconds for all DNS resolves. This option cannot be used in combination with the option -dnsperloop. Note: when using this option the resolved IP addresses (and therefore the stressed Web servers) may alter inside the executed loop of a simulated user at any time - suddenly from one URL call to the next one.
o -dnsperloop Perform new DNS resolves for each executed loop. All resolves are stable within the same loop (no consideration of DNS TTL within a loop). This option cannot be used in combination with the options -dnsenattl or -dnsfixttl. Note: consider when using this option that the default or the configured DNS servers are stressed more than usual because each executed loop of each simulated user will trigger one or more DNS queries.
o -dnsstatistic Effects that statistical data about DNS resolutions are measured and displayed in the load test result, by using an own DNS stack on the load generators. Note: there is no need to use this option if any other, more specific DNS option is enabled because all (other) DNS options also effect implicitly that statistical data about DNS resolutions are measured. If you use this option without any other DNS option, the (own) DNS stack on the load generators will communicate with the default configured DNS servers of the operating system - but without considering the "hosts" file.
o -mtpu <number> Allows to configure how many threads per simulated user are used to process URLs in parallel (simultaneously). Note: this value applies only for URLs which have been configured to be executed in parallel.

Apica ProxySniffer V5.0 User’s Guide English Edition
© 2012, 2013 Ingenieurbüro David Fischer AG, Switzerland All Rights Reserved Page 79 / 171
o -nosdelayCluster Effects for Cluster Jobs that the Startup Delay per User is applied per Exec Agent Job instead of applying it overall simulated users of the Cluster Job. Thus a faster ramp up of load can be achieved.
o -setuseragent "<text>" Replaces the recorded value of the HTTP request header field User-Agent with a new value. The new value is applied for all executed URL calls.
o -collect <measuring agent host>[:port][,<measuring agent host>[:port]]… example: -collect measuringhost1,measuringhost2 Forces the load test program to collect additional data from external measuring agents. Such data contain for example system operating values like CPU usage and memory consumption of the Web server and the database server.
o -sslcache <seconds> Alters the timeout of the user-related SSL session cache. The default value is 300 seconds. A value of 0 (zero) indicates that the cache is disabled.
o -sscreset Resets the user-related SSL session cache per loop (default: no reset per loop)
o -sslcmode Applies SSL (https) compatibility workarounds for buggy SSL servers. You may try this option if you consistently receive the error message "Network Connection aborted by Server" for all https calls when executing the load test.
o -tz <timezone> Allows you to set another time zone to be used during the load test, For a list of supported time zones: see the Application Reference Manual, Chapter 6.
o -Xbootclasspath/a:<path> Specify for the load test job a path of JAR archives and ZIP archives to append to the default bootstrap class path.
o -Xbootclasspath/p:<path> Specify for the load test job a path of JAR archives and ZIP archives to prepend in front of the default bootstrap class path.
- SSL: specifies which HTTPS/SSL protocol version should be used:
o v2/v3/TLS: allows you to detect the best SSL protocol version automatically. The TLS protocol is preferred; however, if it is not supported by the web server, SSLv3 is used – or – if SSLv3 is not supported, then SSLv2 is used. This is standard behavior implemented by many commercial web browser products.
o TLS: sets the SSL protocol version to TLS
o v3: sets the SSL protocol version to SSLv3
o v2: sets the SSL protocol version to SSLv2 (not recommended – out-dated SSL protocol version)
- Annotation: here you should enter a short comment about the test run, such as purpose, current web server configuration, and so on. This annotation will be displayed on the result diagrams.

Apica ProxySniffer V5.0 User’s Guide English Edition
© 2012, 2013 Ingenieurbüro David Fischer AG, Switzerland All Rights Reserved Page 80 / 171
9.1 Starting Exec Agent Jobs
If you have specified that the load test program be executed by a single Exec Agent (but not by an Exec Agent Cluster - see Chapter 11), the load test program is transmitted to the local or remote Exec Agent, and a corresponding load test job - with a job number - is created locally within the Exec Agent. The job is now in the state “configured”; that is, ready to run, but the job is not yet started.
Hint: each Exec Agent always executes load test jobs as separate background processes, and is also able to execute more than one job at the same time. The option Display Real-Time Statistic only means that the GUI opens an additional network connection to the Exec Agent, which reads the real time data directly from the memory space of the corresponding executed load test program. Click on the Start Load Test Job button to start the job. If you have de-selected the checkbox Display Real-Time Statistic, the window will close after a few seconds; however, you can - at any time - access the real time statistic data, or the result data, of the job by using the Jobs menu (see chapter 9.3) which can be called from the Main Menu and also from the Project Navigator.
Alternatively, the load test program can also scheduled to be executed at a predefined time. However, the corresponding Exec Agent process must be available (running) at the predefined time, because the scheduling entry is stored locally inside the Exec Agent jobs working directory which is monitored by the Exec Agent itself. Especially, if you have started the local Exec Agent implicitly by using the Proxy Sniffer Console - AND if the scheduled job should run on that local Exec Agent, you must keep the Proxy Sniffer Console Window open in order that the job will be started ¹.
¹ This restriction can be avoided by installing the Exec Agent as a Windows Service or as a Unix Daemon (see Application Reference Manual).
Note: if you close the window without clicking on the Start Load Test Job button, the job remains in the state "configured" or “scheduled”. Afterwards you can use the Jobs menu to start or delete the job, or to schedule or cancel the schedule of this job.
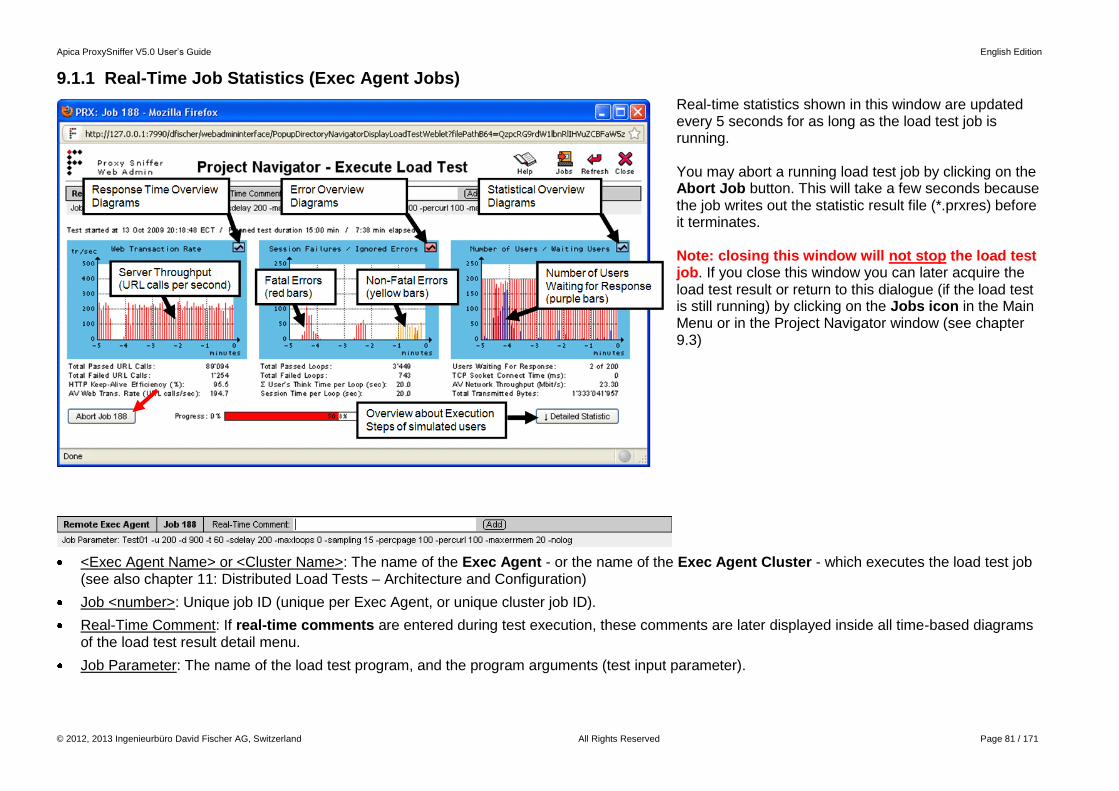
Apica ProxySniffer V5.0 User’s Guide English Edition
© 2012, 2013 Ingenieurbüro David Fischer AG, Switzerland All Rights Reserved Page 81 / 171
9.1.1 Real-Time Job Statistics (Exec Agent Jobs)
Real-time statistics shown in this window are updated every 5 seconds for as long as the load test job is running. You may abort a running load test job by clicking on the Abort Job button. This will take a few seconds because the job writes out the statistic result file (*.prxres) before it terminates. Note: closing this window will not stop the load test job. If you close this window you can later acquire the load test result or return to this dialogue (if the load test is still running) by clicking on the Jobs icon in the Main Menu or in the Project Navigator window (see chapter 9.3)
<Exec Agent Name> or <Cluster Name>: The name of the Exec Agent - or the name of the Exec Agent Cluster - which executes the load test job (see also chapter 11: Distributed Load Tests – Architecture and Configuration)
Job <number>: Unique job ID (unique per Exec Agent, or unique cluster job ID).
Real-Time Comment: If real-time comments are entered during test execution, these comments are later displayed inside all time-based diagrams of the load test result detail menu.
Job Parameter: The name of the load test program, and the program arguments (test input parameter).

Apica ProxySniffer V5.0 User’s Guide English Edition
© 2012, 2013 Ingenieurbüro David Fischer AG, Switzerland All Rights Reserved Page 82 / 171
The Web Transaction Rate Diagram shows the actual number of (successful) completed URL calls per second, counted overall simulated users.
By clicking on this diagram, the Response Time Overview Diagrams are shown (see chapter 9.1.1.1).
Total Passed URL Calls: The total number of passed URL calls since the load test job was started.
Total Failed URL Calls: The total number of failed URL calls since the load test job was started.
Keep-Alive Efficiency (%): The efficiency in percent about how often a network-connection to the web server was successfully re-used, instead of creating a new network connection. This (floating) average value is calculated since the load test job was started.
AV Web Trans. Rate (URL calls/sec): The (floating) average number of (successful) completed URL calls per second, calculated since the load test job was started
The Session Failures / Ignored Errors Diagram shows the actual number of non-fatal errors (yellow bars) as well as the number of fatal errors (red bars = failed sessions), counted overall simulated users.
By clicking on this diagram, the Error Overview Diagrams are shown (see chapter 9.1.1.3).
Total Passed Loops: The total number of passed loops (repetitions of web surfing sessions) since the load test was started.
Total Failed Loops: The total number of failed loops (repetitions of web surfing sessions) since the load test was started.
Σ User's Think Time per Loop (sec): The total user's think time in seconds for one loop per simulated user.
Session Time per Loop (sec): The average session time for one loop per simulated user. This value is the sum of "the average response time of all URLs and all user's think times" per successful completed loop.
The Number of Users / Waiting Users Diagram shows the total number of currently simulated users (red bars) as well as the actual number of users which are waiting for response from the web server (purple bars). The users waiting for response is a subset of the currently simulated users.
By clicking on this diagram, the Statistical Overview Diagrams are shown (see chapter 9.1.1.4).
Users Waiting For Response: the actual number of users which are waiting for response from the web server, compared to ("of") the total number of currently simulated users.
TCP Socket Connect Time (ms): The time in milliseconds (per URL call) to open a new network connection to the web server.
AV Network Throughput (Mbit/s): The total network traffic which is generated by this load test job, measured in megabits per second. This (floating) average value is calculated since the load test job was started.

Apica ProxySniffer V5.0 User’s Guide English Edition
© 2012, 2013 Ingenieurbüro David Fischer AG, Switzerland All Rights Reserved Page 83 / 171
Total Transmitted Bytes: The total number of transmitted bytes, measured since the load test job was started.
More actual measurement details are available by clicking on the Detailed Statistic button. Especially, an overview about the current execution steps of the simulated users is shown:
By clicking on the magnifier icon of a page, the most relevant measured values of the URLs are shown for the selected page.
Using this menu, you can also display and analyze error snapshots by clicking on the magnifier icon next to the failure counter (see Chapter 10.2). In this way, you can begin analyzing errors immediately as they occur – during the running load test.
By clicking on a URL, the corresponding URL Response Time Diagram is shown (see chapter 9.1.1.2).
All of these detail data, including all error data, are also stored inside the final result file (*.prxres) which can be accessed when the load test job has completed.

Apica ProxySniffer V5.0 User’s Guide English Edition
© 2012, 2013 Ingenieurbüro David Fischer AG, Switzerland All Rights Reserved Page 84 / 171
9.1.1.1 Response Time Overview Diagrams (Real-Time)
Description: displays during the load test (at real-time) a diagram per web page about the measured response times. Please consider that maybe only a fraction of the response times is shown, depending on the "Additional Sampling Rate per Page Call" which was selected when the load test was started. For example: only every fifth response time is shown if the "Additional Sampling Rate per Page Call" was set to 20%. Input Fields:
Response Time (drop-down list): Allows to select the period, from the current time back to the past, within the response times are shown in the diagrams.
Time Bars (drop-down list): Allows to select if the bars inside the diagrams are shown as average values or as max. values. Please note that there if only a difference between the max. values and the average values if multiple measured samples of the response time fall inside the same pixel (inside the same displayed bar):

Apica ProxySniffer V5.0 User’s Guide English Edition
© 2012, 2013 Ingenieurbüro David Fischer AG, Switzerland All Rights Reserved Page 85 / 171
The tables at the right side of the diagrams contain the response times for all URLs of the web page. Also these response times are either average values or max. values, depending on the selection in the Time Bars drop-down list. However these values are calculated since the load test was started, and always "accurately" measured which means that they do not depend on the value chosen for the "Additional Sampling Rate per Page Call".
You can click on a URL response time to show the corresponding URL Response Time Diagram (see chapter 9.1.1.2):
At the left side inside the diagram, the average response time of the web page is shown as red colored text, calculated since the load test was started. But depending on the selected period this value may not be displayed in every case. At the right side inside the diagram, the last measured value is shown:

Apica ProxySniffer V5.0 User’s Guide English Edition
© 2012, 2013 Ingenieurbüro David Fischer AG, Switzerland All Rights Reserved Page 86 / 171
9.1.1.2 URL Response Time Diagram (Real-Time)
Description: displays during the load test (at real-time) the response times of a URL, and also a summary diagram about the measured errors of the URL. Please consider that maybe only a fraction of the response times is shown, depending on the "Additional Sampling Rate per URL Call" which was selected when the load test was started. For example: only every fifth response time is shown if the "Additional Sampling Rate per URL Call" was set to 20%. Input Fields:
Response Time (drop-down list): Allows to select the period, from the current time back to the past, within the response times are shown inside the diagram.
Time Bars (drop-down list): Allows to select if the bars inside the diagram are shown as average values or as max. values. Please note that there if only a difference
between the max. values and the average values if multiple measured samples of the response time fall inside the same pixel (inside the same displayed bar).

Apica ProxySniffer V5.0 User’s Guide English Edition
© 2012, 2013 Ingenieurbüro David Fischer AG, Switzerland All Rights Reserved Page 87 / 171
Info Box / Measured Values: All values in this info box are calculated overall successful completed calls of the URL, measured since the load test was started. These values are always "accurately" measured which means that they do not depend on the value chosen for the "Additional Sampling Rate per URL Call".
Total Passed URL Calls: total number of passed calls for this URL.
Total Failed URL Calls: total number of failed calls for this URL.
Average Size (Req. + Resp.): the average size of the transmitted + received data per URL call.
Max. Response Time: the maximum response time ever measured
Min. Response Time: the minimum response time ever measured
Av. TCP Socket Connect Time: the average time to open a new network connection to the web server, measured for this URL. "---" instead of a value means that never a new network connection was opened for this URL because HTTP Keep-Alive (re-using of cached network connections) was always successful. The additional percentage value shown in brackets at the left hand displays the percentage about how often a new network connection was opened to the web server, in comparison to how often this was not necessary. This percentage value is also called the "reverse keep-alive efficiency".
Av. Request Transmit Time: the average time to transmit the HTTP request header + (optionally) the HTTP request content data (form data or file upload data) to the web server, measured after the network connection was already established.
Av. Response Header Wait Time: the average time for waiting for the first byte of the web server response (-header), measured since the request has (completely) transmitted to the web server.
Av. Response Header Receive Time: the average time for receiving the remaining data of the HTTP response header, measured since the first byte of the response header was received.
Av. Response Content Receive Time: the average time for receiving the response content data, for example HTML data or the data of a GIF image.
Average Response Time: the average response time for this URL. This value is calculated as: ((reverse keep-alive efficiency / 100) * Av. TCP Socket Connect Time) + Av. Request Transmit Time + Av. Response Header Wait Time + Av. Response Header Receive Time + Av. Response Content Receive Time + Av. Response Content Receive Time.
URL Errors / Real-Time Profile of Error Types: This diagram shows an overview about what kind of errors did occur for the URL at which time, measured since the load test was started. This "basic error information" is always "accurately" measured independently of the value chosen for the "Additional Sampling Rate per URL Call" - and captured in every case, also if no more memory is left to store full error snapshots.

Apica ProxySniffer V5.0 User’s Guide English Edition
© 2012, 2013 Ingenieurbüro David Fischer AG, Switzerland All Rights Reserved Page 88 / 171
9.1.1.3 Error Overview Diagrams (Real-Time)
Description: displays during the load test (at real-time) an overview about all occurred errors. Failure Diagrams: The first diagram shows an overview about what kind of errors did occur at which time, counted overall URLs and measured since the load test was started. This "basic error information" is always captured in every case, also if no more memory is left to store full error snapshots.
The succeeding diagrams which are shown per web page provide only information at which time errors did occur. The tables at the right side of the diagrams are showing the number of errors which did occur on the URLs of the web page. You can click on a error counter to show the error detail information (error snapshots) for the corresponding URL:
First Error Snapshots: Displays a list about errors which did occur at first (at the start of the load test). By clicking on a magnifier icon the corresponding error detail information (error snapshot) is shown.

Apica ProxySniffer V5.0 User’s Guide English Edition
© 2012, 2013 Ingenieurbüro David Fischer AG, Switzerland All Rights Reserved Page 89 / 171
Latest Error Snapshots: Displays a list about the latest (newest) errors. By clicking on a magnifier icon the corresponding error detail information (error snapshot) is shown:
Input Fields:
All failed URL Calls: effects that all errors about failed URL calls are shown (non-fatal and fatal errors).
Session Failures only: effects that only fatal errors about failed URL calls are shown (session failures).
Error Snapshot Memory: % used + By clicking on the + (plus sign), you can increase the amount of memory available to store error snapshots. Please note: when the memory is already 50% or more used, no additional error snapshots for non-fatal errors are captured. This means that increasing the memory may also re-enable capturing for non-fatal errors:

Apica ProxySniffer V5.0 User’s Guide English Edition
© 2012, 2013 Ingenieurbüro David Fischer AG, Switzerland All Rights Reserved Page 90 / 171
9.1.1.4 Statistical Overview Diagrams (Real-Time)
Description: displays statistical overview diagrams (at real-time) about a load test job. Note: the values shown in the diagrams are captured at regular intervals, depending on the "Statistic Sampling Interval" which was selected when the load test was started. Diagrams:
Concurrent Users: The total number of simulated users.
Users Waiting For Response: The number of users which are waiting for response from the web server.
Session Failures: The number of failed sessions - which is the same as the number of fatal errors.
Session Time per User - per Loop: The session time for one loop per simulated user. This value is the sum of "the response time of all URLs and all user's think times" per successful completed loop.
Web Transaction Rate: The number of (successful) completed URL calls per second, measured overall simulated users.
Completed Loops per Minute: The number of (successful) completed loops (sessions) per minute, measured overall simulated users.
TCP Socket Connect Time: The time in milliseconds (per URL call) to open a new network connection to the web server.
Network Throughput: The total network traffic which is generated by this load test job, measured in megabits per second.

Apica ProxySniffer V5.0 User’s Guide English Edition
© 2012, 2013 Ingenieurbüro David Fischer AG, Switzerland All Rights Reserved Page 91 / 171
9.1.1.5 Real-Time Comments
Description: supports to enter comments during the load test execution. Real-time comments are notes or hints, which you can enter during the load test execution:
These comments are later displayed inside all time-based diagrams of the load test result detail menu (see chapter 10.1):

Apica ProxySniffer V5.0 User’s Guide English Edition
© 2012, 2013 Ingenieurbüro David Fischer AG, Switzerland All Rights Reserved Page 92 / 171
You can also modify, delete or add real-time comments before you generate the PDF report. However, all retroactively entered real-time comments are not permanently stored inside the result data.

Apica ProxySniffer V5.0 User’s Guide English Edition
© 2012, 2013 Ingenieurbüro David Fischer AG, Switzerland All Rights Reserved Page 93 / 171
9.1.2 Loading the Statistics File
After the load test job has completed, the statistic results file is stored in the job directory of the local or remote Exec Agent. In order to access this results file, you must transfer it back to the (local) Project Navigator directory from which the load test program was started.
This menu shows all files of the load test job; however, only the statistics results file is usually needed, and this is already selected. The "*.out" file contains debug information, and the "*.err" file is either empty, or contains internal error messages from the load test program itself. By clicking on the Acquire Selected Files button, all selected files are transferred (back) to the (local) Project Navigator directory. If the checkbox Load *.prxres File on Analyse Load Test Menu is selected, the statistics results file is also loaded into the memory area of the Analyse Load Tests menu where the statistics and diagrams of the measured data can be shown, analyzed, and compared with results of previous test runs.

Apica ProxySniffer V5.0 User’s Guide English Edition
© 2012, 2013 Ingenieurbüro David Fischer AG, Switzerland All Rights Reserved Page 94 / 171
9.2 Starting Cluster Jobs
If you have specified that the load test program be executed by an Exec Agent Cluster (see Chapter 11.2), the load test program is transmitted to the local cluster job controller which coordinates all cluster members (Exec Agents). The cluster job controller creates a cluster job, and allocates a cluster job number. The cluster job is now in the state “configured” (ready to run, but not yet started).
The number of concurrent users will be automatically distributed across the cluster members, depending on the capability of the individual computer systems – called "load factor". In cases where the load test program uses Input Files, you are asked - for each Input File - if you wish to split the content of the Input File. This can be useful, for example, if the Input File contains user accounts (usernames/passwords) but the web application does not allow duplicate logins. In this case, each cluster member must use different user accounts. By clicking on the corresponding magnifier icon, you can view how the Input File data would be distributed across the cluster members. If you do not use the split functionality, each cluster member would receive an entire copy of the Input File. The distribution of users across the cluster members can also be modified manually; however, this is useful only if a cluster member is currently not available (marked with light red background), in which case the cluster job can not be started. In this case, you can assign the users of the unavailable cluster member to other cluster members, and then try to start the cluster job again. This redistribution may take a few seconds to complete.
Alternatively, the load test program can also scheduled to be executed at a predefined time. However, the local Job Controller process must be available (running) at the predefined time, because the scheduling entry for the cluster job is stored inside the Job Controller working directory which is monitored by the Job Controller itself. Especially, if you have started the Job Controller implicitly by using the Proxy Sniffer Console you must keep the Proxy Sniffer Console Window open in order that the cluster job will be started ¹. ¹ This restriction can be avoided by installing the local Job Controller as a Windows Service or as a Unix Daemon (see Application Reference Manual). After the cluster job has been scheduled you can leave this menu by closing the window and you can use later the Jobs menu to cancel or modify the schedule of this job.

Apica ProxySniffer V5.0 User’s Guide English Edition
© 2012, 2013 Ingenieurbüro David Fischer AG, Switzerland All Rights Reserved Page 95 / 171
9.2.1 Real-Time Cluster Job Statistics
The real-time statistics of a cluster job show the most important measured values, similar to the values which are shown in the Real Time Statistic of Exec Agent Jobs (see chapter 9.1.1 for a detailed description) . The cluster job itself contains Exec Agent jobs which have been created by the local cluster job controller. By clicking on the magnifier icon of a cluster member, the real-time statistics of the corresponding Exec Agent job can be displayed in its own window.
If you want to abort the cluster job, you must do it at this level, as this will also abort all Exec Agent jobs. Aborting a single Exec Agent job will not interrupt the cluster job. The same applies to the statistics result file (*.prxres), which must be accessed at this level.

Apica ProxySniffer V5.0 User’s Guide English Edition
© 2012, 2013 Ingenieurbüro David Fischer AG, Switzerland All Rights Reserved Page 96 / 171
9.2.2 Loading the Statistics File of Cluster Jobs
The statistics result file of a cluster job contains the consolidated (merged) measurements for all cluster members. The calculations for merging the results are extensive; therefore, it may take up to 60 seconds for the result file to be shown. The individual measurements of the Exec Agents are embedded separately inside the same consolidated result file.
The consolidated statistics result file is marked with a blue background and is already selected for you. By clicking on the magnifier icon, you have access to the "*.out" and "*.err" files of the corresponding Exec Agent jobs.
Usually, you would work inside the Analyse Load Tests menu with the consolidated measurement results only. However, it is also possible to expand the measurement results to access the results of each individual Exec Agent job:

Apica ProxySniffer V5.0 User’s Guide English Edition
© 2012, 2013 Ingenieurbüro David Fischer AG, Switzerland All Rights Reserved Page 97 / 171
This feature can be used to check if all cluster members have measured approximately the same response times; however, variations in a range of ± 20% or more may be normal:

Apica ProxySniffer V5.0 User’s Guide English Edition
© 2012, 2013 Ingenieurbüro David Fischer AG, Switzerland All Rights Reserved Page 98 / 171
9.3 Jobs Menu
All load test programs which are started from the Project Navigator are always executed as "batch jobs" by an (external) Exec Agent process or by an Exec Agent Cluster. This means, that it is not required to wait for the completion of a load test program on the “Execute Load Test” window: you can close the "Execute Load Test" window at any time and you can check later the result, or the actual effort, of all load test jobs by using this menu.
If a load test job has completed you are disposed to acquire the corresponding statistic result file (*.prxres). If a load test job is still running you are disposed to the temporary live-statistic window of the job.
Input Fields:
Display Cluster Jobs: shows all Exec Agent Cluster jobs.
Display Exec Agent Jobs of: allows to select the Exec Agent from which a list of all load test jobs is displayed.
Clean Up: Delete All Non-Running Jobs: deletes all jobs except running and scheduled jobs. Note: all jobs can be deleted after they have been acquired - the test results will not be lost because the load test result data (*.prxres file) are transferred into the corresponding Project Navigator directory from which the load test has been started. We recommend that you delete all old jobs at regular intervals.
Clean Up: Delete Old Completed Jobs: deletes all completed jobs except the newest one. This button is only shown if at minimum two jobs have been completed.

Apica ProxySniffer V5.0 User’s Guide English Edition
© 2012, 2013 Ingenieurbüro David Fischer AG, Switzerland All Rights Reserved Page 99 / 171
Columns of the job list:
Job Each job has its unique ID which was automatically assigned when the job was defined. However the ID is only unique per Exec Agent. Cluster jobs have an own, separate ID (own enumeration counter).
Allows to acquire the statistic result file (*.prxres) of an already completed load test job - or reconnects to the temporary statistic of the load test job if the job is still running – or allows to cancel the schedule of the job.
Deletes all data (-files) of a completed load test job. Take into consideration that you must first acquire the statistic result file (*.prxres) of the job before you delete all files of a job - otherwise the result data of the job are lost.
Date Displays the date and time when the job has been defined or when the job has been completed, or - for scheduled jobs - the planned point in time when the job will be started.
State Displays the current job state: configured (ready to run), scheduled, running or completed. The state "???" means that the job data are corrupted - you should delete all jobs which have the state "???" because they delay the display of all jobs in this list.
Load Test Program & Arguments Displays the name of the load test program and the arguments of the load test program (see next subchapter)
Released from GUI (IP) Displays the TCP/IP address (remote computer) from which the job has been initiated.
9.3.1 Load Test Program Arguments
Argument / Parameter Meaning
-u <number> Number of concurrent users
-d <seconds> Planned test duration in seconds. 0 = unlimited
-t <seconds> Request timeout per URL call in seconds
-sdelay <milliseconds> Startup delay between creating concurrent users in milliseconds
-maxloops <number> Max. number of loops (repetitions of web surfing session) per user. 0 = unlimited
-downlink <Kbps> Network bandwidth limitation per concurrent user in kilobits per second for the downlink (web server to web browser)
-uplink <Kbps> Network bandwidth limitation per concurrent user in kilobits per second for the uplink (web browser to web server)
-sampling <seconds> Statistic sampling interval in seconds (interval-based sampling). Used for time-based overall diagrams like for example the measured network throughput
-percpage <percent> Additional sampling rate in percent for response times of web pages (event based sampling, each time when a web page is

Apica ProxySniffer V5.0 User’s Guide English Edition
© 2012, 2013 Ingenieurbüro David Fischer AG, Switzerland All Rights Reserved Page 100 / 171
called)
-percurl <percent> Additional sampling rate in percent for response times of URL calls (event based sampling, each time when a URL is called)
-maxerrsnap <number> Max. number of error snapshots per URL (per Exec Agent), 0 = unlimited
-maxerrmem <megabytes> Max. memory in megabytes which can be used to store error snapshots, -1 = unlimited
-nolog Additional (separate) log file disabled
-dl Debug loops
-dh Debug headers & loops
-dc Debug content & loops
-dC Debug cookies & loops
-dK Debug keep-alive for re-used network connections & loops
-dssl Debug information about the SSL protocol and the SSL handshake & loops
-multihomed Forces the Exec Agent(s) to use multiple client IP addresses
-ssl <version> Use fixed SSL protocol version: "v2", "v3" or "TLS"
-sslcache <seconds> Timeout of SSL cache in seconds. 0 = cache disabled
-tz <value> Time zone (see Application Reference Manual)
-annotation <text> Comment about the test-run

Apica ProxySniffer V5.0 User’s Guide English Edition
© 2012, 2013 Ingenieurbüro David Fischer AG, Switzerland All Rights Reserved Page 101 / 171
9.4 Scripting Load Test Jobs
Several load test jobs can be started from the GUI at the same time. However, the GUI does not have the ability to automatically run sequences of load test jobs, synchronize load test jobs, or automatically start several jobs, with a single mouse click. To perform these kinds of activities, you must program load test job scripts which are written in the “natural” scripting language of your operating system (Windows: *.bat files, Unix: *.sh, *.ksh, *.csh … files). Inside these scripts, the PrxJob utility is used as the interface to the Proxy Sniffer system. When the Windows version of Proxy Sniffer is installed, the installation kit creates the directory ScriptExamples within the Project Navigator, and this directory contains some example scripts. The PrxJob utility allows you to start load test jobs on the local as well as on a remote system. It also provides the capability to create cluster jobs, to synchronize jobs, to obtain the current state of jobs, and to acquire the statistics result files of jobs. More information about the PrxJob utility can be found in the Application Reference Manual, Chapter 4.
9.5 Rerun of Load Tests Jobs (Job Templates)
Every time when a load test is started, an additional job definition template file is stored in the actual Project Navigator directory (in XML format). Such a job definition template file contain all configuration date which are needed to rerun the same load test job again. If you click on the corresponding icon of a job definition template file in Project Navigator, the load test job inclusive all of its input parameter is automatically transferred to the Exec Agent or to the Exec Agent Cluster and immediately ready-to-run.
Rerun the same load test
Start load test as usual – with configuring the job input parameters
Edit the template Rename or copy the template

Apica ProxySniffer V5.0 User’s Guide English Edition
© 2012, 2013 Ingenieurbüro David Fischer AG, Switzerland All Rights Reserved Page 102 / 171
Additionally, if you wish to trigger several load test jobs at the same time to be ready-to-run (by using only one mouse click), you can zip several templates to one zip archive. After this click on the corresponding icon of the zip archive:
XML Load Test Template Attributes:
Attribute Name Description
loadTestProgramPath Absolute file path to compiled load test program (*.class) or load test program ZIP archive
startFromExecAgentName Name of the Exec Agent on which the load test is started (empty value if cluster job)
startFromClusterName Name of the Exec Agent Cluster on which the load test is started (empty value if no cluster job)
concurrentUsers Number of concurrent users
testDuration Planned test duration in seconds (0 = unlimited)
loopsPerUser Number of planned loops per user (0 = unlimited)
startupDelayPerUser Startup delay per user in milliseconds
downlinkBandwidth Downlink bandwidth per user in kilobits per second (0 = unlimited)
uplinkBandwidth Uplink bandwidth per user in kilobits per second (0 = unlimited)
requestTimeout Request timeout per URL call in seconds
maxErrorSnapshots Limits the number of error snapshots taken during load test execution (0 = unlimited). Negative value:

Apica ProxySniffer V5.0 User’s Guide English Edition
© 2012, 2013 Ingenieurbüro David Fischer AG, Switzerland All Rights Reserved Page 103 / 171
maximum memory in megabytes used to store all error snapshots, counted overall Exec Agents (recommended). Positive value: maximum number of error snapshots per URL, per Exec Agent (not recommended).
statisticSamplingInterval Statistic sampling interval in seconds
percentilePageSamplingPercent Additional sampling rate per Web page in percent (0..100)
percentileUrlSamplingPercent Additional sampling rate per URL call in percent (0..100)
percentileUrlSamplingPercentAddOption Additional URL sampling options per executed URL call (numeric value): 0: no options 1: all URL performance details (network connect time, request transmit time, …) 2: request header 3: request content (form data) 4: request header & request content 5: response header 6: response header & response content 7: all – but without response content 8: all – full URL snapshot
debugOptions Debug options: (string value) “-dl”: debug loops (including var handler) “-dh”: debug headers & loops “-dc”: debug content & loops “-dC”: debug cookies & loops “-dK”: debug keep-alive & loops “-dssl”: debug SSL handshake & loops
additionalOptions Additional options (string)
sslOptions SSL/HTTPS options: (string value) “all”: automatic SSL protocol detection (TLS preferred) “tls”: SSL protocol fixed to TLS “v3”: SSL protocol fixed to v3 “v2”: SSL protocol fixed to V2
testRunAnnotation Annotation for this test-run (string)
userInputFields Label, variable name and default value of User Input Fields

Apica ProxySniffer V5.0 User’s Guide English Edition
© 2012, 2013 Ingenieurbüro David Fischer AG, Switzerland All Rights Reserved Page 104 / 171
9.6 Project Navigator
The Project Navigator Menu, or "Project Navigator“, offers additional useful functions aside from starting and managing load test programs. These additional functions are briefly described in this chapter.
First, it is recommended that a simple directory structure be defined, one that is relevant to your projects. It is also often useful for individual application releases, or even daily test programs, to be assigned their own sub-directories. To create a new sub-directory, select an existing directory (at left), and then click on the "Create Directory" icon. Note: new directories can also be created via the Operating System; for example, via File Explorer under Windows, or by using a console. The Project Navigator menu has been designed to ensure that no discrepancies exist between the menu and the Operating System view. After the creation of a new sub-directory, an existing load test program, including its recorded web surfing session and Input Files, can be copied by marking the corresponding checkboxes and then clicking on the "Copy Selected Files" icon. The new sub-directory can then be selected with a single click at the left side in the Project Navigator.

Apica ProxySniffer V5.0 User’s Guide English Edition
© 2012, 2013 Ingenieurbüro David Fischer AG, Switzerland All Rights Reserved Page 105 / 171
Individual Java load test programs can also be renamed, or copied to a new name. This can only be done using the Project Navigator; that is, it cannot be done using the Operating System. This is because the Java program contains references in the source code to its own name. The Project Navigator handles this requirement, and will automatically make the appropriate adjustments when copying or renaming a Java load test program. Note: compiled Java programs (*.class files) can never be renamed, only source files (*.java) can be renamed. Note also that the Project Navigator will require confirmation when overwriting or deleting files using a red-shaded status row. Whenever a red-shaded status row appears, you should review the action before approving it. An example is given at left for deleting files. Clicking on the Icon in the Project Navigator will provide a preview of the measurements in the statistics files, including the description associated with the corresponding test run. The description of the recorded web surfing sessions and the load test programs will also be displayed, if available. This feature allow you to quickly compare statistics files of different load tests, especially when the same load test program was executed several times with the same number of concurrent users.

Apica ProxySniffer V5.0 User’s Guide English Edition
© 2012, 2013 Ingenieurbüro David Fischer AG, Switzerland All Rights Reserved Page 106 / 171
9.6.1 Configuration of the Project Navigator Main Directory
Proxy Sniffer can be configured to have its Project Navigator Main Directory on a shared disk or a shared directory, given all members of a team the same view of the data. On Windows, a directory "Share" must already exist. On Unix systems, the shared directory must be already mounted using NFS or mounted via Samba. Proceed as follows:
Windows systems: the Proxy Sniffer mytests.dat configuration file must be edited using a text editor such as Notepad. The entry in this file must point to the directory share. This directory shared must be created using Windows before the Proxy Sniffer configuration file is edited. The mytests.dat is located in the Proxy Sniffer installation directory.
Unix systems: on Unix systems, the mytests.dat configuration file must be manually created in the Proxy Sniffer installation directory using a text editor such as vi, The only entry in this file should be the path to the new main directory. Note: on Unix systems which have only an Exec Agent started, this file is not necessary.
After setting the new Project Navigator main directory, the Proxy Sniffer application must be closed. In addition, all cookies in your Web Browser must be deleted because the old main directory is also stored in a browser cookie. After that Proxy Sniffer can then be re-started, and the new main directory will be active. Further information about Proxy Sniffer configuration files can be found in the "Application Reference Manual", Chapter 7.

Apica ProxySniffer V5.0 User’s Guide English Edition
© 2012, 2013 Ingenieurbüro David Fischer AG, Switzerland All Rights Reserved Page 107 / 171
9.7 More Hints for Executing Load Tests
Please note that the underlying operating system of a single Exec Agent (load injector) can be overloaded if too many concurrent (virtual) users are executed there. In most cases where a system is overloaded, the CPU(s) of the Exec Agent will be constantly at nearly 100% used. In these cases, the measured response times will not be valid because the measuring system itself is overloaded. We recommend that you monitor the CPU consumption of the Exec Agent during the load test, and that you use an Exec Agent Cluster (Chapter 11.2), instead of a single Exec Agent, when a single system does not have the necessary CPU resources to properly generate the load. The CPU consumption of the load-releasing system depends on the number of users (more users = more CPU), the user’s think time (longer think time = less CPU), the response times of the stressed web server (longer response times = less CPU), and whether the HTTP or the HTTPS protocol is used (HTTPS = more CPU). We are therefore not able to give you a general hint as to how many users can be emulated by a single load-releasing system; you will have to experiment. We recommend that you first run a load test with only a few users, and then estimate how much CPU power in total will be necessary to generate the required load. After that, you can decide if an Exec Agent Cluster should be used, and how may systems need to be part of this cluster. Furthermore we recommend that you tune the TCP/IP parameters of load releasing systems – see Application Reference Manual, chapter 5.

Apica ProxySniffer V5.0 User’s Guide English Edition
© 2012, 2013 Ingenieurbüro David Fischer AG, Switzerland All Rights Reserved Page 108 / 171
10 Analyzing Measurement Results
Measurement results can be analyzed using the Analyse Load Tests menu, into which the statistics result files can be loaded. Loading result files occurs either implicitly during the acquisition of the job statistics result file (this file is also stored inside the Project Navigator directory), or explicitly by
clicking on the corresponding icon of a statistics result file within the Project Navigator. The loaded data inside the Analyse Load Tests menu are stored inside a volatile memory cache; therefore, if you delete some results here, they will only be removed from the memory cache, but the corresponding files inside the Project Navigator will not be deleted. You can also invoke this menu from the main menu, and from the Project Navigator, without loading result files.
Load Test: name of the load test program
Start Date: date and time the test-run was started
User: number of simulated users
Test Duration: duration of the rest-run
Web.Trans..: number of successfully executed URL calls per second (hits per second); that is, the web server throughput
Sess. Failures: percentage of failed loops
URL Error Rate: percentage of failed URL calls
Net. Throughput: average network throughput during the test run
Annotation: comment which was entered when starting the test run
Load Curves Diagrams – And comparisons between several test runs
Detail results of a single test run

Apica ProxySniffer V5.0 User’s Guide English Edition
© 2012, 2013 Ingenieurbüro David Fischer AG, Switzerland All Rights Reserved Page 109 / 171
10.1 Detail Results
Many different detail results can be displayed about a single test run:
At the right upper corner, inside the title of the window, is the Report icon which allows you to generate a PDF report.
General data about the test run are shown in a yellow bar.
Further general data are described below:
Advanced Test Parameter: An extract of the most important test input parameters
Measured Results per Single User – per Loop:
- AV Session Time per Loop: average time of a single loop – per user (repetition of a web surfing session)
- AV Response Time per Page: average response time per web page (calculated over all web pages and users)
- Network Throughput per User: average network throughput per user
Overall Test Results:
- Web Transaction Rate: number of successfully executed URL calls per second (hits per second), measured over all users, as an average over the entire test duration. This value reflects the throughput of the web server
- Session Failure Rate: percentage of failed loops (error rate), measured over all users. By clicking on the percentage value (if not zero) the error snapshots can be displayed (see Chapter 10.2)
- Total Network Throughput: average network throughput during the test run
If you have loaded several test results, you can use the arrows in the “Test Result” selection box to switch between them.
Further details of the test run can be accessed by clicking on a title within the red-framed range. These measurement details are briefly explained in the following subchapters.

Apica ProxySniffer V5.0 User’s Guide English Edition
© 2012, 2013 Ingenieurbüro David Fischer AG, Switzerland All Rights Reserved Page 110 / 171
10.1.1 Test Scenario
Displays the test environment, test input parameters, and a summary of the executed web surfing session.
You can also modify, delete or add real-time comments as well as add or modify the annotation of the test-run – before you generate the PDF report. However, all retroactively entered real-time comments are not permanently stored inside the result data.

Apica ProxySniffer V5.0 User’s Guide English Edition
© 2012, 2013 Ingenieurbüro David Fischer AG, Switzerland All Rights Reserved Page 111 / 171
10.1.2 Diagram: Response Time per Page
Displays bar chart diagrams about the average response times and the 90% percentile value of the web pages. Displays also diagrams about the response time progression of the web pages.

Apica ProxySniffer V5.0 User’s Guide English Edition
© 2012, 2013 Ingenieurbüro David Fischer AG, Switzerland All Rights Reserved Page 112 / 171
10.1.3 Results per URL Call (Overview)
Displays statistics about all URL calls.
Columns:
Test: consecutively numbered. Clicking on a number displays the URL detail menu
# Passed: total number of successful calls
# Failed: total number of failed calls. If this value is greater than zero, you can click on it to display the corresponding error snapshots (Chapter 10.2)
AV Time: average response time per URL call, or per web page
<= 90 %: slowest response time within the fastest 90% of all measured values (90% percentile value). This result is only available if the response time has been collected at least 5 times, depending on the percentile sampling rate which was selected when the test run was started. Clicking on this value displays the corresponding response time percentile diagram
AV Size: average size of transmitted and received data per URL call, or per web page
URL: the URL called

Apica ProxySniffer V5.0 User’s Guide English Edition
© 2012, 2013 Ingenieurbüro David Fischer AG, Switzerland All Rights Reserved Page 113 / 171
10.1.3.1 Response Content Throughput / In-Depth Measurement of HTTP(S) Response-Streams
The in-depth measurement of HTTP(S) response-streams is only available if you have to enable the additional option "Resp Throughput Chart per Call" as part of the "Additional sampling rate by URL call" when starting the load test. Furthermore you should configure a "maximum acceptable response time" in order that Proxy Sniffer can calculate and compare the necessary network throughput. This feature is especially useful for Web pages that contain videos and allows to detect if jerky video playback occurs during viewing of a video, respectively to diagnose if enough network bandwidth is available for all simulated users so that the video can be viewed by each user without interruption. However, this feature can also commonly used as a reference for the optimization of any response data. The corresponding charts are showing in different colors the times elapsed for receiving fragments of user data (in red color) and the times elapsed for receiving the overhead data of the chunked protocol (in blue color).

Apica ProxySniffer V5.0 User’s Guide English Edition
© 2012, 2013 Ingenieurbüro David Fischer AG, Switzerland All Rights Reserved Page 114 / 171
Measured internal throughput of a video on a preset viewing time of 3 minutes (180,000 milliseconds). The linear flow and the flow rate peak at the beginning of receiving the data indicates that the delivery is made by a special video server which prevents on the one hand network peaks and ensures on the other hand that no jerky video playback occurs.

Apica ProxySniffer V5.0 User’s Guide English Edition
© 2012, 2013 Ingenieurbüro David Fischer AG, Switzerland All Rights Reserved Page 115 / 171
Throughput measurement of a PDF document which should be received in 30 seconds by a linear network throughput, in order that the beginning of the document can already be viewed after some few seconds. The second measured sample does not meet this requirement.

Apica ProxySniffer V5.0 User’s Guide English Edition
© 2012, 2013 Ingenieurbüro David Fischer AG, Switzerland All Rights Reserved Page 116 / 171
Throughput measurement of a HTML response received from a web portal server. It is conspicuous that the most response time is spent in the chunked protocol overhead, but that the user data (payload) is received in a relatively short time. One explanation could be that the Web page is "calculated" piece by piece by the portal server (page navigation, page main content, page footer), and that some server internal delay times occurred during the calculations.

Apica ProxySniffer V5.0 User’s Guide English Edition
© 2012, 2013 Ingenieurbüro David Fischer AG, Switzerland All Rights Reserved Page 117 / 171
10.1.4 Results per URL Call (Details)
Displays measurement details about URL calls. If this menu is invoked from the URL overview menu by clicking on a test number, the selected URL call is marked with a blue background.
Columns:
Test: consecutively numbered. Clicking on a number displays the URL overview menu
Av Net Con: average time per URL call required to open a network connection to the web server, before HTTP data are send (socket open time). If the HTTP protocol option keep alive is supported by the web server, this time is only measured for some URL calls - and not on all - because the network connections have been reused
Av Req Trm: average time per URL call to transmit the HTTP request data to the web server, measured after the network connection has been opened to the web server
Av Wait: average time, per URL call, waiting for the first byte of the HTTP response (-header) from the web server, measured after the HTTP request data have been transmitted
Av Header Rcv: average time, per URL call, receiving the HTTP response header from the web server, measured after the first byte has been received
Av Content Rcv: average time, per URL call, receiving the HTTP response content from the web server (HTML data, images, etc.), measured after the HTTP response header has been received
Min Time: smallest-ever measured time of the URL call (request + response)
Av Time: average time of the URL call (request + response)
Max Time: highest-ever measured time of the URL call (request + response)
AV Size: average size of transmitted and received data per URL call, or per web page
Av Throughput: average network throughput per URL call (request + response)

Apica ProxySniffer V5.0 User’s Guide English Edition
© 2012, 2013 Ingenieurbüro David Fischer AG, Switzerland All Rights Reserved Page 118 / 171
10.1.5 Diagram: Response Time Percentiles
This screen contains, per web page and per URL, the response time percentile diagram. These diagrams display a cumulative statistical distribution of response times, but are only available if an Additional Sampling Rate per Page Call and/or an Additional Sampling Rate per URL Call option was set when starting the test run (Chapter 9), and at least 5 individual measurements have been collected during the test run.
By using the option lists, you can select the web page and - within the page - the URL. The option “---“ for a URL means that the percentile diagram for the web page is displayed (instead of a specific URL of the web page). “Cumulative statistical distribution” means that only the slowest URL call, within a percentage of all fastest URL calls, is flowing inside the curve. For example, 95% means that 95% of all URL calls have a response time faster than, or equal to, the shown value. The collected individual measurements can be displayed by clicking on the Apply button. It is also possible to export the individual measurements in the form of an HTML table.

Apica ProxySniffer V5.0 User’s Guide English Edition
© 2012, 2013 Ingenieurbüro David Fischer AG, Switzerland All Rights Reserved Page 119 / 171
10.1.6 Diagram: Top Time-Consuming URLs
Shows a compilation of the slowest URLs (average and 90% percentile response time values) and the response time distribution of the slowest URL per page (for each page), and the response time per media-type (text/html, image/gif …).

Apica ProxySniffer V5.0 User’s Guide English Edition
© 2012, 2013 Ingenieurbüro David Fischer AG, Switzerland All Rights Reserved Page 120 / 171
10.1.7 Diagram: Concurrent Users
Shows the number of users during the test run. The number of data points depends on the Statistic Sampling Interval which was set when the test run was started.

Apica ProxySniffer V5.0 User’s Guide English Edition
© 2012, 2013 Ingenieurbüro David Fischer AG, Switzerland All Rights Reserved Page 121 / 171
10.1.8 Diagram: Session Time
Shows the response time per successfully-executed loop (repetition of a web surfing session) during the test run. The number of data points depends on the Statistic Sampling Interval which was set when the test run was started.
The accumulated user’s think time of the loop is shown by a red line.
10.1.9 Diagram: Web Transaction Rate
Shows the number of successfully-executed URL calls per second (hits per second) during the test run, measured over all simulated users. The number of data points depends on the Statistic Sampling Interval which was set when the test run was started.

Apica ProxySniffer V5.0 User’s Guide English Edition
© 2012, 2013 Ingenieurbüro David Fischer AG, Switzerland All Rights Reserved Page 122 / 171
10.1.10 Diagram Users Waiting for Response
Shows the number of users which are waiting for response from the web server, measured over all simulated users. The number of data points depends on the Statistic Sampling Interval which was set when the test run was started.
10.1.11 Diagram: Completed Loops
Shows the number of successfully-completed web surfing sessions (loops) per minute - measured over all concurrent users. The number of data points depends on the Statistic Sampling Interval which was set when the test run was started.

Apica ProxySniffer V5.0 User’s Guide English Edition
© 2012, 2013 Ingenieurbüro David Fischer AG, Switzerland All Rights Reserved Page 123 / 171
10.1.12 Diagram: TCP Socket Connect Time
Shows the time to open a new network connection to the web server before data are sent (socket open time). The number of data points depends on the Statistic Sampling Interval which was set when the test run was started.
10.1.13 Diagram: Network Throughput
Shows the total network throughput of the test run, measured over all users. The number of data points depends on the Statistic Sampling Interval which was set when the test run was started.
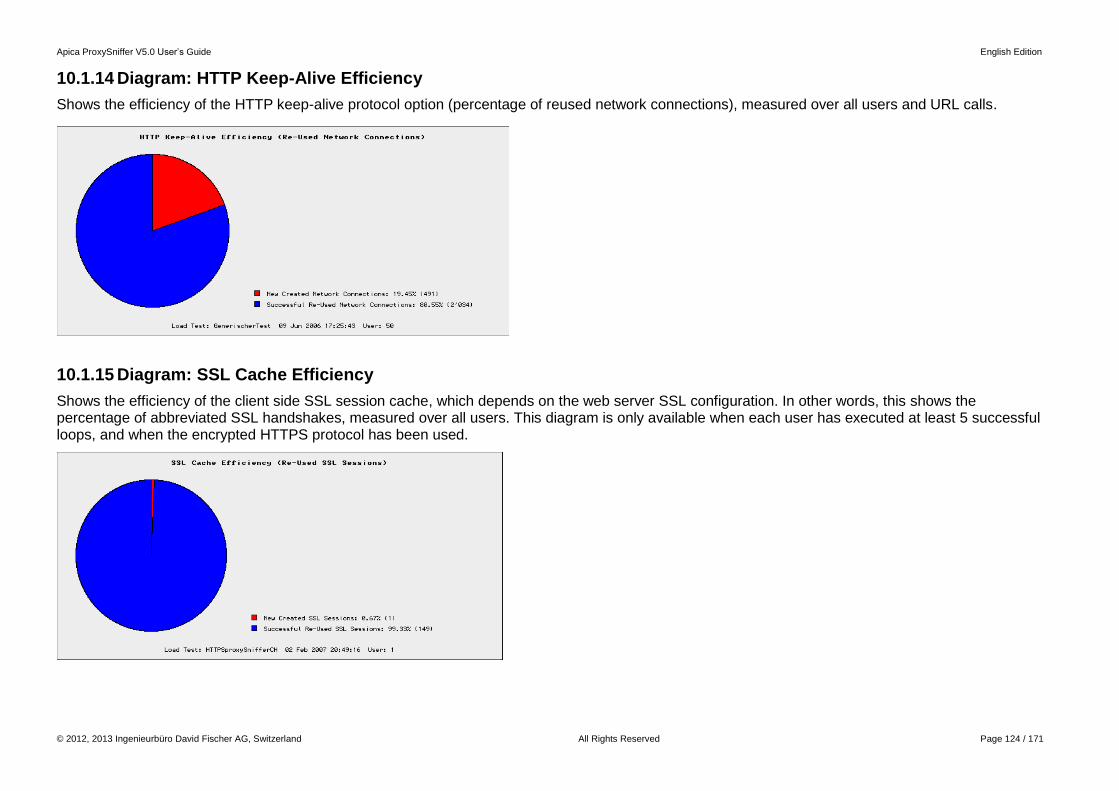
Apica ProxySniffer V5.0 User’s Guide English Edition
© 2012, 2013 Ingenieurbüro David Fischer AG, Switzerland All Rights Reserved Page 124 / 171
10.1.14 Diagram: HTTP Keep-Alive Efficiency
Shows the efficiency of the HTTP keep-alive protocol option (percentage of reused network connections), measured over all users and URL calls.
10.1.15 Diagram: SSL Cache Efficiency
Shows the efficiency of the client side SSL session cache, which depends on the web server SSL configuration. In other words, this shows the percentage of abbreviated SSL handshakes, measured over all users. This diagram is only available when each user has executed at least 5 successful loops, and when the encrypted HTTPS protocol has been used.

Apica ProxySniffer V5.0 User’s Guide English Edition
© 2012, 2013 Ingenieurbüro David Fischer AG, Switzerland All Rights Reserved Page 125 / 171
10.1.16 Diagram: Session Failures
Shows the number of failed web surfing session (failed loops) which occurred during the test run. The number of data points depends on the Statistic Sampling Interval which was set when the test run was started.

Apica ProxySniffer V5.0 User’s Guide English Edition
© 2012, 2013 Ingenieurbüro David Fischer AG, Switzerland All Rights Reserved Page 126 / 171
10.1.17 Diagram: Error Types
Shows a compilation of the most frequently-occurring error types. Note: this basic error information is accurately measured, also in case when not enough memory was left to capture error snapshots for all occurred errors.

Apica ProxySniffer V5.0 User’s Guide English Edition
© 2012, 2013 Ingenieurbüro David Fischer AG, Switzerland All Rights Reserved Page 127 / 171
10.1.18 Diagram: Number of Errors per Page
Shows a compilation of the web pages which experienced the most errors.
10.1.19 Diagram: Number of Errors per URL
Shows a compilation of the URLs which experienced the most errors.

Apica ProxySniffer V5.0 User’s Guide English Edition
© 2012, 2013 Ingenieurbüro David Fischer AG, Switzerland All Rights Reserved Page 128 / 171
10.2 Error Snapshots
If errors occurred during a load test, a "frozen" snapshot of the entire "error-situation" is taken for each error – as long as the number of maximum allowed error snapshots not exceeded. The maximum number of allowed error snapshots is set when the test run is started (test input parameter: Max. Error-Snapshots). An error snapshot contains the following data:
The date and time the error occurred.
The defective URL, including a reference to the web page.
The error type and the HTTP status code.
The internal execution step of the failed URL call, at the point in time when the error has occurred; for example, "open network connection" or "receive content".
All data about the failed URL call: HTTP request header, HTTP request content (only if transmitted), HTTP response header (only if received), HTTP response content (only if received).
The Error Log: The session log of the simulated user. This includes also actual information about the values of variables which have been defined by using the Var Handler.
A Thread Statistic at Error Time: a "system snapshot" of the activity of all (other) concurrent users. The upper part of the window contains a list of all error snapshots. The content of this list depends on the context from which the menu was invoked (error snapshots of the entire test run, per web page, or per URL). The list can be sorted by URL index or by error time. Clicking on a magnifier icon displays the detail data of the corresponding error snapshot in the lower part of the window. The title in the lower part of the window contains the URL index, a consecutive error number relative to the URL, and a short summary description of the error. Clicking on the Error Explanation displays a hint about why the error was occurred.

Apica ProxySniffer V5.0 User’s Guide English Edition
© 2012, 2013 Ingenieurbüro David Fischer AG, Switzerland All Rights Reserved Page 129 / 171

Apica ProxySniffer V5.0 User’s Guide English Edition
© 2012, 2013 Ingenieurbüro David Fischer AG, Switzerland All Rights Reserved Page 130 / 171
URL Exec Step: The URL Exec Step reflects the internal processing state of the URL call, captured at the point in time when the error has occurred. Possible states are:
Internal Processing State of URL Call Value Meaning
No Step / Not Initialized -1 The URL call had not yet started
Open Network Connection to Proxy 0 The URL call failed during the opening of a network connection to an outbound proxy server.
Open Network Connection 1 The URL call failed during the opening of a network connection to the web server.
Transmit HTTP Request 2 The URL call failed during the transmission of the HTTP request data.
Wait for Server Response 3 The URL call failed while waiting for the first byte of the HTTP response data from the web server.
Receive HTTP Header 4 The URL call failed while receiving the HTTP response header from the web server.
Receive Content 5 The URL call failed while receiving the HTTP response content from the web server (HTML data, images, ...)
Close Network Connection 6 The URL call failed while closing the network connection to the web server.
All Done 7 The URL call itself completed successfully (all data transmitted and received), but the received HTTP status code was incorrect, or the received MIME type (text/html, image/gif, ...) was incorrect, or an error was detected inside the received content data.
Enhanced HTTP Status Codes: In addition to the "normal" HTTP status codes (range from 100..599), the Proxy Sniffer load test program generates some additional HTTP status codes in error situations that are not directly related to the HTTP protocol. These additional HTTP status codes have negative values:
Enhanced HTTP Status Code Meaning
-98 An internal network error occurred at the client side (load test resource problem). There are commonly not enough free TCP client sockets available on the Exec Agent and you have to tune the system parameters of the operating system on which the Exec Agent runs.
-11 The network connection to an outbound SSL proxy server has failed.
-10 Unknown host. DNS problem or wrong hostname.
-9 Unable to open the network connection to the web server (connection refused).
-8 The web server has first accepted, but later closed/aborted the network connection - before all response data have been received (connection reset by peer).

Apica ProxySniffer V5.0 User’s Guide English Edition
© 2012, 2013 Ingenieurbüro David Fischer AG, Switzerland All Rights Reserved Page 131 / 171
-7 The web server response violates the HTTP protocol - invalid protocol data have been received.
-2 Request timeout expired - no response from web server. The URL call was aborted by the load test program.
-1 Generic request error.
If the HTTP response content was received in HTML format, the content of the defective web page can be displayed in the web browser (without images) by clicking on Display (Response) in Web Browser. This web page is taken directly from the data of the captured error snapshot; therefore, the defective web page can also be displayed even if the web server is no longer reachable.

Apica ProxySniffer V5.0 User’s Guide English Edition
© 2012, 2013 Ingenieurbüro David Fischer AG, Switzerland All Rights Reserved Page 132 / 171
Shown next is the debug output of the current loop (current web surfing session of simulated user). This also contains information about extracted and assigned session variables, based on the Var Handler definitions:
Finally, the activity of all users at the time of the error is shown. The URL in which the error occurred is marked with a pink background:

Apica ProxySniffer V5.0 User’s Guide English Edition
© 2012, 2013 Ingenieurbüro David Fischer AG, Switzerland All Rights Reserved Page 133 / 171
10.3 Load Curve Diagrams
To discover the maximum possible capability of the web server or web application, you must run the same load test program several times, each time with a different number of users. We recommend increasing the load in each successive test run logarithmically in order to get a good overview; for example, successive test runs with 1, 2, 5, 10, 20, 50, 100, 200, 500, 1000 .. users. The results of these test runs can be combined to produce load curves which will provide an excellent overview of the response time behavior, the throughput, and the stability of the web server or web application, and how they vary depending on the number of users.
With small loads, the response times are constant and are independent of the number of users. If the load is increased, and thereby the maximum throughput of the server is reached (measured in URL calls per second, which is the web transaction rate – or also called hits per second), the response times will rise in an at least linear relationship with the number of users. Web pages and/or URL calls, whose response times rise more strongly than others while under load, are potential tuning candidates; that is, the reason for the sudden, strong rise in their response times should be investigated. Please note that not all web servers or web applications show a linear response time behavior if they are overloaded. A web server may collapse in this situation; in this the case, the throughput falls after a specific load point has been exceeded.
Max. Server Capacity reached
Server-Sided Tuning recommended

Apica ProxySniffer V5.0 User’s Guide English Edition
© 2012, 2013 Ingenieurbüro David Fischer AG, Switzerland All Rights Reserved Page 134 / 171
To produce the load curves, you must select - from inside the Analyse Load Tests menu - several test runs which have been made with the same load Test program, but with a different number of users. Then choose the diagram type Load Curve, and click on the Compare button.

Apica ProxySniffer V5.0 User’s Guide English Edition
© 2012, 2013 Ingenieurbüro David Fischer AG, Switzerland All Rights Reserved Page 135 / 171
10.3.1 Overall Load Curves
In the right upper corner, inside the title of the window, you can generate a PDF report and you can also export the performance data. You can click within the diagrams on the red rhombuses to display the detailed results of the corresponding test run. 9 different diagrams are displayed:
- Average Session Time per User - per Loop: cumulative time for a loop per user; that is, response time behavior of the server
- Web Transaction Rate – Hits per Second: number of successfully-executed URL calls per second (hits per second); that is, server throughput
- Session Failure Rate: percentage of failed loops; that is, server stability
- Average TCP Socket Connect Time: average time per URL call to open a network connection; that is, network performance, in combination with the TCP/IP stack performance of the server
- Users Waiting for Response: average of the number of users which are waiting for response from the server.
- URL Error Rate: percentage of failed URL calls
- HTTP Keep-Alive Efficiency: percentage of reused network connections
- SSL Session Cache Efficiency: percentage of abbreviated SSL handshakes
- Completed Loops per Minute: the number of successful completed loops per minute (sessions per minute).
- Overall Network Throughput: total network throughput; that is, network load

Apica ProxySniffer V5.0 User’s Guide English Edition
© 2012, 2013 Ingenieurbüro David Fischer AG, Switzerland All Rights Reserved Page 136 / 171
10.3.2 Response Time per Page
This menu option displays the load curves of all web pages (average response times and 90% percentile value of the response times). Again, you can click within the diagrams on the red rhombuses to display the detailed results of the corresponding test run.

Apica ProxySniffer V5.0 User’s Guide English Edition
© 2012, 2013 Ingenieurbüro David Fischer AG, Switzerland All Rights Reserved Page 137 / 171
10.3.3 Response Time per URL
This menu option displays the load curves of all URL calls (average response times and 90% percentile value of the response times). Again, you can click within the diagrams on the red rhombuses to display the detailed results of the corresponding test run.

Apica ProxySniffer V5.0 User’s Guide English Edition
© 2012, 2013 Ingenieurbüro David Fischer AG, Switzerland All Rights Reserved Page 138 / 171
10.3.4 Session Failures
This menu option displays a summary about all errors which did occur in the test runs. By clicking on an error counter the detailed results of the corresponding test run is shown.

Apica ProxySniffer V5.0 User’s Guide English Edition
© 2012, 2013 Ingenieurbüro David Fischer AG, Switzerland All Rights Reserved Page 139 / 171
10.4 Comparison Diagrams
Comparison diagrams allow you to compare the response times of several test runs. This is commonly used to visualize tuning efforts; that is, "before and after" tuning of the web server. In contrast to load curve diagrams, these comparison of test runs can be made with the same number of users; however, this is not mandatory. You can compare any test runs as long as all test runs have used the same name for the web pages (same text for all page break comments).
10.4.1 Response Time
You can generate a PDF report in the upper right corner of the window. The diagram in the upper part of the window shows the response time comparison of all web pages. The diagram in the lower part of the window shows the response time comparison of the URLs within a particular web page; by default, the first web page. Clicking on the diagram bars in the upper diagram, displays a comparison of URL calls for any other web page. Clicking on a bar inside the lower diagram displays the detailed results for the corresponding test run.

Apica ProxySniffer V5.0 User’s Guide English Edition
© 2012, 2013 Ingenieurbüro David Fischer AG, Switzerland All Rights Reserved Page 140 / 171
10.4.2 Performance Overview
This menu option displays a summary about the performance data of the test runs. The following measured values are shown in the “Performance Overview” Table:
- Passed / Failed Loops: total number of passed / failed loops of the test run.
- Average Session Time per Loop: average time of a loop, calculated over all simulated users and loops.
- Average Response Time per Page: average response time per web page, calculated over all web pages.
- Web Transaction Rate (Hits per Second): number of successfully-executed URL calls per second.
- Average Outstanding Requests: average of outstanding HTTP/S Requests, executed at exactly the same point in time.
- Total HTTP/S Calls: sum of all by the test run executed HTTP/S calls
- HTTP Keep-Alive Efficiency: percentage of re-used network connections
- SSL Session Cache Efficiency: percentage of abbreviated SSL handshakes.
- Average TCP Socket Connect Time: average time per URL to open a new network connection to the web server.
- Average Network Throughput: average network traffic, released by the test run.
- Total Transmitted Bytes: total data volume which was transferred during the test run
10.4.3 Session Failures
This menu option displays the same data as described in chapter 10.3.4.

Apica ProxySniffer V5.0 User’s Guide English Edition
© 2012, 2013 Ingenieurbüro David Fischer AG, Switzerland All Rights Reserved Page 141 / 171
11 Distributed Load Tests – Architecture and Configuration
Load tests can also be transmitted and started on remote computers. Similarly, a “single” load test can be divided up and run on several computers, in which case the load-releasing computers are combined into a "virtual" application cluster. The configuration is very simple, and only requires that an Exec Agent process be installed on the involved load-releasing systems. This is implied in the case where the product has been installed and started on several computers, as each system already will contain an Exec Agent. Alternatively, individual Exec Agent processes can be installed separately as a Windows service and/or a Unix daemon (see the Application Reference Manual). The communication between the Web Admin GUI and the remote Exec Agent processes usually uses raw TCP/IP network connections to port 7993; however, this port number can be freely chosen if the Exec Agent process is installed separately. The communication can also be made over HTTP or HTTPS connections (tunneling), and also supports outbound HTTP/S proxy servers. The support of outbound HTTP/S proxy server means, in this case, that load tests can be started from a protected corporate network and then transmitted, over the proxy server of the corporation, to any load releasing system on the internet – all without the need for ordering new firewall rules. The computers of a load-releasing cluster (the cluster members) may also be heterogeneous; that is, Windows and Unix systems, as well as strong and weak systems, can be mixed within the same cluster. The individual cluster members can be placed in different locations, and can also use different protocols to communicate with the Web Admin GUI (or rather with the local cluster job controller).

Apica ProxySniffer V5.0 User’s Guide English Edition
© 2012, 2013 Ingenieurbüro David Fischer AG, Switzerland All Rights Reserved Page 142 / 171
11.1 Configuring Additional Load-Releasing Systems (Exec Agents)
Additional load-releasing systems can be added by using the Network menu, which can be invoked from the Project Navigator:
In the upper left part of the Window, a list of currently defined Exec Agents is shown. The Exec Agent configuration can be modified by clicking on the corresponding magnifier icon. In the lower part of the window, additional Exec Agents can be defined, and/or existing Exec Agents can be modified. You must click on the Refresh icon in the right upper corner of the windows to add several Exec Agents.
Input Fields:
- Description: arbitrary description of the Exec Agent
- Host: TCP/IP address or host name of the Exec Agent
- Port: TCP/IP port number, usually 7993
- Protocol: communication protocol
- Username / Password: allows you to restrict access to the Exec Agent by using a username and a password. This option can only be used with the HTTP or HTTPS communication protocols
- All further input fields are only used if the communication should be made over an outgoing proxy server.
You can test the configuration and the accessibility of an Exec Agent by clicking on the icon within the list of Exec Agents (functional “ping” of Exec Agent).

Apica ProxySniffer V5.0 User’s Guide English Edition
© 2012, 2013 Ingenieurbüro David Fischer AG, Switzerland All Rights Reserved Page 143 / 171
11.2 Configuring Load-Releasing Clusters
If several Exec Agents have been defined, they can be combined to form a load-releasing cluster. You can also define more than one cluster by using some of the same Exec Agents in several different clusters.
After an arbitrary name of the cluster has been entered, the cluster members (Exec Agents) can be added to the cluster by clicking on the blue arrows in the list of Available Exec Agents. By clicking on the magnifier icon of a cluster member, the Load Factor of this member can be modified. The load factor controls how many users will be assigned to this cluster member when the load test is distributed across the cluster members. The load factor by itself is an abstract value, meaning that the distribution of the users is made based on the ratio between the load factors. If you mix strong and weak systems within the same cluster, it is recommended that you give a higher load to the stronger systems than to the weaker systems. It is not necessary that all cluster members have the same operating system time. Each time a cluster job is started, the cluster job controller automatically measures the time differences between the cluster members. These measured time differences will be automatically accounted for when the consolidated statistics data are merged.
To get a suggestion for the load factor of a particular Exec Agent, you can click on the icon within the list of all defined Exec Agents. It is, however, recommended that you click several times on the icon in order to get a stable result. Even so, this result may not accurately reflect the power of the computer system.

Apica ProxySniffer V5.0 User’s Guide English Edition
© 2012, 2013 Ingenieurbüro David Fischer AG, Switzerland All Rights Reserved Page 144 / 171
11.3 Starting Distributed Load Tests
If additional Exec Agents and/or clusters have been defined, you can select - when starting the test run - from which system or cluster the load test is to be released (input field: Execute Test from). The succeeding steps inside the Web Admin GUI are then the same as for executing the load test locally.

Apica ProxySniffer V5.0 User’s Guide English Edition
© 2012, 2013 Ingenieurbüro David Fischer AG, Switzerland All Rights Reserved Page 145 / 171
12 Using Multiple Client IP Addresses per Load-Releasing System
Optionally, you may want an Exec Agent to use multiple client IP addresses during the load test in order to simulate users from different network locations. In the case where a load balancer is placed in front of a web server cluster or web server farm, the load balancer will often route all HTTP/S requests of one client IP address to only one member of the web server cluster. This is because web applications use session cookies, whose context information is only stored in the transient memory of a particular cluster member, and also because the server side SSL cache is usually handled by the cluster members and not by the load balancer. This load balancer functionality is called “IP stickiness”, which represents the recording of client IP addresses inside the load balancer algorithms. This term has nothing to do with the sticky bit of Unix file systems. If you encounter this situation the load will appear on only one web server, and will not be distributed across all web server cluster members. The solution to this load balancer behavior is to have the Exec Agent use multiple client IP addresses during the load test; therefore, each concurrent "user" will have its own IP address – or, if more concurrent users are running than available local IP addresses, the local IP addresses will be averaged across the concurrent users.
1. The first step to enable multiple IP addresses for an Exec Agent is to reconfigure the underlying Windows or Unix operating system, such that multiple local IP addresses are available. This can be done by assigning additional IP addresses to the same physical network interface.
2. The second step is to assign these multiple IP addresses to the Exec Agent configuration. For the local host where the Web Admin GUI is
running, the second step can be done by invoking the “Setup” menu inside the Project Navigator (gear-wheel icon in the top navigation). For remote Exec Agents, you must edit the file javaSetup.dat, located inside the Proxy Sniffer installation directory, and add the entry javaVirtualIpAddresses. Enter here all IP addresses on one line, separated by comma characters.
After these two steps have been completed, you can start the load test by using the additional option -multihomed, which initializes the Exec Agent to use multiple local IP addresses when executing a load test. This option is also supported by Exec Agent clusters (load injector clusters), in which case each load-releasing cluster member (Exec Agent) uses its own configuration of client IP addresses. Warning: please contact your network administrator to get additional (free) IP addresses. An incorrect configuration of additional IP addresses without consulting the network administrator may have an impact on several other computers of the same LAN, such that these other computers could lose their network connection due to IP address conflicts.

Apica ProxySniffer V5.0 User’s Guide English Edition
© 2012, 2013 Ingenieurbüro David Fischer AG, Switzerland All Rights Reserved Page 146 / 171
12.1.1 Step1: Configuring Multiple IP Addresses at the Operating System Level
12.1.1.1 Windows
12.1.1.2 Unix-like Systems
You can configure multiple virtual IP addresses for the same network interface by executing the ifconfig command. The specific arguments for the ifconfig command depend on the Unix variant and operating system version (Linux, Solaris, Mac OS X …). Please refer to your operating system manual to find out how to define virtual IP addresses on your system.
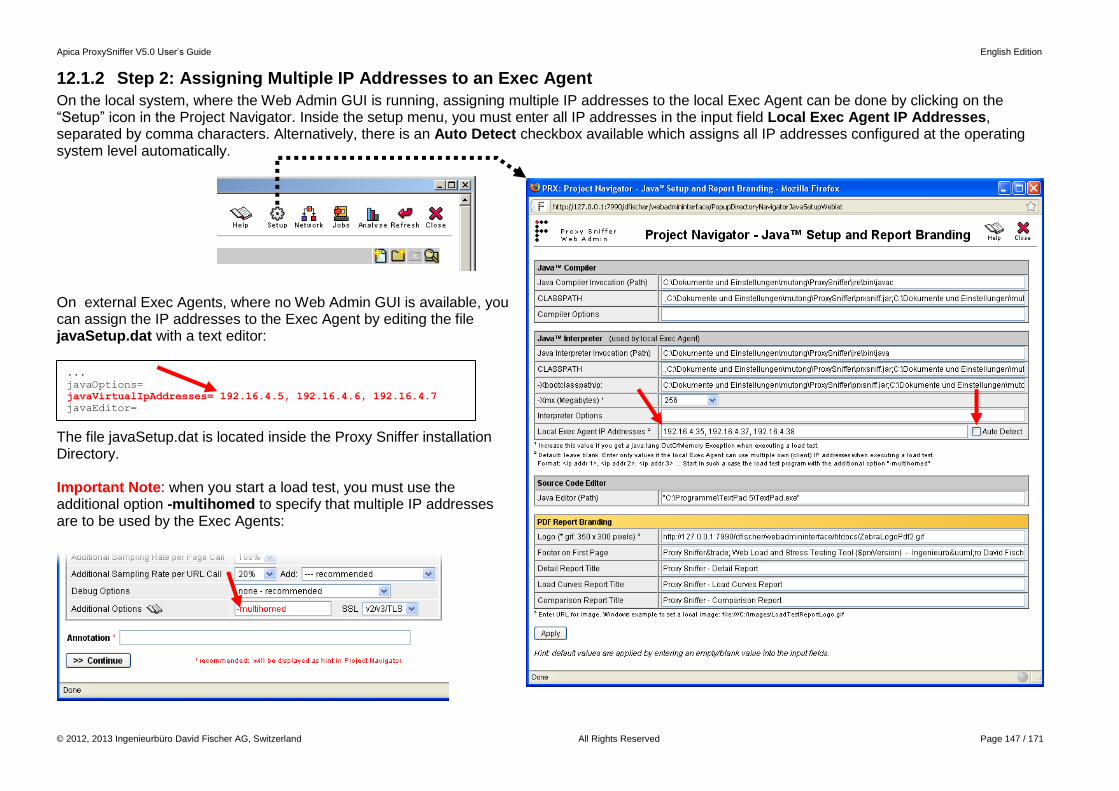
Apica ProxySniffer V5.0 User’s Guide English Edition
© 2012, 2013 Ingenieurbüro David Fischer AG, Switzerland All Rights Reserved Page 147 / 171
12.1.2 Step 2: Assigning Multiple IP Addresses to an Exec Agent
On the local system, where the Web Admin GUI is running, assigning multiple IP addresses to the local Exec Agent can be done by clicking on the “Setup” icon in the Project Navigator. Inside the setup menu, you must enter all IP addresses in the input field Local Exec Agent IP Addresses, separated by comma characters. Alternatively, there is an Auto Detect checkbox available which assigns all IP addresses configured at the operating system level automatically. On external Exec Agents, where no Web Admin GUI is available, you can assign the IP addresses to the Exec Agent by editing the file javaSetup.dat with a text editor: The file javaSetup.dat is located inside the Proxy Sniffer installation Directory. Important Note: when you start a load test, you must use the additional option -multihomed to specify that multiple IP addresses are to be used by the Exec Agents:
...
javaOptions=
javaVirtualIpAddresses= 192.16.4.5, 192.16.4.6, 192.16.4.7
javaEditor=

Apica ProxySniffer V5.0 User’s Guide English Edition
© 2012, 2013 Ingenieurbüro David Fischer AG, Switzerland All Rights Reserved Page 148 / 171
12.2 Sending Email and SMS Alert Notifications during Test Execution
The Exec Agents can be configured in such a way that Email and SMS Alert Notifications are released during the execution of a load test job. The corresponding Alert Configuration Menu can be called from the Personal Settings Menu. The Alert Configuration Menu will create a file named AlertConfig.xml which is located in the Proxy Sniffer installation directory and which contains the configuration data for all alert devices and for all alert notifications. If no AlertConfig.xml file exists on an Exec Agent no alerts are released from this Exec Agent ¹. Each time when a job is started on an Exec Agent the Exec Agent tries to read this file which means that the file can be created, updated or deleted without the need of restarting the corresponding Exec Agent.
¹ As a further option, it is also supported to use a specific alert configuration for a particular load test program. In such a case you have first to place a copy of the file AlertConfig.xml inside the Project Navigator directory where the load test program is stored. After that you can manually edit the copied AlertConfig.xml file and then you have to ZIP it together with the compiled class of the load test program (similar to the procedure which is required for using input files or using plug-ins). This effect that the program specific alert configuration is automatically transmitted to the Exec Agent(s) and that it overrides the default behavior on the Exec Agent(s). Note: the copy of the AlertConfig.xml file is stored in such a case inside the job specific directory on the Exec Agent.

Apica ProxySniffer V5.0 User’s Guide English Edition
© 2012, 2013 Ingenieurbüro David Fischer AG, Switzerland All Rights Reserved Page 149 / 171
12.2.1 Alert Conditions
The following Alert Conditions are supported:
If a Job cannot be started
At the Start of a Job (information)
If an Internal Error occurs during the Execution of a Job
During the Execution of a Job in Periodically Intervals (configurable interval time in minutes)
o At Every Interval (information)
o If the Session Failure Rate is greater than a threshold in percent ¹
o If the Average Response Time per Page is greater than a threshold in seconds ¹
o If the Average Response Time of the Slowest Page is greater than a threshold in seconds ¹
At the End of a Job (information)
At the End of a Job: If the Session Failure Rate is greater than a threshold in percent
At the End of a Job: If the Average Response Time per Page is greater than a threshold in seconds
At the End of a Job: If the Average Response Time of the Slowest Page is greater than a threshold in seconds
¹ = The values for periodically checked alert conditions are calculated from the measurements collected within one interval. Repeated alerts are suppressed. A cancel notification is released if the measurement is later less than the threshold.

Apica ProxySniffer V5.0 User’s Guide English Edition
© 2012, 2013 Ingenieurbüro David Fischer AG, Switzerland All Rights Reserved Page 150 / 171
12.2.2 Message Headlines
The Message Headlines for all Alert Notifications can be configured and support placeholders. The values of the placeholders are calculated at runtime and are replaced within the message headlines. Generic Placeholders which can be used in every type of alert notification are:
{$timestamp}: The current date and time when the alert notification was created. Example: "01 Jun 2010 13:45:38 ECT"
{$generator}: The name of the Exec Agent (load generator) which releases the alert notification.
{$jobId}: The job ID of the Exec Agent job.
{$programName}: The program name of the Exec Agent job.
Specific Placeholders:
During the Execution of a Job (Information at Every Interval) and at the End of a Job (Information):
o {$sessionFailureRate}: The measured session failure rate in percent.
o {$avResponseTimePerPage}: The measured average response time per page in seconds.
During the Execution of a Job and at the End of a Job: if the Session Failure Rate is greater than %
o {$sessionFailureRate}: The measured session failure rate in percent.
o {$sessionFailureRateLimit}: The configured threshold for the session failure rate in percent.
During the Execution of a Job and at the End of a Job: if the Average Response Time per Page is greater than seconds
o {$avResponseTimePerPage}: The measured average response time per page in seconds.
o {$avResponseTimePerPageLimit}: The configured threshold for the average response time per page in seconds.
During the Execution of a Job and at the End of a Job: if the Average Response Time of the Slowest Page is greater than seconds
o {$slowestPageName}: The name of the measured slowest page.
o {$avResponseTimeOfSlowestPage}: The measured response time of the slowest page in seconds.
o {$avResponseTimeOfSlowestPageLimit}: The configured threshold for the response time of the slowest page in seconds.

Apica ProxySniffer V5.0 User’s Guide English Edition
© 2012, 2013 Ingenieurbüro David Fischer AG, Switzerland All Rights Reserved Page 151 / 171
13 Page Scanner
Page Scanner browses and explores web pages of a web server automatically in a recursive way - similar to a Web Spider or a Web Crawler.
Primary Purpose: the scan result can be turned into a "normal" web surfing session, and from this a load test program can be generated. This provides a simplified way to create a web surfing session, instead of recording single web pages manually. However, Page Scanner can only be used to acquire web surfing sessions which do not require HTML form-based authentication. This tool is not a replacement for recording web surfing sessions of real web applications.
Other Purposes: Page Scanner allows the detection of broken links inside a web site, and provides statistical data about the largest and slowest web pages. It also supports searching for text fragments over all scanned web pages.
Note 1: Page Scanner does not interpret JavaScript code and does not submit forms. Only hyperlinks are considered. Cookies are automatically supported. Note 2: Page Scanner keeps the entire scanned web site in its transient memory (RAM) in compressed from. This means that large web sites can be scanned, but it also means that transient memory is not unlimited. If you encounter, in the Proxy Sniffer console, the error message "java.lang.OutOfMemoryError", you should stop Proxy Sniffer and start it again with 1024 MB memory:
Please note that the Page Scanner tool may return no result, or may return an incomplete result, because some web sites or web pages contain malformed HTML code, or because old, unusual HTML options have been used within the scanned web pages. Although this tool has been intensively tested, we are not able to provide any warranty of error-free behavior. Possible web site- or web page-related errors may be impossible to fix because of divergent requirements, or because of complexity. The functionality and behavior of this tool is similar to other search engines, which have also similar restrictions.

Apica ProxySniffer V5.0 User’s Guide English Edition
© 2012, 2013 Ingenieurbüro David Fischer AG, Switzerland All Rights Reserved Page 152 / 171
13.1.1 Input Parameter, Progress Display and Saving the Scan Result
The window is divided into two parts. The upper part of the window shows the progress of the scan, or the scan result when the scan has been completed. The lower part of the window allows the setting of scan input parameters, and the starting of a scan.
Input Parameters:
Starting Web Page: URL from which the scan starts. You can optionally scan only parts of a web site by entering a deep-linked URL path; for example, http://www.<domain>/sales/customers.html. In this case, only web pages below or at the same level of the URL path are scanned.
Char Encoding: allows you to override the default value "Auto Detect" in case some or all web pages are wrongly coded, such that the HTML header-specified character set does not match the character set which is actually used within the HTML body of the web pages (malformed HTML at server side). You can try "ISO-8859-1" or "UTF" as a workaround if Page Scanner is unable to extract hyperlinks (succeeding web pages) from the starting web page.
Exclude Path Patterns: allows you to exclude one or more URL path patterns from scanning. The path patterns are separated by commas.
Follow Web Servers: allows you to include content and web pages from other web servers within the scan; for example, this option can be used when images embedded in the web pages are located on another web server. You can enter several additional web servers, separated by commas. Example: http://www.<domain1>, https://imgsrv.<domain2>:444. The protocol (http or https), the host name (usually www), the domain, and the TCP/IP port are considered, but URL paths are NOT considered.
Verify External Links: allows you to verify all external links to all other web servers. This is commonly used to detect broken hyperlinks to other web servers.
Include: affects which sets of embedded content types should also be included in the scan. Page Scanner uses the file extensions of the URL paths to determine the content type (if available) because this can be done before the hyperlink of the embedded content itself is processed. This saves execution time, but it might have the effect that a few URLs for excluded content types flow into the result from scanning, because the MIME type of the received HTTP response headers is only used in detecting web pages. You can remove these unwanted URLs after the scan has been

Apica ProxySniffer V5.0 User’s Guide English Edition
© 2012, 2013 Ingenieurbüro David Fischer AG, Switzerland All Rights Reserved Page 153 / 171
completed by using the "remove URL" form in the Display Result window.
Content Type Sets Corresponding File Extensions
Images, Flash, CSS, JS .img, .bmp, .gif, .pct, .pict, .png, .jpg, .jpeg, .tif, .tiff, .tga, .ico, .swf, .stream, .css, .stylesheet, .js, .javascript
PDF Documents .pdf
Office Documents .doc, .ppt, .pps, .xls, .mdb, .wmf, .rtf, .wri, .vsd, .rtf, .rtx
ASCII Text Files .txt, .text, .log, .asc, .ascii, .cvs
Music and Movies .mp2, .mp3, .mpg, .avi, .wav, .avi, .mov, .wm, .rm, .mpeg
Binary Files .exe, .msi, .dll, .bat, .com, .pif, .dat, .bin, .vcd, .sav
Include Options: allows you to select or to de-select specific file extensions by using the -add or -remove keyword. Example: -remove .gif -add .mp2.
Max Scan Time: limits the maximum scan time in minutes. The scan will be stopped if this time is exceeded.
Max Web Pages: limits the maximum number of scanned web pages. The scan will be stopped if the maximum number of web pages is exceeded.
Max Received Bytes: limits the maximum size of the received data (in megabytes), measured over the entire scan. The scan will be stopped if the maximum size of the received data is exceeded.
Max URL Calls: limits the maximum number of executed URL calls, measured over the entire scan. The scan will be stopped if the maximum number of executed URL calls is exceeded.
URL Timeout: defines the response timeout, in seconds, per single URL call. If this timeout expires, the URL call will be reported as failed (no response from web server).
Max Path Depth: limits the maximum URL path depth of scanned web pages. Example: http://www.<domain>/docs/content/about.html has a path depth of 3.
Follow Redirections: limits the total number of followed HTTP redirects during the scan.
Follow Path Repetitions: limits the number of path repetitions which can occur within a single URL path. This parameter acts as protection against endless loops in scanning, and should usually be set to 1 (default) or to 2. Example: http://www.<domain>/docs/images/images/images/x.gif has a path repetition value of 3.

Apica ProxySniffer V5.0 User’s Guide English Edition
© 2012, 2013 Ingenieurbüro David Fischer AG, Switzerland All Rights Reserved Page 154 / 171
Follow CGI Parameters: this (by default disabled) option acts as protection against receiving almost identical URLs many times if they differ only in their CGI parameters. If disabled, only the first similar URL will be processed. Example: the first URL http://www.<domain>/showDoc?context=12 will be processed, but subsequent similar URLs, such as http://www.<domain>/showDoc?context=10 and http://www.<domain>/showDoc?context=13, will not be processed.
Authentication: allows you to scan protected web sites (or web pages). The following authentication methods are supported:
Authentication Method Note
Basic Apply HTTP Basic Authorization (Base64 encoded username:password send within all HTTP request headers). You should also enter a username and a password into the corresponding input fields.
NTLM Apply NTLM authentication for all URL calls (if requested by the Web server). The NTLM configuration of the Personal Settings menu (Chapter 0) will be used.
PKCS#12 Client Certificate Apply a HTTPS/SSL client certificate for authentication. The active PKCS#12 client certificate of the Personal Settings menu (Chapter 3.1.2.3) will be used.
Browser Language: used when scanning multilingual web sites to tell the web server which default language should be preferred.
Use Proxy: this option allows you to scan through an (outgoing) proxy server by applying the next proxy configuration of the Personal Settings menu.
SSL Version: allows you to select the SSL protocol version to be used to communicate with HTTPS servers (encrypted connections).
Annotation: here you should enter a short comment about the scan. You can abort a running scan by clicking on the “Abort Scan” button:

Apica ProxySniffer V5.0 User’s Guide English Edition
© 2012, 2013 Ingenieurbüro David Fischer AG, Switzerland All Rights Reserved Page 155 / 171
When a scan has completed, you should save the scan result to a file. The file will be saved in the selected Project Navigator directory and will always have the file extension *.prxscn.
A saved Page Scanner result can be restored and loaded back into the Page Scanner by clicking on the corresponding "Load Page Scan" icon inside Project Navigator:
13.1.2 Analyzing the Scan Result

Apica ProxySniffer V5.0 User’s Guide English Edition
© 2012, 2013 Ingenieurbüro David Fischer AG, Switzerland All Rights Reserved Page 156 / 171
The most important statistical data about the scan are shown in the overview, marked in orange, near the top of the window. Below the orange-marked overview, various scan result details can be selected. The search form, on the right side near the scan result detail selection, allows you to search for an ASCII text fragment over all web pages of the scan result. By default, the text fragment is searched for within all HTTP request headers, all HTTP response headers, and all HTTP response content data. The remove URL form, which is shown below the scan result detail selection, allows you to remove specific sets of URLs from the scan result. The set of removed URLs is selected by the received MIME type (examples: IMAGE/GIF, APPLICATION/PDF, ..), and linked with a logical AND condition with the received HTTP status code for the URLs (200, 302, ..), or with a Page Scanner error code, such as "network connection failed".
with content MIME type: selects a specific MIME type (see also http://www.iana.org/assignments/media-types). The input field is case insensitive (upper and lower case characters will be processed as identical). any means that all MIME types are selected, independent of their value. none means that only URL calls whose HTTP response header does NOT contain MIME type information (HTTP response header field "Content-Type" not set) will be selected.
HTTP status code: selects an HTTP status code or a Page Scanner error code. Note: A few URLs with excluded content types may flow into the scan result (not selected by scan input parameter). You can use the "remove URL" form to clean up the scan result, and to remove any unwanted URLs. The most common case is to remove PDF documents from the scan result.

Apica ProxySniffer V5.0 User’s Guide English Edition
© 2012, 2013 Ingenieurbüro David Fischer AG, Switzerland All Rights Reserved Page 157 / 171
13.1.2.1 Scan Result Details
Scan Input Parameter: displays all input parameters for the scan (without authentication data).
Scan Statistic: displays some additional statistical data about the scan.Similar Web Pages are the number of web pages with duplicate content (same content but different URL path). Failed URL Calls are the number of URL calls which failed, such that no HTTP status code was available (no response received from web server), or that the received HTTP status was an error code (400..599).

Apica ProxySniffer V5.0 User’s Guide English Edition
© 2012, 2013 Ingenieurbüro David Fischer AG, Switzerland All Rights Reserved Page 158 / 171
Non-Processed Web Servers: displays a summary of all web servers which have been found in hyperlinks, but whose web pages or page elements have not been scanned. The number before the server name shows the number of times the hyperlink was ignored by Page Scanner.

Apica ProxySniffer V5.0 User’s Guide English Edition
© 2012, 2013 Ingenieurbüro David Fischer AG, Switzerland All Rights Reserved Page 159 / 171
Scan Result per Web Page: displays all scanned web pages. The embedded content of a web page, such as images, is always displayed in a Web Browser Cached View. For example, this can mean that a particular (unique) image is only shown once inside the web page in which it has been referenced for the first time. All subsequent web pages will not show the same embedded content. This behavior is more or less equal to what a web browser does - it caches duplicate references over all web pages within a web surfing session. More details about a specific URL call can be shown by clicking on the corresponding URL hyperlink.
Broken Links: displays a list of all broken hyperlinks.

Apica ProxySniffer V5.0 User’s Guide English Edition
© 2012, 2013 Ingenieurbüro David Fischer AG, Switzerland All Rights Reserved Page 160 / 171
Duplicated Content: displays a list of URLs with duplicate content (same content but different URL path).
Largest Web Pages: displays a list of the largest web pages. Hint: you can click on the bars to display the corresponding page details.

Apica ProxySniffer V5.0 User’s Guide English Edition
© 2012, 2013 Ingenieurbüro David Fischer AG, Switzerland All Rights Reserved Page 161 / 171
Slowest Web Pages: displays a list of the slowest web pages. Hint: you can click on the bars to display the corresponding page details.

Apica ProxySniffer V5.0 User’s Guide English Edition
© 2012, 2013 Ingenieurbüro David Fischer AG, Switzerland All Rights Reserved Page 162 / 171
13.1.3 Converting a Scan Result into a Web Surfing Session
A Page Scanner result can be converted into a “normal” web surfing session, which can be used to create a load test program.
Input Fields:
Filename: file name of the web surfing session. You must enter a "simple" filename, with no path and no file extension. The file extension is always "*.prxdat". The file will be saved in the selected Project Navigator directory.
Web Pages: allows you to select the scanned web pages which should flow into the web surfing session. “All Pages” means that all scanned web pages are selected. Alternatively, the option “Page Ranges” allows you to select one or several ranges of page numbers. If you use several ranges, they must be separated by commas. Example: "1, 3-5, 7, 38-81"
Max. URL Calls: limits the number of URL calls which should flow into the web surfing session. Hint: it is recommended that you do not convert more than 1000 URL calls into a web surfing session.
Annotation: we recommend that you enter a short comment about the web surfing session.
Load Session into: also loads the web surfing session into the transient memory area of the main menu, or into a scratch area of the Session Cutter.

Apica ProxySniffer V5.0 User’s Guide English Edition
© 2012, 2013 Ingenieurbüro David Fischer AG, Switzerland All Rights Reserved Page 163 / 171
After the web surfing session has been stored, it will be automatically loaded into the Main Menu if the “Load Session into” checkbox was selected. After this, you can generate the load test Program (see chapter 8).

Apica ProxySniffer V5.0 User’s Guide English Edition
© 2012, 2013 Ingenieurbüro David Fischer AG, Switzerland All Rights Reserved Page 164 / 171
14 Web Tools
The Web tools menu can be invoked from the main menu, and contains four small utilities which can be useful to examine the data exchanged between the web browser and the web server. Tools / Utilities:
- Base64 Text Transformation: performs a base64 transformation, or its inverse operation, as appropriate. The base64 algorithm is often used to obfuscate the values of CGI parameters. The inverse operation allows you to decode such obfuscated values.
- Escape/Unescape URL/CGI Text Value: performs a URL-encoding transformation, or its inverse operation, as appropriate. This algorithm is often used to mask special characters within the values of CGI parameters, and is also used when HTML form parameters are transmitted to the web server
- Examine SSL Configuration of HTTPS Server - Encryption Protocols and Algorithms: examines the SSL configuration of an HTTPS web server "from outside“, and displays hints about SSL misconfigurations
- Test HTTP(S) Request: executes URL calls whose input data can be entered manually. Can be used to examine the HTTP protocol behavior of the web server.

Apica ProxySniffer V5.0 User’s Guide English Edition
© 2012, 2013 Ingenieurbüro David Fischer AG, Switzerland All Rights Reserved Page 165 / 171
15 Modifying Load Test Programs Manually
Important Note: before you manually modify an automatically generated load test program, you should first check whether not the same result can be reached by writing an own Load Test Plug-In. Please read first the "Load Test Plug-In Developer Handbook."
Proxy Sniffer follows the philosophy that almost all functionality can be done by using the GUI, without requiring programming knowledge. Nevertheless, it is also possible to modify the automatically-generated load test programs manually. You can freely modify the program on this "second level" according to your needs; however, you should remember that the modifications are not protected from being overwritten when the load test program is generated again. You should be sure that you have already made all Var Handler definitions, such as defining Input Files and User Input Fields, before you start modifying the program code. All special classes and methods used by the load test programs are fully described in the Proxy Sniffer Java API documentation, in order to enable you to understand how the program works. On Windows systems, the Proxy Sniffer Java API documentation is accessible from the Start Programs ProxySniffer menu. The inner structure of a load test program is organized as follows:
The main method – which is marked by a blue background at the bottom on the image – first reads all input data. After that, the structure of the statistics data is created. Then an own instance of the load test program itself is created for each emulated user. The main method starts these users/instances in a loop, and then waits until all users have completed their work. Finally, the statistics result file is written and the load test program is terminated.
The method run – which is the main method of a single thread or user – controls the number of loops, and/or the elapsed time, and terminates the activity of the user if one of these values has been exceeded.
The method execute contains all URL calls and page breaks, and is repeatedly called from the method run.
This structure has a direct influence on how variables must be declared within the program:
- static (global) variables are shared between users; that is, all users see the same value. If a static variable is not a primitive data type (integer, boolean, etc...), then modifications to the value must be protected by a synchronized statement in order to avoid data corruption.
- common (local) variables have a per-user value, even if they have been defined only once. The values of these variables are set by the constructor, or during the execution of the methods execute and/or run.
Apica ProxySniffer V5.0 User’s Guide English Edition
© 2012, 2013 Ingenieurbüro David Fischer AG, Switzerland All Rights Reserved Page 166 / 171
For debug purposes, an empty log vector is created before the method execute() is called. The reason for doing this is that inside the execute() method, any console and log output should not be written by calling the Java method System.out.println(), as later on it would be nearly impossible to check what has happened inside a thread because all output data of all threads would be “mixed”. The method log() exists for this purpose. This method collects all output data of a loop until the loop has been terminated. After loop termination, the log data of the loop are synchronized and written to standard output inside the method run(). During the development of your own program extensions, you can force the display of the log vector by using the optional program argument -dl (debug loops), or by selecting the debug option debug loops (including var handler) when starting the test run from the Web Admin GUI.

Apica ProxySniffer V5.0 User’s Guide English Edition
© 2012, 2013 Ingenieurbüro David Fischer AG, Switzerland All Rights Reserved Page 167 / 171
16 Direct Access to Measured Data
The Proxy Sniffer Java API also contains classes and methods which allow direct access to all measured values stored within a statistics result file of a load test run ("*.prxres file"). This enables you to create your own extracts and/or compilations from the measured data. The main entry point to access these data is the method PerformanceData.readObjectFromFile(<result file name>).
16.1 Example 1 – Extracting Performance Data
The following programming example extracts the most important performance data of the web pages and the URL calls: import java.io.*;
import dfischer.utils.PerformanceData;
import dfischer.utils.PerformanceDataRecord;
public class AnalyzeResult
{
public static void main(String[] args)
{
try
{
// read result file from disk
PerformanceData performanceData = new PerformanceData();
performanceData.readObjectFromFile(args[0]);
PerformanceDataRecord[] performanceDataRecord = performanceData.getPerformanceDataRecord();
// display overall data
System.out.println("users = " + performanceData.getParallelUsers());
System.out.println("test duration = " + (performanceData.getTestDurationMillis() / 1000) + " seconds");
System.out.println("hits per second = " + performanceData.getWebTransactionRate());
System.out.println("passed loops = " + performanceData.getPassedLoops());
System.out.println("failed loops = " + performanceData.getFailedLoops());
System.out.println("average response time per page = " + ((float)performanceData.getAveragePageTime() / 1000.0f) + " seconds");
System.out.println("average network connect time per URL call = " + performanceData.getAverageNetworkEstablishTime() + " milliseconds");
System.out.println("");
// display page data
int[] pageBreakIndex = performanceData.getPageBreakIndexes();
for (int x = 0; x < pageBreakIndex.length; x++)
{
String pageName = performanceDataRecord[pageBreakIndex[x]].getInfoText();
long pageResponseTime = performanceData.getPageTime(pageBreakIndex[x]);
// get all url calls per page
int[] urlIndexesOfPage = performanceData.getValidUrlIndexesOfPage(pageBreakIndex[x]);
// calculate average size of page
long pageSize = 0;

Apica ProxySniffer V5.0 User’s Guide English Edition
© 2012, 2013 Ingenieurbüro David Fischer AG, Switzerland All Rights Reserved Page 168 / 171
long pageTime = 0;
long cumulatedPageSize = 0;
for (int y = 0; y < urlIndexesOfPage.length; y++)
{
PerformanceDataRecord urlDataRecord = performanceDataRecord[urlIndexesOfPage[y]];
pageSize = pageSize + urlDataRecord.getAverageSize();
pageTime = pageTime + urlDataRecord.getAverageTime();
cumulatedPageSize = cumulatedPageSize + urlDataRecord.getTotalSize();
}
System.out.println(pageName + "; size = " + pageSize + " bytes; time = " + ((float) pageTime / 1000.0f) + " seconds; total transmitted
bytes over all calls = " + cumulatedPageSize);
}
System.out.println("");
// loop over all measured url calls and page breaks
for (int x = 0; x < performanceDataRecord.length; x++)
{
switch (performanceDataRecord[x].getDataType())
{
case PerformanceDataRecord.TYPE_PERFORMANCE_DATA:
long urlSize = performanceDataRecord[x].getAverageSize();
long urlTime = performanceDataRecord[x].getAverageTime();
long cumulatedUrlSize = performanceDataRecord[x].getTotalSize();
System.out.println(performanceDataRecord[x].getInfoText() + "; size = " + urlSize + " bytes; time = " + ((float) urlTime / 1000.0f)
+ " seconds; total transmitted bytes = " + cumulatedUrlSize);
break;
case PerformanceDataRecord.TYPE_PAGE_BREAK:
System.out.println(performanceDataRecord[x].getInfoText());
break;
default:
break;
}
}
}
catch (Exception e)
{
e.printStackTrace();
}
}
}

Apica ProxySniffer V5.0 User’s Guide English Edition
© 2012, 2013 Ingenieurbüro David Fischer AG, Switzerland All Rights Reserved Page 169 / 171
16.2 Example 2 – Extracting Error Snapshots
The following programming example extracts all received content data of error snapshots taken (malformed web pages), and stores them in files so they can be displayed later in the web browser: import java.io.FileOutputStream;
import dfischer.utils.PerformanceData;
import dfischer.utils.PerformanceDataRecord;
import dfischer.utils.PerformanceDataRecordFailureInfo;
import dfischer.utils.HttpTestURL;
/**
* Writes the response content of all error snapshots to files if they contain ASCII (HTML,XML) data.
* Program Argument: name of the result file (*.prxres).
*/
public class ExtractErrors
{
public static void main(String[] args)
{
try
{
// read result file from disk
PerformanceData performanceData = new PerformanceData();
performanceData.readObjectFromFile(args[0]);
// loop over all measured url calls and page breaks
PerformanceDataRecord[] performanceDataRecord = performanceData.getPerformanceDataRecord();
for (int x = 0; x < performanceDataRecord.length; x++)
{
switch (performanceDataRecord[x].getDataType())
{
case PerformanceDataRecord.TYPE_PERFORMANCE_DATA:
// loop over all error snapshots per url call
PerformanceDataRecordFailureInfo[] failureInfo = performanceDataRecord[x].getFailureInfo();
for (int y = 0; y < failureInfo.length; y++)
{
// get data of failed url call
HttpTestURL testURL = performanceDataRecord[x].getFailedUrl(failureInfo[y]);
if (testURL != null)
{
// now we have access to all frozen url data
String fileStartName = "url_" + x + "_error_" + (y + 1);
// write response content to file - no binary data are written
if (testURL.isAsciiContent())
{
FileOutputStream fout = new FileOutputStream(fileStartName + "_response_content.html");
fout.write(testURL.getDecompressedContent());
fout.close();
}
}

Apica ProxySniffer V5.0 User’s Guide English Edition
© 2012, 2013 Ingenieurbüro David Fischer AG, Switzerland All Rights Reserved Page 170 / 171
}
break;
case PerformanceDataRecord.TYPE_PAGE_BREAK:
break;
default:
break;
}
}
}
catch (Exception e)
{
e.printStackTrace();
}
}
}

Apica ProxySniffer V5.0 User’s Guide English Edition
© 2012, 2013 Ingenieurbüro David Fischer AG, Switzerland All Rights Reserved Page 171 / 171
Note: All menus provide context specific help text, available using the Help Icon:
17 Manufacturer Ingenieurbüro David Fischer AG, Switzerland | A company of the Apica Group Product Web Site: http://www.proxy-sniffer.com
We recommend that you also read the Application Reference Manual.